
Submitted:
12 July 2025
Posted:
15 July 2025
You are already at the latest version
Abstract
Plant cell wall-derived oligosaccharides, such as xylo-oligosaccharides (XOS), serve as key signaling molecules regulating plant growth and immunity. The bioactivity of XOS is closely tied to their degree of polymerization (DP), yet the molecular mechanisms underlying DP-specific effects remain poorly understood. Here, we investigated the transcriptional and phenotypic responses of lettuce (Lactuca sativa) to foliar application of four high-purity XOS variants: xylobiose (XOSY, DP2), xylotriose (XOSB, DP3), xylotetraose (XOSD, DP4), and xylopentose (XOSW, DP5). Phenotypic analyses revealed that high-DP XOS (XOSD and XOSW) significantly enhanced aboveground biomass and root system development, with XOSD showing the most pronounced effects, including a 31.74% increase in leaf area and a 20.71% increase in aboveground biomass. Transcriptomic profiling identified extensive transcriptional reprogramming across treatments, with XOSD eliciting the highest number of differentially expressed genes (DEGs). Functional enrichment analyses indicated that XOSD and XOSW upregulated genes involved in plant hormone signaling, starch and sucrose metabolism, and cell wall biosynthesis, while downregulating photosynthesis-related genes. Notably, MapMan and KEGG pathway analyses revealed that XOSD significantly activated biotic stress-related pathways, including MAPK signaling, β-1,3-glucanase activity, and PR protein pathways. In contrast, XOSY treatment primarily upregulated genes linked to basal immunity, highlighting distinct mechanisms employed by low- and high-DP XOS. These findings demonstrate that XOS with varying DP differentially modulate growth- and immunity-related processes in lettuce. High-DP XOS, particularly XOSD, not only promote plant biomass accumulation but also enhance immune responses, highlighting their potential as biostimulants for sustainable agriculture. This study provides a molecular framework for understanding the DP-specific bioactivity of XOS and their dual role in optimizing plant growth and defense.
Keywords:
xylooligosaccharide
; degree of polymerization
; immune response
; growth
; transcriptome sequencing
1. Introduction
Cellulose and hemicellulose are the predominant polysaccharides in plant cell walls, playing crucial roles in maintaining cellular integrity and enabling adaptive responses to a wide array of biotic and abiotic stressors[19]. Upon exposure to stressors, enzymatic degradation of these polysaccharides releases oligosaccharides, such as cello-oligosaccharides (COOS) and xylo-oligosaccharides (XOS), which have emerged as key signaling molecules in plant defense and growth regulation[4]. Acting as damage-associated molecular patterns (DAMPs), these oligosaccharides are recognized by plant pattern recognition receptors, triggering immune signaling pathways and influencing fundamental physiological processes[19,7]. Understanding the molecular mechanisms underlying these processes is essential for advancing strategies to enhance plant resilience and improve crop productivity under stress conditions.
The bioactivity of oligosaccharides is intricately linked to their degree of polymerization (DP), which governs their interaction with specific receptors and dictates the downstream signaling pathways they activate[8]. During pathogen attack, cell wall-degrading enzymes (CWDEs) hydrolyze polysaccharides into oligomers of varying DP[13]. These oligomers are recognized by plasma membrane-localized pattern recognition receptors, triggering calcium influx, mitogen-activated protein kinase (MAPK) cascades, and the transcriptional activation of immune-related genes[14,19]. Notably, DP2 COOS rapidly induce immune responses independent of reactive oxygen species (ROS), whereas higher DP variants (e.g., DP3–5) elicit more pronounced ROS production and transcriptional reprogramming, leading to enhanced disease resistance[19,23]. This DP-dependent variation in immune activation underscores the complexity of oligosaccharide-mediated signaling networks and highlights their potential for fine-tuning plant immune responses.
In addition to their roles in immunity, oligosaccharides also regulate growth-related processes by modulating key metabolic and hormonal pathways[24]. For example, COOS have been shown to influence auxin and nitrate signaling, both of which are critical regulators of biomass accumulation and resource allocation[25]. Evidence suggests that oligosaccharides with higher degrees of polymerization (DP) often exhibit stronger growth-promoting effects, indicating that DP is a key determinant in coordinating the trade-off between growth and defense[19]. Despite the extensive study of cellulose-derived oligosaccharides, the regulatory potential of hemicellulose-derived XOS remains relatively unexplored.
This study systematically investigated the degree of polymerization (DP)-specific effects of four high-purity xylo-oligosaccharide (XOS) variants—xylobiose (XOSY), xylotriose (XOSB), xylotetraose (XOSD), and xylopentose (XOSW)—on lettuce (Lactuca sativa) seedlings. Integrating transcriptomic profiling with phenotypic analyses, we uncovered key regulatory pathways and genes influenced by XOS treatments, including those involved in auxin signaling, nitrate transport, and immunity-related transcriptional networks. Among the variants, XOSD induced the most extensive transcriptional reprogramming and pronounced phenotypic changes, underscoring its dual role in promoting plant growth and enhancing immune responses. These findings establish a molecular framework for understanding the DP-specific bioactivity of XOS and highlight their potential as innovative biostimulants for advancing sustainable agricultural practices.
2. Results
2.1. Effects of Xylooligosaccharides with Different Degrees of Polymerization on Lettuce Growth
Foliar application of xylooligosaccharides (XOS) with varying DP exerted differential effects on lettuce growth. Compared with the distilled water control (CK), treatments with low-DP XOS, including xylobiose (XOSY) and xylotriose (XOSB), showed no significant impact on aboveground biomass (Figure 1A, B). In contrast, high-DP XOS, specifically xylotetraose (XOSD) and xylopentose (XOSW), significantly promoted lettuce growth in a DP-dependent manner. Notably, XOSD treatment increased aboveground biomass by 20.71%, while XOSW led to an 11.68% increase. XOSD also induced a remarkable 31.74% expansion in leaf area, compared to a 24.79% increase under XOSW treatment. These results highlight the superior growth-promoting effects of higher DP XOS, particularly XOSD, which showed pronounced effects on both leaf area expansion and biomass accumulation.
Root morphology changes exhibited similar trends to aboveground growth (Figure 1C, Table S1). Treatments with XOSD and XOSW significantly enhanced root morphological parameters, with XOSD demonstrating the strongest effects. Specifically, XOSD increased total root length, root surface area, lateral root length, and adventitious root length by 18.77%, 19.15%, 38.82%, and 21.08%, respectively. These changes indicate that XOSD and XOSW not only stimulate aboveground growth but also significantly improve root architecture, enhancing the plant’s capacity for water and nutrient uptake. By contrast, low-DP XOS (XOSY and XOSB) had negligible effects on root morphology, suggesting limited involvement in pathways associated with root system development. The observed differences in growth responses to XOS treatments can be attributed to functional distinctions between low-DP and high-DP XOS. High-DP XOS, such as XOSD and XOSW, appear to activate more robust growth-promoting mechanisms, particularly those linked to root architecture optimization and biomass accumulation. These findings underscore the critical role of DP in modulating the bioactivity of XOS in plant growth regulation.
In summary, the degree of polymerization of XOS profoundly influences lettuce growth, with high-DP XOS (XOSD and XOSW) significantly enhancing biomass accumulation and root system development, whereas low-DP XOS (XOSY and XOSB) exhibit minimal effects.
2.2. Quality Assessment of RNA-Seq Data
RNA-seq analysis was conducted on 15 samples representing the CK, XOSY, XOSB, XOSD, and XOSW treatment groups. Post-quality control, the total number of clean reads per sample ranged from 36,385,590 to 53,501,390, with an average Q30 value exceeding 92.80%, indicating high sequencing accuracy (Table S2). Over 45.65% of the clean reads exhibited GC content within the normal range, further confirming the reliability and integrity of the sequencing data. Mapping of clean reads to the reference genome yielded alignment rates exceeding 92.94% across all samples, underscoring the robustness of the sequencing results.
Biological replicates within each treatment group demonstrated strong reproducibility, as evidenced by Pearson correlation coefficients exceeding 0.92 (Figure S1A). Principal component analysis (PCA) showed that the first principal component explained 64.03% of the total variance, with the 15 samples clearly clustering into five distinct groups corresponding to their respective treatments (Figure S1B). Hierarchical clustering heatmaps further revealed significant transcriptional differences between the XOS-treated groups and the CK group (Figure S1C), highlighting the distinct transcriptional responses induced by XOS treatments of varying DP.
These results confirm the high quality, reproducibility, and robustness of the RNA-seq data, providing a reliable foundation for downstream analyses. Furthermore, the observed transcriptional divergence across treatments underscores the differential regulatory effects of XOS with varying degrees of polymerization on lettuce gene expression.
2.3. Differentially Expressed Gene (DEG) Analysis
XOS treatments with varying DP induced extensive transcriptional reprogramming in lettuce leaves compared to the CK group (Figure 2). In the XOSY treatment group, 370 genes were upregulated and 310 were downregulated. Similarly, the XOSB treatment group exhibited 573 upregulated and 608 downregulated genes. Notably, the XOSD treatment group displayed the largest number of DEGs, with 1,396 upregulated and 1,273 downregulated genes. The XOSW treatment group showed 720 upregulated and 797 downregulated genes. A Venn diagram analysis identified 41 DEGs that were consistently regulated across all DP2–5 XOS treatments, suggesting shared molecular pathways activated by these oligosaccharides. The number of treatment-specific DEGs varied significantly among the XOS treatments. XOSD elicited the highest number of unique DEGs (649), followed by XOSY (277), XOSB (96), and XOSW (68). These data underscore the distinct transcriptional responses associated with each XOS variant, with XOSD inducing the most substantial and specific gene expression changes.
In summary, XOS treatments with different DP significantly modulated lettuce gene expression, with XOSD emerging as the most potent variant in driving transcriptional reprogramming associated with growth and developmental processes.
2.4. GO Enrichment Analysis
Gene Ontology (GO) enrichment analysis was performed on the differentially expressed genes (DEGs) across three categories: biological process, cellular component, and molecular function (Figure 3).
In the XOSY treatment group, only four GO terms were significantly enriched under molecular function, primarily associated with DNA-dependent transcription factor activity and transcription regulatory activity. No significant enrichment was observed for upregulated DEGs in the XOSB treatment group. However, the top 20 enriched GO terms for downregulated DEGs in the XOSB group included seven related to biological processes and cellular components, such as photosynthesis, thylakoid membrane, and photosystem I reaction center. Additionally, six molecular function terms were enriched, including oxidoreductase activity and iron-sulfur cluster binding.
The XOSD treatment group exhibited substantial GO enrichment for both upregulated and downregulated DEGs. Among the upregulated DEGs, 20 GO terms were significantly enriched, including one biological process term (microtubule-based movement), 14 cellular component terms (e.g., nucleosome, chromatin, and non-membrane-bound organelles), and five molecular function terms (e.g., microtubule motor activity and hydrolase activity). For the downregulated DEGs in the XOSD group, six biological process terms were enriched, including photosynthesis, redox processes, and cellular homeostasis. Nine cellular component terms (e.g., photosynthetic membrane, photosystem II, and thylakoid membrane) and five molecular function terms (e.g., oxidoreductase activity, heat shock protein binding, and antioxidant activity) were also significantly enriched.
In the XOSW treatment group, upregulated DEGs were enriched in 11 GO terms, including biological processes such as carbohydrate metabolism and microtubule-based movement. Cellular component enrichment highlighted β-galactosidase complexes, while molecular function enrichment included terms related to hydrolase activity and microtubule motor activity. Downregulated DEGs in the XOSW group were enriched in 20 GO terms, with biological process terms including redox processes and cellular homeostasis, 10 cellular component terms associated with photosynthetic systems, and molecular function terms such as oxidoreductase activity, iron-sulfur cluster binding, and antioxidant activity.
Overall, XOS treatments significantly modulated the expression of genes associated with photosynthesis and photosystems. Notably, low-DP XOS suppressed photosynthetic processes, while treatments with higher DP XOS (XOSB, XOSD, and XOSW) activated molecular functions linked to growth and immune regulation. These findings underscore the distinct regulatory effects of XOS with varying degrees of polymerization on key physiological processes in lettuce.
2.5. KEGG Pathway Enrichment Analysis
KEGG pathway enrichment analysis identified significant associations between differentially expressed genes (DEGs) and diverse metabolic and signaling pathways in response to XOS treatments with varying degrees of polymerization (DP) (Figure 4).
In the XOSY treatment group, 370 upregulated DEGs were mapped to 31 pathways, with significant enrichment in plant-pathogen interaction, plant hormone signal transduction, ubiquitin-mediated proteolysis, and cyanogenic amino acid metabolism. In contrast, the 310 downregulated DEGs were mapped to 76 pathways, including photosynthesis, amino acid metabolism, and carbon-nitrogen metabolism, though no significant enrichment was observed. The XOSB treatment group exhibited broader transcriptional effects, with 573 upregulated DEGs mapped to 70 pathways. Significant enrichment was found in fatty acid elongation, cutin, suberin, and wax biosynthesis, secondary metabolite biosynthesis, circadian rhythm, and starch and sucrose metabolism, with fatty acid elongation showing particularly strong enrichment. Among the 608 downregulated DEGs, significant enrichment was observed in photosynthesis-related pathways, including photosystem antenna proteins, carbon fixation, and porphyrin and chlorophyll metabolism.
The XOSD treatment group exhibited the most extensive transcriptional reprogramming, with 1,396 upregulated DEGs mapped to 94 pathways. Significant enrichment was identified in fatty acid elongation, starch and sucrose metabolism, DNA replication, and cutin, suberin, and wax biosynthesis. Among the 1,273 downregulated DEGs, significant enrichment was observed in photosynthesis-related pathways (e.g., photosystem antenna proteins, carbon fixation, and thylakoid membrane processes), as well as the pentose phosphate pathway, porphyrin and chlorophyll metabolism, and glycine, serine, and threonine metabolism. Similarly, the XOSW treatment group displayed 720 upregulated DEGs mapped to 76 pathways, with significant enrichment in fatty acid elongation, starch and sucrose metabolism, and DNA replication. The 797 downregulated DEGs were mapped to 79 pathways, with significant enrichment in photosynthesis-related pathways, carbon metabolism, glyoxylate and dicarboxylate metabolism, the pentose phosphate pathway, terpene backbone biosynthesis, and porphyrin and chlorophyll metabolism.
Overall, XOS treatments significantly reshaped the transcriptional landscape of lettuce leaves. Upregulated DEGs were predominantly associated with plant immune responses, while downregulated DEGs were primarily linked to photosynthesis and carbon-nitrogen metabolism. Notably, the XOSY treatment induced immune-related pathways even in the absence of pathogen challenge, suggesting its potential role in priming plant immunity. High-DP XOS, such as XOSD, activated DEGs involved in both biotic stress responses and growth-related processes, including starch and sucrose metabolism, amino acid metabolism, and auxin biosynthesis through the tryptophan metabolism pathway. These findings underscore the dual regulatory role of XOS in coordinating growth and immune responses, offering insights into their potential applications in plant resilience and productivity enhancement.
2.6. Analysis of Biotic Stress-Related Pathways
MapMan visualization was employed to analyze biotic stress-related differentially expressed genes (DEGs) in lettuce treated with XOS of varying DP (Figure 5). Results showed substantial differences in the number of biotic stress-related DEGs among treatments compared to the control group (CK). Specifically, XOSY treatment identified 219 DEGs related to biotic stress, XOSB identified 364, XOSD identified 780, and XOSW identified 460. In the XOSD treatment group, significant upregulation was observed for genes encoding β-1,3-glucanases (2–4.8-fold increase), MAPK signal kinases (6 genes, 1–4-fold increase), and PR proteins (66 genes, 0.7–5-fold increase). These genes likely play crucial roles in the immune defense responses triggered by XOSD treatment. MapMan visualization of hormone signaling pathways revealed distinct regulation of ethylene-responsive genes by XOS treatments, with marked differences between DP2 (XOSY) and DP3–5 (XOSB, XOSD, and XOSW) treatments. Notably, only two genes (LOC111888090 and LOC111921161) were commonly regulated across XOSB, XOSD, and XOSW treatments, while DP3–5 treatments collectively regulated a significantly higher number of genes compared to XOSY.
Pathways directly associated with plant disease resistance, such as the MAPK signaling pathway, β-1,3-glucanase-related pathways, and PR protein pathways, also displayed treatment-specific responses. XOSY treatment upregulated seven ERF transcription factor genes and nine WRKY transcription factor genes, while XOSB treatment predominantly activated eight MYB family genes and one ERF transcription factor gene. The XOSD treatment group showed a broader transcriptional response, with 12 genes encoding ERF and MYB transcription factors and four genes encoding WRKY transcription factors upregulated. XOSW treatment activated seven ERF, seven MYB, and three WRKY transcription factor family genes. These results suggest that DP2 XOS (e.g., XOSY) may utilize distinct mechanisms to activate basal immune responses compared to higher DP XOS (e.g., XOSB, XOSD, and XOSW).
Additionally, a significant proportion of the upregulated DEGs in all XOS treatment groups were involved in the synthesis and degradation of cell wall components. Genes encoding cellulose synthases and cell wall-degrading enzymes were notably upregulated, indicating that cell wall thickening might be a critical mechanism by which XOS enhance plant immune defenses.
2.7. Analysis of Growth-Related Pathways
The expression of DEGs related to growth pathways varied significantly among XOS treatments, as shown in Table S3. Overall, XOS treatments suppressed the transcriptional levels of certain genes associated with carbohydrate and energy metabolism. However, key pathways such as amino sugar and nucleotide sugar metabolism, pentose and glucuronate interconversion, pyruvate metabolism, and starch and sucrose metabolism showed upregulation of specific genes, with starch and sucrose metabolism being particularly prominent.
Distinct differences were observed between treatments. XOSY treatment resulted in only a few downregulated DEGs annotated to carbohydrate metabolism and photosynthesis pathways, with minimal upregulation in these pathways. In contrast, XOSB, XOSD, and XOSW treatments showed upregulated DEGs across 15 carbohydrate metabolism pathways, with significant enrichment in starch and sucrose metabolism for XOSD and XOSW. Notably, XOSB, XOSD, and XOSW treatments downregulated numerous DEGs significantly enriched in carbon fixation, nitrogen metabolism, photosynthesis, and photosystem antenna protein pathways. These results suggest that XOSY (DP2) has limited effects on carbohydrate and energy metabolism, while DP3–5 XOS (XOSB, XOSD, XOSW) suppress photosynthesis and nitrogen metabolism-related genes but positively regulate key carbohydrate metabolism pathways, including starch and sucrose metabolism, amino sugar and nucleotide sugar metabolism, and pentose and glucuronate interconversion.
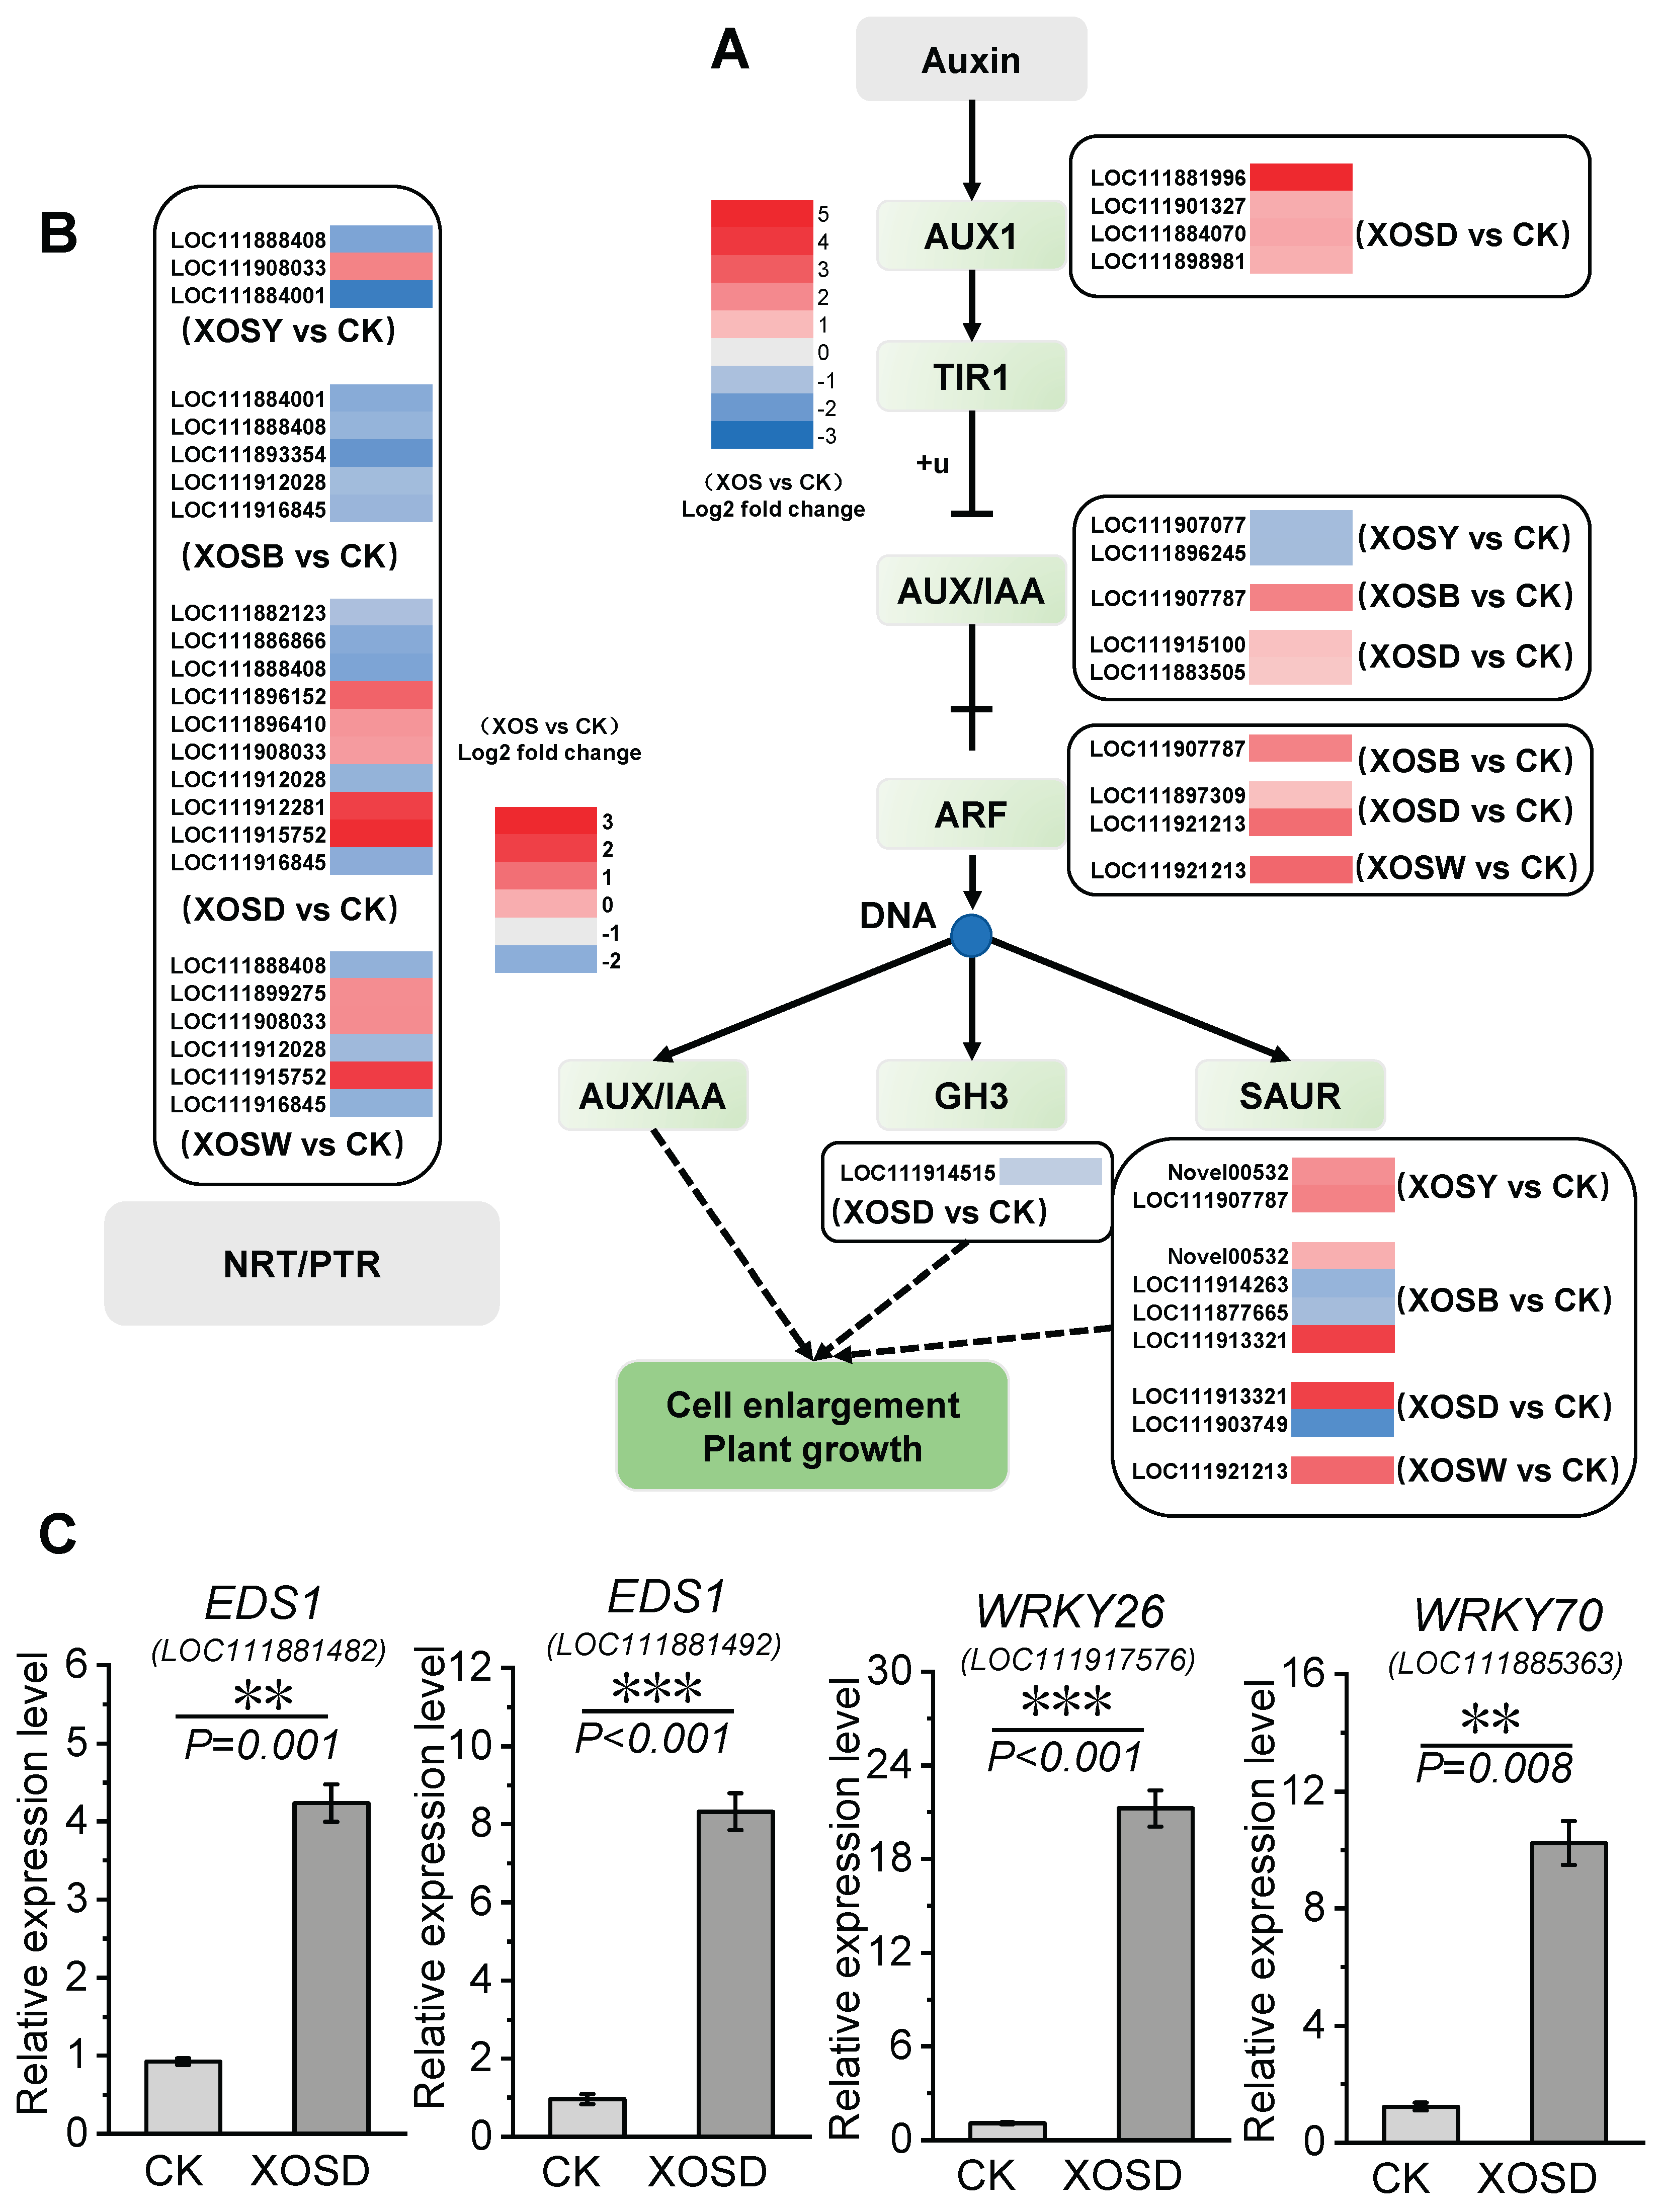
DEGs associated with plant growth auxin signaling pathways and nitrate transporter proteins were identified across treatments (Figure 6). XOSD treatment significantly upregulated AUX1 and ARF, two positive regulators of the auxin signaling pathway. Genes encoding AUX1, an auxin influx carrier located in the plasma membrane (e.g., LOC111881996, LOC111901327, LOC111884070, and LOC111898981), were induced 1–5-fold under XOSD treatment. Similarly, ARF transcription factors (e.g., LOC111897309 and LOC111921213) were upregulated 0.9–2.6-fold. XOSD treatment also activated 10 members of the NRT1 nitrate transporter family. Notably, NPF5.6-like and NPF8.1-like showed 3- and 3.5-fold upregulation, respectively. In the XOSW treatment group, several NRT1-encoding genes, such as LOC111915752, LOC111899275, and LOC111998033, were upregulated.
Moreover, key growth-defense balance regulators were highly induced under XOSD treatment. The EDS1-encoding genes LOC111881482 and LOC111881492 showed 3.57- and 7.63-fold upregulation, respectively. WRKY transcription factors also exhibited significant upregulation, with WRKY26 (LOC111917576) increasing by 18.51-fold and WRKY70 (LOC111885363) by 7.32-fold. These genes are likely critical in enhancing aboveground biomass growth in lettuce under XOSD treatment.
3. Discussion
The bioactivity of oligosaccharides is closely linked to their molecular weight, conformation, charge distribution, and degree of polymerization (DP)[26-Error! Reference source not found.]. In this study, foliar application of low-DP xylooligosaccharides (XOS, DP2–5) to lettuce seedlings revealed significant differences in regulatory effects depending on DP. Treatments with xylobiose (XOSY) and xylotriose (XOSB) had minimal impact on biomass and root morphology, whereas xylotetraose (XOSD) and xylopentose (XOSW) significantly increased aboveground biomass. RNA-seq analysis revealed that these growth differences are closely associated with XOS-induced immune responses. XOSD treatment induced the highest number of differentially expressed genes (DEGs), followed by XOSW, XOSB, and XOSY.
GO and KEGG enrichment analyses revealed that XOS treatments suppressed the expression of genes involved in photosynthesis, amino acid metabolism, and nitrogen metabolism. XOSY treatment downregulated DEGs annotated to photosynthesis-related pathways, while XOSB treatment further suppressed genes involved in photosystem antenna proteins, carbon fixation, and glyoxylate and dicarboxylate metabolism. XOSD and XOSW treatments not only suppressed these pathways but also downregulated chlorophyll metabolism genes. These results explain why XOSY and XOSB did not enhance lettuce biomass and suggest that higher DP XOS suppress photosynthetic capacity and carbon-nitrogen metabolism.
Upregulated DEGs in all XOS treatments were enriched in immune-related pathways, with notable differences in the level and nature of responses among treatments. XOSY treatment primarily activated genes associated with primary immune responses, including plant-pathogen interaction, plant hormone signaling, and ubiquitin-mediated proteolysis. In contrast, XOSD and XOSW treatments induced higher-level immune responses by upregulating genes in fatty acid metabolism, starch and sucrose metabolism, and cutin, suberin, and wax biosynthesis. These pathways contribute to the synthesis of secondary metabolites and structural reinforcements, such as cell wall thickening, to prevent pathogen invasion[Error! Reference source not found.-Error! Reference source not found.]. MapMan visualization highlighted significant upregulation of DEGs related to cell wall synthesis and degradation, including β-1,3-glucanase and PR protein genes. Notably, XOSD treatment upregulated nine β-1,3-glucanase genes by 2–4.8-fold and 66 PR protein genes by 0.7–5-fold, emphasizing the critical role of these genes in the enhanced immune response. PR proteins are key components of plant defense, providing resistance against diverse pathogens and pests[Error! Reference source not found.-Error! Reference source not found.].
Interestingly, despite strong immune activation, XOSD treatment significantly increased aboveground biomass. This suggests that XOSD induces a robust growth-defense tradeoff mechanism[35,36]. While photosynthesis-related pathways were suppressed, DEGs involved in carbohydrate metabolism, such as starch and sucrose metabolism, pentose and glucuronate interconversion, and amino sugar and nucleotide sugar metabolism, were upregulated. This indicates that XOSD treatment triggers osmotic regulation and reactive oxygen species (ROS) scavenging mechanisms, reducing ROS accumulation while enhancing osmoprotectant levels to balance growth and defense. RT-qPCR results further confirmed the significant upregulation of key growth-defense regulators, including Enhanced Disease Susceptibility 1 (EDS1), WRKY26, and WRKY70. EDS1, a critical hub in the salicylic acid (SA)-mediated ETI immune response, plays an essential role in basal immunity[37,38,39]. Additionally, the BZR1-EDS1 and DELLA-EDS1 protein interaction modules are key to balancing growth and defense by fine-tuning SA synthesis and suppressing excessive defense gene expression during later stages of immunity[35,40].
Auxin signaling pathways were also implicated in XOSD-induced growth promotion. XOSD treatment significantly upregulated the expression of AUX1 (auxin influx carrier) and ARF (auxin response factor) genes, enhancing auxin transport and cellular responses. This likely contributed to increased cell division and differentiation, promoting leaf expansion and aboveground biomass accumulation. In parallel, nitrate response pathways were activated, with 10 NRT1 family members upregulated, particularly NPF5.6-like and NPF8.1-like, whose expression increased by 3–3.5-fold. These nitrate transporters play a crucial role in nitrate uptake and allocation, further supporting XOSD-induced growth enhancement. Interestingly, DP parity influenced the bioactivity of XOS. Even-DP XOS (e.g., XOSD) induced more DEGs and exhibited higher enrichment in GO terms compared to odd-DP XOS. This may be due to structural compatibility between even-DP XOS and plant cell wall receptors, as glucuronoxylan polymers with even residues have enhanced hydrophilic interactions with cellulose microfibrils, which are critical for secondary cell wall development[41].
In conclusion, this study demonstrates that XOS with different DP elicit distinct growth and immune responses in lettuce, with XOSD emerging as the most effective variant for balancing growth and defense. The activation of key regulators such as EDS1, WRKY transcription factors, and nitrate transporters highlights the dual role of XOSD in promoting plant growth while enhancing immunity. Future studies should focus on elucidating the precise mechanisms underlying DP-dependent interactions between XOS and plant receptors, as well as their role in regulating the growth-defense tradeoff in different crops under biotic and abiotic stress conditions.
4. Materials and Methods
4.1. Plant Materials
This study was conducted in a controlled-environment chamber of the Institute of Biotechnology and Food Science, Hebei Academy of Agricultural and Forestry Sciences, China, from October 2021 to April 2023. Lettuce (Lactuca sativa var. ramosa Hort.), cultivar ‘Roma’, was used as the experimental plant. Xylooligosaccharides (XOS) including xylobiose (XOSY), xylotriose (XOSB), xylotetraose (XOSD), and xylopentose (XOSW) were employed as oligosaccharide materials with a purity of 90%–95%. The molecular weights of XOSY, XOSB, XOSD, and XOSW were 282.24, 414.36, 546.47, and 678.59 Da, respectively.
4.2. Experimental Design
Lettuce seedlings were grown hydroponically. Seeds were sown in seedling trays and germinated in darkness at 25°C. After 80% germination, trays were transferred to a controlled chamber with an LED lighting system comprising a red (peak at 665 nm) and blue (peak at 430 nm) light combination. The light intensity was set to 240 μmol·m⁻²·s⁻¹ with a 12-hour photoperiod (7:00 AM–7:00 PM). The day/night temperatures were 25/20°C, relative humidity was maintained at 50%, and the CO₂ concentration was ambient.
When seedlings reached the two-leaf and one-heart stage (14 days old), uniform plants were selected and transplanted into light-proof hydroponic boxes (60 × 60 × 10 cm), with 9 seedlings per box. The nutrient solution (volume: 33.6 L; depth: 9.5 cm) consisted of the following components (mmol·L⁻¹): 0.75 K₂SO₄, 0.5 KH₂PO₄, 0.1 KCl, 0.65 MgSO₄·7H₂O, 0.1 EDTA-Fe, 1.0 × 10⁻³ H₃BO₃, 1.0 × 10⁻³ MnSO₄·4H₂O, 1.0 × 10⁻³ ZnSO₄·7H₂O, 1.0 × 10⁻⁴ CuSO₄·5H₂O, and 5.0 × 10⁻⁶ H₂MoO₄. Calcium nitrate [Ca(NO₃)₂·4H₂O] was added to provide 10 mmol·L⁻¹ nitrogen. The stock nutrient solution was diluted 100-fold, and the pH was adjusted to 6.0. The nutrient solution was not replaced during the growth period.
At 16 days, seedlings were subjected to foliar application of 50 mg·L⁻¹ XOS solutions (XOSY, XOSB, XOSD, or XOSW) or distilled water as the control (CK). Treatments were applied every three days, for a total of four applications, with spraying performed at 9:00 AM. The application volume was adjusted to ensure leaves were fully covered without dripping. Three hours after the final treatment, third to fifth leaves were collected, rinsed with ultrapure water, blotted dry, snap-frozen in liquid nitrogen, and stored at –80°C for RNA extraction. Growth-related parameters were measured two days after the final treatment.
4.3. Measurement of Growth Parameters
Growth parameters were measured on 10 plants per treatment. The aboveground and belowground parts were separated at the root-shoot junction. Fresh weight of the shoots was measured, and total leaf area was determined using a leaf area scanner (LI-3000C, Li-Cor Biosciences, USA). Roots were imaged using the WinRHIZO root analysis system (Regent Instruments, Canada) to obtain root morphological parameters. Dry weights of the shoots and roots were measured after drying at 70°C for 48 h following an initial inactivation step at 105°C for 15 min.
4.4. Transcriptomic Analysis
(1) RNA Extraction and Library Construction
Total RNA was extracted using the TRIzol method (Invitrogen) and evaluated for purity using a Nanodrop spectrophotometer (IMPLEN, CA, USA) and for integrity using an Agilent 2100 Bioanalyzer (Agilent Technologies, CA, USA). RNA samples passing quality control were sent to Beijing Novogene for library preparation and sequencing using Illumina reagents (Illumina, San Diego, USA).
(2) Sequencing Data Processing
Raw reads were filtered using Trimmomatic (v0.33) to remove adapters, reads with more than 10% “N” content, and reads with low-quality bases (Q ≤ 20) exceeding 50%. Clean reads were aligned to the reference genome using STAR (v2.5.2b). Gene expression was quantified as fragments per kilobase of transcript per million mapped reads (FPKM) using HTSeq (v0.5.4.p3), and only genes with FPKM > 1 were included in subsequent analyses.
(3) Differentially Expressed Gene (DEG) Analysis
Gene-level read counts were analyzed for differential expression using DESeq (v1.10.1). Genes with q-values < 0.05 (adjusted using the Benjamini-Hochberg method) were considered significantly differentially expressed. GO (Gene Ontology) and KEGG (Kyoto Encyclopedia of Genes and Genomes) enrichment analyses were performed for the DEGs, and MapMan was used to analyze metabolic pathways.
4.5. RT-qPCR Validation
Six genes were randomly selected for validation using RT-qPCR. LsPP2AA3 was used as the internal reference gene. Primer sequences are listed in Table S4. Gene expression levels were normalized to the CK, and results confirmed that RT-qPCR trends were consistent with RNA-seq data, validating the reliability of transcriptomic results.
Supplementary Materials
The following supporting information can be downloaded at the website of this paper posted on Preprints.org, Figure S1: Comprehensive assessment of RNA-seq data accuracy; Table S1: Root morphology characteristics of lettuce plants treated with xylooligosaccharides (DP 2–5); Table S2: Sequencing data quality and alignment results with the reference genome; Table S3: Key metabolic pathways associated with lettuce growth under xylooligosaccharide (DP 2–5) treatment; Table S4: Specific primers used for RT-qPCR amplification.
Author Contributions
H.W.: Writing – original draft, Data curation, Visualization, Methodology, Investigation, Conceptualization, J.Z., L.W., W.L., Z.W., and J.L.: Methodology, Formal analysis, Visualization, Methodology. H.W. and T.W.: Writing – review & editing, Resources, Methodology, Conceptualization, Funding acquisition.
Funding
This research was funded by Centrally Guided Local Science and Technology Development Fund Project [246Z7001G], National Key R&D Program of China [grant 2021YFB3900602], Hebei Provincial Water Resources Science and Technology Plan Project [2020-07; 2022-20; 2024-63; HBST2024-03; 2025-72], Hebei Academy of Agriculture and Forestry Sciences Agriculture Science and Technology Innovation Project [2022KJCXZX-SSS-7].
Date Availability Statement
The RNA-seq data have been deposited in the Sequence Read Archive (SRA) of the National Center for Biotechnology Information (NCBI) under the accession number PRJNA1161149. All data supporting the conclusions of this study are included within the main manuscript and the supplementary files.
Conflict of Interest
The authors declare that they have no known competing financial interests or personal relationships that could have appeared to influence the work reported in this paper.
References
- Wang, B.T.; Hu, S.; Yu, X.Y.; Zhu, Y.J.; Jin, F.J. Studies of cellulose and starch utilization and the regulatory mechanisms of related enzymes in fungi. Polymers 2020, 12: 530. [CrossRef]
- Sarkar, P.; Bosneaga, E.; Aure, M. Plant cell walls throughout evolution: towards a molecular understanding of their design principles. Journal of Experimental Botany 2009, 60: 3615-3635. [CrossRef]
- Akin, D.E. Plant cell wall aromatics: Influence on degradation of biomass. Biofuels Bioproducts and Biorefining-Biofpr 2010, 2: 288-303. [CrossRef]
- Ramoni, J.; Seiboth, B. 6 Degradation of plant cell wall polymers by fungi. Switzerland: Springer International Publishing, 2016; 127-148.
- Zarattini, M.; Corso, M.; Kadowaki, M.A.; Monclaro, A.; Magri, S.; Milanese, I.; Jolivet, S.; de Godoy, M.O.; Hermans, C.; Fagard, M.; Cannella, D. LPMO-oxidized cellulose oligosaccharides evoke immunity in Arabidopsis conferring resistance towards necrotrophic fungus B. cinerea. Communications Biology 2021, 4: 727. [CrossRef]
- Bellincampi, D.; Cervone, F.; Lionetti, V. Plant cell wall dynamics and wall-related susceptibility in plant-pathogen interactions. Frontiers in Plant Science 2014, 5: 1-8. [CrossRef]
- Engelsdorf, T.; Gigli-Bisceglia, N.; Veerabagu, M.; McKenna, J.; Vaahtera, L.; Augstein, F.; der Does, D.V.; Zipfel, C.; Hamann, T. The plant cell wall integrity maintenance and immune signaling systems cooperate to control stress responses in Arabidopsis thaliana. Science Signaling 2018, 11: eaao3070. [CrossRef]
- Rebaque, D.; Del, H.I.; Lopez, G.; Bacete, L.; Vilaplana, F.; Dallabernardina, P.; Pfrengle, F.; Jordá, L.; Sánchez-Vallet, A.; Pérez, R.; Brunner, F.; Molina, A.; Mélida, H. Cell wall-derived mixed-linked beta-1,3/1,4-glucans trigger immune responses and disease resistance in plants. Plant Journal 2021, 106: 601-615. [CrossRef]
- Lorrai, R.; Ferrari, S. Host cell wall damage during pathogen infection: mechanisms of perception and role in plant-pathogen interactions. Plants 2021, 10: 399. [CrossRef]
- Dora, S.; Terrett, O.M.; Sannchez-Rodrihuez, C. Plant-microbe interactions in the apoplast: Communication at the plant cell wall. Plant Cell 2022, 34: 1532-1550. [CrossRef]
- Eijsink, V.G.H.; Petrovic, D.; Forsberg, Z.; Mekasha, S.; Røhr, A.K.; Várnai, A.; Bissaro, B.; Vaaje-Kolstad, G. On the functional characterization of lytic polysaccharide monooxygenases (LPMOs). Biotechnology for Biofuels and Bioproducts 2019, 12: 1-16. [CrossRef]
- Wei, W.; Xu, L.S.; Peng, H.; Zhu, W.J.; Tanaka, K.; Cheng, J.S.; Sanguinet, K.A.; Vandemark, G.; Chen, W.D. A fungal extracellular effector inactivates plant polygalacturonase-inhibiting protein. Nature Communications 2022, 13: 2213. [CrossRef]
- Uluisik, S.; Seymour, G.B. Pectate lyases: Their role in plants and importance in fruit ripening. Food Chemistry 2020, 309: 125559. [CrossRef]
- Kubicek, C.P.; Starr, T.L.; Glass, N.L. Plant cell wall-degrading enzymes and their secretion in plant-pathogenic fungi. Annual Review of Phytopathology 2014, 52: 427-451. [CrossRef]
- Bacete, L.; Melidi, H.; Miedes, E.; Molina, A. Plant cell wall-mediated immunity: Cell wall changes trigger disease resistance responses. Plant Journal 2018, 93: 614-636. [CrossRef]
- Vaahtera, L.; Schulz, J.; Hamann, T. Cell wall integrity maintenance during plant development and interaction with the environment. Nature Plants 2019, 5: 924-932. [CrossRef]
- Du, J.; Anderson, C.T.; Xiao, C. Dynamics of pectic homogalacturonan in cellular morphogenesis and adhesion, wall integrity sensing and plant development. Nature Plants 2022, 8: 332-340. [CrossRef]
- Wan, J.X.; He, M.; Hou, Q.Q.; Zou, L.J.; Yang, Y.H.; Wei, Y.; Chen, X.W. Cell wall associated immunity in plants. Stress Biology 2021, 1: 3. [CrossRef]
- Pontiggia,D.; Benedetti, M.; Costantini, S.; De Lorenzo, G.; Cervone, F. Dampening the DAMPs: How plants maintain the homeostasis of cell wall molecular patterns and avoid hyper-immunity. Frontiers in Plant Science 2020, 11: 613259. [CrossRef]
- Souza, C.D.A.; Li, S.; Lin, A.Z.; Boutrot, F.; Grossmann, G.; Zipfel, C.; Somerville, S.C. Cellulose-derived oligomers act as damage-associated molecular patterns and trigger defense-like responses. Plant Physiology 2017, 173: 2383-2398. [CrossRef]
- Oelmüller, R. Sensing environmental and developmental signals via cellooligomers. Journal of Plant Physiology 2018, 229: 1-6. [CrossRef]
- Chavanke, S.N.; Penna, S.; Dalvi, S.G. β-Glucan and its nanocomposites in sustainable agriculture and environment: An overview of mechanisms and applications. Environmental Science and Pollution Research 2022, 29: 80062–80087. [CrossRef]
- Bacete, L.; Hamann, T. The role of mechanoperception in plant cell wall integrity maintenance. Plants 2020, 9: 574. [CrossRef]
- Rzemieniewski, J.; Stegmann, M. Regulation of pattern-triggered immunity and growth by phytocytokines. Current Opinion in Plant Biology 2022, 68: 102230. [CrossRef]
- He, J.X.; Han, W.; Wang, J.; Qian, Y.C.; Saito, M.; Bai, W.B.; Song, J.Q.; Lv G.H.; Functions of oligosaccharides in improving tomato seeding growth and chilling resistance. Journal of Plant Growth Regulation 2021, 41: 535-545. [CrossRef]
- Wu, J.R.; Yang, Z.L.; Yang, X.C.; Chen, X.T.; Zhang, H.T.; Zhan, X,B. Synthesis of branched beta-1,3-glucan oligosaccharide with narrow degree of polymerization by fungi co-cultivation. Carbohydrate Polymers 2021, 273: 118582. [CrossRef]
- Xing, M.C.; Cao, Q.; Wang, Y.; Xiao, H.; Zhao, J.R.; Zhang, Q.; Ji, A.G.; Song, S.L. Advances in research on the bioactivity of alginate oligosaccharides. Marine Drugs 2020, 18: 144. [CrossRef]
- Pring, S.; Kato, H.; Imano, S.; Camagna, M.; Tanaka, A.; Kimoto, H.; Chen, P.R.; Shrotri, A.; Kobayashi, H.; Fukuoka, A.; Saito, M.; Suzuki, T.; Terauchi, R.; Sato, I.; Chiba, S.; Takemoto, D. Induction of plant disease resistance by mixed oligosaccharide elicitors prepared from plant cell wall and crustacean shells. Physiologia Plantarum 2023, 175: e14052. [CrossRef]
- Li, C.; Dong, Z.P.; Zhang, B.; Huang, Q.; Liu, G.; Fu, X. Structural characterization and immune enhancement activity of a novel polysaccharide from Moringa oleifera leaves. Carbohydrate Polymers 2020, 234: 115897. [CrossRef]
- Ziv, C.; Zhao, Z.Z.; Gao, Y.G.; Xia, Y. Multifunctional roles of plant cuticle during plant-pathogen interactions. Frontiers in Plant Science 2018, 9: 1088. [CrossRef]
- Petrasch, S.; Knapp, S.J.; van Kan, J.A.L.; Blanco-Ulate, B. Grey mould of strawberry, a devastating disease caused by the ubiquitous necrotrophic fungal pathogen Botrytis cinerea. Molecular Plant Pathology 2019, 20: 877–892. [CrossRef]
- Silva, M.S.; Arraes, F.B.M.; Campos, M.A.; Grossi-de-Sá, M.; Fernandez, D.; Cândido, E.S.; Cardoso, M.H.; Franco, O.L. Grossi-de-Sa, M.F. Review: Potential biotechnological assets related to plant immunity modulation applicable in engineering disease-resistant crops. Plant Science 2018, 270: 72–84. [CrossRef]
- Kolodziej, M.C.; Singla, J.; Sánchez-Martín, J.; Kolodziej, M.C.; Singla, J.; Sánchez-Martín, J.; Zbinden, H.; Šimková, H.; Karafiátová, M.; Doležel, J.; Gronnier, J.; Poretti, M.; Glauser, G.; Zhu,W.S.; Köster, P.; Zipfel, C.; Wicker, T.; Krattinger, S.G.; Keller, B. A membrane-bound ankyrin repeat protein confers race-specific leaf rust disease resistance in wheat. Nature Communications 2021, 12: 956. [CrossRef]
- Zhou, Z.Z.; Pang, Z.Q.; Zhao, S.L.; Zhang, L.L.; Lv, Q.M.; Yin, D.D.; Li, D.Y.; Liu, X.; Zhao, X.F.; Li, X.B.; Wang, W.M.; Zhu, L.H. Importance of OsRac1 and RAI1 in signalling of nucleotide-binding site leucine-rich repeat protein-mediated resistance to rice blast disease. New Phytologist 2019, 223: 828–838. [CrossRef]
- Li, Y.G.; Yang, Y.H.; Hu, Y.L.; Liu, H.L.; He, M.; Yang, Z.Y.; Kong, F.J.; Liu, X.; Hou, X.L. DELLA and EDS1 form a feedback regulatory module to fine-tune plant growth-defense tradeoff in Arabidopsis. Molecular Plant 2019, 12: 1485-1498. [CrossRef]
- Zhang, H.; Zhao, Y.; Zhu, J.K. Thriving under stress: how plants balance growth and the stress response. Developmental Cell 2020, 55: 529-543. [CrossRef]
- Li, Y.J.; Xue, J.; Wang, F.Z.; Huang, X.J.; Gong, B.Q.; Tao, Y.H.; Shen, W.Z.; Tao, K.H.; Yao, N.; Xiao, S.; Zhou, J.M.; Li, J.F. Plasma membrane-nucleo-cytoplasmic coordination of a receptor-like cytoplasmic kinase promotes EDS1-dependent plant immunity. Nature Plants 2022, 8: 802-816. [CrossRef]
- Chen, J.N. Functions and mechanism of WRKY transcription factors in brassinosteroid-regulated plant growth and stress response. Ames: Iowa State University, 2017, 50-77.
- Granthan, N.J.; Wurman-Rodrich, J.; Terrett, O.M.; Lyczakowski, J.J.; Stott, K.; Iuga, D.; Simmons, T.J.; Durand-Tardif, M.; Brown, S.P.; Dupree, R.; Busse-Wicher, M.; Dupree, P. An even pattern of xylan substitution is critical for interaction with cellulose in plant cell walls. Nature Plants 2017, 3: 859-865. [CrossRef]
- Qi, G.; Chen, H.; Wang, D, Zheng, H.Y.; Tang, X.F.; Guo, Z.Z.; Chen, J.Y.; Chen, J.; Wang, Y.P.; Bai, M.Y.; Liu, F.Q.; Wang, D.W.; Fu, Z.Q. The BZR1-EDS1 module regulates plant growth-defense coordination. Molecular Plant 2021, 14: 2072-2087. [CrossRef]
- Wang, Q.; Yu, F.F.; Xie Q. Balancing growth and adaptation to stress: Crosstalk between brassinosteroid and abscisic acid signaling. Plant Cell and Environment 2020, 43: 2325-2335. [CrossRef]
Figure 1.
Effects of xylooligosaccharides with different degrees of polymerization on the growth of lettuce (27 d). (A) Aboveground fresh biomass and leaf area (B) of lettuce seedlings treated with distilled water (CK), xylobiose (XOSY), xylotriose (XOSB), xylotetraose (XOSD), and xylopentose (XOSW). (B) Representative images of lettuce plants under CK, XOSY, XOSB, XOSD, and XOSW treatments. (C) Dry weight of lettuce seedlings treated with XOS. (E) Representative root images of lettuce seedlings showing differences in root morphology under CK, XOSY, XOSB, XOSD, and XOSW treatments. Values are presented as mean ± standard deviation (n = 8). Significant differences between treatments and the control group are indicated by different letters (P < 0.05). Scale bar for root images: 6.5 cm.
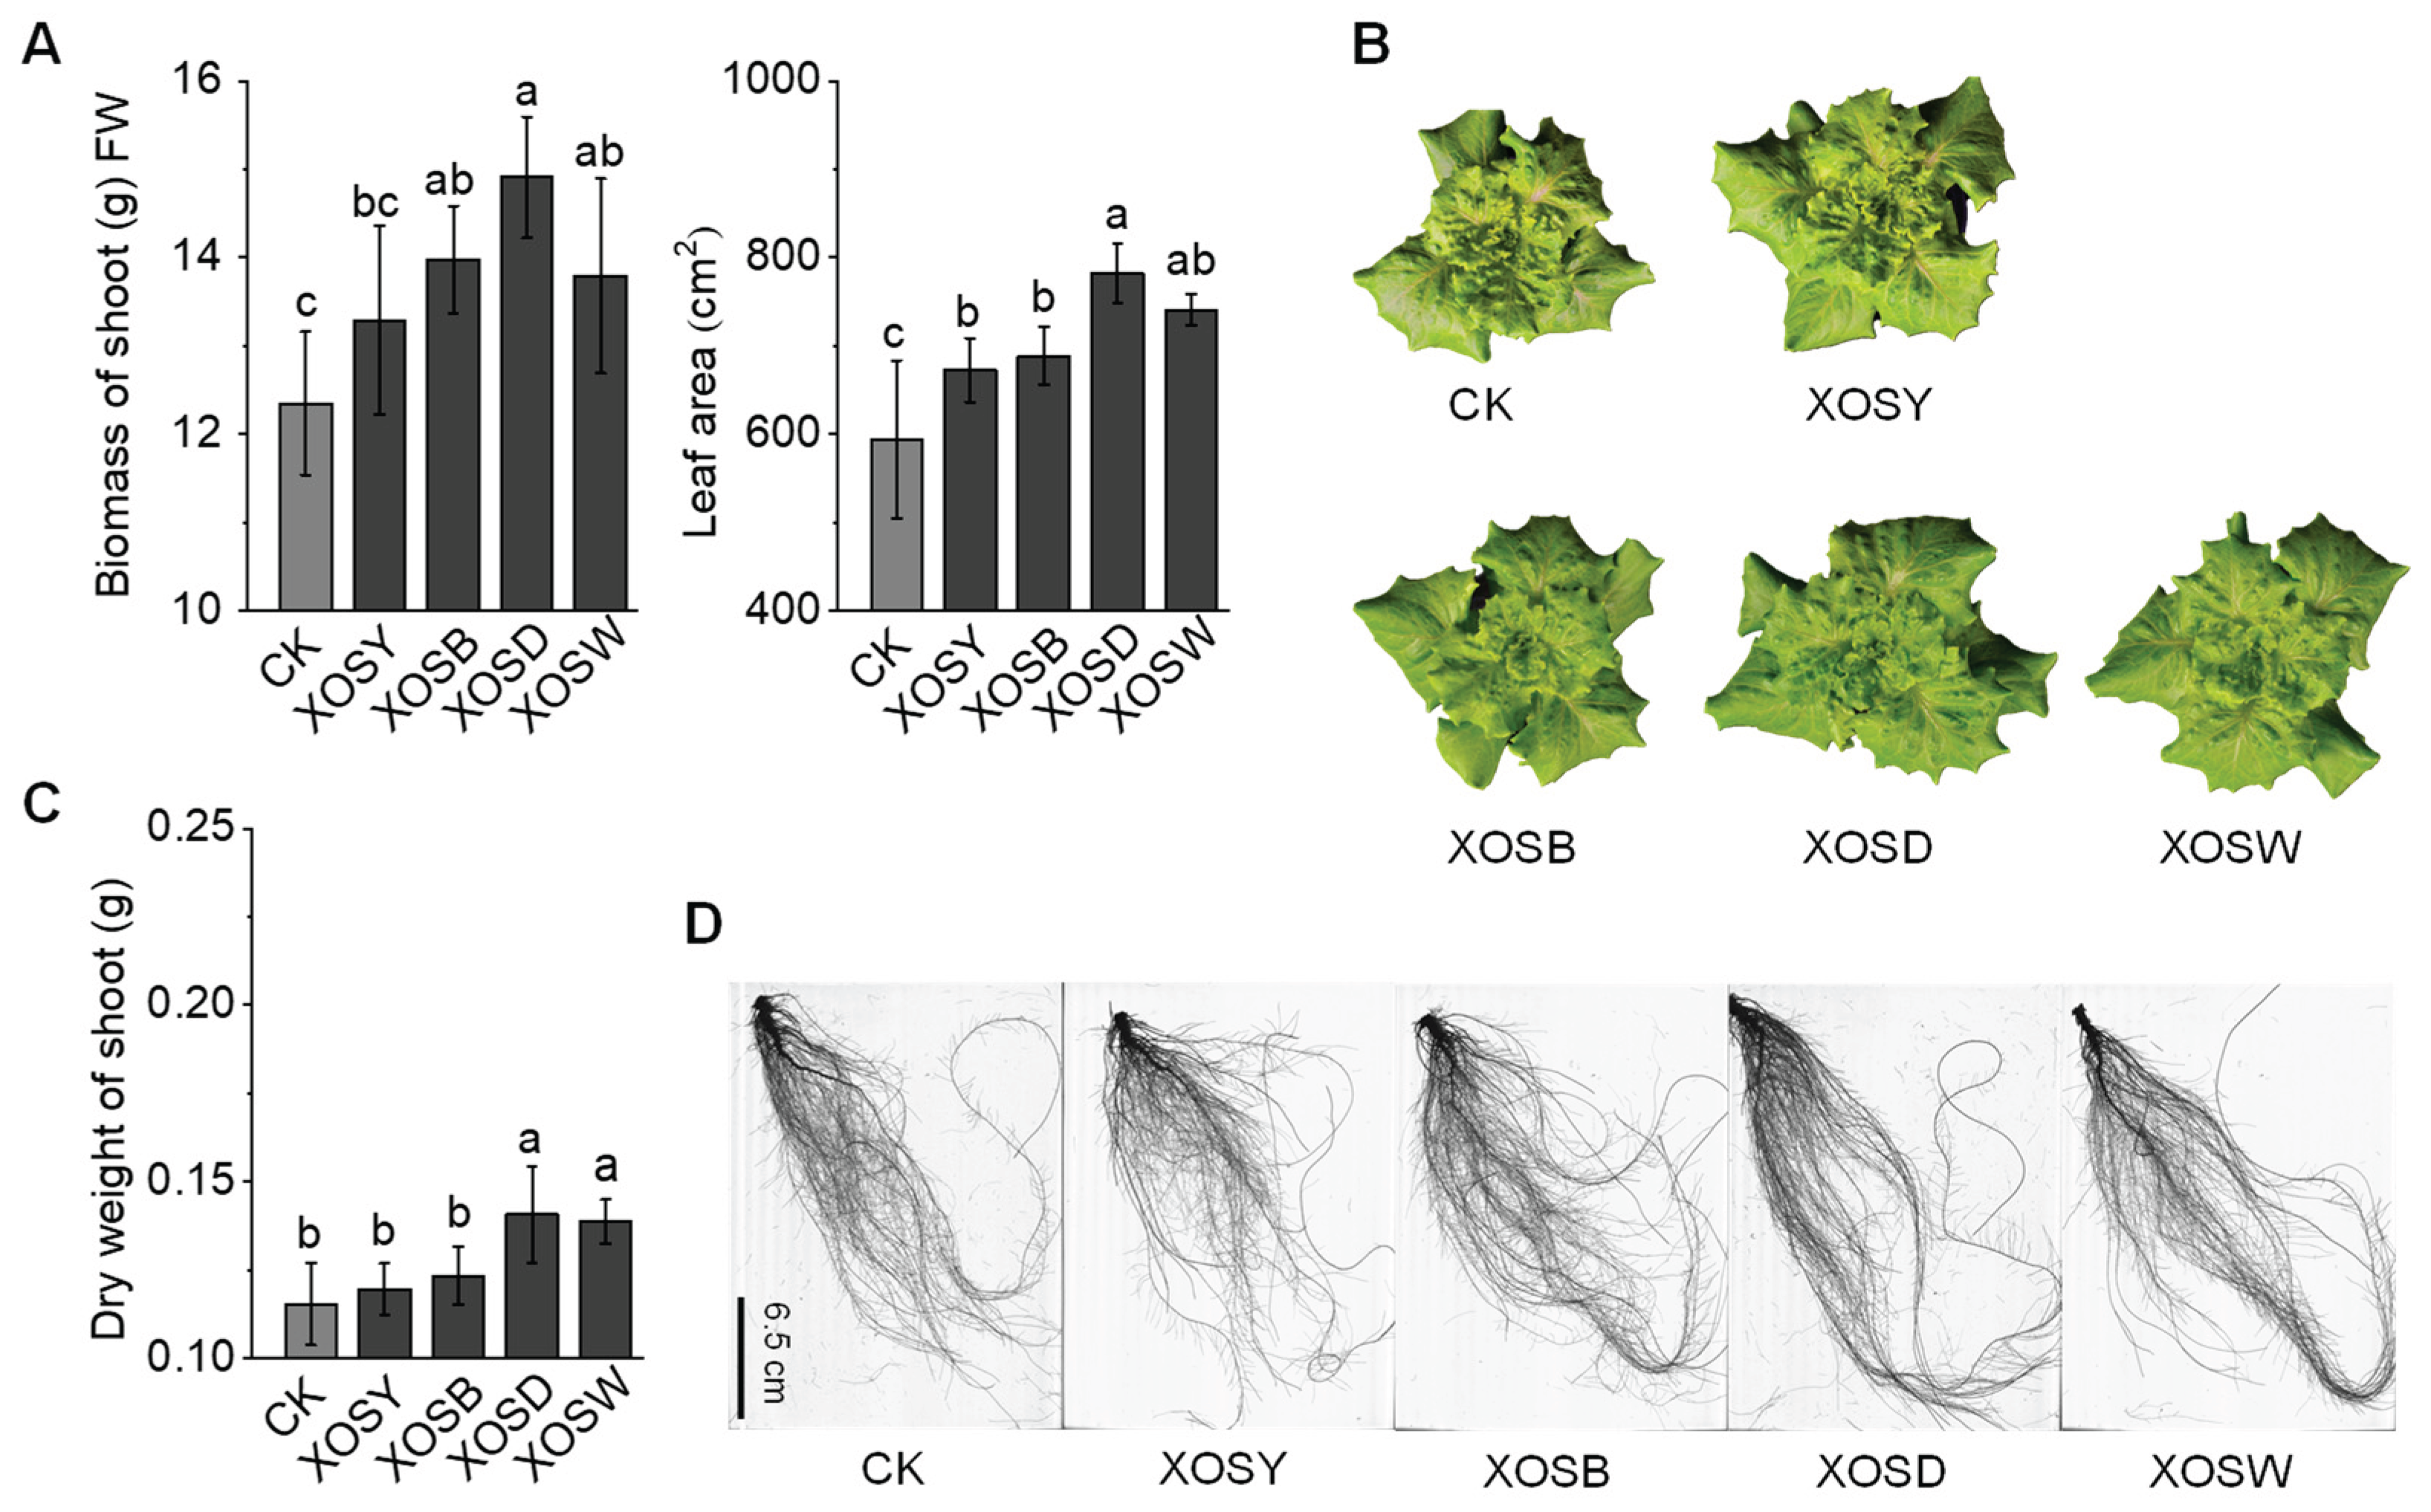
Figure 2.
Volcano plot (A) and Venn diagram (B) analysis of differentially expressed genes (DEGs) in lettuce leaves treated with xylooligosaccharides of low degree of polymerization (DP 2–5). The volcano plot highlights up-regulated (red) and down-regulated (green) genes, comparing samples with and without xylooligosaccharide treatment. The Venn diagram illustrates the overlap and uniqueness of DEGs across different treatment conditions.
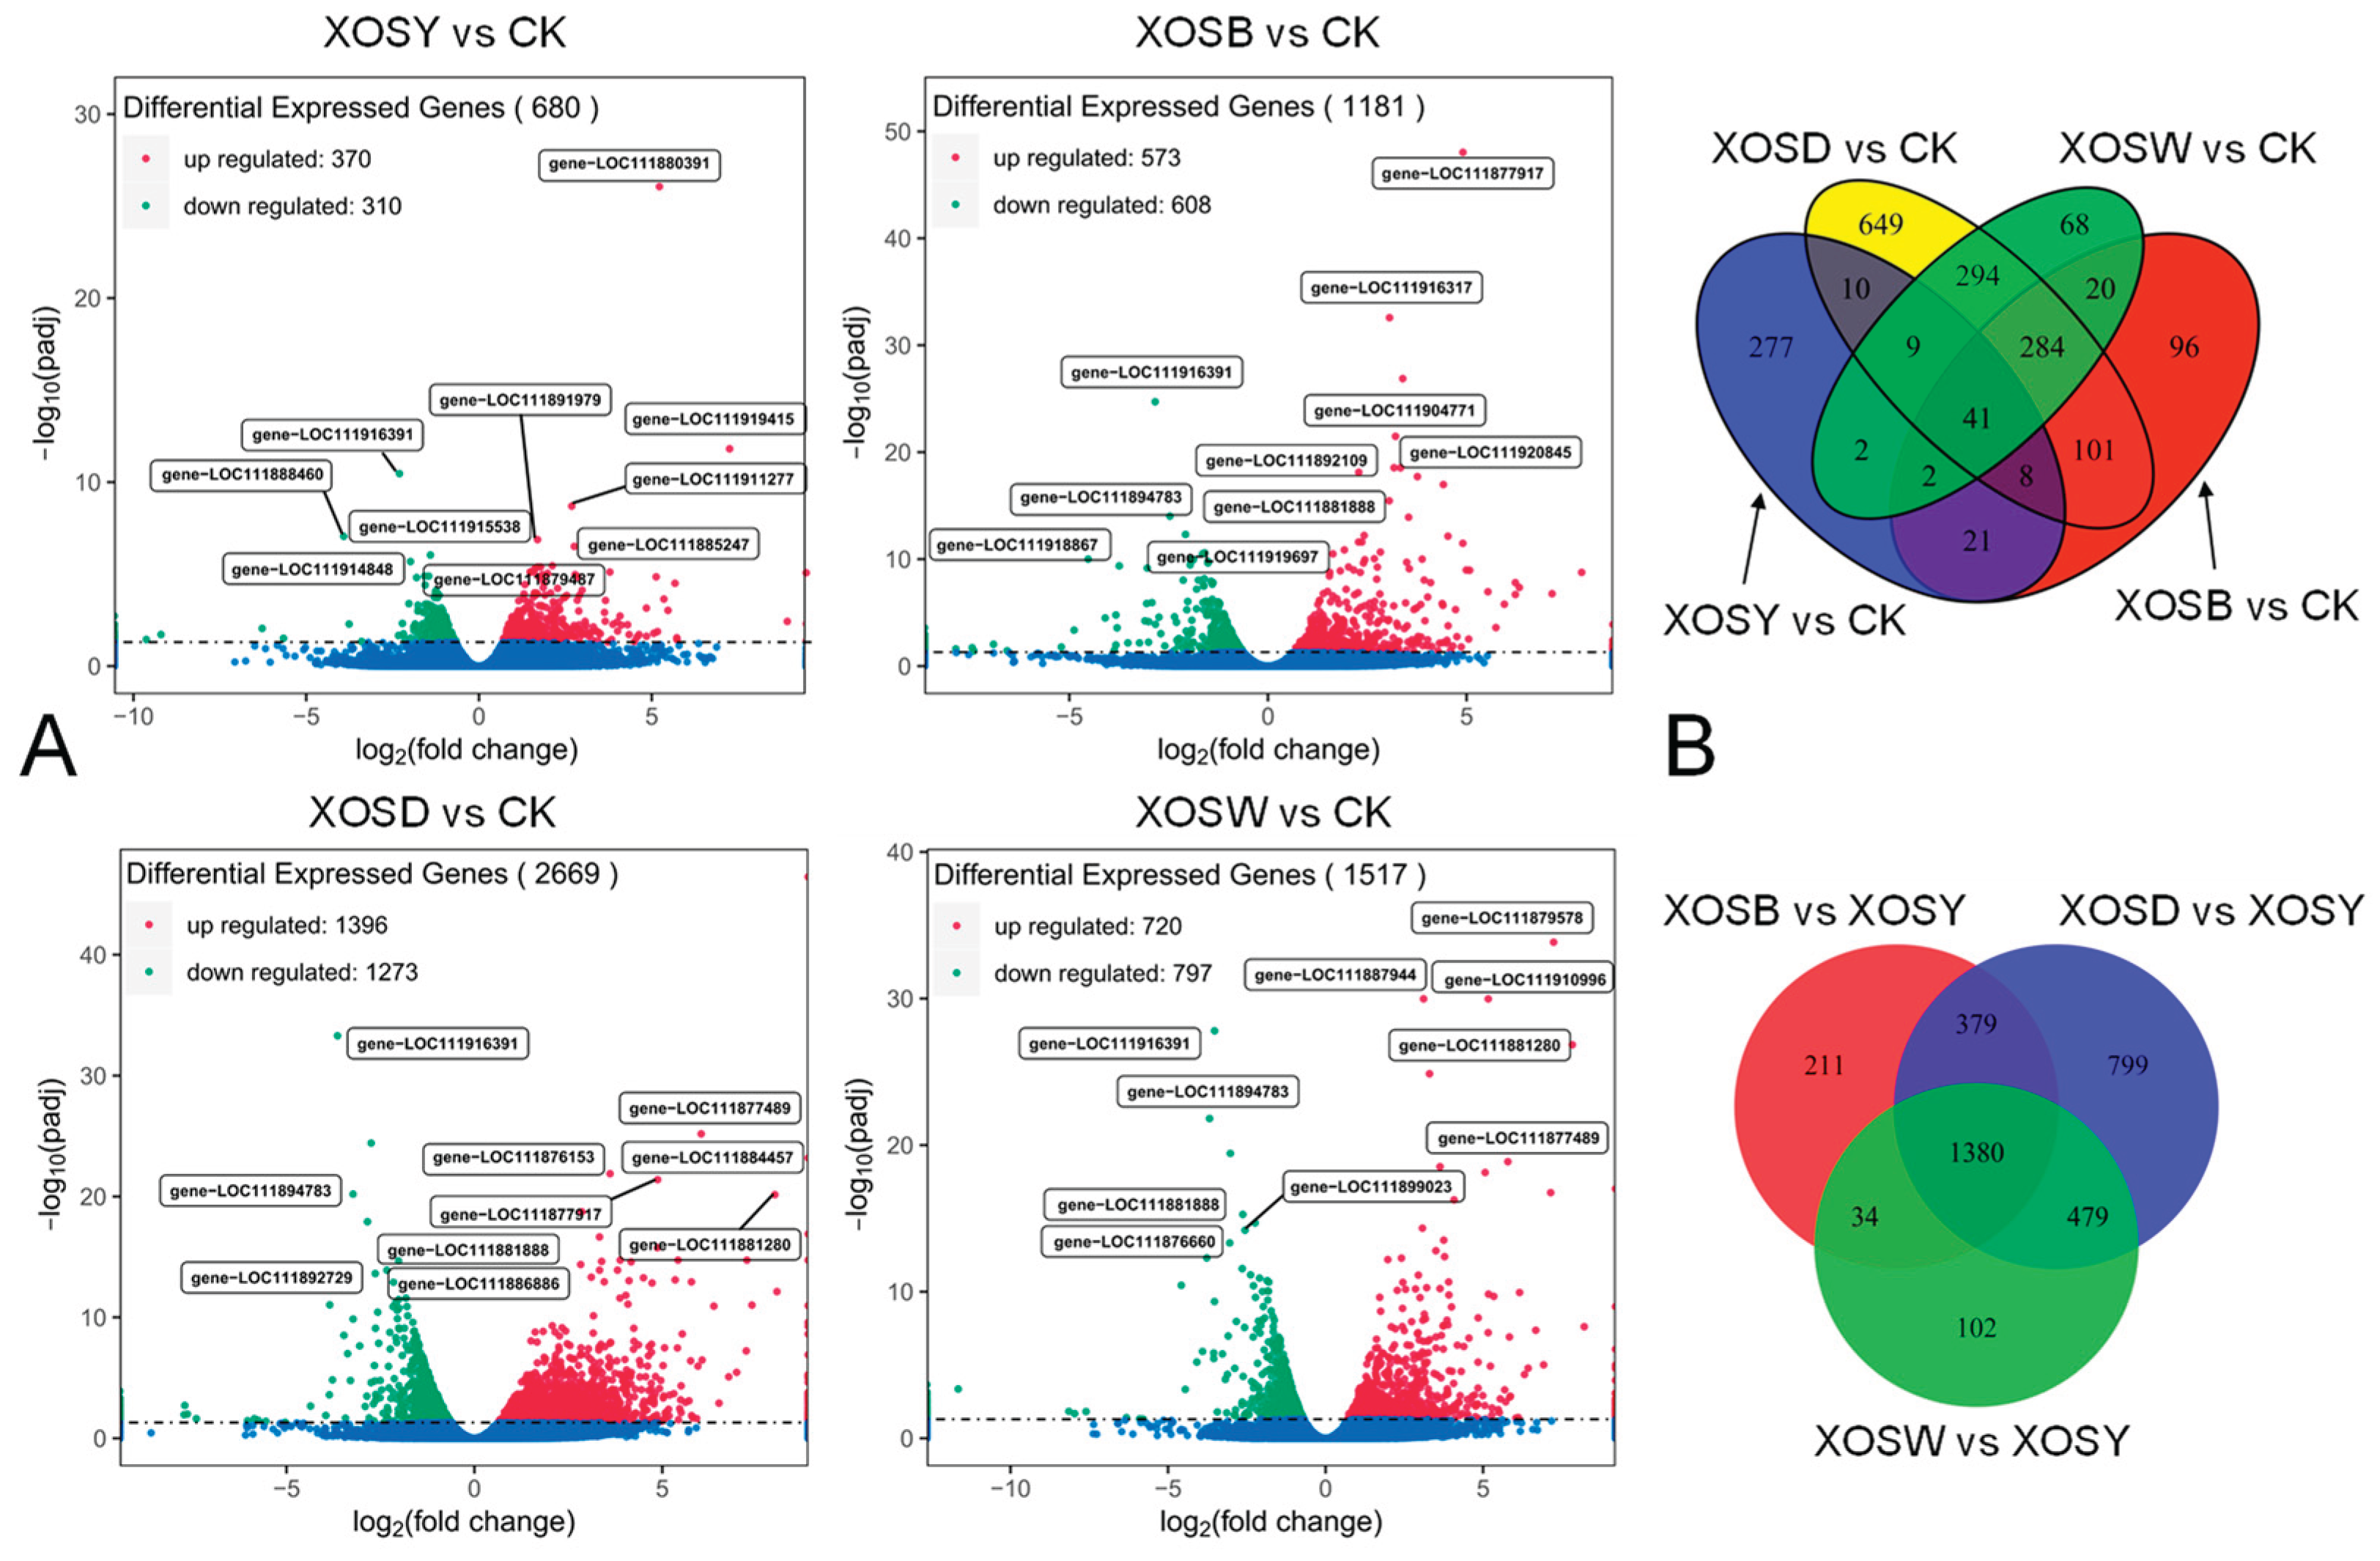
Figure 3.
GO enrichment analysis of differentially expressed genes (DEGs) in lettuce leaves treated with xylooligosaccharides (DP 2–5). The analysis categorizes DEGs into enriched Gene Ontology (GO) terms across three domains: biological processes, cellular components, and molecular functions, highlighting key functional pathways affected by the treatment.
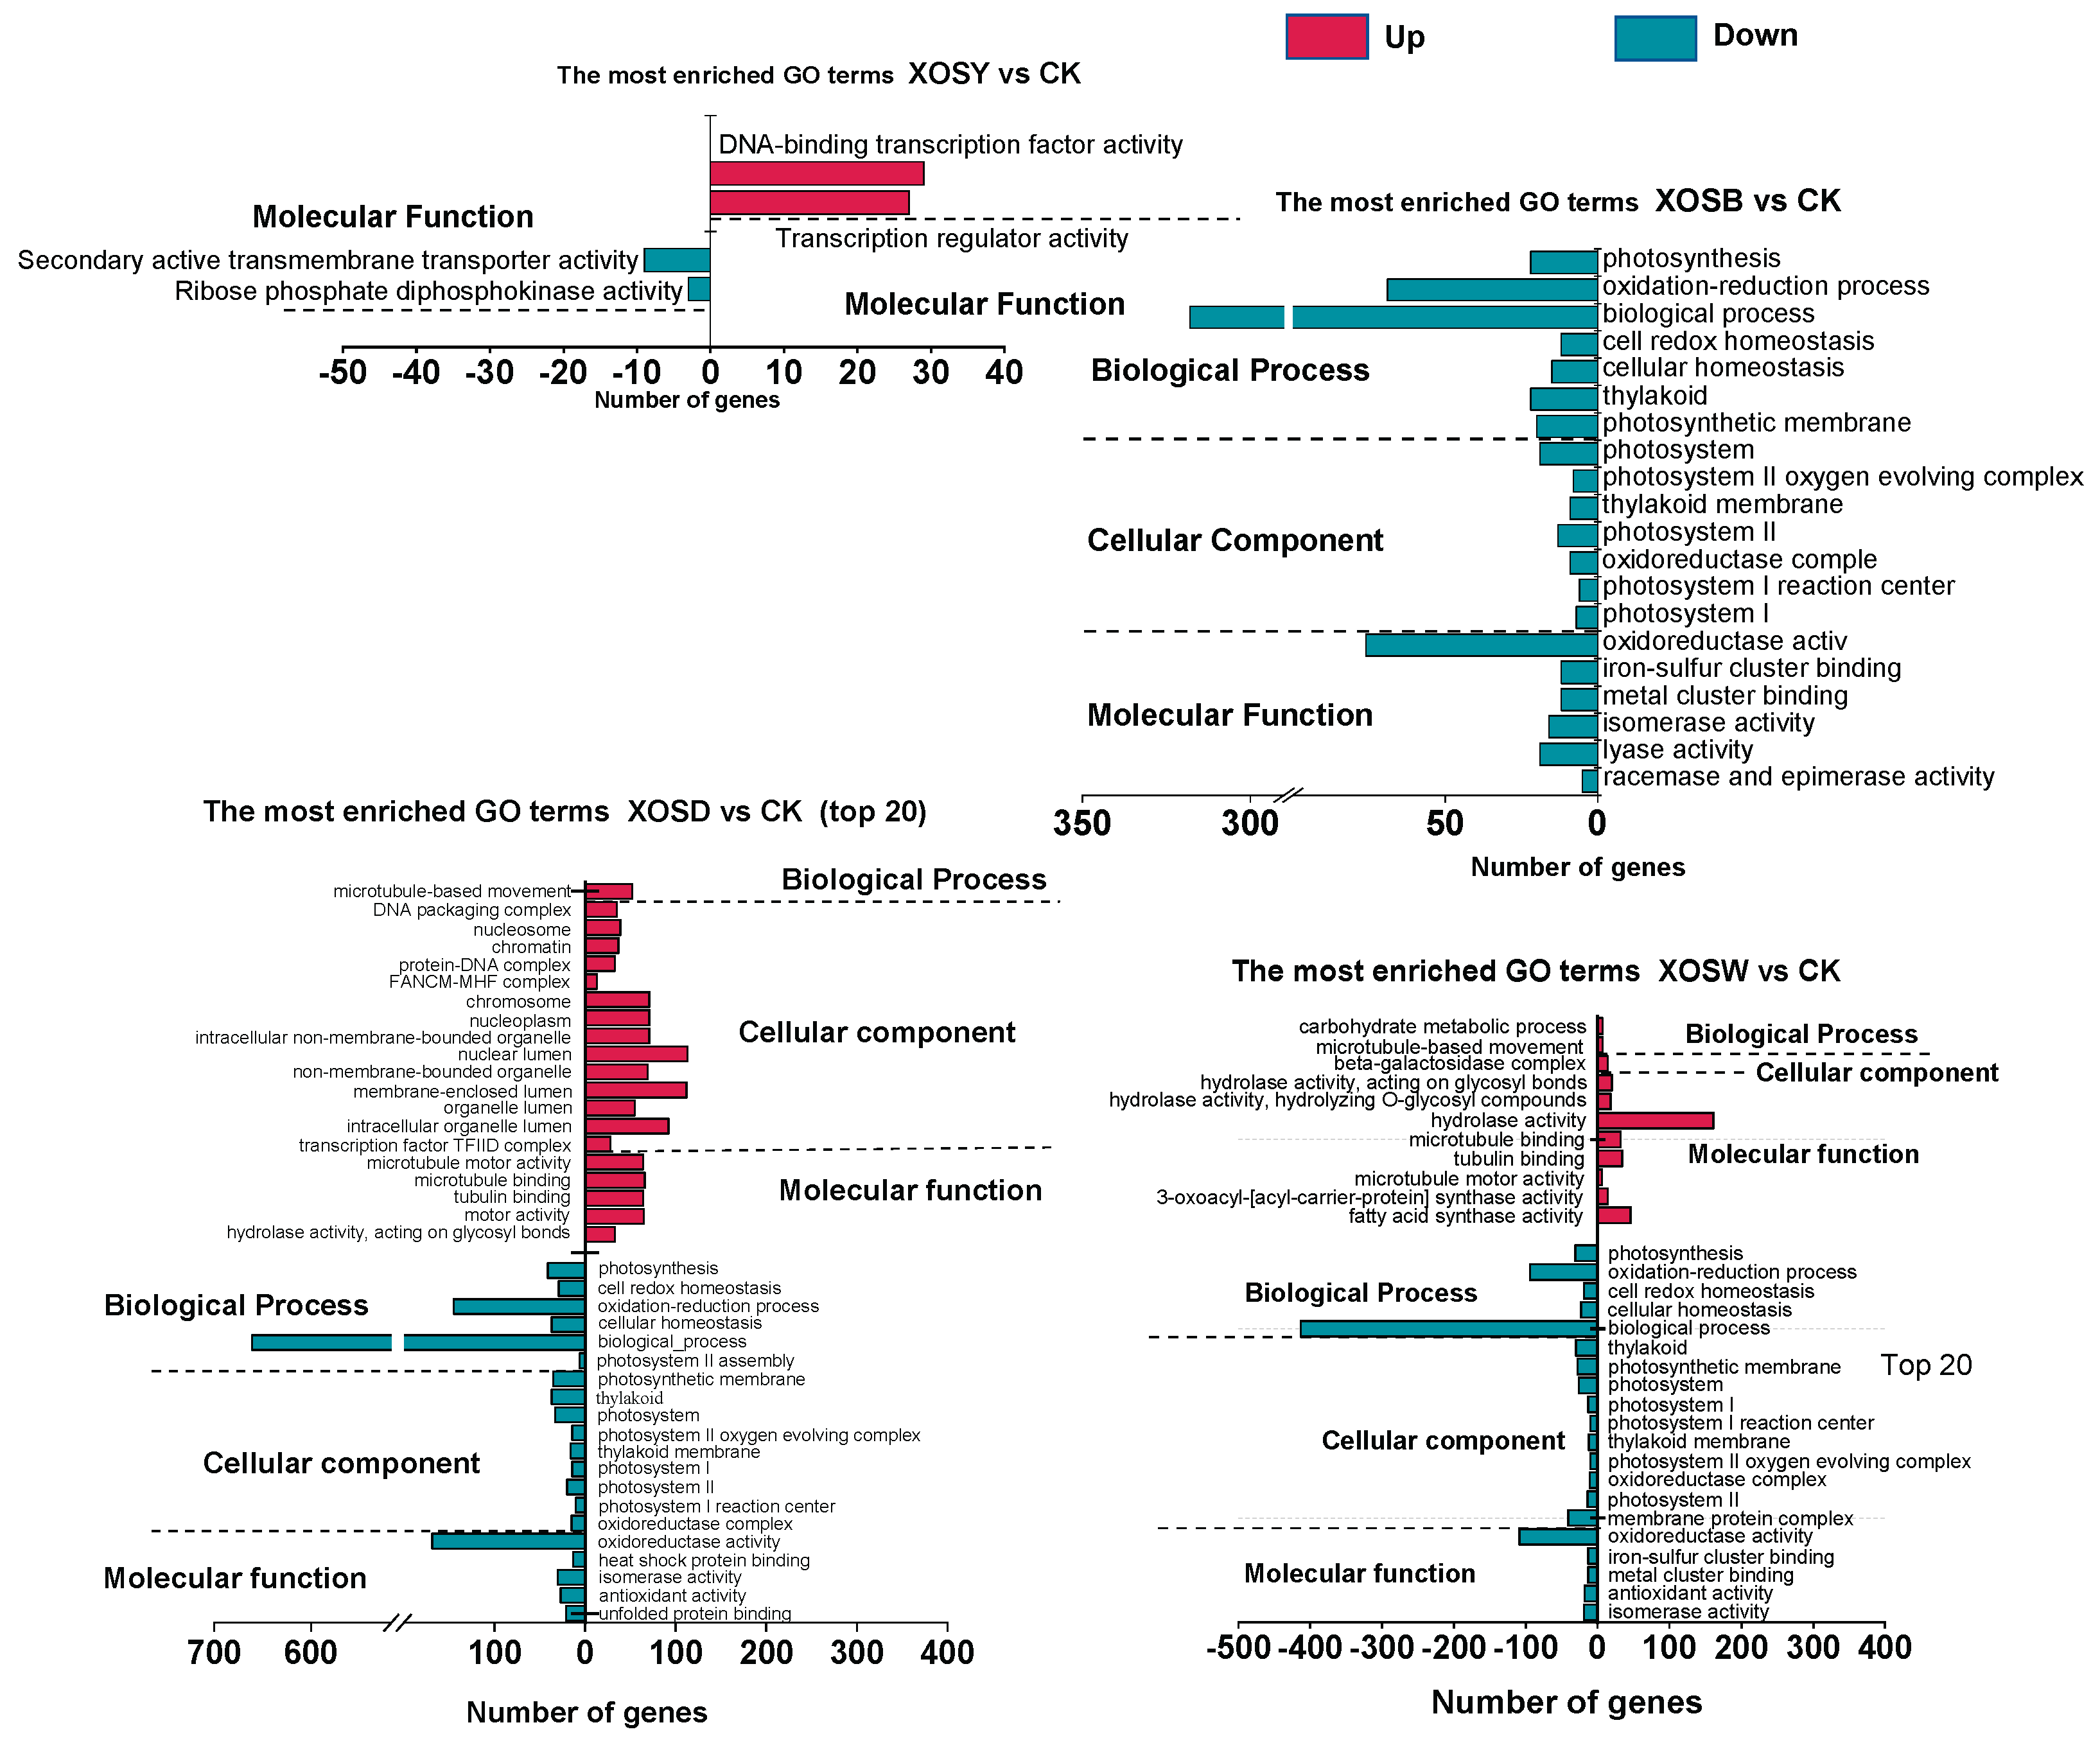
Figure 4.
KEGG enrichment analysis of differentially expressed genes (DEGs) in lettuce leaves treated with xylooligosaccharides (DP 2–5).
Figure 4.
KEGG enrichment analysis of differentially expressed genes (DEGs) in lettuce leaves treated with xylooligosaccharides (DP 2–5).
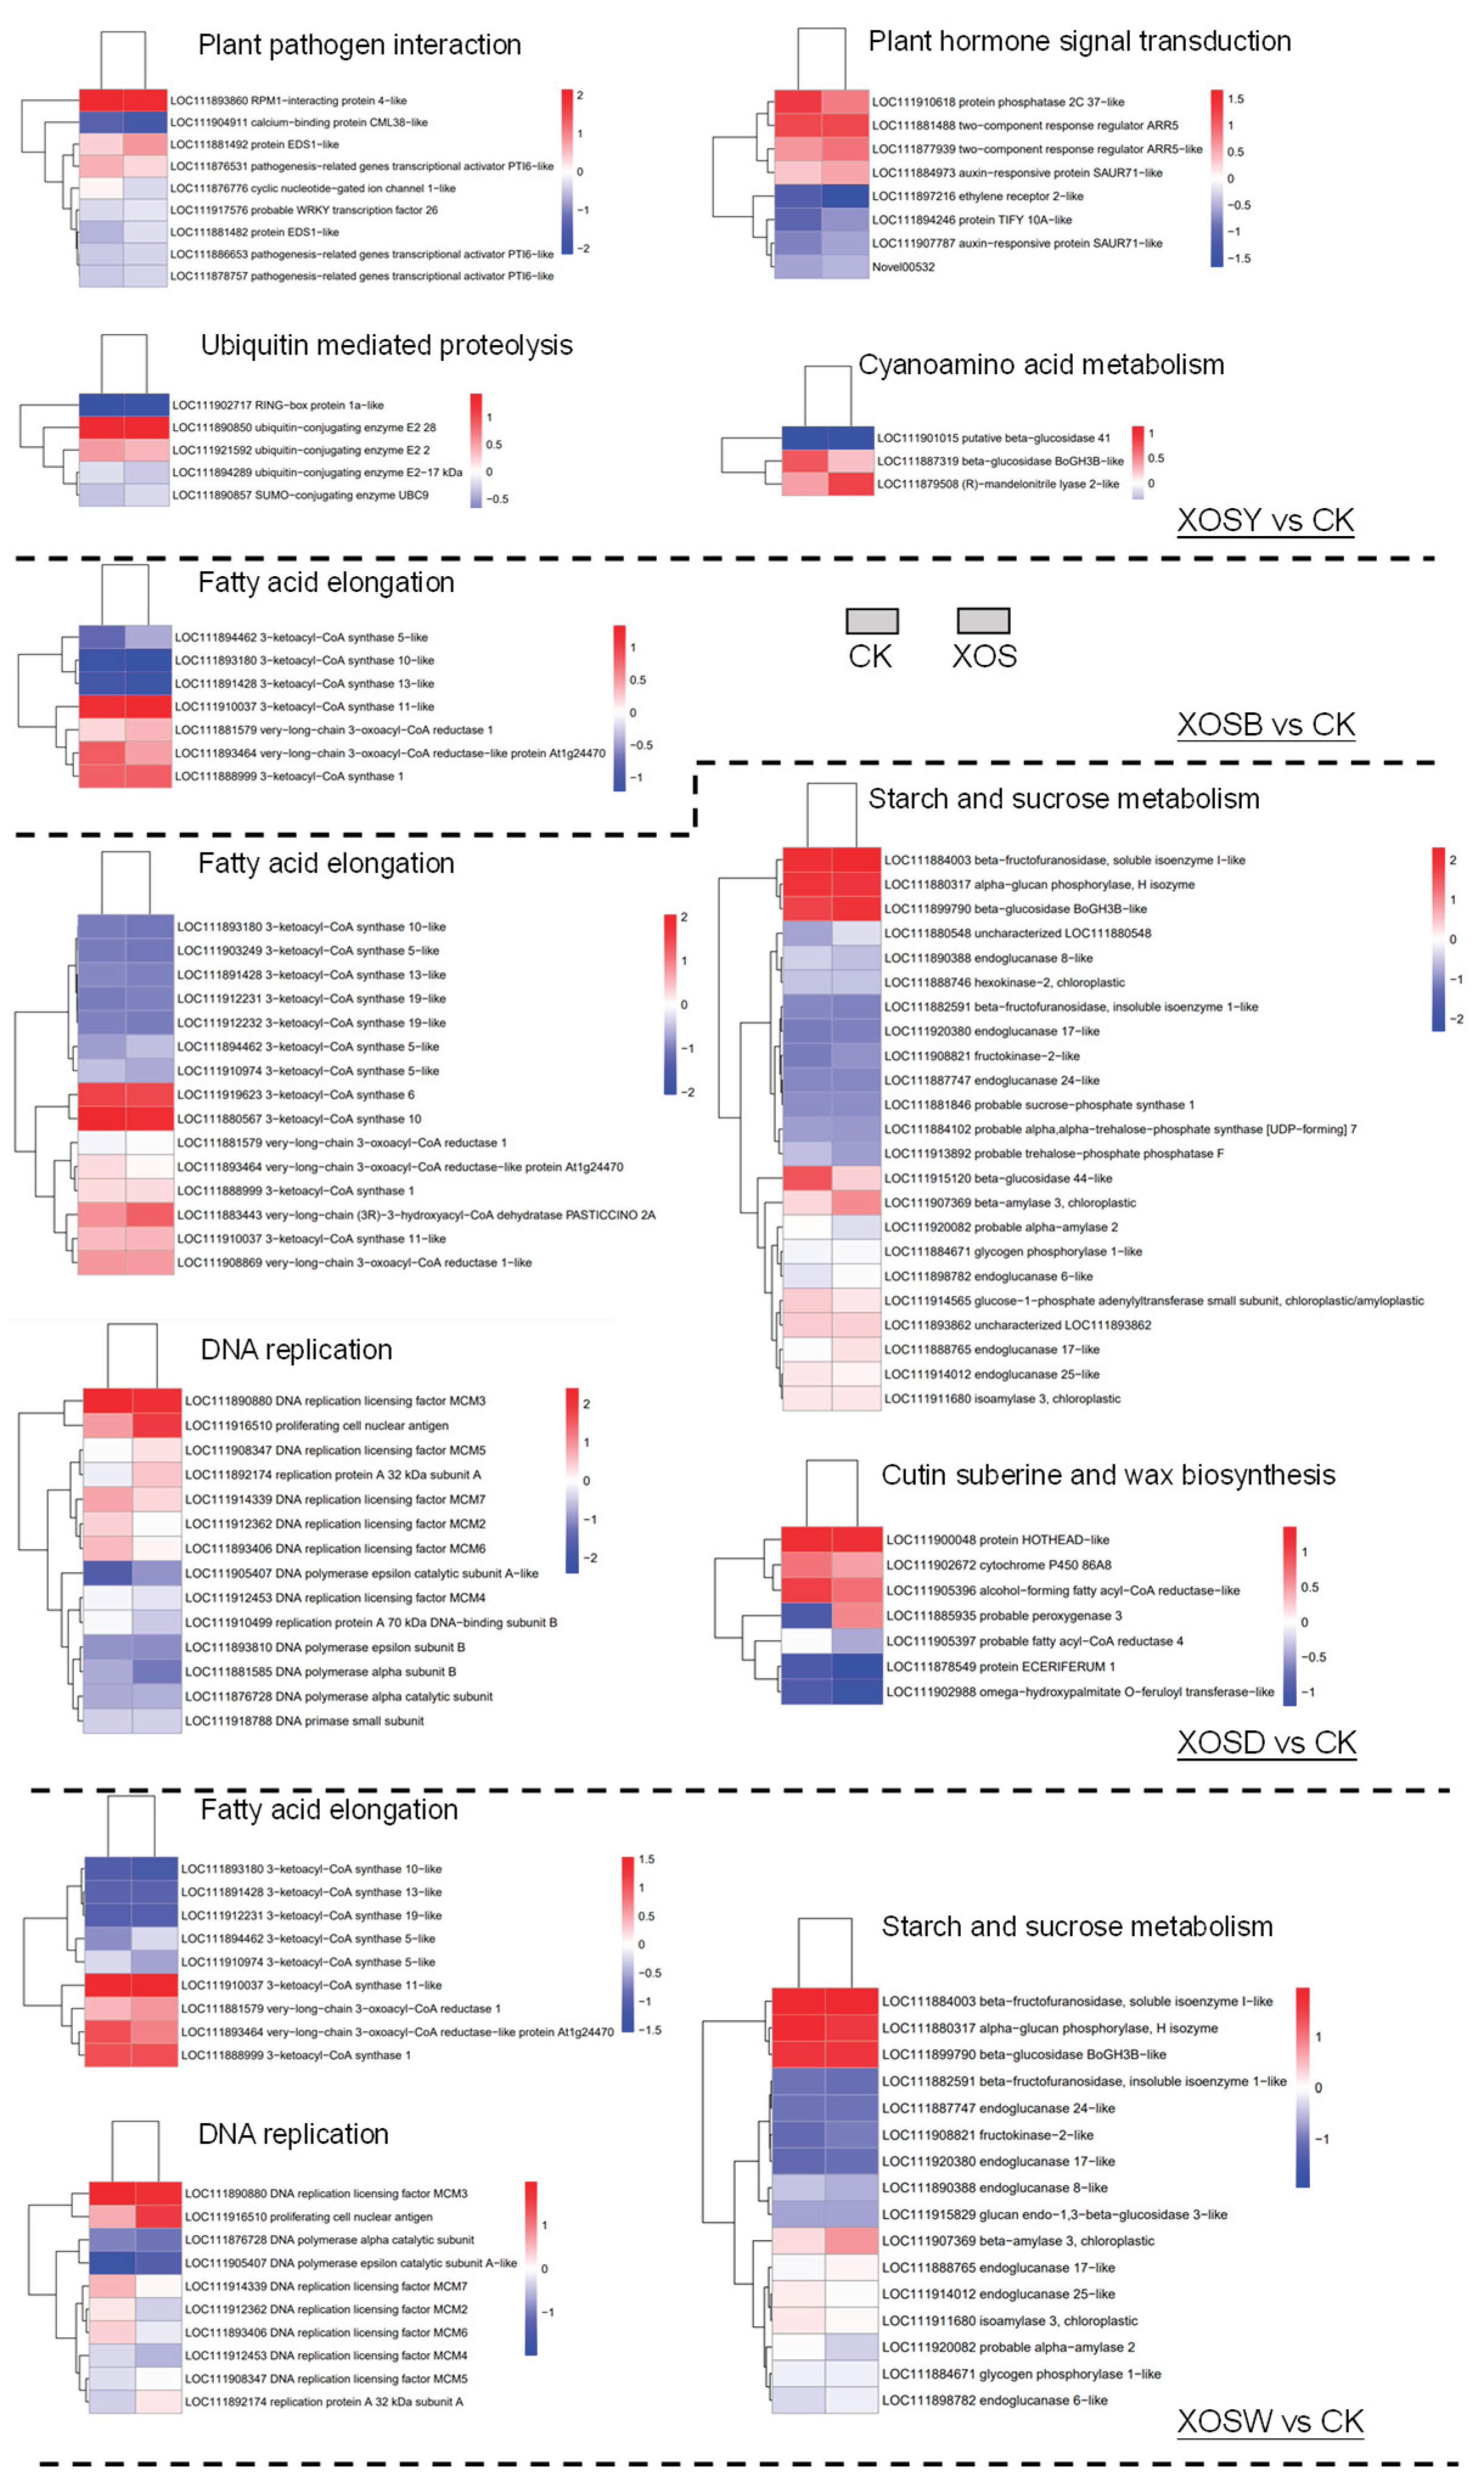
Figure 5.
MapMan analysis of differentially expressed genes (DEGs) associated with plant biotic stress in lettuce leaves treated with xylooligosaccharides (DP 2–5).
Figure 5.
MapMan analysis of differentially expressed genes (DEGs) associated with plant biotic stress in lettuce leaves treated with xylooligosaccharides (DP 2–5).
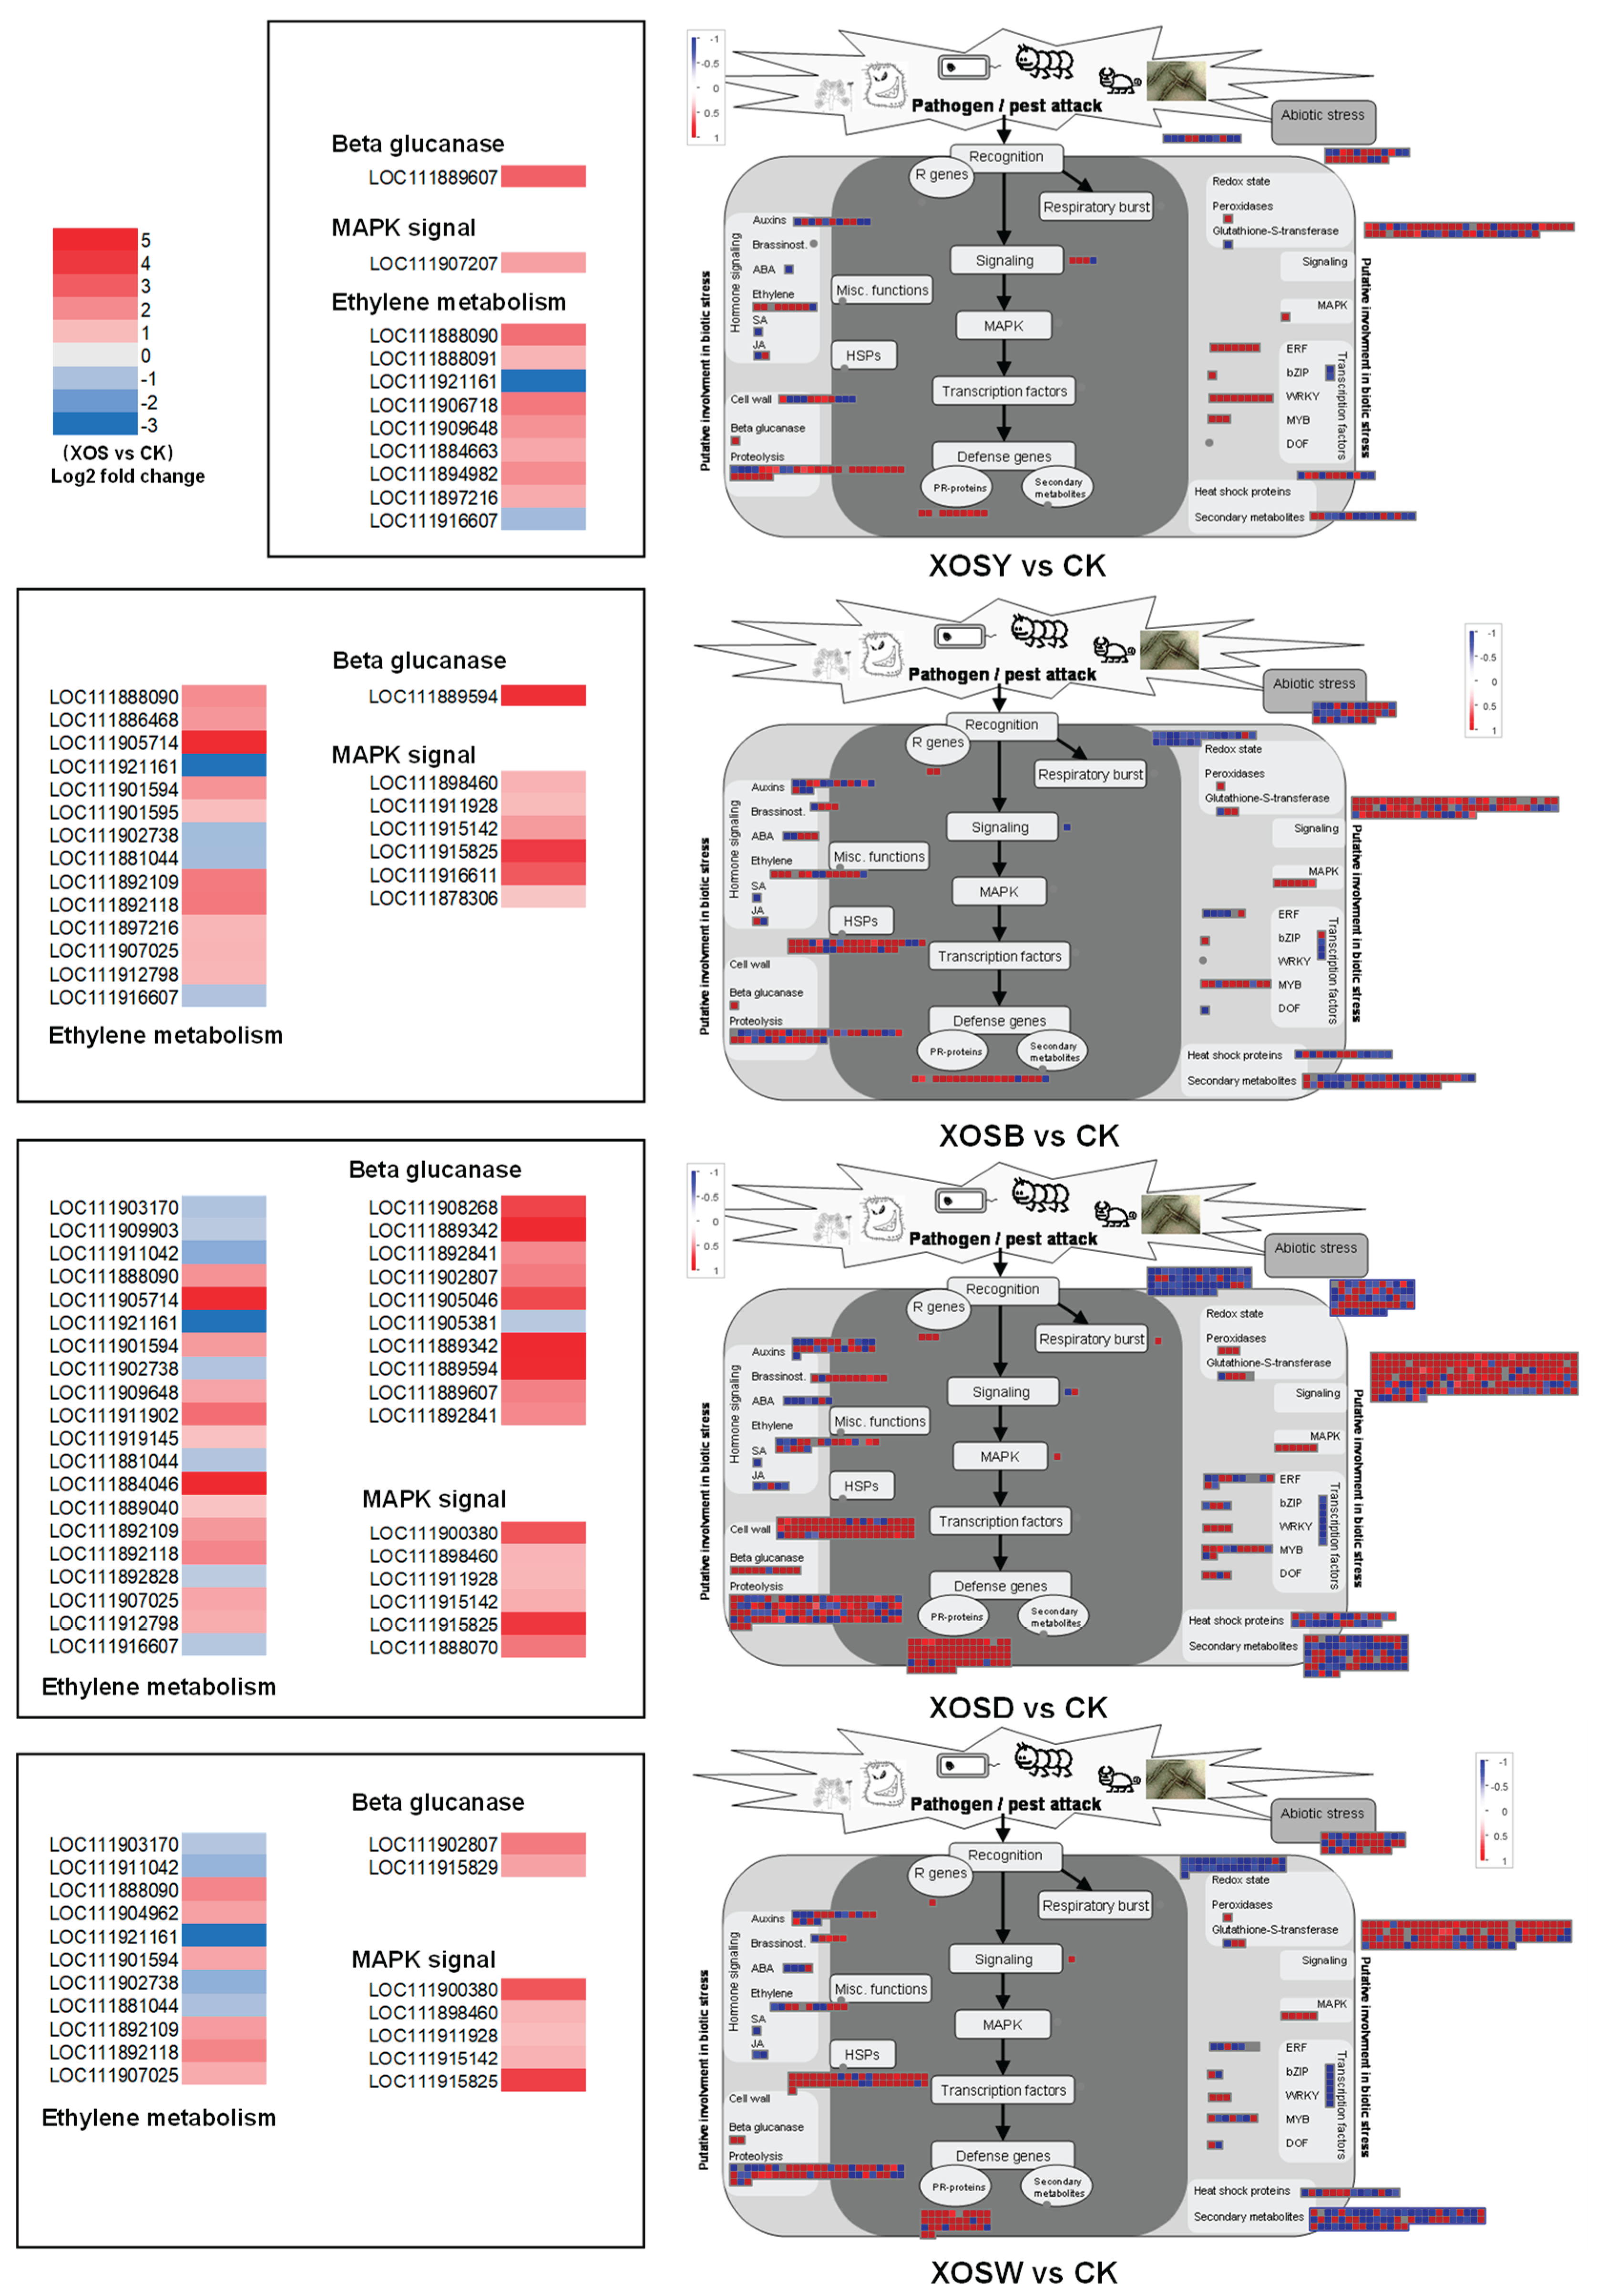
Figure 6.
Key genes involved in the auxin signal transduction pathway (A), nitrate transporter proteins (B), and plant growth-immune balance regulation (C) in lettuce treated with xylooligosaccharides (DP 2–5). The data represent means ± SD (n=3). P values were derived by two-tailed Student’s t-test.
Disclaimer/Publisher’s Note: The statements, opinions and data contained in all publications are solely those of the individual author(s) and contributor(s) and not of MDPI and/or the editor(s). MDPI and/or the editor(s) disclaim responsibility for any injury to people or property resulting from any ideas, methods, instructions or products referred to in the content. |
© 2025 by the authors. Licensee MDPI, Basel, Switzerland. This article is an open access article distributed under the terms and conditions of the Creative Commons Attribution (CC BY) license (http://creativecommons.org/licenses/by/4.0/).
Copyright: This open access article is published under a Creative Commons CC BY 4.0 license, which permit the free download, distribution, and reuse, provided that the author and preprint are cited in any reuse.


