
Submitted:
11 July 2025
Posted:
11 July 2025
You are already at the latest version
Abstract
This study investigates the joint mechanical power (JMP) distribution in the half squat (HS) exercise through the Power-Based Training (PBT) framework, aiming to validate its methodological usability and its suitability to characterize joint contributions across movement phases and load levels. Five professional weightlifters performed HS under five progressive loads (20–80% 1RM), while kinematics and kinetics were recorded with a Vicon motion capture system and force platforms. JMP at the hip, knee, and ankle was analyzed in four distinct movement phases. Results revealed that joint contributions varied significantly with both load and phase: under light loads, the knee contributed most to power production, whereas higher loads elicited a proximal shift, with the hip showing greater power absorption and production, and the ankle gaining relative contribution in the final lifting phase. The main eccentric (lowering deceleration) and concentric (lifting acceleration) phases concentrated the highest JMP values, though differences between phases diminished at higher loads, indicating a more homogeneous effort distribution. These findings highlight the adaptive inter-joint dynamics and support the PBT framework as a rigorous, replicable tool for biomechanical analysis. The results have direct implications for designing training, rehabilitation, and injury-prevention programs based on joint-specific mechanical demands.
Keywords:
power-based training
; concentric
; eccentric
; lifting
; fitness
1. Introduction
1.1. Contextualization of Strength Training and Joint Biomechanics
Muscular strength is an essential component not only for athletic performance but also for general health and injury prevention [1]. Greater strength is closely associated with improvements in sport-specific skills such as jumping, running, agility, and changes of direction, as well as with better performance in both team and individual sports disciplines [2,3]. In particular, strength development in the trunk and lower limbs plays a decisive role in stability, balance, and tolerance to high loads during sports practice across different populations [4,5]. Furthermore, strength training has proven to be highly effective in preventing both acute and overuse injuries, establishing a direct, dose-dependent relationship: increases in training load or volume are associated with a lower incidence of injuries [6,7]. This effect is reinforced when training programs are aimed at correcting muscular imbalances, specifically in the trunk and lower limbs [8,9].
The squat is widely recognized as one of the most effective and safest exercises for developing strength and muscular power in the lower body, playing a central role in the physical preparation of athletes who require high levels of neuromuscular performance [10]. Its systematic practice has been shown to significantly improve maximal strength, muscular power, and jumping ability, with efficacy comparable to other exercises such as the deadlift [11,12]. Additionally, squat training contributes to the prevention of lower limb injuries by globally strengthening the involved musculature, provided it is performed under proper technical supervision.
1.2. Relevance of JMP
Increasing the capacity to generate muscular power is frequently a central goal in both rehabilitation and sports physical preparation programs, and it is common for these programs to include weight training as a method of strength training [13]. In that sense, various studies have pointed out that, in order to optimize gains in muscular power production, exercises must be performed with a load that allows reaching maximum power output [14], por lo que resulta esencial identificar qué nivel de carga ofrece esta producción óptima. Although this aspect has been addressed on numerous occasions by the scientific literature, the findings do not precisely identify an optimal load for the development of maximum power, placing this milestone at loads ranging between 0% and 60% of the one-repetition maximum (1RM), depending on the type of exercise analysed [14,15]. In the specific context of the squat, the evidence supports the use of moderate loads (between 30% and 70% of 1RM) as optimal to maximize power production, while strength training combined with ballistic exercises, such as jump squats, allows an optimization of the power-load curve, reaching power peaks with light loads [16,17,18].
In this way, the analysis of the mean joint mechanical power (JMP) achieved during the different phases of the squat allows for a better understanding of the production and absorption of mechanical energy in the joints involved in the movement. Although JMP is very useful for evaluating the mechanical demand of the joints at each moment, this variable does not quantify the total amount of mechanical energy produced or absorbed throughout the movement.
1.3. Relevance of Joint Contribution
The literature emphasizes the importance of understanding and evaluating the mechanical demand of each muscle or muscle group during the execution of strength exercises, with the aim of improving training effectiveness and reducing the risk of injury [19,20]. Recent studies [21] have shown that the progressive increase of load during the squat produces increases in net joint moments in all the joints involved, while the relative proportions between agonist and antagonist muscles remain constant; this reflects a coordinated neuromuscular organization that can be strategically used in training programming. On the other hand, some studies observe a greater involvement of the hip as the load increases, an aspect that should be considered in strength development under high-demand conditions [13,22]. Likewise, in subjects with functional alterations, such as posterior cruciate ligament injuries, a redistribution of effort from the knee to the hip and ankle during the squat has been documented, which highlights the relevance of evaluating this distribution to prevent compensatory overloads in healthy joints [23]. In this sense, the analysis of joint contribution is especially relevant in injury prevention contexts, since the presence of imbalances in the production of net muscular moment between joints may indicate compensatory patterns and biomechanical risks that must be corrected through specific interventions [21].
1.4. Limitations of Previous Literature
Despite progress in the understanding of strength training, most research has focused mainly on the analysis of bar velocity or the kinematics of the bar’s centre of mass as indirect indicators of mechanical performance, which may lead to inaccurate estimations of the actual effort applied to the subject-bar system [24]. However, few studies have analyzed in detail the joint contribution broken down according to load level, such as Farris [13] and Armstrong [22]; and even fewer have segmented the movement into more than two phases [25,26]. In that sense, no previous work has been found that has simultaneously performed an analysis of joint contribution during the squat exercise while segmenting the movement into more than two phases. Likewise, a notable gap persists in the literature regarding biomechanical analysis of the squat that integrates both mechanical and dynamic criteria of the centre of mass of the system and of the joints, which hinders a comprehensive understanding of the movement.
1.5. Introduction of the Power-Based Training (PBT) Approach
For this purpose, the present article proposes the study of joint behaviour and contribution in the half squat (HS) exercise through biomechanical analysis under the framework of Power-Based Training (PBT) [27]. As defined in previous works [27], “the Power-Based Training (PBT) framework is a methodological approach that allows the assessment and training of muscular strength qualities [28], based on the analysis of mechanical power [29] and the use of structural systemic analysis [30]”.
The PBT approach will allow the quantification of JMP generated at the three main joints of the lower body (hip, knee, and ankle) in each of the four phases of the half squat movement. The phases are differentiated based on the centre of mass of the subject-bar system, identifying the changes in the sign of mechanical power. This methodology is especially applicable to exercises with countermovement, which integrate a stretch-shortening cycle consisting of an immediate transition between the eccentric and concentric phases [31].
1.6. Objective of the Study
In this context, the present study aims to: (1) validate the Power-Based Training approach as a highly precise methodology for analysing joint contribution of joint mechanical power during the execution of the half squat; and (2) examine the contribution of the main joints involved —ankle, knee, and hip— in relation to the different phases of the movement and the different levels of applied load.
1.7. Expected Contribution
In this sense, the study aims to provide a detailed and phase-specific characterization of the mechanical demand per joint during the half squat, which enables a better understanding of the inter-joint behavior of this exercise under controlled effort conditions. These results have direct application in the design of training, rehabilitation, and injury prevention programs, by integrating the logic of power production as a guiding principle. Likewise, it aims to consolidate the Power-Based Training (PBT) approach as a rigorous and replicable methodological framework for future research in the field of applied joint biomechanics.
2. Materials and Methods
2.1. Experimental Design
The biomechanical assessment protocol for the HS exercise was structured into a series of sequential phases. Initially, participants’ personal information was documented, and informed consent was obtained in accordance with ethical standards. Anthropometric data were then recorded, and the training loads for each set were determined based on the individual 1RM values previously established for the full squat.
Participants subsequently completed a general warm-up comprising low-intensity aerobic activity and joint mobility exercises, designed to adequately prepare the musculoskeletal system for the upcoming task. Following this, anatomical markers were positioned on the participants’ bodies in line with the anthropometric model outlined in the instruments section, to enable photogrammetric motion capture.
A static trial without external load was then conducted to serve as a biomechanical baseline, facilitating the automated tracking of markers during the dynamic movement analysis. This was followed by a specific warm-up, during which participants performed gradual repetitions of the HS exercise using submaximal loads of less than 20% of their 1RM.
The final phase involved the application of the experimental protocol, which required execution of the HS exercise under a progressive load scheme. An incremental load protocol was used, based on the known value of each subject’s 1RM (one-repetition maximum), that is, the last load lifted before failure occurs [19]. The exercise began with a load equivalent to 20% of the 1RM and ended at 80%, with progressive increments of 15% (20%, 35%, 50%, 65%, and 80% of the 1RM). For each load condition, participants performed five repetitions, with inter-set rest intervals ranging from 2 to 3 minutes, as recommended in the literature to ensure adequate recovery and minimize performance variability [20,21,22].
The selection of 15% increments is based on the need to cover a wide range of light, moderate, and submaximal intensities, while at the same time avoiding excessive fatigue in the participants. Previous studies have successfully used increments between 10% and 20% of the 1RM in exercises such as the squat to evaluate load–velocity profiles and kinematic parameters [23,24,25]. In that sense, the choice of these intervals is justified because they allow for the detection of relevant mechanical variations in the execution of the exercise without compromising technique due to the onset of muscular fatigue.
2.2. Subjects
To ensure technical consistency and biomechanical reliability in the performance of the HS exercise, a purposive sample was selected comprising five professional athletes from the Mexican national weightlifting team, who had extensive experience in the technical execution of the HS. These participants belong to the 96 kg and 102 kg bodyweight categories and belonged to the U17, U20, and U23 age divisions.
Eligibility for inclusion required athletes to meet the following criteria: (1) active membership in the national weightlifting team within the U17, U20, or U23 categories; (2) a full squat one-repetition maximum (1RM) to body weight ratio exceeding 1.5; (3) regular squat training of at least three sessions per week; (4) absence of any lower limb or trunk injuries within the preceding 12 months; and (5) no medical contraindications for high-intensity physical exertion.
Participants exhibited an average body weight of 96.09 ± 4.34 kg, an average height of 172.88 ± 6.43 cm, a mean full squat 1RM of 220.20 ± 28.73 kg, and an average 1RM-to-body weight ratio of 2.29 ± 0.23.
The research protocol received ethical clearance from the Department of Teaching and Research Support at the Mexicali Campus of the Autonomous University of Baja California (code 149/3496), adhering to the principles outlined in the Declaration of Helsinki. Prior to participation, all athletes were fully briefed on the study’s procedures and provided written informed consent.
2.3. Instrumental
For data acquisition in this study, the Vicon biomechanical analysis system [26] in conjunction with Nexus software version 2.16 [27] was employed. This system is a widely recognized standard for three-dimensional motion capture and has been thoroughly validated across both clinical and biomechanical research domains. It combines high-speed optical tracking with advanced reconstruction algorithms, enabling the precise and detailed analysis of kinematic and kinetic variables with high spatial and temporal accuracy.
The Vicon system functions through an array of high-speed infrared cameras that track reflective markers placed on specific anatomical landmarks of the participant’s body. These cameras capture positional data, which are then used to reconstruct the subject’s movements in three dimensions by mapping the spatial trajectories of the markers. This approach allows for highly accurate analysis of motor patterns during exercise execution.
In this study, the Plug-in Gait (PiG) Full Body model [28] was employed to obtain joint kinematic data from the hip, knee, and ankle. Based on this information, Inverse Dynamics Analysis (IDA) [29] was applied to compute joint mechanical power (JMP) throughout the four phases of the half-squat exercise. JMP values were normalized relative to each subject’s body mass (N·m/kg) was then derived by integrating the JMP curve.
In addition, ground reaction forces were recorded using two AMTI model OR6-6 force platforms [30], designed specifically for biomechanical applications requiring high frequency response and low structural weight. These platforms allow simultaneous measurement of the three orthogonal components of force (Fx, Fy, Fz) and moments around the three axes (Mx, My, Mz), for a total of six outputs, with low inter-channel interference (crosstalk < 2 %) and high linearity and repeatability (nonlinearity error and hysteresis < ± 0.2 % of full range).
2.4. Procedure
2.4.1. Protocol
The biomechanical assessment protocol for the HS exercise was organized into a sequence of structured phases. Initially, participants’ personal information was collected, and informed consent was obtained in alignment with established ethical standards. Subsequently, anthropometric measurements were taken, and the load for each trial series was determined based on the individual 1RM values previously recorded for the full squat exercise.
Participants then completed a general warm-up routine that included low-intensity aerobic activity and joint mobility exercises, aimed at physiologically preparing them for the specific task. Following this, anatomical markers were affixed according to the anthropometric model described in the instruments section, to enable photogrammetric motion capture.
After completing the preparatory procedures, a static trial without external loading was conducted to serve as a biomechanical reference point. This facilitated accurate automated tracking of marker trajectories during the subsequent dynamic recordings. A specific warm-up phase followed, consisting of progressive repetitions of the HS exercise performed at submaximal intensities, specifically below 20% of the participant’s 1RM.
Participants then performed the HS exercise using a progressive loading scheme set at 20%, 35%, 50%, 65%, and 80% of their 1RM. For each load condition, five repetitions were completed, with rest intervals of 2 to 3 minutes between sets, following established methodological guidelines to ensure full recovery and minimize fatigue-related performance variability [20,21,22].
2.4.2. Signal Processing
Prior to the calculation of joint kinematics and subsequent biomechanical variables, the raw positional data from the reflective markers underwent a preprocessing step. A fourth-order digital Butterworth low-pass filter with a cut-off frequency of 6.5 Hz was applied to the marker trajectories to reduce high-frequency noise and enhance signal quality [29,31,32].
On the other hand, the ground reaction force signals recorded by the force platforms were conditioned and amplified using an AMTI OPTIMA-SC signal conditioner [33], specifically designed to operate with Optima/OR6-6 platforms. To suppress high-frequency components and avoid aliasing, the device incorporates internal anti-aliasing and reconstruction filters (second- and third-order Butterworth filters, respectively) with a cutoff frequency of 1000 Hz. The signals were sampled at a frequency of 1000 Hz per channel.
Synchronization of the force and motion capture data was performed using the external trigger of the OPTIMA-SC and the genlock function of the Vicon system, ensuring temporal alignment between the kinematic and kinetic signals.
2.4.3. Determination of the Phases
This study is grounded in the theoretical premise that a biomechanical analysis of the squat, based on center of mass (CoM) mechanical power, enables the accurate division of the movement into four distinct phases, thereby offering a comprehensive understanding of its dynamic demands [34]. According to this framework, Mechanical power - defined as the product of the bar acceleration, total mass and movement velocity - serves as the principal variable for distinguishing between concentric phases, characterized by positive mechanical power, and eccentric phases, marked by negative mechanical power.
Following the PBT framework, the combined CoM of the subject-bar system was calculated. First, the bar (including the weight plates) was assumed to be a body segment, given its fixed position on the user’s back and its firm and nearly symmetrical grip with the hands. Based on this premise, the vertical coordinate of the CoM of the bar (including the plates) was estimated by calculating the average vertical position of the CoM of both hands. Second, the geometric center between the subject’s CoM and the bar’s CoM was determined, taking into account both the vertical coordinates and the relative mass of each. This procedure follows the approach described by authors such as Robertson, who states that “The total body’s center of gravity is computed in a similar fashion. It is the weighted average of all the segments of the body” [35].
2.4.4. Parameter Calculation
An inverse dynamic analysis [29] was performed using the Vicon system [27], and subsequently, joint mechanical power was calculated using a custom-developed algorithm coded in Python.
Thus, joint mechanical power is calculated as follows:
Where JMP is joint mechanical power, in watts (W); is the net joint moment, in newton-meters (N·m); and is the relative angular velocity between the two segments connected by the joint, in radians per second (rad/s).
For the calculation of the net and relative (percentage) contribution of each lower-limb joint to the total, the contributions of each joint pair (left and right) were summed.
2.5. Statistical Analysis
The means of JMP were calculated from the individual measurements recorded for each participant across all repetitions, movement phases, and load conditions. To minimize potential bias from transient fluctuations typically observed at the beginning and end of the exercise, the first and fifth repetitions of each set were excluded from analysis. Only the three middle repetitions were considered, as this methodological choice aimed to reduce variability associated with the commonly observed deviations in execution during initial and final repetitions.
Pairwise comparisons between joints were performed using the Wilcoxon signed-rank test to identify the specific phases and sets in which their contributions differed significantly. For each phase and set, the test was conducted by comparing the following joint pairs: hip–knee, hip–ankle, and knee–ankle. This analytical approach enabled a reliable assessment of the joints’ contributions to the JMP across movement phases and load conditions, while accounting for the non-parametric nature of the data and the limited sample size.
3. Results
Joint Mechanical Power (JMP)
Figure 1 shows the progression of JMP in the hip, knee, and ankle across the five load levels analysed in the present study. As observed, the peak JMP values are higher at light loads (S1–S2), consistent with the behaviour of the centre of mass of the subject-bar system [27] and with findings reported by other authors in previous studies [13]. However, it is worth noting that mean JMP does not exhibit the same behavior, as it is influenced by an increase in phase duration at high loads. For this reason, at high loads, the mean JMP values are higher than the peak values.
Table 1 presents the mean values of joint mechanical power (W/kg) during each phase of the execution of the half squat exercise, distinguishing the contributions of the hip (H), knee (K), and ankle (A), both in magnitude and in relative proportion to the total.
Considering the results as a whole, during Phase 1 (lowering acceleration), negative mean JMP values are observed in all joints, as well as in the total, reflecting eccentric effort, although the magnitude of these values is between two and four times lower than in Phase 2 (lowering deceleration). As the load increases, the magnitude of these negative values progressively increases, with this trend being particularly notable in the hip. In Set 4 (65% 1RM), the hip shows the most negative value (–1.66 W/kg), with statistically significant differences (p = 0.043) compared to the ankle (superscript “c”). Significant differences are also observed between the hip and the ankle in Set 5 (80% 1RM), with a value of –1.63 W/kg for the hip and –0.84 W/kg for the ankle (p = 0.043).
The knee, in turn, shows more pronounced negative mean JMP values than the hip in S1 and S2, contributing 44%–43% compared to 30.2%–32.7% of the total joint mechanical power, respectively. In contrast, from S3 to S5, this proportion is reversed, with the hip contributing approximately 44% of the total, compared to 35%–32% from the knee. Meanwhile, the ankle is the joint that shows the lowest magnitudes and contributions, accounting for approximately 20% to 25% of the total.
During Phase 2 (lowering deceleration), also characterized by negative power values, markedly higher values are observed due to the increase in eccentric JMP demands required to produce the braking. The hip and knee show the highest contributions (45%–50% and 40%–45%, respectively). In Set 3 (50% of 1RM), significant differences (p < 0.05) are detected between these two joints and the ankle. In Set 4 (65% of 1RM), significant differences (p < 0.05) are also found between the hip and the ankle; notably, this is the condition in which the greatest magnitude in the hip is observed (–3.55 W/kg). In this phase, a clear increase in eccentric demand on the proximal joints (hip and knee) is observed as the load increases.
Phase 3 (lifting acceleration) is characterized by positive values in all joints, indicating the development of concentric joint mechanical power. Among all joints, the hip exhibits the highest values, especially at higher loads. In Set 1 (20%RM), a value of 2.98 W/kg is observed for the hip, with a significant difference (p = 0.043) compared to the ankle, and a value of 3.14 W/kg for the knee, also with a significant difference (p < 0.05) compared to the ankle. In Set 4, significant differences (p < 0.05) are found between all joints, with values of 3.43 W/kg for the hip, 2.70 W/kg for the knee, and 0.97 W/kg for the ankle. In Set 5, significant differences (p < 0.05) are also detected between the hip and the other two joints, with values of 3.10 W/kg for the hip, 1.95 W/kg for the knee, and 0.93 W/kg for the ankle.
Phase 4 (lifting deceleration), characterized by positive JMP values of considerably lower magnitude compared to the main concentric phase (Phase 3), shows its highest values in the hip and knee. In Set 1 (20% of 1RM), the knee stands out above the hip with 1.05 W/kg versus 0.95 W/kg, showing significant differences (p = 0.043) compared to the ankle (0.47 W/kg). In Set 3 (50% of 1RM), a JMP of 1.74 W/kg is observed in the hip, already exceeding that of the knee (0.95 W/kg), with significant differences (p = 0.043) compared to the ankle (0.96 W/kg); a condition that is repeated in Set 4 (65% of 1RM), where the hip reaches 1.38 W/kg, exceeding the 0.95 W/kg of the knee, with significant differences (p < 0.05) compared to the ankle (1.2 W/kg). The proportional contribution reflects the predominance of the hip (38.6%) and the knee (42.5%) in the lowest load condition, while at higher loads the contribution of the knee decreases considerably, whereas the ankle’s contribution increases, rising from 18.9% in S1 to 32% in S5.
Figure 2 represents the total mean JMP (stacked) and the contribution (colors) of each joint for each phase and load condition. This representation makes it possible to observe that total mean JMP increases with load, reaching its highest values in S4 (65% of 1RM). Additionally, it can be seen that during P1, P2, and P3, the contribution of the ankle is reduced, whereas in P4, under the highest load condition (S5), its contribution surpasses that of the knee, while remaining lower than that of the hip.
It is worth noting that the highest magnitude values for the hip and ankle in the main phases (P2 and P3) both correspond to Set 4. Regarding the knee, although the highest magnitude values in P2 also correspond to Set 4, those in P3 occur in Set 1.
4. Discussion
The results of the present study show that JMP is distributed differently across joints, phases, and load levels during the half squat movement. Furthermore, previous studies [36] have documented that, in subjects with functional impairments such as posterior cruciate ligament injuries, there is a redistribution of effort from the knee to the hip and ankle during the squat, highlighting the relevance of assessing joint behaviour and its partial contribution, both in pathological populations and in healthy athletes. Given the significant lack of field literature, a thorough comprehensive interpretation has been developed to understand subjacent mechanisms of JMP during half squat exercise.
A detailed analysis of each phase shows that, during the lowering acceleration phase (F1), JMP is negative and presents a moderate magnitude. With light loads (S1–S2), the knee absorbs the highest percentage of negative JMP (approximately 43–44%), while the hip contributes around 30–33%. From S3 onward, this relationship is reversed, with the hip accounting for up to 44% and the knee decreasing to 32–35%. The ankle maintains a lower contribution (approximately 20–26%) across all sets, showing the smallest magnitudes of the three joints, with values ranging from –0.46 W/kg to –0.84 W/kg (the latter being its highest negative value throughout the cycle). For this reason, statistically significant differences (p < 0.05) are found between the contribution of the ankle and the hip under high loads (S4 and S5). The fact that the hip’s contribution percentage increases progressively up to S4 while the ankle’s remains unchanged indicates a real increase in the coxal joint JMP, not merely a relative redistribution (the magnitude increases from –0.53 to –1.66 W/kg from S1 to S4).
Despite the fact that, in this phase, the vertical mechanical power of the subject-bar system is positive [34], JMP is negative. Although these are values close to zero, they indicate a partial action of the hip, knee, and ankle extensors to control the course of acceleration, preventing the acceleration from becoming too high and resulting in an excessively pronounced eccentric muscular action during P2, which would unbalance the relationship between force in P2 and P3, shifting away the proportion of forces (and, in consecuence, mechanical impulses) from the optimum, according to initial force principle [37], that allows for an optimal acceleration course during the ascent of the CoM that maximizes JMP development and/or maximum velocity of the movement.
In the lowering deceleration phase (P2), the highest negative power values are concentrated. Total JMP increases up to 3.2 times compared to P1, and in the case of the hip in S1, it is 5 times higher; although this proportion decreases to 1.9 times in S5. The hip and knee together account for up to 85–90% of the total output. Both joints progressively increase their JMP up to S4, where they reach their highest negative JMP values, with –3.55 W/kg in the hip and –2.89 W/kg in the knee. It is worth highlighting the leading role of the hip in eccentric absorption under high loads (S4–S5). For its part, the ankle maintains a contribution below 12%, with significant differences (p = 0.043) found between the hip and the ankle in S4 and S5.
The lifting acceleration phase (P3) displays the highest positive values of the entire cycle, showing the greatest positive value for the hip (3.43 W/kg in S4) and for the knee (3.14 W/kg in S1) , fully consistent with what was described by Farris et al. [13]. In this way, under light and moderate loads (S1–S3), the knee leads power production, but its contribution decreases as load increases, from 46% to 33%. The opposite occurs with the hip, which progressively increases its contribution up to S4, raising both its share (from 44% to 52%) and its absolute magnitude (+0.45 W/kg). This aspect is reflected in the presence of statistically significant differences (p < 0.05) between the hip and the knee under high loads (S4 and S5). This proximal transition, which occurs in both P3 and P2, confirms the greater mechanical efficiency of the hip in power production and absorption under moderate to high loads, as indicated by Farris et al. [13] and Cormie et al. [38]. For its part, the ankle maintains a lower contribution, below 16%, which remains close in magnitude compared to other phases, but its contribution is relatively higher due to the decrease in knee JMP. Nevertheless, under light loads (S1), the ankle shows significantly lower values (p < 0.05) than those of the knee and hip.
Finally, in the lifting deceleration phase (P4), JMP is positive but of lower magnitude than in P3 (between 1.28 and 2.77 times lower). The hip continues to lead the contribution, increasing its power output up to S5, unlike in the other phases, where it reaches its peak value in S4. The hip shows significant differences (p = 0.043) compared to the ankle in S3 and S4. However, the ankle experiences a notable increase both in magnitude (ranging from 0.47 to 1.49 W/kg) and in percentage (rising from 18.9% to 32%), reaching its highest positive value in S5 and even surpassing the knee’s JMP. This pattern suggests a shift of the final action toward the ankle extensors, reducing the contribution of the knee. It is worth mentioning that, although Farris et al. [13] also report a progressive increase in mean ankle JMP with increasing load, their results differ from those found in the present study. In their study, they state that mean ankle JMP decreases between 60% and 80% of 1RM. This discrepancy is most likely due to the absence of subdivision of the lifting into two phases by those authors, which PBT framework methodology makes possible, enabling a more detailed analysis of the movement.
Analogous to what is observed in the initial phase of the movement, despite the fact that in this phase the vertical mechanical power of the subject-bar system is negative [34], JMP is positive. This relationship is due to the fact that the action of the extensors, although reduced, persists and remains until the end or near the end of the extension. It is worth noting that, as load increases, not only does the duration of P4 increase, but the lower-limb contribution in JMP also increases. However, the negative mechanical power of the CoM occurs because, despite having a positive vertical velocity, its acceleration is negative, due to the fact that the force produced by the lower limbs during P4 is lower than the weight-force of the subject-bar system. Thus, although the concentric action of the lower limbs continues during P4 and increases with load, it is always lower than the JMP required to accelerate the subject-bar system, thereby producing a negative acceleration and, consequently, negative mechanical power.
The main phases of the movement, P2 and P3, play a central role in eccentric and concentric contractions, respectively, as they are the phases in which the highest levels of net JMP are reached, specially under lower loads (S1–S3). However, under high loads (S4–S5), the disparity in JMP production between the main phases of the movement and the initial (P1) and final (P4) phases decrease. Comparing the magnitudes of total JMP contribution between phases P1-P2 and P3-P4, it is observed that the mean JMP in P2 is 2.8 times higher than in P1, at the lowest load condition (S1), and the difference is reduced to a ratio of 1.3 times, at the highest load (S5). Similarly, the mean JMP in P3 is 3.3 times higher than in P4 at the lightest load (S1) and this ratio is reduced to 1.7 times at the highest load (S5). Specifically, disproportions of up to 5.13 times can be observed, as is the case of the ratio of average JMP produced by the hip in P2 with respect to P1 in S1 (20% 1RM). On the contrary, it can also be observed how the proportion of average JMP produced in P1 and P4 by the ankle are quite close to those produced in P2 and P3, respectively, even exceeding them in medium and higher load conditions. This trend indicates that, at higher loads, even though in the final phase of the movement there is braking of the CoM, there is a less disproportionate action of the extensors compared to that performed in P3. However, this action of the extensors is not sufficient to positively accelerate the CoM of the system, causing the mechanical power of the system to be negative.
The evolution of joint contribution as the load level increases can be explained by the fact that the increase in load in the squat is associated with greater trunk inclination, resulting from increased hip flexion. This is the consequence of an adaptation of the motor pattern aimed at maintaining stability. Given that an increase in the load on the bar with the plates shifts the CoM of the subject-bar system backward, the user is forced to generate greater forward inclination in order to bring the CoM forward and avoid losing postural stability. This displacement of the CoM and the increase in anterior loading have as a direct consequence the increase in the distance between the CoM and the hip, which increases the moment of force that the hip must produce in order to extend. The opposite effect occurs at the knee, as the CoM moves closer to the knee joint on the posterior effector, which reduces the moment of force that the knee extensor must produce to move that load. The anteroposterior distance between the ankle joint and the CoM also increases, which in turn causes an anterior displacement of the center of pressure in order to control posture, resulting in a greater demand for net extensor moment from the ankle joint. This explains the trend in the reduction of knee JMP as hip and ankle JMP increase with the rising load level in the exercise.
5. Conclusions
The present study validates the applicability of the Power-Based Training (PBT) methodological framework for the detailed analysis of joint mechanical power (JMP) contribution during the execution of the half squat exercise. The results reveal a differential distribution of JMP among the hip, knee, and ankle joints, modulated by both the movement phases and the applied load conditions. In particular, a consistent proximal transition pattern was observed as the load increased, characterized by a greater involvement of the hip in the absorption and production of JMP under high-demand conditions, with a relative decrease in the contribution of the knee. This finding confirms the greater mechanical contribution of the hip under moderate and high loads, whereas the knee maintain a more relevant role under light loads and the ankle acquires more prominence under high load conditions, especially in the final phase of movement.
Moreover, the segmentation of the movement into four phases enabled the identification of the main phases (P2 and P3) as concentrating the greatest JMP production, eccentric and concentric, respectively. However, as the load increases, the differences between the main phases and the initial and final phases tend to diminish, indicating a more homogeneous distribution of effort across phases and joints. This adaptive behavior reflects a biomechanical adjustment of the motor pattern aimed at maintaining postural stability and optimizing power output.
Finally, the findings underscore the value of phase-specific joint analysis for the design of training, rehabilitation, and injury prevention programs, as it allows for the detection of compensatory patterns and informs the selection of loads and exercises based on joint mechanics. The proposed methodology consolidates PBT as a rigorous and replicable framework for future research in applied biomechanics of strength training, providing a more comprehensive understanding of the dynamic demands of the movement.
Author Contributions
Conceptualization, M.R.; methodology, M.R., K.G., and J.P.G.; formal analysis, M.R., E.M.A.M., and M.E.G.M.; investigation, M.R., E.M.A.M., and M.E.G.M.; resources E.M.A.M. and M.E.G.M.; visualization, M.R and L.E.M.; writing—original draft preparation, M.R. and L.E.M.; writing—review and editing, M.R., L.E.M. and K.G.; supervision, K.G. and J.P.G. All authors have read and agreed to the published version of the manuscript.
Funding
This research received no external funding.
Institutional Review Board Statement
Department of Teaching and Research Support of the Mexicali Campus of the Autonomous University of Baja California (code: 149/3496, date: 15 December 2022).
Informed Consent Statement
Informed consent was obtained from all subjects involved in the study.
Data Availability Statement
The data presented in this study are available on request from the corresponding author. The data are not publicly available due to ethical considerations.
Acknowledgments
The authors would like to thank all the subjects who selflessly participated in the study.
Conflicts of Interest
The authors declare that they have no conflicts of interest.
References
- Suchomel, T.J.; Nimphius, S.; Stone, M.H. The Importance of Muscular Strength in Athletic Performance. Sports Med. 2016, 46, 1419–1449. [Google Scholar] [CrossRef]
- Quiceno, C.; Alfonso Mantilla, J.I.; Samudio, M.A.; Arevalo Parra, J.C. Caracterización de fuerza de cadena muscular anterior y posterior en futbolistas colombianos, categorías U17 y U20. Viref Rev. Educ. Física 2020, 9, 38–47. [Google Scholar]
- Aliaga Reynaldo, J.R.; Núñez Aliaga, F. Distribución del volumen de trabajo de la fuerza muscular en atletas del área de velocidad del atletismo (Original). Olimp. Publ. Científica Fac. Cult. Física Univ. Granma 2016, 13, 192–201. [Google Scholar]
- Rosa-Guillamón, A.; García-Cantó, E. Relación entre fuerza muscular y otros parámetros de la condición física en escolares de primaria. SPORT TK-Rev. Euroam. Cienc. Deporte 2017, 6, 107–116. [Google Scholar] [CrossRef]
- Fernandez Ortega, J.A.; Hoyos Cuartas, L.A. Efectos de La Velocidad de Entrenamiento En Fuerza Sobre Diversas Manifestaciones de La Fuerza En Mujeres Adultas Mayores (Effect of the Velocity Resistance Training on Various Manifestations of Resistance in Older Women). Retos 2020, 325–332. [Google Scholar] [CrossRef]
- Lauersen, J.B.; Andersen, T.E.; Andersen, L.B. Strength Training as Superior, Dose-Dependent and Safe Prevention of Acute and Overuse Sports Injuries: A Systematic Review, Qualitative Analysis and Meta-Analysis. Br. J. Sports Med. 2018, 52, 1557–1563. [Google Scholar] [CrossRef]
- Hameed, I.; Farooq, N.; Haq, A.; Aimen, I.; Shanley, J. Role of Strengthening Exercises in Management and Prevention of Overuse Sports Injuries of Lower Extremity: A Systematic Review. J. Sports Med. Phys. Fitness 2024, 64, 807–815. [Google Scholar] [CrossRef]
- Sasaki, S.; Tsuda, E.; Yamamoto, Y.; Maeda, S.; Kimura, Y.; Fujita, Y.; Ishibashi, Y. Core-Muscle Training and Neuromuscular Control of the Lower Limb and Trunk. J. Athl. Train. 2019, 54, 959–969. [Google Scholar] [CrossRef]
- Szewczyk, J.; Świta, M.; Szuciak, A. The Impact of Strength Training on the Prevention of Orthopedic Injuries in Sports: A Literature Review. Qual. Sport 2024, 31, 55268–55268. [Google Scholar] [CrossRef]
- Stone, M.H.; Hornsby, W.G.; Mizuguchi, S.; Sato, K.; Gahreman, D.; Duca, M.; Carroll, K.M.; Ramsey, M.W.; Stone, M.E.; Pierce, K.C.; et al. The Use of Free Weight Squats in Sports: A Narrative Review—Terminology and Biomechanics. Appl. Sci. 2024, 14, 1977. [Google Scholar] [CrossRef]
- Bird, S.P.; Tarpenning, K.M.; Marino, F.E. Designing Resistance Training Programmes to Enhance Muscular Fitness. Sports Med. 2005, 35, 841–851. [Google Scholar] [CrossRef]
- Nigro, F.; Bartolomei, S. A Comparison Between the Squat and the Deadlift for Lower Body Strength and Power Training. J. Hum. Kinet. 2020, 73, 145–152. [Google Scholar] [CrossRef]
- Farris, D.J.; Lichtwark, G.A.; Brown, N. a. T.; Cresswell, A.G. Deconstructing the Power Resistance Relationship for Squats: A Joint-Level Analysis. Scand. J. Med. Sci. Sports 2016, 26, 774–781. [Google Scholar] [CrossRef]
- Cormie, P.; McCaulley, G.O.; Triplett, N.T.; McBride, J.M. Optimal Loading for Maximal Power Output during Lower-Body Resistance Exercises. Med. Sci. Sports Exerc. 2007, 39, 340–349. [Google Scholar] [CrossRef]
- Baker, D.; Nance, S.; Moore, M. The Load That Maximizes the Average Mechanical Power Output during Jump Squats in Power-Trained Athletes. J. Strength Cond. Res. 2001, 15, 92–97. [Google Scholar]
- Soriano, M.A.; Jiménez-Reyes, P.; Rhea, M.R.; Marín, P.J. The Optimal Load for Maximal Power Production During Lower-Body Resistance Exercises: A Meta-Analysis. Sports Med. 2015, 45, 1191–1205. [Google Scholar] [CrossRef]
- Cormie, P.; McCAULLEY, G.O.; McBRIDE, J.M. Power Versus Strength-Power Jump Squat Training: Influence on the Load-Power Relationship. Med. Sci. Sports Exerc. 2007, 39, 996. [Google Scholar] [CrossRef]
- Loturco, I.; Nakamura, F.Y.; Tricoli, V.; Kobal, R.; Abad, C.C.C.; Kitamura, K.; Ugrinowitsch, C.; Gil, S.; Pereira, L.A.; González-Badillo, J.J. Determining the Optimum Power Load in Jump Squat Using the Mean Propulsive Velocity. PLOS ONE 2015, 10, e0140102. [Google Scholar] [CrossRef] [PubMed]
- Haff, G.G.; Triplett, N.T. Essentials of Strength Training and Conditioning 4th Edition; Human Kinetics: Champaign, IL, USA, 2015; ISBN 978-1-4925-0162-6. [Google Scholar]
- Matos, F.; Ferreira, B.; Guedes, J.; Saavedra, F.; Reis, V.M.; Vilaça-Alves, J. Effect of Rest Interval Between Sets in the Muscle Function During a Sequence of Strength Training Exercises for the Upper Body. J. Strength Cond. Res. 2021, 35, 1628. [Google Scholar] [CrossRef] [PubMed]
- Santana, W. de J.; Bocalini, D.S.; João, G.A.; Caperuto, E.C.; Araujo, I.P. de; Figueira Junior, A. Recovery between Sets in Strength Training: Systematic Review and Meta-Analysis. Rev. Bras. Med. Esporte 2023, 30, e2021_0037. [Google Scholar]
- Harris, J. Establishing an Optimal Recovery Time between Repeated Maximal Stength Sets on the Squat and Bench Press.; 2008.
- Sánchez-Medina, L.; González-Badillo, J.J. Velocity Loss as an Indicator of Neuromuscular Fatigue during Resistance Training. Med. Sci. Sports Exerc. 2011, 43, 1725–1734. [Google Scholar] [CrossRef]
- Chapman, M.; Larumbe-Zabala, E.; Gosss-Sampson, M.; Colpus, M.; Triplett, N.T.; Naclerio, F. Perceptual, Mechanical, and Electromyographic Responses to Different Relative Loads in the Parallel Squat. J. Strength Cond. Res. 2019, 33, 8. [Google Scholar] [CrossRef] [PubMed]
- Hirayama, K. Acute Effects of an Ascending Intensity Squat Protocol on Vertical Jump Performance. J. Strength Cond. Res. 2014, 28, 1284. [Google Scholar] [CrossRef] [PubMed]
- Vicon Motion Systems Ltd. Vicon Motion Capture System 2024.
- Vicon Motion Systems Ltd. Vicon Nexus 2024.
- Vicon Motion Systems Ltd. Plug-in Gait Reference Guide Vicon Help 2023.
- Winter, D.A. Biomechanics and Motor Control of Human Movement; John Wiley & Sons: Hoboken, NJ, USA, 2009; ISBN 978-0-470-39818-0. [Google Scholar]
- AMTI Force Platform, Model OR6-6.
- Yu, B.; Gabriel, D.; Noble, L.; An, K.-N. Estimate of the Optimum Cutoff Frequency for the Butterworth Low-Pass Digital Filter. 1999. [CrossRef]
- Roithner, R.; Schwameder, H.; Müller, E. Determination of Optimal Filter Parameters for Filtering Kinematic Walking Data Using Butterworth Low-Pass Filter.; 2000.
- AMTI NetForce / BioAnalysis Software (Optima SC).
- Rodal, M.; Arrayales-Millán, E.M.; Gonzalez-Macías, M.E.; Pérez-Gómez, J.; Gianikellis, K. Half Squat Mechanical Analysis Based on PBT Framework. Bioengineering 2025, 12, 603. [Google Scholar] [CrossRef] [PubMed]
- Robertson, G.; Caldwell, G.; Hamill, J.; Kamen, G.; Whittlesey, S. Research Methods in Biomechanics; 2nd ed.; Human Kinetics, 2013; ISBN 978-0-7360-9340-8.
- Liu, M.-F.; Chou, P.-H.; Liaw, L.-J.; Su, F.-C. Lower-Limb Adaptation during Squatting after Isolated Posterior Cruciate Ligament Injuries. Clin. Biomech. 2010, 25, 909–913. [Google Scholar] [CrossRef]
- Hochmuth, G. Biomechanics of Athletic Movement; Sportverlag, 1984.
- Cormie, P.; McCaulley, G.O.; Triplett, N.T.; McBride, J.M. Optimal Loading for Maximal Power Output during Lower-Body Resistance Exercises. Med. Sci. Sports Exerc. 2007, 39, 340–349. [Google Scholar] [CrossRef]
Figure 1.
Evolution of joint mechanical power in the right hip, knee, and ankle during the execution of the half squat with a load level of 20% of the 1RM (blue), 35% of the 1RM (turquoise), 50% of the 1RM (green), 65% of the 1RM (orange), and 80% of the 1RM (red) by a subject presented as reference.
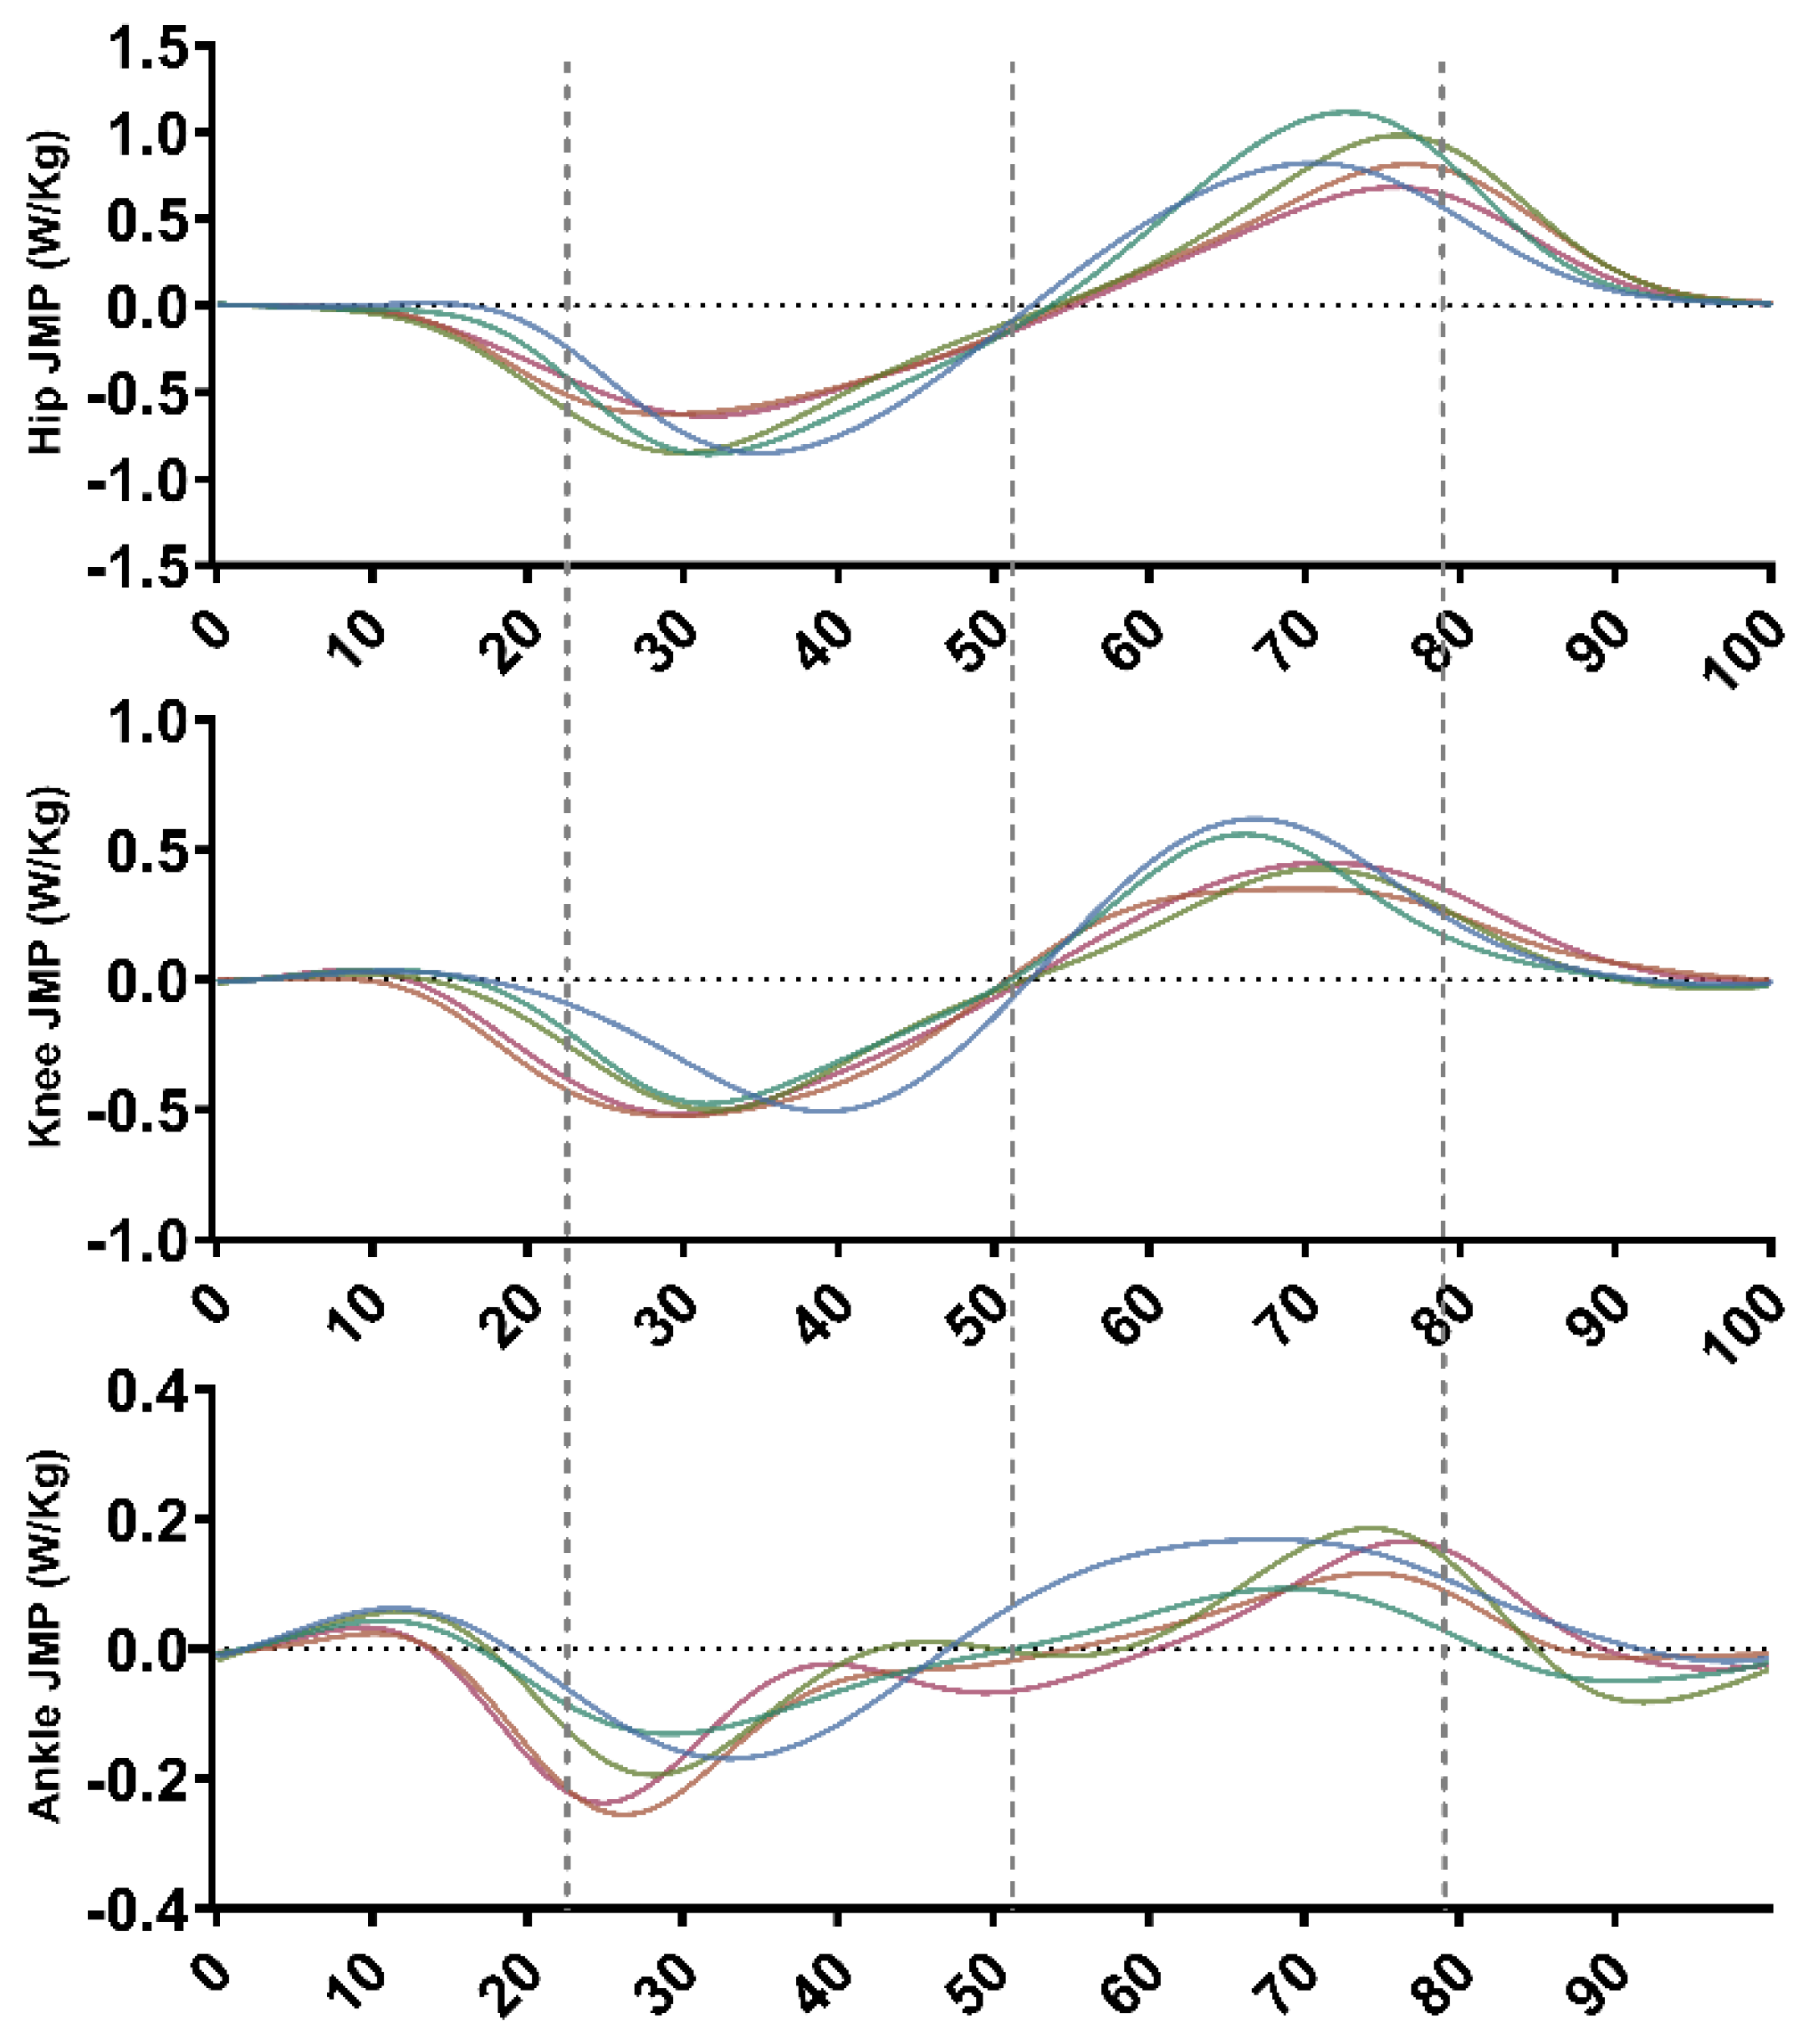
Figure 2.
Evolution of joint mechanical power in the hip (red), knee (blue), and ankle (green) joints during the four phases of the half squat movement, according to the load condition (S1–S5).
Figure 2.
Evolution of joint mechanical power in the hip (red), knee (blue), and ankle (green) joints during the four phases of the half squat movement, according to the load condition (S1–S5).
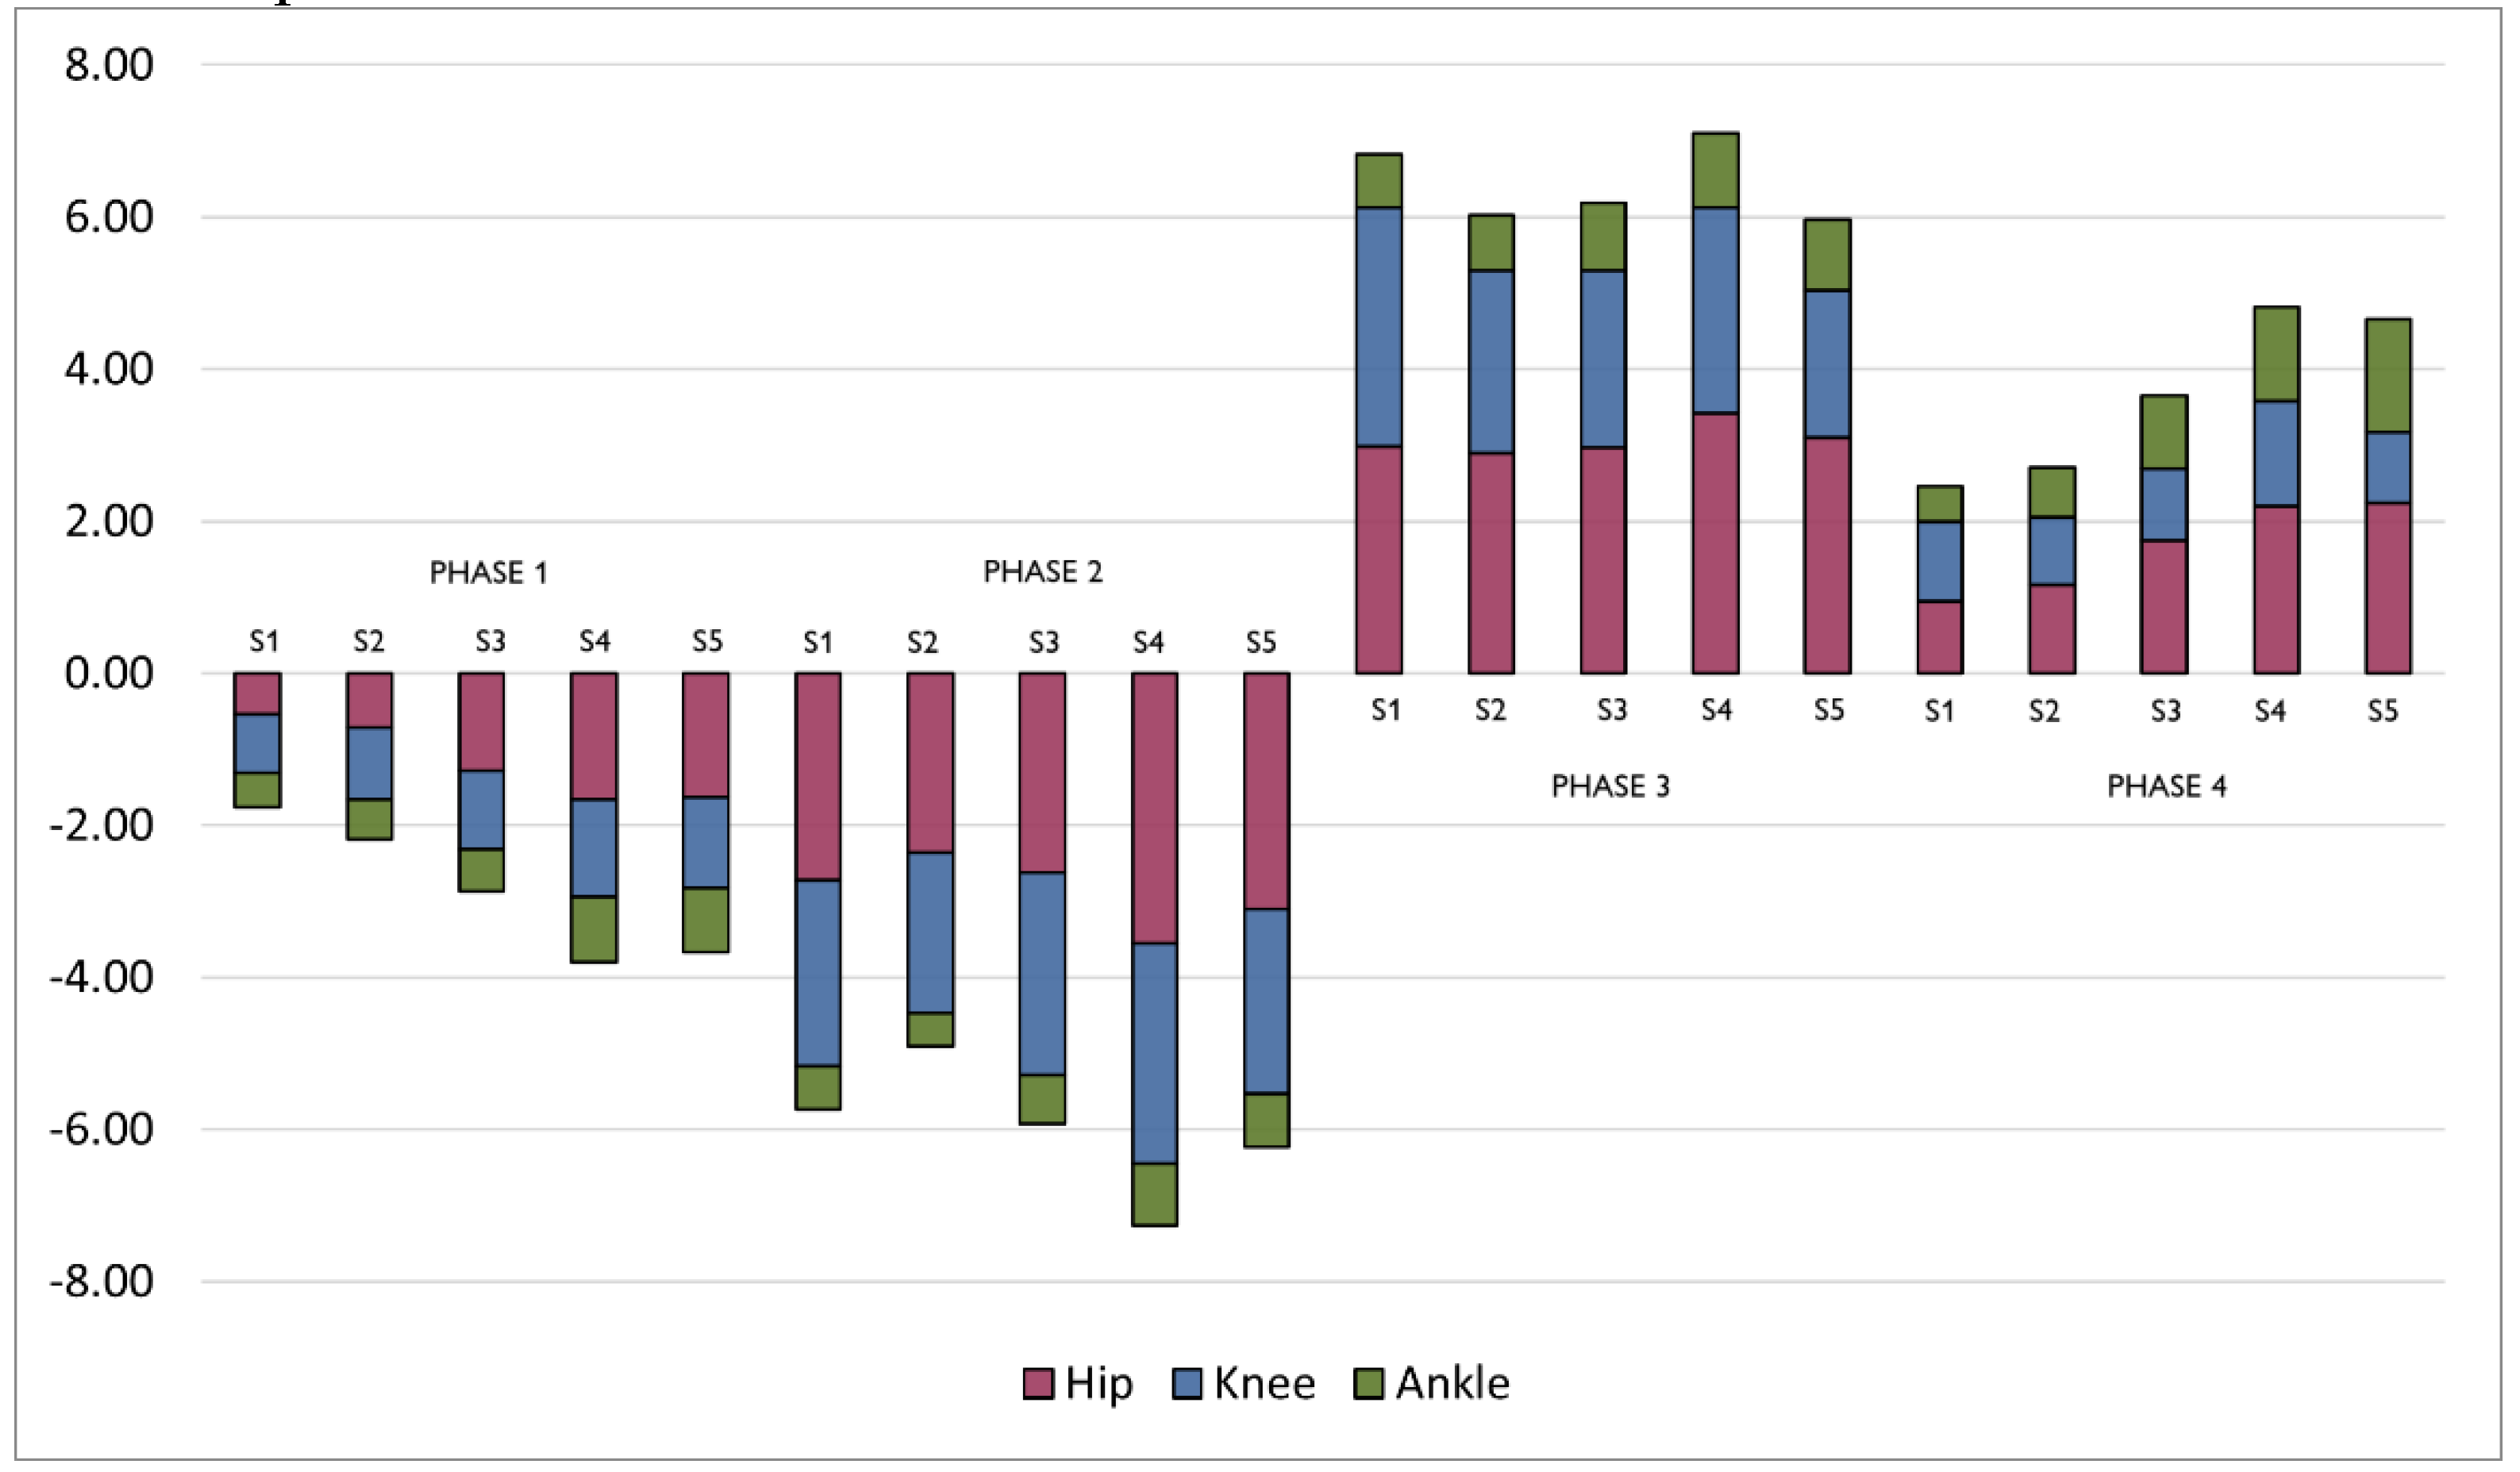

Table 1.
Mean values of joint mechanical power for the Hip (H), Knee (K), and Ankle (A) joints, as well as the Total (sum of the three). The values are presented both in their magnitude and as a percentage of their contribution to the total.
Table 1.
Mean values of joint mechanical power for the Hip (H), Knee (K), and Ankle (A) joints, as well as the Total (sum of the three). The values are presented both in their magnitude and as a percentage of their contribution to the total.
| Joint Mechanical Power (W/kg) | ||||||||||||
|---|---|---|---|---|---|---|---|---|---|---|---|---|
| Phase | Sets | Value | Contribution | |||||||||
| H | K | A | Global | H | K | A | Global | |||||
| P1 | S1 | -0.53 | -0.78 | -0.46 | -1.76 | 30.2% | 44.0% | 25.8% | 100% | |||
| S2 | -0.71 | -0.94 | -0.53 | -2.19 | 32.7% | 43.0% | 24.4% | 100% | ||||
| S3 | -1.29 | -1.03 | -0.56 | -2.88 | 44.8% | 35.7% | 19.6% | 100% | ||||
| S4 | -1.66 | c | -1.29 | -0.86 | c | -3.81 | 43.7% | 33.8% | 22.5% | 100% | ||
| S5 | -1.63 | c | -1.20 | -0.84 | c | -3.67 | 44.4% | 32.7% | 22.9% | 100% | ||
| P2 | S1 | -2.72 | -2.45 | -0.56 | -5.73 | 47.4% | 42.7% | 9.8% | 100% | |||
| S2 | -2.36 | -2.11 | -0.44 | -4.91 | 48.1% | 42.9% | 9.1% | 100% | ||||
| S3 | -2.62 | c | -2.66 | b | -0.64 | b,c | -5.92 | 44.3% | 44.9% | 10.7% | 100% | |
| S4 | -3.55 | c | -2.89 | -0.82 | c | -7.26 | 48.9% | 39.8% | 11.2% | 100% | ||
| S5 | -3.10 | -2.43 | -0.70 | -6.23 | 49.7% | 39.0% | 11.2% | 100% | ||||
| P3 | S1 | 2.98 | c | 3.14 | b | 0.71 | b,c | 6.83 | 43.6% | 46.0% | 10.4% | 100% |
| S2 | 2.90 | 2.39 | 0.73 | 6.02 | 48.2% | 39.8% | 12.0% | 100% | ||||
| S3 | 2.96 | 2.34 | 0.88 | 6.18 | 47.9% | 37.9% | 14.2% | 100% | ||||
| S4 | 3.43 | a,c | 2.70 | a,b | 0.97 | b,c | 7.10 | 48.3% | 38.0% | 13.7% | 100% | |
| S5 | 3.10 | a,c | 1.95 | a | 0.93 | c | 5.97 | 51.9% | 32.6% | 15.5% | 100% | |
| P4 | S1 | 0.95 | 1.05 | b | 0.47 | b | 2.47 | 38.6% | 42.5% | 18.9% | 100% | |
| S2 | 1.16 | 0.89 | 0.65 | 2.70 | 43.0% | 32.9% | 24.1% | 100% | ||||
| S3 | 1.74 | c | 0.95 | 0.96 | c | 3.65 | 47.6% | 26.1% | 26.3% | 100% | ||
| S4 | 2.20 | c | 1.38 | 1.24 | c | 4.82 | 45.7% | 28.6% | 25.8% | 100% | ||
| S5 | 2.25 | 0.92 | 1.49 | 4.66 | 48.2% | 19.8% | 32.0% | 100% | ||||
Disclaimer/Publisher’s Note: The statements, opinions and data contained in all publications are solely those of the individual author(s) and contributor(s) and not of MDPI and/or the editor(s). MDPI and/or the editor(s) disclaim responsibility for any injury to people or property resulting from any ideas, methods, instructions or products referred to in the content. |
© 2025 by the authors. Licensee MDPI, Basel, Switzerland. This article is an open access article distributed under the terms and conditions of the Creative Commons Attribution (CC BY) license (http://creativecommons.org/licenses/by/4.0/).
Copyright: This open access article is published under a Creative Commons CC BY 4.0 license, which permit the free download, distribution, and reuse, provided that the author and preprint are cited in any reuse.


