
Submitted:
10 July 2025
Posted:
11 July 2025
You are already at the latest version
Abstract
Irish agriculture faces the challenge of balancing productivity with agri-environmental sustainability, where system models could play an important role in precise land use planning. This study focuses on enhancing the predictability of HOLOS-IE, an agricultural system model, by integrating geographically referenced soil data on detailed Land Parcel Identification System (LPIS) maps of Ireland. Soil data sourced from SoilGrids (https://soilgrids.org/) via Google Earth Engine (GEE) and the National Soil Database of Ireland were processed using ArcGIS tools and the Multiple Imputation by Chained Equations (MICE) method to ensure data completeness and accuracy. This refined soil information was integrated with LPIS maps to develop a robust soil database and thereby soil health indices using observed over referenced typical values. The findings identify the significant regional soil differences, with the western counties characterized by acidic, sandy soils with high organic carbon (pH 4.0-5.5, sand >40%, SOC >0.10 kg kg-1), com-pared to the counties in the east with neutral, clay soils (pH >6.0, clay >20%, bulk density >0.95 g cm-3 ), with clear northwest southeast trends in moisture retention and nutrient. The Soil Health Index (SHI) reveals that regions with extensive grasslands, mostly in central and southern areas, exhibit higher soil health indices compared to other areas. The data generated are overlaid on LPIS maps and integrated into the HOLOS-IE model to initiate and serve as driving variables for predicting growth, changes in soil organic carbon density, greenhouse gas emissions, and soil health, leading to inform precise land-use planning for climate change mitigation and adaptation.
Keywords:
GIS
; MICE
; soil database
; land cover
; soil health
; HOLOS-IE
1. Introduction
Global agriculture faces economic, environmental, and social sustainability challenges, including rising costs, stagnant incomes, and increased regulatory burdens, causing stress and reducing well-being among farm families. Farmers face challenges in environmental, economic and social sustainability in farming. Increasing costs, income stagnation, workload pressures, and regulatory burdens increase stress. To achieve enhanced sustainability, farmers must balance environmental goals like reducing carbon footprint while maintaining livelihoods, guiding policymaking and designing adjustment pathways[1]. Ireland's agricultural sector needs strategic management techniques/approaches to maximize productivity while attaining sustainability, considering the country's distinct climate and variety of soil types [2]. Land cover constitutes a critical variable in the monitoring and modelling of various environmental and socioeconomic processes [3,4] Land cover maps are a key to understanding the Earth's surface features and are used in ecological modelling, land use planning, and climate change studies [5]. Soil is fundamental to agriculture, providing essential nutrients, water, and support for plant growth, thereby enabling food production. Among the determinant or driving variables, soil texture determined by the proportion of clay, silt and sand content influences soil structure and ability to hold water and nutrients, which in turn affect crop development and soil health [6]. Drainage class and soil moisture influence plant water availability and soil erosion risk, both of which are critical for preserving soil integrity, encompassing soil biogeochemical processes and their interactions, and decreasing nutrient runoff [7]. Soil pH and bulk density are two parameters that determine nutrient availability and root penetration, which affects plant health and productivity [8] Soil organic carbon (SOC) and essential nutrients, for example, nitrogen and phosphorus are important elements of assessing soil fertility and carbon sequestration capacity, which are necessary for sustainable soil management and lowering greenhouse gas (GHG) emissions [9]. Porosity, field capacity, and wilting point are also essential for understanding soil water dynamics as well as managing approaches to fertigation [10]. Crop adaptability for a certain climate and soil aeration conditions is influenced by factors such as hardiness zone, which helps in crop selection and management [11]. For long-term planning, it is important to determine how well crops can withstand climatic variability [12].
Soil health and productivity are fundamental to ensuring food security, mitigating environmental degradation, and fostering sustainable development [13,14]. The creation of a detailed and accurate soil database is a key to addressing these challenges. Geospatial technologies, including remote sensing and geographic information systems (GIS), have revolutionized the monitoring and management of agricultural landscapes. These tools provide detailed spatial data and advanced analytical capabilities, offering invaluable support for sustainable decision-making [15,16]. GIS facilitates the integration of diverse datasets, aiding in forecasting agricultural production, maintaining soil health, and assessing environmental impacts [13,17] . Previous studies have demonstrated the utility of GIS-based approaches in several sectors. For instance, Basu (2021) utilized national soil maps and Coordination of Information on the Environment (CORINE) land cover data to develop soil and land cover databases for Ireland, which were subsequently applied to the Soil and Water Assessment Tool (SWAT) model [18]. Khalil et al. (2013; 2018) refined depth-distribution models and pedotransfer functions and overlaid soil and land-use maps using ArcGIS to provide robust SOC stock estimates for disaggregated land covers and soil types, enabling Ireland's transition to a Tier 2 accounting methodology for Land Use, Land Use Change and Forestry (LULUCF) carbon stock inventories, as well as revealing deficiencies in the IPCC methodology and advocating for integrated approaches to provide robust estimates of SOC and its long-term changes across land uses and soil categories [19,20]. Similarly, Trinh et al. (2018) proposed innovative methods to improve the representation of saturated hydraulic conductivity by integrating global soil and land use/land cover datasets [21]. Luzio et al. (2004) developed GIS-based tools to incorporate detailed Soil Survey Geographic Database (SSURGO) soil data into watershed modeling frameworks, significantly enhancing landscape representation and water quality assessments [22]. Multiple Imputation by Chained Equations (MICE) generates complete sets of data through a series of modeling runs, facilitating the handling of missing information. Because it tracks variable relationships, it significantly improves accuracy and is particularly helpful for research in environmental and agricultural fields, where datasets may be incomplete [23,24].
The HOLOS-IE (HOLOS means entire or whole; Greek word ‘ολοσ’; IE stands for Ireland), an agricultural system model, stands out from other agricultural and environmental models due to its integrated approach, requiring comprehensive input data for precise simulations. Unlike conventional models, HOLOS-IE benefits from automated data integration, streamlining inputs such as soil properties, climate variables, and management practices. This automation reduces manual errors, enhances consistency, and ensures real-time updates for dynamic predictions of crop production, SOC, and GHG emissions. By minimizing variability in outputs, the system provides more reliable insights for sustainable land management and climate-smart agricultural practices [25,26].
Key gaps persist in Irish soil research, notably in SOC dynamics, soil biodiversity, and understanding the impacts of various land uses on overall soil health and thereby integration into the modelling framework. Studies are often small-scale, involving fewer than 30 samples, and influenced by funding priorities rather than natural settings. Additionally, inconsistencies in parameter analysis, a lack of data quality indicators, and the absence of standardized classification systems hinder the effectiveness of current soil research. These limitations are further compounded by the limited integration of soil data with high-resolution land cover maps, particularly in the context of assessing GHG emissions [27]. Addressing these gaps is essential to align Irish soil research with the European Soil Strategy 2030 goals for sustainable soil management. By leveraging geospatial technologies, this study aims to develop a soil database and integrate it with the Land Parcel Identification System (LPIS) map of Ireland, contributing to the development of the HOLOS-IE model.
2. Materials and Methods
2.1. Methodological Framework
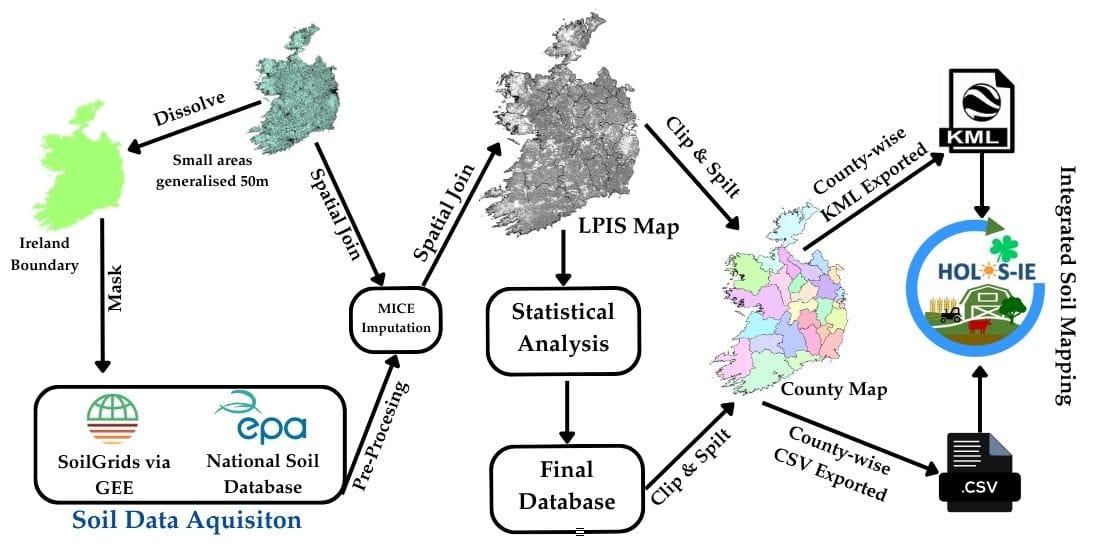
An intensive methodology structure has been developed that aims to explain the process of data collection and integration systematically. These are formulated to be transparent and reproducible, thus providing a clear step-by-step protocol (Figure 1). The entire process is described, highlighting the most important steps and the instruments used to implement them, i.e., the steps of initial acquisition of soil and climatic data and their preprocessing and further integration into the HOLOS-IE platform.
2.2. Data Acquisition and Preparation
Several soil properties, such as bulk density in cg cm-³, clay content in g kg-1, sand content in g kg-1, volumetric water content (VWC) at -10 pKa, VWC at -33 pKa, VWC at -1500 pKa in (10−2 cm3 cm−3)*10, nitrogen in cg kg-1, SOC in dg kg-1, pH in pH*10 and soil groups, were obtained from SoilGrids (www.soilgrids.org) via Google Earth Engine (GEE). The database is publicly available (https://git.wur.nl/isric/soilgrids/soilgrids.notebooks/-/blob/master/markdown/access_on_gee.md) and provides global soil predictions that are done at six standard depths (0-5 cm, 5-15 cm, 15-30 cm, 30-60 cm, 60-100 cm and 100-200 cm) [28,29,30]. To provide a harmonized topsoil layer (0-30 cm), the upper three depth bands (0-5 cm, 5-15 cm and 15-30 cm) were combined with a thickness-weighted average. These soil properties were transformed into standard units (clay and sand content into percentages by diving by 10, bulk density into g cm-3 by dividing by 102, SOC into kg kg-1 by dividing by 104, total nitrogen into kg kg-1 by dividing by 105, pH by dividing by 10 and VWC into cm3 cm-3 by dividing by a 102) for analytical purposes. Total phosphorus (Total P) in mg-l-1 (further transformed into kg kg-1 by dividing by 106) was obtained from National Soil Database (NSDB) of Ireland which is available at Secure Archive for Environmental Research Data (SAFER) managed by Environmental Protection Agency Ireland (https://eparesearch.epa.ie/safer/iso19115/displayISO19115.jsp?isoID=7) that provides accurate and appropriate information such as agriculture, environmental prediction, and natural resource management for uses [31]. Shapefile of Small areas generalised 50m - National Statistical Boundaries (NSB) (2015) was downloaded from the Surveying Open Data Portal (SODP) (https://data-osi.opendata.arcgis.com/datasets/osi::small-areas-generalised-50m-national-statistical-boundaries-2015) and LPIS shapefiles from the Department of Agriculture, Food and the Marine (DAFM) (https://datacatalogue.gov.ie/dataset/land-parcel-identification-system-land-parcel-data) for spatial analysis and parcel-level mapping [32,33].
To delineate the Ireland boundary, the small area unit boundaries from generalized 50m shapefiles were dissolved into a single polygon using the Dissolve tool in ArcGIS Pro. Each soil parameter raster derived from SoilGrids and NSDB was clipped to the extent of the Ireland boundary using the Extract by Mask tool for further analysis. After that, the raster files were converted into point features using the Raster to Point tool in ArcGIS pro. This conversion was useful in converting to a vector format, which allowed a spatial join to be run on the data.
The vector point features representing soil properties were spatially joined with a small area map of Ireland using the Spatial Join tool in ArcGIS Pro. This process linked soil characteristics information with geographic zones for thorough examination. The spatial join standards were based on the spatial range and attributes of the small area map of Ireland, ensuring precise data connection.
2.3. Statistical Analysis and Imputation
There were missing values in the extracted soil datasets. Therefore, MICE was used to impute missing values in the soil property datasets. This approach was chosen because it can deal with missing data in multivariate analysis while maintaining the dataset's accuracy and integrity [24]. For nominal categorical variables (soil great group), categories were first converted into a numeric format using one-hot encoding (scikit-learn's One Hot Encoder). The encoded data were then imputed alongside quantitative variables using MICE, and following the imputation, the original nominal variables were reconstructed by reversing the one-hot encoding (inverse_transform).
The general soil texture classification was performed based on the percentage composition of sand and clay, utilizing the classification scheme outlined by the Food and Agriculture Organization (FAO) of the United Nations, using ArcPy in ArcGIS Pro [34].
Porosity, calculated relative to bulk density, quantifies the volume of void spaces within soil, indicating its ability to hold water and air [35].
Porosity (Φ) was computed using the formula:
Soil Moisture was computed as the arithmetic mean of volumetric water content at different pressure heads using the formula:
Water-filled pore space (WFPS) was calculated using formula [36]:
Field capacity was calculated based on soil texture and volumetric water content (θv) at different pressure heads. The field capacity of coarse soil texture, moderate soil texture and medium soil texture is equivalent to θv at −33pKa. On the other hand, the field capacity of moderate fine soil texture and fine soil texture is equivalent to θv at −10pKa [37]. The calculation was automated through a Python script using the ArcPy module, where systematic conditional statements were utilized.
Wilting point (θwp) was calculated based on the volumetric water content (θv) at -1500pKa.
Typical SOC values, originally expressed in g kg-1, were converted to kg kg-1 by dividing by 102. The Observed/Typical (O/T) SOC is used as a Soil Health Index and is calculated by dividing the observed SOC value (kg kg-1) by the typical SOC value (kg kg-1) corresponding to the specific pedo-climatic zone and land cover types [38]. Four (arable crops, grass, tree or forest, and built-up area) land cover classifications were derived through reclassification of the CRP_CROP_D attribute field contained within the LPIS shapefiles and delete all parcels of built-up area land cover class using ArcPy.
Soil health quality was categorized based on O/T SOC Index thresholds and land Cover type [38].
For Croplands:
Low: 0.75< O/T SOC
Medium: 0.75 ≥ O/T SOC <0.96
High: 0.96 ≥ O/T SOC <1.26
Very High: O/T SOC ≥1.26
For Forests and Grasslands:
Low: 0.7< O/T SOC
Medium: 0.7 ≥ O/T SOC <1.02
High: 1.02 ≥ O/T SOC <1.45
Very High: O/T SOC ≥1.45
The soil properties data obtained from the spatial analysis and further statistical analyses, and imputation, were further integrated with LPIS map of Ireland utilizing the Spatial Join tool in ArcGIS Pro.
2.4. Integration with HOLOS-IE Version 1.0
The spatially integrated LPIS map of Ireland was first divided into 26 separate county shapefiles. The ‘Table to Excel’ tool in ArcGIS was used to extract data from each shapefile, which was then exported to Excel spreadsheets. After preprocessing, these county Excel files, each of which has soil properties of every land parcel of the LPIS map of Ireland, were converted to comma-separated value (CSV) formats and uploaded as a resource file to the HOLOS-IE Version 1.0 (Hereafter, HOLOS-IE).
Simultaneously, the Ireland LPIS map underwent a data transformation, being re-digitized, broken down into 26 single-county shapefiles (the latter represented 26 separate county entities) and exported to Keyhole Markup Language (KML) format for integration into the HOLOS-IE platform. During preprocessing, unnecessary attributes were removed from the KML files, and irrelevant columns were removed from the CSV files, ensuring compatibility with the HOLOS-IE system. The individual fields in the KML files and the CSV files were connected by a common attribute: ‘Placemark Name’ as the ID, while ‘Holding ID’ was the associated column in the CSV files. The connection enables spatial data integration within the HOLOS-IE map, allowing users to point at a location and retrieve the relevant soil information from the corresponding CSV records. Consequently, the HOLOS-IE platform can efficiently retrieve soil data for individual parcels of land from the LIPS map of Ireland.
3. Results and Discussion
3.1. Summary Statistics
Table 1 provides a comprehensive overview of soil parameters across the Republic of Ireland, highlighting significant variability in physical, chemical, and hydrological properties.
Soils with clay content ranging from 2%–37% (mean 18.41%) and sand content from 9%–67% (mean 35.57%) generally fall within medium soil texture (Figure A1b), offering balanced water retention and man oderate nutrient-holding capacity. In areas with higher sand content is recommended to reduce leaching and erosion, while high clay zones may require drainage improvement for sustainable farming and improved soil health [39,40]. Soil pH ranging from 4 to 6.86 indicates predominantly acidic conditions, which are consistent with previous studies that have documented soil acidification in Ireland [31,41]. This acidity can decrease nutrient availability and microbial activity [42], and influence nutrient availability and microbial activity, necessitating appropriate soil management practices to maintain agricultural productivity [43]. Bulk density values ranging from 0.8 g cm-3 to 1.2 g cm-3 with an average of 0.88 g cm⁻³, and porosity from 55% to 97% with an average of 66.68% suggest well-structured soils with favorable aeration and water movement characteristics, which are crucial for root development and overall soil health [39,44].
SOC levels show considerable variation ranging from 0.035 kg kgsoil-1 to 0.598 kg kgsoil-1 with mean of 0.08 kg kgsoil⁻¹. SOC stocks were measured 52 t ha-1 in grasslands on mineral and organo-mineral soils compared to 29.9 t ha-1 in arable crops in 0 to 10 cm depth which reflects the influence of land use practices on the SOC stock of Ireland [20]. Notably, a study on land cover change and SOC stocks in Ireland estimated an increase in SOC stock from 1,391 Tg in 1851 to 1,469 Tg in 2000, highlighting the dynamic nature of carbon sequestration in Irish soils [45]. Total nitrogen and phosphorus contents are found relatively low, with the average of 0.0036 kg kgsoil⁻¹ and 0.001 kg kgsoil⁻¹, reflecting the importance of balanced fertilization strategies to enhance crop production and minimize environmental impacts [43,46].
Field capacity ranging from 0.03 cm3 cm-3 with mean 0.27 cm³ cm⁻³ and wilting point 0.02 cm3 cm-3 with mean 0.12 cm³ cm⁻³ indicate moderate water retention capabilities and thereby availability [47]. Water-filled Pore Space (WFPS) ranging from 5% to 55%, with an average of 36.50%, suggests adequate soil aeration under typical conditions [48]. However, variability in these parameters points to localized differences in water-holding capacity and drainage, which can affect plant growth and soil microbial processes [39,49].
3.2. Soil Property Variation Across Irish Counties
The violin plots (Figure 2) show an in-depth analysis of the spatial and statistical variability of soil physical and chemical properties across various counties in the Republic of Ireland, highlighting both uniformity and heterogeneity [50].
Figure 2a revealed the observable differences in the clay levels nationally. Counties Meath and Westmeath in eastern areas and the midlands of Offaly and Roscommon possess clay contents exceeding 22 and 20 percent, respectively. Conversely, western coastal counties like Donegal and Sligo are found to contain substantially less clay content i.e. below 17 percent (Figure A1c). Sandy soil, observed to have almost 50 percent of sand, dominates the northwestern areas of Ireland, including Donegal, with surrounding counties like Leitrim and Monaghan also exhibiting significant sand content. Conversely, the eastern countries, specifically Dublin and Meath, contain less sand (Figure 2b and Figure A1d). Soil texture is significantly dependent on the ratio of clay and sand content, which determines drainage, water-holding capacity and nutrient availability [34]. High sand and low clay content qualify soil as moderate coarse throughout Donegal, where organic amendments and controlled moisture management are recommended to maximize water- holding potential and medium soil texture elsewhere in most regions (Figure A1c) have been found to provide better nutrient retention and crop production [51]. Soil acidity (pH<5) is identified as a significant factor in western counties (Kerry, Donegal, and Leitrim). This level of acidity can restrict plant growth without the application of lime amendments [42]. Conversely, eastern regions (Dublin, Kildare, and Wexford) maintain near-neutral pH levels (above 6), which are considered optimal for agricultural practices [43]. Central areas such as Tipperary and Laois are characterized by moderately acidic conditions (pH 5.5–6.0) (Figure 2c and Figure A1e).
Future 2d depicts an interesting spatial variance pattern of the bulk density in Ireland. The midland counties have higher bulk densities, with Roscommon and Kilkenny being found to have densities above 0.99 g cm-3. Dublin soil, composed of sand and influenced by urban factors, is listed as having the lowest bulk density of 0.77 g cm-3. The bulk density of most counties is in a middle range of 0.90-0.95 g cm-3 (Figure A1f), providing a balance between root penetration and sufficient water flow that is essential to crop productivity [48,49]. Figure 2e demonstrates that the greatest concentration of SOC is found in the west of Ireland. Specifically, the Galway and Mayo counties have SOC values above 0.14 kg kg-1, attributed to the abundance of grasslands in the region (Figure A1p) [45,52]. Kerry and Clare counties, with mainly pastoral land uses, also experience SOC values that are high. Conversely, at the opposite end of the scale, Dublin and Meath have significantly lower SOC concentrations, about 0.05 kg kg-1, an outcome attributed to intensive agriculture and rapidly advancing urbanization (Figure A1p) [53,54]. Intermediate SOC levels of 0.06 to 0.08 kg kg-1 are observed in midland counties, notably Offaly and Laois (Figure A1g).
According to Figure 2f, regional changes in soil moisture content are observed throughout geographic areas where the greatest level is recorded in the north-west counties like Monaghan and Leitrim, with a mean moisture density of 0.35 cm3 cm-3. It can be explained by the existence of clay-rich soils containing a high amount of organic matter to a large degree [52,55]. The low moisture retention is, on the contrary, noted in the eastern regions where sandy soils show lower than 0.25 cm3 cm-3 soil moisture, like in Dublin and Louth. An intermediate moisture level, generally around 0.30 cm3 cm-3, is found in the midland counties, conditions which are considered optimal for agricultural sectors [48]. Figure 2g demonstrates that WFPS also has a similar distributional pattern. The greatest levels of WFPS are reported in Roscommon (50.3%), which signifies a high saturation time due to fine-textured soils [51]. On the other hand, the lowest WFPS is recorded in Dublin (22.4%). WFPS values in most agricultural areas fall within the optimal range of 35-45 percent, allowing proper aeration as well as maintaining adequate moisture [55]. The concentrations of phosphorus exhibit a modest geographical gradient with slightly higher concentrations in the southeast coast counties of Wexford and Waterford and the mid-county region of Meath (Figure 2h and Figure A1j). The trends show consistency with earlier practices of fertilizer application [46]. According to Figure 2i, the nitrogen distribution pattern indicates a high spatial contrast with the highest values in Dublin and the coastal county of Donegal where urbanization and marine influence are considered to be the main drivers [56]. Figure 2j illustrates that the soils of Dublin have very high porosity (70.77 %), recounting the fact that they are mostly sandy (Figure A1d), whereas lower porosities (<63 %) in Roscommon and Wexford are potentially caused by the higher amount of clay (Figure A1c). This distribution is associated with field capacity, as the northwestern counties, Monaghan and Cavan, hold the greatest amount of water (0.34-0.35 cm3 cm-3) (Figure 2k and Figure A1m). According to Figure 2l, the wilting point values are greatest in Roscommon (0.18 cm3 cm-3), suggesting that in soil of these areas’ plants will be able to draw water at drier conditions as oppose to the Dublin soils with a lesser wilting point (0.08 cm3 cm-3), which are relatively subject to being dried out [47,55]. The patterns of distribution of soil properties are consistent with the past pedological studies' soil maps [57,58]. A physical disparity in texture, organic carbon and pH indicates the relevance of the climate, geology and land-use regime as shown by the EPA cross-country analyses [59]. The level of consistency of these datasets has been used to support the regional soil characterization, and the variations have supported the deployment of precision farming and sustainable land-management practices through the application of these frameworks [39].
3.3. Soil Health Quality Index
The Soil Health Index (SHI), based on the Observed/Typical SOC (O/T SOC), Map illustrates significant spatial variability in soil health across Ireland, with SHI values ranging from 1.20 to 19.97 (Figure 3a). Regions with high SOC levels, particularly in the Mayo and Galway counties, correspond to peatlands (organo-mineral to organic soil) known for their substantial carbon sequestration capacity [20]. This observation is consistent with findings from the European Environment Agency, which highlights the critical role of peatlands in carbon storage [60]. However, typical values for organo-mineral and organic soils, including peatlands, across various land uses may not accurately assess SHI, potentially leading to overestimated values. Conversely, lower SOC levels are observed in counties such as Cork and Meath, which are characterized by mineral soils with intensive agricultural practices. This trend aligns with studies linking lower SOC levels to reduced organic inputs and higher rates of soil disturbance in intensively farmed regions. Research on soil carbon stocks in heavy-textured soil provides insights into these dynamics [61]. The SHI serves as a reliable indicator of soil health quality by normalizing SOC content against site-specific environmental and textural conditions. Unlike the SOC/clay ratio, the SHI minimizes biases related to soil texture, providing a more accurate and consistent assessment of soil structure, microbial activity, and carbon sequestration potential [62,63]. Although the SHI is a standardized method of assessing SOC-based soil health, its precision relies on a consistent set of baseline SOC concentrations and also neglects other important soil health variables, including nutrient status, compaction and biological activity, which restricts its applicability in diverse agroecosystems [64].
The SHI Map of Ireland reveals distinct spatial patterns correlating with land cover types and agricultural practices (Figure 3b). Central and southern regions predominantly exhibited classifications of High and Very High (Grass), reflecting Ireland's extensive grasslands, which cover approximately 60% of the national land area. This observation aligns with findings from the Irish Environmental Protection Agency (EPA), which emphasizes the significance of grasslands in Ireland's land use and soil quality dynamics [54]. Southeastern counties, such as Wexford, Carlow and Kilkenny, are characterized by the Very High (Arable Crops) classification, indicative of intensive agricultural activities. This pattern is consistent with studies highlighting these areas as key agricultural hubs with high soil fertility. For instance, research on SOC stocks in heavy-textured soil underscores the agricultural productivity of these regions [61]. Forested regions in western counties, including Galway, Mayo and Donegal, display the Very High (Tree or Forest) classification. This finding corroborates previous studies that emphasize the ecological importance of these forested areas in enhancing soil health through organic matter accumulation. Notably, research on SOC stocks in Irish afforested soils provides evidence supporting the role of forests in soil carbon sequestration [53].
3.4. Integrating Soil Properties with LPIS Map in HOLOS-IE Platform
The HOLOS-IE platform provides an intuitive interface that allows users to visualize farm locations and interact with soil property data (Figure 4). By selecting land parcel polygons, users can access key integrated soil parameters such as pH, bulk density, SOC content, etc., on the map and the NASA climate database through Application Programming Interface (API).
Based on the combined HOLOS-IE framework and NASA climate data, users can learn about the spatial variation of soil pH, bulk density, and SOC, etc., in the Irish farmland. According to the map, western areas have high SOC and low bulk density and vice versa, the eastern and southeastern regions, where extensive cultivation is practiced due to high population density, have low SOC and compacted soil. Real-time climate data provided by the NASA API also puts these trends into perspective by correlating the state of the soil with the local weather trends of temperature and precipitation. This can be used to better assess sustainable soil and carbon management in a more accurate, site-specific study [25,26].
The development of digital tools to apply to agricultural land use planning predicting GHGs, SOC, and production, leading to assessing net carbon balance for climate change mitigation and adaptation, is gaining momentum. The model of HOLOS, which aims at exploring the GHG mitigation practices, will be extended to carbon, nitrogen, and energy flows to increase their environmental impact analysis. An extension of the HOLOS model to Ireland and the European Union, named HOLOS-IE, has the additional capability to evaluate the environmental consequences of agricultural activities. This capability would make the process of retrieval of such critical data easier and decision-making processes more precise and based on data, contributing to sustainable land use, farm management and GHG mitigation strategies in agriculture [65].
4. Conclusions
This research explored the potential of geospatial technologies to generate a complete database on Irish soil, integrating with the LPIS map. The statistical findings indicate significant variation among Irish soils in a variety of main soil properties, which include clay content, sand content, pH, bulk density, SOC, soil moisture, WFPS, Total P, Total N, soil porosity, field capacity, and wilting point. These parameters become critical in assessing the health of the soil, the suitability of crops and sustainable land use. The combination of land cover and categorical data, such as soil great group and soil texture, with spatial soil data developed in the study, is essential in improving the HOLOS-IE model. However, results imply that further research is needed to generate typical SOC values for organo-mineral and organic soils across various land uses to develop more appropriate SHI. The integration of sophisticated models like HOLOS-IE is a major achievement in agricultural land use planning and GHG mitigation. This digital platform could allow a comprehensive picture of the environmental effects of agricultural activities by including carbon, nitrogen, and other soil parameters as the driving variables. This multifactorial approach not only increases the accuracy of the data but also engages stakeholders to make informed and sustainable choices, which comply with climate objectives. Such integration aids better prediction in crop productivity, SOC dynamics, and GHG emissions. The methodology also fills the existing gaps in Irish soil research, as it can adapt to the objectives of the European Soil Strategy 2030, the strategy should help promote the development of climate-smart agriculture, sound policy-making, and sustainable environmental development. Findings of this study indicate that GIS and remote sensing-driven spatially integrated soil data are essential inputs in modern agricultural modelling and sustainable resource management. These efforts also promote cooperation between farmers, researchers, and policymakers, building a common vision of sustainable agricultural growth with an emphasis on both economic development and environmental stewardship.
Author Contributions
Conceptualization, methodology, visualization, writing - original draft preparation, S.S.; Conceptualization, methodology, writing, review and editing, supervision, project administration, funding acquisition, M.I.K. All authors have read and agreed to the published version of the manuscript.
Funding
This project is funded by the Science Foundation Ireland (SFI; currently Research Ireland) through the Government of Ireland and the European Commission Resilience and Recovery Facility (Grant No. 22/NCF/FD/10947).
Data Availability Statement
The raw data supporting the conclusions of this study are available from the authors upon reasonable request.
Acknowledgements
The team acknowledges the collaboration with the HOLOSEU project funded by ERA-NET COFUND ICT-AGRI-FOOD, and ReLive Project funded by ERA-NET, through the Department of Agriculture, Food and the Marine, Ireland. Special thanks are also extended to Mubashir Ali (Former GIS Analyst, PCD) and Badhan Sen (Programmer/RA, UCD) for their contributions.
Conflicts of Interest
The authors declare no conflicts of interest.
Abbreviations
The following abbreviations are used in this manuscript:
| API | Application Programming Interface |
| CORINE | Coordination of Information on the Environment |
| CSV | Comma-Separated Value |
| DAFM | Department of Agriculture, Food and the Marine |
| EPA | Environmental Protection Agency |
| FAO | Food and Agriculture Organization |
| FLT | OpenFlight |
| GEE | Google Earth Engine |
| GHG | Greenhouse Gas |
| GIS | Geographic Information Systems |
| HOLOS-IE | Towards a Systems-based Digital Platform for Agricultural Land Use Planning, Management Decision, and Inventory Reporting |
| KML | Keyhole Markup Language |
| LPIS | Land Percel Identification System |
| MICE | Multiple Imputation by Chained Equations |
| NSB | National Statistical Boundaries |
| NSDB | National Soil Database National Soil Database |
| O/T SOC | Observed/Typical SOC |
| SAFER | Secure Archive for Environmental Research |
| SOC | Soil Organic Carbon |
| SODP | Surveying Open Data Portal |
| SSURGO | Soil Survey Geographic Database |
| SWAT | Soil and Water Assessment Tool |
| TIFF | Tagged Image File Format |
| Total N | Total Nitrogen |
| Total P | Total phosphorus |
| VWC | Volumetric Water Content |
| WFPS | Water-Filled Pore Space |
Appendix A
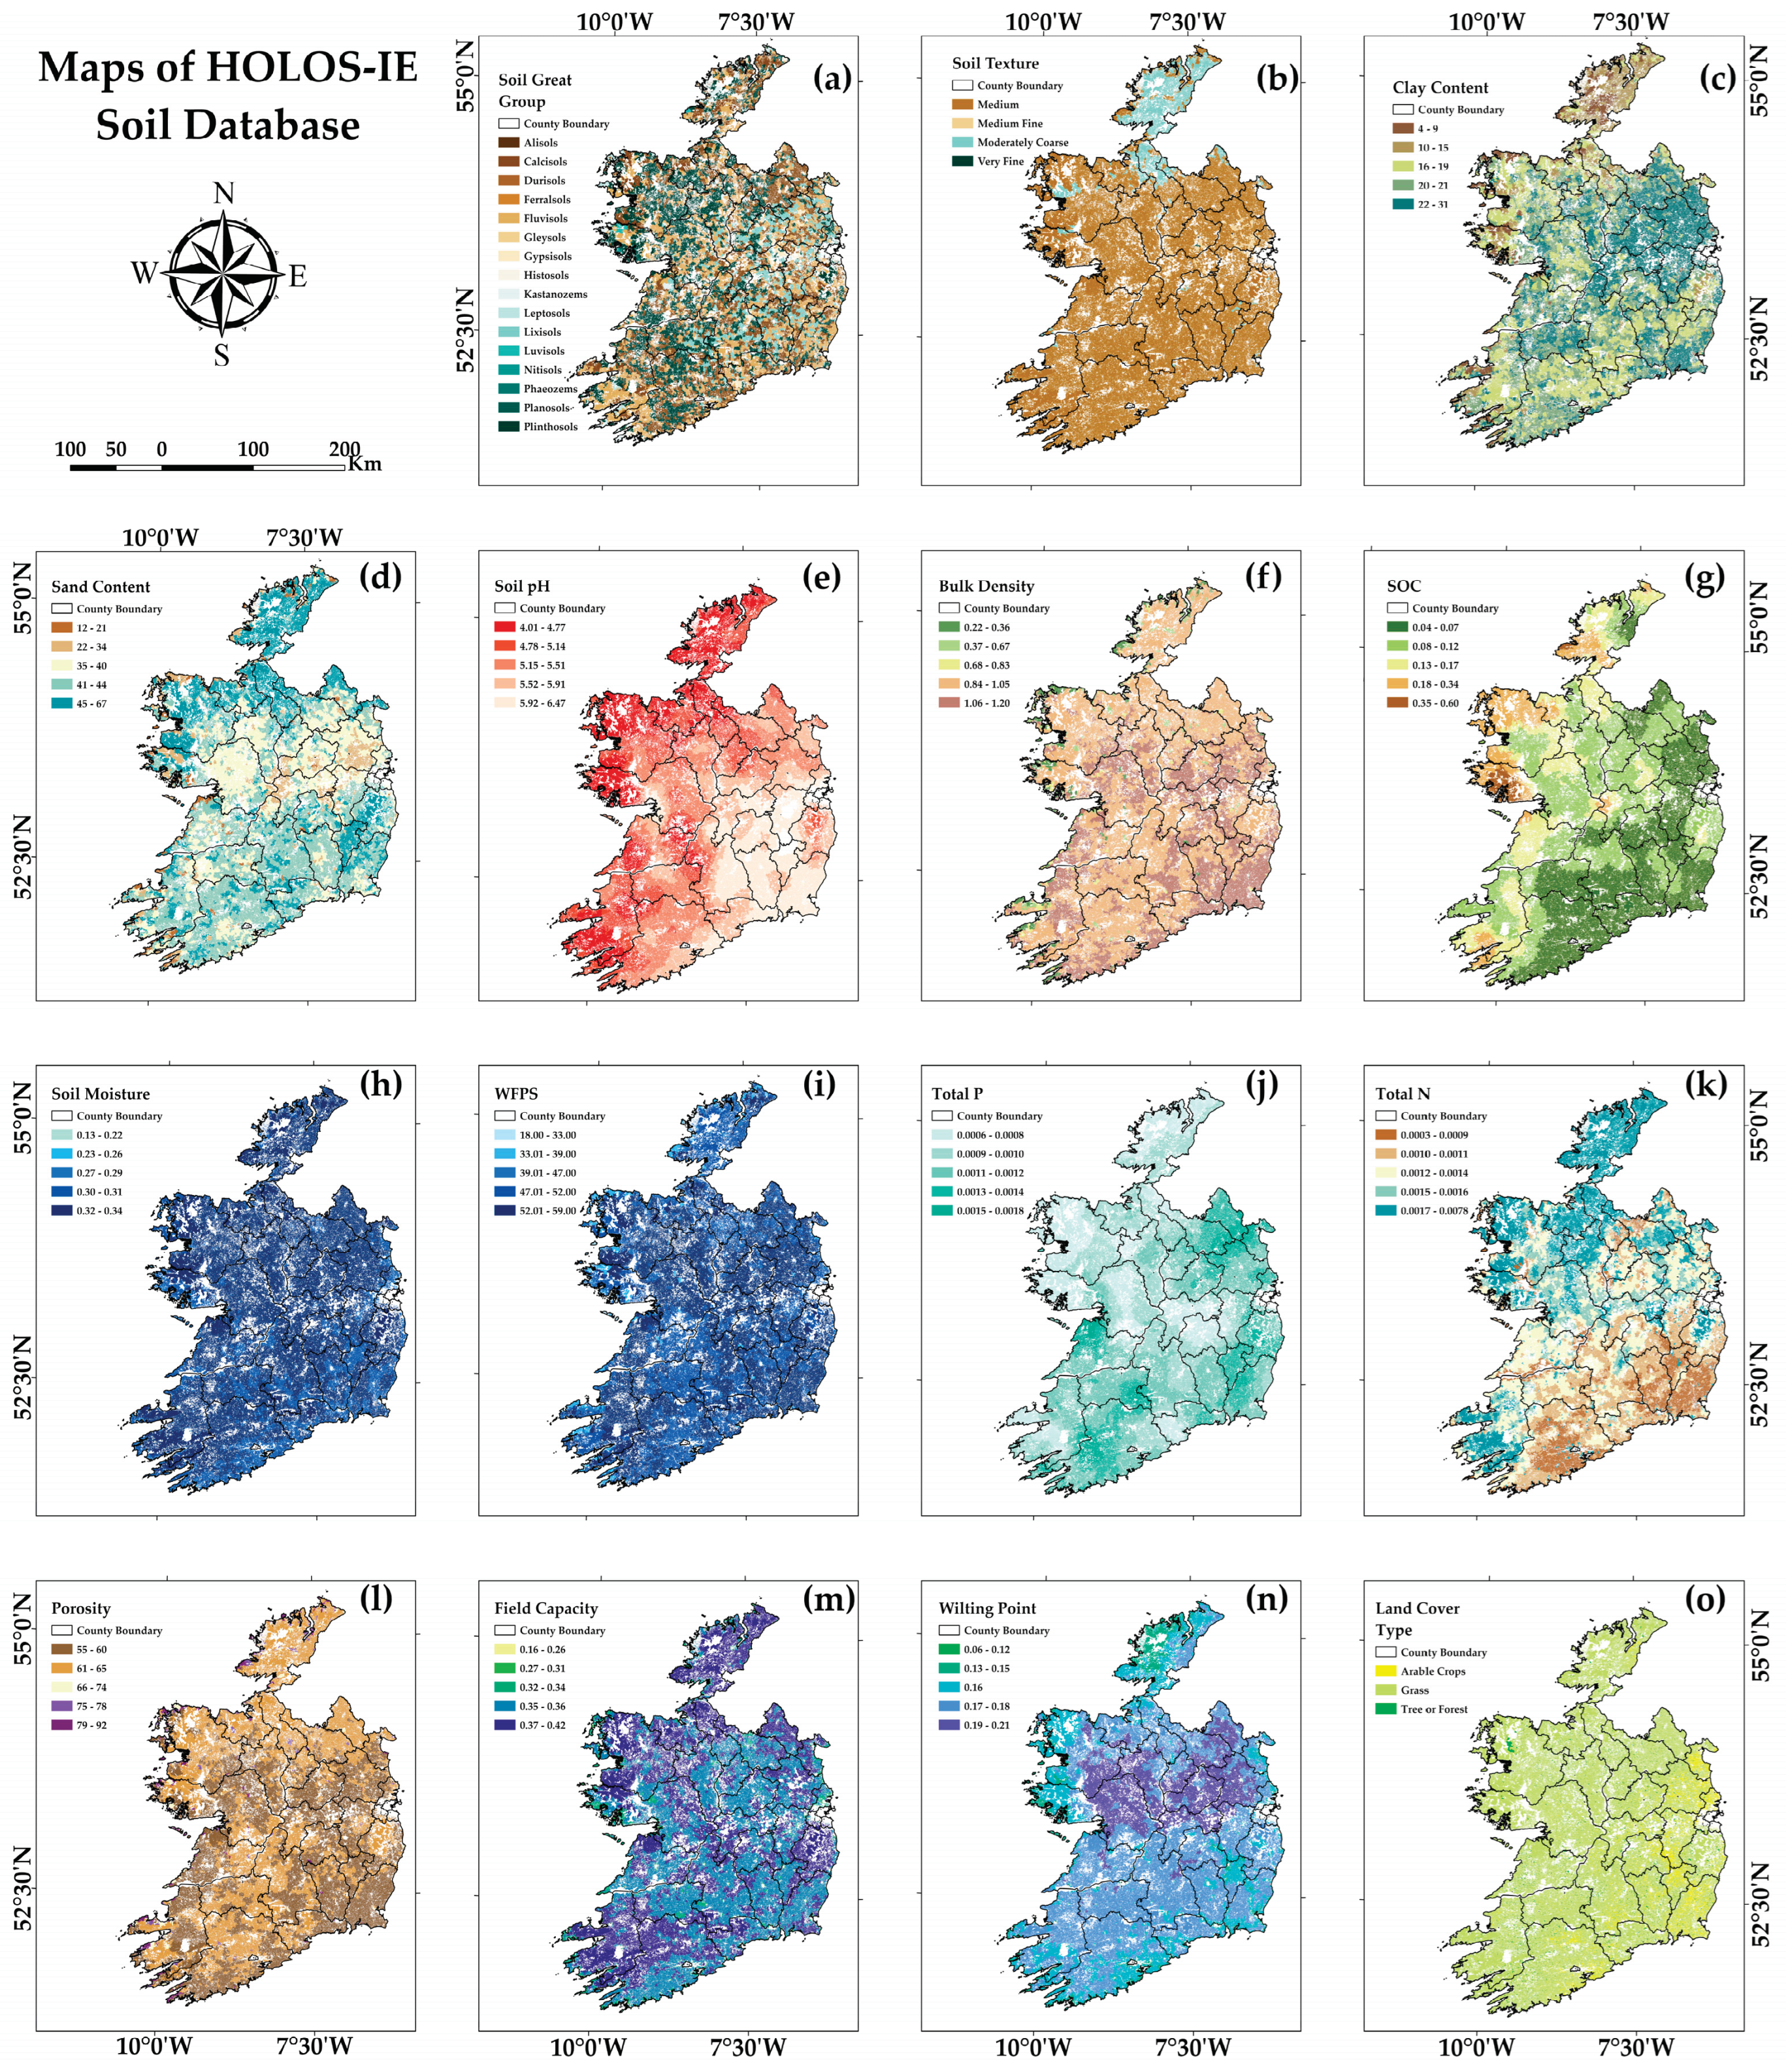
Figure A1.
Spatial distribution maps of key soil parameters across Ireland: (a) Soil great group, (b) Soil texture, (c) Clay content, (d) Sand content, (e) Soil pH, (f) Bulk density, (g) Soil organic carbon (SOC), (h) Soil moisture, (i) Water-filled pore space, (j) Total phosphorus, (k) Total nitrogen, (l) Soil porosity, (m) Field capacity, (n) Wilting point, and (o) Land cover.
References
- Chatzichristou, T. Can Farms Combining Livestock and Crops Improve Sustainability? Available online: https://www.rte.ie/brainstorm/2024/0326/1440039-mixed-farming-systems-crops-livestock-sustainabilty-rural-development/ (accessed on 13 June 2024).
- Fay, D.; McGrath, D.; Zhang, C.; Carrigg, C.; O’Flaherty, V.; Kramers, G.; Carton, O.T.; Grennan, E.J. National Soils Database, End of Project Report; Teagasc, 2007. [Google Scholar]
- Costa, H.; Almeida, D.; Vala, F.; Marcelino, F.; Caetano, M. Land Cover Mapping from Remotely Sensed and Auxiliary Data for Harmonized Official Statistics. ISPRS International Journal of Geo-Information 2018, Vol. 7, Page 157 2018, 7, 157. [Google Scholar] [CrossRef]
- Luyssaert, S.; Jammet, M.; Stoy, P.C.; Estel, S.; Pongratz, J.; Ceschia, E.; Churkina, G.; Don, A.; Erb, K.; Ferlicoq, M.; et al. Land Management and Land-Cover Change Have Impacts of Similar Magnitude on Surface Temperature. Nat Clim Chang 2014, 4, 389–393. [Google Scholar] [CrossRef]
- Connolly, J.; Holden, N.M.; Ward, S.M. Mapping Peatlands in Ireland Using a Rule-Based Methodology and Digital Data. Soil Science Society of America Journal 2007, 71, 492–499. [Google Scholar] [CrossRef]
- Rawls, W.J.; Brakensiek, C.L.; Saxton, K.E. Estimation of Soil Water Properties. Trans ASABE 1982, 25. [Google Scholar] [CrossRef]
- Ray R., Weil; Nyle C. Brady The Nature and Properties of, Soils; Fox, D. , Gilfillan, A., Dimmick, L., Eds.; Fifteenth.; Pearson: Columbus, 2016. [Google Scholar]
- Havlin, J.L.; Tisdale, S.L.; Nelson, W.L.; Beaton, J.D. Soil Fertility and Fertilizers, 8th Edition. Pearson 2014. [Google Scholar]
- Lal, R. Soil Carbon Sequestration to Mitigate Climate Change. Geoderma 2004, 123, 1–22. [Google Scholar] [CrossRef]
- Hillel, D. Water Entry into Soil. Introduction to Environmental Soil Physics 2003, 259–282. [Google Scholar] [CrossRef]
- USDA USDA Plant Hardiness Zone Map. Available online: https://planthardiness.ars.usda.gov/pages/how-to-use-the-maps (accessed on 13 June 2024).
- Barros, V.R.; Field, C.B.; Dokken, D.J.; Mastrandrea, M.D.; Mach, K.J.; Bilir, T.E.; Chatterjee, M.; Ebi, K.L.; Estrada, Y.O.; Genova, R.C.; et al. Climate Change 2014 – Impacts, Adaptation and Vulnerability: Part B: Regional Aspects: Working Group II Contribution to the IPCC Fifth Assessment Report. Climate Change 2014: Impacts, Adaptation and Vulnerability: Part B: Regional Aspects: Working Group II Contribution to the Fifth Assessment Report of the Intergovernmental Panel on Climate Change; 2014; pp. 1–1820. [Google Scholar] [CrossRef]
- Tahat, M.M.; Alananbeh, K.M.; Othman, Y.A.; Leskovar, D.I. Soil Health and Sustainable Agriculture. Sustainability 2020, 12. [Google Scholar] [CrossRef]
- Davis, A.G.; Huggins, D.R.; Reganold, J.P. Linking Soil Health and Ecological Resilience to Achieve Agricultural Sustainability. Front Ecol Environ 2023, 21, 131–139. [Google Scholar] [CrossRef]
- Balasubramani, K. Assessment of Watershed Resources for Sustainable Agricultural Development: A Case of Developing an Operational Methodology Under Indian Conditions Through Geospatial Technologies. The International Archives of the Photogrammetry, Remote Sensing and Spatial Information Sciences 2020, XLII-3-W11, 9–13. [Google Scholar] [CrossRef]
- Banwart, S.; Black, H.; Cai, Z.; Gicheru, P.; Joosten, H.; Victoria, R.; Milne, E.; Noellemeyer, E.; Pascual, U.; Nziguheba, G.; et al. Benefits of Soil Carbon: Report on the Outcomes of an International Scientific Committee on Problems of the Environment Rapid Assessment Workshop. Carbon Manag 2014, 5, 185–192. [Google Scholar] [CrossRef]
- Smith, P.; Bustamante, M.; Ahammad, H.; Clark, H.; Dong, H.; Elsiddig, E.; Haberl, H.; Harper, R.; House, J.; Jafari, M.; et al. Agriculture, Forestry and Other Land Use (AFOLU). In Climate Change 2014: Mitigation of Climate Change; 2014; pp. 811–922. [Google Scholar] [CrossRef]
- Basu, B. Development of Soil and Land Cover Databases for Use in the Soil Water Assessment Tool from Irish National Soil Maps and CORINE Land Cover Maps for Ireland. 2021. [Google Scholar] [CrossRef]
- Khalil, M.I.; Osborne, B.A. Improving Estimates of Soil Organic Carbon (SOC) Stocks and Their Long-Term Temporal Changes in Agricultural Soils in Ireland. Geoderma 2018, 322, 172–183. [Google Scholar] [CrossRef]
- Khalil, M.I.; Kiely, G.; O’Brien, P.; Müller, C. Organic Carbon Stocks in Agricultural Soils in Ireland Using Combined Empirical and GIS Approaches. Geoderma 2013, 193–194, 222–235. [Google Scholar] [CrossRef]
- Trinh, T.; Kavvas, M.L.; Ishida, K.; Ercan, A.; Chen, Z.Q.; Anderson, M.L.; Ho, C.; Nguyen, T. Integrating Global Land-Cover and Soil Datasets to Update Saturated Hydraulic Conductivity Parameterization in Hydrologic Modeling. Science of The Total Environment 2018, 631–632, 279–288. [Google Scholar] [CrossRef] [PubMed]
- Luzio, M.; Arnold, J.; Srinivasan, R. Integration of SSURGO Maps and Soil Parameters within a Geographic Information System and Nonpoint Source Pollution Model System. J Soil Water Conserv 2004. [Google Scholar] [CrossRef]
- White, I.R.; Royston, P.; Wood, A.M. Multiple Imputation Using Chained Equations: Issues and Guidance for Practice. Stat Med 2011, 30, 377–399. [Google Scholar] [CrossRef]
- Azur, M.J.; Stuart, E.A.; Frangakis, C.; Leaf, P.J. Multiple Imputation by Chained Equations: What Is It and How Does It Work? Int J Methods Psychiatr Res 2011, 20, 40–49. [Google Scholar] [CrossRef] [PubMed]
- Khalil, M.I.; Collier, R.; Barry, A.; Khalil, M.I. Stakeholder Perspectives on Irish Agri-Environmental Measures and HOLOS-IE Digital Platform Development. 2025. [Google Scholar] [CrossRef]
- Khalil, M.I.; Sen, B.; Siddque, M.; Chatzichristou, T.; McPherson, A.; Rakin, S.; Herron, J.; Kröbel, R.; Osborne, B.; Collier, R. HOLOS-IE: A System Model for Assessing Carbon Emissions and Balance in Agricultural Systems. Copernicus Meetings 2025. [Google Scholar] [CrossRef]
- Binner, H.; Andrade, L.; McNamara, M.E. Assessing Synergies between Soil Research in the Republic of Ireland and European Union Policies. Environmental Challenges 2024, 15, 100881. [Google Scholar] [CrossRef]
- Markdown/Access_on_gee.Md · Master · ISRIC / SoilGrids / Soilgrids.Notebooks · GitLab Available online:. Available online: https://git.wur.nl/isric/soilgrids/soilgrids.notebooks/-/blob/master/markdown/access_on_gee.md (accessed on 27 June 2025).
- Poggio, L.; De Sousa, L.M.; Batjes, N.H.; Heuvelink, G.B.M.; Kempen, B.; Ribeiro, E.; Rossiter, D. SoilGrids 2.0: Producing Soil Information for the Globe with Quantified Spatial Uncertainty. SOIL 2021, 7, 217–240. [Google Scholar] [CrossRef]
- Turek, M.E.; Poggio, L.; Batjes, N.H.; Armindo, R.A.; de Jong van Lier, Q.; de Sousa, L.; Heuvelink, G.B.M. Global Mapping of Volumetric Water Retention at 100, 330 and 15 000 Cm Suction Using the WoSIS Database. International Soil and Water Conservation Research 2023, 11, 225–239. [Google Scholar] [CrossRef]
- Fay, Dr.D.; Zhang, Dr.C. Towards a National Soil Database Available online:. Available online: https://eparesearch.epa.ie/safer/resource?id=c265bb3f-2cec-102a-b1da-b128b41032cc (accessed on 22 June 2025).
- Small Areas Generalised 50m - National Statistical Boundaries - 2015 | Surveying Open Data Portal Available online:. Available online: https://data-osi.opendata.arcgis.com/datasets/osi::small-areas-generalised-50m-national-statistical-boundaries-2015/about (accessed on 26 June 2025).
- Land Parcel Identification System Land Parcel Data - Dataset - PSB Data Catalogue Available online:. Available online: https://datacatalogue.gov.ie/dataset/land-parcel-identification-system-land-parcel-data (accessed on 26 June 2025).
- FAO 6. Available online: https://www.fao.org/fishery/docs/CDrom/FAO_Training/FAO_Training/General/x6706e/x6706e06.htm (accessed on 13 June 2024).
- Brogowski, Z.; Kwasowski, W.; Madyniak, R. Calculating Particle Density, Bulk Density, and Total Porosity of Soil Based on Its Texture. Soil Science Annual 2014, 65. [Google Scholar] [CrossRef]
- Jayasundara, S. What’s an Easy Way to Measure WFPS of Arable Soil? 2016.
- Bean, E.Z.; Huffaker, R.G.; Migliaccio, K.W. Estimating Field Capacity from Volumetric Soil Water Content Time Series Using Automated Processing Algorithms. Vadose Zone Journal 2018, 17, 180073. [Google Scholar] [CrossRef]
- Feeney, C.J.; Bentley, L.; De Rosa, D.; Panagos, P.; Emmett, B.A.; Thomas, A.; Robinson, D.A. Benchmarking Soil Organic Carbon (SOC) Concentration Provides More Robust Soil Health Assessment than the SOC/Clay Ratio at European Scale. Science of the Total Environment 2024, 951. [Google Scholar] [CrossRef] [PubMed]
- Teagasc Irish Soil Information System. Teagasc Research Soil Special 2014.
- Riaz, M.; Marschner, P. Sandy Soil Amended with Clay Soil: Effect of Clay Soil Properties on Soil Respiration, Microbial Biomass, and Water Extractable Organic C. J Soil Sci Plant Nutr 2020, 20, 2465–2470. [Google Scholar] [CrossRef]
- Žurovec, O.; Wall, D.P.; Brennan, F.P.; Krol, D.J.; Forrestal, P.J.; Richards, K.G. Increasing Soil PH Reduces Fertiliser Derived N2O Emissions in Intensively Managed Temperate Grassland. Agric Ecosyst Environ 2021, 311. [Google Scholar] [CrossRef]
- Teagasc Soil PH & Lime; 2016; Vol. 2;
- Brogan, J.; Crowe, M.; Carty, M.G. Towards Setting Environmental Quality Objectives for Soil Developing: A Soil Protection Strategy for Ireland. Environmental Protection Agency, Ireland.
- Schwyter, A.R.; Vaughan, K.L. 5.2: Bulk Density, Porosity, Particle Density of Soil. In Intro to Soil Science Laboratory Manual; University of Wyoming, 2020.
- Eaton, J.M.; McGoff, N.M.; Byrne, K.A.; Leahy, P.; Kiely, G. Land Cover Change and Soil Organic Carbon Stocks in the Republic of Ireland 1851-2000. Clim Change 2008, 91, 317–334. [Google Scholar] [CrossRef]
- Awan, S. Irish Soil Data Analysis 2023-2024 Part 2: Phosphorus; 2025. [Google Scholar]
- Kirkham, M.B. Field Capacity, Wilting Point, Available Water, and the Non-Limiting Water Range. Principles of Soil and Plant Water Relations 2005, 101–115. [Google Scholar] [CrossRef]
- USDA; NRCS Soil Health – Bulk Density/Moisture/Aeration. United States Department of Agriculture, Natural Resources Conservation Service (USDA NRCS), 2019.
- USDA; NRCS Soil Health - Respiration. United States Department of Agriculture, Natural Resources Conservation Service (USDA NRCS), 2014.
- Hintze, J.L.; Nelson, R.D. Violin Plots: A Box Plot-Density Trace Synergism. American Statistician 1998, 52, 181–184. [Google Scholar] [CrossRef]
- Joshi, K. Understanding Soil Texture: Methods and Importance; 2025. [Google Scholar]
- Kiely, G.; Leahy, P.; Lewis, L.; Xu, X.; Sottocornola, M. SoilC - Feasibility of Grassland Soil Carbon Survey 2017.
- Jarmain, C.; Cummins, T.; Jovani-Sancho, A.J.; Nairn, T.; Premrov, A.; Reidy, B.; Renou-Wilson, F.; Tobin, B.; Walz, K.; Wilson, D.; et al. Soil Organic Carbon Stocks by Soil Group for Afforested Soils in Ireland. Geoderma Regional 2023, 32, e00615. [Google Scholar] [CrossRef]
- O’Sullivan, L.; Bampa, F.; Knights, K.; Creamer, R.E. Soil Protection for a Sustainable Future: Options for a Soil Monitoring Network for Ireland. Soil Use Manag 2017, 33, 346–363. [Google Scholar] [CrossRef]
- Tuohy, P.; Fenton, O.; O’Loughlin, J.; Humphreys, J. Land Drainage - A Farmer’s Practical Guide to Draining Grassland in Ireland. 2013.
- Henry, J.; Aherne, J. Nitrogen Deposition and Exceedance of Critical Loads for Nutrient Nitrogen in Irish Grasslands. Science of The Total Environment 2014, 470–471, 216–223. [Google Scholar] [CrossRef] [PubMed]
- Daly, Karen.; Fealy, R. In Digital Soil Information System for Ireland – Scoping Study; Environmental Protection Agency, 2007.
- Creamer, R.E.; Simo, I.; O’sullivan, L.; Reidy, B.; Schulte, R.P.O.; Fealy, R.M. Irish Soil Information System: Soil Property Maps. In Environmental Protection Agency, Ireland; 2016. [Google Scholar]
- Tomlinson, R.W. Soil Carbon Stocks and Changes in the Republic of Ireland. J Environ Manage 2005, 76, 77–93. [Google Scholar] [CrossRef] [PubMed]
- Soil Carbon. Environmental information systems 2022.
- Tuohy, P.; O’Sullivan, L.; Fenton, O. Field Scale Estimates of Soil Carbon Stocks on Ten Heavy Textured Farms across Ireland. J Environ Manage 2021, 281, 111903. [Google Scholar] [CrossRef] [PubMed]
- Poeplau, C.; Don, A. A Simple Soil Organic Carbon Level Metric beyond the Organic Carbon-to-Clay Ratio. Soil Use Manag 2023, 39, 1057–1067. [Google Scholar] [CrossRef]
- Drexler, S.; Broll, G.; Flessa, H.; Don, A. Benchmarking Soil Organic Carbon to Support Agricultural Carbon Management: A German Case Study#. Journal of Plant Nutrition and Soil Science 2022, 185, 427–440. [Google Scholar] [CrossRef]
- Hussain, Z.; Deng, L.; Wang, X.; Cui, R.; Liu, G. A Review of Farmland Soil Health Assessment Methods: Current Status and a Novel Approach. Sustainability (Switzerland) 2022, 14, 9300. [Google Scholar] [CrossRef]
- Kröbel, R.; Bolinder, M.A.; Janzen, H.H.; Little, S.M.; Vandenbygaart, A.J.; Kätterer, T. Canadian Farm-Level Soil Carbon Change Assessment by Merging the Greenhouse Gas Model Holos with the Introductory Carbon Balance Model (ICBM). Agric Syst 2016, 143, 76–85. [Google Scholar] [CrossRef]
Figure 1.
Methodological Framework.
Figure 2.
Violin plot analysis of soil property distributions across Irish counties: (a) clay content, (b) sand content, (c) pH, (d) bulk density, (e) soil organic carbon (SOC), (f) soil moisture, (g) water-filled pore space (WFPS), (h) total phosphorus (Total P), (i) total nitrogen (Total N), (j) soil porosity, (k) field capacity, and (l) wilting point. Note: County codes used in the plots are as follows: CW – Carlow, CN – Cavan, CE – Clare, CK – Cork, DL – Donegal, DN – Dublin, GY – Galway, KY – Kerry, KE – Kildare, KK – Kilkenny, LS – Laois, LM – Leitrim, LK – Limerick, LD – Longford, LH – Louth, MO – Mayo, MH – Meath, MN – Monaghan, OY – Offaly, RN – Roscommon, SO – Sligo, TY – Tipperary, WD – Waterford, WH – Westmeath, WX – Wexford, WW – Wicklow.
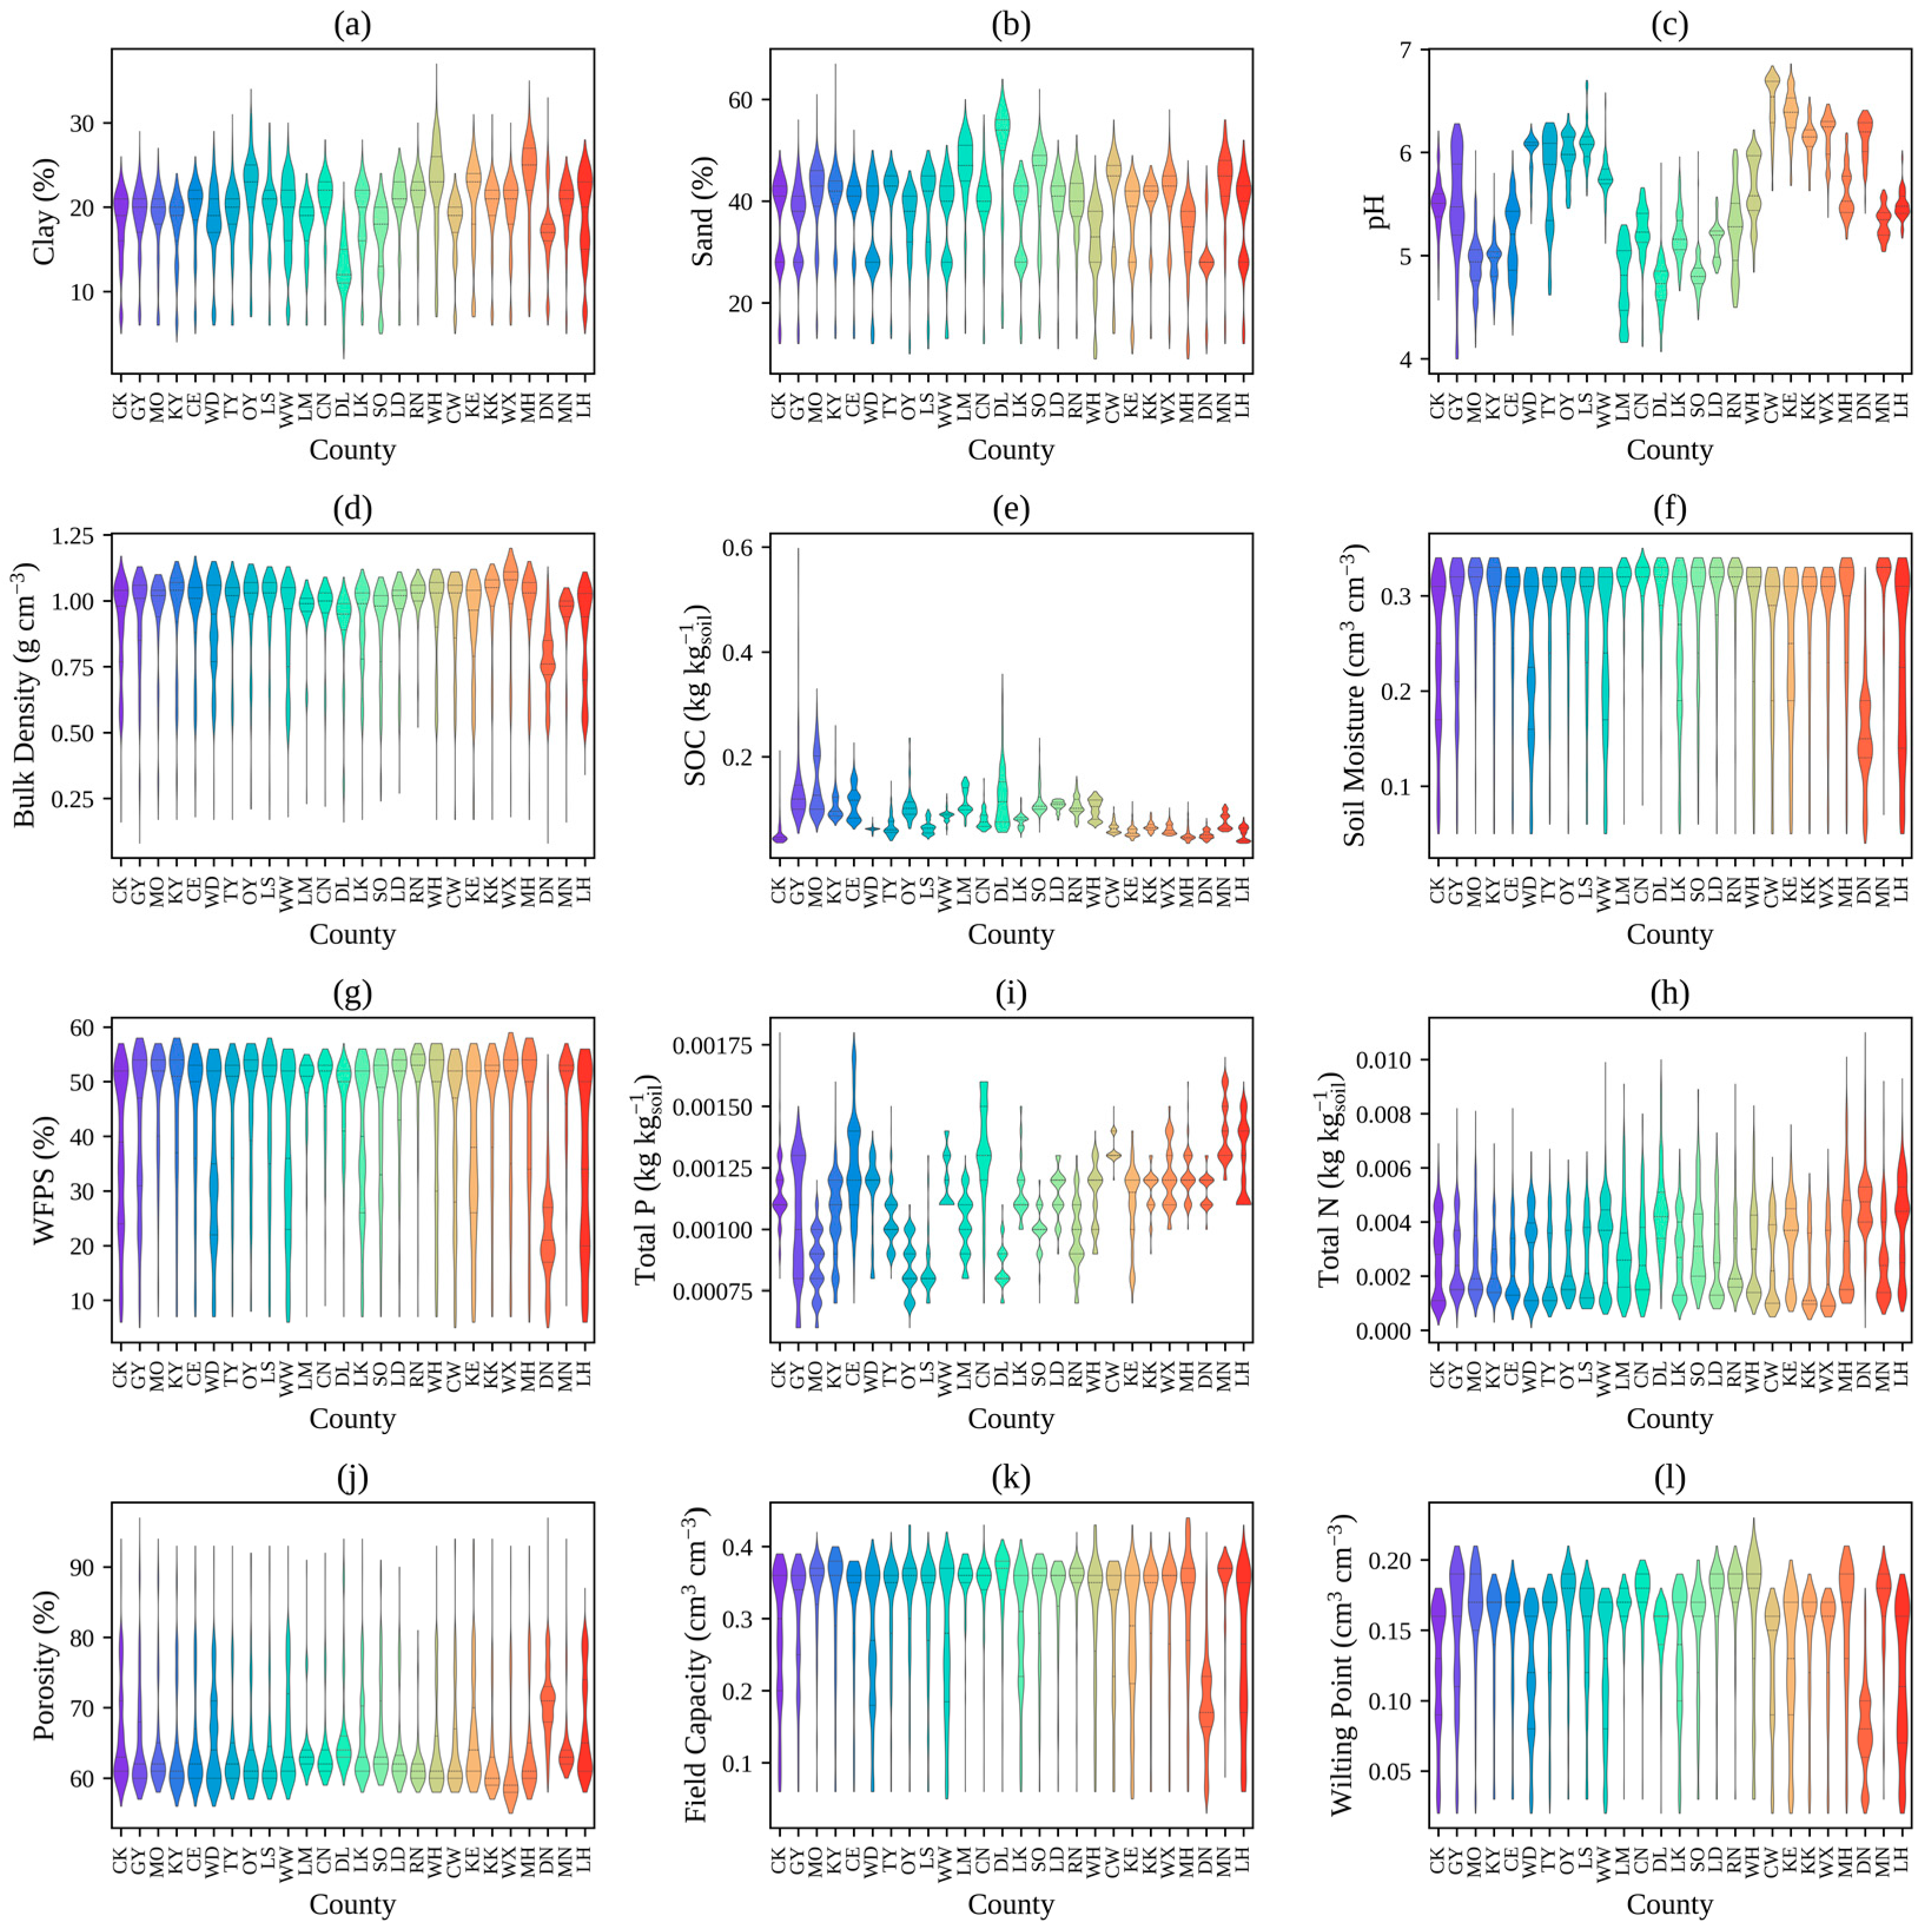
Figure 3.
These maps show the spatial distribution of (a) Observed/Typical Soil Organic Carbon (O/T SOC) Index and (b) Soil Health Quality of Ireland.
Figure 3.
These maps show the spatial distribution of (a) Observed/Typical Soil Organic Carbon (O/T SOC) Index and (b) Soil Health Quality of Ireland.
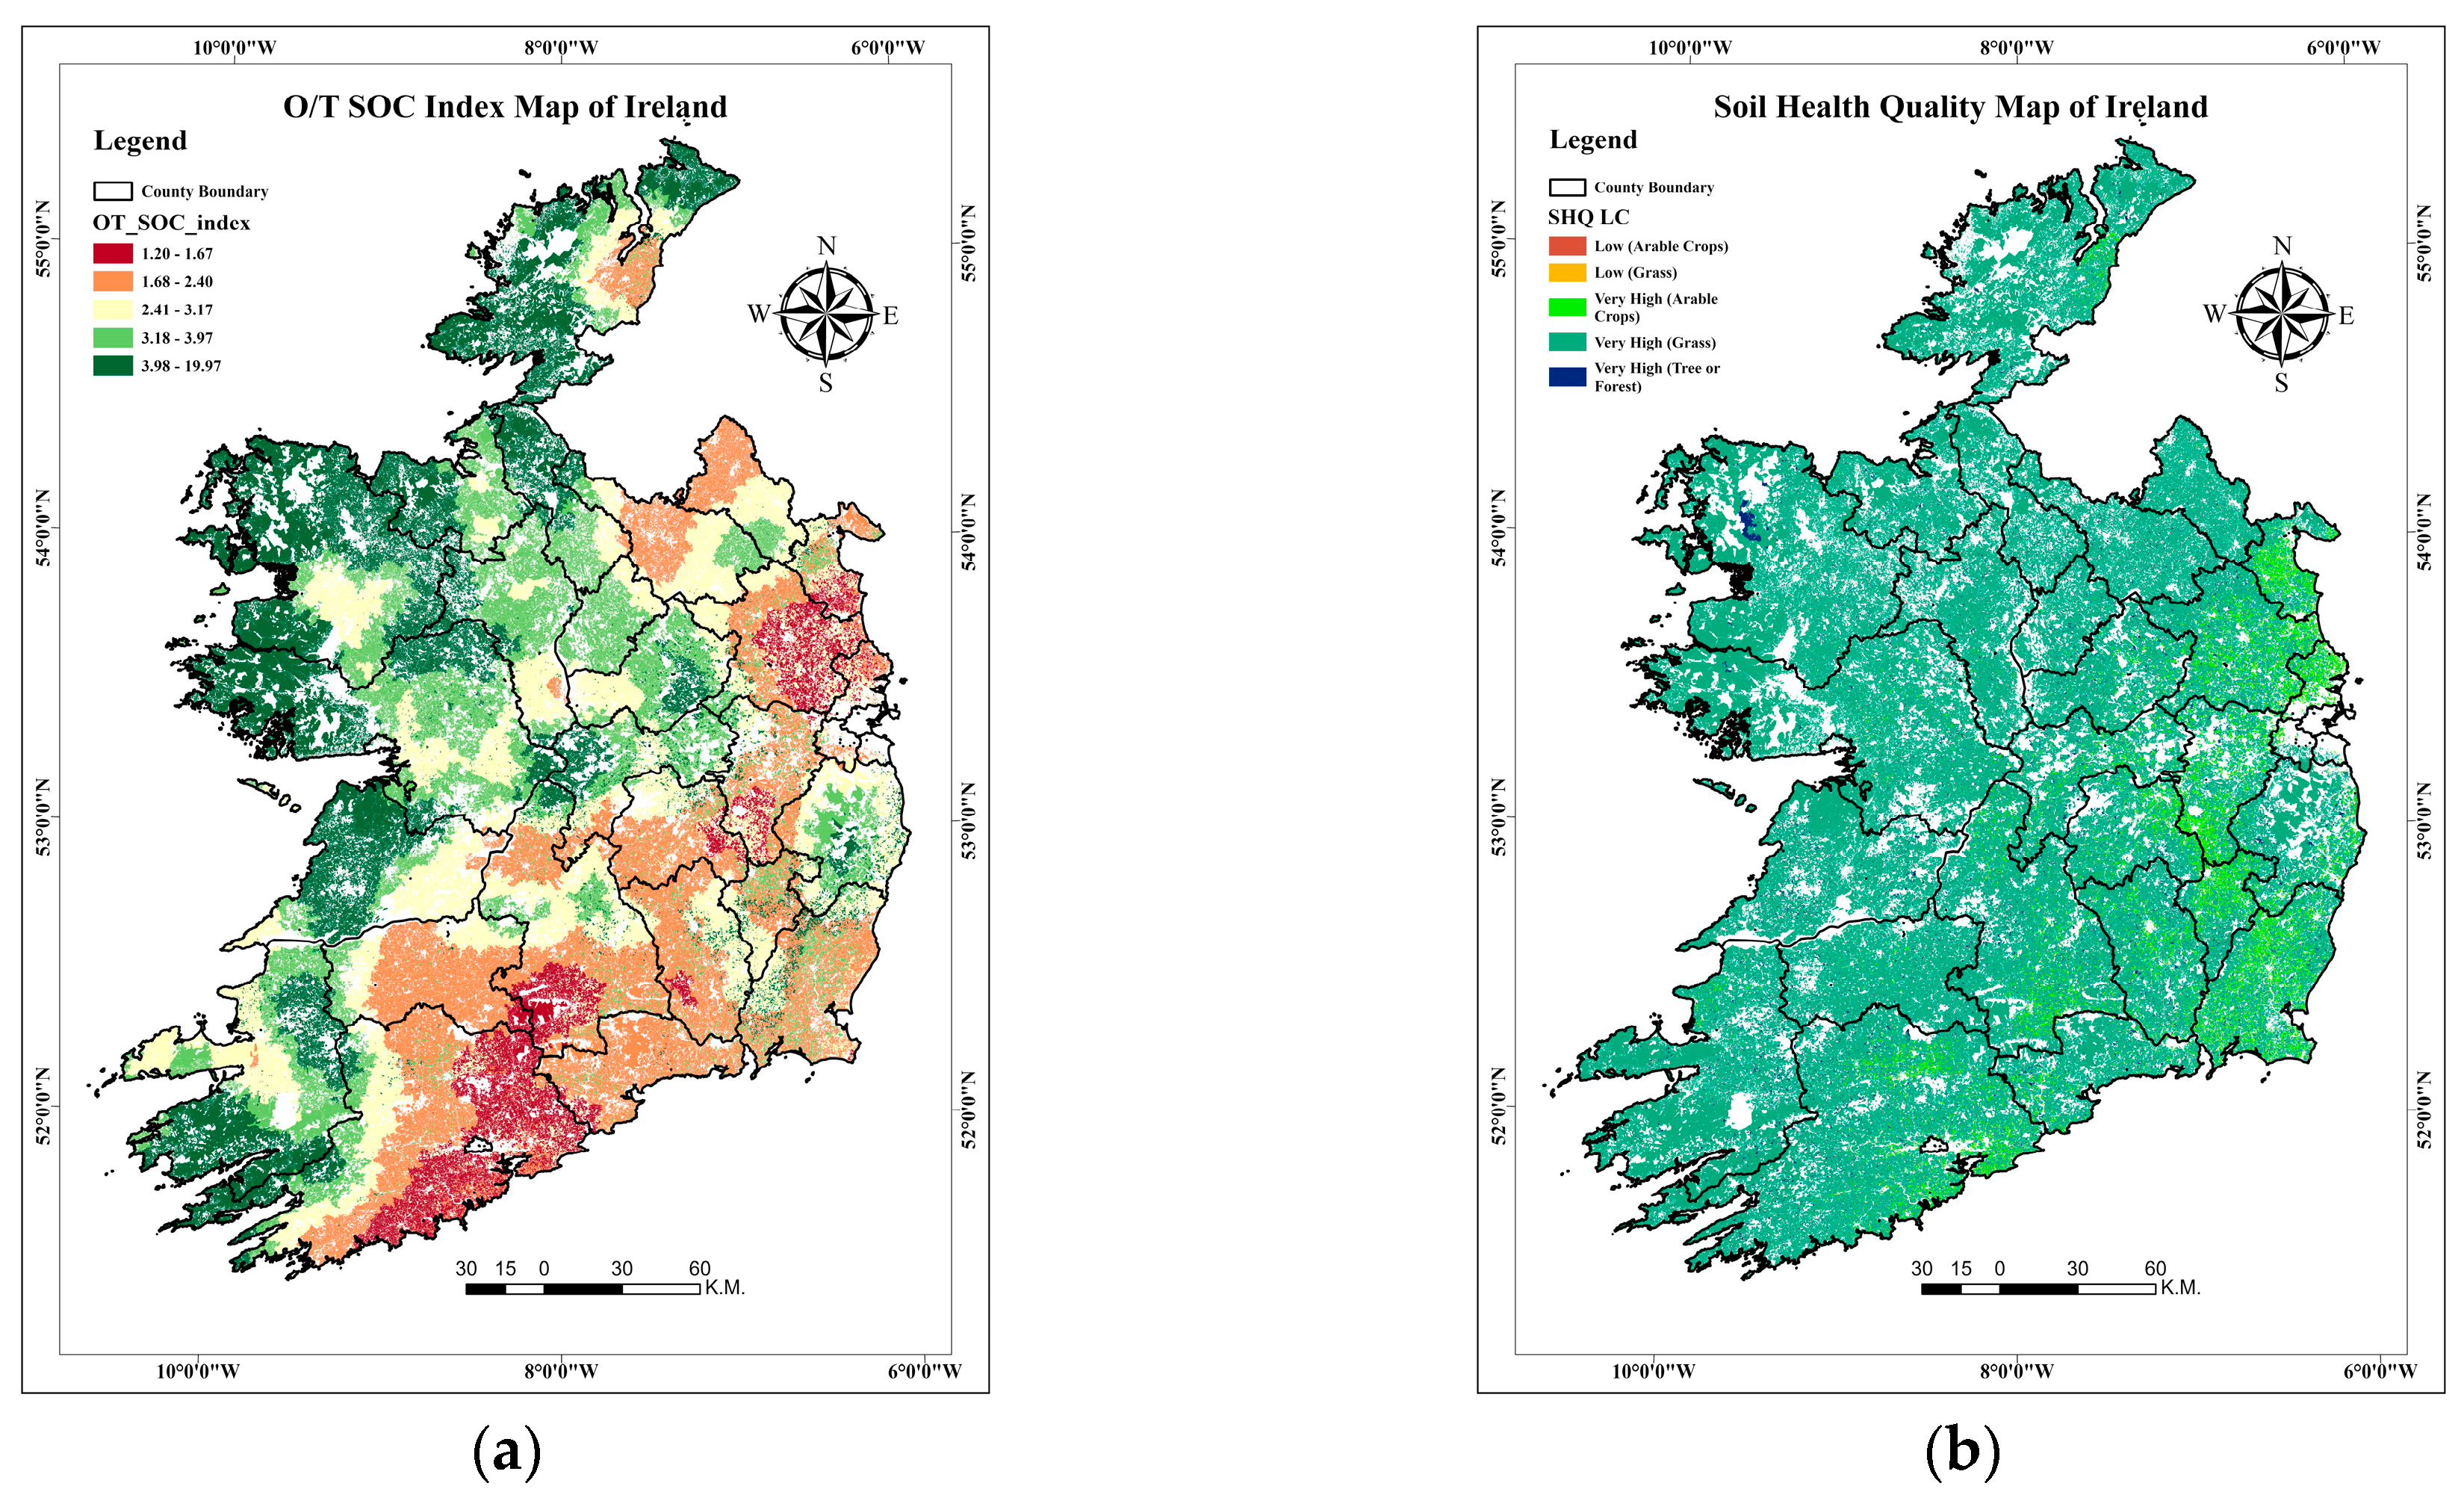
Figure 4.
Soil Data Interface in HOLOS-IE (a) Irish map developed for HOLOS-IE (b) Detailed regional input interface within HOLOS-IE.
Figure 4.
Soil Data Interface in HOLOS-IE (a) Irish map developed for HOLOS-IE (b) Detailed regional input interface within HOLOS-IE.
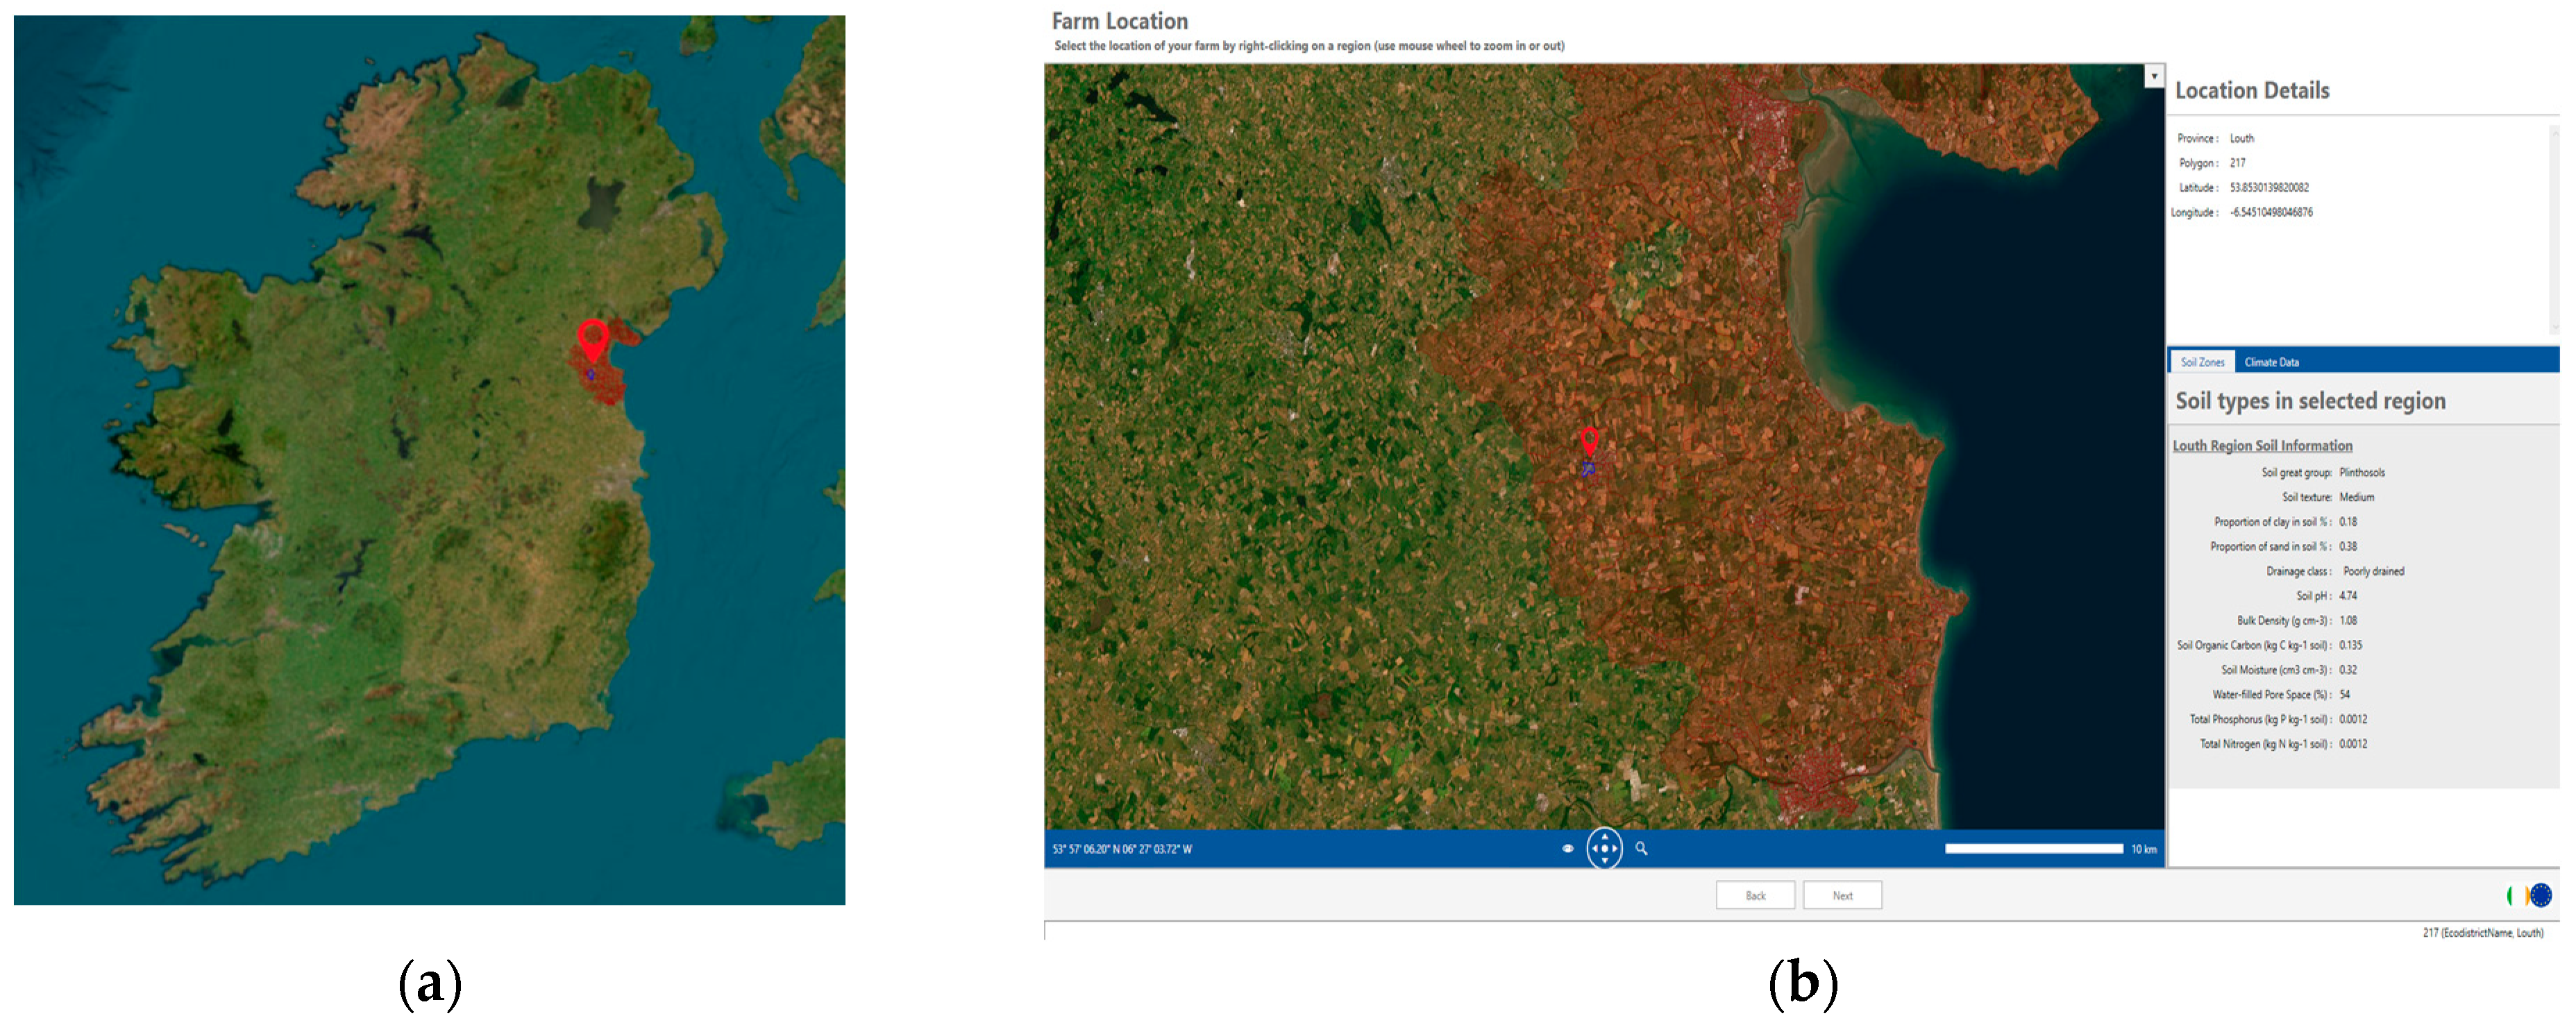

Table 1.
Summary Statistics of Key Soil Properties in the Republic of Ireland.
| Soil Parameter | mean | std | min | 25% | 50% | 75% | max |
|---|---|---|---|---|---|---|---|
| Clay (%) | 18.41 | 4.8574 | 2 | 16 | 19 | 22 | 37 |
| Sand (%) | 35.57 | 9.9011 | 9 | 28 | 39 | 43 | 67 |
| pH | 5.67 | 0.5535 | 4 | 5.26 | 5.74 | 6.16 | 6.86 |
| Bulk Density (g cm-3) | 0.88 | 0.1914 | 0.08 | 0.76 | 0.95 | 1.04 | 1.2 |
| SOC (kg kgSoil-1) | 0.08 | 0.0458 | 0.035 | 0.049 | 0.063 | 0.092 | 0.598 |
| Soil Moisture (cm3 cm-3) | 0.23 | 0.0859 | 0.04 | 0.16 | 0.25 | 0.32 | 0.35 |
| WFPS (%) | 36.50 | 15.4203 | 5 | 23 | 38 | 52 | 59 |
| Total P (kg kgSoil-1) | 0.00 | 0.0002 | 0.0006 | 0.001 | 0.0011 | 0.0012 | 0.0018 |
| Total N (kg kgsoil-1) | 0.00 | 0.0017 | 0.0001 | 0.0016 | 0.0036 | 0.0046 | 0.011 |
| Porosity (%) | 66.68 | 7.2250 | 55 | 61 | 64 | 71 | 97 |
| Field Capacity (cm3 cm-3) | 0.27 | 0.0990 | 0.03 | 0.18 | 0.29 | 0.36 | 0.44 |
| Wilting Point (cm3 cm-3) | 0.12 | 0.0503 | 0.02 | 0.08 | 0.13 | 0.17 | 0.23 |
Disclaimer/Publisher’s Note: The statements, opinions and data contained in all publications are solely those of the individual author(s) and contributor(s) and not of MDPI and/or the editor(s). MDPI and/or the editor(s) disclaim responsibility for any injury to people or property resulting from any ideas, methods, instructions or products referred to in the content. |
© 2025 by the authors. Licensee MDPI, Basel, Switzerland. This article is an open access article distributed under the terms and conditions of the Creative Commons Attribution (CC BY) license (http://creativecommons.org/licenses/by/4.0/).
Copyright: This open access article is published under a Creative Commons CC BY 4.0 license, which permit the free download, distribution, and reuse, provided that the author and preprint are cited in any reuse.


