
Submitted:
09 July 2025
Posted:
10 July 2025
You are already at the latest version
Abstract
This study investigates the concentrations and spatial distribution of heavy metals in atmospheric particulate matter (PM2.5 and PM10) in Santo Domingo, Dominican Republic, during 2022. A total of 30 air samples were collected across diverse urban environments using portable low-volume samplers. Elemental analysis was performed via energy-dispersive X-ray fluorescence (EDXRF) to quantify levels of As, Cd, Cr, Cu, Fe, Hg, Mn, Ni, Pb, V, and Zn. Due to a high proportion of left-censored values, regression on order statistics (ROS) was employed to impute data below detection limits. The highest mean concentrations in both PM fractions were observed for Cu and Zn, indicating significant anthropogenic contributions, while V and Fe displayed marked spatial variability. Principal component analysis (PCA) suggested potential source groupings linked to traffic and industrial emissions. This work provides critical baseline data for urban air quality management in the region and highlights the need for expanded environmental monitoring to mitigate health risks associated with airborne heavy metals.
Keywords:
particulate matter (PM2.5
; PM10)
; heavy metals
; air pollution
; energy-dispersive X-ray fluorescence (EDXRF)
; urban air quality
; censored data imputation
; principal component analysis (PCA)
; Santo Domingo
; environmental monitoring
; anthropogenic emissions
1. Introduction
Air pollution is a critical environmental and public health issue, particularly in urban areas where anthropogenic activities contribute to elevated levels of harmful pollutants [1,2,3,4,5,6,7,8,9,10,11,12,13,14,15,16]. Among these pollutants, particulate matter (PM) is of special concern due to its ability to carry various toxic substances, including heavy metals. PM comprises tiny solid particles and liquid aerosols containing acids, organic compounds, metals, and dust [17,18,19,20,21,22,23,24]. These particles originate from natural sources, such as wildfires, volcanic activity, and Saharan dust transport, as well as human activities like industrial emissions, vehicle exhaust, and fossil fuel combustion.
Heavy metals are generally defined as elements with high atomic weight and a density at least five times greater than that of water. Metalloids, such as arsenic (As), exhibit characteristics intermediate between metals and non-metals and are often grouped with heavy metals due to similar toxicological behaviour [25]. Some heavy metals, including iron (Fe), copper (Cu), zinc (Zn), manganese (Mn), cobalt (Co), and nickel (Ni), are considered essential trace elements for biological functions, participating in enzymatic processes, redox reactions, and cellular signalling [26]. However, even essential metals can become toxic when present in elevated concentrations, while non-essential elements like cadmium (Cd), lead (Pb), mercury (Hg), vanadium (V), and arsenic (As) are toxic even at low levels [27].
Heavy metals such as As, Mn, Cu, Cd, Pb, Zn, Ni, V, and Co are frequently detected in particulate matter (PM), especially in its respirable fractions, PM2.5 and PM10. These elements can bind to fine and coarse particles and are released into the atmosphere through both anthropogenic sources—including metallurgy, combustion processes, vehicular traffic, waste incineration, and industrial activity—and natural events such as volcanic eruptions and wind-driven dust resuspension [28].
In the PM10 fraction, heavy metals are predominantly associated with coarser particles that tend to deposit in the upper respiratory tract. In contrast, PM2.5 represents a greater health hazard, as fine particles can penetrate deep into the alveolar regions of the lungs and enter the bloodstream, carrying toxic metals with them [29]. These metals are known not only for their capacity to bioaccumulate and contribute to respiratory and cardiovascular diseases, but also for their potential to induce genotoxic and cytotoxic effects [13,30]. Due to their greater surface area and reactivity, fine particles are especially efficient at penetrating biological barriers and triggering oxidative stress, DNA damage, inflammation, and apoptosis in human cells, particularly in pulmonary and epithelial tissues [25,31,32,33,34,35,36]. Beyond human health, heavy metals in PM can also impact terrestrial and aquatic ecosystems. Once deposited, these metals may accumulate in soils and sediments, become absorbed by vegetation, and enter the food chain, where they may biomagnify and affect biodiversity and ecological functions [37].
Urban areas in developing countries are especially vulnerable to air pollution, as rapid urbanization and industrialization often outpace environmental regulations [3,7,8,11,14,15,38,39]. The city of Santo Domingo, located in the National District on the south-central coast of the Dominican Republic, exemplifies these challenges. While the city’s diverse urban environments provide an opportunity to study the dynamics of air pollution, limited research has been conducted to investigate the concentrations and sources of heavy metals in PM [40,41,42,43].
The atmospheric deposition of heavy metals is influenced by various factors, including wind patterns, precipitation, and local emission sources. Understanding the concentrations and atmospheric fluxes of these metals is essential to assess their environmental and health impacts. Despite its importance, data on heavy metal concentrations in PM from Santo Domingo remain scarce, underscoring the need for targeted studies [40,41].
This study focuses on the analysis of heavy metal concentrations in PM2.5 and PM10 collected during a sampling campaign in Santo Domingo in 2022. The primary objectives are: (1) to evaluate the concentrations of As, Cd, Cr, Cu, Fe, Hg, Mn, Ni, Pb, V and Zn in PM fractions; (2) to assess imputation methods for left-censored values to extract meaningful conclusions about metal concentrations and their variability; and (3) to provide insights into the potential sources and environmental implications of heavy metal deposition in the region, as well as their distribution across sampling sites.
By providing a comprehensive analysis of heavy metal concentrations in PM, this research contributes to a deeper understanding of air pollution dynamics in Santo Domingo and offers a scientific basis for policy interventions aimed at mitigating environmental and public health risks.
2. Materials and Methods
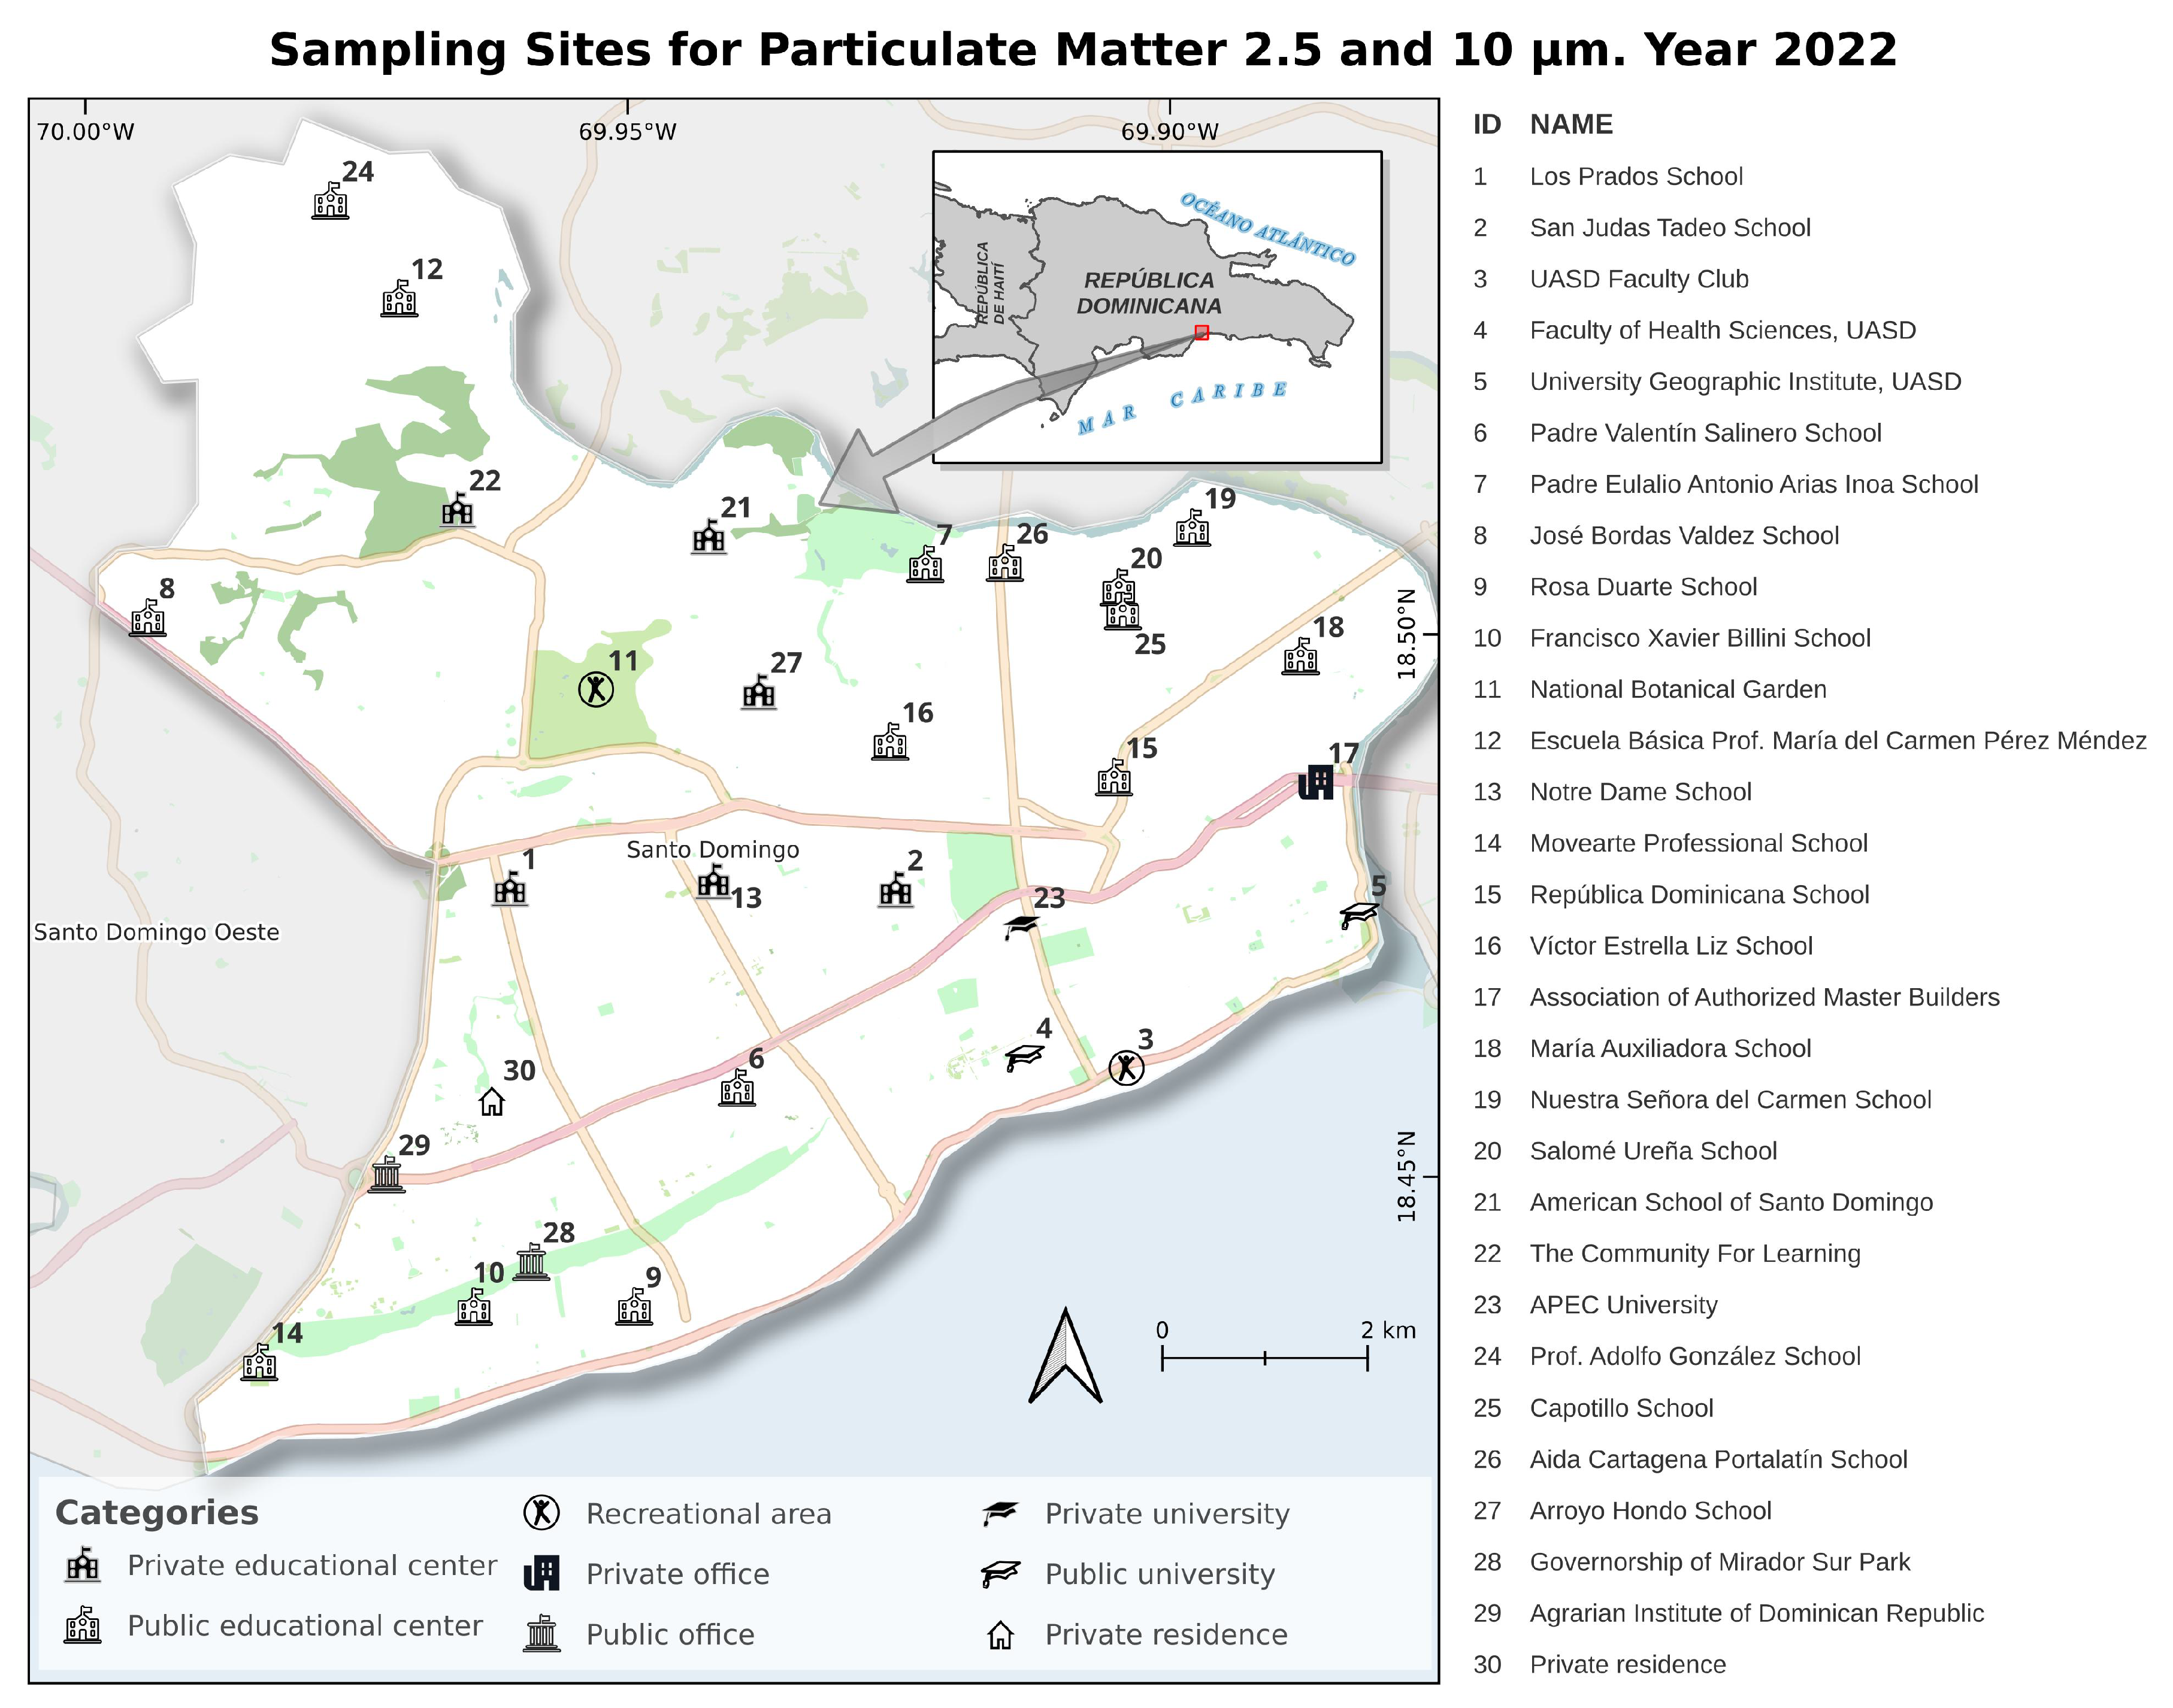
The study was carried out in Santo Domingo, National District, Dominican Republic (approx. ), covering a range of urban environments with different land uses (Figure 1). The sampling locations included public and private schools, a university campus, and a major urban park, following the initial site selection proposed by Caballero-González. A total of 30 air quality samples were collected between May and July 2022 for both PM2.5 and PM10, with one sample per site due to logistical and budgetary constraints. Although the measurements of PM mass concentrations (expressed in g/m3) are not presented in this study, they are available in the work of Matos-Espinosa et al..
This single-day-per-site design, adopted for feasibility reasons, inherently restricts the ability to assess intra-site temporal variability or capture seasonal trends, but it offers a practical approach for characterizing the spatial distribution of particulate matter over a broad urban area. Single-day measurements, when distributed systematically across representative sites within a narrow temporal window (May to July), can still provide meaningful spatial comparisons, especially when meteorological conditions remain relatively stable throughout the sampling period [44]. Furthermore, by ensuring that sampling activities occurred on consecutive or near-consecutive days during each week, the resulting dataset supports the computation of time-averaged indicators and minimizes potential biases introduced by sporadic or asynchronous sampling. Although this approach does not replace long-term monitoring, it aligns with widely used methods in resource-constrained settings and has been shown to yield valuable insights into spatial pollution patterns across urban environments [44].
Particulate matter was collected using MiniVolTM TAS Portable Air Samplers (AirMetrics Co., Eugene, OR, USA) [45,46]. These devices operate by drawing air through size-selective impactors to separate PM10 and PM2.5 fractions based on aerodynamic diameter, following the principle of inertial impaction. Gravimetric analysis was conducted using pre-weighed 47 mm PTFE (polytetrafluoroethylene) filters, chosen for their low hygroscopicity, chemical inertness, and stable mass under conditioning, which make them suitable for mass determination and subsequent chemical analysis. Each sampler was operated for 24 h at a nominal flow rate of 5.0 L/min (), with an estimated detection limit of 3–5 µg/m3 and a reported measurement accuracy within , assuming proper maintenance and calibration. The MiniVolTM samplers are limited to PM10 and PM2.5 and do not support high-frequency measurements or PM1 collection, restricting the analysis to these two common size fractions.
The devices were installed at a height of 1.5 to 3 m above ground level, either on flat rooftops or securely positioned at ground level, ensuring consistency across sites to allow for comparability. The sampling strategy followed a systematic layout, ensuring an approximate 2 km separation between sites. The final selection of specific sampling points, including educational and recreational areas, was refined using the nearest-neighbor approach, optimizing their placement based on predefined ideal locations determined through spatial analysis software.
Heavy metal concentrations in PM2.5 and PM10 were determined by energy-dispersive X-ray fluorescence spectrometry (EDXRF). Analyses were performed using a Skyray Instruments EDX3600B spectrometer equipped with a Si(Li) detector positioned at a angle relative to the Ag anode X-ray source. The excitation parameters were set at 40 kV and 600 A. Total concentrations of Fe, Mn, Cr, Cu, Ni, Zn, Pb, and As were quantified based on calibration curves obtained from certified Standard Reference Materials (SRMs). The quality of each calibration was assessed through the coefficient of determination (), which ranged from 0.990 to 0.999. Elemental intensities were processed using the proprietary Skyray Instruments software, provided by the manufacturer [47,48].
Although energy-dispersive X-ray fluorescence (EDXRF) has relatively high detection limits compared to more sensitive techniques such as ICP-MS, it was selected for this study due to several practical and scientific advantages. EDXRF is a non-destructive, cost-effective, and rapid analytical method that allows for the simultaneous quantification of multiple elements directly on filter media without the need for complex sample preparation. These features are particularly valuable in resource-constrained settings or large-scale environmental monitoring campaigns, where budget and time limitations must be balanced with data quality. Moreover, EDXRF provides sufficient accuracy and reproducibility for detecting moderate to high concentrations of metals commonly found in urban particulate matter. The dataset includes measurements of arsenic (As), cadmium (Cd), chromium (Cr), copper (Cu), iron (Fe), mercury (Hg), manganese (Mn), nickel (Ni), lead (Pb), vanadium (V), and zinc (Zn), with reported values in parts per million (ppm). Samples with metal concentrations below the instrument’s detection limit were treated as left-censored data. This limitation, which affected elements such as As, Mn, and Hg, was addressed through the application of robust statistical methods for censored data, enabling meaningful interpretation without compromising the integrity of the dataset.
Figure 1.
Sampling sites for particulate matter (PM2.5 and PM10) in the National District of Santo Domingo during 2022. Site names and classifications are shown in the list to the right. Geographic coordinates for each site are provided in Table A1 and Table A2.
All analyses were conducted using R statistical environment (Version 4.4.0) [49], using a combination of packages, including tidyverse for data wrangling, gstat and automap for spatial interpolation of metal concentrations, NADA for censored data imputation, pcaMethods for PCA, and ggplot2 for visualization [50,51,52,53,54,55,56]. The complete workflow was implemented in an R Markdown document for reproducibility.
Initial data exploration included calculating summary statistics and correlation analyses among heavy metal concentrations in PM2.5 and PM10 (Table A1 and Table A2). However, due to a high proportion of left-censored values in several metals, correlation analyses were not used for further interpretation.
Summary statistics were computed before and after imputation to assess the central tendency and variability of metal concentrations. Metals with more than 50% left-censored values were excluded from the imputation process, following best practices in environmental data analysis [57].
To visualize the spatial distribution of heavy metals in PM2.5 and PM10, we applied geostatistical interpolation using ordinary kriging [58,59,60,61]. Only those metals with at least 50% valid observations were included in the analysis. The monitoring sites were converted into an sf object in R and reprojected to UTM Zone 19N (EPSG:32619) [62,63]. A regular interpolation grid was created with a resolution of 50 meters, extending the bounding box of the monitoring points by 2 kilometers to reduce edge effects.
The automap R package was used to automatically fit variogram models (spherical or exponential) based on the smallest residual sum of squares with respect to the sample variogram, and perform kriging for each metal independently [53,58,59,60,61]. Interpolated values were transformed into a raster and then used to generate filled contour levels and smoothed isolines. The individual maps for each metal were assembled into a single panel using the ggplot2 and patchwork R packages [64,65]. The shaded polygon in the background of each map represents the official administrative boundary of the National District of Santo Domingo.
The instrumental detection limits (IDLs) for heavy metals in PM2.5 and PM10 were determined following established protocols for X-ray fluorescence spectrometry [66,67] as well as using empirical laboratory measurements. The IDLs were derived from multiple measurements of certified reference materials (CRMs), specifically SRM-NIST-IAEA samples, analyzed under the same conditions as the field samples. The detection limit for each metal was established based on the lowest concentration that could be reliably distinguished from background noise, considering the variability across multiple replicates [68]. The IDLs values for elements such as Al, Si, P, S, Mn, Fe, Ni, Cu, Zn, As, Br, Sr, Cd, and Pb were compiled in an accompanying reference table, ensuring consistency in the reporting of metal concentrations [69,70]. Values below these detection limits were treated as left-censored and were subsequently handled using statistical imputation methods where appropriate [57].
For metals with less than 50% of measurements below detection limits, imputation was performed using regression on order statistics (ROS) implemented in the NADA package in R statistical environment [55]. The ROS method estimates censored values based on the empirical distribution of detected values, providing a statistically sound approach for handling non-detects while avoiding strong parametric assumptions [57].
Importantly, imputed values were only used for global descriptive statistics and not for multivariate analyses, such as principal component analysis (PCA), where preserving the original data structure was required.
PCA was applied separately to PM2.5 and PM10 metal concentrations to explore their distribution across sampling sites and identify potential sources. Only metals with sufficient observations (i.e., limited missing values) were included in the PCA. The final selection of metals for PCA was based on the presence of complete cases across sites, ensuring the robustness of the analysis. The PCA was performed using the pca function from the pcaMethods package in R, employing the non-linear iterative partial least squares (NIPALS) algorithm [71,72]. This method is particularly suitable for datasets with missing values, as it iteratively estimates principal components while handling incomplete data without requiring listwise deletion. The input dataset was standardized (mean-centered and scaled to unit variance) before PCA computation.
The results were visualized using biplots to examine the relationships between metals and sampling sites. The biplots were generated using ggplot2, with individual observations plotted in the principal component space and metal loadings represented as vectors scaled for interpretability. The explained variance of each principal component was assessed to determine the number of meaningful components.
Although detailed external datasets such as traffic counts or land-use inventories were not available for integration in this study, the interpretation of principal components was informed by established metal source profiles and contextual knowledge of the urban environment. Metals such as Cu, Zn, and Pb, which loaded heavily on the first component, are commonly associated with vehicular emissions and mechanical wear, while Fe and V suggest contributions from industrial activities or resuspended soil. Future research will aim to incorporate high-resolution auxiliary data, including traffic density, industrial zoning, and meteorological parameters, to further refine source attribution and strengthen causal inferences.
While the toxicological relevance of heavy metals in particulate matter is well established, this study did not include a formal health risk assessment or estimates of population exposure due to the unavailability of local epidemiological and health outcome data. Our primary objective was to establish a baseline of metal concentrations across urban sites, which is a necessary first step toward future risk-based evaluations. The spatial patterns and concentration levels reported here can serve as input for subsequent studies focused on health impact modelling, particularly those incorporating population vulnerability, exposure duration, and toxicological benchmarks. We recognize the importance of such analyses and recommend them as a critical next step in advancing air quality management in the region.
3. Results
After applying regression on order statistics (ROS) to impute left-censored values, descriptive statistics for metal concentrations in PM2.5 were obtained. Manganese (Mn) and Mercury (Hg) were excluded from the imputation process since more than 50% of their values were censored, making reliable estimation unfeasible. The results indicate substantial variability among metals, with mean concentrations ranging from 2.48 ppm for As to 21.89 ppm for Cu (Table 1). Among the analyzed elements, Cu and Zn exhibited the highest median values (22.00 ppm and 19.80 ppm, respectively), whereas As and Cd had the lowest medians (2.40 ppm and 2.50 ppm, respectively). The standard deviation values reveal notable dispersion, particularly for V (9.18 ppm) and Fe (6.10 ppm), indicating significant variability across the sampling sites. Additionally, the standard error values, which provide an estimate of uncertainty in the mean concentrations, were lowest for Zn (0.16 ppm) and highest for V (1.68 ppm), suggesting more stable concentration estimates for Zn compared to highly variable metals like V.
The proportion of censored values varied across metals, with the highest number observed for V (15 censored values) and Fe (14 censored values), while Cu and Zn had no censored values. This suggests that certain metals frequently fell below the instrumental detection limits, requiring imputation to obtain meaningful statistical summaries. The highest recorded metal concentration was 36.9 ppm for V, while the lowest detected value was 0.58 ppm for Cd. Figure 4 illustrates the mean concentrations along with their standard errors, highlighting the metals with greater measurement uncertainty. The error bars emphasize the variation in concentration levels across sites, with Fe and V showing the most considerable spread, reinforcing their observed variability in the dataset.
The analysis of metal concentrations in PM10 revealed differences in both the magnitude and variability of detected levels. Copper (Cu) and Zinc (Zn) exhibited the highest mean concentrations, with values of 21.15 ppm and 20.14 ppm, respectively, while Cadmium (Cd) and Chromium (Cr) showed the lowest means at 3.79 ppm and 3.89 ppm. Vanadium (V), despite having a relatively moderate mean concentration (8.61 ppm), displayed the highest observed value among all metals (43.6 ppm), suggesting a highly skewed distribution. Similarly, Iron (Fe) exhibited substantial variability, with concentrations ranging from 3.41 ppm to 28.4 ppm. It is important to note that Manganese (Mn), Mercury (Hg), and Arsenic (As) were excluded from imputation due to excessive censoring, as more than 50% of their values were below detection limits, making statistical estimation unreliable. The variability in concentrations is further illustrated in Table 2.
Figure 2.
Spatial interpolation of metal concentrations (ppm) in PM2.5 particles across the study area using ordinary kriging. Each panel corresponds to a different metal: As, Cd, Cr, Cu, Fe, Ni, Pb, V, and Zn. Filled contour maps show estimated concentration gradients, with isolines indicating interpolated concentration levels. The shaded polygon in the background represents the boundary of the Distrito Nacional of Santo Domingo. Scale bars and north arrows are provided for spatial reference.
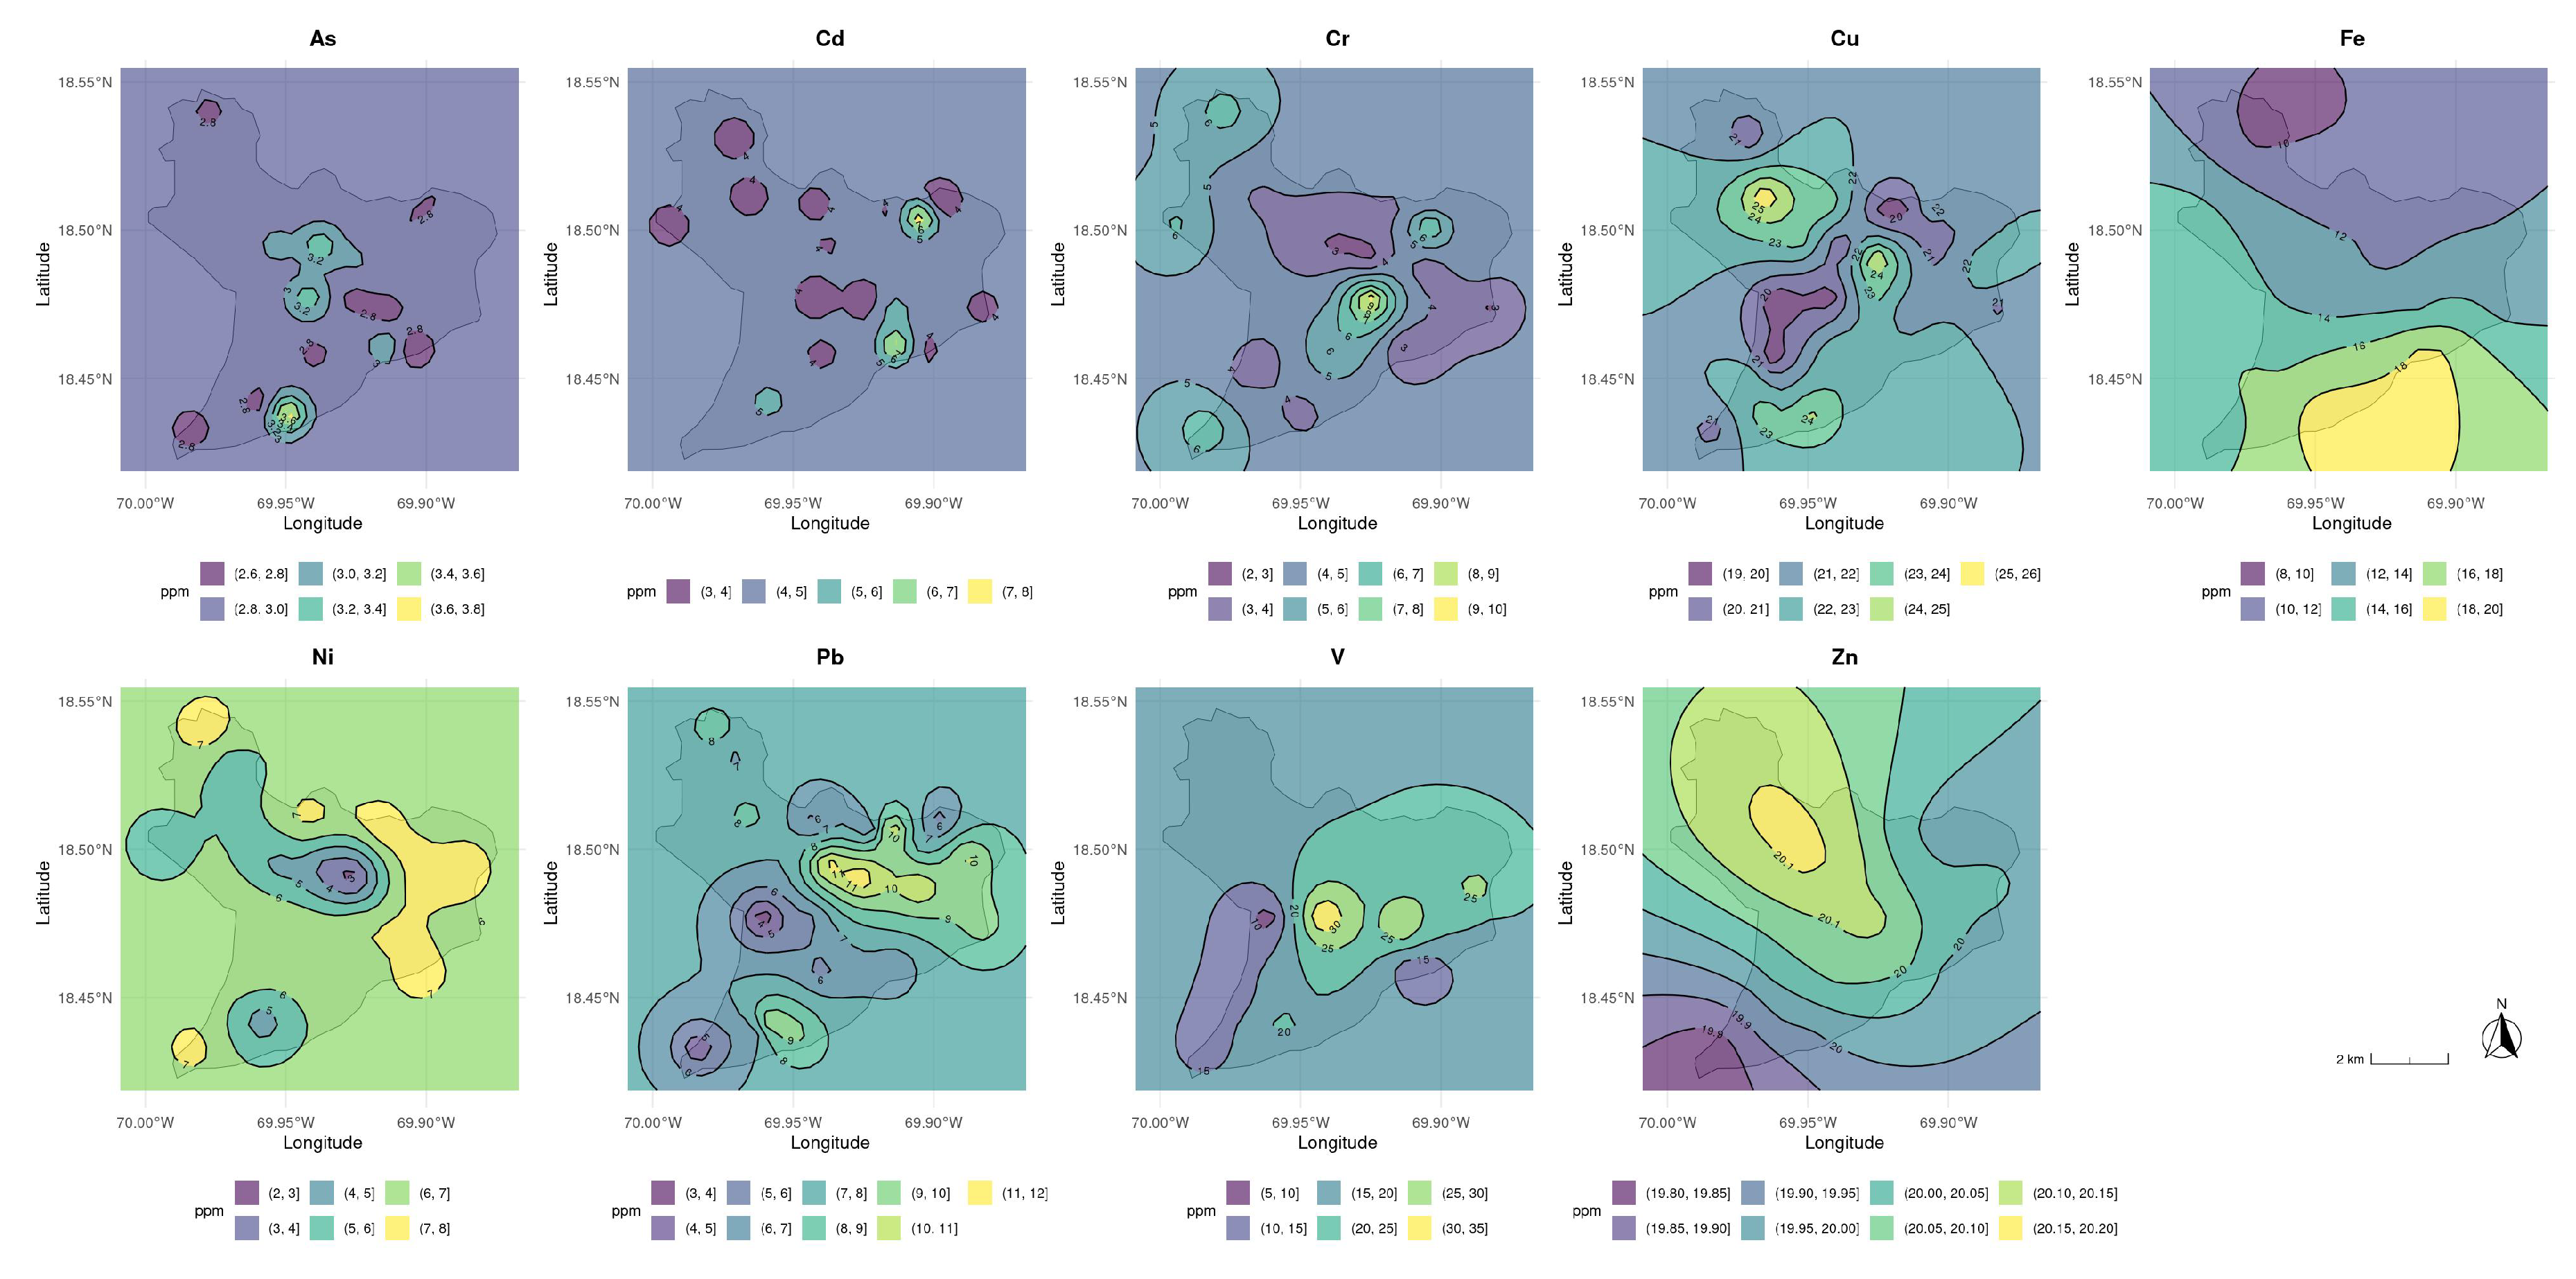
When considering the uncertainty associated with these estimations, the standard error values indicate that Zn had the most stable concentration estimates (0.13 ppm), whereas V had the highest level of uncertainty (1.88 ppm), reflecting its large dispersion. The extent of censored values also varied significantly among metals, with Fe (19 censored values) and V (16 censored values) being the most affected. In contrast, Cu, Zn, and Ni had no censored values, implying that their concentrations consistently exceeded detection limits. The graphical representation in Figure 5 highlights the differences in concentration variability across metals, emphasizing the higher dispersion in V and Fe, which suggests spatial heterogeneity in their deposition patterns.
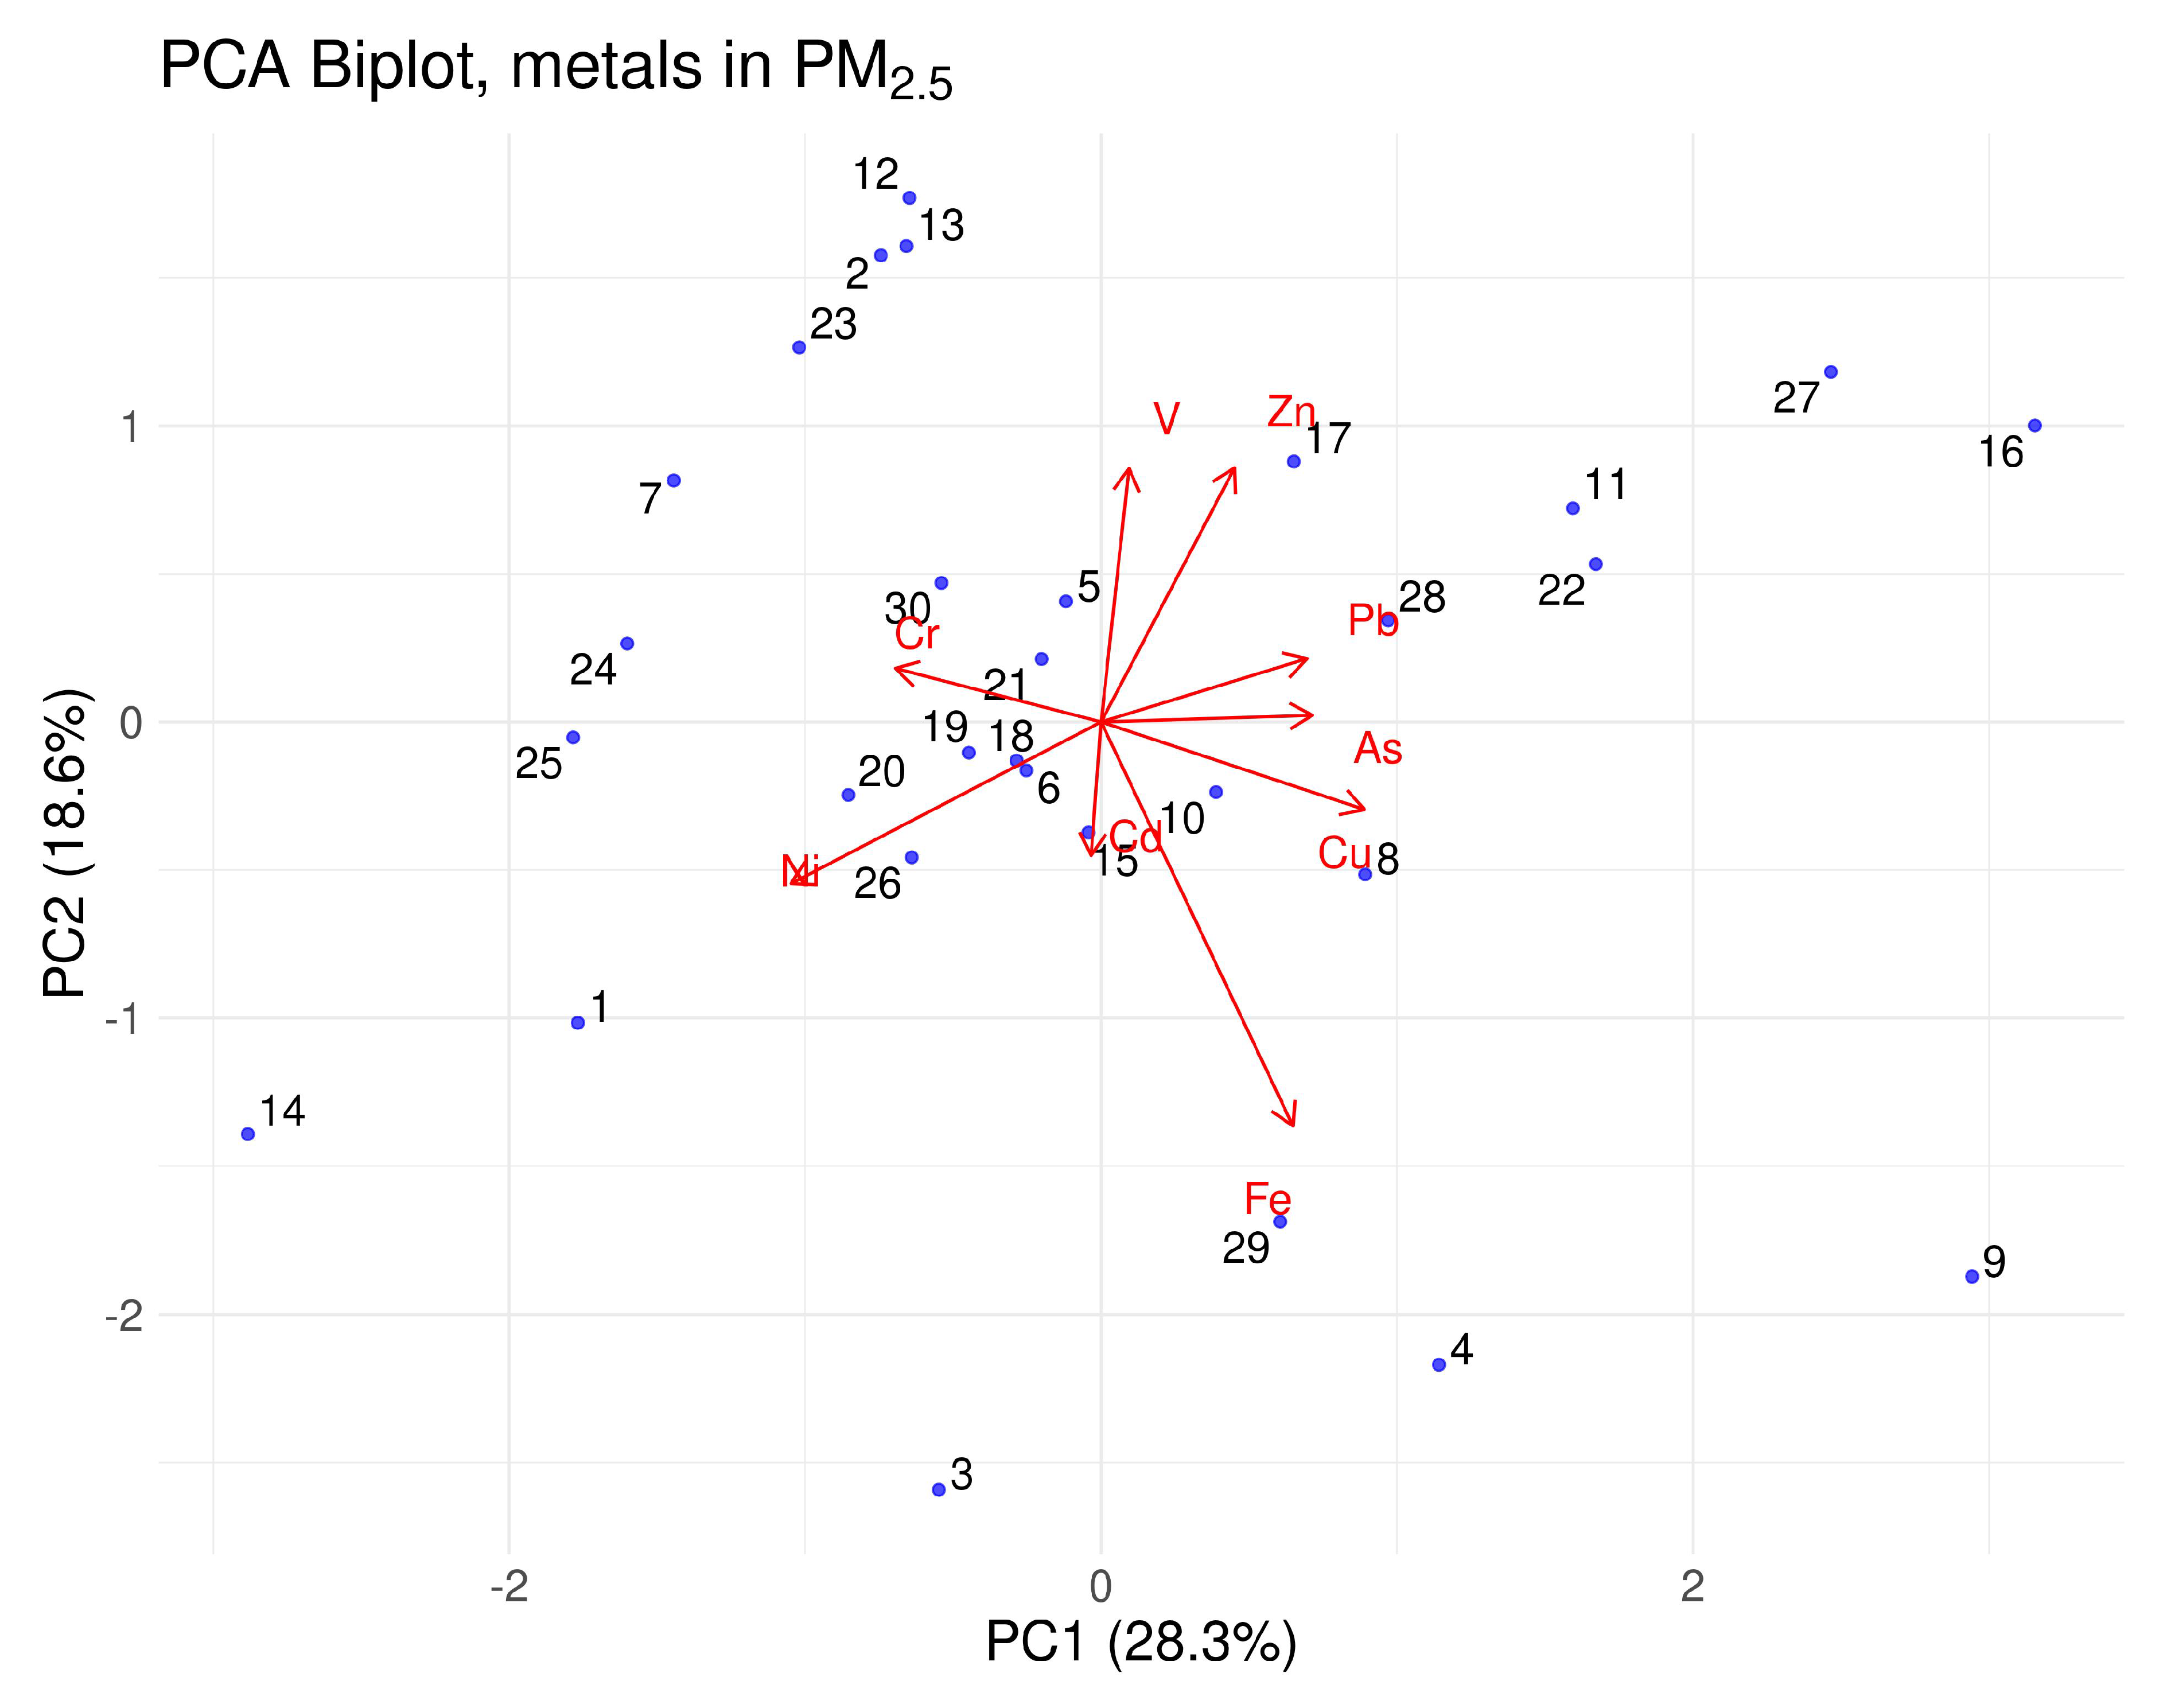
The principal component analysis (PCA) for metal concentrations in PM2.5 (Figure 6) reveals the distribution of sampling sites along the first two principal components, which together explain a substantial proportion of the variance in the dataset. The first component (PC1) accounts for 28.3% of the variance, while the second component (PC2) explains 18.6%. Sampling sites such as the Agrarian Institute of Dominican Republic, APEC University, and San Judas Tadeo School are positioned at the extremes along PC1, whereas sites like the American School of Santo Domingo, Victor Estrella Liz School, and Prof. Adolfo González School are located towards the center. The loading plot shows that metals such as Zn, V, and Pb contribute strongly to the first component, while Fe and Cr have a more substantial influence along the second component.
Figure 3.
Spatial interpolation of metal concentrations (ppm) in PM10 particles across the study area using ordinary kriging. Each panel corresponds to a different metal: Cd, Cr, Cu, Fe, Ni, Pb, V, and Zn. Filled contour maps show estimated concentration gradients, with isolines indicating interpolated concentration levels. The shaded polygon in the background represents the boundary of the Distrito Nacional of Santo Domingo. Scale bars and north arrows are provided for spatial reference.
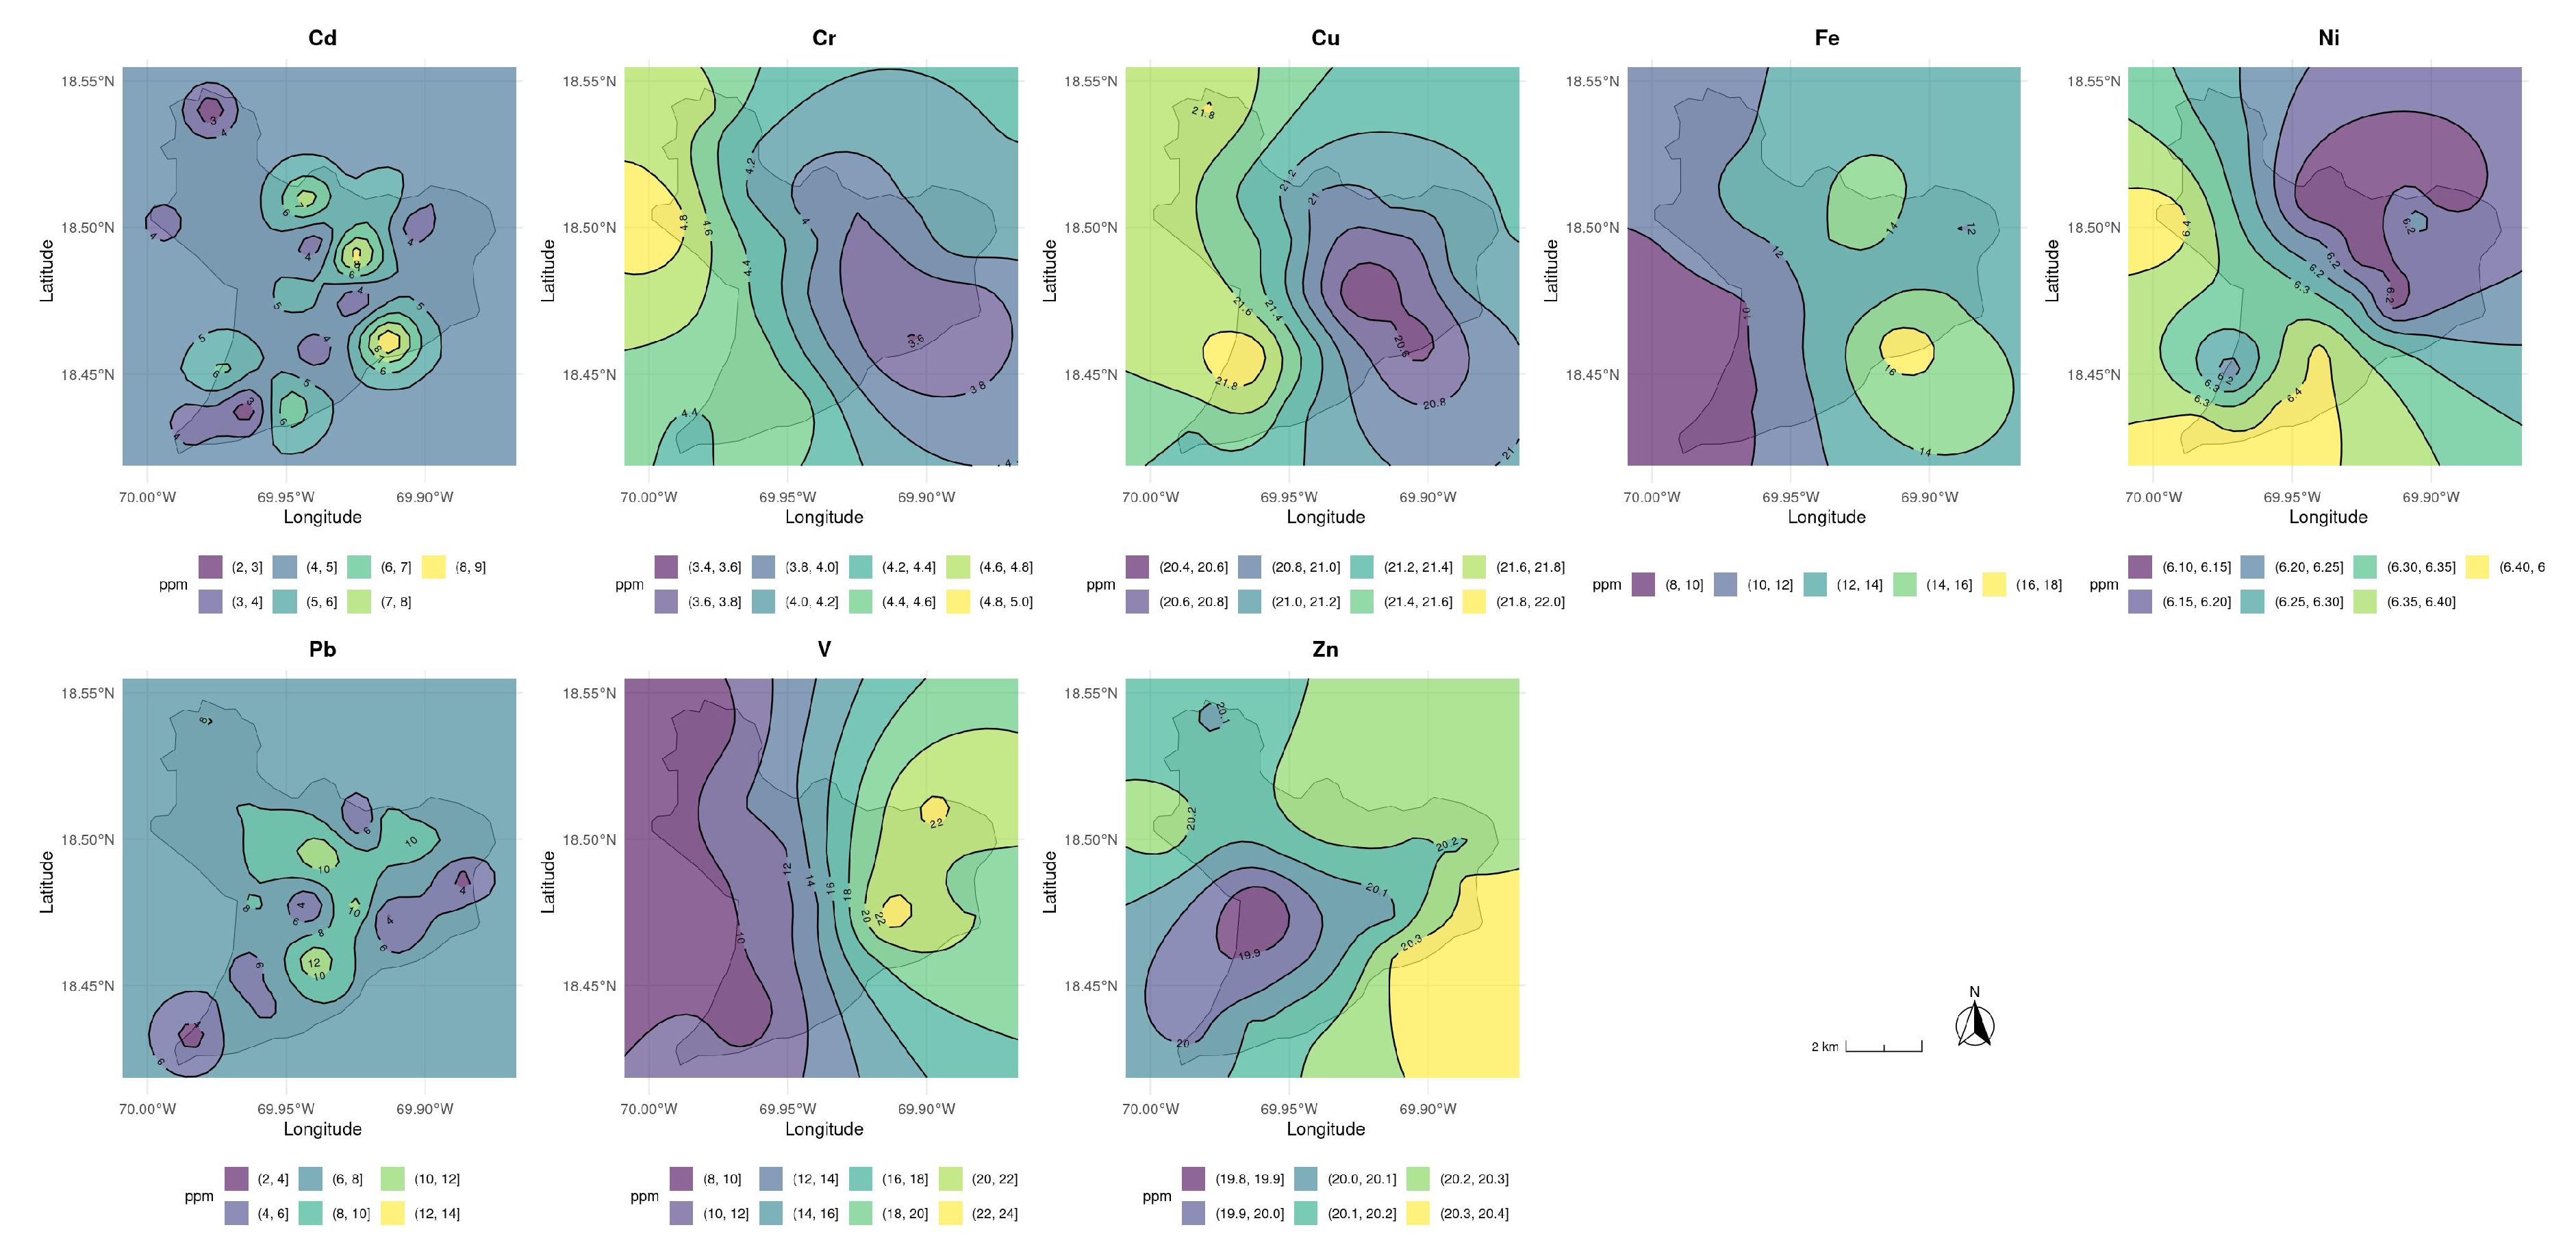
Figure 4.
Mean Concentration of Metals in PM2.5 with Standard Error
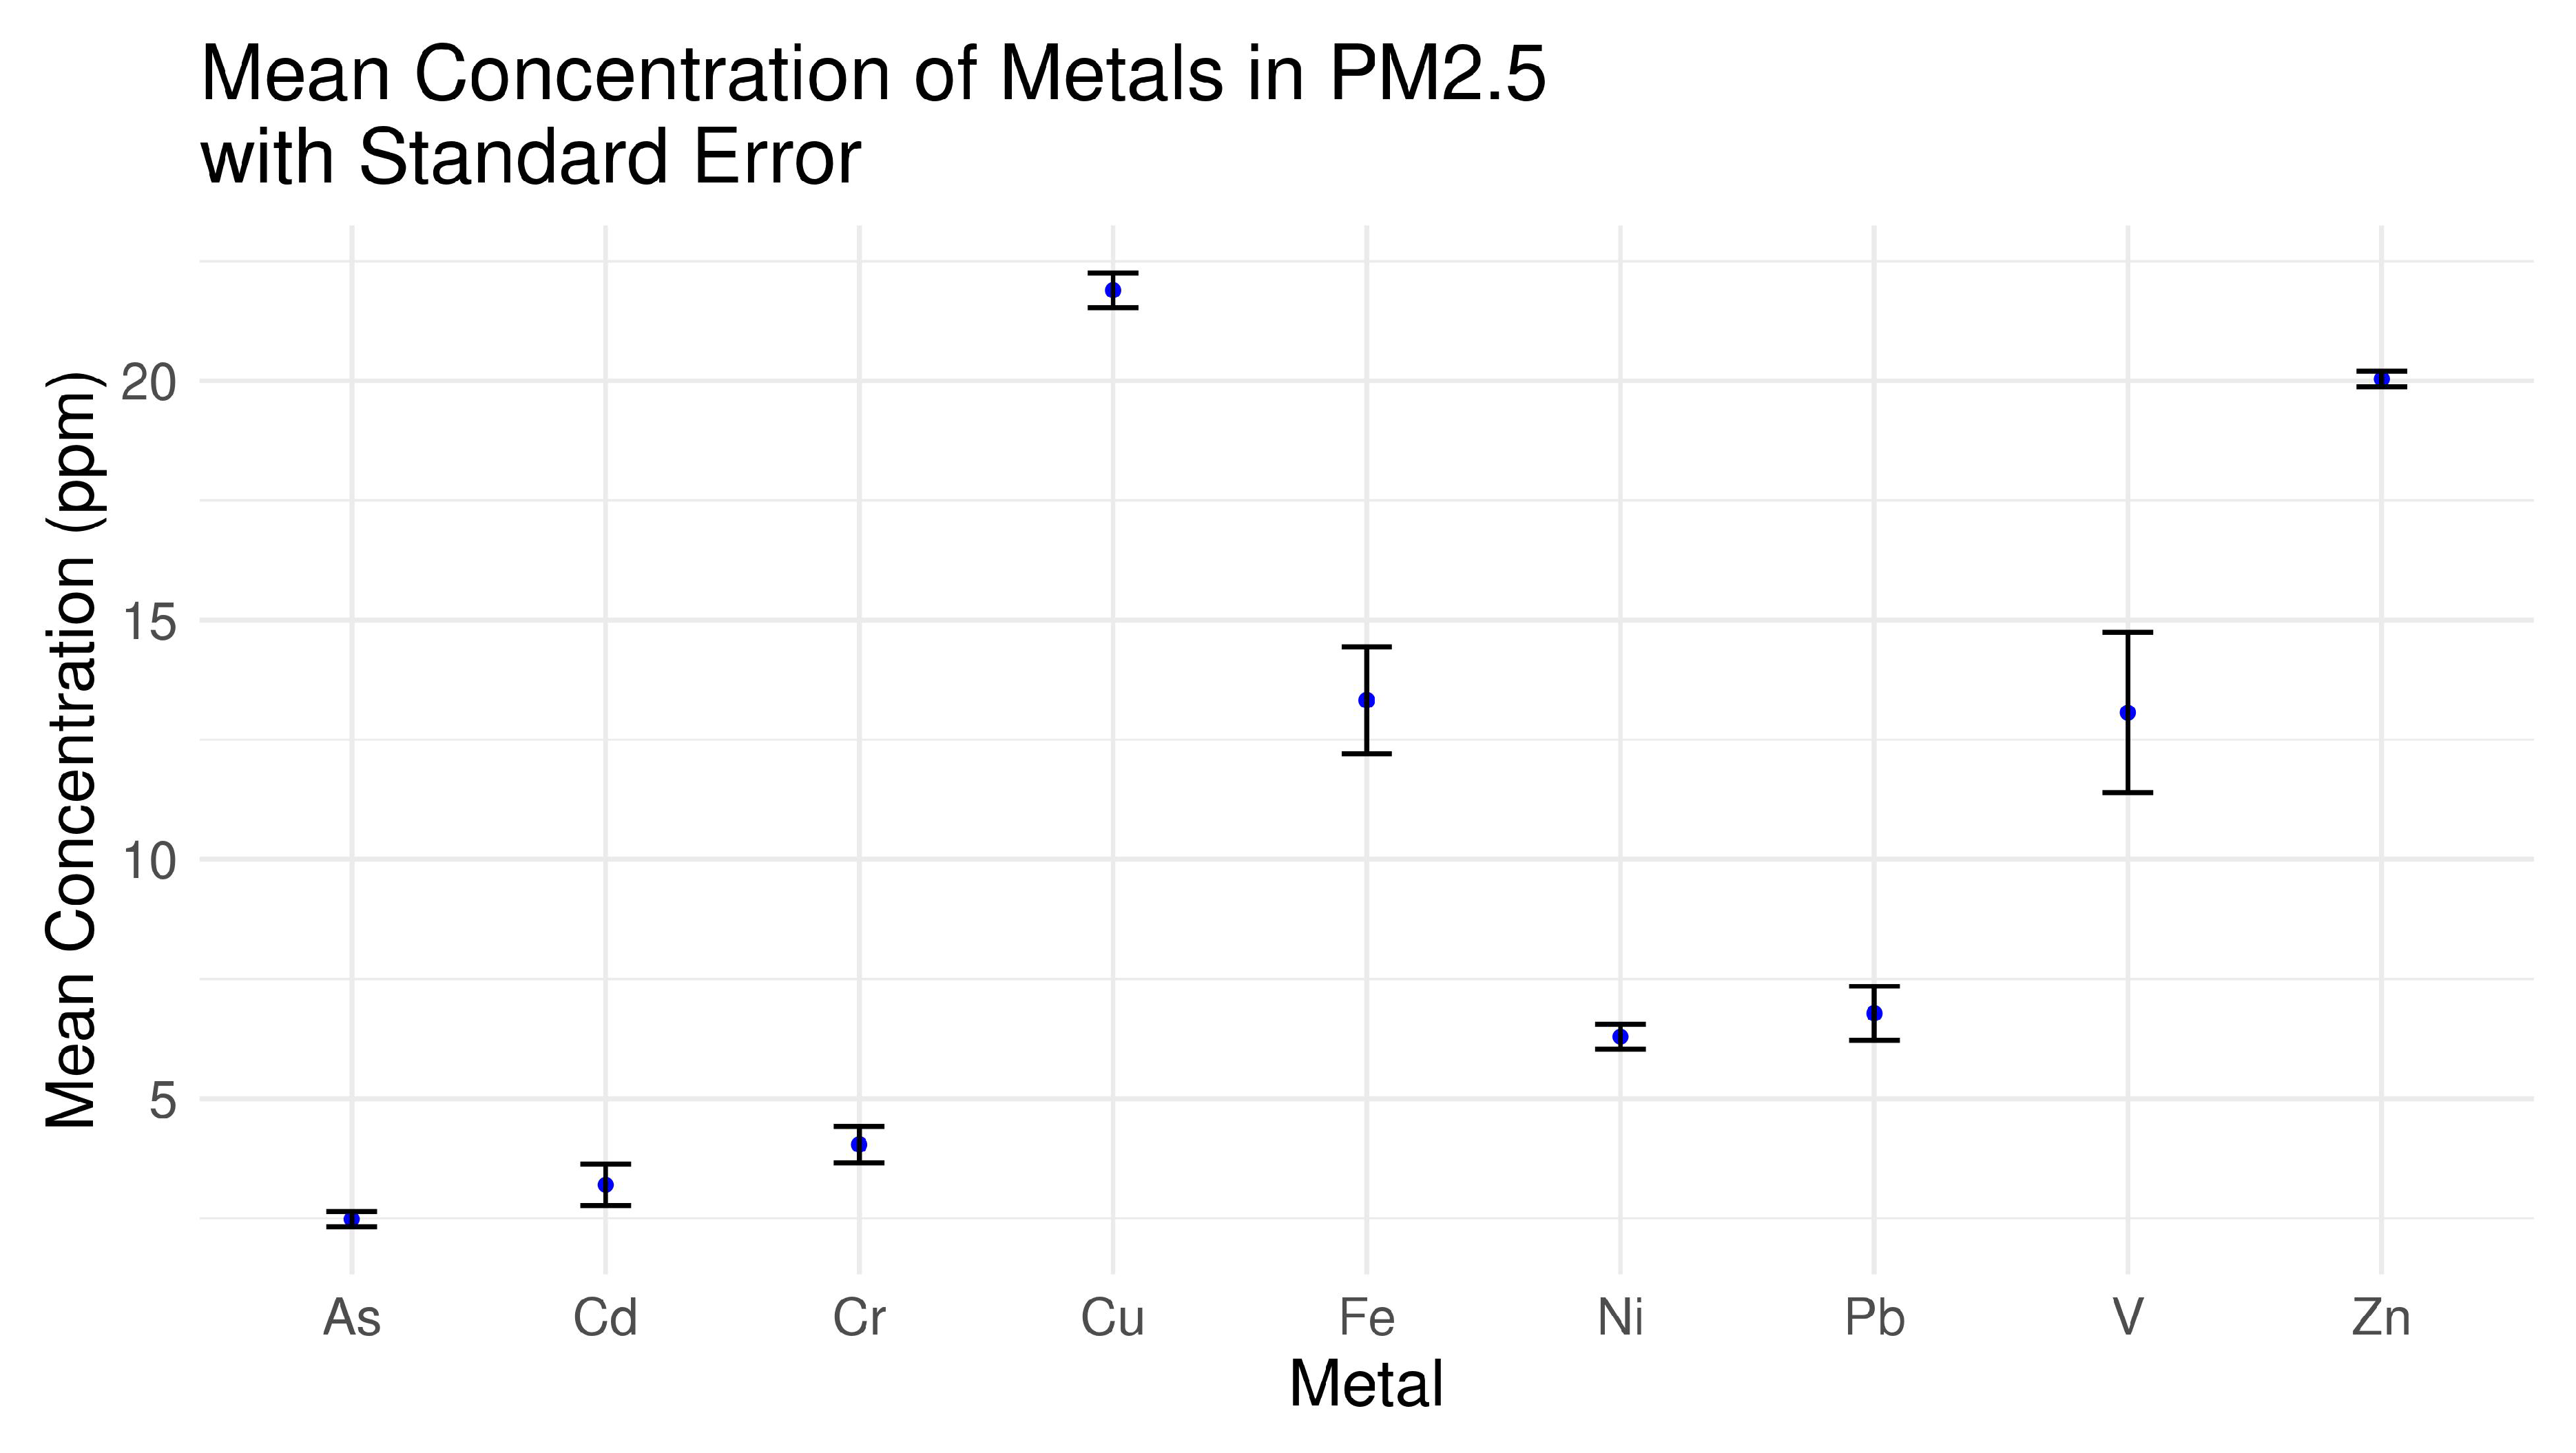
Figure 5.
Mean Concentration of Metals in PM10 with Standard Error
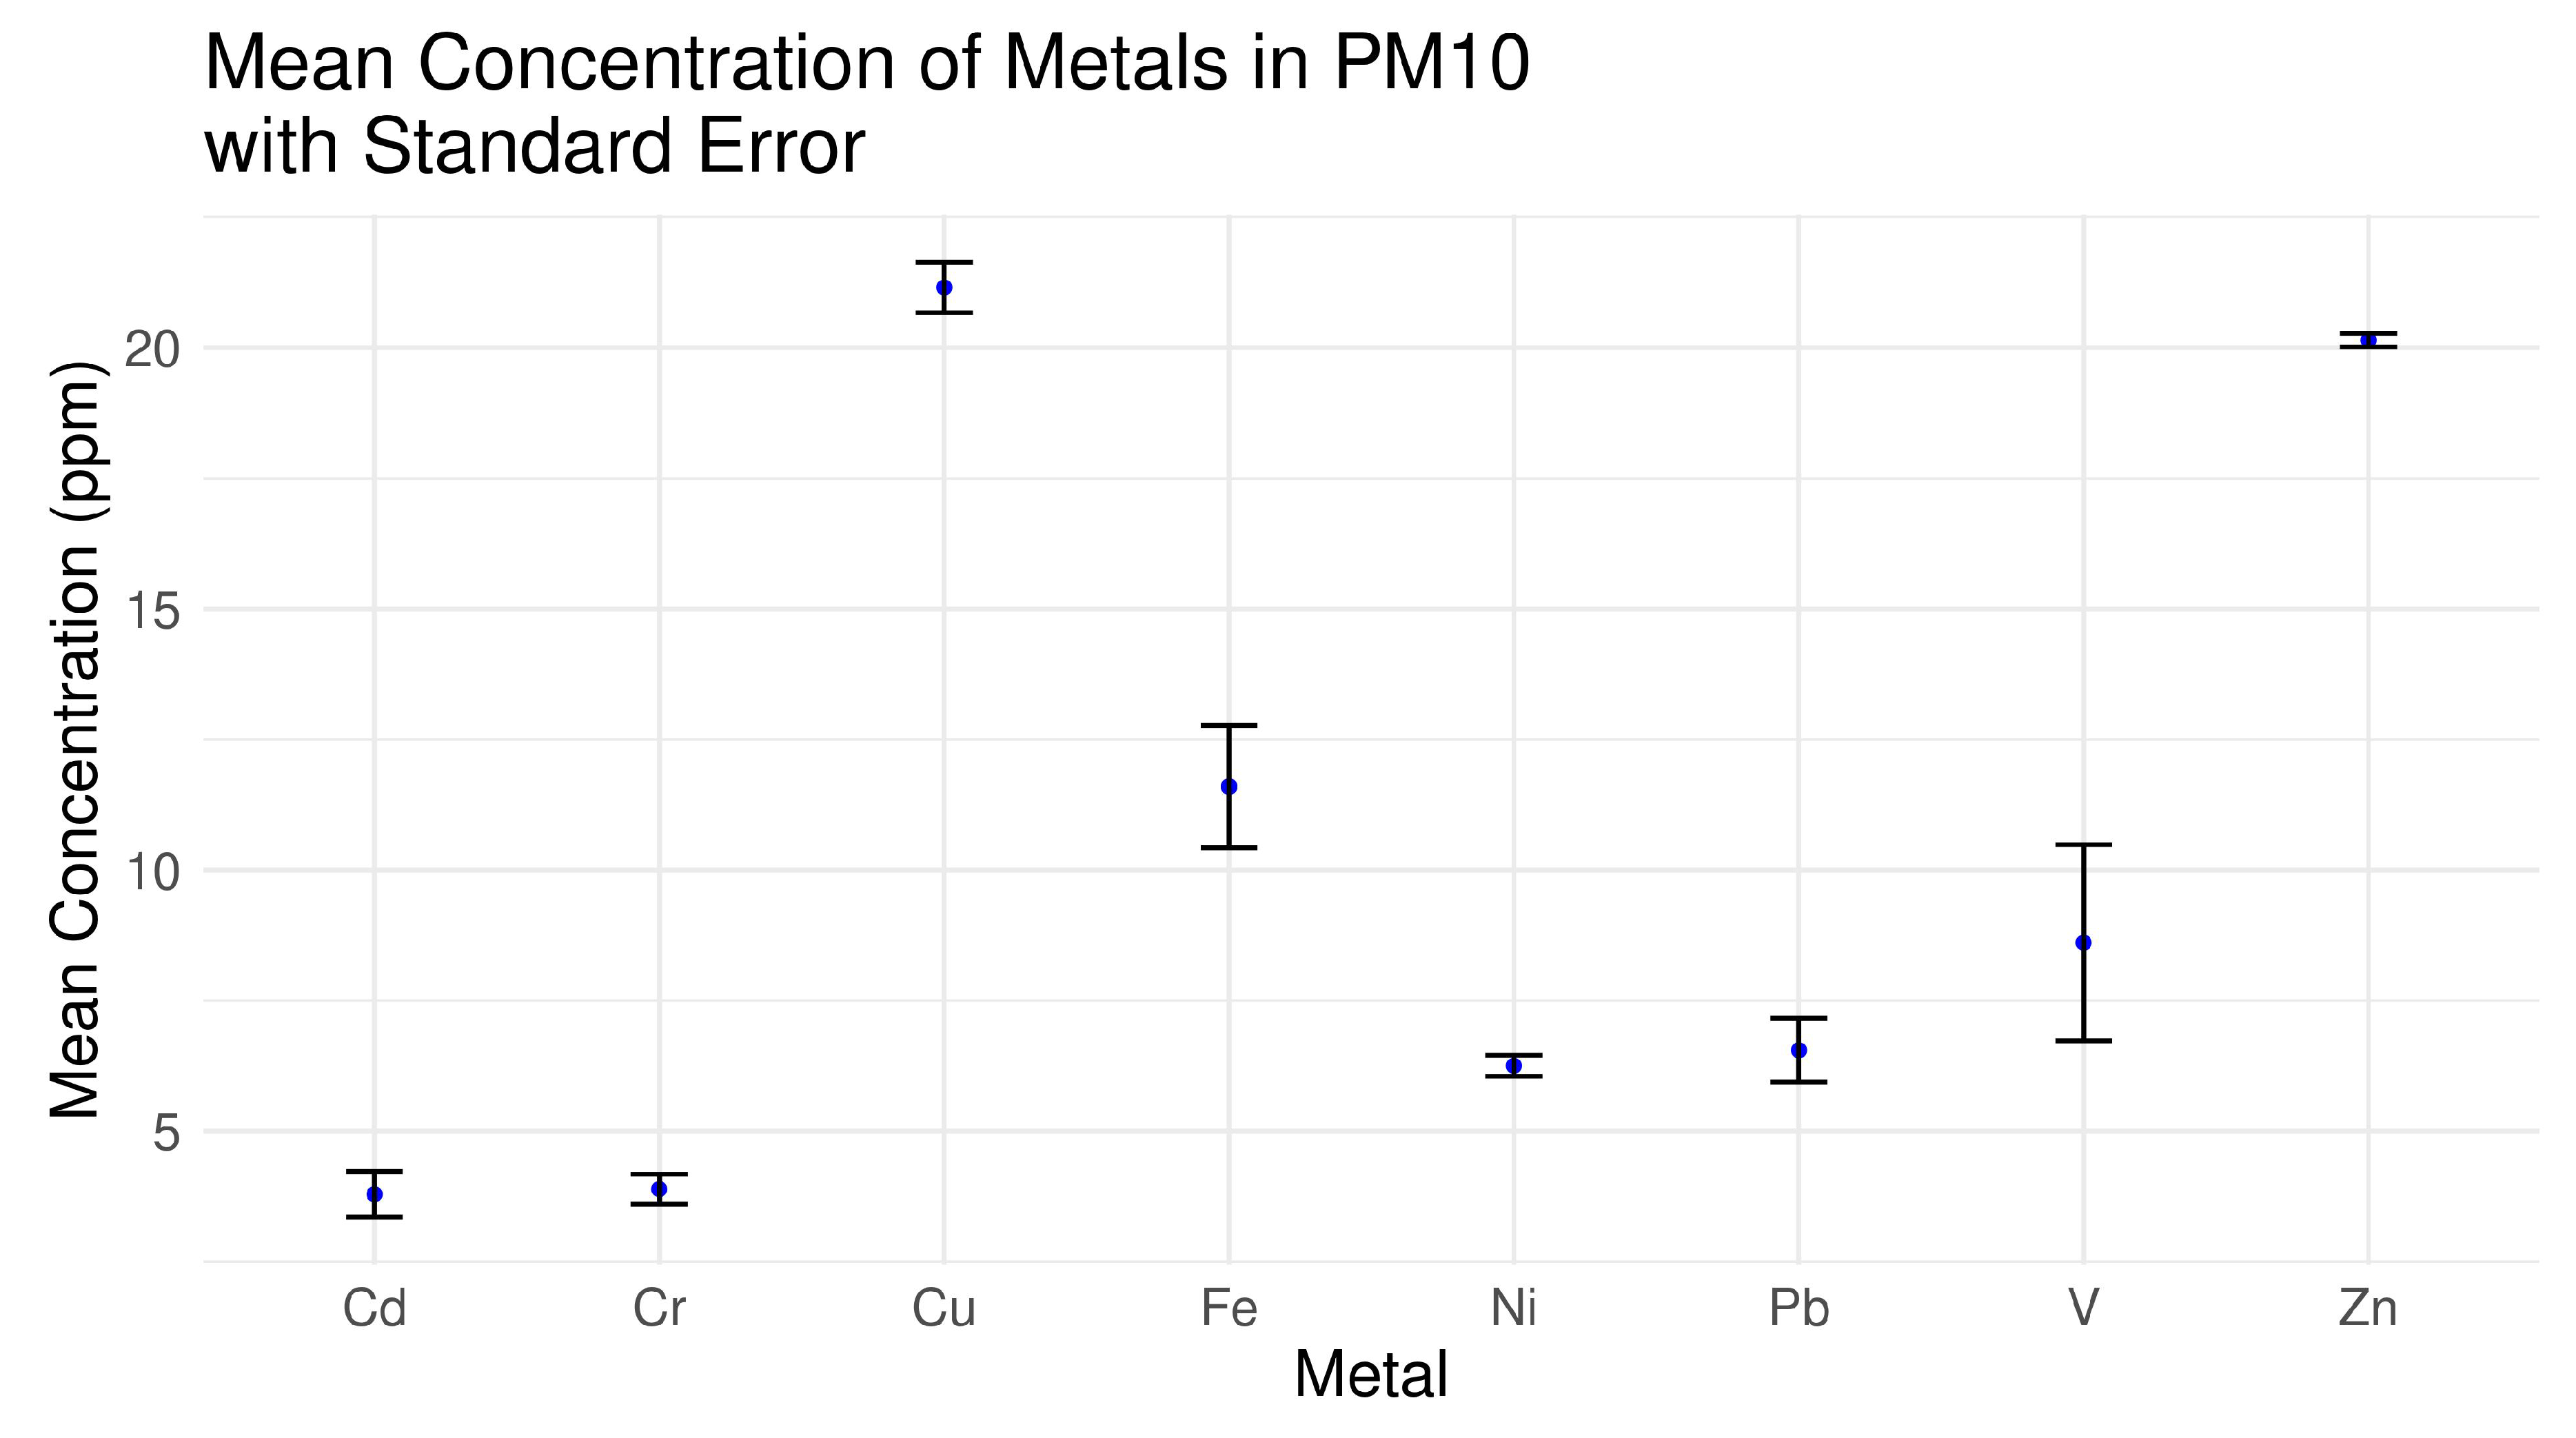
Figure 6.
PCA Biplot, metals in PM2.5
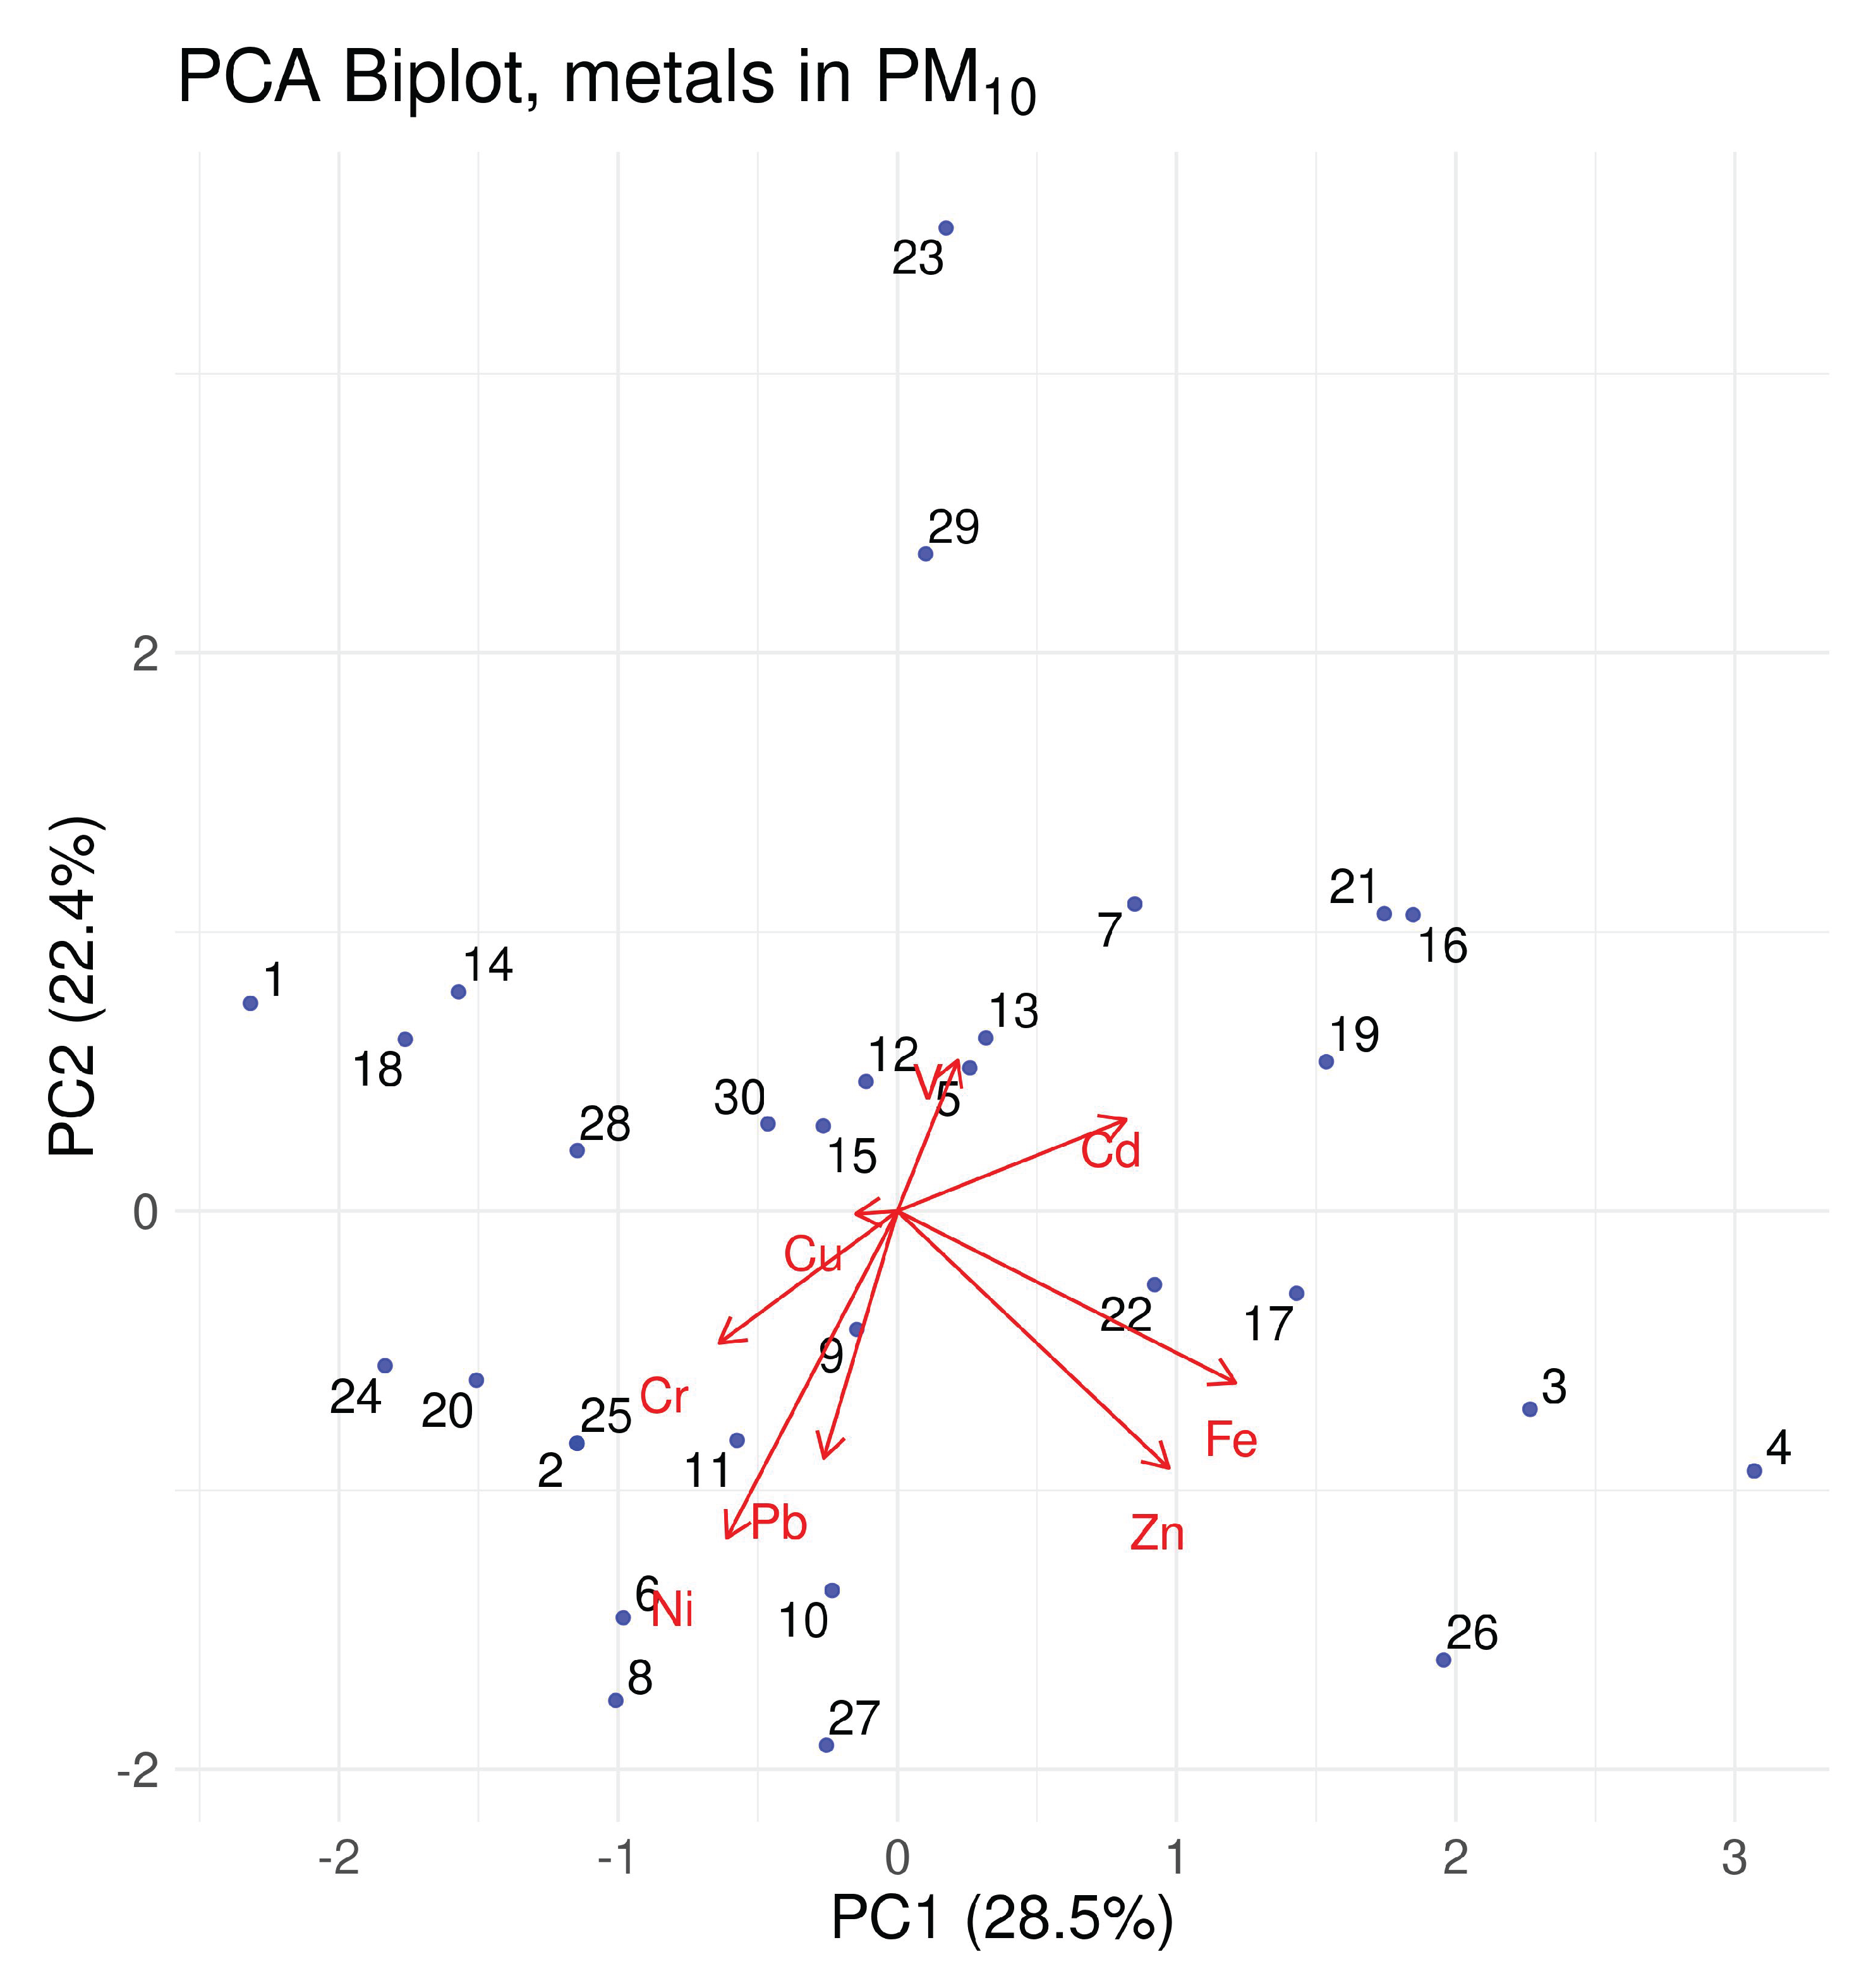
In the case of PM10 (Figure 7), the first two principal components explain 28.5% and 22.4% of the variance, respectively. The PCA plot reveals a clustering pattern where sites such as Aida Cartagena Portalatín School and The Community for Learning are positioned towards the positive extremes of PC1, while Los Prados School, María Auxiliadora School, and Notre Dame School are situated towards the negative end. The loading vectors indicate that Zn, V, and Fe show a strong correlation with PC1, whereas Pb, Cr, and Ni have more influence along PC2. Compared to PM2.5, the PCA for PM10 shows a slightly different spatial distribution of sites, suggesting variations in the metal concentration patterns.
Across both analyses, certain sites exhibit distinct positions within the PCA space, indicating differences in their metal concentration profiles. For instance, Capotillo School and Arroyo Hondo School appear centrally located in both analyses, while Salomé Ureña School and República Dominicana School occupy different relative positions between PM2.5 and PM10. The biplots further illustrate the contribution of individual metals, where V, Cr, and Pb consistently appear as key contributors to the variability in both fractions. The separation among sites along PC1 and PC2 suggests underlying differences in metal distributions across urban environments.
Figure 7.
PCA Biplot, metals in PM10
4. Discussion
This study aimed to (1) quantify the concentrations of selected heavy metals in PM2.5 and PM10 in Santo Domingo, (2) apply statistical imputation techniques to handle left-censored data, and (3) explore the spatial distribution and potential sources of these metals through principal component analysis. These objectives have been met successfully: the analysis provided detailed concentration profiles for nine metals, robustly addressed censoring through ROS, and identified spatial variability and possible emission sources using PCA. The study contributes new baseline data on airborne metal pollution in the capital city of the Dominican Republic, a context where environmental monitoring efforts remain limited [44]. The findings provide a foundation for both regulatory interventions and future scientific research.
The high concentrations of Cu and Zn across both PM fractions suggest dominant and persistent anthropogenic sources, possibly related to vehicular traffic, brake and tire wear, and mechanical workshops [73,74]. These metals are commonly found in urban PM worldwide and their consistent detection in all sites supports their ubiquity in the city’s atmosphere [75,76]. The presence of Pb and Ni, although at moderate levels, remains concerning due to their toxicity and potential for chronic exposure. Leaded gasoline was phased out in the region decades ago, but legacy pollution from past vehicular emissions and industrial activity may still influence current concentrations [77,78,79].
Vanadium (V) and iron (Fe) exhibited high variability, particularly in PM10, suggesting heterogeneous sources or resuspension processes [80,81]. V is often associated with the combustion of heavy fuels, such as bunker oil used in marine transport and some electricity generation facilities [82,83]. The elevated standard errors and extreme values observed for V may reflect occasional long-range transport or local emission peaks. Similarly, the broad concentration range of Fe may indicate contributions from soil resuspension, construction activities, or industrial dust [80,84].
The PCA results revealed patterns of co-occurrence among metals, allowing for tentative source attribution. In both PM2.5 and PM10, PC1 was strongly influenced by Zn, Cu, and V, suggesting a common source, likely traffic-related or industrial combustion [83,84]. Site differentiation along the PCA axes implies that exposure to metal pollutants is spatially uneven, with educational centers like APEC University and Aida Cartagena Portalatín School showing distinct signatures. Such variation may correspond to micro-environmental differences, such as traffic density, building layout, and wind flow dynamics [85,86].
This study has several limitations. First, the number of samples (30) constrains the statistical power and generalizability of the findings. Although the sampling design was spatially optimized, temporal variability was not captured, as all samples were collected during a single campaign. Additionally, the exclusion of several metals (e.g., Mn, Hg, As) from the PCA due to high censoring limits the scope of source identification. The use of XRF, while cost-effective and non-destructive, also has higher detection limits compared to other analytical methods such as ICP-MS, potentially leading to underestimation of trace metals [69,87].
These results prompt several new research questions. Future studies should investigate seasonal and diurnal patterns in metal concentrations, assess deposition rates to soil and vegetation, and explore health outcomes associated with chronic exposure in children and sensitive populations. Integrating land use regression (LUR) models or chemical mass balance (CMB) models would help refine source attribution [88,89]. Moreover, monitoring metals not captured in this study, including those associated with electronic waste and emerging contaminants, could yield insights into evolving pollution sources in urban contexts.
5. Conclusions
This work provides a foundational assessment of heavy metals in atmospheric particulate matter in Santo Domingo. It reveals the presence of persistent pollutants, spatial heterogeneity in exposure, and key indicators of anthropogenic activity. The study underscores the need for expanded air quality monitoring and targeted mitigation strategies to protect public health and environmental quality in the region.
Author Contributions
CME: Designed and conducted the field experiments, developed the methodology, managed the project administration, secured the resources, analyzed the data, interpreted the results, contributed to the writing, review, and editing of the manuscript; RD: Assisted with the measurements; AHG and UJH: Reviewed and provided feedback on the manuscript; JRMB: Analyzed the data, interpreted the results, and contributed to the writing, review, and editing of the manuscript
Funding
The authors acknowledge the Ministry of Higher Education, Science, and Technology of the Dominican Republic, specifically its National Fund for Scientific Innovation and Technological Development, for funding this research under the project “Air pollution by heavy metals and radionuclides in atmospheric aerosols from urban areas: Contribution to air quality management in the Distrito Nacional”, Fondo Nacional de Innovación y Desarrollo Científico–Tecnológico (CROSSREF funder ID 100016968), grant code No. 2020-2021-2B1-110.
Institutional Review Board Statement
Not applicable.
Informed Consent Statement
Not applicable.
Data Availability Statement
The original contributions presented in this study are included in the article. Further inquiries can be directed to the corresponding author.
Acknowledgments
This work was carried out within the Doctoral Program in Environmental Sciences of the Basic and Environmental Sciences Area at the Technological Institute of Santo Domingo (INTEC). The authors also express their gratitude to the Science Faculty and the Physics Institute of the Autonomous University of Santo Domingo (UASD) for their support. Special thanks are extended to José Antonio Peña and Albert Santiago de la Cruz for their valuable contribution to field sampling and logistics.
Conflicts of Interest
The authors declare no conflicts of interest. The funders had no role in the design of the study; in the collection, analyses, or interpretation of data; in the writing of the manuscript; or in the decision to publish the results.
Abbreviations
The following abbreviations are used in this manuscript:
| As | Arsenic |
| Cd | Cadmium |
| Cr | Chromium |
| Cu | Copper |
| Fe | Iron |
| Hg | Mercury |
| Mn | Manganese |
| Ni | Nickel |
| Pb | Lead |
| PM | Particulate Matter |
| PM10 | Particles with a diameter less than 10 |
| PM2.5 | Particles with a diameter less than 2.5 |
| V | Vanadium |
| XRF | X-ray Fluorescence |
| Zn | Zinc |
Appendix A Estimated concentrations of metals by X-ray fluorescence spectrometry in PM2.5 and PM10, including all metals at all sampling sites, regardless of whether values were left-censored (e.g., below the calibrated detection limits) or below the instrument’s detection limit.

Table A1.
Estimated concentrations of metals (units in ppm) in PM2.5
| Site ID | Name | As | Cd | Cr | Cu | Fe | Hg | Mn | Ni | Pb | V | Zn | Latitude | Longitude |
|---|---|---|---|---|---|---|---|---|---|---|---|---|---|---|
| 1 | Los Prados School | 2.8 | 5.4 | 4.4 | 19.0 | 12.8 | 2.1 | 7.0 | 2.9 | 6.9 | 19.7 | 18.48 | -69.96 | |
| 2 | San Judas Tadeo School | 2.4 | 2.5 | 10.2 | 23.2 | 10.5 | 6.5 | 23.8 | 21.6 | 18.48 | -69.93 | |||
| 3 | UASD Faculty Club | 2.0 | 3.5 | 23.1 | 24.5 | 2.2 | 3.5 | 8.0 | 11.8 | 18.9 | 18.46 | -69.90 | ||
| 4 | Faculty of Health Sciences, UASD | 3.5 | 9.4 | 2.6 | 22.2 | 26.7 | 6.9 | 6.0 | 13.1 | 21.0 | 18.46 | -69.91 | ||
| 5 | University Geographic Institute, UASD | 3.2 | 2.8 | 20.7 | 7.5 | 2.3 | 4.0 | 6.0 | 9.9 | 18.8 | 19.0 | 18.47 | -69.88 | |
| 6 | Padre Valentín Salinero School | 2.4 | 3.3 | 6.1 | 23.2 | 17.6 | 6.8 | 5.5 | 20.9 | 18.46 | -69.94 | |||
| 7 | Padre Eulalio Antonio Arias Inoa School | 2.9 | 3.9 | 19.2 | 5.0 | 6.8 | 5.8 | 19.8 | 18.51 | -69.92 | ||||
| 8 | José Bordas Valdez School | 2.9 | 2.5 | 6.4 | 23.0 | 22.1 | 5.2 | 18.3 | 20.2 | 18.50 | -69.99 | |||
| 9 | Rosa Duarte School | 4.9 | 3.5 | 24.5 | 28.0 | 2.5 | 5.4 | 9.7 | 19.2 | 18.44 | -69.95 | |||
| 10 | Francisco Xavier Billini School | 2.8 | 23.9 | 15.8 | 6.2 | 20.4 | 18.44 | -69.96 | ||||||
| 11 | National Botanical Garden | 3.3 | 3.5 | 23.4 | 13.8 | 4.6 | 7.0 | 21.1 | 18.49 | -69.95 | ||||
| 12 | Escuela Básica Prof. María del Carmen Pérez Méndez | 2.5 | 20.1 | 4.0 | 5.7 | 6.7 | 20.6 | 18.53 | -69.97 | |||||
| 13 | Notre Dame School | 4.0 | 2.2 | 4.5 | 19.2 | 8.0 | 6.4 | 5.8 | 36.9 | 19.5 | 18.48 | -69.94 | ||
| 14 | Movearte Professional School | 2.1 | 4.9 | 7.3 | 20.4 | 11.0 | 7.4 | 3.7 | 12.1 | 17.9 | 18.43 | -69.98 | ||
| 15 | República Dominicana School | 3.1 | 20.9 | 14.6 | 7.4 | 11.3 | 24.0 | 19.2 | 18.49 | -69.91 | ||||
| 16 | Víctor Estrella Liz School | 3.2 | 2.4 | 25.6 | 9.5 | 3.8 | 2.4 | 12.2 | 22.3 | 19.5 | 18.49 | -69.93 | ||
| 17 | Association of Authorized Master Builders | 4.4 | 23.1 | 15.0 | 7.6 | 9.5 | 27.0 | 22.0 | 18.49 | -69.89 | ||||
| 18 | María Auxiliadora School | 5.0 | 3.9 | 21.8 | 10.8 | 7.6 | 10.6 | 19.6 | 18.50 | -69.89 | ||||
| 19 | Nuestra Señora del Carmen School | 2.6 | 2.1 | 4.0 | 21.8 | 13.3 | 4.2 | 6.2 | 5.4 | 19.5 | 18.51 | -69.90 | ||
| 20 | Salomé Ureña School | 2.6 | 10.0 | 5.4 | 22.5 | 8.5 | 4.3 | 3.0 | 7.1 | 22.6 | 19.6 | 18.50 | -69.90 | |
| 21 | American School of Santo Domingo | 3.1 | 23.8 | 11.2 | 7.2 | 5.5 | 20.5 | 18.51 | -69.94 | |||||
| 22 | The Community For Learning | 2.7 | 3.7 | 26.2 | 12.3 | 5.5 | 8.5 | 20.7 | 18.51 | -69.97 | ||||
| 23 | APEC University | 2.3 | 6.3 | 21.1 | 6.5 | 7.2 | 30.6 | 20.5 | 18.47 | -69.91 | ||||
| 24 | Prof. Adolfo González School | 2.4 | 6.9 | 21.2 | 8.8 | 2.7 | 7.8 | 8.6 | 19.8 | 18.54 | -69.98 | |||
| 25 | Capotillo School | 7.9 | 19.5 | 13.0 | 7.5 | 6.9 | 19.8 | 18.50 | -69.90 | |||||
| 26 | Aida Cartagena Portalatín School | 3.7 | 3.8 | 19.6 | 14.3 | 7.8 | 11.4 | 19.2 | 18.51 | -69.92 | ||||
| 27 | Arroyo Hondo School | 4.1 | 3.6 | 2.6 | 19.9 | 16.2 | 4.5 | 3.8 | 11.9 | 21.2 | 18.49 | -69.94 | ||
| 28 | Governorship of Mirador Sur Park | 2.4 | 6.6 | 22.3 | 13.9 | 2.5 | 4.4 | 10.0 | 20.7 | 20.3 | 18.44 | -69.96 | ||
| 29 | Agrarian Institute of Dominican Republic | 3.7 | 23.2 | 20.7 | 6.4 | 12.2 | 19.3 | 18.45 | -69.97 | |||||
| 30 | Private residence | 2.8 | 3.5 | 19.1 | 12.3 | 6.7 | 20.6 | 18.46 | -69.96 |
Table A2.
Estimated concentrations of metals (units in ppm) in PM10
| Site ID | Name | As | Cd | Cr | Cu | Fe | Hg | Mn | Ni | Pb | V | Zn | Latitude | Longitude |
|---|---|---|---|---|---|---|---|---|---|---|---|---|---|---|
| 1 | Los Prados School | 4.3 | 20.6 | 6.0 | 2.7 | 7.1 | 8.4 | 18.2 | 18.48 | -69.96 | ||||
| 2 | San Judas Tadeo School | 3.2 | 3.5 | 15.5 | 8.0 | 2.9 | 7.4 | 11.2 | 19.9 | 18.48 | -69.93 | |||
| 3 | UASD Faculty Club | 6.7 | 2.8 | 16.5 | 21.4 | 4.1 | 6.7 | 20.3 | 21.1 | 18.46 | -69.90 | |||
| 4 | Faculty of Health Sciences, UASD | 3.5 | 9.4 | 2.6 | 22.2 | 26.7 | 6.9 | 6.0 | 13.1 | 21.0 | 18.46 | -69.91 | ||
| 5 | University Geographic Institute, UASD | 4.6 | 2.4 | 21.2 | 10.0 | 6.2 | 7.1 | 22.6 | 20.3 | 18.47 | -69.88 | |||
| 6 | Padre Valentín Salinero School | 3.3 | 3.7 | 23.1 | 13.8 | 7.6 | 12.9 | 19.8 | 18.46 | -69.94 | ||||
| 7 | Padre Eulalio Antonio Arias Inoa School | 2.8 | 2.3 | 19.6 | 12.6 | 6.6 | 5.9 | 2.8 | 20.3 | 18.51 | -69.92 | |||
| 8 | José Bordas Valdez School | 3.2 | 7.1 | 22.1 | 9.1 | 7.4 | 21.1 | 18.50 | -69.99 | |||||
| 9 | Rosa Duarte School | 6.9 | 6.8 | 18.4 | 9.5 | 2.2 | 6.4 | 6.7 | 20.6 | 18.44 | -69.95 | |||
| 10 | Francisco Xavier Billini School | 2.2 | 4.7 | 21.9 | 12.8 | 6.5 | 8.1 | 5.7 | 21.0 | 18.44 | -69.96 | |||
| 11 | National Botanical Garden | 5.3 | 24.3 | 10.2 | 2.1 | 6.1 | 9.7 | 4.2 | 20.4 | 18.49 | -69.95 | |||
| 12 | Escuela Básica Prof. María del Carmen Pérez Méndez | 2.6 | 21.4 | 8.8 | 7.0 | 6.5 | 6.3 | 20.1 | 18.53 | -69.97 | ||||
| 13 | Notre Dame School | 2.8 | 5.4 | 3.3 | 19.3 | 12.7 | 6.4 | 2.8 | 6.9 | 20.0 | 18.48 | -69.94 | ||
| 14 | Movearte Professional School | 2.9 | 3.5 | 19.2 | 4.1 | 7.5 | 2.2 | 13.9 | 19.6 | 18.43 | -69.98 | |||
| 15 | República Dominicana School | 19.6 | 11.4 | 6.1 | 19.8 | 18.49 | -69.91 | |||||||
| 16 | Víctor Estrella Liz School | 2.6 | 8.9 | 2.1 | 20.5 | 14.8 | 4.6 | 9.6 | 20.2 | 18.49 | -69.93 | |||
| 17 | Association of Authorized Master Builders | 2.3 | 24.1 | 18.7 | 6.2 | 2.5 | 7.4 | 21.2 | 18.49 | -69.89 | ||||
| 18 | María Auxiliadora School | 2.8 | 4.9 | 6.2 | 21.3 | 5.8 | 3.0 | 6.0 | 7.9 | 19.2 | 18.50 | -69.89 | ||
| 19 | Nuestra Señora del Carmen School | 4.9 | 4.0 | 4.1 | 20.9 | 16.9 | 3.9 | 4.6 | 6.4 | 31.6 | 21.0 | 18.51 | -69.90 | |
| 20 | Salomé Ureña School | 2.4 | 4.2 | 25.5 | 6.1 | 7.6 | 8.4 | 19.9 | 18.50 | -69.90 | ||||
| 21 | American School of Santo Domingo | 7.8 | 2.7 | 19.2 | 13.2 | 4.6 | 13.9 | 20.6 | 18.51 | -69.94 | ||||
| 22 | The Community For Learning | 3.1 | 20.0 | 18.9 | 2.2 | 6.3 | 8.2 | 16.9 | 20.2 | 18.51 | -69.97 | |||
| 23 | APEC University | 4.2 | 21.6 | 11.4 | 2.1 | 3.6 | 3.3 | 43.6 | 18.9 | 18.47 | -69.91 | |||
| 24 | Prof. Adolfo González School | 3.6 | 2.0 | 6.6 | 24.1 | 10.9 | 6.1 | 8.3 | 3.1 | 19.6 | 18.54 | -69.98 | ||
| 25 | Capotillo School | 3.2 | 3.5 | 15.5 | 8.0 | 2.9 | 7.4 | 11.2 | 19.9 | 18.50 | -69.90 | |||
| 26 | Aida Cartagena Portalatín School | 5.7 | 5.3 | 23.3 | 28.4 | 6.1 | 9.2 | 20.9 | 18.51 | -69.92 | ||||
| 27 | Arroyo Hondo School | 3.5 | 5.3 | 20.4 | 17.5 | 7.1 | 12.9 | 18.3 | 20.4 | 18.49 | -69.94 | |||
| 28 | Governorship of Mirador Sur Park | 3.8 | 23.9 | 8.3 | 5.8 | 7.3 | 4.6 | 6.0 | 19.5 | 18.44 | -69.96 | |||
| 29 | Agrarian Institute of Dominican Republic | 2.1 | 6.3 | 4.2 | 23.4 | 8.2 | 2.4 | 3.5 | 6.1 | 19.5 | 18.45 | -69.97 | ||
| 30 | Private residence | 2.4 | 5.6 | 26.0 | 10.9 | 5.9 | 5.1 | 20.1 | 18.46 | -69.96 |
References
- Anderson, J.O.; Thundiyil, J.G.; Stolbach, A. Clearing the Air: A Review of the Effects of Particulate Matter Air Pollution on Human Health. Journal of Medical Toxicology 2012, 8, 166–175. [CrossRef]
- Organization, W.H. The world health report 2002: reducing risks, promoting healthy life; World Health Organization, 2002.
- Organization, W.H.; et al. WHO global air quality guidelines: particulate matter (PM2. 5 and PM10), ozone, nitrogen dioxide, sulfur dioxide and carbon monoxide; World Health Organization, 2021.
- Goossens, J.; Jonckheere, A.C.; Dupont, L.J.; Bullens, D.M.A. Air Pollution and the Airways: Lessons from a Century of Human Urbanization. Atmosphere 2021, 12. [CrossRef]
- Anjum, M.S.; Ali, S.M.; ud din, M.I.; Subhani, M.A.; Anwar, M.N.; Nizami, A.S.; Ashraf, U.; Khokhar, M.F. An Emerged Challenge of Air Pollution and Ever-Increasing Particulate Matter in Pakistan; A Critical Review. Journal of Hazardous Materials 2021, 402, 123943. [CrossRef]
- Sicard, P.; Agathokleous, E.; Anenberg, S.C.; De Marco, A.; Paoletti, E.; Calatayud, V. Trends in urban air pollution over the last two decades: A global perspective. Science of The Total Environment 2023, 858, 160064. [CrossRef]
- Sanda, M.; Dunea, D.; Iordache, S.; Predescu, L.; Predescu, M.; Pohoata, A.; Onutu, I. Recent Urban Issues Related to Particulate Matter in Ploiesti City, Romania. Atmosphere 2023, 14. [CrossRef]
- Wang, Z.; Chen, J.; Zhou, C.; Wang, S.; Li, M. The Impacts of Urban Form on PM2.5 Concentrations: A Regional Analysis of Cities in China from 2000 to 2015. Atmosphere 2022, 13. [CrossRef]
- Xiao, K.; Wang, Y.; Wu, G.; Fu, B.; Zhu, Y. Spatiotemporal Characteristics of Air Pollutants (PM10, PM2.5, SO2, NO2, O3, and CO) in the Inland Basin City of Chengdu, Southwest China. Atmosphere 2018, 9. [CrossRef]
- U.S. Environmental Protection Agency. Integrated Science Assessment (ISA) for Particulate Matter (Final Report, Dec 2019). Technical Report EPA/600/R-19/188, U.S. Environmental Protection Agency, Washington, DC, 2019. Final Report.
- Cohen, A.J.; Brauer, M.; Burnett, R.; Anderson, H.R.; Frostad, J.; Estep, K.; Balakrishnan, K.; Brunekreef, B.; Dandona, L.; Dandona, R.; et al. Estimates and 25-year trends of the global burden of disease attributable to ambient air pollution: an analysis of data from the Global Burden of Diseases Study 2015. The lancet 2017, 389, 1907–1918.
- Murray, C.J.; Aravkin, A.Y.; Zheng, P.; Abbafati, C.; Abbas, K.M.; Abbasi-Kangevari, M.; Abd-Allah, F.; Abdelalim, A.; Abdollahi, M.; Abdollahpour, I.; et al. Global burden of 87 risk factors in 204 countries and territories, 1990–2019: a systematic analysis for the Global Burden of Disease Study 2019. The lancet 2020, 396, 1223–1249.
- Jaishankar, M.; Tseten, T.; Anbalagan, N.; Mathew, B.B.; Beeregowda, K.N. Toxicity, mechanism and health effects of some heavy metals. Interdisciplinary toxicology 2014, 7, 60.
- WHO Regional Office for Europe. Review of Evidence on Health Aspects of Air Pollution – REVIHAAP. Technical report, WHO Europe, Copenhagen, 2013. Accessed June 2025.
- Silva, R.A.; West, J.J.; Lamarque, J.F.; Shindell, D.T.; Collins, W.J.; Faluvegi, G.; Folberth, G.A.; Horowitz, L.W.; Nagashima, T.; Naik, V.; et al. Future global mortality from changes in air pollution attributable to climate change. Nature Climate Change 2017, 7, 647–651. [CrossRef]
- Dominici, F.; Peng, R.D.; Bell, M.L.; Pham, L.; McDermott, A.; Zeger, S.L.; Samet, J.M. Fine Particulate Air Pollution and Hospital Admission for Cardiovascular and Respiratory Diseases. JAMA 2006, 295, 1127–1134, [https://jamanetwork.com/journals/jama/articlepdf/202503/joc60023.pdf]. [CrossRef]
- Asif, M.; Yousuf, S.; Donald, A.N.; Hassan, A.M.M.; Iqbal, A.; Bodlah, M.A.; Sharf, B.; Noshia, N. A review on particulate matter and heavy metal emissions; impacts on the environment, detection techniques and control strategies. MOJ Ecology & Environmental Sciences 2021, 7, 1–5. [CrossRef]
- Alharbi, H.A.; Rushdi, A.I.; Bazeyad, A.; Al-Mutlaq, K.F. Temporal Variations, Air Quality, Heavy Metal Concentrations, and Environmental and Health Impacts of Atmospheric PM2.5 and PM10 in Riyadh City, Saudi Arabia. Atmosphere 2024, 15. [CrossRef]
- Contini, D.; Cesari, D.; Donateo, A.; Chirizzi, D.; Belosi, F. Characterization of PM10 and PM2.5 and Their Metals Content in Different Typologies of Sites in South-Eastern Italy. Atmosphere 2014, 5, 435–453. [CrossRef]
- Alwadei, M.; Srivastava, D.; Alam, M.S.; Shi, Z.; Bloss, W.J. Chemical characteristics and source apportionment of particulate matter (PM2.5) in Dammam, Saudi Arabia: Impact of dust storms. Atmospheric Environment: X 2022, 14, 100164. [CrossRef]
- Querol, X.; Alastuey, A.; Viana, M.; Rodriguez, S.; Artiñano, B.; Salvador, P.; Garcia do Santos, S.; Fernandez Patier, R.; Ruiz, C.; de la Rosa, J.; et al. Speciation and origin of PM10 and PM2.5 in Spain. Journal of Aerosol Science 2004, 35, 1151–1172. [CrossRef]
- Buseck, P.R.; Adachi, K. Nanoparticles in the Atmosphere. Elements 2008, 4, 389–394, [https://pubs.geoscienceworld.org/msa/elements/article-pdf/4/6/389/3113124/389_v4n6.pdf]. [CrossRef]
- Harrison, R.M.; Yin, J. Particulate matter in the atmosphere: which particle properties are important for its effects on health? Science of The Total Environment 2000, 249, 85–101. [CrossRef]
- Zhang, R.; Jing, J.; Tao, J.; Hsu, S.C.; Wang, G.; Cao, J.; Lee, C.S.L.; Zhu, L.; Chen, Z.; Zhao, Y.; et al. Chemical characterization and source apportionment of PM2.5 in Beijing: seasonal perspective. Atmospheric Chemistry and Physics 2013, 13, 7053–7074. [CrossRef]
- Duffus, J.H. "Heavy metals"-A meaningless term. Chemistry International – Newsmagazine for IUPAC 2001, 23. [CrossRef]
- Maret, W. Zinc Biochemistry: From a Single Zinc Enzyme to a Key Element of Life. Advances in Nutrition 2013, 4, 82–91. [CrossRef]
- Tchounwou, P.B.; Yedjou, C.G.; Patlolla, A.K.; Sutton, D.J., Heavy Metal Toxicity and the Environment. In Molecular, Clinical and Environmental Toxicology: Volume 3: Environmental Toxicology; Springer Basel: Basel, 2012; pp. 133–164. [CrossRef]
- Pant, P.; Harrison, R.M. Estimation of the contribution of road traffic emissions to particulate matter concentrations from field measurements: A review. Atmospheric Environment 2013, 77, 78–97. [CrossRef]
- III, C.A.P.; and, D.W.D. Health Effects of Fine Particulate Air Pollution: Lines that Connect. Journal of the Air & Waste Management Association 2006, 56, 709–742, [. [CrossRef]
- Valko, M.; Morris, H.; Cronin, M.T. Metals, Toxicity and Oxidative Stress. Current Medicinal Chemistry 2005, 12, 1161–1208. [CrossRef]
- Goudarzi, G.; Shirmardi, M.; Naimabadi, A.; Ghadiri, A.; Sajedifar, J. Chemical and organic characteristics of PM2.5 particles and their in-vitro cytotoxic effects on lung cells: The Middle East dust storms in Ahvaz, Iran. Science of The Total Environment 2019, 655, 434–445. [CrossRef]
- Galeano-Páez, C.; Brango, H.; Pastor-Sierra, K.; Coneo-Pretelt, A.; Arteaga-Arroyo, G.; Peñata-Taborda, A.; Espitia-Pérez, P.; Ricardo-Caldera, D.; Humanez-Álvarez, A.; Londoño-Velasco, E.; et al. Genotoxicity and Cytotoxicity Induced In Vitro by Airborne Particulate Matter (PM2.5) from an Open-Cast Coal Mining Area. Atmosphere 2024, 15, 1420. [CrossRef]
- Chen, W.; Ge, P.; Deng, M.; Liu, X.; Lu, Z.; Yan, Z.; Chen, M.; Wang, J. Toxicological responses of A549 and HCE-T cells exposed to fine particulate matter at the air–liquid interface. Environmental Science and Pollution Research 2024, 31, 27375–27387. [CrossRef]
- Figueiredo, D.; Vicente, E.D.; Vicente, A.; Gonçalves, C.; Lopes, I.; Alves, C.A.; Oliveira, H. Toxicological and Mutagenic Effects of Particulate Matter from Domestic Activities. Toxics 2023, 11, 505. [CrossRef]
- Hu, A.; Li, R.; Chen, G.; Chen, S. Impact of Respiratory Dust on Health: A Comparison Based on the Toxicity of PM2.5, Silica, and Nanosilica. International Journal of Molecular Sciences 2024, 25, 7654. [CrossRef]
- Kabata-Pendias, A. Trace Elements in Soils and Plants, 0 ed.; CRC Press, 2000. [CrossRef]
- and, J.B. Bioindicators: Types, Development, and Use in Ecological Assessment and Research. Environmental Bioindicators 2006, 1, 22–39, [. [CrossRef]
- Riojas-Rodríguez, H.; Da Silva, A.S.; Texcalac-Sangrador, J.L.; Moreno-Banda, G.L. Air pollution management and control in Latin America and the Caribbean: implications for climate change. Revista Panamericana de Salud Pública 2016, 40, 150–159.
- Li, Q.Q.; Guo, Y.T.; Yang, J.Y.; Liang, C.S. Review on main sources and impacts of urban ultrafine particles: Traffic emissions, nucleation, and climate modulation. Atmospheric Environment: X 2023, 19, 100221. [CrossRef]
- Espinal, G.; Nivar, S. Estudio de la contaminación ambiental al interior de las viviendas en tres barrios de la capital dominicana. Ciencia y Sociedad 2004, 29, 167–212. [CrossRef]
- Caballero-González, C. Calidad del aire e infraestructura verde. Estudio de caso: Distrito Nacional. Master’s thesis, Instituto Tecnológico de Santo Domingo (INTEC), Santo Domingo, Dominican Republic, 2020.
- Gómez Pérez, A.; Guillermo Manzanillo, L.A.; Vázquez Frías, J.; Quintana Pérez, C.E. Contaminación atmosférica en puntos seleccionados de la ciudad de Santo Domingo, República Dominicana. Ciencia y Sociedad 2014, 39, 533–557.
- Martinuzzi, S.; Locke, D.H.; Ramos-González, O.; Sanchez, M.; Grove, J.M.; Muñoz-Erickson, T.A.; Arendt, W.J.; Bauer, G. Exploring the relationships between tree canopy cover and socioeconomic characteristics in tropical urban systems: The case of Santo Domingo, Dominican Republic. Urban Forestry & Urban Greening 2021, 62, 127125. [CrossRef]
- Matos-Espinosa, C.; Delanoy, R.; Caballero-González, C.; Hernández-Garces, A.; Jauregui-Haza, U.; Bonilla-Duarte, S.; Martínez-Batlle, J.R. Assessment of PM10 and PM2.5 Concentrations in Santo Domingo: A Comparative Study Between 2019 and 2022. Atmosphere 2025, 16. [CrossRef]
- Airmetrics. MiniVol Portable Air Sampler Operation Manual. Airmetrics, Eugene, OR, USA, 2007. Accessed: 15 August 2024.
- Airmetrics. MiniVol TAS Portable Air Sampler, 2024. Accessed: 12 August 2024.
- Skyray Instrument Inc.. RoHS4 Software, Version 1.1.47_110524_R. Skyray Instrument Inc., Kunshan, Jiangsu, China, 2009. Copyright © Skyray Instrument Inc.
- Skyray Instrument Inc.. RoHS4 User Manual. Skyray Instrument Inc., Kunshan, Jiangsu, China, 2010. Edition dated 2010-12-13.
- R Core Team. R: A Language and Environment for Statistical Computing. R Foundation for Statistical Computing, Vienna, Austria, 2024.
- Wickham, H.; Averick, M.; Bryan, J.; Chang, W.; McGowan, L.D.; François, R.; Grolemund, G.; Hayes, A.; Henry, L.; Hester, J.; et al. Welcome to the tidyverse. Journal of Open Source Software 2019, 4, 1686. [CrossRef]
- Pebesma, E.J. Multivariable geostatistics in S: the gstat package. Computers & Geosciences 2004, 30, 683–691.
- Gräler, B.; Pebesma, E.; Heuvelink, G. Spatio-Temporal Interpolation using gstat. The R Journal 2016, 8, 204–218.
- Hiemstra, P.; Pebesma, E.; Twenh"ofel, C.; Heuvelink, G. Real-time automatic interpolation of ambient gamma dose rates from the Dutch Radioactivity Monitoring Network. Computers & Geosciences 2008. DOI: http://dx.doi.org/10.1016/j.cageo.2008.10.011.
- Neuwirth, E. RColorBrewer: ColorBrewer Palettes, 2022. R package version 1.1-3.
- Lee, L. NADA: Nondetects and Data Analysis for Environmental Data, 2020. R package version 1.6-1.1.
- Stacklies, W.; Redestig, H.; Scholz, M.; Walther, D.; Selbig, J. pcaMethods – a Bioconductor package providing PCA methods for incomplete data. Bioinformatics 2007, 23, 1164–1167.
- Shoari, N.; Dubé, J.S. Toward improved analysis of concentration data: embracing nondetects. Environmental toxicology and chemistry 2018, 37, 643–656.
- Matheron, G. Principles of geostatistics. Economic geology 1963, 58, 1246–1266.
- Cressie, N. Geostatistics. The American Statistician 1989, 43, 197–202.
- Isaaks, E.H.; Srivastava, R.M. Applied geostatistics: Oxford University Press. New York 1989, 561.
- Goovaerts, P.; et al. Geostatistics for natural resources evaluation; Oxford University Press on Demand, 1997.
- Pebesma, E.; Bivand, R. Spatial Data Science: With applications in R; Chapman and Hall/CRC, 2023. [CrossRef]
- Pebesma, E. Simple Features for R: Standardized Support for Spatial Vector Data. The R Journal 2018, 10, 439–446. [CrossRef]
- Wickham, H. ggplot2: Elegant Graphics for Data Analysis; Springer-Verlag New York, 2016.
- Pedersen, T.L. patchwork: The Composer of Plots, 2024. R package version 1.2.0.
- United States Environmental Protection Agency (USEPA). Method 6200: Field Portable X-ray Fluorescence Spectrometry for the Determination of Elemental Concentrations in Soil and Sediment. https://www.epa.gov/sites/default/files/2015-12/documents/6200.pdf, 2007. Revision 0.
- Beckhoff, B.; Kanngießer, H.B.; Langhoff, N.; Wedell, R.; Wolff, H., Eds. Handbook of Practical X-Ray Fluorescence Analysis; Springer Berlin Heidelberg: Berlin, Heidelberg, 2006. [CrossRef]
- Becker, S. Inorganic Mass Spectrometry: Principles and Applications; Wiley, 2008.
- Niu, J.; Rasmussen, P.E.; Wheeler, A.; Williams, R.; Chénier, M. Evaluation of airborne particulate matter and metals data in personal, indoor and outdoor environments using ED-XRF and ICP-MS and co-located duplicate samples. Atmospheric Environment 2010, 44, 235–245. [CrossRef]
- PerkinElmer, Inc.. Sensitivity, Background, Noise, and Calibration in Atomic Spectroscopy: Effects on Accuracy and Detection Limits. White paper, PerkinElmer, Inc., Waltham, MA, USA, 2018. pp. 1–11.
- WOLD, H. Estimation of principal components and related models by iterative least squares. Multivariate Analysis 1966, pp. 391–420.
- Wold, S.; Esbensen, K.; Geladi, P. Principal component analysis. Chemometrics and Intelligent Laboratory Systems 1987, 2, 37–52. Proceedings of the Multivariate Statistical Workshop for Geologists and Geochemists, . [CrossRef]
- Celo, V.; Yassine, M.M.; Dabek-Zlotorzynska, E. Insights into Elemental Composition and Sources of Fine and Coarse Particulate Matter in Dense Traffic Areas in Toronto and Vancouver, Canada. Toxics 2021, 9. [CrossRef]
- Jeong, H.; Ryu, J.S.; Ra, K. Characteristics of potentially toxic elements and multi-isotope signatures (Cu, Zn, Pb) in non-exhaust traffic emission sources. Environmental Pollution 2022, 292, 118339. [CrossRef]
- Yang, J.; Ma, L.; He, X.; Au, W.C.; Miao, Y.; Wang, W.X.; Nah, T. Measurement report: Abundance and fractional solubilities of aerosol metals in urban Hong Kong – insights into factors that control aerosol metal dissolution in an urban site in South China. Atmospheric Chemistry and Physics 2023, 23, 1403–1419. [CrossRef]
- Rasoazanany, E.O.; Andriamahenina, N.N.; Ravoson, H.N.; Andriambololona, R.; Randriamanivo, L.V.; Ramaherison, H.; Ahmed, H.; Harinoely, M. Air pollution studies in terms of PM2.5, PM2.5-10, PM10, lead and black carbon in urban areas of Antananarivo - Madagascar, 2012, [arXiv:physics.ao-ph/1204.1498].
- Laidlaw, M.A.; Filippelli, G.M. Resuspension of urban soils as a persistent source of lead poisoning in children: A review and new directions. Applied Geochemistry 2008, 23, 2021–2039. [CrossRef]
- Mielke, H.W.; Laidlaw, M.A.; Gonzales, C. Lead (Pb) legacy from vehicle traffic in eight California urbanized areas: Continuing influence of lead dust on children’s health. Science of The Total Environment 2010, 408, 3965–3975. [CrossRef]
- Resongles, E.; Dietze, V.; Green, D.C.; Harrison, R.M.; Ochoa-Gonzalez, R.; Tremper, A.H.; Weiss, D.J. Strong evidence for the continued contribution of lead deposited during the 20th century to the atmospheric environment in London of today. Proceedings of the National Academy of Sciences 2021, 118, e2102791118, [https://www.pnas.org/doi/pdf/10.1073/pnas.2102791118]. [CrossRef]
- O’Day, P.A.; Pattammattel, A.; Aronstein, P.; Leppert, V.J.; Forman, H.J. Iron Speciation in Respirable Particulate Matter and Implications for Human Health. Environmental Science & Technology 2022, 56, 7006–7016, [. [CrossRef] [PubMed]
- Furutani, H.; Jung, J.; Miura, K.; Takami, A.; Kato, S.; Kajii, Y.; Uematsu, M. Single-particle chemical characterization and source apportionment of iron-containing atmospheric aerosols in Asian outflow. Journal of Geophysical Research: Atmospheres 2011, 116, [https://agupubs.onlinelibrary.wiley.com/doi/pdf/10.1029/2011JD015867]. [CrossRef]
- Spada, N.J.; Cheng, X.; White, W.H.; Hyslop, N.P. Decreasing Vanadium Footprint of Bunker Fuel Emissions. Environmental Science & Technology 2018, 52, 11528–11534, [. [CrossRef] [PubMed]
- Tao, L.; Fairley, D.; Kleeman, M.J.; Harley, R.A. Effects of Switching to Lower Sulfur Marine Fuel Oil on Air Quality in the San Francisco Bay Area. Environmental Science & Technology 2013, 47, 10171–10178, [. [CrossRef] [PubMed]
- González-Romero, A.; González-Flórez, C.; Panta, A.; Yus-Díez, J.; Reche, C.; Córdoba, P.; Moreno, N.; Alastuey, A.; Kandler, K.; Klose, M.; et al. Variability in sediment particle size, mineralogy, and Fe mode of occurrence across dust-source inland drainage basins: the case of the lower Drâa Valley, Morocco. Atmospheric Chemistry and Physics 2023, 23, 15815–15834. [CrossRef]
- Harrison, R.M.; Jones, A.M.; Lawrence, R.G. Major component composition of PM10 and PM2.5 from roadside and urban background sites. Atmospheric Environment 2004, 38, 4531–4538. [CrossRef]
- Karagulian, F.; Belis, C.A.; Dora, C.F.C.; Prüss-Ustün, A.M.; Bonjour, S.; Adair-Rohani, H.; Amann, M. Contributions to cities’ ambient particulate matter (PM): A systematic review of local source contributions at global level. Atmospheric Environment 2015, 120, 475–483. [CrossRef]
- McComb, J.Q.; Rogers, C.; Han, F.X.; Tchounwou, P.B. Rapid Screening of Heavy Metals and Trace Elements in Environmental Samples Using Portable X-Ray Fluorescence Spectrometer, A Comparative Study. Water, Air, & Soil Pollution 2014, 225, 2169. [CrossRef]
- Cai, J.; Ge, Y.; Li, H.; Yang, C.; Liu, C.; Meng, X.; Wang, W.; Niu, C.; Kan, L.; Schikowski, T.; et al. Application of land use regression to assess exposure and identify potential sources in PM2.5, BC, NO2 concentrations. Atmospheric Environment 2020, 223, 117267. [CrossRef]
- Wang, Q.; Cheng, N.; Li, S.; Dong, M.; Wang, X.; Ge, L.; Guo, T.; Li, W.; Gao, X. An Amended Chemical Mass Balance Model for Source Apportionment of PM2.5 in Typical Chinese Eastern Coastal Cities. CLEAN – Soil, Air, Water 2019, 47, 1800115, [https://onlinelibrary.wiley.com/doi/pdf/10.1002/clen.201800115]. [CrossRef]
Table 1.
Descriptive statistics of metal concentrations (ppm) in PM2.5 after imputation using regression on order statistics (ROS)
Table 1.
Descriptive statistics of metal concentrations (ppm) in PM2.5 after imputation using regression on order statistics (ROS)
| Metal | Mean | Median | Max | Min | Standard Deviation | Standard Error | Variance | N Censored |
|---|---|---|---|---|---|---|---|---|
| As | 2.48 | 2.40 | 4.9 | 1.17 | 0.88 | 0.16 | 0.77 | 10 |
| Cd | 3.20 | 2.50 | 10.0 | 0.58 | 2.39 | 0.44 | 5.71 | 11 |
| Cr | 4.04 | 3.70 | 10.2 | 1.31 | 2.08 | 0.38 | 4.32 | 6 |
| Cu | 21.89 | 22.00 | 26.2 | 19.00 | 1.98 | 0.36 | 3.91 | 0 |
| Fe | 13.32 | 12.90 | 28.0 | 4.94 | 6.10 | 1.11 | 37.19 | 14 |
| Ni | 6.29 | 6.75 | 8.0 | 2.40 | 1.40 | 0.26 | 1.97 | 1 |
| Pb | 6.78 | 6.10 | 12.2 | 2.27 | 3.10 | 0.57 | 9.60 | 7 |
| V | 13.07 | 9.32 | 36.9 | 2.41 | 9.18 | 1.68 | 84.32 | 15 |
| Zn | 20.04 | 19.80 | 22.0 | 17.90 | 0.90 | 0.16 | 0.80 | 0 |
Table 2.
Descriptive statistics of metal concentrations (ppm) in PM10 after imputation using regression on order statistics (ROS)
Table 2.
Descriptive statistics of metal concentrations (ppm) in PM10 after imputation using regression on order statistics (ROS)
| Metal | Mean | Median | Max | Min | Standard Deviation | Standard Error | Variance | N Censored |
|---|---|---|---|---|---|---|---|---|
| Cd | 3.79 | 3.20 | 9.4 | 0.83 | 2.39 | 0.44 | 5.73 | 10 |
| Cr | 3.89 | 3.60 | 7.1 | 1.51 | 1.57 | 0.29 | 2.45 | 3 |
| Cu | 21.15 | 21.25 | 26.0 | 15.50 | 2.66 | 0.49 | 7.08 | 0 |
| Fe | 11.60 | 9.91 | 28.4 | 3.41 | 6.43 | 1.17 | 41.36 | 19 |
| Ni | 6.25 | 6.35 | 7.6 | 3.50 | 1.11 | 0.20 | 1.23 | 0 |
| Pb | 6.55 | 6.55 | 12.9 | 1.67 | 3.35 | 0.61 | 11.23 | 4 |
| V | 8.61 | 4.10 | 43.6 | 0.38 | 10.27 | 1.88 | 105.56 | 16 |
| Zn | 20.14 | 20.15 | 21.2 | 18.20 | 0.70 | 0.13 | 0.50 | 0 |
Disclaimer/Publisher’s Note: The statements, opinions and data contained in all publications are solely those of the individual author(s) and contributor(s) and not of MDPI and/or the editor(s). MDPI and/or the editor(s) disclaim responsibility for any injury to people or property resulting from any ideas, methods, instructions or products referred to in the content. |
© 2025 by the authors. Licensee MDPI, Basel, Switzerland. This article is an open access article distributed under the terms and conditions of the Creative Commons Attribution (CC BY) license (http://creativecommons.org/licenses/by/4.0/).
Copyright: This open access article is published under a Creative Commons CC BY 4.0 license, which permit the free download, distribution, and reuse, provided that the author and preprint are cited in any reuse.


