
Submitted:
24 December 2024
Posted:
25 December 2024
You are already at the latest version
Abstract
This study investigates long-term trends in fine particulate matter (PM2.5) composition and oxidative potential in Los Angeles. While regulatory interventions have reduced PM2.5 mass concentration and primary combustion-related components (e.g., organic carbon (OC) and elemental carbon (EC)), our findings reveal a more complex PM2.5 toxicity pattern. From 2001–2008, PM2.5 oxidative potential, measured via the dithiothreitol (DTT) assay, declined from ~0.84 to ~0.16 nmol/min/m3, coinciding with stringent tailpipe emission controls. However, after this initial decline, PM2.5 DTT stabilized and gradually rose from ~0.35 in 2012 to ~0.97 nmol/min/m3 by 2024, reflecting a shift in PM2.5 composition toward non-tailpipe emissions’ tracers, and the growing importance of their sources, such as brake/tire wear. Metals and trace elements, such as iron (Fe, ~150 ng/m3) and zinc (Zn, ~10 ng/m3), remained relatively stable as OC and EC declined, resulting in non-tailpipe contributions dominating PM2.5 toxicity. Although PM2.5 mass concentrations were effectively reduced, the growing contribution of non-tailpipe emissions (e.g., brake/tire wear and secondary organic aerosols) to PM2.5 toxicity underscores the limitations of mass-based standards and tailpipe-focused strategies. Our findings emphasize the need to broaden regulatory strategies, targeting emerging sources that shape PM2.5 composition and toxicity, and ensuring more meaningful improvements in public health outcomes.
Keywords:
DTT assay
; PM toxicity
; PM2.5
; Oxidative potential
1. Introduction
Ambient particulate matter (PM) is a critical environmental health concern globally, associated with many adverse health effects, including respiratory and cardiovascular diseases, lung cancer, and increased mortality rates [1,2]. PM is categorized based on aerodynamic diameter into coarse (PM2.5-10, 2.5 µm ≤ dp ≤ 10 µm), fine (PM2.5, dp ≤ 2.5 µm), and ultrafine particles (UFPs, dp <0.1 µm) [3,4,5,6,7]. PM2.5 poses significant health risks due to its ability to penetrate deep into the lungs, depositing in the alveolar sacs and triggering inflammation and systemic oxidative stress [1,8,9]. Deposited particles translocate into the bloodstream and reach other organs, potentially causing cardiovascular and neurological disorders [10,11,12]. Studies have demonstrated that residents in urban environments where vehicular emissions are the primary source of PM, such as Los Angeles, experience higher incidences of asthma, lung cancer, and cardiovascular diseases compared to those in less polluted areas [13,14,15,16,17]. In the early 2000s, Los Angeles was often subject to frequent air quality alerts, raising concerns among health professionals about the escalating rates of respiratory illnesses, especially among vulnerable populations like children and the elderly [18,19,20]. This public health crisis incited efforts to implement stringent regulatory actions aimed at reducing PM emissions from vehicular and industrial sources [21,22,23,24].
Over the past decades, a comprehensive set of federal and state-level air quality measures have substantially improved air quality in Los Angeles and across California [24,25,26]. At the federal level, the U.S. Environmental Protection Agency (U.S. EPA) introduced the National Ambient Air Quality Standard (NAAQS) for PM2.5 in 1987, aiming to reduce ambient concentrations of PM2.5 [27,28]. At the state level, the California Air Resources Board (CARB) introduced stringent vehicular emissions programs with the Low Emission Vehicle I (LEV I) initiative in 1990, later followed by LEV II, LEV III, and the Zero-Emission Vehicle (ZEV) program, each tightening emissions limits on non-methane organic gases (NMOG), carbon monoxide (CO), nitrogen oxides (NOx), and PM [29,30,31]. Additional actions included the Diesel Risk Reduction Plan (2000), financial incentives for replacing high-polluting vehicles (1998–2012), such as the Cleaner Port Truck (CPT) program (2007), Drayage Truck Regulation (2008), and At-Berth Regulation (2010), targeting diesel PM and NOx emissions from freight and maritime activities [32,33,34,35]. In 2013, the Low Carbon Fuel Standard (LCFS) further encouraged the adoption of cleaner fuels, cutting both particulate and greenhouse gas emissions [36,37]. Hasheminassab et al. (2014) [22] conducted a comprehensive analysis of ambient PM2.5 in the Los Angeles Basin from 2002 to 2012, finding a notable reduction in PM2.5 concentrations, largely attributed to decreased vehicular emissions resulting from the CARB’s regulations. Similarly, Lurmann et al. (2015) [24] highlighted a 21% reduction in PM2.5 and significant decreases in NOx and volatile organic compounds (VOCs) over two decades. These improvements underscore the effectiveness of regulatory measures in mitigating air pollution. However, despite these successes, recent studies indicate that the particle number concentration (PNC) of UFPs has not decreased proportionally and may have plateaued from 2016 onwards [26], suggesting that existing regulations may not sufficiently address UFP emissions, potentially due to the complex nature of UFP sources and formation mechanisms, such as secondary formation and non-tailpipe emissions [4,38,39]. Moreover, PM comprises a diverse mix of chemical components, including organic compounds, metals, and biological materials, with varying levels of toxicity [40,41,42,43]. Transition metals and polycyclic aromatic hydrocarbons from combustion processes have been associated with higher oxidative potential, posing greater health risks even as overall PM mass declines [44,45]. Consequently, PM mass concentration alone may not adequately reflect the health impacts, emphasizing the need to consider PM composition and toxicity [46,47,48].
One of the primary mechanisms underlying the adverse health effects of PM exposure is the induction of oxidative stress resulting from interactions with biological systems [49,50]. Oxidative stress occurs when the generation of reactive oxygen species (ROS) exceeds the body’s antioxidant defenses, leading to cellular damage, inflammation, and exacerbation of respiratory and cardiovascular diseases [51,52]. To quantify the oxidative potential of PM, several assays have been developed, with the dithiothreitol (DTT) assay being one of the most widely used [53,54,55,56]. The DTT assay measures the capacity of PM to catalyze electron transfer from DTT to oxygen, simulating redox reactions in biological systems. The rate of DTT consumption correlates with the particle’s ability to generate ROS, serving as an indicator of oxidative potential [45,57,58]. Studies utilizing the DTT assay have provided valuable insights into the relationship between PM composition and toxicity. Verma et al. (2015) [58] demonstrated that organic aerosols and transition metals significantly contribute to the oxidative potential of PM2.5. Despite reductions in PM mass concentrations in Los Angeles, the oxidative potential of PM may not have decreased proportionally, possibly due to shifts in PM composition towards more toxic constituents [25,59].
The disconnect between trends of PM mass concentration and toxicity underscores an urgent need to reevaluate air quality metrics and regulatory strategies [6,46,47,60]. Relying solely on mass-based standards may not fully consider the increased health risks posed by the oxidative potential of PM. This study aims to investigate the long-term temporal trends in PM toxicity, focusing on the oxidative potential of PM2.5 as measured by the DTT assay in Los Angeles, potentially resulting from PM emissions regulations. By examining data spanning the last two decades, we sought to understand the influence of regulatory measures on oxidative potential, considering that none of the regulations specifically targets PM toxicity. This analysis fills a critical knowledge gap and provides insights for policymakers, enabling them to adapt and enhance current and future strategies aimed at improving air quality and public health. By focusing on both PM mass and toxicity, we can develop a more comprehensive understanding of the health impacts of air pollution and devise more effective regulatory interventions.
2. Methods
2.1. Data Collection
Data for PM2.5 oxidative potential were collected through a comprehensive review of studies conducted over the past two decades [52,54,59,61,62,63,64,65,66,67,68,69,70,71]. The initially reported DTT data were presented in different units by various studies (i.e., some as activity per mass of PM, others per volume of air) and were converted between these units using the respective PM mass and sampling duration measurements, ensuring that all DTT data could be directly compared on a consistent basis. Moreover, DTT activity per volume was presented in the main text as it more directly reflects inhalation exposure scenarios, providing a more relevant metric of aerosol oxidative potential for environmental and public health assessments compared to mass-normalized values [72]. Detailed information on each study, including year of sampling, sampling period, and locations, is provided in Table S1. Most of the DTT data was sourced from the particle instrumentation unit (PIU) of the University of Southern California (USC), which is located in an urban area near downtown Los Angeles, 150 m downwind of a major freeway (I-110). Additionally, the trends of different chemical species such as metals (i.e., barium (Ba), copper (Cu), manganese (Mn), zinc (Zn), chromium (Cr), nickel (Ni), cadmium (Cd), and iron (Fe)) as well as inorganic ions (i.e., sulfate (SO4-2) and nitrate (NO3-) were obtained from the North Main Street monitoring station, operated by the U.S. EPA as part of the Air Quality System (AQS) and Chemical Speciation Network (CSN) (EPA, 2024). These trends correspond to the sampling periods of the reviewed DTT studies. It should be noted that these trends were only available from 2005 to 2024, as the CSN did not provide data prior to 2005, and no metals data were available in 2005.
2.2. Additional Sampling, Instrumentation, and Analysis in 2024
The sampling campaigns for PM2.5 were conducted at the PIU of the USC during January and February 2024. For PM2.5 collection, pre-baked quartz filters were used in Sioutas Personal Cascade Impactor Samplers (PCISs, SKC Inc., Eighty-Four, PA, USA), operating with a flow rate set at 9 liters per minute [74,75], to ensure accurate mass measurements.
The oxidative potential of collected PM2.5 samples was assessed using the DTT assay following established protocols [45,54,76]. Briefly, PM extracts were incubated with a DTT solution, and the rate of DTT consumption was measured spectrophotometrically, which serves as an indicator of the particle’s capacity to generate ROS. All assays were performed in triplicate and under controlled laboratory conditions to ensure consistency and reliability of the results. It should be noted that the DTT data provided for PM2.5 DTT in 2008 were obtained using the same methodology as described by Verma et al. (2009) [69].
3. Results and Discussions
3.1. Long-Term Trends in PM2.5 Composition
This section presents the yearly averaged concentrations of various PM2.5 species based on data retrieved from the AQS, as shown in Figures 1–3, which illustrate long-term trends in PM2.5 components in Los Angeles. Additionally, discrete sampling data were also retrieved from the AQS but were limited to the specific dates provided by prior studies for DTT measurements. These discrete sampling data are presented in the Supplementary Information (Figures S1–S3), providing further context on the evolving PM2.5 composition and insights into the specific dates when DTT activity was measured.
3.1.1. Carbonaceous Species: Organic Carbon and Elemental Carbon
Figure 1 presents the yearly averaged concentrations of OC and EC in Los Angeles from 2007 to 2024, revealing two distinct subperiods for both species. During the first subperiod (2007–2016), OC overall decreased from 7.98 µg/m3 in 2007 to 3.43 µg/m3 by 2016. Despite a brief increase to 6.35 µg/m3 in 2011, these marked reductions align with an array of diesel- and fuel-specific regulations implemented during the 2000s and early 2010s, including CARB’s Diesel Risk Reduction Plan (2000), the Low Emission Vehicle II (CA LEV-II) program (2004–2010), and the Cleaner Port Truck (CPT) program (2007) targeting heavy-duty fleets at the ports [30,34]. This trend aligns with the results of Badami et al. (2024) [26], noting that pollutant reductions were more pronounced during earlier years (2007–2015) due to impactful regulatory efforts targeting primary tailpipe emissions. In contrast, the second subperiod (2017–2024) is characterized by a plateau in OC, varying between approximately 3.43 µg/m3 in 2019 and 5.26 µg/m3 in 2020 before settling around 3.50 µg/m3 in 2024. This stabilization, coupled with intermittent spikes (e.g., the notable increase in 2020 possibly linked to wildfires, including the Bobcat wildfire [77], suggests that while tailpipe emissions have been effectively controlled, ongoing contributions from non-tailpipe and secondary aerosol sources continue to influence ambient OC levels [5,66,78,79]. This trend is consistent with the findings of Badami et al. (2024) [26], who demonstrated a similar plateau in primary pollutant levels since 2016, underscoring the diminished impact of current regulatory measures and the need for stricter standards, although CARB continued to tighten regulations (e.g., via the Low Emission Vehicle III (CA LEV-III) program (2015) and the Innovative Clean Transit Rule (2018)). Discrete sampling data corresponding to DTT activity, illustrated in Figure S1, generally align with the overall decreasing trends but also reveal shorter-term variations possibly driven by meteorological factors and transient emission episodes, such as wildfires.
EC exhibits a similar two-phase trend over the same period, with concentrations declining significantly from 2.57 µg/m3 in 2007 to 0.78 µg/m3 in 2016 during the first phase. This marked reduction highlights the success of diesel-specific regulations and fleet modernization in curbing combustion-derived PM2.5 emissions [34]. However, beginning in 2017, EC levels stabilized below 1 µg/m3 without a consistent downward trend, fluctuating between 0.43 µg/m3 in 2018 and 0.97 µg/m3 in 2020 before settling in the range of 0.46–0.62 µg/m3 by 2024. These findings suggest that residual combustion sources continue to contribute to EC levels, highlighting the need for additional regulatory measures to address these emissions [30]. This trend aligns with observations from Badami et al. (2024) [26], which emphasize the initial effectiveness of regulations followed by a plateau in pollutant levels, underscoring the limitations of existing controls. The concurrent EC measurements corresponding to DTT activity (Figure S1) further support these trends, revealing episodic surges that highlight the interplay between effective tailpipe regulations and transient emission sources. Collectively, the two-phase evolution observed for both OC and EC indicates a sustained decline in primary tailpipe emissions during the earlier years, followed by stabilization in recent years.
3.1.2. Inorganic Ions: Nitrate and Sulfate
Figure 2 illustrates yearly averaged sulfate and nitrate concentrations in Los Angeles from 2005 to 2024, revealing two subperiods consistent with the broader regulatory timeline. During the first subperiod (2005–2016), sulfate decreased from approximately 3.11 µg/m3 in 2005 to 1.06 µg/m3 in 2016, while nitrate similarly declined from 3.88 µg/m3 in 2005 to 1.55 µg/m3 by 2016. This substantial reduction aligns with progressively stricter sulfur and nitrogen oxide controls, including ultra-low sulfur fuel mandates [22,65], the U.S. EPA Tier 2 program [80], and CARB’s Diesel Risk Reduction Plan, all of which targeted on-road and off-road sources of NOx and SOx [5,59]. In the second subperiod (2016–2024), both sulfate and nitrate remain below their mid-2000s levels but exhibit minor variability. For instance, sulfate concentrations stabilized around 1.50 µg/m3 during 2011–2015, followed by a gradual decline to 0.78 µg/m3 by 2024. Nitrate similarly stabilizes to values near 1.5–2.0 µg/m3 after 2016, with modest variability across the later years. These plateaus suggest that while tailpipe regulations and fuel improvements have significantly curtailed sulfate and nitrate formation pathways, other factors – including regional atmospheric chemistry, wildfires, and potential contributions from stationary sources – can produce episodic elevations [22,69,81].
Additionally, sulfate and nitrate exhibit broadly consistent downward trends in both the annual AQS dataset (Figure 2) and the discrete sampling intervals used in previous DTT-focused studies (Figure S2). This consistency possibly stems from stronger and more direct controls on sulfur content in fuels and NOx emissions from on-road and off-road engines, resulting in relatively stable, long-term reductions in these inorganic ions [80]. In contrast, OC and EC levels display more pronounced fluctuations between the annual and discrete datasets. The difference arises because EC and especially OC are influenced by a broader range of sources – beyond tailpipe emissions – including mechanical abrasion (e.g., brake and tire wear), secondary organic aerosol formation VOCs, and re-suspended dust [25,82,83]. These non-tailpipe processes are not as directly constrained by existing regulations, leading to less uniform and, at times, divergent trends when comparing annual means to snapshots aligned with DTT sampling. As a result, even though EC and OC exhibit predominant declines from early regulatory efforts, their more diverse and evolving source profiles yield significant year-to-year variability not seen in the comparatively steadier trajectories of sulfate and nitrate.
3.1.3. Trace Elements and Metals
Figure 3 illustrates the yearly trends of key trace elements and metal species in Los Angeles between 2005 and 2024, indicating a comparatively stable pattern over this interval. While OC and EC exhibit clear subperiods of decline, the concentrations of metals such as Ba, Cr, Cu, Fe, Mn, Ni, Ti, and Zn remain relatively constant or fluctuate, reflecting non-tailpipe and largely unregulated sources (e.g., brake/tire wear, resuspended road dust, and industrial emissions) [68,84,85]. In particular, Fe shows the highest concentrations, ranging from approximately 100–170 ng/m3, with an average of almost 150 ng/m3 during this period and occasional spikes, such as ~210 ng/m3 in 2020. Other metals, including Ba, Zn, and Cu, exhibit concentrations around 10–20 ng/m3, consistent with previous findings in the literature [66,84].
These metals do not exhibit the sustained downward trends observed for combustion-related species, indicating that stricter tailpipe regulations have reduced OC and EC emissions, and metals might have emerged as more important contributors to PM2.5 toxicity [59]. Concurrent sampling intervals corresponding to reported DTT activities (Figure S3) support this observation, showing that metal concentrations remain substantial even when OC and EC levels are comparatively low. The stable concentrations of metals, combined with the declining trends of tailpipe emission tracers (e.g., OC and EC), suggest an increasing relative contribution of non-tailpipe metal sources to PM2.5 oxidative potential as their proportion in PM2.5 mass concentrations continues to grow, which will be explored in greater detail in the following sections.
3.1.4. Long-Term Trends of the Ratio of Trace Elements and Metals to Elemental Carbon
To further illustrate the shift from tailpipe to non-tailpipe sources, Figure 4 presents yearly concentration ratios of Fe/EC, Zn/EC, Cu/EC, and Ti/EC from 2007 to 2024. These ratios were derived using the extensive yearly dataset, beyond the discrete sampling days, to provide a broader and more representative perspective. To account for the different scales of mean metals’ concentrations, particularly Fe, compared to others, the ratios were normalized using Shift Z-Score Normalization. This method standardizes the data by subtracting the mean and dividing it by the standard deviation for each metal, ensuring comparability across species. Additionally, a constant equal to the minimum Z-score was added to all normalized values to eliminate negative values [86].
The normalized Fe/EC ratio, for example, shows a steady increase from approximately 0.47 in 2007 to 3.65 in 2018, maintaining values around 2.0 in the early 2020s. Similar upward trends are observed for Zn/EC and Cu/EC. The earlier regulatory years exhibit significantly lower metal-to-EC ratios, reflecting the dominant influence of tailpipe emissions during that time. These rising metal/EC ratios further corroborate the arguments in the previous sections that as regulations effectively reduced tailpipe-related EC emissions in the earlier years, non-tailpipe sources, such as tire and brake wear and re-suspended road dust, contributed an increasing fraction to the PM2.5 composition [30,84]. This shift might suggest an increased role of non-tailpipe sources in influencing the oxidative potential of ambient aerosols, as their proportional contribution to PM2.5 mass has grown relative to declining tailpipe emissions, which is in agreement with the results reported in the literature [25].
3.2. Trends in DTT Activity and Correlations with Species
3.2.1. Long-Term Trends of Oxidative Potential of PM2.5
Figure 5 presents the long-term oxidative potential of PM2.5, measured by the DTT activity per volume, from 2001 to 2024, revealing two distinct subperiods. The first subperiod (2001–2008) is characterized by a pronounced decline in DTT activity, which decreased from approximately 0.836 nmol/min/m3 in 2001 to 0.163 nmol/min/m3 by 2007. This substantial reduction corresponds to the early phase of California’s Diesel Risk Reduction Plan (initiated in 2000), the implementation of stricter standards under the U.S. EPA Tier 2 program (2004), Cleaner Port Truck Program (2007), and Drayage Truck Regulation (2008) [32,33]. These regulatory actions significantly reduced combustion-derived particulate matter, thereby diminishing the oxidative burden associated with tailpipe emissions.
The second subperiod (2012–2024) reveals a gradual rise in DTT activity, increasing from approximately 0.35 nmol/min/m3 in 2012 to nearly 0.97 nmol/min/m3 by 2024. This trend indicates that while overall PM mass and primary tailpipe tracers such as EC and OC have declined due to ongoing regulatory efforts, alternative sources – particularly non-tailpipe emission tracers (e.g., Fe, Cu, Zn from brake and tire wear) and secondary organic aerosols – have become increasingly significant in influencing PM2.5 oxidative potential [66]. These findings align with the concurrent shift in PM composition discussed in Section 3.1.3 and Section 3.1.4, where metals and friction-derived emissions emerged as major contributors to ambient toxicity. As older diesel fleets were retrofitted or replaced and advanced emissions controls were implemented, the relative contribution of non-tailpipe sources grew, reflecting a broader transformation in the composition of urban PM in Los Angeles [5,87]. Consequently, the PM2.5 DTT activity per volume highlights an evolving toxicity profile increasingly driven by mechanisms and species not directly targeted by traditional tailpipe-focused regulations.
Figure S4 further complements this analysis by presenting the long-term trend of DTT activity per PM2.5 mass in Los Angeles. Similar to the per-volume metric, DTT per mass reveals two subperiods, with an initial decline during the early regulatory years, consistent with the success of early tailpipe-focused measures. However, following this initial reduction, DTT per mass exhibits a much slower rate of decrease, approaching a near-stable or very slow decline in later years. This subtle downward trend suggests a gradual rather than pronounced reduction in intrinsic aerosol toxicity over time.
The distinction between per-volume and per-mass trends highlights a shift in PM2.5 composition. The initial reduction in DTT activity per volume reflects regulatory success in reducing the overall ambient PM concentration. However, the slower decline in DTT activity per mass suggests that the composition of the remaining PM has shifted toward a higher relative contribution of more toxic components, such as non-tailpipe metals, secondary organic aerosols, and frictional emissions. This compositional shift underscores the growing proportional role of unregulated sources as primary components like sulfates, nitrates, and EC were reduced. These trends suggest that while overall PM2.5 mass concentrations declined due to tailpipe emission controls, the oxidative potency of the remaining PM2.5 mass remains significant, driven by emerging non-tailpipe and secondary sources., emphasizing the importance of expanding regulatory efforts to address these sources to further mitigate PM2.5 toxicity.
3.2.2. Correlations of Species with PM2.5 DTT Activity
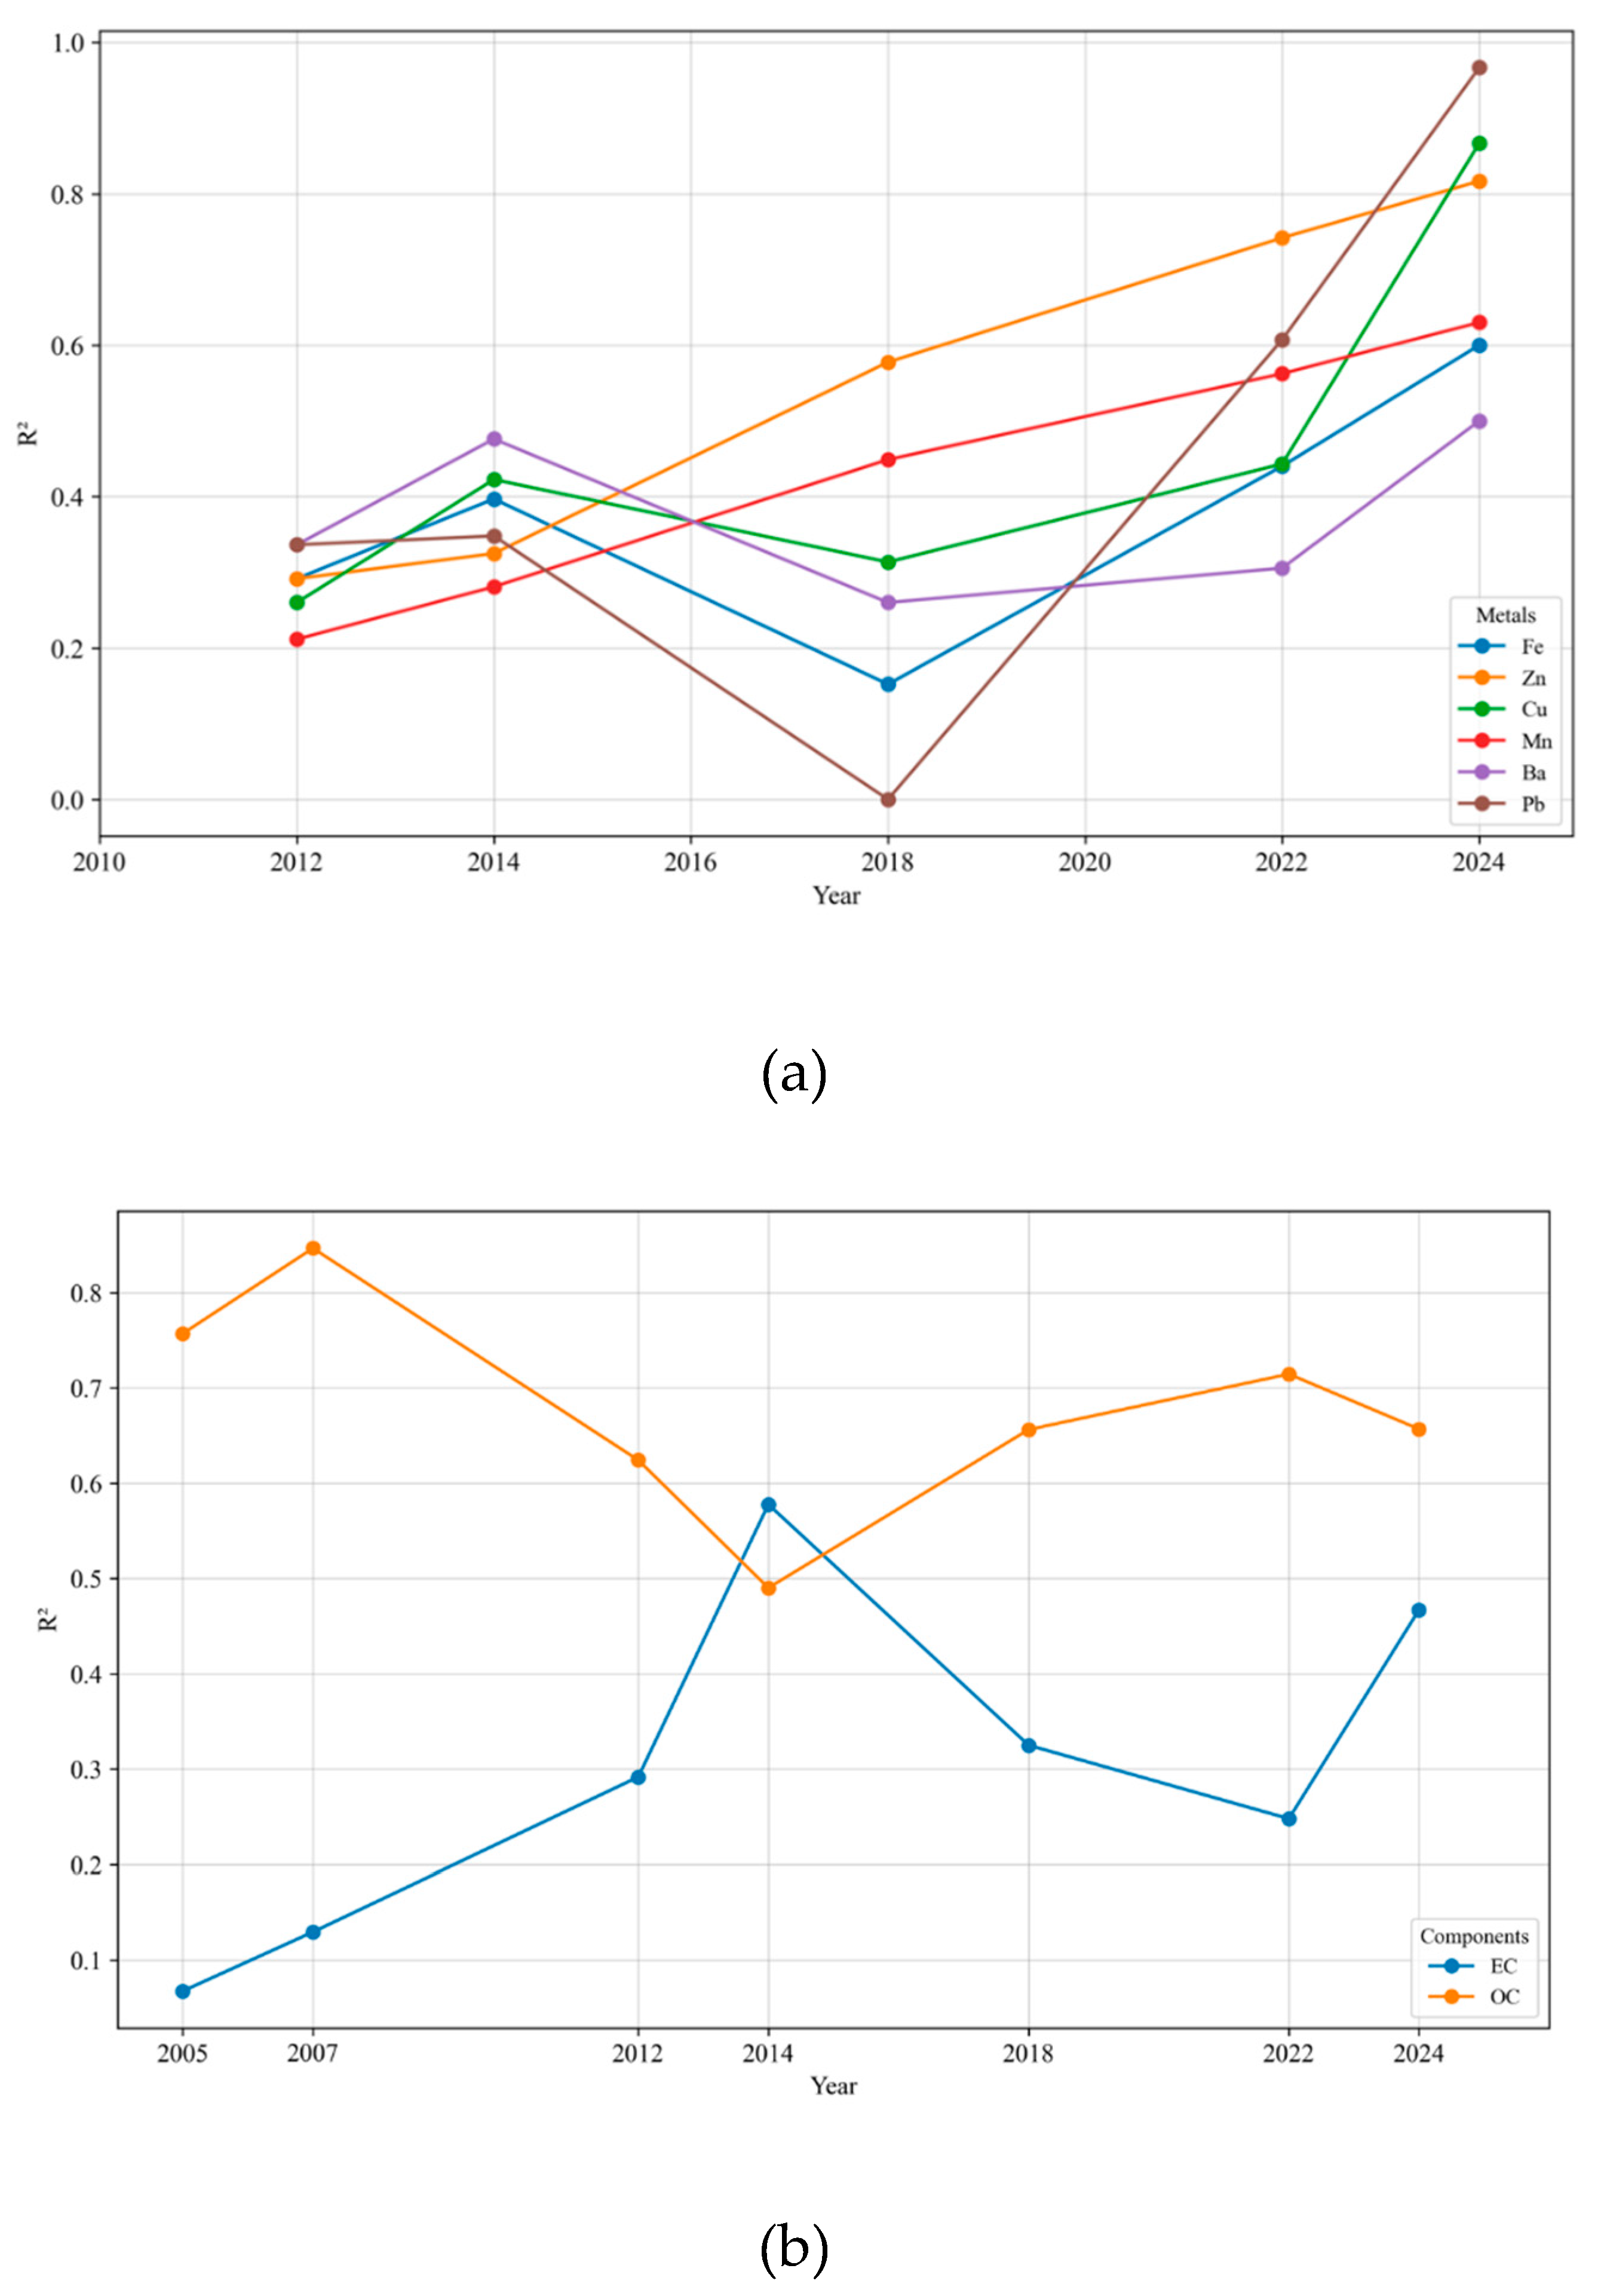
Figure 6 (a, b) presents long-term trends in the correlations between DTT activity and key PM2.5 constituents, including EC, OC, Fe, Zn, Cu, Mn, and Pb, based on data collected in Los Angeles from 2012 to 2024. Only statistically significant correlations (p < 0.05) are shown in the figure. Over time, the correlations between metals (e.g., Fe, Zn, Cu, Mn, and Pb) and DTT activity tend to strengthen, consistent with earlier studies that identified transition metals as major drivers of PM oxidative potential [57,88,89,90]. By the 2015–2018 period, correlation coefficients for these metals were notably higher, reflecting the increasing contribution of non-tailpipe metal emissions to the oxidative potential of fine PM as tailpipe-related sources diminished under the influence of regulatory measures [84,89]. Although the 2018 dataset [62] included averages from multiple global cities – potentially introducing some variability not solely attributable to local factors – the overall pattern still aligns with the observed decline in combustion-related influences and the growing significance of non-tailpipe sources, such as brake and tire wear, as key contributors to PM2.5 toxicity.
For OC and EC, contrasting trends are observed in their correlations with DTT activity. OC exhibits a slight decreasing trend in correlation, which may indicate the reduced role of tailpipe emissions in driving the oxidative potential of fine PM over time [25]. Moreover, OC consistently displays stronger correlations with DTT activity compared to EC, with the exception of one year, in agreement with the previous studies [91]. This suggests that OC has a greater intrinsic role in contributing to oxidative potential. In contrast, EC shows a modest increase in its correlation with DTT activity, a trend possibly driven by its concurrent emissions with non-tailpipe tracers, such as metals, which are strongly correlated with the oxidative potential of fine PM, rather than its own inherent toxicity. The rising correlation of EC with DTT activity may, therefore, reflect the indirect influence of non-tailpipe sources on oxidative potential. These trends underscore the growing importance of emissions from non-tailpipe emissions and resuspension processes in the modern PM2.5 chemical composition in megacities such as Los Angeles [25]. Despite the slight decrease trend of OC levels and its correlations with the oxidative potential of fine PM, it still remains high, highlighting the importance of other sources of OC, such as photochemistry, biomass combustion, and non-tailpipe emissions, in addition to primary emissions that are also part of OC [5,25].
4. Summary and Conclusions
This study examined long-term trends in both the composition and oxidative potential of PM2.5 in Los Angeles over the past two decades, with a particular focus on the DTT assay as an indicator of particle-induced oxidative stress. Our results demonstrate that although mass concentrations of key combustion markers (e.g., OC and EC) have markedly declined – particularly before 2016 – there has been a subsequent shift in PM2.5 composition toward non-tailpipe emissions tracers. These species, which remained largely unregulated, accounted for a growing fraction of PM2.5 toxicity. This transition was reflected in the partial resurgence or plateau of DTT activity per mass between 2012 and 2024 and the increase in the per volume DTT activity of fine PM, as well as the increasing correlation trends. Metals including Fe, Cu, and Zn remained relatively stable or even proportionally increased within the PM2.5 composition, underscoring their elevated oxidative potential in a context where traditional tailpipe emissions have already been substantially mitigated. The growing contribution of non-tailpipe emissions and secondary aerosol formation suggests that residual toxicity is increasingly driven by unregulated sources. These findings suggest prioritizing unregulated sources – particularly non-tailpipe metals and secondary organics – will be crucial for further improving air quality and protecting public health. Policymakers could consider integrating toxicity metrics like oxidative potential (e.g., DTT activity) alongside mass concentration limits in future regulatory frameworks to target both total PM mass and its most hazardous chemical components.
Supplementary Materials
The following supporting information can be downloaded at the website of this paper posted on Preprints.org.
Author Contributions
Conceptualization, M.B., and Y.A.; methodology, M.B., and Y.A.; formal analysis, M.B., and Y.A.; investigation, M.B., and Y.A.; resources, C.S.; data curation, M.B., and Y.A.; writing—original draft preparation, M.B., and Y.A.; writing—review and editing, M.B., Y.A., and C.S.; visualization, M.B.; supervision, C.S.; funding acquisition, C.S. All authors have read and agreed to the published version of the manuscript.
Funding
This study was funded by the National Institutes of Health (NIH) (grant numbers: 5R01ES033660-03, 1RF1NS130681-01, and 5R01AI065617-23).
Institutional Review Board Statement
Not applicable.
Informed Consent Statement
Not applicable.
Data Availability Statement
Dataset available on request from the authors.
Acknowledgments
This study was funded by the National Institutes of Health (NIH) (grant numbers: 5R01ES033660-03, 1RF1NS130681-01, and 5R01AI065617-23). The authors are grateful to the Viterbi School of Engineering, University of Southern California Ph.D. fellowship award.
Conflicts of Interest
The authors declare no conflicts of interest.
References
- Brook RD, Rajagopalan S, Pope CA, Brook JR, Bhatnagar A, Diez-Roux AV, et al. Particulate matter air pollution and cardiovascular disease: An update to the scientific statement from the american heart association. Circulation 2010;121:2331–78. [CrossRef]
- Pope CA, Dockery DW. Health effects of fine particulate air pollution: Lines that connect. Journal of the Air and Waste Management Association 2006;56:709–42. [CrossRef]
- Becker S, Soukup JM. Coarse (PM2.5-10), fine (PM2.5), and ultrafine air pollution particles induce/increase immune costimulatory receptors on human blood-derived monocytes but not on alveolar macrophages. Journal of Toxicology and Environmental Health - Part A 2003;66:847–59. [CrossRef]
- Sioutas C, Delfino RJ, Singh M. Exposure assessment for atmospheric Ultrafine Particles (UFPs) and implications in epidemiologic research. Environmental Health Perspectives 2005;113:947–55. [CrossRef]
- Tohidi R, Altuwayjiri A, Sioutas C. Investigation of organic carbon profiles and sources of coarse PM in Los Angeles. Environmental Pollution 2022;314:120264. [CrossRef]
- WHO. WHO global air quality guidelines: particulate matter (PM2.5 and PM10), ozone, nitrogen dioxide, sulfur dioxide and carbon monoxide: executive summary 2021. https://www.who.int/publications/i/item/9789240034433 (accessed November 29, 2024).
- Aghaei Y, Sajadi B, Ahmadi G. The effect of the mucus layer and the inhaled air conditions on the droplets fate in the human nasal cavity: A numerical study. Journal of Aerosol Science 2023;171:113260. [CrossRef]
- Willers SM, Eriksson C, Gidhagen L, Nilsson ME, Pershagen G, Bellander T. Fine and coarse particulate air pollution in relation to respiratory health in Sweden. European Respiratory Journal 2013;42:924–34. [CrossRef]
- Zhang Y, Liu L, Zhang L, Yu C, Wang X, Shi Z, et al. Assessing short-term impacts of PM2.5 constituents on cardiorespiratory hospitalizations: Multi-city evidence from China. International Journal of Hygiene and Environmental Health 2022;240:113912. [CrossRef]
- Kreyling WG, Semmler-Behnke M, Möller W. Ultrafine particle-lung interactions: does size matter? J Aerosol Med 2006;19:74–83. [CrossRef]
- Oberdörster G. Pulmonary effects of inhaled ultrafine particles. International Archives of Occupational and Environmental Health 2000;74:1–8. [CrossRef]
- Oberdörster G, Oberdörster E, Oberdörster J. Nanotoxicology: an emerging discipline evolving from studies of ultrafine particles. Environmental Health Perspectives 2005;113:823–39. [CrossRef]
- Burnett R, Chen H, Szyszkowicz M, Fann N, Hubbell B, Pope CA, et al. Global estimates of mortality associated with long-term exposure to outdoor fine particulate matter. Proc Natl Acad Sci USA 2018;115:9592. [CrossRef]
- Crouse DL, Peters PA, Donkelaar A van, Goldberg MS, Villeneuve PJ, Brion O, et al. Risk of nonaccidental and cardiovascular mortality in relation to long-term exposure to low concentrations of fine particulate matter: A canadian national-level cohort study. Environmental Health Perspectives 2012;120:708–14. [CrossRef]
- Jerrett M, Burnett RT, Beckerman BS, Turner MC, Krewski D, Thurston G, et al. Spatial analysis of air pollution and mortality in California. American Journal of Respiratory and Critical Care Medicine 2013;188:593–9. [CrossRef]
- Künzli N, Jerrett M, Mack WJ, Beckerman B, LaBree L, Gilliland F, et al. Ambient air pollution and atherosclerosis in Los Angeles. Environmental Health Perspectives 2005;113:201–6. [CrossRef]
- Pope CA, Burnett RT, Thun MJ, Calle EE, Krewski D, Ito K, et al. Lung cancer, cardiopulmonary mortality, and long-term exposure to fine particulate air pollution. Journal of the American Medical Association 2002;287:1132–41. [CrossRef]
- Gilliland FD, Berhane K, Rappaport EB, Thomas DC, Avol E, Gauderman WJ, et al. The effects of ambient air pollution on school absenteeism due to respiratory illnesses. Epidemiology 2001;12:43–54. [CrossRef]
- Jerrett M, Burnett RT, Ma R, Pope CA, Krewski D, Newbold KB, et al. Spatial analysis of air pollution and mortality in Los Angeles. Epidemiology 2005;16:727–36. [CrossRef]
- McConnell R, Berhane K, Gilliland F, London SJ, Islam T, Gauderman WJ, et al. Asthma in exercising children exposed to ozone: a cohort study. Lancet 2002;359:386–91. [CrossRef]
- CARB. Almanac of Emissions & Air Quality | California Air Resources Board 2013. https://ww2.arb.ca.gov/our-work/programs/almanac-emissions-air-quality (accessed December 13, 2024).
- Hasheminassab S, Daher N, Ostro BD, Sioutas C. Long-term source apportionment of ambient fine particulate matter (PM 2.5) in the Los Angeles Basin: A focus on emissions reduction from vehicular sources. Environmental Pollution 2014;193:54–64. [CrossRef]
- Lloyd AC, Cackette TA. Diesel Engines: Environmental Impact and Control. Journal of the Air & Waste Management Association 2001;51:809–47. [CrossRef]
- Lurmann F, Avol E, Gilliland F. Emissions reduction policies and recent trends in Southern California’s ambient air quality. Journal of the Air and Waste Management Association 2015;65:324–35. [CrossRef]
- Altuwayjiri A, Pirhadi M, Taghvaee S, Sioutas C. Long-Term trends in the contribution of PM2.5sources to organic carbon (OC) in the Los Angeles basin and the effect of PM emission regulations. Faraday Discussions 2021;226:74–99. [CrossRef]
- Badami MM, Tohidi R, Sioutas C. Los Angeles Basin’s air quality transformation: A long-term investigation on the impacts of PM regulations on the trends of ultrafine particles and co-pollutants. Journal of Aerosol Science 2024;176:106316. [CrossRef]
- Cheung K, Shafer MM, Schauer JJ, Sioutas C. Historical trends in the mass and chemical species concentrations of coarse particulate matter in the Los Angeles basin and relation to sources and air quality regulations. Journal of the Air and Waste Management Association 2012;62:541–56. [CrossRef]
- Suh HH, Bahadori T, Vallarino J, Spengler JD. Criteria air pollutants and toxic air-pollutants. Environmental Health Perspectives 2000;108:625–33. [CrossRef]
- CARB. Low-Emission Vehicle Program | California Air Resources Board 2003. https://ww2.arb.ca.gov/our-work/programs/low-emission-vehicle-program/about (accessed November 30, 2024).
- Singh S, Kulshrestha MJ, Rani N, Kumar K, Sharma C, Aswal DK. An Overview of Vehicular Emission Standards. MAPAN 2023;38:241–63. [CrossRef]
- Warneke C, Gouw JAD, Holloway JS, Peischl J, Ryerson TB, Atlas E, et al. Multiyear trends in volatile organic compounds in Los Angeles, California: Five decades of decreasing emissions. Journal of Geophysical Research Atmospheres 2012;117:D00V17. [CrossRef]
- CARB. AB 32 Climate Change Scoping Plan | California Air Resources Board 2023. https://ww2.arb.ca.gov/our-work/programs/ab-32-climate-change-scoping-plan (accessed November 30, 2024).
- Goodchild A, Mohan K. The clean trucks program: Evaluation of policy impacts on marine terminal operations. Maritime Economics and Logistics 2008;10:393–408. [CrossRef]
- Haveman J, Thornberg C. Clean Trucks Program-3 2008.
- Lee G, You SI, Ritchie SG, Saphores JD, Jayakrishnan R, Ogunseitan O. Assessing air quality and health benefits of the Clean Truck Program in the Alameda corridor, CA. Transportation Research Part A: Policy and Practice 2012;46:1177–93. [CrossRef]
- Andress D, Nguyen TD, Das S. Low-carbon fuel standard-Status and analytic issues. Energy Policy 2010;38:580–91. [CrossRef]
- CARB. Low Carbon Fuel Standard | California Air Resources Board 2013. https://ww2.arb.ca.gov/our-work/programs/low-carbon-fuel-standard (accessed November 29, 2024).
- Gani S, Chambliss SE, Messier KP, Lunden MM, Apte JS. Spatiotemporal profiles of ultrafine particles differ from other traffic-related air pollutants: lessons from long-term measurements at fixed sites and mobile monitoring. Environmental Science: Atmospheres 2021;1:558–68. [CrossRef]
- Kumar P, Pirjola L, Ketzel M, Harrison RM. Nanoparticle emissions from 11 non-vehicle exhaust sources – A review. Atmospheric Environment 2013;67:252–77. [CrossRef]
- Adamson IYR, Prieditis H, Hedgecock C, Vincent R. Zinc is the toxic factor in the lung response to an atmospheric particulate sample. Toxicology and Applied Pharmacology 2000;166:111–9. [CrossRef]
- Bello D, Hsieh SF, Schmidt D, Rogers E. Nanomaterials properties vs. biological oxidative damage: Implications for toxicity screening and exposure assessment. Nanotoxicology 2009;3:249–61. [CrossRef]
- Gualtieri M, Øvrevik J, Holme JA, Perrone MG, Bolzacchini E, Schwarze PE, et al. Differences in cytotoxicity versus pro-inflammatory potency of different PM fractions in human epithelial lung cells. Toxicol In Vitro 2010;24:29–39. [CrossRef]
- Niu X, Wang Y, Chuang HC, Shen Z, Sun J, Cao J, et al. Real-time chemical composition of ambient fine aerosols and related cytotoxic effects in human lung epithelial cells in an urban area. Environmental Research 2022;209. [CrossRef]
- Shuster-Meiseles T, Shafer MM, Heo J, Pardo M, Antkiewicz DS, Schauer JJ, et al. ROS-generating/ARE-activating capacity of metals in roadway particulate matter deposited in urban environment. Environmental Research 2016;146:252–62. [CrossRef]
- Verma V, Shafer MM, Schauer JJ, Sioutas C. Contribution of transition metals in the reactive oxygen species activity of PM emissions from retrofitted heavy-duty vehicles. Atmospheric Environment 2010;44:5165–73. [CrossRef]
- Bates JT, Fang T, Verma V, Zeng L, Weber RJ, Tolbert PE, et al. Review of Acellular Assays of Ambient Particulate Matter Oxidative Potential: Methods and Relationships with Composition, Sources, and Health Effects. Environmental Science and Technology 2019;53:4003–19. [CrossRef]
- Kelly FJ, Fussell JC. Size, source and chemical composition as determinants of toxicity attributable to ambient particulate matter. Atmospheric Environment 2012;60:504–26. [CrossRef]
- Alramzi Y, Aghaei Y, Badami MM, Aldekheel M, Tohidi R, Sioutas C. Investigating Urban Emission and Lung-Deposited Surface Area Sources and Their Diurnal Trends in Fine and Ultrafine Pm in Los Angeles 2024.
- Ayres JG, Borm P, Cassee FR, Castranova V, Donaldson K, Ghio A, et al. Evaluating the toxicity of airborne particulate matter and nanoparticles by measuring oxidative stress potential - A workshop report and consensus statement. Inhalation Toxicology 2008;20:75–99. [CrossRef]
- Miller MR, Shaw CA, Langrish JP. From particles to patients: oxidative stress and the cardiovascular effects of air pollution. Future Cardiol 2012;8:577–602. [CrossRef]
- Gurgueira SA, Lawrence J, Coull B, Murthy GGK, González-Flecha B. Rapid increases in the steady-state concentration of reactive oxygen species in the lungs and heart after particulate air pollution inhalation. Environ Health Perspect 2002;110:749–55. [CrossRef]
- Li N, Sioutas C, Cho A, Schmitz D, Misra C, Sempf J, et al. Ultrafine particulate pollutants induce oxidative stress and mitochondrial damage. Environmental Health Perspectives 2003;111:455–60. [CrossRef]
- Charrier JG, Anastasio C. On dithiothreitol (DTT) as a measure of oxidative potential for ambient particles: Evidence for the importance of soluble transition metals. Atmospheric Chemistry and Physics 2012;12:9321–33. [CrossRef]
- Cho AK, Sioutas C, Miguel AH, Kumagai Y, Froines JR. Redox activity of airborne particulate matter (PM) at different sites in the Los Angeles Basin. Environ Res 2005;99:40–7. [CrossRef]
- Fang T, Verma V, Guo H, King LE, Edgerton ES, Weber RJ. A semi-automated system for quantifying the oxidative potential of ambient particles in aqueous extracts using the dithiothreitol (DTT) assay: Results from the Southeastern Center for Air Pollution and Epidemiology (SCAPE). Atmospheric Measurement Techniques 2015;8:471–82. [CrossRef]
- Gao D, Fang T, Verma V, Zeng L, Weber RJ. A method for measuring total aerosol oxidative potential (OP) with the dithiothreitol (DTT) assay and comparisons between an urban and roadside site of water-soluble and total OP. Atmospheric Measurement Techniques 2017;10:2821–35. [CrossRef]
- Fang T, Verma V, Bates JT, Abrams J, Klein M, Strickland JM, et al. Oxidative potential of ambient water-soluble PM2.5 in the southeastern United States: Contrasts in sources and health associations between ascorbic acid (AA) and dithiothreitol (DTT) assays. Atmospheric Chemistry and Physics 2016;16:3865–79. [CrossRef]
- Verma V, Fang T, Xu L, Peltier RE, Russell AG, Ng NL, et al. Organic aerosols associated with the generation of reactive oxygen species (ROS) by water-soluble PM2.5. Environmental Science and Technology 2015;49:4646–56. [CrossRef]
- Shirmohammadi F, Wang D, Hasheminassab S, Verma V, Schauer JJ, Shafer MM, et al. Oxidative potential of on-road fine particulate matter (PM2.5) measured on major freeways of Los Angeles, CA, and a 10-year comparison with earlier roadside studies. Atmospheric Environment 2017;148:102–14. [CrossRef]
- US EPA O. Integrated Science Assessment (ISA) for Particulate Matter 2015. https://www.epa.gov/isa/integrated-science-assessment-isa-particulate-matter (accessed November 30, 2024).
- Badami MM, Tohidi R, Aldekheel M, Farahani VJ, Verma V, Sioutas C. Design, optimization, and evaluation of a wet electrostatic precipitator (ESP) for aerosol collection. Atmospheric Environment 2023;308:119858. [CrossRef]
- Farahani VJ, Altuwayjiri A, Pirhadi M, Verma V, Ruprecht AA, Diapouli E, et al. The oxidative potential of particulate matter (PM) in different regions around the world and its relation to air pollution sources. Environmental Science: Atmospheres 2022;2:1076–86. [CrossRef]
- Hu S, Polidori A, Arhami M, Shafer MM, Schauer JJ, Cho A, et al. Redox activity and chemical speciation of size fractioned PM in the communities of the Los Angeles-Long Beach harbor. Atmospheric Chemistry and Physics 2008;8:6439–51. [CrossRef]
- Li N, Wang M, Bramble LA, Schmitz DA, Schauer JJ, Sioutas C, et al. The adjuvant effect of ambient particulate matter is closely reflected by the particulate oxidant potential. Environmental Health Perspectives 2009;117:1116–23. [CrossRef]
- Ntziachristos L, Froines JR, Cho AK, Sioutas C. Relationship between redox activity and chemical speciation of size-fractionated particulate matter. Particle and Fibre Toxicology 2007;4. [CrossRef]
- Saffari A, Daher N, Shafer MM, Schauer JJ, Sioutas C. Seasonal and spatial variation in dithiothreitol (DTT) activity of quasi-ultrafine particles in the Los Angeles Basin and its association with chemical species. Journal of Environmental Science and Health - Part A Toxic/Hazardous Substances and Environmental Engineering 2014;49:441–51. [CrossRef]
- Saffari A, Hasheminassab S, Shafer MM, Schauer JJ, Chatila TA, Sioutas C. Nighttime aqueous-phase secondary organic aerosols in Los Angeles and its implication for fine particulate matter composition and oxidative potential. Atmospheric Environment 2016;133:112–22. [CrossRef]
- Shirmohammadi F, Hasheminassab S, Wang D, Schauer JJ, Shafer MM, Delfino RJ, et al. The relative importance of tailpipe and non-tailpipe emissions on the oxidative potential of ambient particles in Los Angeles, CA. Faraday Discussions 2016;189:361–80. [CrossRef]
- Verma V, Polidori A, Schauer JJ, Shafer MM, Cassee FR, Sioutas C. Physicochemical and toxicological profiles of particulate matter in Los Angeles during the October 2007 Southern California wildfires. Environmental Science and Technology 2009;43:954–60. [CrossRef]
- Verma V, Pakbin P, Cheung KL, Cho AK, Schauer JJ, Shafer MM, et al. Physicochemical and oxidative characteristics of semi-volatile components of quasi-ultrafine particles in an urban atmosphere. Atmospheric Environment 2011;45:1025–33. [CrossRef]
- Zhang X, Staimer N, Gillen DL, Tjoa T, Schauer JJ, Shafer MM, et al. Associations of oxidative stress and inflammatory biomarkers with chemically-characterized air pollutant exposures in an elderly cohort. Environmental Research 2016;150:306–19. [CrossRef]
- Yao K, Wang S, Zheng H, Zhang X, Wang Y, Chi Z, et al. Oxidative potential and source apportionment of size-resolved particles from indoor environments: Dithiothreitol (DTT) consumption and ROS production. Atmospheric Environment 2023;313:120060. [CrossRef]
- EPA. EPA: Air Quality System (AQS) API 2024. https://scholar.google.com/scholar_lookup?title=Air%20quality%20System%20(AQS)%20API&author=US%20EPA&publication_year=2023 (accessed December 15, 2024).
- Misra C, Singh M, Shen S, Sioutas C, Hall PM. Development and evaluation of a personal cascade impactor sampler (PCIS). Journal of Aerosol Science 2002;33:1027–47. [CrossRef]
- Singh M, Misra C, Sioutas C. Field evaluation of a personal cascade impactor sampler (PCIS). Atmospheric Environment 2003;37:4781–93. [CrossRef]
- Kumagai Y, Koide S, Taguchi K, Endo A, Nakai Y, Yoshikawa T, et al. Oxidation of proximal protein sulfhydryls by phenanthraquinone, a component of diesel exhaust particles. Chemical Research in Toxicology 2002;15:483–9. [CrossRef]
- Sannigrahi S, Zhang Q, Pilla F, Basu B, Basu AS. Effects of West Coast forest fire emissions on atmospheric environment: A coupled satellite and ground-based assessment 2020. [CrossRef]
- Limbeck A, Kulmala M, Puxbaum H. Secondary organic aerosol formation in the atmosphere via heterogeneous reaction of gaseous isoprene on acidic particles. Geophysical Research Letters 2003;30. [CrossRef]
- Aghaei Y, Aldekheel M, Tohidi R, Badami MM, Farahani VJ, Sioutas C. Development and performance evaluation of online monitors for near real-time measurement of total and water-soluble organic carbon in fine and coarse ambient PM. Atmospheric Environment 2024;319:120316. [CrossRef]
- Graham LA, Belisle SL, Rieger P. Nitrous oxide emissions from light duty vehicles. Atmospheric Environment 2009;43:2031–44. [CrossRef]
- Soleimanian E, Mousavi A, Taghvaee S, Shafer MM, Sioutas C. Impact of secondary and primary particulate matter (PM) sources on the enhanced light absorption by brown carbon (BrC) particles in central Los Angeles. Science of The Total Environment 2020;705:135902. [CrossRef]
- Blanchard CL, Shaw SL, Edgerton ES, Schwab JJ. Ambient PM2.5 organic and elemental carbon in New York City: Changing source contributions during a decade of large emission reductions. Journal of the Air & Waste Management Association 2021;71:995–1012. [CrossRef]
- Murphy BN, Sonntag D, Seltzer KM, Pye HOT, Allen C, Murray E, et al. Reactive organic carbon air emissions from mobile sources in the United States. Atmospheric Chemistry and Physics 2023;23:13469–83. [CrossRef]
- Farahani VJ, Soleimanian E, Pirhadi M, Sioutas C. Long-term trends in concentrations and sources of PM2.5–bound metals and elements in central Los Angeles. Atmospheric Environment 2021;253. [CrossRef]
- Panko JM, Hitchcock KM, Fuller GW, Green D. Evaluation of Tire Wear Contribution to PM2.5 in Urban Environments. Atmosphere 2019;10:99. [CrossRef]
- Badami MM, Tohidi R, Jalali Farahani V, Sioutas C. Size-segregated source identification of water-soluble and water-insoluble metals and trace elements of coarse and fine PM in central Los Angeles. Atmospheric Environment 2023;310:119984. [CrossRef]
- CARB. Advanced Clean Trucks | California Air Resources Board 2019. https://ww2.arb.ca.gov/our-work/programs/advanced-clean-trucks (accessed November 29, 2024).
- Fujitani Y, Furuyama A, Tanabe K, Hirano S. Comparison of Oxidative Abilities of PM2.5 Collected at Traffic and Residential Sites in Japan. Contribution of Transition Metals and Primary and Secondary Aerosols. Aerosol Air Qual Res 2017;17:574–87. [CrossRef]
- Jiang H, Ahmed CMS, Canchola A, Chen JY, Lin Y-H. Use of Dithiothreitol Assay to Evaluate the Oxidative Potential of Atmospheric Aerosols. Atmosphere 2019;10:571. [CrossRef]
- Aghaei Y, Badami MM, Tohidi R, Subramanian PSG, Boffi R, Borgini A, et al. The Impact of Russia-Ukraine geopolitical conflict on the air quality and toxicological properties of ambient PM2.5 in Milan, Italy. Sci Rep 2024;14:5996. [CrossRef]
- Campbell SJ, Wolfer K, Utinger B, Westwood J, Zhang Z-H, Bukowiecki N, et al. Atmospheric conditions and composition that influence PM2.5 oxidative potential in Beijing, China. Atmospheric Chemistry and Physics 2021;21:5549–73. [CrossRef]
Figure 1.
Yearly averaged long-term PM2.5 concentrations of OC and EC in Los Angeles (2007–2024).
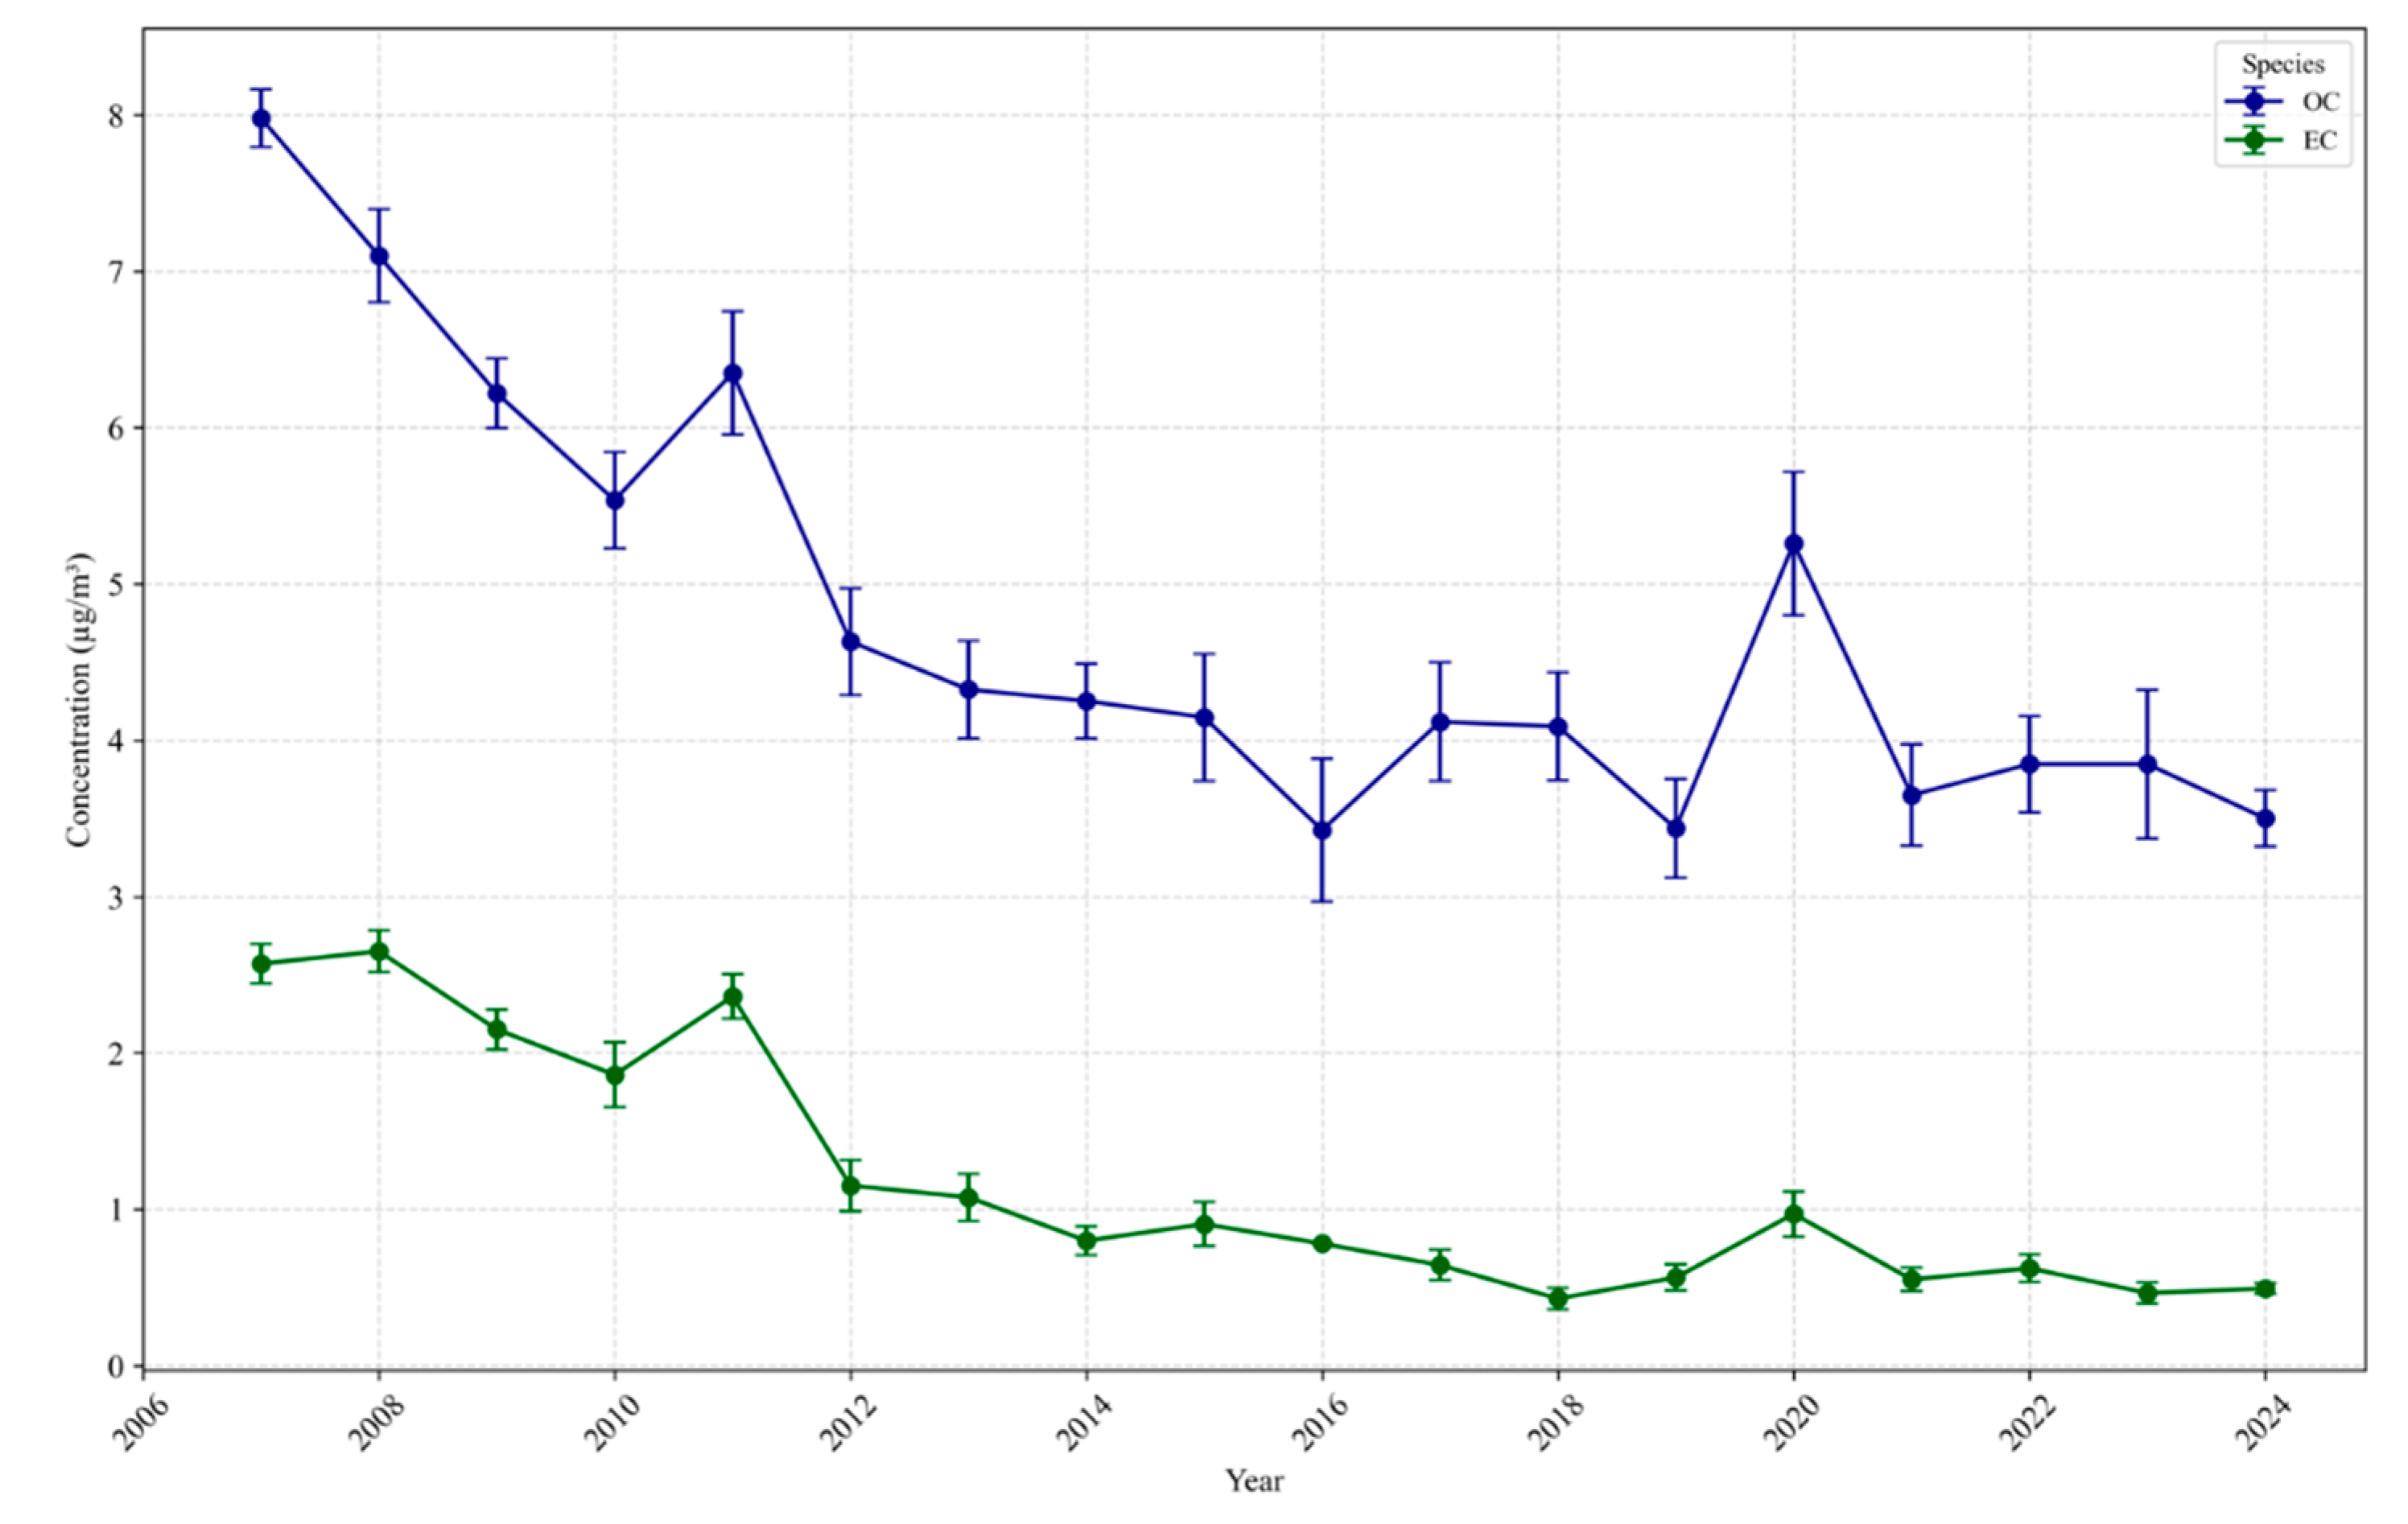
Figure 2.
Yearly averaged long-term PM2.5 concentrations of sulfate and nitrate in Los Angeles (2005–2024).
Figure 2.
Yearly averaged long-term PM2.5 concentrations of sulfate and nitrate in Los Angeles (2005–2024).
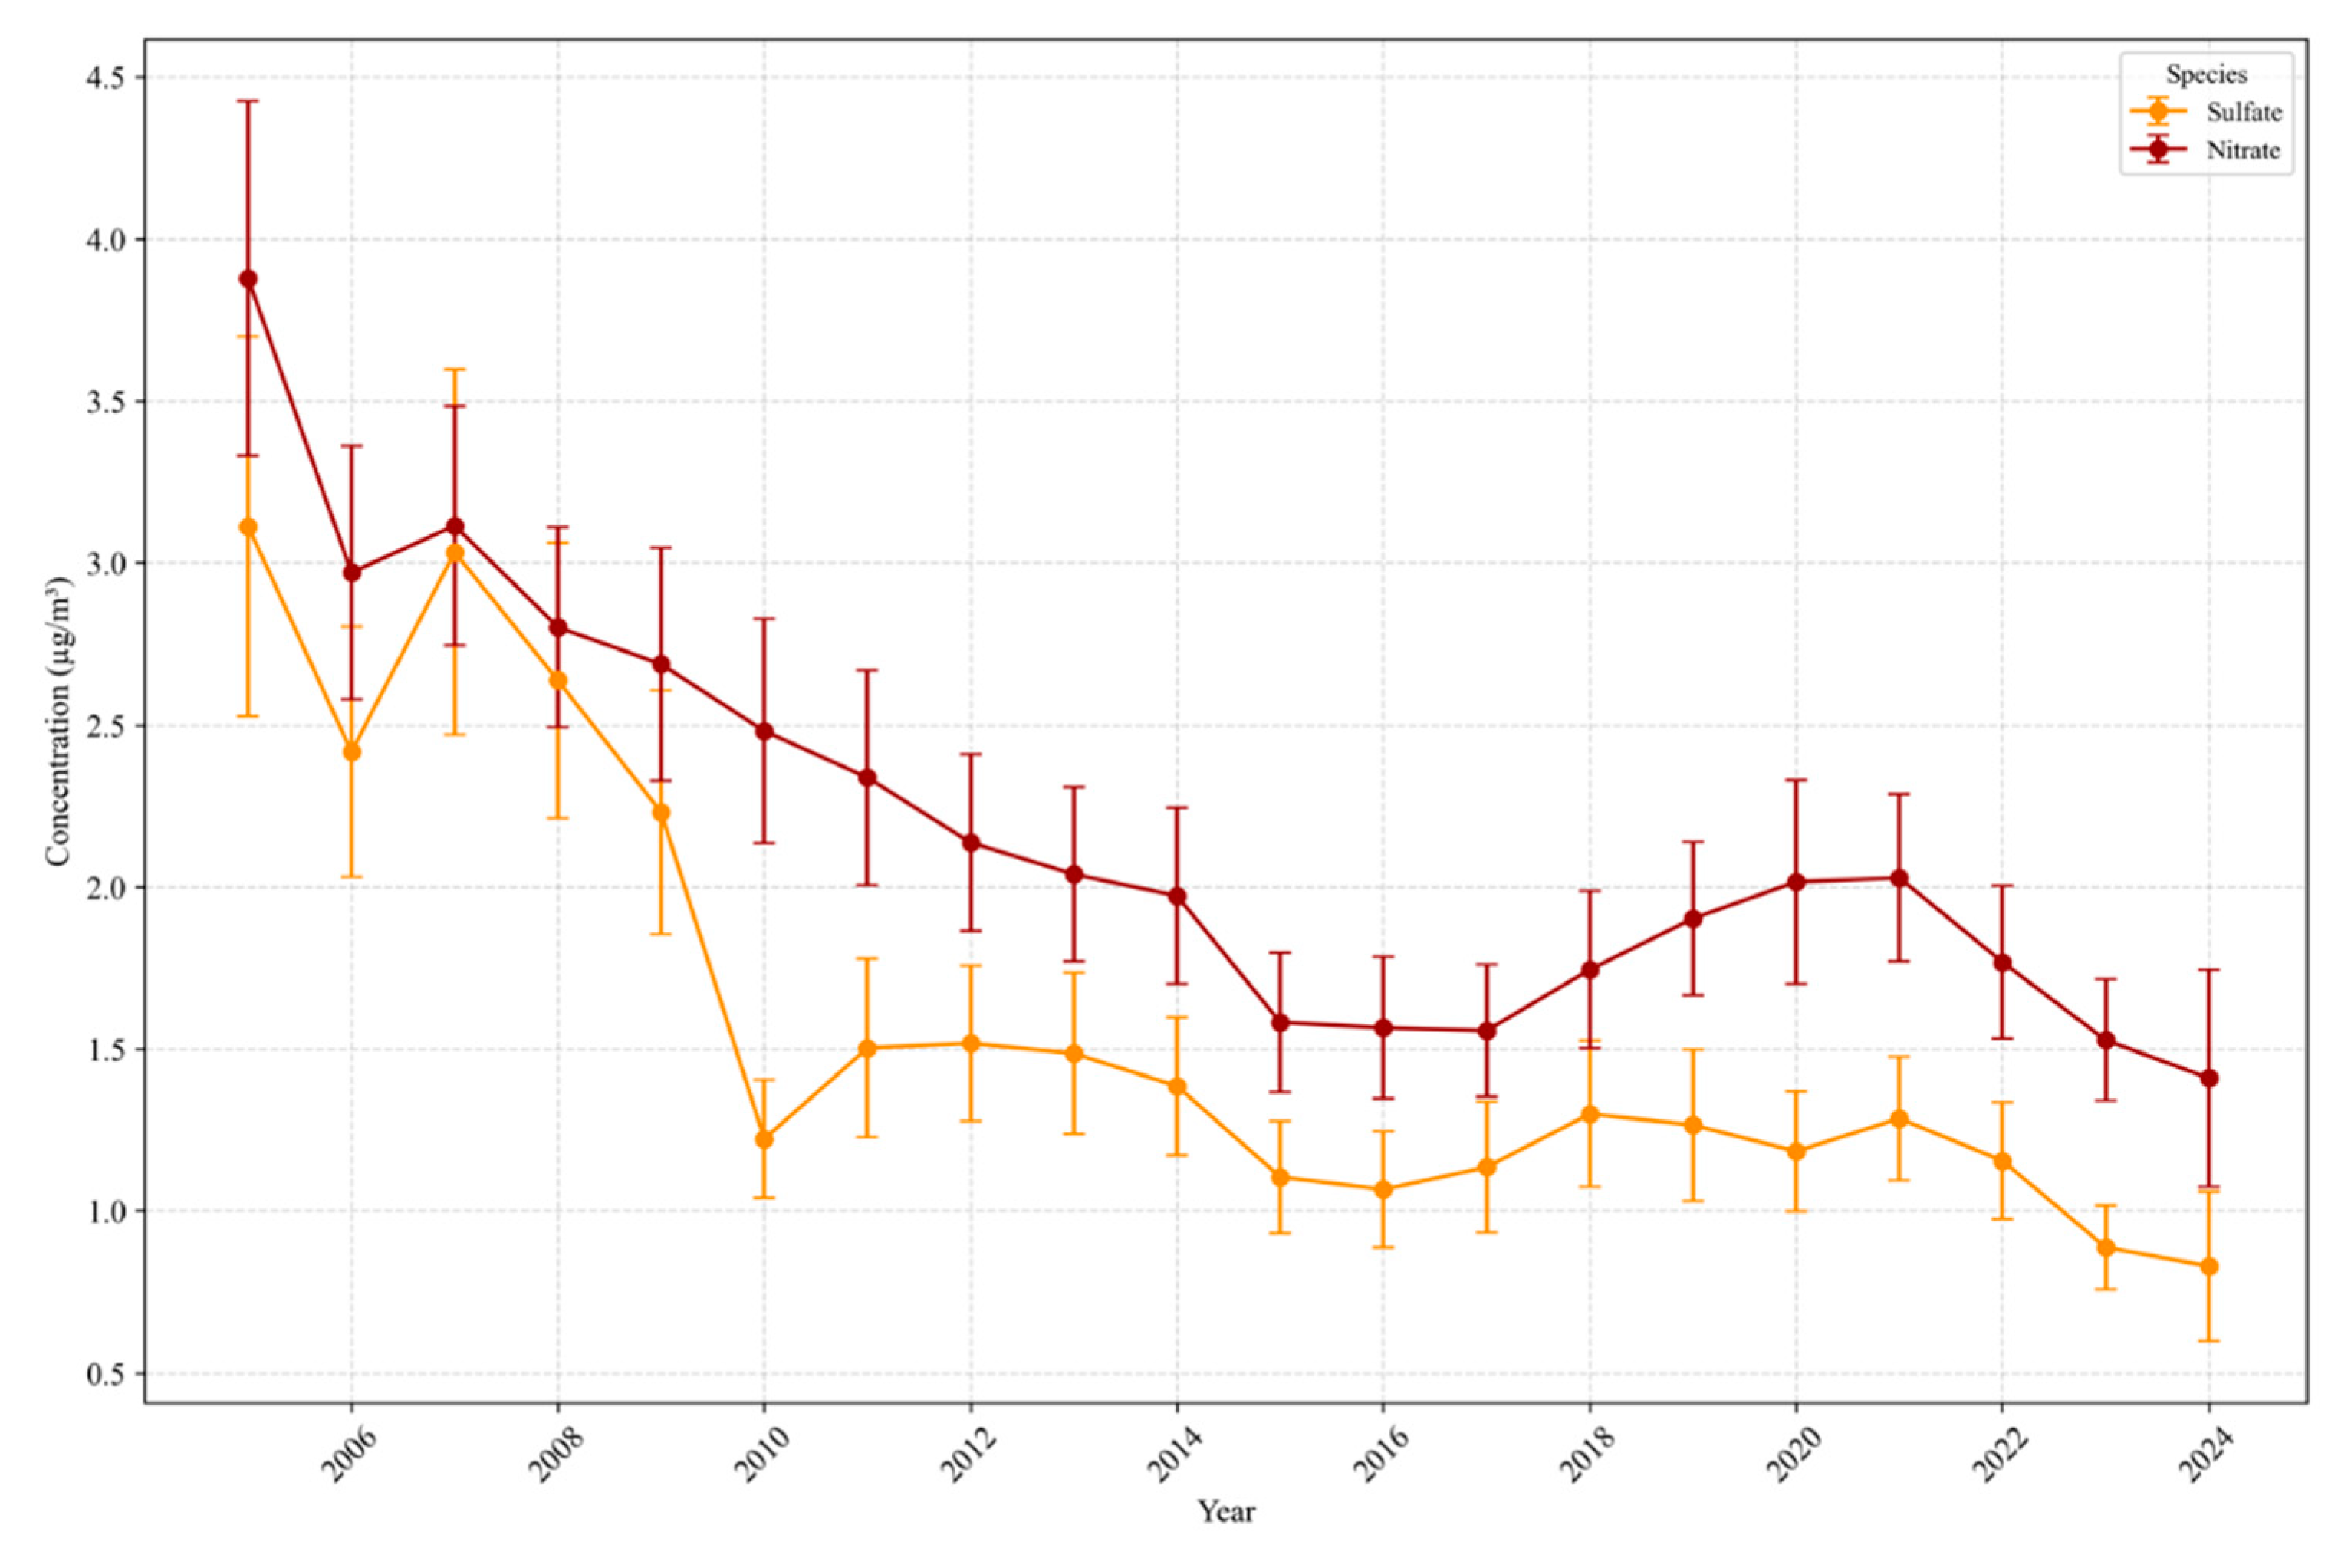
Figure 3.
Yearly averaged long-term concentrations of metals in Los Angeles (2007–2024).
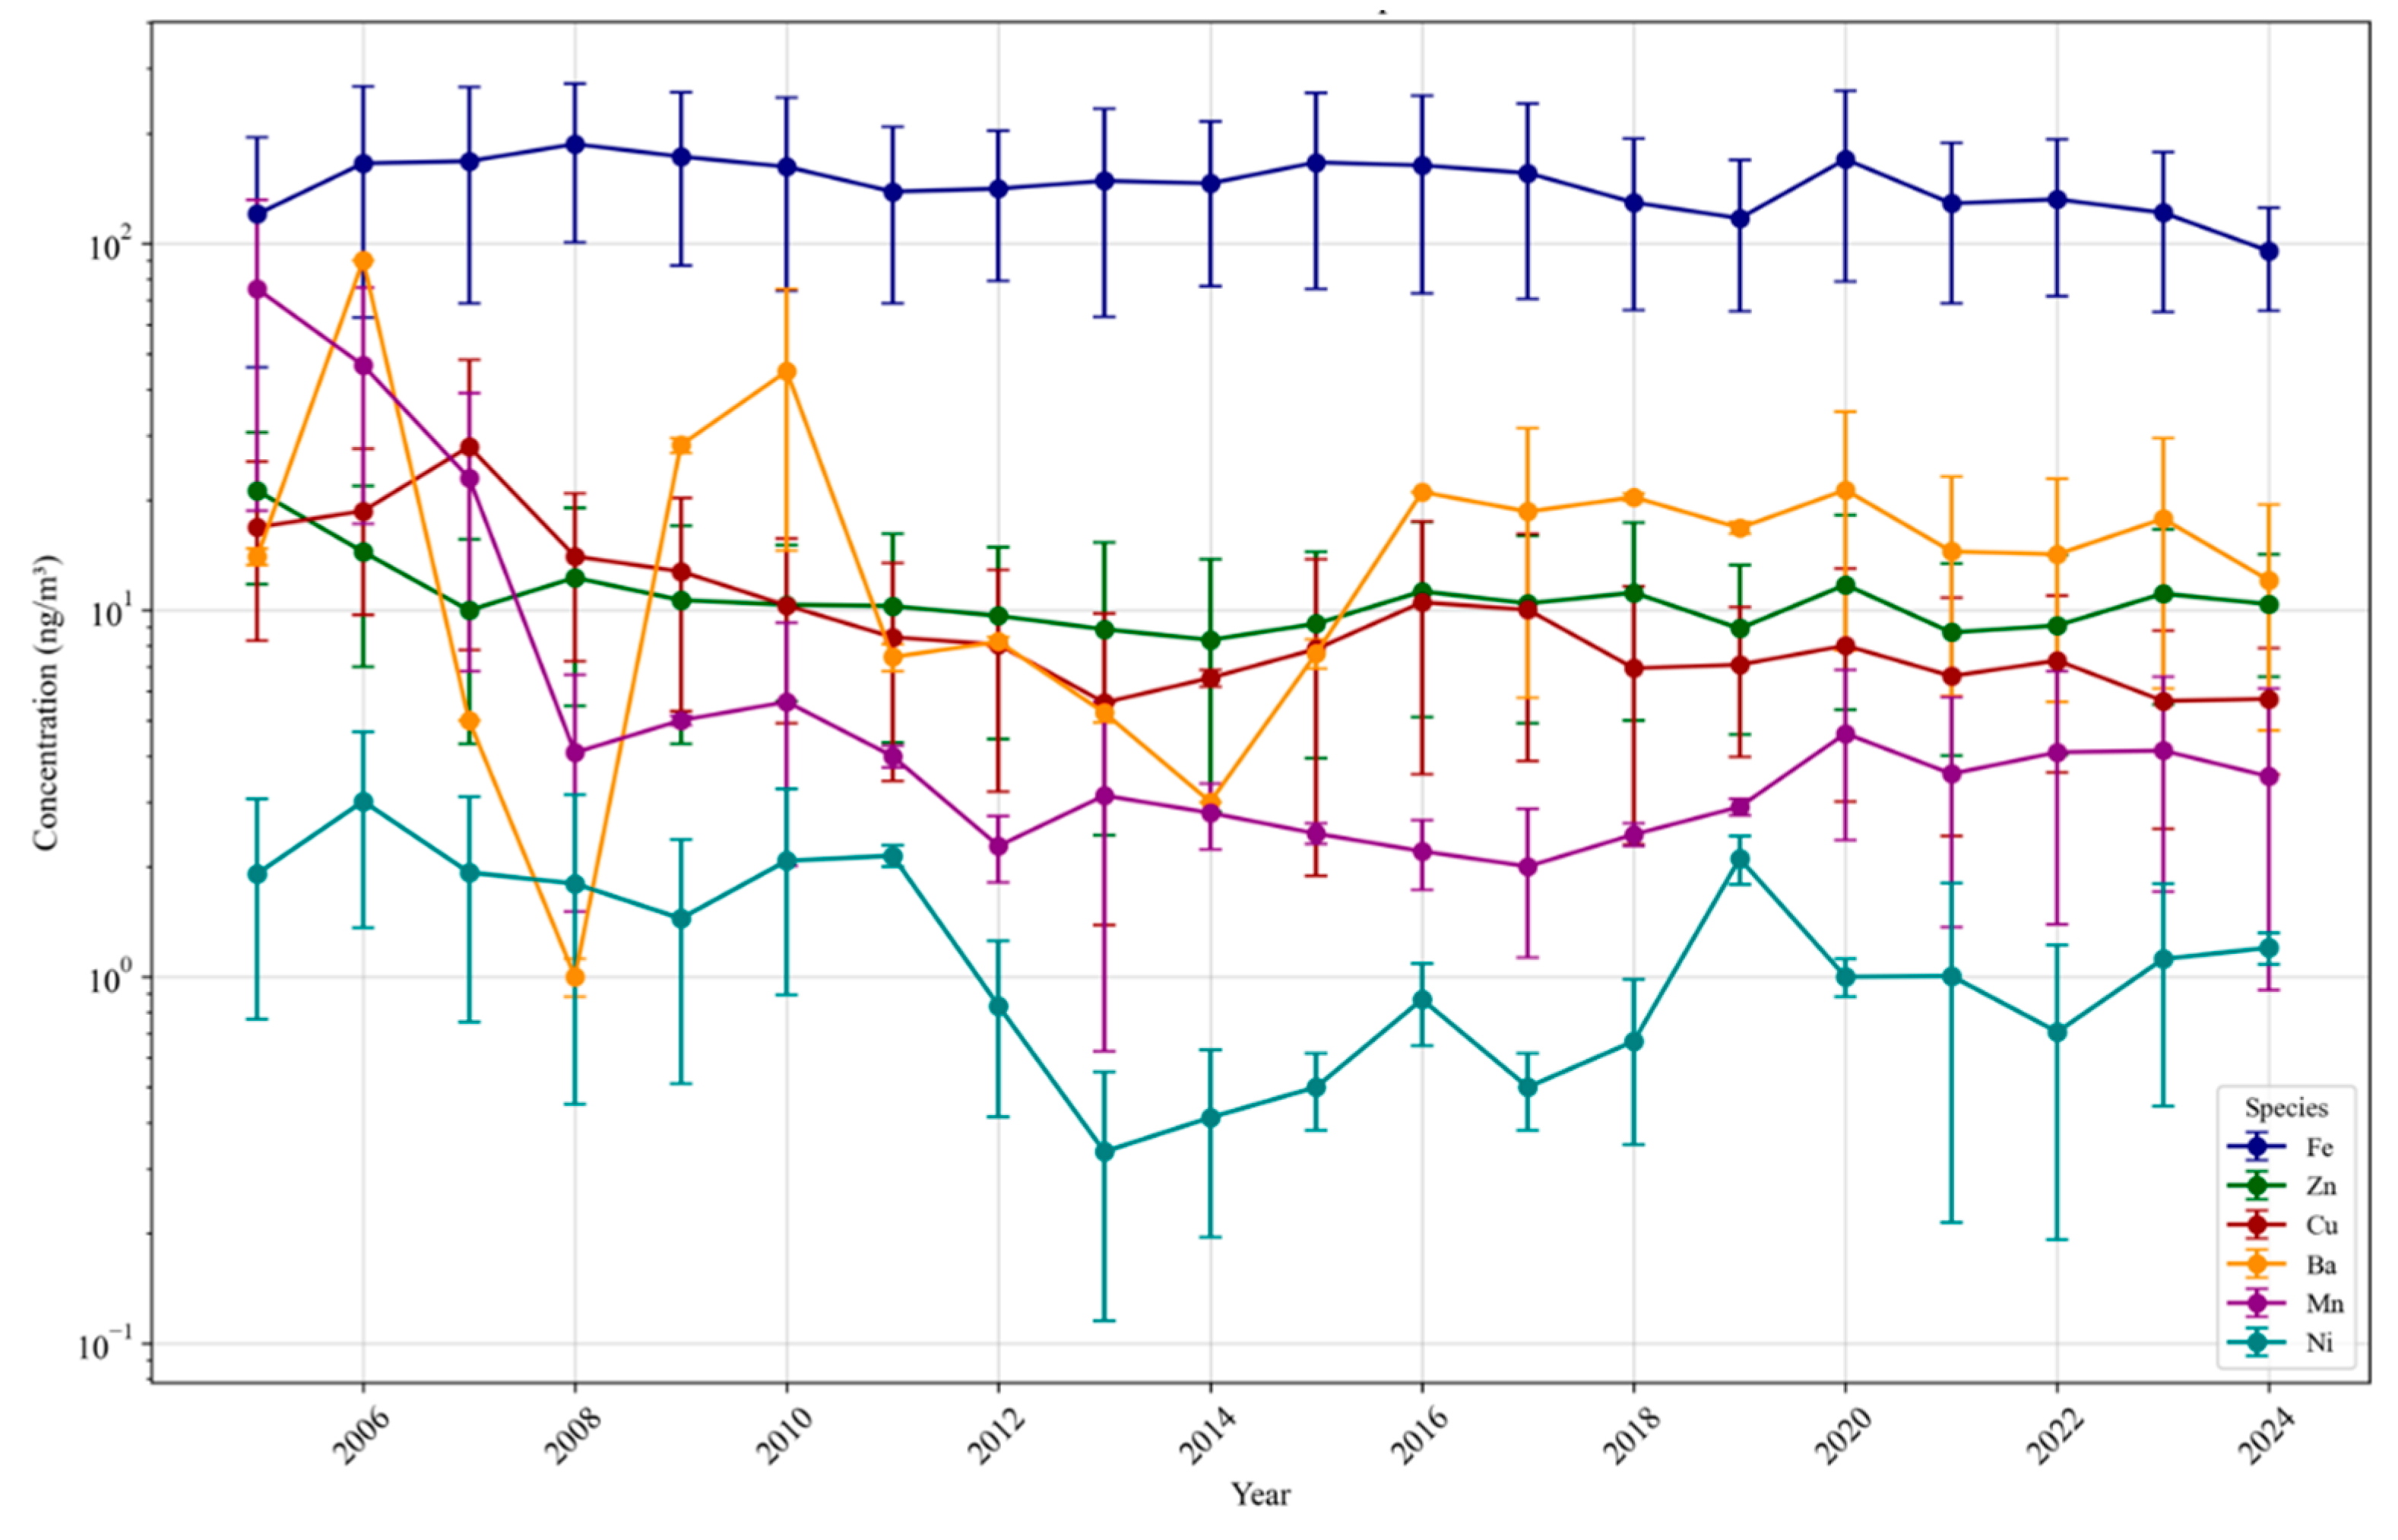
Figure 4.
Normalized averaged long-term normalized ratio of specific metals to EC mass in Los Angeles (2007–2024).
Figure 4.
Normalized averaged long-term normalized ratio of specific metals to EC mass in Los Angeles (2007–2024).
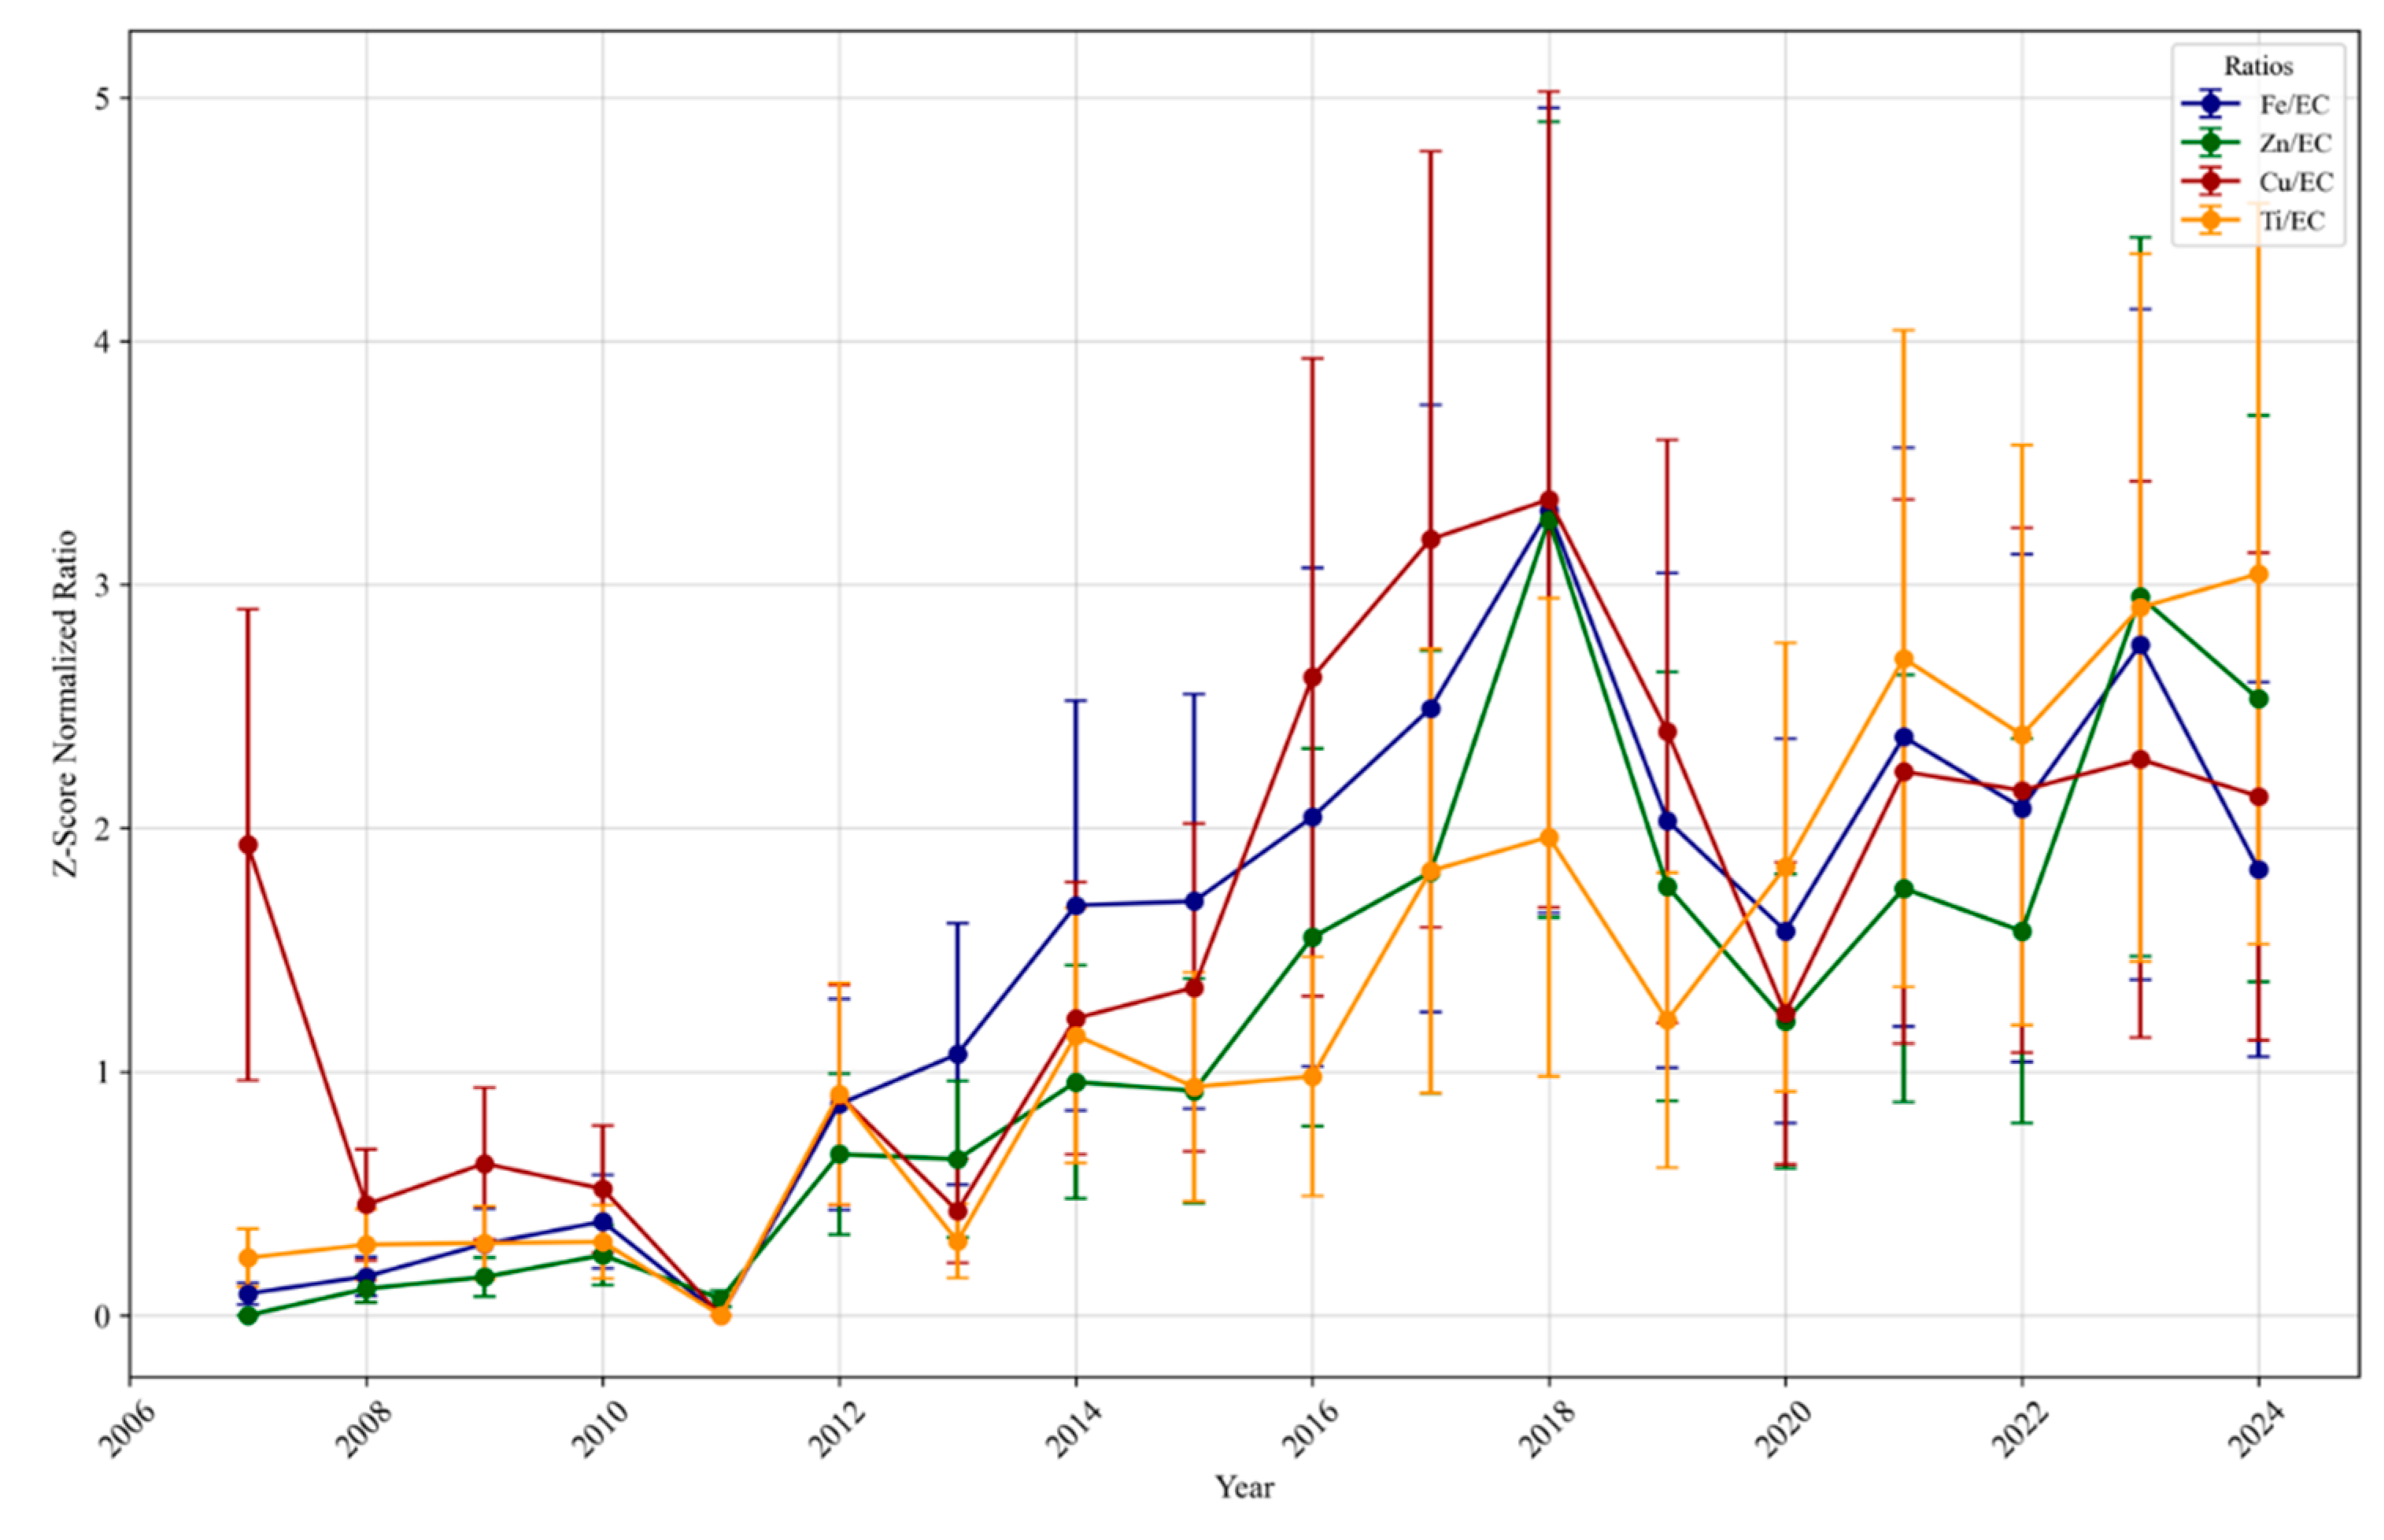
Figure 5.
Long-term trends of volumetric DTT activity of PM2.5 in Los Angeles (2001–2024).
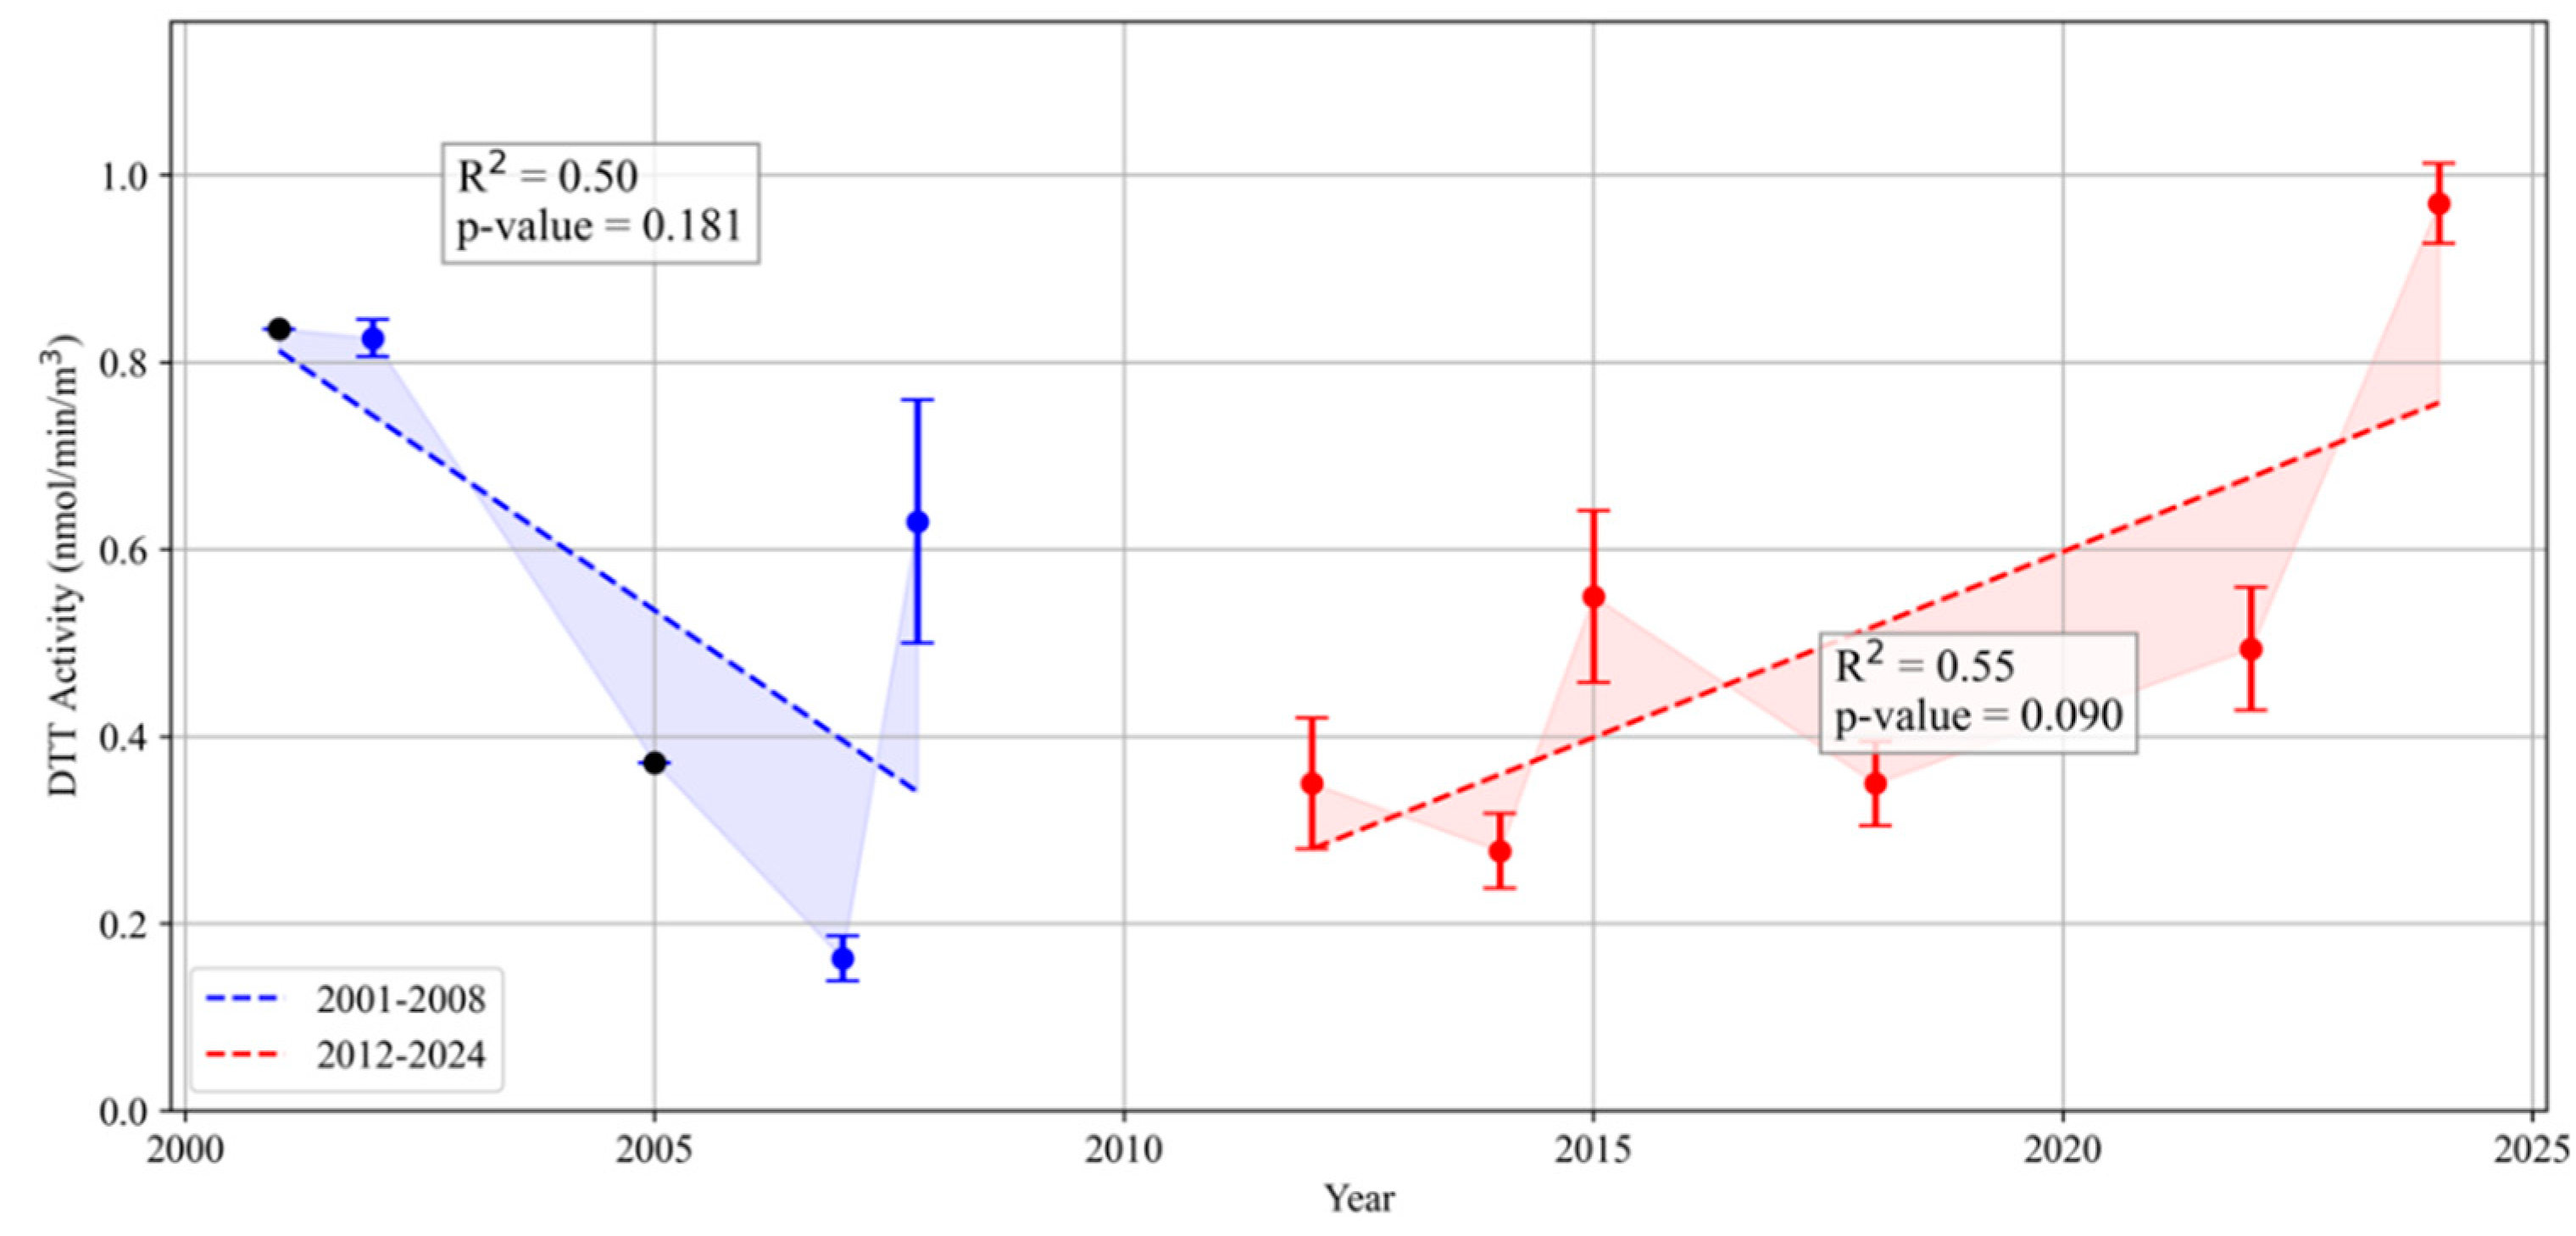
Figure 6.
Long-term trends of correlation of (a) metals and (b) OC and EC with DTT activity of PM2.5 in Los Angeles.
Figure 6.
Long-term trends of correlation of (a) metals and (b) OC and EC with DTT activity of PM2.5 in Los Angeles.
Disclaimer/Publisher’s Note: The statements, opinions and data contained in all publications are solely those of the individual author(s) and contributor(s) and not of MDPI and/or the editor(s). MDPI and/or the editor(s) disclaim responsibility for any injury to people or property resulting from any ideas, methods, instructions or products referred to in the content. |
© 2024 by the authors. Licensee MDPI, Basel, Switzerland. This article is an open access article distributed under the terms and conditions of the Creative Commons Attribution (CC BY) license (http://creativecommons.org/licenses/by/4.0/).
Copyright: This open access article is published under a Creative Commons CC BY 4.0 license, which permit the free download, distribution, and reuse, provided that the author and preprint are cited in any reuse.


