
Submitted:
03 April 2025
Posted:
04 April 2025
You are already at the latest version
Abstract
This study examines the concentrations of PM10 and PM2.5 in Santo Domingo by comparing data collected in 2019 and 2022. The research aims to identify temporal and spatial variations in particulate matter concentrations and to analyze the impact of meteorological and environmental variables on these concentrations. Methods include the collection of PM data at various urban sites and subsequent statistical analysis to assess the influence of factors like air temperature, wind speed, and aerosol optical depth (AOD). Results indicate significant fluctuations in PM levels, correlated with changes in meteorological conditions, seasonal variations, and urban activities. This study contributes to the understanding of air quality trends in Santo Domingo and provides insights into the efficacy of current environmental regulations and practices.
Keywords:
air pollution
; urban areas
; particulate matter
; aerosol optical depth
1. Introduction
Air pollution remains one of the most pressing environmental and public health challenges in urban areas worldwide [1,2,3,4,5,6,7,8,9]. Particulate matter (PM) consists of tiny solid particles and liquid aerosols containing acids, organic compounds, metals, and dust [10,11,12,13,14]. PM originates from both natural sources, such as volcanic eruptions, wildfires, dust storms, and Saharan air layer, and human activities like fuel combustion, vehicle exhaust, and industrial emissions [11,14,15,16,17,18,19,20,21].
PM, particularly PM10 (particles with a diameter less than 10 ) and PM2.5 (particles with a diameter less than 2.5 ), is of special concern due to its adverse effects on human health and its ability to penetrate the respiratory system [22,23,24]. Elevated concentrations of PM have been associated with increased morbidity and mortality from cardiovascular and respiratory diseases, making it a significant topic of study in environmental science [25,26,27,28,29,30].
Urban environments, especially in developing regions, are particularly susceptible to high levels of PM due to a combination of vehicular emissions, industrial activities, construction, and the influence of meteorological conditions [7,8,31,32,33]. In this context, identifying the spatial and temporal patterns of particulate matter, as well as its key predictors, is essential to understanding the factors driving air quality in urban areas and to informing effective mitigation strategies [9,34,35,36,37,38]. Studies have shown that variables such as wind speed, air pressure, temperature, rainfall, and aerosol optical depth (AOD) can influence PM concentrations, but their relative importance often varies by location, season, and particle size [37,39,40].
The city of Santo Domingo, located in the National District on the south-central coast of the Dominican Republic, is an ideal setting for this study due to its diverse urban environments and increasing exposure to air pollution [41,42,43,44,45,46,47]. However, comprehensive studies investigating the spatial distribution of PM and its relationship with meteorological and environmental variables in this region are still limited [42]. Previous work has highlighted the need for systematic monitoring and analysis of PM concentrations, including the use of low-cost sensors, to better understand local air quality dynamics [21,42,47,48,49].
In this study, we analyze PM10 and PM2.5 concentrations collected during two distinct sampling campaigns in 2019 and 2022 across various urban environments in Santo Domingo. The primary objectives of this research are: (1) to assess the spatial distribution and temporal variability of PM10 and PM2.5, (2) to investigate the relationship between PM concentrations and key meteorological, environmental variables and satellite observations using linear regression models, and (3) to determine the predictive power of these variables for explaining PM variations in both years. By identifying significant predictors of PM concentrations, this study contributes to a better understanding of air quality dynamics in Santo Domingo and provides a foundation for targeted environmental policies and interventions aimed at improving urban air quality.
2. Materials and Methods
The study was conducted in Santo Domingo, National District, Dominican Republic (ca. 18.49°N, 69.96°W), focusing on various types of urban environments (Figure 1). The sampling sites comprised public and private schools, a university, and an urban park, selected based on a previous study [42,47]. A total of 26 sampling sites were selected in 2019 for PM10 collection, with each site sampled at least three times between July and December. The sampling design was systematic, aiming for a 2 km separation between points. The final locations, including the specific schools, university, or recreational areas, were determined using the nearest neighbor method based on the ideal points initially established through software. In 2022, a new sampling campaign was conducted, incorporating additional measurements. A total of 30 sites were sampled between May and July, each sampled once.
Due to logistical and budgetary constraints, both campaigns opted to conduct measurements on a single day per site. Although this strategy limits the capture of daily variations, it allows for a comparative assessment of PM10 levels at different locations within the study area, providing a representative overview of the spatial distribution of pollution. To evaluate the limitation of single-day sampling per site, statistical analyses were conducted, including linear regression, correlations with meteorological variables, and spatial interpolation techniques.
Although efforts were made to maintain the same sampling sites in both campaigns, in some cases, this was not possible due to access restrictions, lack of permits, or safety concerns for equipment installation. To ensure the continuity of the study, alternative locations were selected in representative areas within the same urban environment. As noted, the second campaign included more sites to improve spatial coverage and capture variability in air pollution across different areas of Santo Domingo. This adaptation allowed for a broader perspective on the distribution of PM10 in the city, complementing the data obtained in 2019. While some sampling sites varied between 2019 and 2022, the selection followed homogeneous location criteria (urban areas with similar characteristics). Additionally, statistical analyses were applied to assess general trends in PM10 and PM2.5, ensuring the comparability of results between both periods.
For both sampling campaigns, particulate matter was collected using MiniVolTM TAS Portable Air Samplers (AirMetrics Co., Oregon, USA) [50,51]. This device operates by drawing air through size-selective impactors, which separate PM10 and PM2.5 fractions based on their aerodynamic diameter. In 2019, only PM10 was measured, as the campaign was initially designed to focus on coarse particles. In 2022, both PM10 and PM2.5 were measured by using the appropriate impactor for each fraction, providing a more comprehensive analysis of particulate matter.
The MiniVol TAS samplers were deployed at each site for 24 hours to collect representative samples of particulate matter. Both the 2019 and 2022 samples were single-day measurements, with no daily replicates collected. The samplers were calibrated and maintained according to the manufacturer’s specifications to ensure data accuracy and reliability.
2.1. Data Analysis
The collected data were analyzed using a variety of statistical methods to evaluate the concentration and distribution of particulate matter (PM10 and PM2.5) in Santo Domingo. The analysis included descriptive statistics, correlation analyses, regression modeling, and geospatial analysis.
Descriptive statistics were calculated to summarize the data, including measures of central tendency and dispersion. The analysis provided mean, median, standard deviation, and confidence intervals for PM10 and PM2.5 concentrations across different sampling periods.
Correlation analyses were performed to examine the relationships between PM10 and PM2.5 concentrations [36,52]. Pearson and Spearman correlation coefficients were calculated to assess the strength and direction of the associations. The Pearson correlation coefficient, r, is given by the equation 1
and the Spearman correlation coefficient, , is given by the equation 2
where and are the individual sample points, and are the means of the sample points, is the difference between the ranks of corresponding variables, and n is the number of observations.
Cross-correlation functions (CCF) were calculated to examine the temporal relationships between aerosol optical depth (AOD) and PM10 concentrations, using daily data along with weekly and monthly averages for temporal aggregation [20,53,54,55,56,57,58,59]. Time series visualizations were used to represent the temporal trends in AOD and PM10 concentrations for 2019 and 2022. Daily, weekly, and monthly averages were plotted, and smoothed trends were illustrated using Locally Estimated Scatterplot Smoothing (LOESS) regression. Additionally, an animation of AOD data was created to depict temporal variations over the study period.
Linear regression models were developed to investigate the relationship between PM2.5 and PM10 concentrations. The models were evaluated for normality of residuals, homoscedasticity, and goodness of fit using appropriate statistical tests such as Shapiro-Wilk, Anderson-Darling, and Breusch-Pagan tests. To ensure the robustness of the regression results, three outliers were excluded from the analysis. These outliers were identified using Cook’s distance, a measure used to detect influential data points. Specifically, observations with Cook’s distance values exceeding a threshold, calculated as where n is the number of observations and k is the number of predictors in the model, were considered as outliers and subsequently removed from the regression analysis.
Geospatial analyses were conducted to map the distribution of PM10 and PM2.5 concentrations across the study area. Geographic coordinates of the sampling sites were used to create spatial plots. Spatial autocorrelation analysis was performed using Moran’s I to assess the degree of clustering or dispersion of particulate matter concentrations. Multiple approaches for defining spatial weights were tested, including distance-based and k-nearest neighbor methods, selecting the 5-nearest neighbors as the most appropriate spatial weighting scheme. This approach facilitated the identification of significant hotspots, influential sites and spatial outliers. Local Indicators of Spatial Association (LISA) were applied to visualize clusters of high and low values, while multiple custom functions were developed to detect influential sites, evaluate the strength of spatial relationships, and quantify spatial outliers based on Cook’s distance and Moran scatterplots [60,61,62,63].
To identify the meteorological and environmental variables that predict particulate matter (PM10 and PM2.5) concentrations, linear regression models were fitted. The predictor variables considered in this analysis included air temperature, air pressure, wind speed, rainfall, and Aerosol Optical Depth (AOD). All variables were obtained or derived from meteorological records and remote sensing products. Meteorological data, including air temperature, air pressure, wind speed, and rainfall, were sourced from the RDSD meteorological station, where daily averages were computed from high-frequency measurements to ensure consistency with particulate matter sampling periods. Aerosol Optical Depth (AOD) data were retrieved from the ’MCD19A2.061: Terra & Aqua MAIAC Land Aerosol Optical Depth Daily 1km’ product via Google Earth Engine [64], where ’MAIAC’ stands for Multi-angle Implementation of Atmospheric Correction. The data were extracted for an Area of Interest (AOI) encompassing the National District and an adjacent buffer zone. The resulting raster datasets were processed to obtain spatially averaged values at different temporal scales (daily, weekly, and monthly), ensuring comparability across sites. Before fitting the regression models, as mentioned before, spatial independence of the observations was verified using Moran’s I statistic.
The linear models were fitted separately for each period and particulate matter type. For 2019, models were evaluated during the July-August, September-October, and November-December periods. For 2022, the analysis considered the entire year for both PM2.5 and PM10 concentrations. Each model included the predictor variables as independent terms and the particulate matter concentrations as the dependent variable. The explanatory power of each model was assessed using the coefficient of determination (), while the statistical significance of each predictor variable was evaluated through p-values. A tile plot was used to visually represent the relationships between predictor variables and particulate matter concentrations
All analyses were conducted using R statistical software [65]. Packages such as tidyverse, readxl, sf, sf, zoo, spatialreg, spdep, raster, terra, stars, forecast, caret, corrplot, GGally and gganimate, were utilized for data manipulation, statistical analysis, and visualization [55,66,67,68,69,70,71,72,73,74,75,76,77,78,79]. Custom functions were developed for specific tasks, such as performing correlation tests and fitting linear models.
3. Results
The basic statistics for particulate matter (PM) concentrations are shown in Table 1 and Figure 2. The mean PM10 concentration in 2019 was 38.14 (N = 26), while in 2022, the mean concentrations were 30.37 for PM2.5 (N = 30) and 62.18 for PM10 (N = 30). The Shapiro-Wilk test indicated that the data for 2022 significantly deviated from normality (p < 0.01), whereas the 2019 PM10 data showed no significant deviation (p = 0.08).
The paired t-test comparing PM10 concentrations between 2019 and 2022 indicated a significant difference, with a mean difference of -18.38 (t = -2.38, p = 0.029), indicating that PM10 concentrations were higher in 2022 than in 2019, with a 95% confidence interval ranging from -34.66 to -2.10 . In contrast, the Wilcoxon signed-rank test showed no statistically significant difference in the medians (V = 41, p = 0.054), although the result was close to the threshold for significance.
Turning to the data for 2022, the normality tests indicated that both PM2.5 and PM10 concentrations deviated significantly from normality (Table 2). Due to this deviation, Spearman’s rank correlation coefficient () was used to assess the relationship between the two pollutants. A moderate, but significant, positive correlation was observed between PM2.5 and PM10 concentrations, suggesting that higher levels of one pollutant were generally associated with higher levels of the other during this period.
To further explore the relationship between PM2.5 and PM10 concentrations in 2022, a linear regression model was fitted, excluding three outliers identified by Cook’s distance. The model indicated a significant positive relationship between the two pollutants, with PM2.5 serving as a strong predictor of PM10 levels. The regression equation was , where y represents PM10 and x represents PM2.5. The model explains approximately 65% of the variance in PM10 concentrations (R2 = 0.65, adjusted R2 = 0.63, p < 0.001). The residual standard error was 13.99, and the fitted model exhibited no significant violations of the assumptions of normality or homoscedasticity. This suggests that, after excluding the identified outliers, there is a robust linear association between PM2.5 and PM10 in 2022 (Figure 3).
Figure 5 shows the isopleths of the distribution around the region of PM10 and PM2.5 measured in Santo Domingo during both campaigns, 2019 and 2022 and the air quality stations (red circles). For the 2019 campaign, PM10 concentrations were generally lower, with values ranging mainly between 10 and 25 ppm in the study area. Higher concentrations, exceeding 70 ppm, were observed in the westernmost part of the domain, as well as in some isolated spots in the north and center. Meanwhile, for the 2022 campaign, it is observed that for PM10 it reaches values higher than 50 ppm distributed throughout almost the entire study domain with the exception of some isolated areas in the center, south, and southwest with lower values. However, for PM2.5, the area with the highest values is located to the south of the study area, reaching values higher than 25 ppm.
The temporal trends of the weekly mean aerosol optical depth (AOD) for 2019 and 2022 are shown in Figure 4. Both years exhibit a clear seasonal pattern, with AOD values increasing steadily from January to a peak around July-August and subsequently declining toward December. In 2022, AOD values were consistently higher compared to 2019 throughout most of the year, particularly during the first half. This difference is more pronounced during the March to August period, where 2022 shows sharper increases, reaching maximum AOD values of approximately 0.4. The smoothed trends, visualized with LOESS regression, further emphasize these seasonal patterns, with confidence intervals highlighting significant deviations between the two years. Notably, AOD variability, as indicated by the error bars, is greater in 2019 during the middle of the year but becomes more stable in 2022. These results suggest a distinct difference in aerosol optical depth behavior between the two years.
The cross-correlation function (CCF) between weekly averaged AOD and PM10 concentrations for 2019 and 2022 is presented in Figure 6. The analysis reveals a significant positive correlation at lag 0, suggesting that changes in AOD are contemporaneously associated with changes in PM10. The correlation is strong at lag 0, with a coefficient close to 0.5, indicating a moderate association. At lag -1, the correlation is negative and relatively strong, while at lag -2, it becomes positive and strong. In contrast, the correlations at other lags, both positive and negative, are weak and not statistically significant. These findings indicate that variations in AOD and PM10 concentrations occur synchronously on a weekly timescale, with minimal temporal displacement. This contemporaneous relationship highlights the potential of AOD as a reliable predictor for PM10 concentrations when analyzed at a weekly resolution.
The local spatial autocorrelation analysis identified several influential sites and spatial outliers, along with a minimal number of hotspots, across different years and particulate matter (PM) sizes (Table 3 and Figure 7). However, as shown further, these localized patterns were not reflected in the global spatial autocorrelation analysis. For PM10 in 2019, sites 8 and 22 were negatively influential, while site 23 was both positively influential and a positive spatial outlier, indicating higher PM10 concentrations than expected. In 2022, site 10 for PM2.5 was negatively influential and a negative spatial outlier, with sites 18 and 33 being positively influential; site 33 was also a positive spatial outlier and LISA hotspot, indicating a cluster of high PM2.5 values. For PM10 in 2022, site 29 was a LISA hotspot, and site 31 was negatively influential, revealing localized patterns of influence and clustering.
The spatial autocorrelation analysis for particulate matter (PM) using the Global Moran’s I statistic revealed non-significant results across all periods and particulate matter types assessed. Specifically, after log-transforming the particulate matter variables to better meet the assumption of normality, none of the Moran’s I tests yielded significant results. This indicates a lack of spatial dependence in the observed PM concentrations.
These results indicate that the particulate matter measurements do not exhibit significant spatial clustering or patterns, which aligns with the minimal number of LISA hotspots identified in previous analyses. This lack of spatial autocorrelation justifies the use of traditional statistical models that assume independent observations. Consequently, subsequent analyses can explore the relationships between PM levels and potential meteorological predictors without needing to account for any underlying spatial structure, thereby avoiding violations of the independence assumption.
The analysis of meteorological variables and Aerosol Optical Depth (AOD) as predictors of particulate matter concentrations revealed some interesting patterns. The results of the analysis were summarized visually in a tile plot, which highlights the significant predictor variables and their corresponding values (Figure 8). This figure enables a visual interpretation of the predictive strength of each variable across the analyzed periods and particulate matter types.
Notably, no significant predictors were identified for PM10 levels during the months of July-August and November-December 2019 using linear models. However, the results indicated that for PM10 concentrations during September-October 2019, wind speed emerged as a significant predictor, albeit with a relatively low explanatory power (R2=0.181).
In contrast, for the year 2022, multiple variables showed predictive power for both PM2.5 and PM10 levels. Specifically, air pressure was identified as a significant predictor for PM2.5, although with moderate explanatory power (R2=0.361). For PM10 in 2022, both AOD and air pressure exhibited strong predictive capabilities, with the model achieving a high R2 of 0.752. Additionally, rainfall was also a significant predictor for PM10 during this period, further indicating that meteorological conditions played a more influential role in explaining variations in particulate matter concentrations in 2022 compared to 2019.
4. Discussion
This study evaluated PM10 and PM2.5 concentrations in Santo Domingo, focusing on their spatial distribution, temporal variability, and relationships with meteorological and environmental variables. The findings reveal significant insights into particulate matter dynamics, particularly the role of aerosol optical depth (AOD), meteorological predictors, and localized spatial patterns.
The observed differences in PM concentrations between 2019 and 2022 can be attributed to seasonal variability and environmental factors. Notably, higher PM10 levels in 2022 coincided with the mid-year months (May–July), characterized by increased Saharan dust activity [80,81]. This aligns with the elevated AOD values during this period, as highlighted by the LOESS regression trends. In contrast, the lower PM10 concentrations in 2019, sampled between July and December, may reflect reduced dust transport and increased precipitation, which likely enhanced particle deposition.
Despite a substantial increase in the national vehicle fleet from 2019 to 2022 [82], the minimal growth in the National District and Santo Domingo province suggests that vehicular emissions are unlikely to explain the observed PM10 increase in 2022. Instead, meteorological conditions such as air pressure and rainfall, alongside AOD values (likely correlated with higher Saharan air layer concentrations), emerged as significant predictors, as demonstrated by the regression models. The strong explanatory power of these variables, particularly for PM10 (R2 = 0.752), underscores their critical role in influencing particulate matter levels.
The cross-correlation analysis revealed a synchronous relationship between AOD and PM10 at lag 0, indicating that real-time AOD data could serve as a reliable proxy for estimating PM10 concentrations, consistent with findings from previous studies that demonstrated strong correlations between AOD and surface particulate matter levels [59,83,84]. The temporal alignment suggests that satellite-derived AOD products could enhance air quality monitoring in regions with limited ground-based observations, as supported by studies showing that integrating AOD into air quality models significantly improves PM10 and PM2.5 estimations, particularly in areas with sparse monitoring networks [85,86,87,88,89,90,91,92].
Spatial autocorrelation analysis identified localized patterns, including influential sites, hotspots, and spatial outliers. For instance, site 23 in 2019 exhibited high PM10 concentrations, serving as both a positive spatial outlier and an influential site. In 2022, site 33 was a LISA hotspot for PM2.5, with significant clustering of high values. However, the absence of global spatial autocorrelation suggests that PM concentrations are not driven by broader spatial patterns, allowing the use of traditional regression models that assume independent observations. This lack of spatial autocorrelation is expected when observations are taken on different dates, particularly for particulate matter concentrations, which represent a highly dynamic phenomenon strongly influenced by atmospheric conditions [93,94]. This further underscores the need to model its behavior using physical atmospheric models to complement statistical approaches [95,96].
These findings emphasize the importance of integrating spatial and temporal analyses to uncover localized phenomena and validate predictive models. While the study highlights key predictors and spatial patterns, future research should explore the influence of land use, industrial activities, and local emission sources to develop a more comprehensive understanding of air quality dynamics in Santo Domingo.
Based on the findings of the study, which highlight the role of meteorological factors, urban activities, and aerosol concentrations, the following policy recommendations and mitigation strategies can help improve air quality in Santo Domingo: strengthening air quality monitoring and data integration, reducing vehicular emissions, controlling industrial and construction emissions, implementing urban planning for better air quality, promoting public awareness and community engagement, and enhancing policy coordination and enforcement.
5. Conclusions
This study provides a comparative assessment of PM10 and PM2.5 concentrations in Santo Domingo for 2019 and 2022, offering key insights into their temporal trends, meteorological predictors, and spatial variability. The significant differences in particulate matter levels between the two years are closely linked to seasonal meteorological conditions and Saharan dust activity, rather than local anthropogenic sources.
The regression models identified AOD, air pressure, and rainfall as robust predictors of PM concentrations, highlighting the potential of integrating remote sensing data with ground-based measurements to enhance air quality monitoring. The cross-correlation analysis further supports the use of AOD as a real-time proxy for PM10, providing valuable tools for policymakers and researchers.
Spatial analyses revealed localized influences, with certain sites demonstrating significant clustering and outlier behavior. However, the lack of global spatial autocorrelation underscores the need for targeted interventions rather than broad regional strategies. The study underscores the importance of incorporating localized meteorological and environmental data into air quality management plans.
Future studies should aim to expand the temporal and spatial scope of sampling, incorporate high-resolution emission inventories, and assess the health implications of observed PM concentrations. These efforts will enhance the ability to design effective mitigation strategies and improve urban air quality in Santo Domingo and similar urban environments.
6. Recommendations
While this study provides a comparative assessment of PM10 and PM2.5 levels in different areas of Santo Domingo, future research should incorporate continuous measurements or repeated sampling to assess temporal variability with greater precision. To improve continuity in future studies, it is recommended to establish a fixed monitoring network to analyze the evolution of pollutants at the same sites over time.
The results of this study suggest that, in addition to meteorological factors, anthropogenic sources such as traffic and industrial activity may play a significant role in PM levels in Santo Domingo. Future research should include detailed emission inventories and impact analyses of traffic control policies and industrial regulations to better understand their influence. Implementing mitigation strategies will require a multi-sectoral approach involving government agencies, industries, academia, and local communities. By integrating better monitoring, stricter regulations, sustainable transportation, and urban greening, Santo Domingo can significantly reduce air pollution and improve public health.
Funding
The authors acknowledge the Ministry of Higher Education, Science, and Technology of the Dominican Republic, specifically its National Fund for Scientific Innovation and Technological Development, for funding this research under the project
Author Contributions: CME
Designed and conducted the field experiments, developed the methodology, managed the project administration, secured the resources, analyzed the data, interpreted the results, contributed to the writing, review, and editing of the manuscript; RD: Assisted with the measurements; AHG and UJH: Reviewed and provided feedback on the manuscript; CCG and SBD: Provided the data from 2019 and reviewed the manuscript; JRMB: Analyzed the data, interpreted the results, and contributed to the writing, review, and editing of the manuscript
Data Availability Statement
Acknowledgments
This work was carried out within the Doctoral Program in Environmental Sciences of the Basic and Environmental Sciences Area at the Technological Institute of Santo Domingo (INTEC). The authors also express their gratitude to the Science Faculty and the Physics Institute of the Autonomous University of Santo Domingo (UASD) for their support. Special thanks are extended to José Antonio Peña and Albert Santiago de la Cruz for their valuable contribution to field sampling and logistics.
Conflicts of Interest
The authors declare no conflicts of interest. The funders had no role in the design of the study; in the collection, analyses, or interpretation of data; in the writing of the manuscript; or in the decision to publish the results.
Abbreviations
The following abbreviations are used in this manuscript:
| AOD | Aerosol Optical Depth |
| CCF | Cross-correlation functions |
| LISA | Local Indicators of Spatial Association |
| LOESS | Locally Estimated Scatterplot Smoothing |
| MAIAC | Multi-angle Implementation of Atmospheric Correction |
| PM | Particulate Matter |
| PM10 | Particles with a diameter less than 10 |
| PM2.5 | Particles with a diameter less than 2.5 |
Appendix A Identifier Code (ID) and English-Spanish Name Equivalences of Sampling Sites

Table A1.
Identifier Code (ID) and English-Spanish Name Equivalences of Sampling Sites.
| ID | Name in English | Name in Spanish | Latitude | Longitude |
|---|---|---|---|---|
| 1 | Prof. Adolfo González School | Liceo Prof. Adolfo González | 18.5400 | -69.9774 |
| 2 | Salomé Ureña de Henríquez (Los Girasoles) School | Escuela Básica Salomé Ureña de Henríquez (Los Girasoles) | 18.5274 | -69.9813 |
| 3 | Escuela Básica Prof. María del Carmen Pérez Méndez | Escuela Básica Prof. María del Carmen Pérez Méndez | 18.5310 | -69.9711 |
| 4 | Ciudad Real School | Colegio Ciudad Real | 18.5107 | -69.9864 |
| 5 | The Community For Learning | The Community For Learning | 18.5115 | -69.9657 |
| 6 | José Bordas Valdez School | Escuela José Bordas Valdez | 18.5016 | -69.9942 |
| 7 | Los Prados School | Colegio Los Prados | 18.4766 | -69.9609 |
| 8 | National Botanical Garden | Jardín Botánico Nacional | 18.4949 | -69.9529 |
| 9 | Notre Dame School | Colegio Notre Dame | 18.4773 | -69.9421 |
| 10 | San Judas Tadeo School | Colegio San Judas Tadeo | 18.4765 | -69.9253 |
| 11 | Víctor Estrella Liz School | Instituto Politécnico Víctor Estrella Liz | 18.4901 | -69.9258 |
| 12 | Arroyo Hondo School | Colegio Arroyo Hondo | 18.4947 | -69.9379 |
| 13 | American School of Santo Domingo | American School of Santo Domingo | 18.5090 | -69.9425 |
| 14 | Padre Eulalio Antonio Arias Inoa School | Escuela Básica Padre Eulalio Antonio Arias Inoa - PAX | 18.5065 | -69.9226 |
| 15 | Salomé Ureña School | Escuela Básica Salomé Ureña (Capotillo) | 18.5043 | -69.9047 |
| 16 | Santo Domingo School | Colegio Santo Domingo | 18.4633 | -69.9240 |
| 17 | María Auxiliadora School | Escuela Primaria María Auxiliadora - Loma del Chivo | 18.4980 | -69.8880 |
| 18 | República Dominicana School | Escuela Primaria República Dominicana | 18.4869 | -69.9052 |
| 19 | República de Argentina School | Centro Educativo del Nivel Medio República de Argentina | 18.4750 | -69.8867 |
| 20 | Babeque Inicial y Primaria School | Babeque Inicial y Primaria | 18.4637 | -69.9032 |
| 21 | Padre Valentín Salinero School | Escuela Padre Valentín Salinero | 18.4582 | -69.9399 |
| 22 | Serafín de Asís School | Colegio Serafín de Asís | 18.4573 | -69.9624 |
| 23 | Movearte Professional School | Movearte Escuela Técnico Profesional | 18.4330 | -69.9840 |
| 24 | Francisco Xavier Billini School | Escuela Primaria Francisco Xavier Billini | 18.4381 | -69.9642 |
| 25 | Rosa Duarte School | Hogar Escuela Rosa Duarte | 18.4381 | -69.9494 |
| 26 | República de El Salvador Kindergarten | Jardín de Infancia República de El Salvador | 18.4588 | -69.9216 |
| 27 | Iberoamericana University (UNIBE) | Universidad Iberoamericana (UNIBE) | 18.4747 | -69.9099 |
| 28 | UASD Faculty Club | Club de Profesores de la UASD | 18.4600 | -69.9040 |
| 29 | Faculty of Health Sciences, UASD | Antiguo Marión, Facultad de Ciencias de la Salud, UASD | 18.4610 | -69.9134 |
| 30 | University Geographic Institute, UASD | Instituto Geográfico Universitario (IGU), UASD | 18.4742 | -69.8825 |
| 31 | Association of Authorized Master Builders | Asociacion de Maestro Constructores de Obras Autorizados (AMACOA) | 18.4864 | -69.8866 |
| 32 | Nuestra Señora del Carmen School | Politécnico Nuestra Señora del Carmen | 18.5098 | -69.8980 |
| 33 | APEC University | Universidad APEC | 18.4730 | -69.9137 |
| 34 | Capotillo School | Centro Educativo Capotillo | 18.5022 | -69.9044 |
| 35 | Aida Cartagena Portalatín School | Escuela Básica Aida Cartagena Portalatín | 18.5066 | -69.9152 |
| 36 | Governorship of Mirador Sur Park | Gobernación del Parque Mirador Sur (ADN) | 18.4422 | -69.9589 |
| 37 | Agrarian Institute of Dominican Republic | Instituto Agrario Dominicano (IAD) | 18.4503 | -69.9722 |
| 38 | Private residence | Vivienda particular | 18.4571 | -69.9625 |
References
- Anderson, J.O.; Thundiyil, J.G.; Stolbach, A. Clearing the Air: A Review of the Effects of Particulate Matter Air Pollution on Human Health. Journal of Medical Toxicology 2012, 8, 166–175. [Google Scholar] [CrossRef]
- Organization, W.H. The world health report 2002: reducing risks, promoting healthy life; World Health Organization, 2002.
- Organization, W.H.; et al. WHO global air quality guidelines: particulate matter (PM2. 5 and PM10), ozone, nitrogen dioxide, sulfur dioxide and carbon monoxide; World Health Organization, 2021.
- Goossens, J.; Jonckheere, A.C.; Dupont, L.J.; Bullens, D.M.A. Air Pollution and the Airways: Lessons from a Century of Human Urbanization. Atmosphere 2021, 12. [Google Scholar] [CrossRef]
- Anjum, M.S.; Ali, S.M.; ud din, M.I.; Subhani, M.A.; Anwar, M.N.; Nizami, A.S.; Ashraf, U.; Khokhar, M.F. An Emerged Challenge of Air Pollution and Ever-Increasing Particulate Matter in Pakistan; A Critical Review. Journal of Hazardous Materials 2021, 402, 123943. [Google Scholar] [CrossRef]
- Sicard, P.; Agathokleous, E.; Anenberg, S.C.; De Marco, A.; Paoletti, E.; Calatayud, V. Trends in urban air pollution over the last two decades: A global perspective. Science of The Total Environment 2023, 858, 160064. [Google Scholar] [CrossRef]
- Sanda, M.; Dunea, D.; Iordache, S.; Predescu, L.; Predescu, M.; Pohoata, A.; Onutu, I. Recent Urban Issues Related to Particulate Matter in Ploiesti City, Romania. Atmosphere 2023, 14. [Google Scholar] [CrossRef]
- Wang, Z.; Chen, J.; Zhou, C.; Wang, S.; Li, M. The Impacts of Urban Form on PM2.5 Concentrations: A Regional Analysis of Cities in China from 2000 to 2015. Atmosphere 2022, 13. [Google Scholar] [CrossRef]
- Xiao, K.; Wang, Y.; Wu, G.; Fu, B.; Zhu, Y. Spatiotemporal Characteristics of Air Pollutants (PM10, PM2.5, SO2, NO2, O3, and CO) in the Inland Basin City of Chengdu, Southwest China. Atmosphere 2018, 9. [Google Scholar] [CrossRef]
- Asif, M.; Yousuf, S.; Donald, A.N.; Hassan, A.M.M.; Iqbal, A.; Bodlah, M.A.; Sharf, B.; Noshia, N. A review on particulate matter and heavy metal emissions; impacts on the environment, detection techniques and control strategies. MOJ Ecology & Environmental Sciences 2021, 7, 1–5. [Google Scholar] [CrossRef]
- Karthick Raja Namasivayam, S.; Priyanka, S.; Lavanya, M.; Krithika Shree, S.; Francis, A.; Avinash, G.; Arvind Bharani, R.; Kavisri, M.; Moovendhan, M. A review on vulnerable atmospheric aerosol nanoparticles: Sources, impact on the health, ecosystem and management strategies. Journal of Environmental Management 2024, 365, 121644. [Google Scholar] [CrossRef]
- Fameli, K.M.; Moustris, K.; Spyropoulos, G.; Rodanas, D.M. Exposure to PM2.5 on Public Transport: Guidance for Field Measurements with Low-Cost Sensors. Atmosphere 2024, 15, 330. [Google Scholar] [CrossRef]
- Bessagnet, B.; Allemand, N.; Putaud, J.P.; Couvidat, F.; André, J.M.; Simpson, D.; Pisoni, E.; Murphy, B.N.; Thunis, P. Emissions of Carbonaceous Particulate Matter and Ultrafine Particles from Vehicles—A Scientific Review in a Cross-Cutting Context of Air Pollution and Climate Change. Applied Sciences 2022, 12, 3623. [Google Scholar] [CrossRef]
- Contini, D.; Cesari, D.; Donateo, A.; Chirizzi, D.; Belosi, F. Characterization of PM10 and PM2.5 and Their Metals Content in Different Typologies of Sites in South-Eastern Italy. Atmosphere 2014, 5, 435–453. [Google Scholar] [CrossRef]
- Alwadei, M.; Srivastava, D.; Alam, M.S.; Shi, Z.; Bloss, W.J. Chemical characteristics and source apportionment of particulate matter (PM2.5) in Dammam, Saudi Arabia: Impact of dust storms. Atmospheric Environment: X 2022, 14, 100164. [Google Scholar] [CrossRef]
- Manousakas, M.I. Special Issue Sources and Composition of Ambient Particulate Matter. Atmosphere 2021, 12, 462. [Google Scholar] [CrossRef]
- Plocoste, T.; Laventure, S. Forecasting PM10 Concentrations in the Caribbean Area Using Machine Learning Models. Atmosphere 2023, 14, 134. [Google Scholar] [CrossRef]
- Sadiq, A.A. Effect of particulate emissions from road transportation vehicles on health of communities in urban and rural areas, Kano State, Nigeria. Theses, Université Claude Bernard - Lyon I, 2022.
- Sawyer, W.E.; Aigberua, A.O.; Nwodo, M.U.; Akram, M. , Sources, and Impacts; Springer Nature Switzerland: Cham, 2024; pp. 3–30. https://doi.org/10.1007/698_2024_1125.Effects. In Air Pollutants in the Context of One Health: Fundamentals, Sources, and Impacts; Springer Nature Switzerland: Cham, 2024; Springer Nature Switzerland: Cham, 2024; pp. 3–30. [Google Scholar] [CrossRef]
- Bae, M.; Kim, B.U.; Kim, H.C.; Kim, S. A Multiscale Tiered Approach to Quantify Contributions: A Case Study of PM2.5 in South Korea During 2010–2017. Atmosphere 2020, 11. [Google Scholar] [CrossRef]
- Sacks, J.D.; Fann, N.; Gumy, S.; Kim, I.; Ruggeri, G.; Mudu, P. Quantifying the Public Health Benefits of Reducing Air Pollution: Critically Assessing the Features and Capabilities of WHO’s AirQ+ and U.S. EPA’s Environmental Benefits Mapping and Analysis Program—Community Edition (BenMAP—CE). Atmosphere 2020, 11. [Google Scholar] [CrossRef]
- Xing, Y.F.; Xu, Y.H.; Shi, M.H.; Lian, Y.X. The impact of PM2.5 on the human respiratory system. Journal of Thoracic Disease 2016, 8, E69–74. [Google Scholar] [CrossRef]
- Thangavel, P.; Park, D.; Lee, Y.C. Recent Insights into Particulate Matter (PM2.5)-Mediated Toxicity in Humans: An Overview. International Journal of Environmental Research and Public Health 2022, 19, 7511. [Google Scholar] [CrossRef] [PubMed]
- Alharbi, H.A.; Rushdi, A.I.; Bazeyad, A.; Al-Mutlaq, K.F. Temporal Variations, Air Quality, Heavy Metal Concentrations, and Environmental and Health Impacts of Atmospheric PM2.5 and PM10 in Riyadh City, Saudi Arabia. Atmosphere 2024, 15. [Google Scholar] [CrossRef]
- Tran, H.M.; Tsai, F.J.; Lee, Y.L.; Chang, J.H.; Chang, L.T.; Chang, T.Y.; Chung, K.F.; Kuo, H.P.; Lee, K.Y.; Chuang, K.J.; et al. The impact of air pollution on respiratory diseases in an era of climate change: A review of the current evidence. Science of The Total Environment 2023, 898, 166340. [Google Scholar] [CrossRef]
- Orellano, P.; Reynoso, J.; Quaranta, N.; Bardach, A.; Ciapponi, A. Short-term exposure to particulate matter (PM10 and PM2.5), nitrogen dioxide (NO2), and ozone (O3) and all-cause and cause-specific mortality: Systematic review and meta-analysis. Environment International 2020, 142, 105876. [Google Scholar] [CrossRef] [PubMed]
- Guo, C.; Lv, S.; Liu, Y.; Li, Y. Biomarkers for the adverse effects on respiratory system health associated with atmospheric particulate matter exposure. Journal of Hazardous Materials 2022, 421, 126760. [Google Scholar] [CrossRef]
- Krittanawong, C.; Qadeer, Y.K.; Hayes, R.B.; Wang, Z.; Thurston, G.D.; Virani, S.; Lavie, C.J. PM2.5 and cardiovascular diseases: State-of-the-Art review. International Journal of Cardiology Cardiovascular Risk and Prevention 2023, 19, 200217. [Google Scholar] [CrossRef]
- Anjum, S.; Zafar, M.M.; Kumari, A. Chapter 6 - A review of diseases attributed to air pollution and associated health issues: a case study of Indian metropolitan cities. In Diseases and Health Consequences of Air Pollution; Dehghani, M.H.; Karri, R.R.; Vera, T.; Hassan, S.K.M., Eds.; Academic Press, 2024; pp. 145–169. [CrossRef]
- Wan Mahiyuddin, W.R.; Ismail, R.; Mohammad Sham, N.; Ahmad, N.I.; Nik Hassan, N.M.N. Cardiovascular and Respiratory Health Effects of Fine Particulate Matters (PM2.5): A Review on Time Series Studies. Atmosphere 2023, 14. [Google Scholar] [CrossRef]
- Li, Q.Q.; Guo, Y.T.; Yang, J.Y.; Liang, C.S. Review on main sources and impacts of urban ultrafine particles: Traffic emissions, nucleation, and climate modulation. Atmospheric Environment: X 2023, 19, 100221. [Google Scholar] [CrossRef]
- Rahman, M.; Meng, L. Examining the Spatial and Temporal Variation of PM2.5 and Its Linkage with Meteorological Conditions in Dhaka, Bangladesh. Atmosphere 2024, 15. [Google Scholar] [CrossRef]
- Rusca, M.; Rusu, T.; Avram, S.E.; Prodan, D.; Paltinean, G.A.; Filip, M.R.; Ciotlaus, I.; Pascuta, P.; Rusu, T.A.; Petean, I. Physicochemical Assessment of the Road Vehicle Traffic Pollution Impact on the Urban Environment. Atmosphere 2023, 14. [Google Scholar] [CrossRef]
- Dyer, G.M.; Khomenko, S.; Adlakha, D.; Anenberg, S.; Behnisch, M.; Boeing, G.; Esperon-Rodriguez, M.; Gasparrini, A.; Khreis, H.; Kondo, M.C.; et al. Exploring the nexus of urban form, transport, environment and health in large-scale urban studies: A state-of-the-art scoping review. Environmental Research 2024, 257, 119324. [Google Scholar] [CrossRef]
- Wu, C.; Lu, S.; Tian, J.; Yin, L.; Wang, L.; Zheng, W. Current Situation and Prospect of Geospatial AI in Air Pollution Prediction. Atmosphere 2024, 15. [Google Scholar] [CrossRef]
- Jurado, X.; Reiminger, N.; Maurer, L.; Vazquez, J.; Wemmert, C. On the Correlations between Particulate Matter: Comparison between Annual/Monthly Concentrations and PM10/PM2.5. Atmosphere 2023, 14. [Google Scholar] [CrossRef]
- Lightstone, S.; Gross, B.; Moshary, F.; Castillo, P. Development and Assessment of Spatially Continuous Predictive Algorithms for Fine Particulate Matter in New York State. Atmosphere 2021, 12. [Google Scholar] [CrossRef]
- Zhao, C.; Pan, Y.; Teng, Y.; Baqa, M.F.; Guo, W. Air Quality Improvement in China: Evidence from PM2.5 Concentrations in Five Urban Agglomerations, 2000–2021. Atmosphere 2022, 13. [Google Scholar] [CrossRef]
- Shoari, N.; Dubé, J.S. Toward improved analysis of concentration data: embracing nondetects. Environmental toxicology and chemistry 2018, 37, 643–656. [Google Scholar] [CrossRef]
- Beloconi, A.; Chrysoulakis, N.; Lyapustin, A.; Utzinger, J.; Vounatsou, P. Bayesian geostatistical modelling of PM10 and PM2.5 surface level concentrations in Europe using high-resolution satellite-derived products. Environment International 2018, 121, 57–70. [Google Scholar] [CrossRef]
- Espinal, G.; Nivar, S. Estudio de la contaminación ambiental al interior de las viviendas en tres barrios de la capital dominicana. Ciencia y Sociedad 2004, 29, 167–212. [Google Scholar] [CrossRef]
- Caballero-González, C. Calidad del aire e infraestructura verde. Estudio de caso: Distrito Nacional. Master’s thesis, Instituto Tecnológico de Santo Domingo (INTEC), Santo Domingo, Dominican Republic, 2020.
- Gómez Pérez, A.; Guillermo Manzanillo, L.A.; Vázquez Frías, J.; Quintana Pérez, C.E. Contaminación atmosférica en puntos seleccionados de la ciudad de Santo Domingo, República Dominicana. Ciencia y Sociedad 2014, 39, 533–557. [Google Scholar] [CrossRef]
- Vallejo Díaz, A.; Herrera Moya, I. Urban wind energy with resilience approach for sustainable cities in tropical regions: A review. Renewable and Sustainable Energy Reviews 2024, 199, 114525. [Google Scholar] [CrossRef]
- Fernández, I.C.; Koplow-Villavicencio, T.; Montoya-Tangarife, C. Urban environmental inequalities in Latin America: A scoping review. World Development Sustainability 2023, 2, 100055. [Google Scholar] [CrossRef]
- Martinuzzi, S.; Locke, D.H.; Ramos-González, O.; Sanchez, M.; Grove, J.M.; Muñoz-Erickson, T.A.; Arendt, W.J.; Bauer, G. Exploring the relationships between tree canopy cover and socioeconomic characteristics in tropical urban systems: The case of Santo Domingo, Dominican Republic. Urban Forestry & Urban Greening 2021, 62, 127125. [Google Scholar] [CrossRef]
- Bonilla-Duarte, S.; González, C.C.; Rodríguez, L.C.; Jáuregui-Haza, U.J.; García-García, A. Contribution of Urban Forests to the Ecosystem Service of Air Quality in the City of Santo Domingo, Dominican Republic. Forests 2021, 12. [Google Scholar] [CrossRef]
- Hernández-Garces, A.; Peña-Cossío, R.; Hernández Bilbao, F.; González, J.A. Distribución espacial de la emisión de contaminantes a la atmósfera emitidos por centrales azucareros villaclareños. Centro Azúcar 2021, 48, 29–40. [Google Scholar]
- Liu, H.Y.; Schneider, P.; Haugen, R.; Vogt, M. Performance Assessment of a Low-Cost PM2.5 Sensor for a near Four-Month Period in Oslo, Norway. Atmosphere 2019, 10. [Google Scholar] [CrossRef]
- Airmetrics. MiniVol Portable Air Sampler Operation Manual, .: Eugene, OR, USA, 2007. Accessed, 15 August 2007.
- Airmetrics. MiniVol TAS Portable Air Sampler, 2024. Accessed:. 12 August.
- Triola, M. Estadística (Décima Edición); Pearson Educación, México, 2009.
- Becker, R.; Chambers, J.; Wilks, A. The New S Language: A Programming Environment for Data Analysis and Graphics; Computer science series, Wadsworth & Brooks/Cole Advanced Books & Software, 1988.
- Venables, W.N.; Ripley, B.D.; Venables, W.N. Modern applied statistics with S, 4th ed ed.; Statistics and computing, Springer: New York, 2002. [Google Scholar]
- Zeileis, A.; Grothendieck, G. zoo: S3 Infrastructure for Regular and Irregular Time Series. Journal of Statistical Software 2005, 14, 1–27. [Google Scholar] [CrossRef]
- Hyndman, R.J.; Khandakar, Y. Automatic time series forecasting: the forecast package for R. Journal of Statistical Software 2008, 27, 1–22. [Google Scholar] [CrossRef]
- Hyndman, R.; Athanasopoulos, G.; Bergmeir, C.; Caceres, G.; Chhay, L.; O’Hara-Wild, M.; Petropoulos, F.; Razbash, S.; Wang, E.; Yasmeen, F. forecast: Forecasting functions for time series and linear models, 2024. R package version 8.22.0.
- Hyndman, R.J.; Killick, R. CRAN Task View: Time Series Analysis, 2024. Publisher: Comprehensive R Archive Network (CRAN).
- Abdullah, S.; Ismail, M.; Ahmed, A.N.; Abdullah, A.M. Forecasting Particulate Matter Concentration Using Linear and Non-Linear Approaches for Air Quality Decision Support. Atmosphere 2019, 10, 667. [Google Scholar] [CrossRef]
- Moran, P.A. The interpretation of statistical maps. Journal of the Royal Statistical Society. Series B (Methodological) 1948, 10, 243–251. [Google Scholar] [CrossRef]
- Anselin, L. Local indicators of spatial association—LISA. Geographical analysis 1995, 27, 93–115. [Google Scholar] [CrossRef]
- Anselin, L. The Moran scatterplot as an ESDA tool to assess local instability in spatial association. In Spatial Analytical Perspectives on GIS in Environmental and Socio-Economic Sciences; Fischer, M.; Scholten, H.; Unwin, D., Eds.; Taylor and Francis, 1996; chapter 8, pp. 111–125. [CrossRef]
- Anselin, L.; Rey, S.J. Perspectives on spatial data analysis. In Perspectives on Spatial Data Analysis; Anselin, L., Rey, S.J., Eds.; Springer: Berling, Heidelberg, 2010. [Google Scholar] [CrossRef]
- Lyapustin, A.; Wang, Y. MODIS/Terra+Aqua Land Aerosol Optical Depth Daily L2G Global 1km SIN Grid V061, 2022. d: Type. [CrossRef]
- R Core Team. R: A Language and Environment for Statistical Computing, 2024.
- Wickham, H.; Averick, M.; Bryan, J.; Chang, W.; McGowan, L.D.; François, R.; Grolemund, G.; Hayes, A.; Henry, L.; Hester, J.; et al. Welcome to the tidyverse. Journal of Open Source Software 2019, 4, 1686. [Google Scholar] [CrossRef]
- Hijmans, R.J. raster: Geographic Data Analysis and Modeling, 2023. R package version 3.6-26.
- Wei, T.; Simko, V. R package ’corrplot’: Visualization of a Correlation Matrix, 2021. (Version 0.92).
- Pebesma, E.; Bivand, R. Spatial Data Science: With applications in R; Chapman and Hall/CRC, 2023. [CrossRef]
- Pebesma, E. Simple Features for R: Standardized Support for Spatial Vector Data. The R Journal 2018, 10, 439–446. [Google Scholar] [CrossRef]
- Hijmans, R.J. terra: Spatial Data Analysis, 2024. R package version 1.7-78.
- Schloerke, B.; Cook, D.; Larmarange, J.; Briatte, F.; Marbach, M.; Thoen, E.; Elberg, A.; Crowley, J. GGally: Extension to ’ggplot2’, 2024. R package version 2.2.1.
- Pedersen, T.L.; Robinson, D. gganimate: A Grammar of Animated Graphics, 2024. R package version 1.0.9.
- Grolemund, G.; Wickham, H. Dates and Times Made Easy with lubridate. Journal of Statistical Software 2011, 40, 1–25. [Google Scholar] [CrossRef]
- Roger Bivand. R Packages for Analyzing Spatial Data: A Comparative Case Study with Areal Data. Geographical Analysis 2022, 54, 488–518. [Google Scholar] [CrossRef]
- Bivand, R.S.; Pebesma, E.; Gómez-Rubio, V. Applied spatial data analysis with R, Second edition; Springer, NY, 2013.
- Bivand, R.; Hauke, J.; Kossowski, T. Computing the Jacobian in Gaussian spatial autoregressive models: An illustrated comparison of available methods. Geographical Analysis 2013, 45, 150–179. [Google Scholar] [CrossRef]
- Neuwirth, E. RColorBrewer: ColorBrewer Palettes, 2022. R package version 1.1-3.
- Kuhn. ; Max. Building Predictive Models in R Using the caret Package. Journal of Statistical Software 2008, 28, 1–26. [Google Scholar] [CrossRef]
- Hernández Ayala, J.J.; Méndez-Tejeda, R. Analyzing Trends in Saharan Dust Concentration and Its Relation to Sargassum Blooms in the Eastern Caribbean. Oceans 2024, 5, 637–646. [Google Scholar] [CrossRef]
- Harr, B.; Pu, B.; Jin, Q. The emission, transport, and impacts of the extreme Saharan dust storm of 2015. Atmospheric Chemistry and Physics 2024, 24, 8625–8651. [Google Scholar] [CrossRef]
- Dirección General de Impuestos Internos. Parque Vehicular. Informes Anuales, 2024. Accessed: 2025-03-11.
- Pedde, M.; Kloog, I.; Szpiro, A.; Dorman, M.; Larson, T.V.; Adar, S.D. Estimating long-term PM10-2.5 concentrations in six US cities using satellite-based aerosol optical depth data. Atmospheric Environment 2022, 272, 118945. [Google Scholar] [CrossRef]
- Gharibzadeh, M.; Saadat Abadi, A.R. Estimation of surface particulate matter (PM2.5 and PM10) mass concentration by multivariable linear and nonlinear models using remote sensing data and meteorological variables over Ahvaz, Iran. Atmospheric Environment: X 2022, 14, 100167. [Google Scholar] [CrossRef]
- Handschuh, J.; Erbertseder, T.; Baier, F. On the added value of satellite AOD for the investigation of ground-level PM2.5 variability. Atmospheric Environment 2024, 331, 120601. [Google Scholar] [CrossRef]
- Markowicz, K.M.; Stachlewska, I.S.; Zawadzka-Manko, O.; Wang, D.; Kumala, W.; Chilinski, M.T.; Makuch, P.; Markuszewski, P.; Rozwadowska, A.K.; Petelski, T.; et al. A Decade of Poland-AOD Aerosol Research Network Observations. Atmosphere 2021, 12. [Google Scholar] [CrossRef]
- Kang, J.G.; Lee, J.Y.; Lee, J.B.; Lim, J.H.; Yun, H.Y.; Choi, D.R. High-Resolution Daily PM2.5 Exposure Concentrations in South Korea Using CMAQ Data Assimilation with Surface Measurements and MAIAC AOD (2015–2021). Atmosphere 2024, 15. [Google Scholar] [CrossRef]
- Hua, Z.; Sun, W.; Yang, G.; Du, Q. A Full-Coverage Daily Average PM2.5 Retrieval Method with Two-Stage IVW Fused MODIS C6 AOD and Two-Stage GAM Model. Remote Sensing 2019, 11. [Google Scholar] [CrossRef]
- Kuttippurath, J.; Patel, V.K. Chapter 21 - Advances in Earth Observation Satellites for global air quality monitoring. In Sustainable Development Perspectives in Earth Observation; Behera, M.D.; Behera, S.K.; Barik, S.K.; Mohapatra, M.; Mohapatra, T., Eds.; Earth Observation, Elsevier, 2025; pp. 361–381. [CrossRef]
- Nie, X.; Yu, L.; Mao, Q.; Zhang, X. Study on global atmospheric aerosol type identification from combined satellite and ground observations. Atmospheric Environment 2025, 347, 121100. [Google Scholar] [CrossRef]
- Brandao, R.; Foroutan, H. Air Quality in Southeast Brazil during COVID-19 Lockdown: A Combined Satellite and Ground-Based Data Analysis. Atmosphere 2021, 12. [Google Scholar] [CrossRef]
- Amiridis, V.; Kazadzis, S.; Gkikas, A.; Voudouri, K.A.; Kouklaki, D.; Koukouli, M.E.; Garane, K.; Georgoulias, A.K.; Solomos, S.; Varlas, G.; et al. Natural Aerosols, Gaseous Precursors and Their Impacts in Greece: A Review from the Remote Sensing Perspective. Atmosphere 2024, 15. [Google Scholar] [CrossRef]
- Suthar, G.; Singh, S.; Kaul, N.; Khandelwal, S. Prediction of land surface temperature using spectral indices, air pollutants, and urbanization parameters for Hyderabad city of India using six machine learning approaches. Remote Sensing Applications: Society and Environment 2024, 35, 101265. [Google Scholar] [CrossRef]
- Johnson, D.P.; Ravi, N.; Filippelli, G.; Heintzelman, A. A Novel Hybrid Approach: Integrating Bayesian SPDE and Deep Learning for Enhanced Spatiotemporal Modeling of PM2.5 Concentrations in Urban Airsheds for Sustainable Climate Action and Public Health. Sustainability 2024, 16. [Google Scholar] [CrossRef]
- Wang, S.; Zhang, Y. An attention-based CNN model integrating observational and simulation data for high-resolution spatial estimation of urban air quality. Atmospheric Environment 2025, 340, 120921. [Google Scholar] [CrossRef]
- Mitreska Jovanovska, E.; Batz, V.; Lameski, P.; Zdravevski, E.; Herzog, M.A.; Trajkovik, V. Methods for Urban Air Pollution Measurement and Forecasting: Challenges, Opportunities, and Solutions. Atmosphere 2023, 14. [Google Scholar] [CrossRef]
Figure 1.
Sampling Sites for Particulate Matter 2.5 and 10 . Years 2019 and 2022.. See Table A1 for English-Spanish Name Equivalences
Figure 1.
Sampling Sites for Particulate Matter 2.5 and 10 . Years 2019 and 2022.. See Table A1 for English-Spanish Name Equivalences
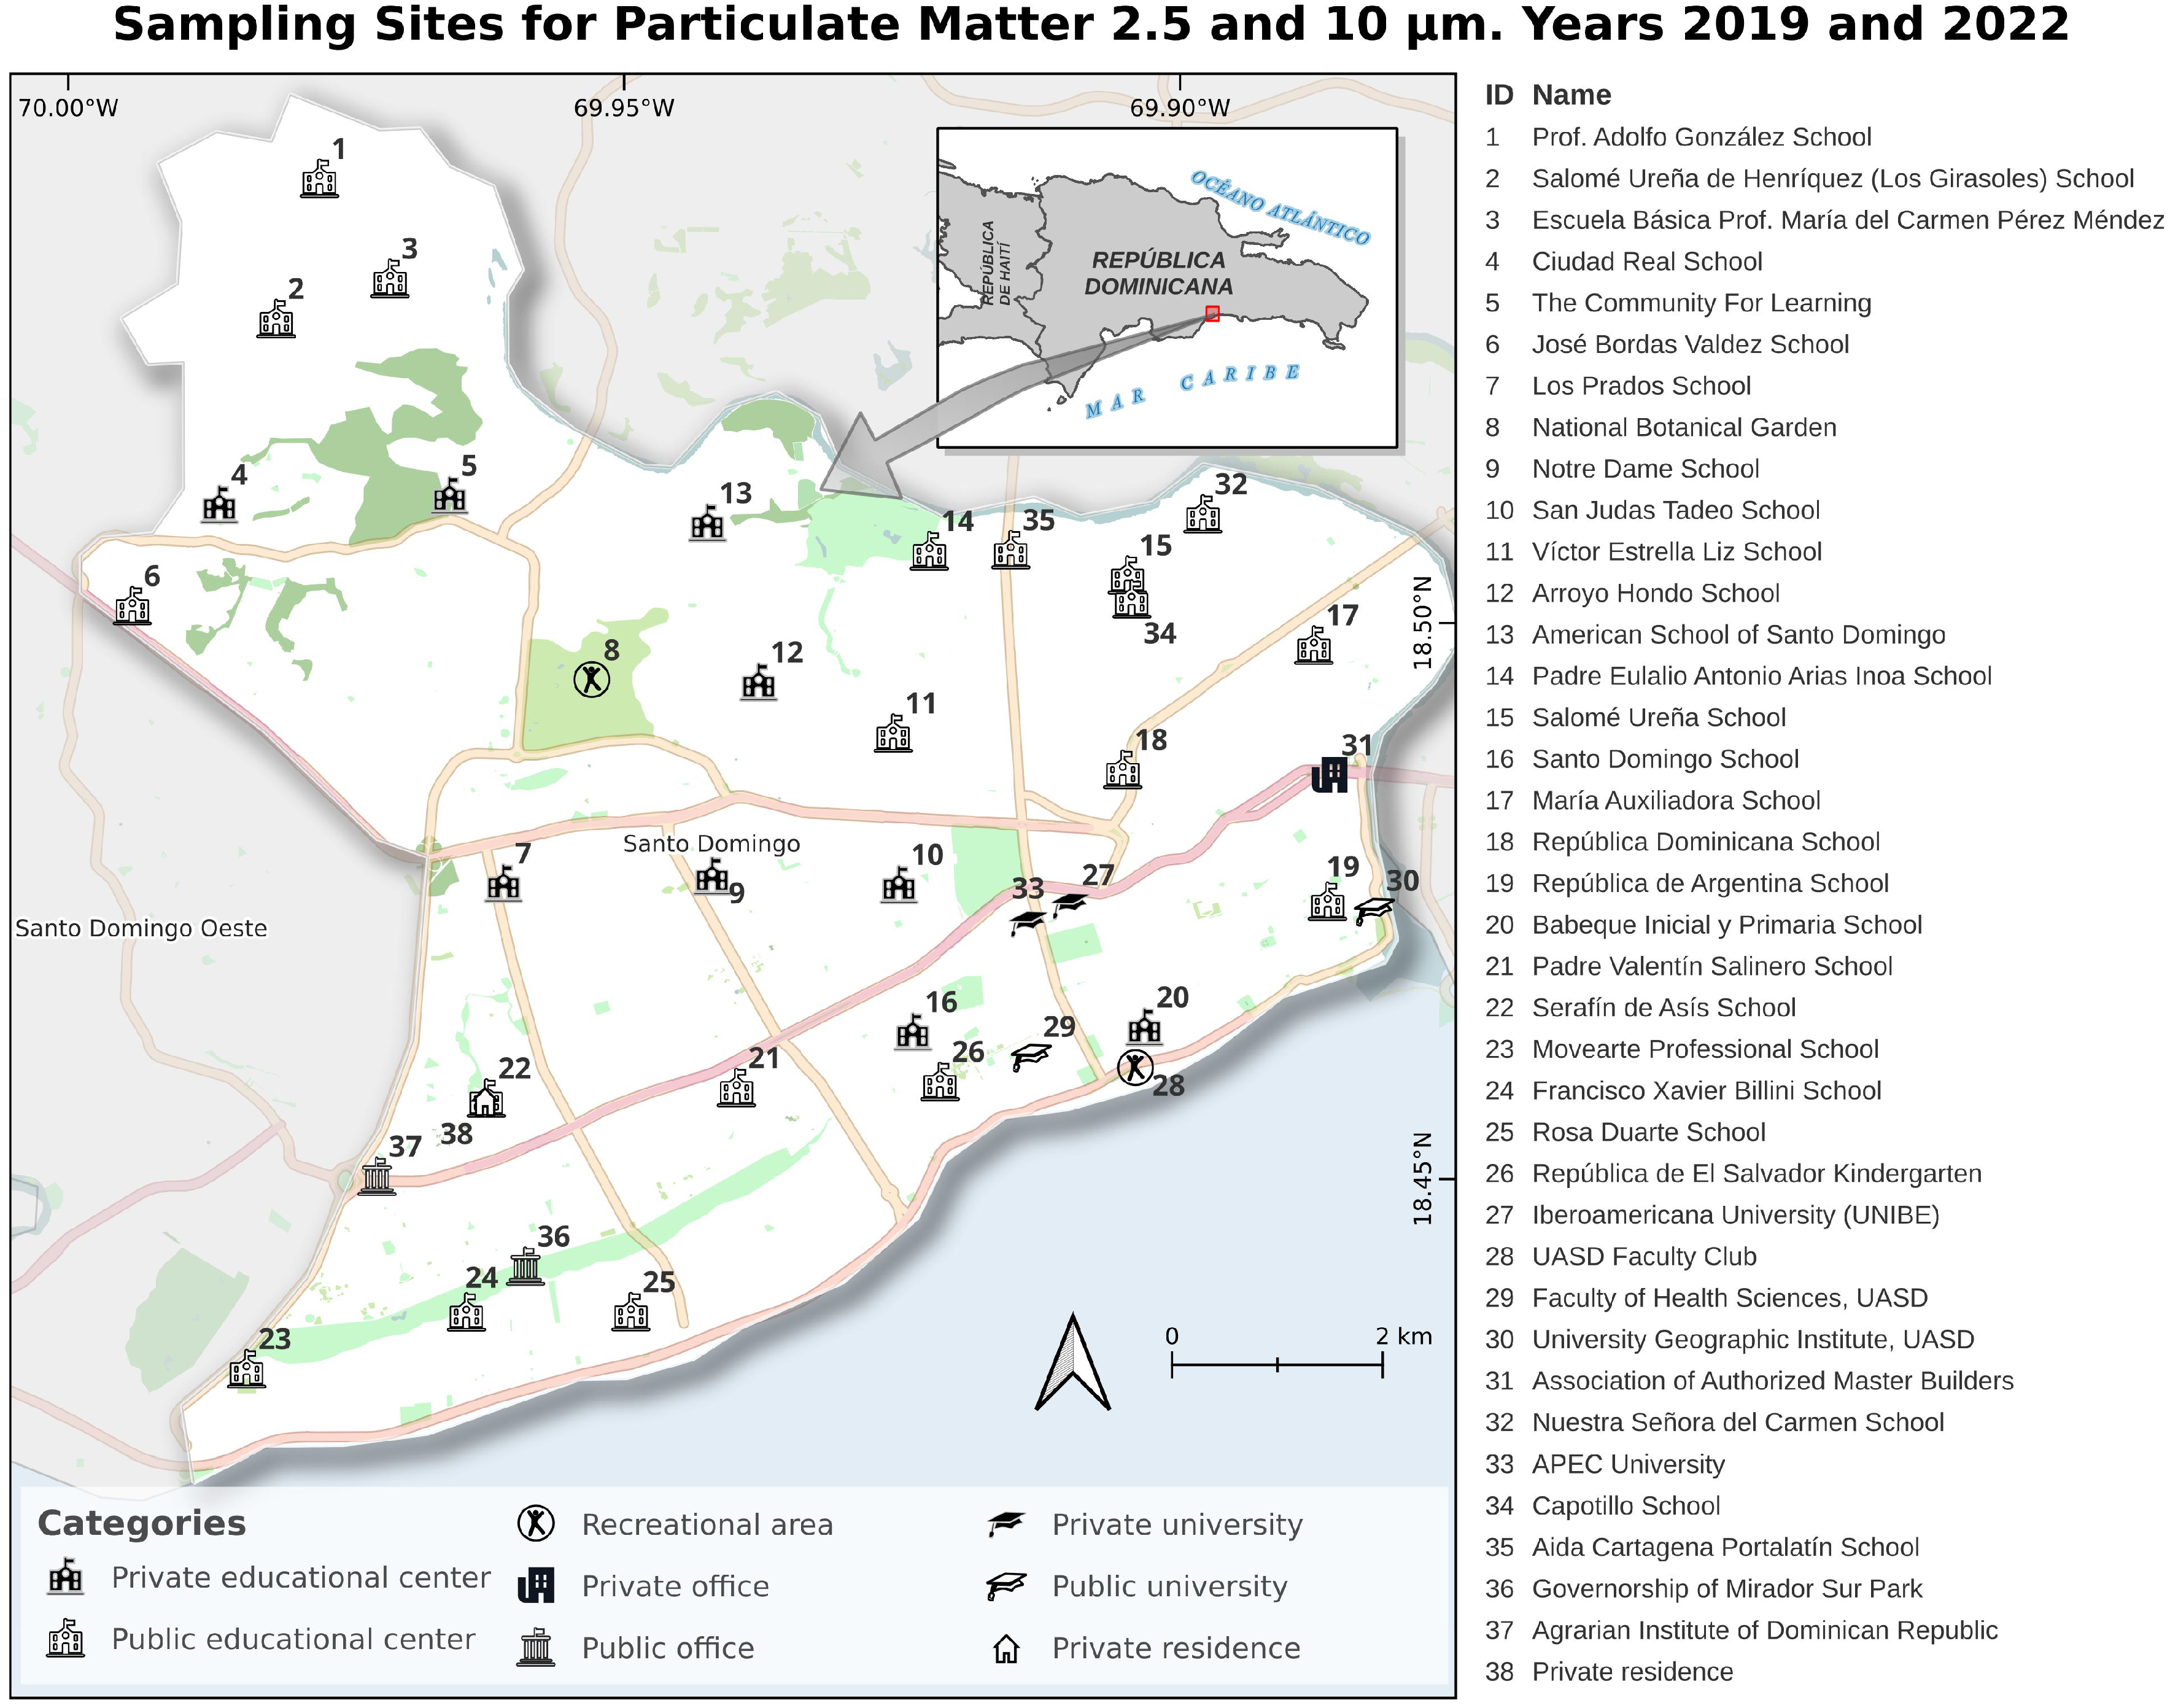
Figure 2.
PM2.5 and PM10 particulate matter by months of 2019, 2019 average, and 2022 (means and error) in Santo Domingo.
Figure 2.
PM2.5 and PM10 particulate matter by months of 2019, 2019 average, and 2022 (means and error) in Santo Domingo.
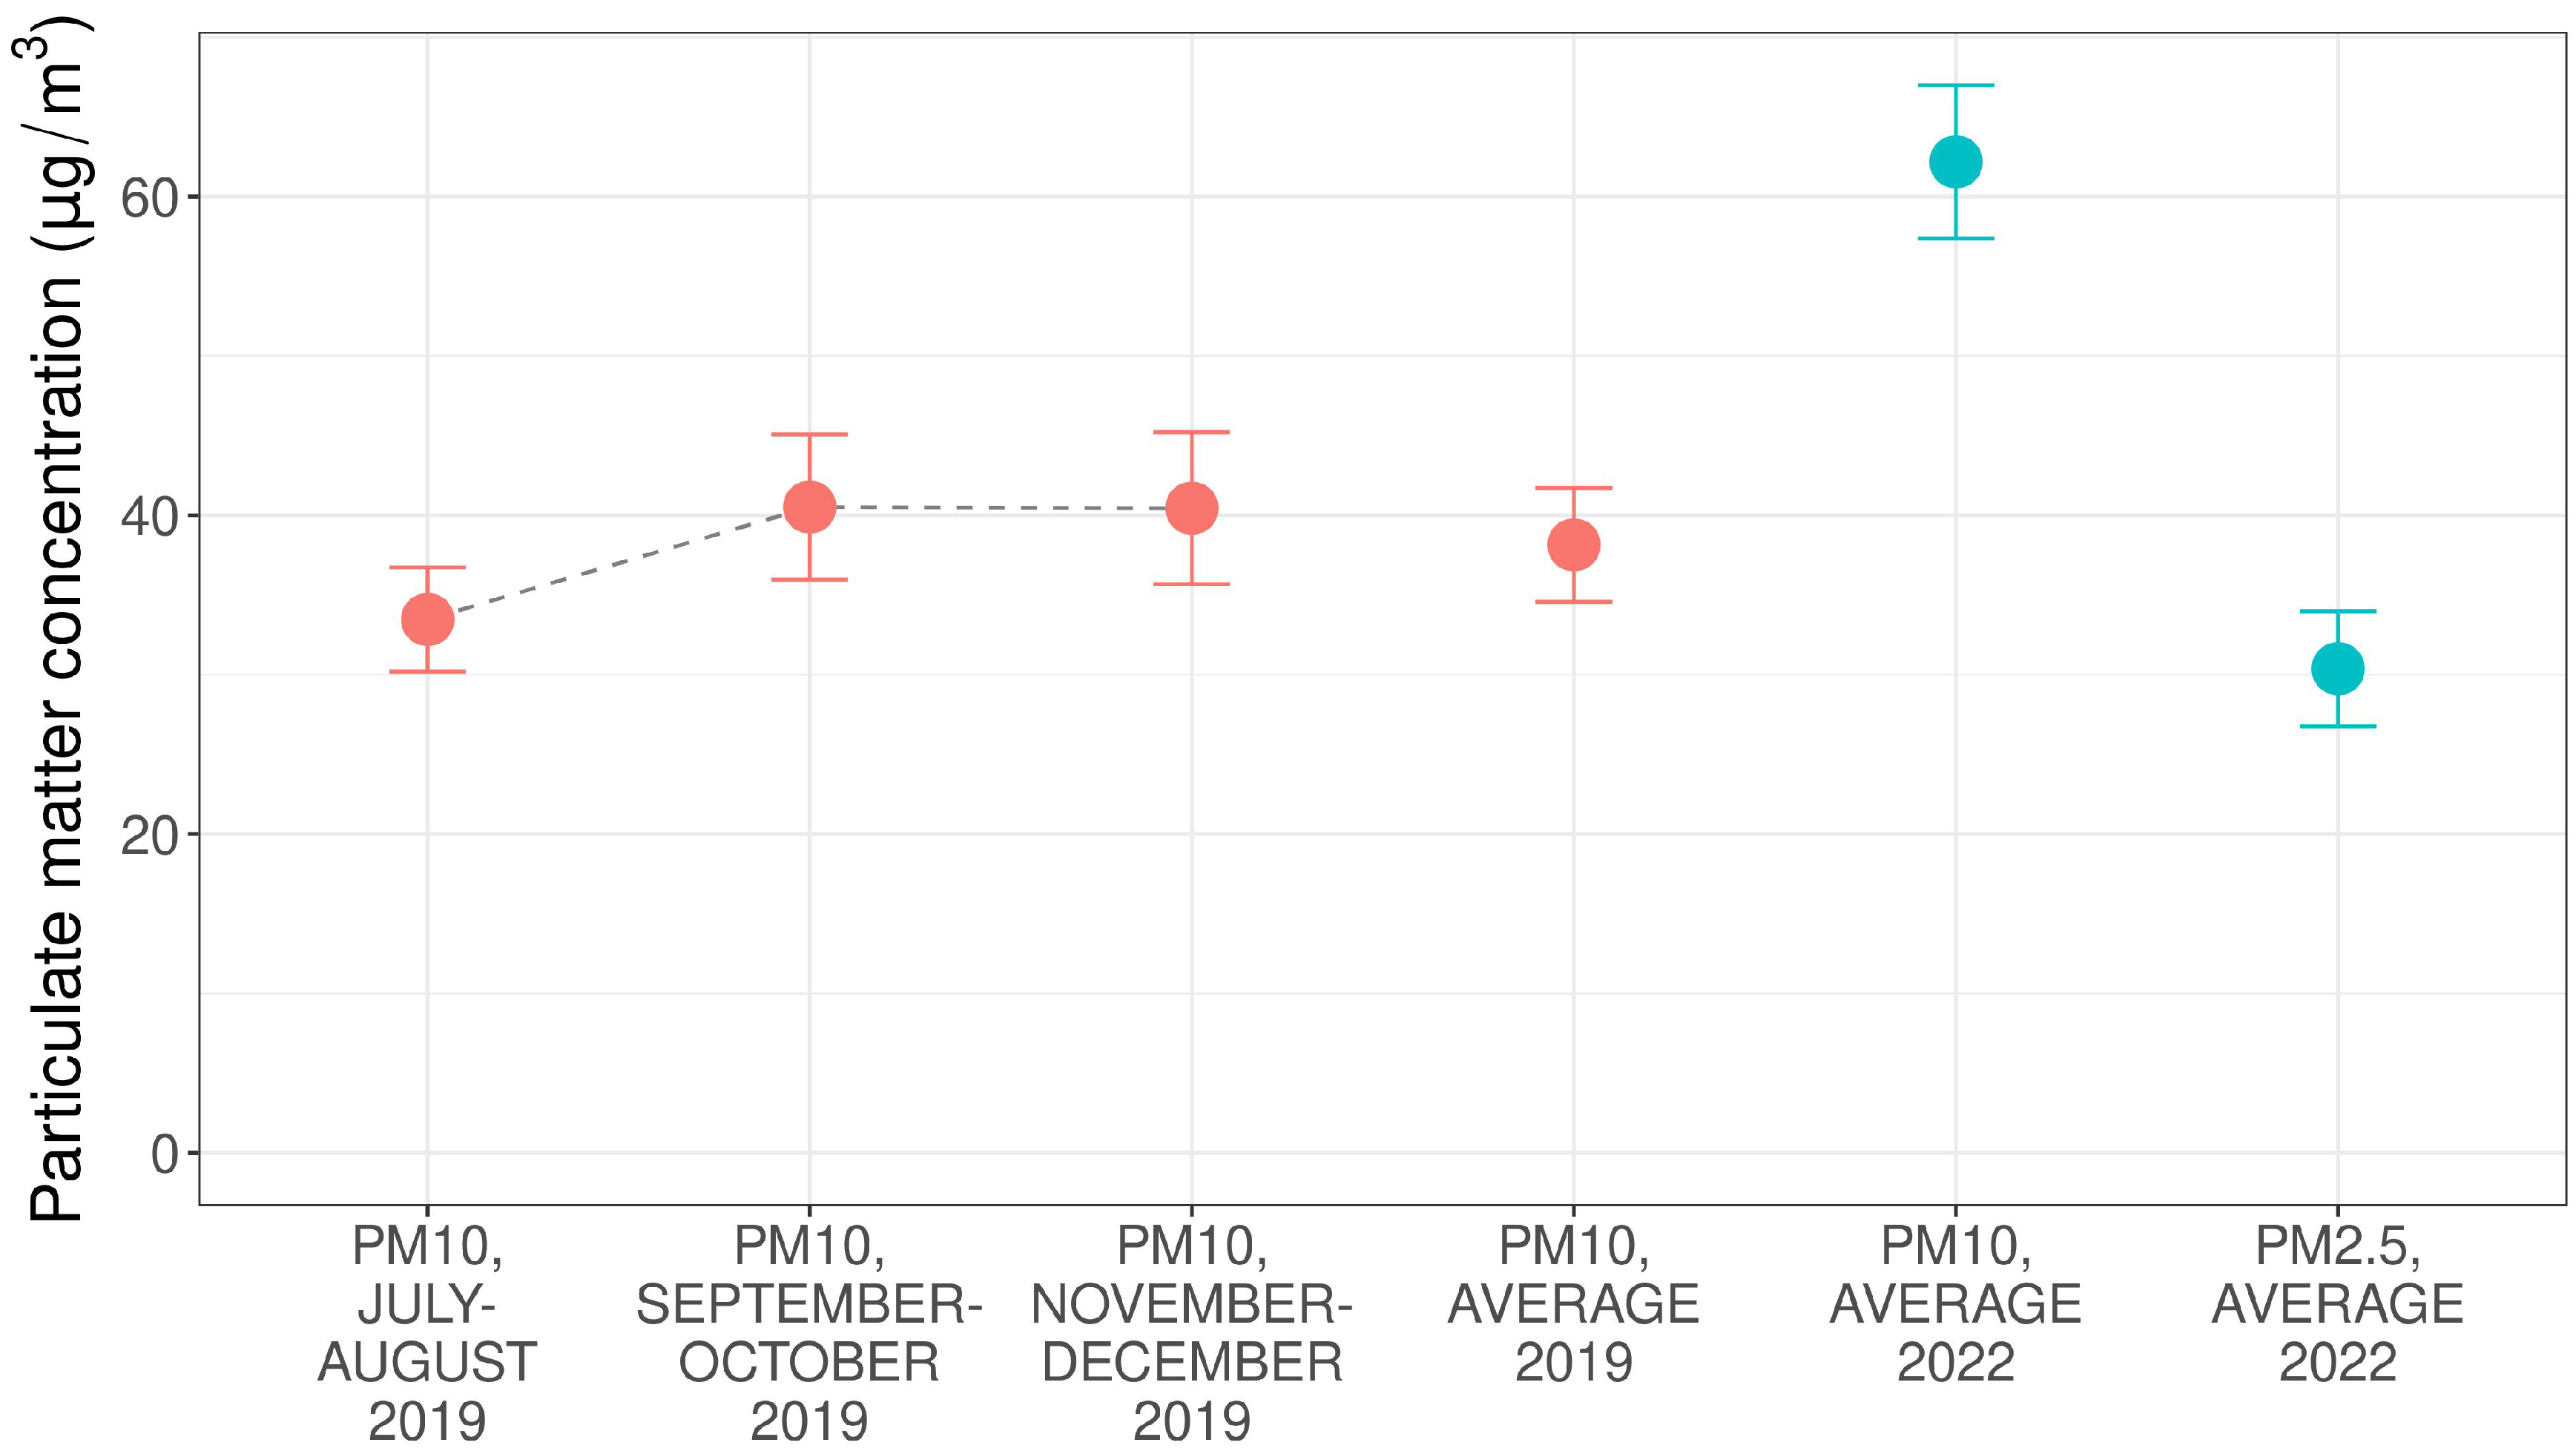
Figure 3.
Scatter plot showing the relationship between PM10 and PM2.5 concentrations () in Santo Domingo for 2022, with a superimposed linear regression model (solid line) and a 95% confidence interval (shaded area).
Figure 3.
Scatter plot showing the relationship between PM10 and PM2.5 concentrations () in Santo Domingo for 2022, with a superimposed linear regression model (solid line) and a 95% confidence interval (shaded area).
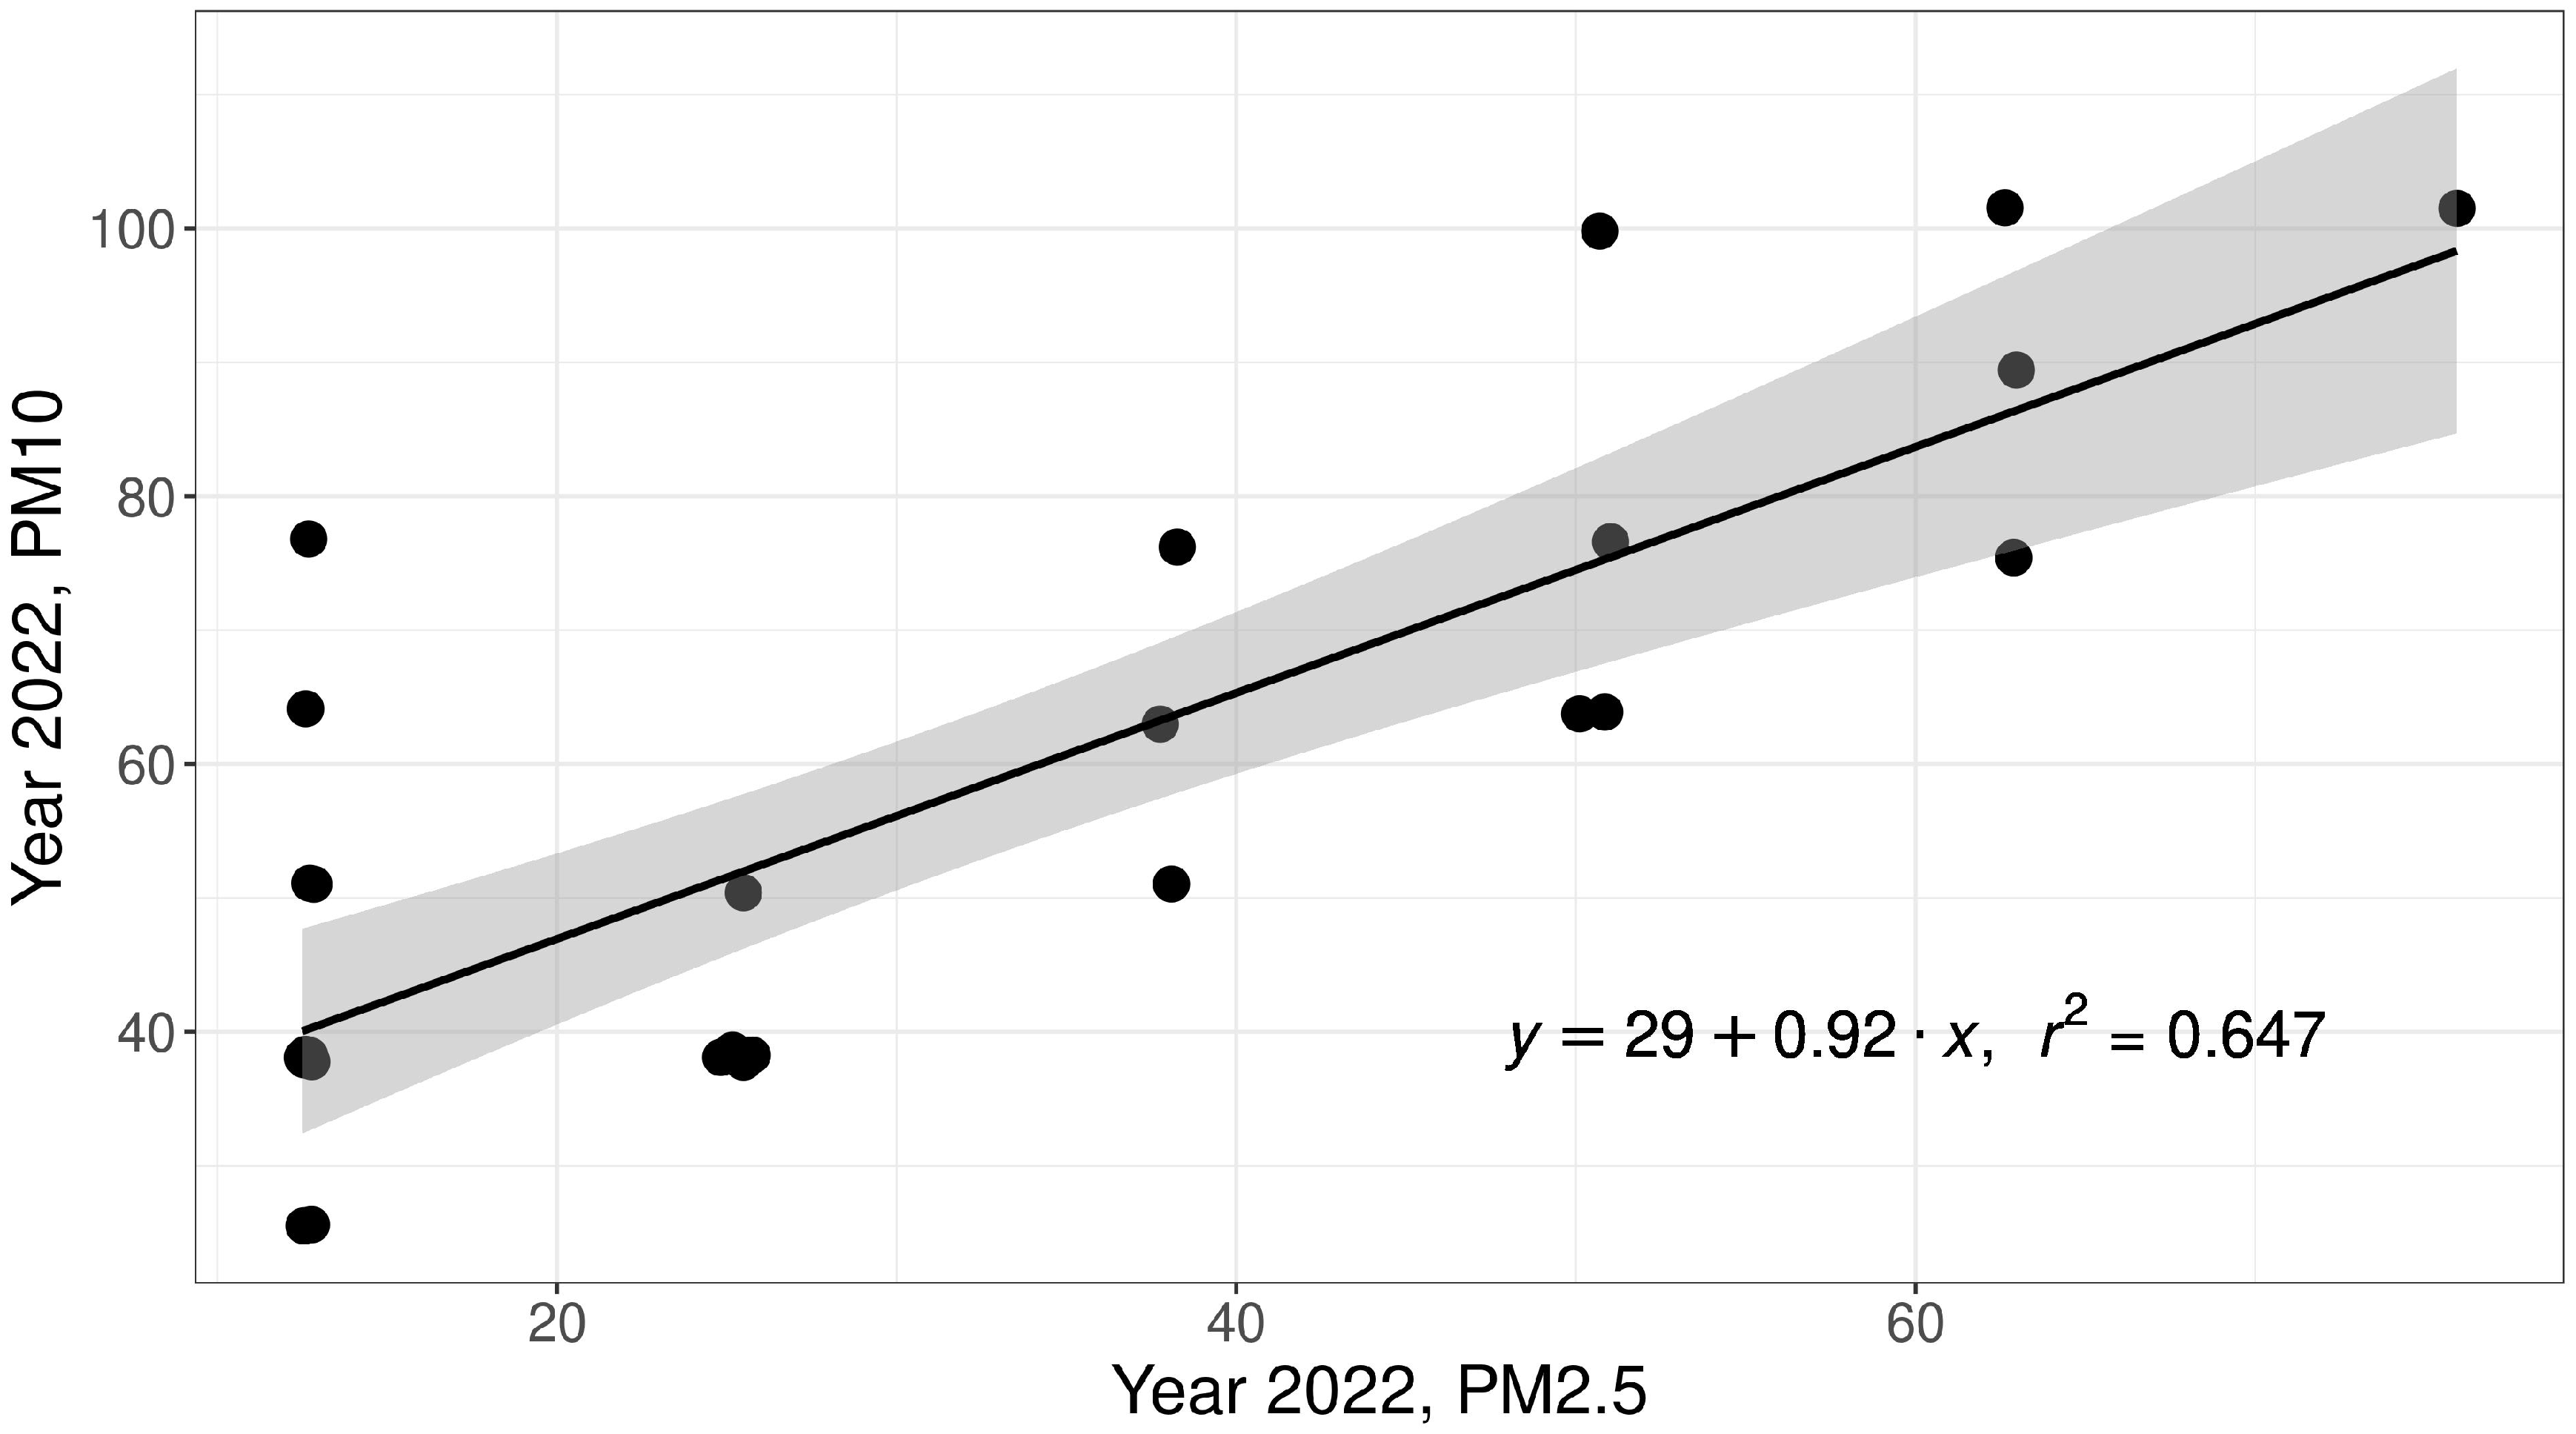
Figure 4.
Weekly mean aerosol optical depth (AOD) for 2019 (blue) and 2022 (red) in Santo Domingo, with LOESS smoothed trends and confidence intervals. AOD values exhibit a clear seasonal pattern, peaking during mid-year months and showing higher values in 2022 compared to 2019, particularly from March to August.
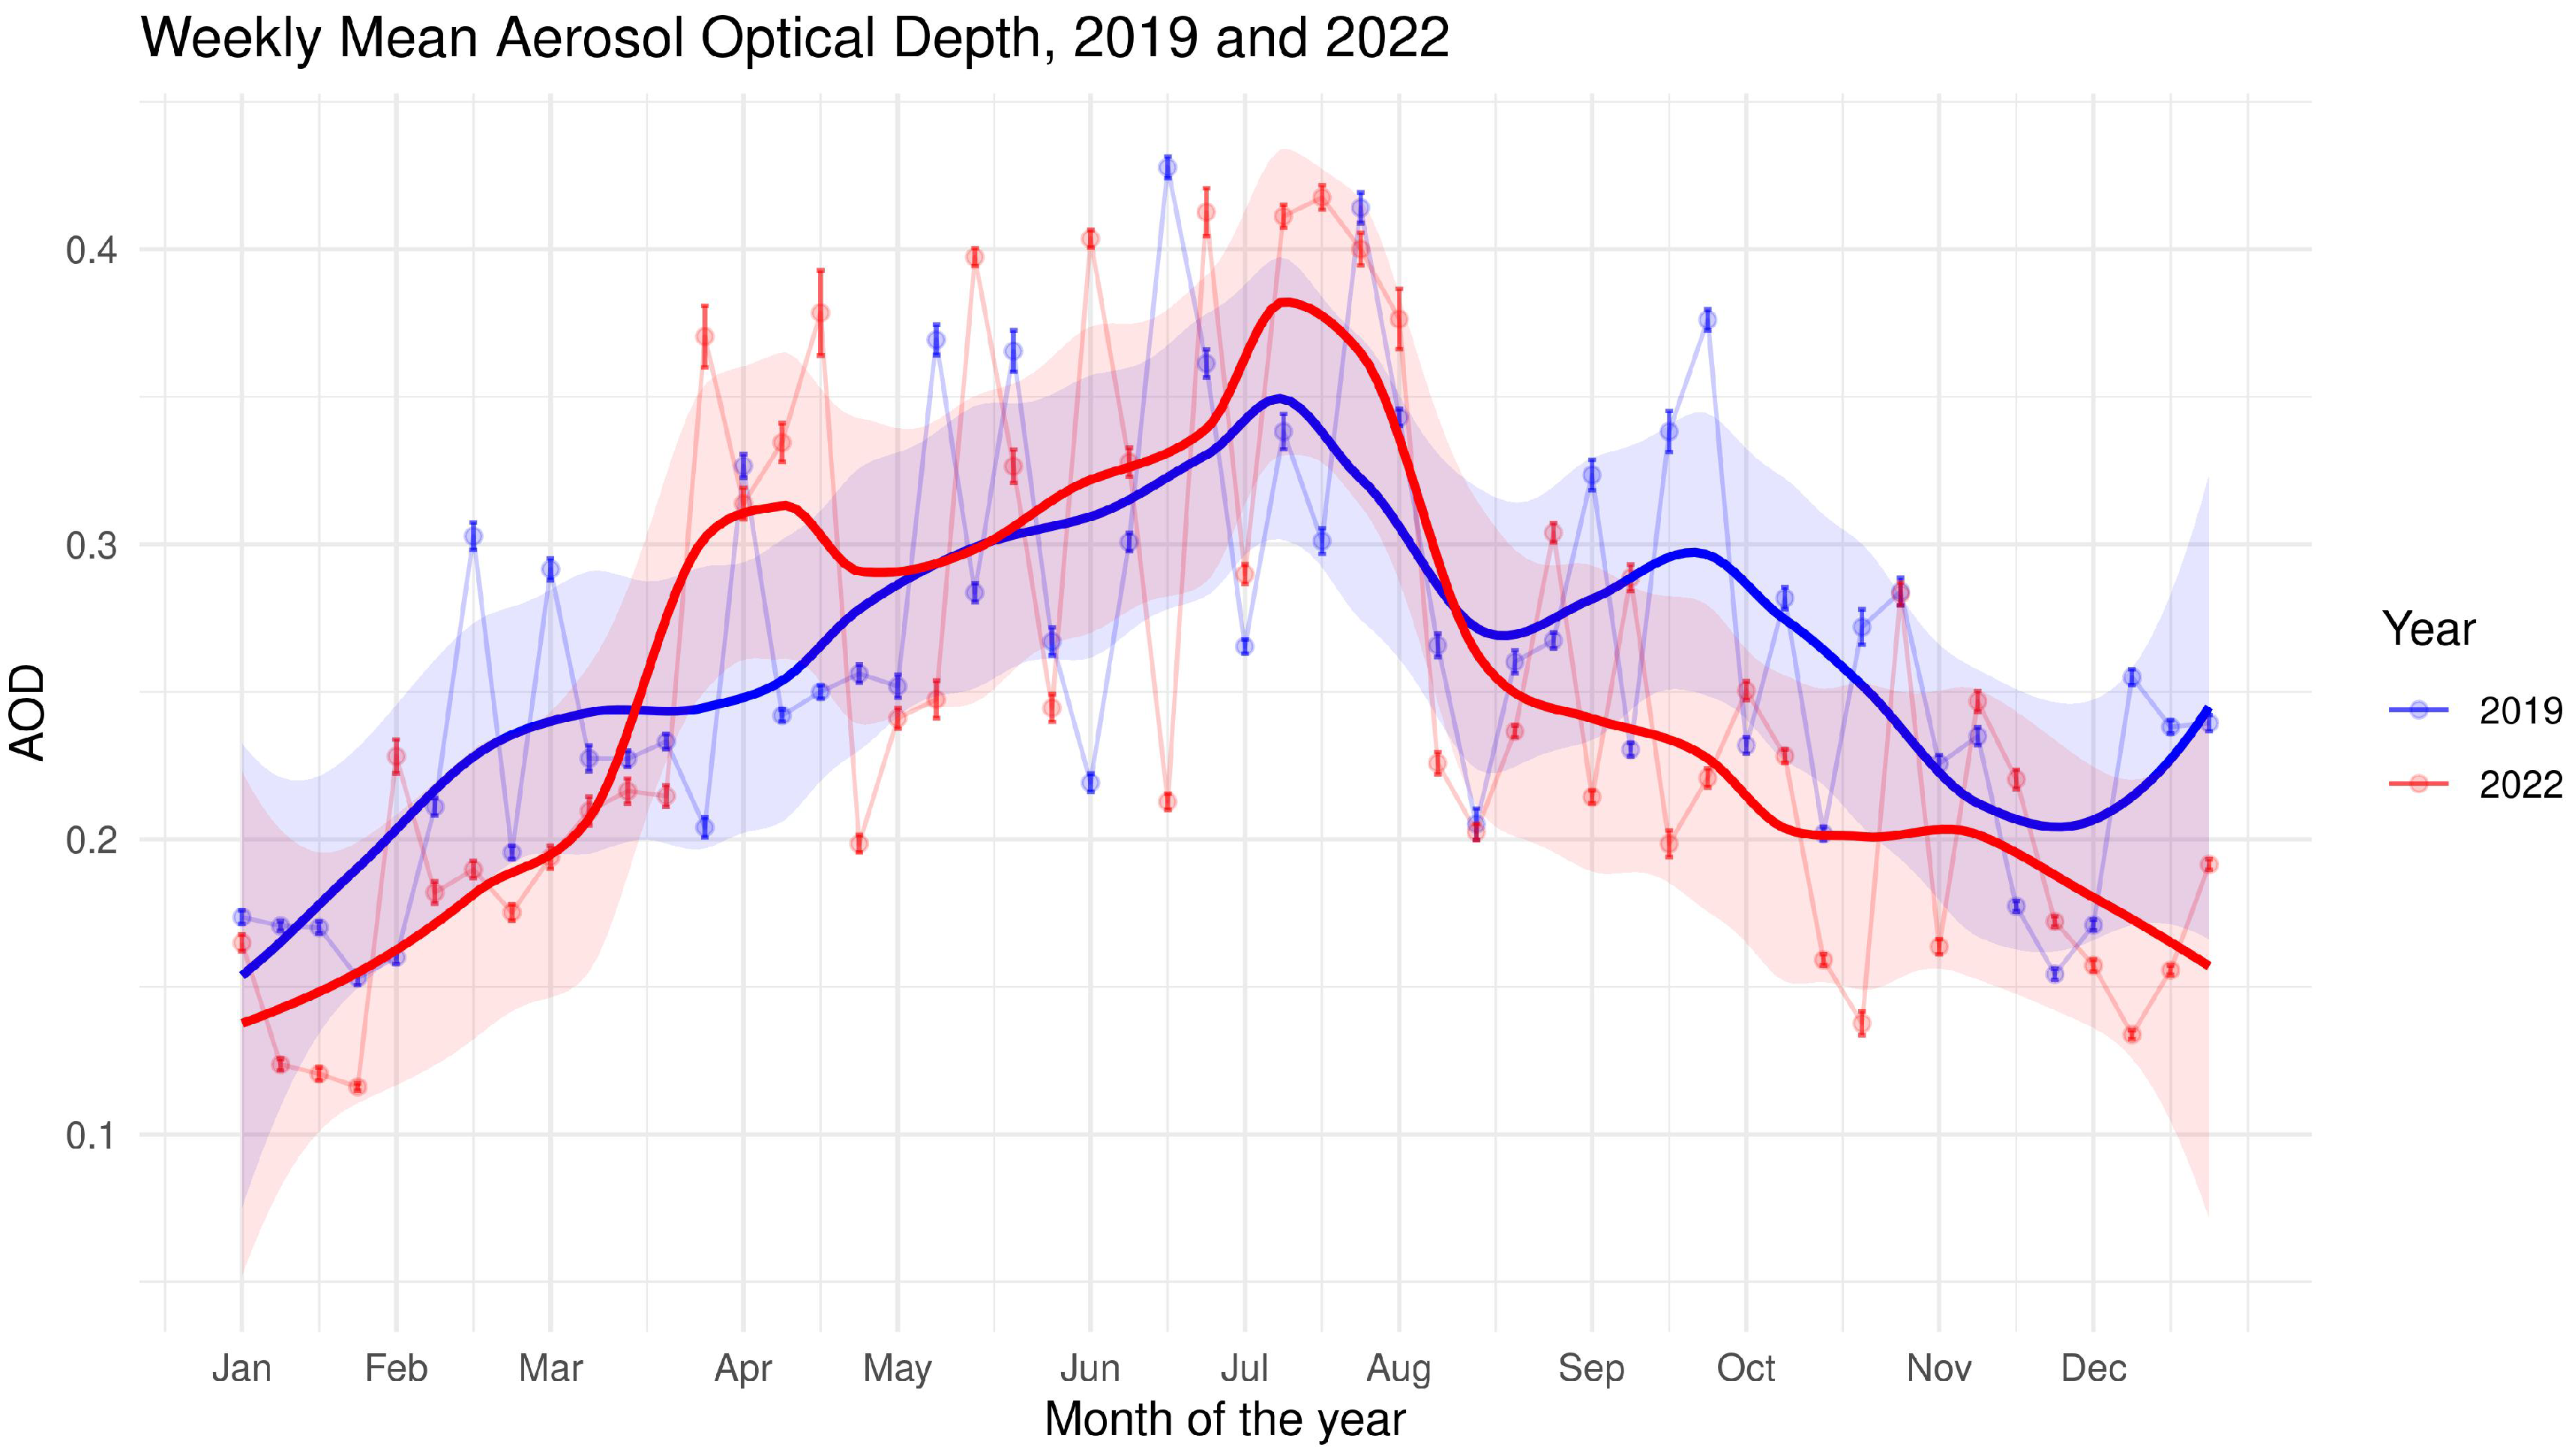
Figure 5.
Isopleths showing the spatial distribution of PM10 and PM2.5 measured in Santo Domingo during both campaigns, (A) 2019 and (B-C) 2022. Red circles indicate air quality monitoring stations
Figure 5.
Isopleths showing the spatial distribution of PM10 and PM2.5 measured in Santo Domingo during both campaigns, (A) 2019 and (B-C) 2022. Red circles indicate air quality monitoring stations
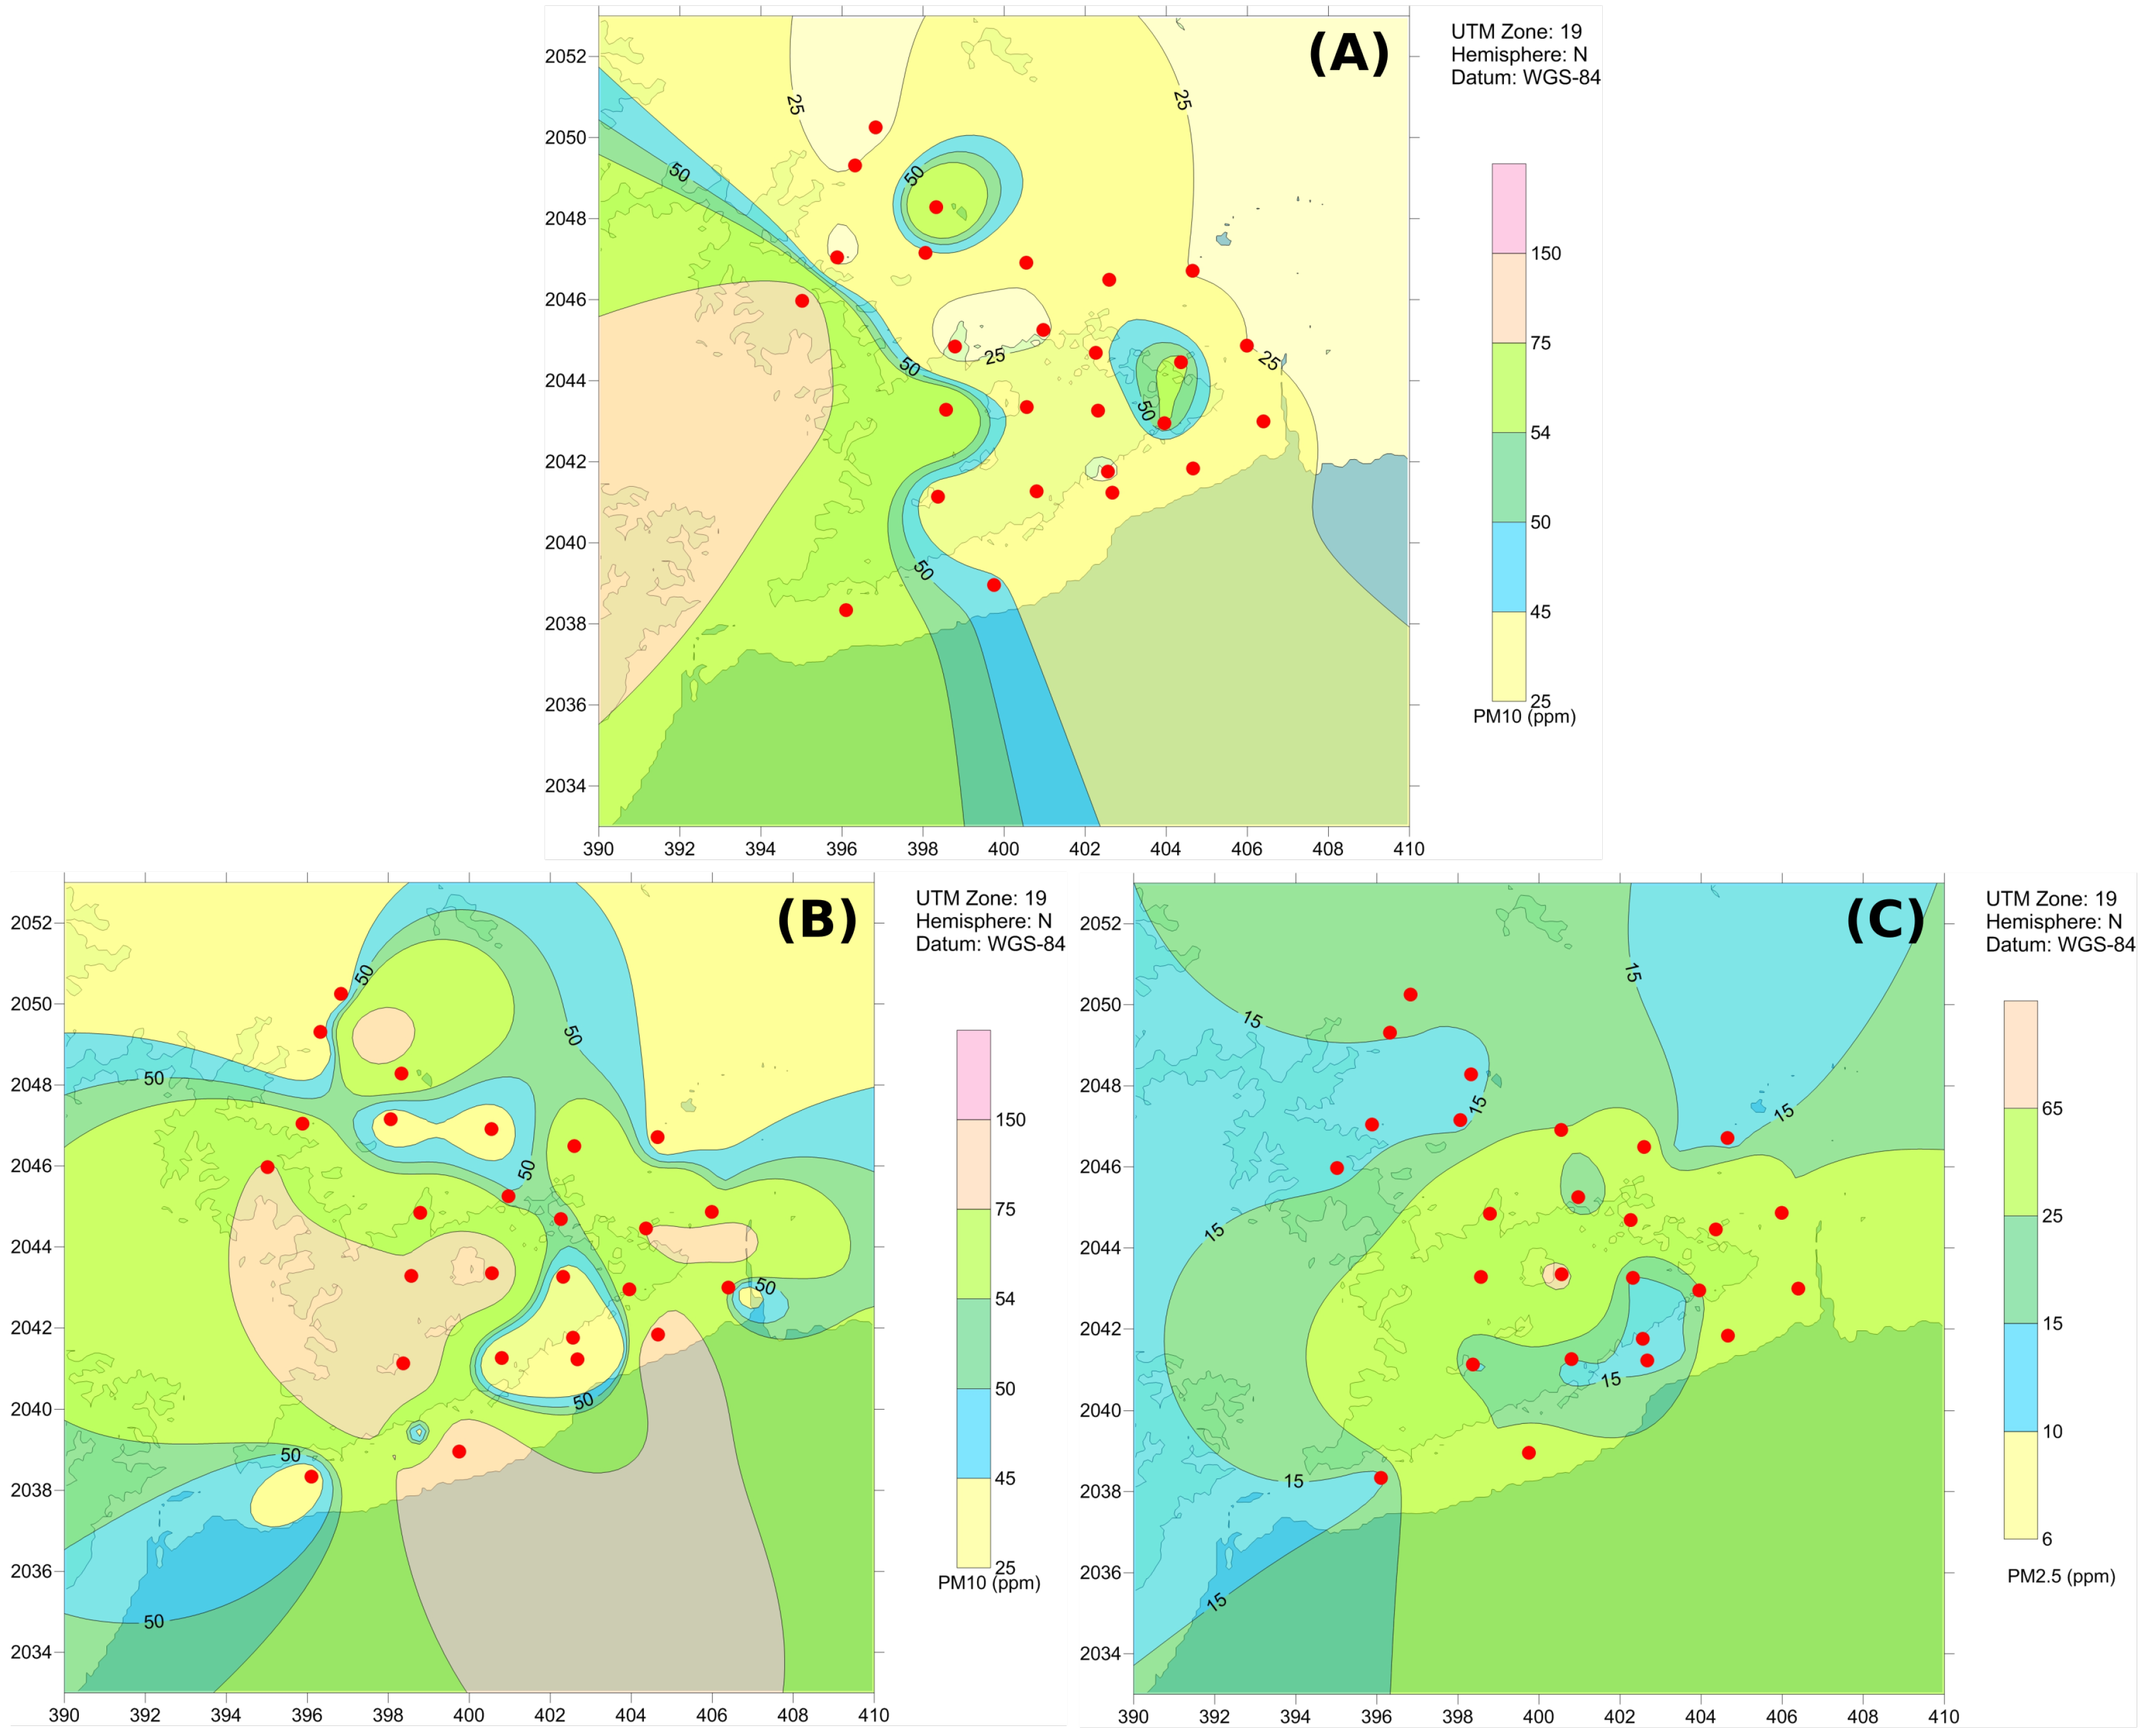
Figure 6.
Cross-Correlation Function (CCF) between weekly averaged PM10 and aerosol optical depth (AOD). The strongest positive correlation is observed at lag 0, indicating a synchronous relationship between AOD and PM10 concentrations in Santo Domingo for 2019 and 2022. The dashed blue lines represent the significance threshold, with correlations outside this range being statistically significant.
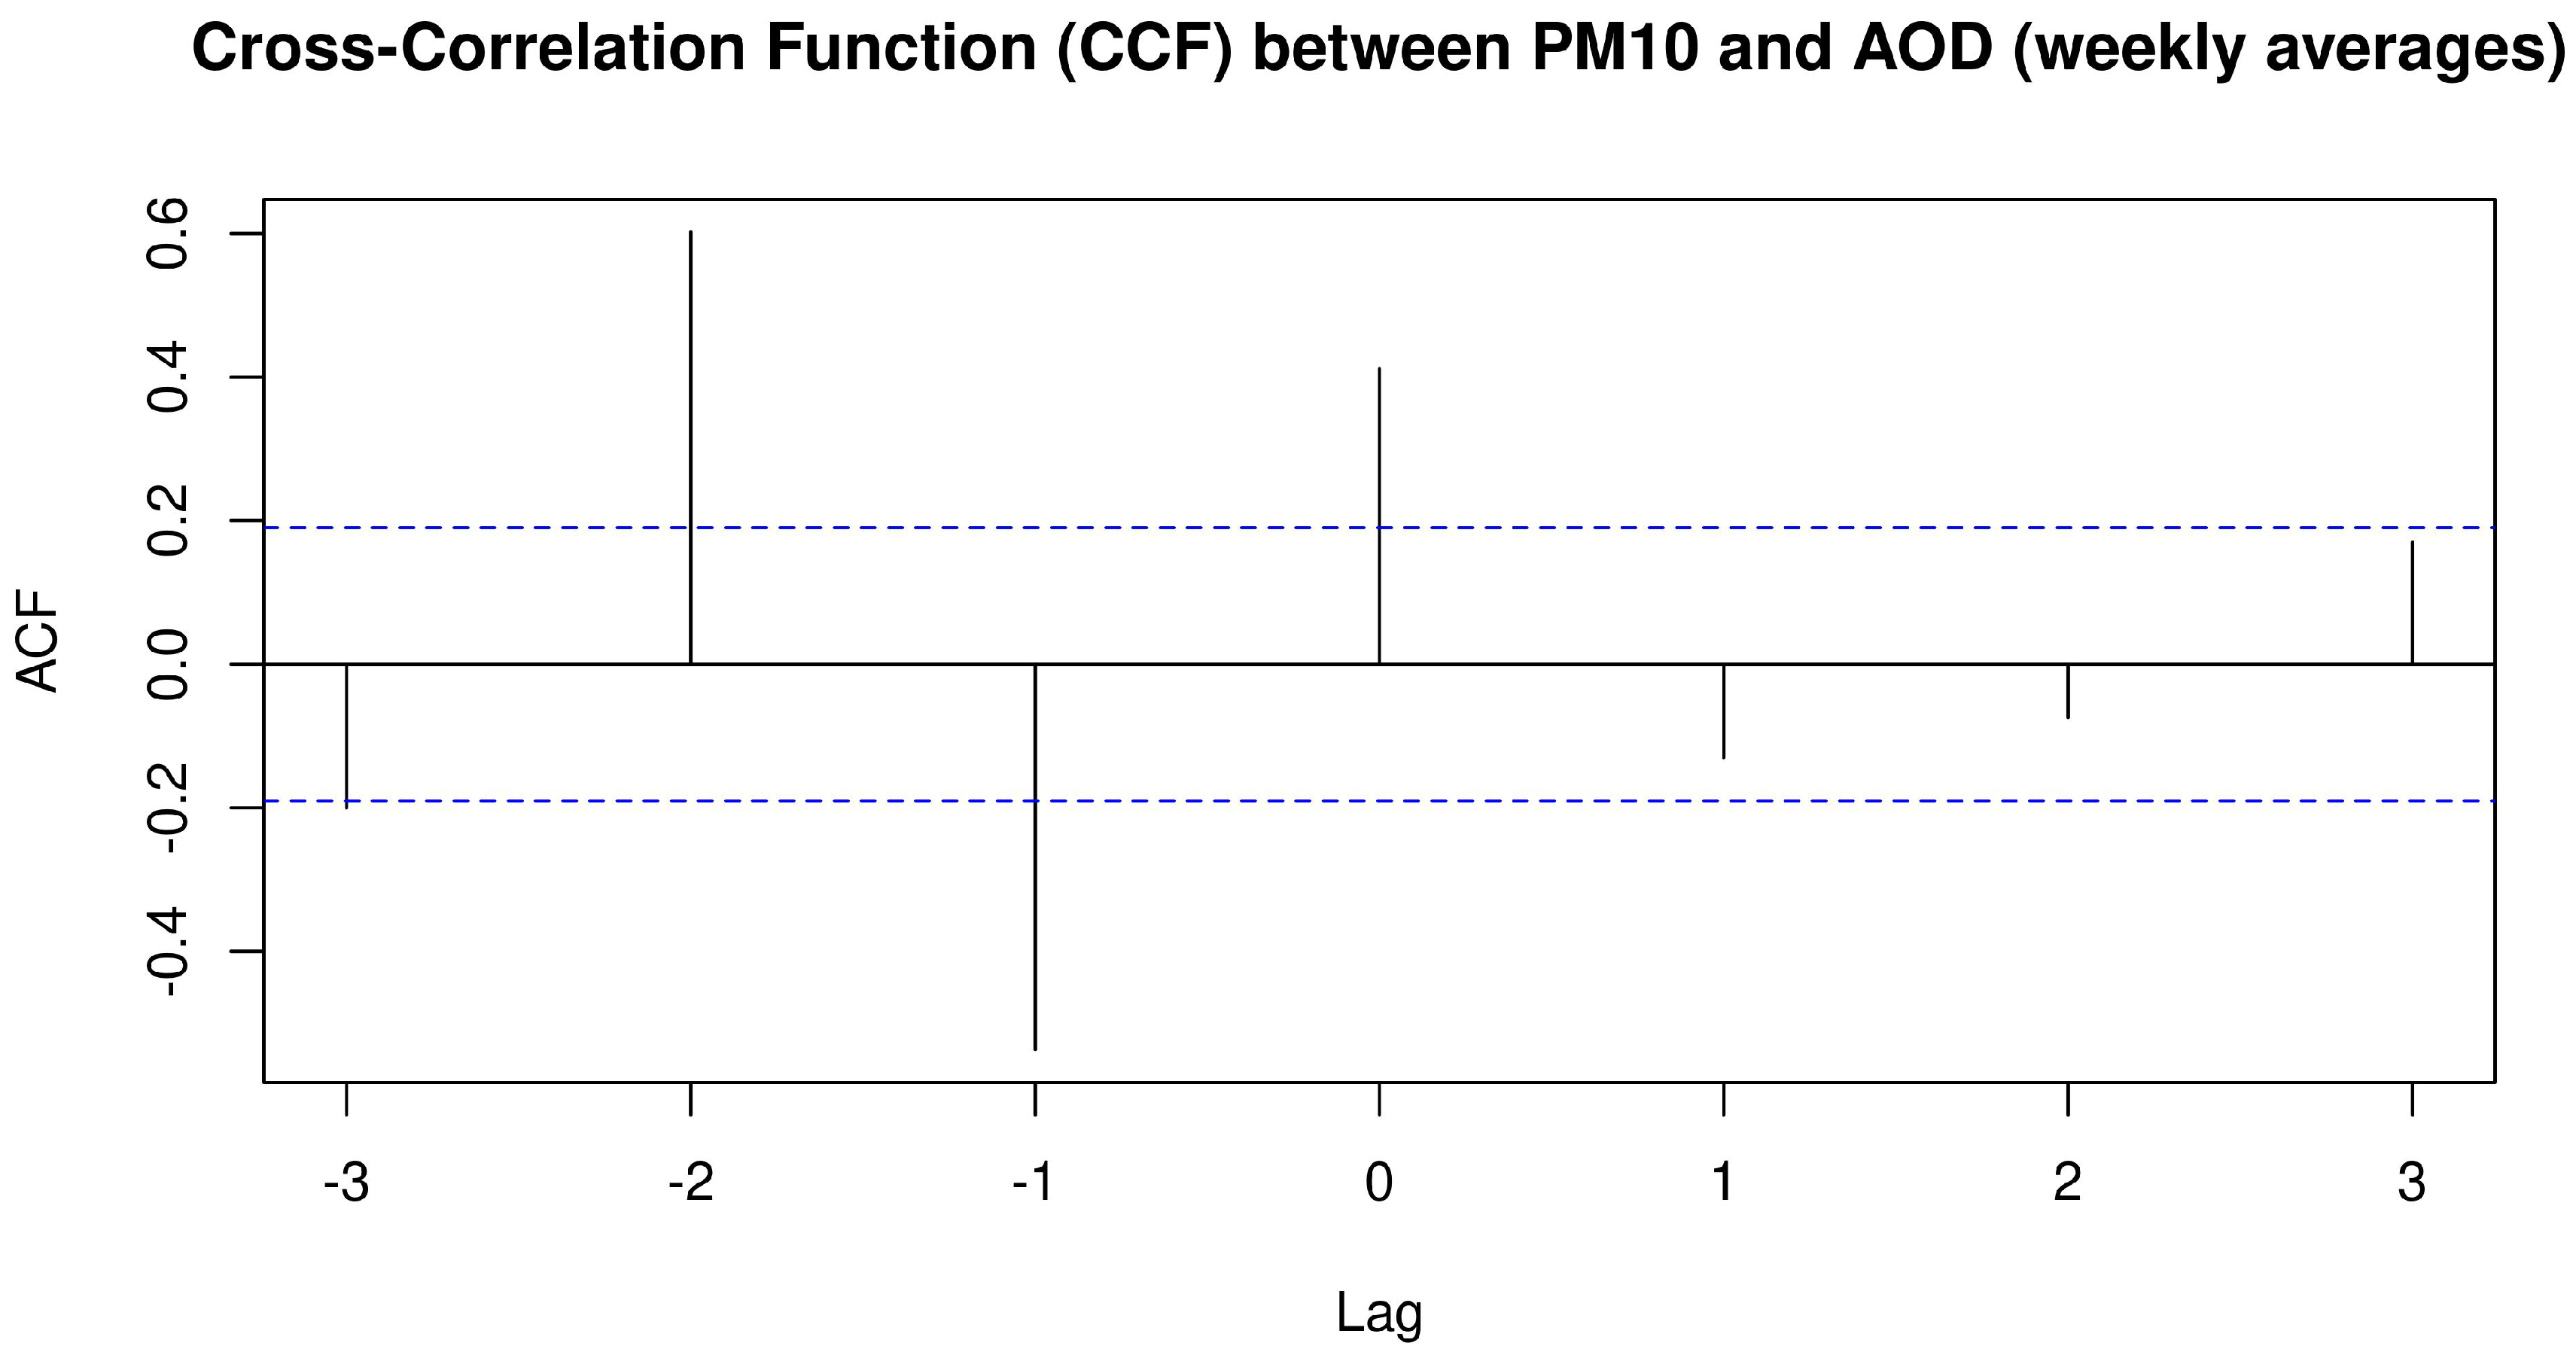
Figure 7.
Distribution of PM10 and PM2.5 concentration values () in samples taken in the Distrito Nacional, 2019 and 2022 (see Figure 1 for site reference). Labels indicate spatial statistical results: “H” denotes a hotspot, “I” an influential site, and “S” a spatial outlier. A positive sign (+) indicates higher-than-expected values (hotspot, positive influence, or positive outlier), while a negative sign (-) represents lower-than-expected values (negative influence or negative outlier). The panels correspond to PM10 concentrations in 2019 (left) and 2022 (middle), and PM2.5 concentrations in 2022 (right).
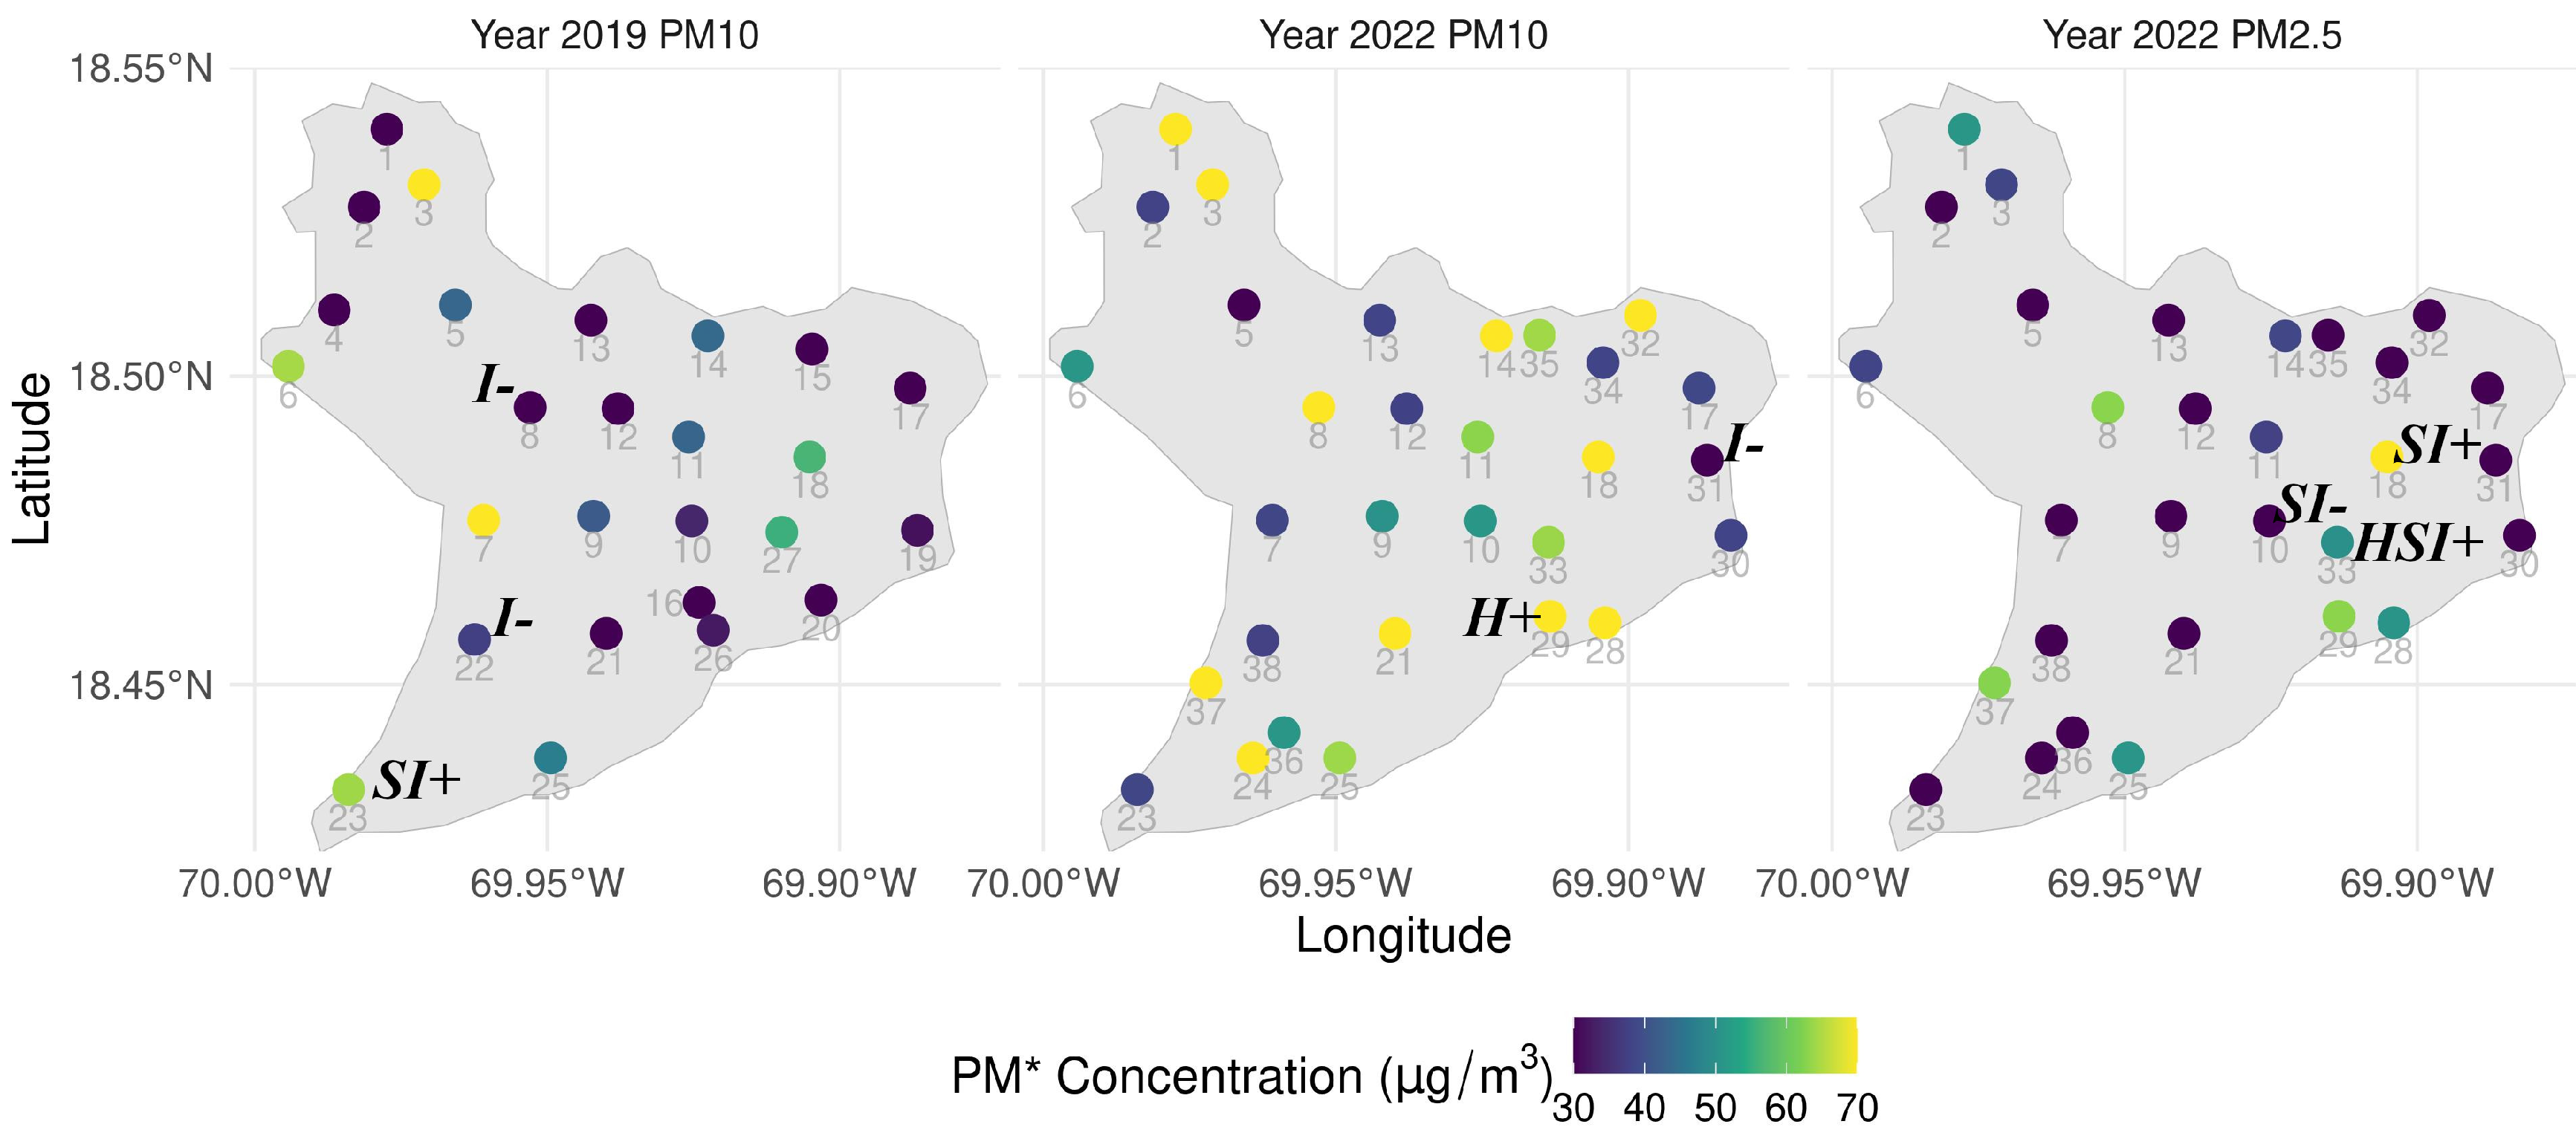
Figure 8.
Predictor variables of particulate matter in samples taken in the Distrito Nacional, 2019 and 2022.
Figure 8.
Predictor variables of particulate matter in samples taken in the Distrito Nacional, 2019 and 2022.
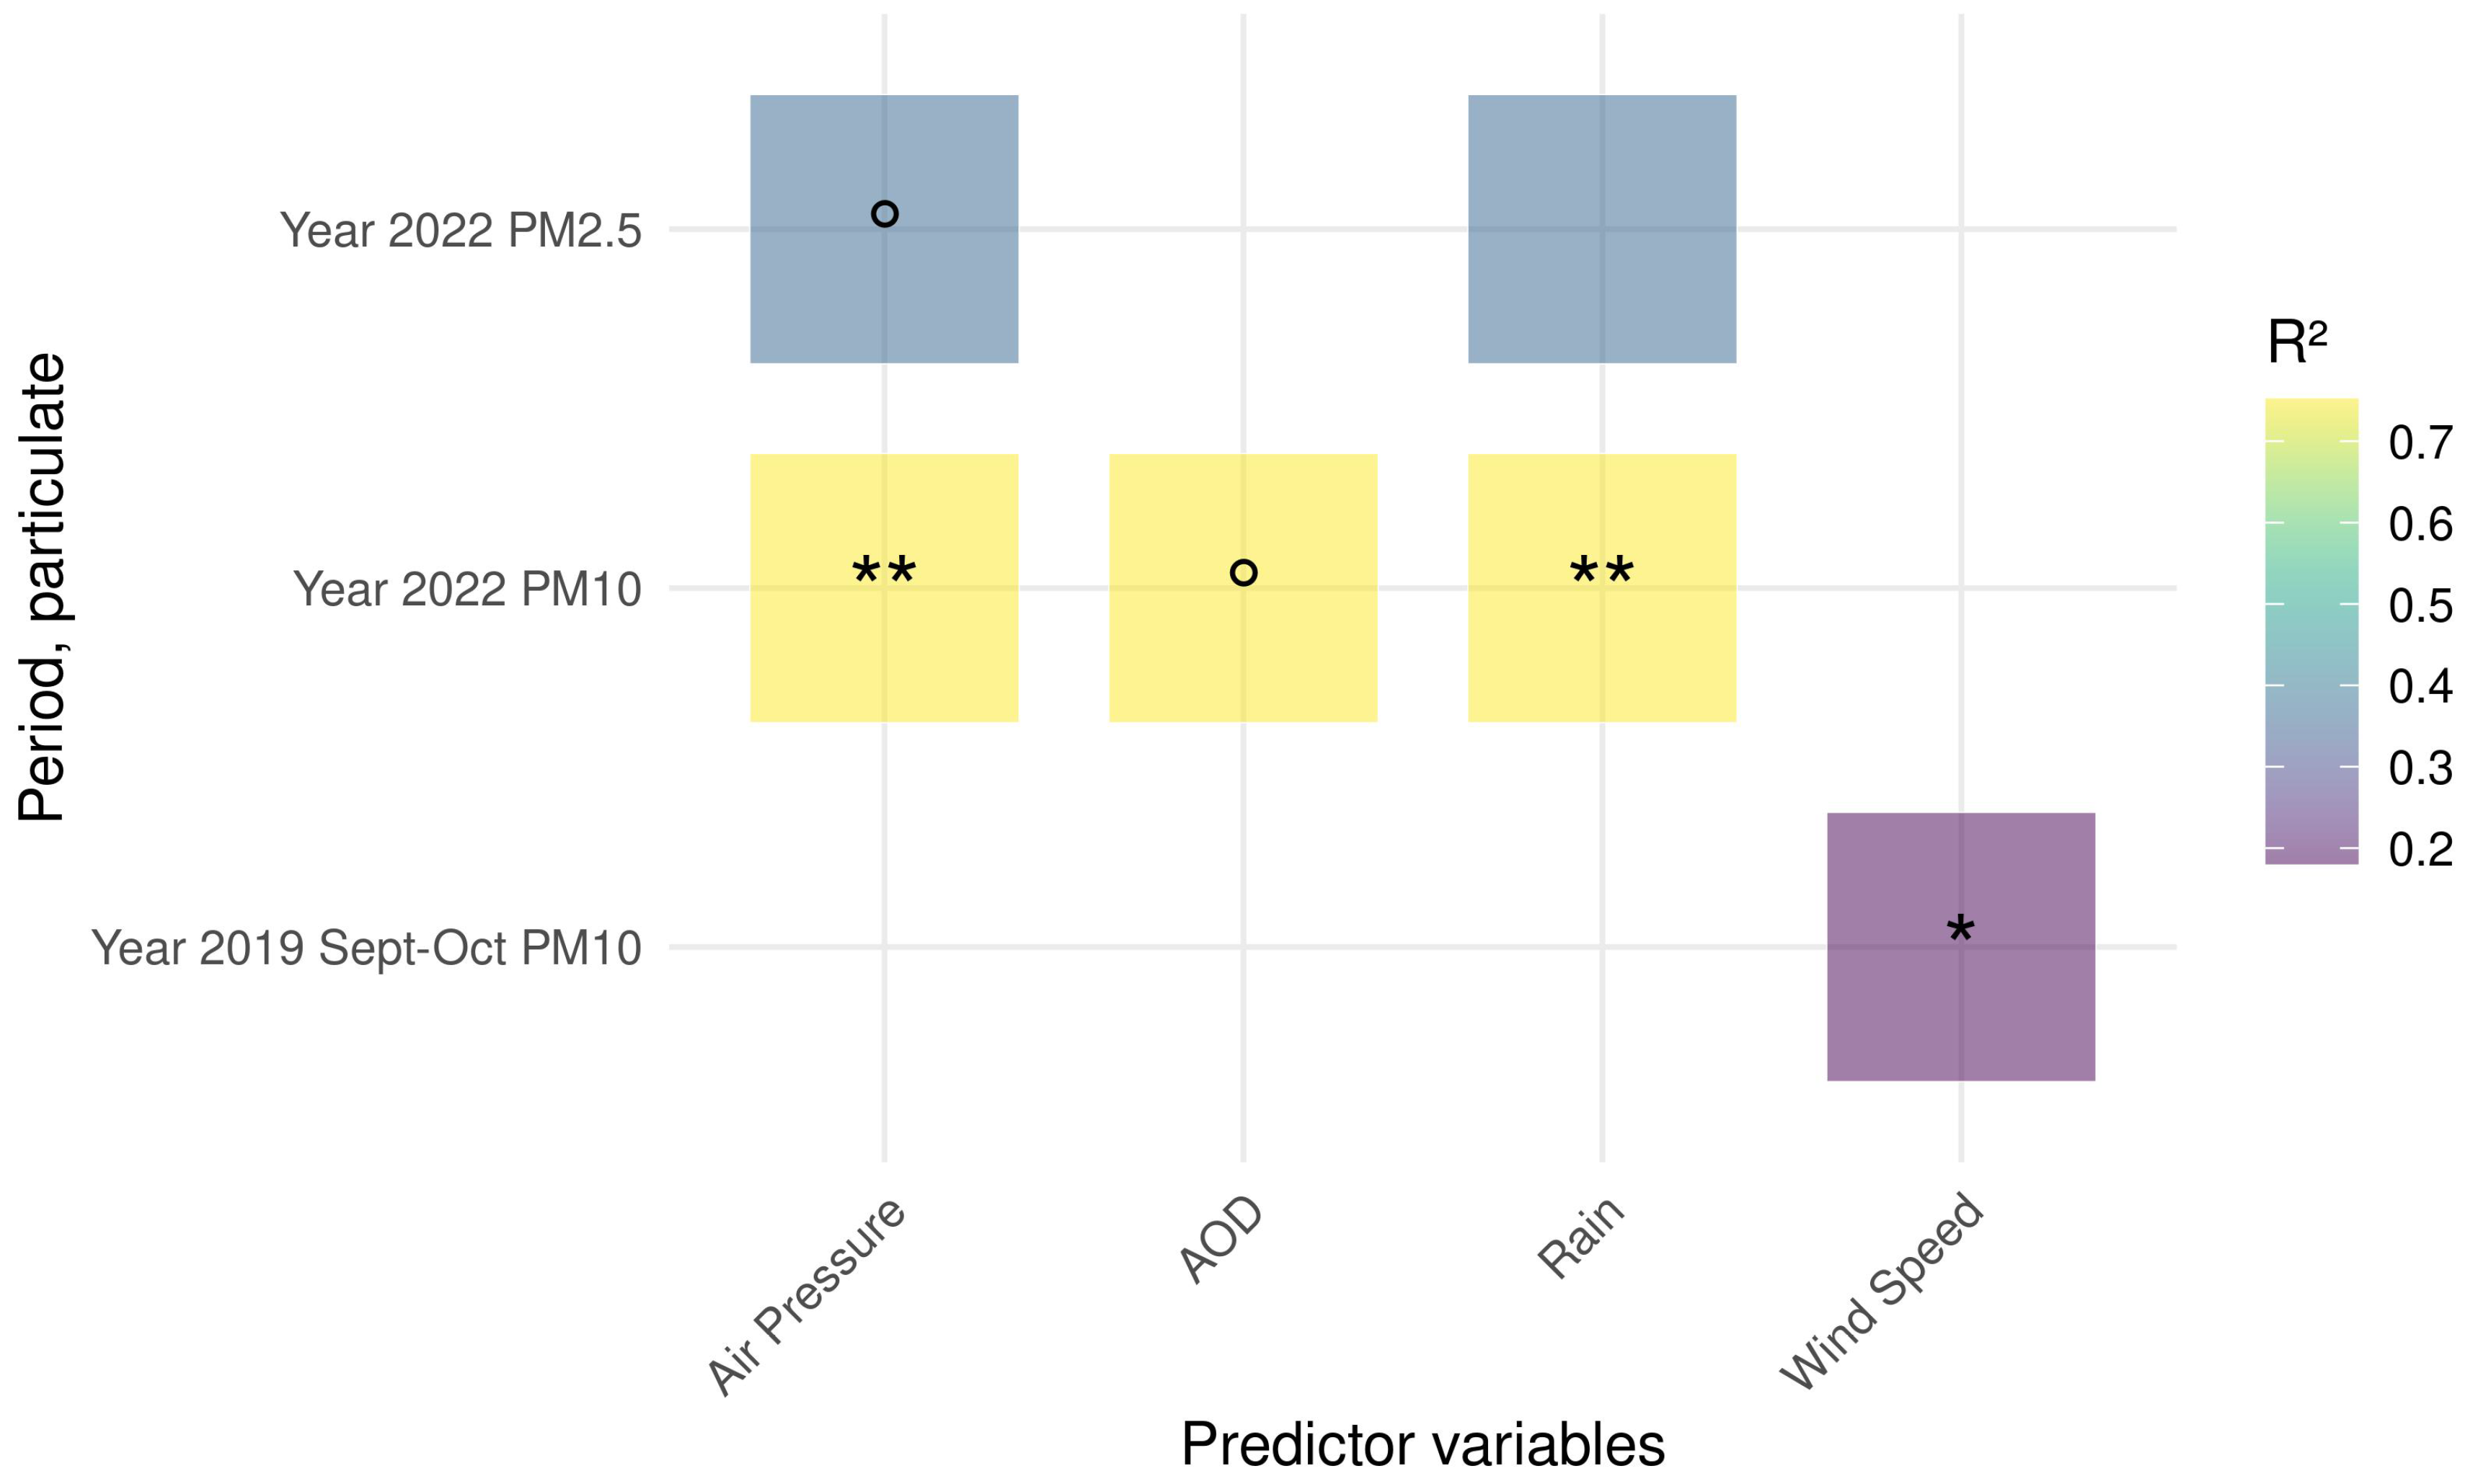
Table 1.
Average PM10 and PM2.5 concentrations () for the years 2019 and 2022 in Santo Domingo.
| Year, PM | N | Min. | Mean ± Error | Median | Max. | Std. Dev. | Confidence Interval (95%) |
|---|---|---|---|---|---|---|---|
| 2019, PM10 | 26 | 10.85 | 38.14 ± 3.58 | 33.06 | 77.27 | 18.24 | (30.78, 45.51) |
| 2022, PM2.5 | 30 | 12.50 | 30.37 ± 3.61 | 25.33 | 75.94 | 19.76 | (22.99, 37.75) |
| 2022, PM10 | 30 | 25.51 | 62.18 ± 4.81 | 57.04 | 113.05 | 26.33 | (52.34, 72.01) |
Table 2.
Normality testing and correlation of PM2.5 and PM10 concentrations, year 2022.
| Test | Result (p-value, significance) |
|---|---|
| Assumption of normality (S-W test) PM2.5 | (p<0.001 ***) |
| Assumption of normality (S-W test) PM10 | (0.001<p<0.01 **) |
| Correlation between PM2.5 and PM10 concentrations | (0.001<p<0.01 **) |
Table 3.
Spatial autocorrelation diagnostics of PM10 and PM2.5 concentrations in Santo Domingo for the years 2019 and 2022 (see Figure 1 and Table A1 for site reference).
| Year | Particulate matter (µm) | Site | Influential - | Influential + | Spatial outlier - | Spatial outlier + | LISA hotspot |
|---|---|---|---|---|---|---|---|
| 2019 | 10 | 8 | X | ||||
| 2019 | 10 | 22 | X | ||||
| 2019 | 10 | 23 | X | X | |||
| 2022 | 2.5 | 10 | X | X | |||
| 2022 | 2.5 | 18 | X | ||||
| 2022 | 2.5 | 33 | X | X | X | ||
| 2022 | 10 | 29 | X | ||||
| 2022 | 10 | 31 | X |
Disclaimer/Publisher’s Note: The statements, opinions and data contained in all publications are solely those of the individual author(s) and contributor(s) and not of MDPI and/or the editor(s). MDPI and/or the editor(s) disclaim responsibility for any injury to people or property resulting from any ideas, methods, instructions or products referred to in the content. |
© 2025 by the authors. Licensee MDPI, Basel, Switzerland. This article is an open access article distributed under the terms and conditions of the Creative Commons Attribution (CC BY) license (http://creativecommons.org/licenses/by/4.0/).
Copyright: This open access article is published under a Creative Commons CC BY 4.0 license, which permit the free download, distribution, and reuse, provided that the author and preprint are cited in any reuse.


