
Submitted:
19 June 2025
Posted:
20 June 2025
You are already at the latest version
Abstract
Although the implementation of the European Union's policies has contributed substan-tially to reducing air pollution in recent years, PM2.5 remains a pollutant that poses sig-nificant risks to the environment and public health. The present study examines the ap-plication of a novel method for assessing the environmental impact and risk associated with this pollutant. The new integrated approach for air quality evaluation and predic-tion of the effects and risk of certain pollutants is based on AOD analysis, considering the AERONET database. For its validation, the new approach was applied based on moni-toring air quality data for two cities in Romania, considering 13 years (from 2011 to 2023) in one case and 12 years (from 2012 to 2023) in the other. The results demonstrated that an AOD risk index can be developed and utilised for air quality evaluation and prediction, enabling the estimation of impacts and risks. In this case, the aerosols measured by AERONET over Cluj-Napoca for 13 years (2011 – 2023) were dominated by the occurrence of a 46% elemental carbon (EC) and organic carbon (OC) mixture, while the measure-ments over Iasi city for 12 years (2012 – 2023) were dominated by the occurrence of 55% EC and OC mixture. The impacts and risks, as calculated by the AOD index for EC, show few significant ones, with an AOD range of 0.88 to 1.05 for Iasi city and 0.73 to 0.88 for Cluj-Napoca.
Keywords:
air quality
; integrated impact assessment
; risk assessment
; AERONET
; aerosols
1. Introduction
Air quality plays a vital role in both human and ecosystem health, with poor air quality causing numerous health problems and approximately 3.3 million deaths annually since 2000 [1,2,3,4,5]. This underscores the necessity for clear strategies and policies to address air pollution. Globally, countries have adopted legislative measures to reduce pollution and establish limits for key pollutants [6,7,8]. As an EU member state, Romania is also making efforts to improve air quality, including promoting sustainable clean energy technologies and implementing strategies such as the Green Deal, which aims to reduce greenhouse gas emissions to zero by 2050 [9].
Approximately 65% of urban areas worldwide have experienced an increase in PM2.5 concentrations since 2000 [1,2,3,4]. This pollutant, generated by specific sources, has a varied composition and different toxicological, physical, and chemical properties. Elemental carbon (EC) and organic carbon (OC) are key components of particulate matter with distinct sources and behaviours. Biomass burning is a major contributor to both, generally producing a higher proportion of organic carbon (OC), resulting in a low elemental carbon to organic carbon (EC/OC) ratio. Desert dust, primarily composed of minerals, can interact with anthropogenic emissions, incorporating EC and OC into complex aerosol mixtures. In such cases, the EC/OC ratio serves as a valuable indicator of source contribution and mixing processes, with implications for both air quality assessment and source apportionment [10,11,12]. These aerosol types (biomass burning, desert dust, and mixtures) are associated with a wide range of health effects due to their varying chemical composition, particle sizes, and toxicological properties, as summarized in Table 1. Biomass burning aerosols and mixtures are the most hazardous to health, as they contain toxic chemicals, polycyclic aromatic hydrocarbons and black carbon. These fine particles enter the bloodstream and deposit in organs, causing serious health effects. Although desert dust can affect health, especially in vulnerable people (children, the elderly, the chronically ill), it is considered less hazardous than aerosols from biomass burning, which are strongly linked to chronic diseases and mortality [13,14,15,16,17,18,19,20,21,22,23,24,25]. The sources of elemental carbon in Romania include both local (vehicular traffic) and long-range transport (Eastern European High and regional influences, as well as agricultural activities) [26,27,28,29].
Given these risks, accurately assessing the presence and distribution of PM2.5 is essential. A critical parameter for evaluating atmospheric aerosol loadings is Aerosol Optical Depth (AOD), which measures the attenuation of solar radiation due to scattering and absorption by particles suspended in the atmosphere. Although AOD does not directly represent surface-level PM2.5 concentrations, it serves as a valuable proxy when integrated with other datasets. The relationship between AOD and PM2.5 is complex and context-dependent, affected by local meteorology, aerosol type, and geographical factors. Nonetheless, several studies have demonstrated the utility of AOD for tracking pollution patterns and identifying aerosol sources, particularly when supported by the Ångström exponent (AE), precipitable water (PW), and atmospheric models like HYSPLIT [30,31,32,33,34,35].
The primary objective of this paper is to propose a new integrated approach for evaluating air quality and predicting the impact and risk of specific pollutants based on AOD analysis. The new approach was applied based on monitoring air quality data for two cities in Romania for 13 and 12 years, respectively (for the period 2011-2023 and 2012-2023). By integrating AOD into environmental impact and risk assessment, this research provides a novel toolset for monitoring pollution dynamics, identifying high-risk periods, and supporting policy making. The framework enhances traditional monitoring by enabling broader spatial analysis and improved forecasting capabilities. Furthermore, it emphasises the importance of aerosol classification and source apportionment in understanding local air quality trends, ultimately contributing to more informed and effective mitigation strategies.
2. Materials and Methods
2.1. Site Description
According to European regulations, Romania monitors air quality through 148 stations: 30 traffic-type (assessing the impact of traffic), 58 industrial-type (monitoring industrial activity), 37 urban and 13 suburban background (assessing the influence of settlement and human activity), 7 regional reference stations, and 3 EMEP stations (for monitoring cross-border pollution). To enhance aerosol property analysis, Romania also hosts 8 AERONET stations in Timisoara, Cluj-Napoca, Iasi, and Bucharest, which monitor local and long-range transported aerosol events. This study considers Iasi and Cluj-Napoca for integrated air quality assessment. Iasi (northeast Romania) faces major air pollution issues, with PM2.5 levels 2.3 times above the legal limit. In Cluj-Napoca (northwest), PM2.5 is also the main pollutant. In both cities, the primary sources of PM2.5 pollution include industrial activity, traffic, and residential heating. Iasi, with about 271,692 residents and 60,000 students, is a major cultural and academic centre. It has six air quality stations and one AERONET station (Iasi_LOASL) (Figure 1). Cluj-Napoca, known as ”the heart of Transylvania”, has about 286,598 inhabitants, five air quality stations, and one AERONET station at a university lab (Cluj_UBB) [36,37,38,39,40].
2.2. Experimental Data
The values used in this study come from the AERONET (Aerosol Robotic Network) database - a global aerosol monitoring system operated by NASA and partners (agencies, universities, institutions, researchers, etc.). Unlike models limited to ground-level or full-column data via remote sensing, this study focuses on optical aerosol parameters that indicate aerosol type, such as fine-mode particles (EC/OC mixtures) signalling biomass burning or soot; coated large particles that absorb solar radiation (black carbon, polluted dust); and mixtures like OC/dust, dust/EC, or dust-dominated aerosols [26,41,42,43,44].
Adapting the Integrated Impact and Risk Assessment method to aerosol-type characterisation via photometric data enables impact analysis on atmospheric components. AERONET data are categorized into three levels: unscreened (Level 1.0), cloud-screened (Level 1.5), and quality-assured cloud-screened (Level 2.0). Aerosol Optical Depth (AOD) - a key parameter - serves diverse applications in climate and weather modelling, visibility, aviation safety, and air quality due to its indication of total aerosol load [45,46,47,48]. Higher AOD values indicate a greater presence of aerosols, which negatively affects visibility and air quality [49,50]. AOD helps fill gaps where ground monitoring stations are lacking and correlates with PM2.5, a major health-impacting pollutant. Studies have shown that PM2.5 estimates improve when AOD is integrated into machine learning models [51,52,53].
For this study, AERONET photometric data from Iasi (LOASL: 47.19°N, 27.55°E) and Cluj-Napoca (UBB: 46.77°N, 23.55°E) stations were used. Both stations have improved understanding of local air quality by contributing aerosol optical property data and validating satellite-based observations [54,55,56].
We used inversion products from Level 1.5 data (version 3), selected using Level 2.0 criteria: solar zenith angle >50° and retrieval error <5% [57]. AOD at 400 nm was used to cover both polluted and unpolluted events. Level 1.5 was preferred due to its near-real-time availability – within one hour of measurement [58,59,60,61,62] – important for timely risk and impact assessment [63,64,65,66]. Note that Level 2.0 data require annual instrument calibration and verification.
2.3. Integrated Assessment Methodology
Integrated Impact and Risk Assessment is an approach for quantifying environmental impact. The first step consists of establishing the environmental components, which are given a degree of importance (values from 0 to 1), depending on the specifics of the assessed activity and the opinions of the environmental specialist. Based on matrix calculations, normalised scores and importance units (IU) are obtained, which are subsequently used in calculations. The next step is represented by environmental quality quantification (Q), as shown in Equation (1). Finally, considering the units of importance (IU) and environmental quality (Q), environmental impact quantification (EI) and risk quantification (ER) are completed using Equations (2) and (3) [63,64,65,66]. In this case, the method was adjusted, and the importance of the environmental component under assessment (AOD) was considered at its maximum value (1). Thus, the IU were 1000, while the probability of pollution occurrence (p) was also considered at its maximum value (1). It results that ER is similar to EI, having the same values.
Equation 1. Environmental quality quantification (Q)
Where:
Q is the environmental quality;
MAC is the maximum allowed concentration (in the absence of clear maximum allowed concentrations established by legislation for aerosols, it was necessary to adapt the integrated assessment method; in this case, we considered for the MAC the highest AOD value measured in our data set);
MC is the measured concentration.
Equation 2. Impact on environmental quality quantification (EI)
Where:
EIᵢ is the environmental impact considering the quality indicator i;
IU is the importance unit assigned to each environmental component;
Q is the quality of the environmental component considering the quality indicator i.
Equation 3. Environmental risk quantification (ER)
Where:
ERi is the environmental risk;
EIᵢ is the environmental impact considering the quality indicator i;
P is the probability of impact/pollution occurrence.
After quantifying the environmental impact and risk, their classification follows, depending on the scenario in which the obtained EI values fall, according to Table 2.
2.4. Rescaling Method
The scores resulting from the initial impact and risk assessment method exceeded the threshold of 700, which, according to the interpretation in Table 2, indicates a severely affected environment, unsuitable for life. However, the measured AOD values don’t reflect a critical or catastrophic risk. For this reason, it was deemed necessary to develop a rescaling method that would more accurately reflect the actual implications of different types of aerosols. The applied calculation formula is shown in Equation (4).
Equation 4. Rescaling formula
Where:
x is the value to be rescaled;
xmax, xmin are the limits of the original interval (EI calculated);
ymax, ymin are the limits of the new interval (we stopped at 700 because no measurements were made under catastrophic conditions);
y is the rescaled value.
Since the scientific literature demonstrates the distinct health and environmental effects of different aerosol categories, we performed a classification, selecting EC (elemental carbon) and DD (desert dust) for analysis and applying differentiated rescaling for these categories. While biomass burning – the main source of EC – is associated with severe diseases and increased mortality rates [13,14,15,16,17,18,19,20,21,22,23,24,25], DD aerosols tend to have less severe effects (Table 1). The environmental impacts of these two aerosol types also differ significantly. Although DD pollution poses certain risks, especially in arid regions, scientific studies consistently show that its environmental impact is substantially lower compared to that of EC from biomass burning. The latter releases complex toxic compounds and contributes more significantly to global warming, whereas DD increases suspended particle concentrations with more localized and less severe impacts [68,69,70,71,72,73]. Furthermore, considering that the intensity of health and environmental effects depends on the distance from the emission source, the negative impact of DD diminishes significantly as it travels farther from its origin and approaches the study areas considered here (Table 3) [13,14,15,16,17,18,19,20,21,22,23,24,25,68,69,70,71,72,73]. Since aerosol mixtures originate from both natural and anthropogenic sources, including this category in the risk score assessment complicates the linkage between emission sources and policy development. Based on these differences and the risk categories presented in Table 2, the EI (environmental impact) values for EC were rescaled between 0 and 700, while those for DD were rescaled between 0 and 350, thus reflecting the different magnitude of the impact on the environment and health. Rescaling was applied starting from 0, as scenarios without significant pollution were also included, allowing for rescaling from the minimum value.
Moreover, to validate the rescaling method, the standard assessment method was applied again, this time assigning differentiated scores to aerosol categories. EC was considered of utmost importance (assigning a score of 1 in impact assessment), while for the DD category, scores ranging from 0.1 to 1 were assigned progressively.
Furthermore, to validate both the proposed rescaling method and the risk-level-based scoring system, two standard statistical indicators were calculated: Root Mean Square Error (RMSE) and Mean Absolute Error (MAE), which are presented in the following section.
2.5. Validation With Statistical Indicators – Error Calculation: Root Mean Square Error (RMSE) and Mean Absolute Error (MAE)
The performance of the proposed rescaling method and the risk-level-based scoring system was evaluated using two widely recognized statistical indicators: Root Mean Square Error (RMSE) and Mean Absolute Error (MAE). These parameters allow quantifying the difference between the rescaled values and the values obtained from applying the integrated method for EC and DD, thereby providing an objective basis for evaluating the method’s performance. RMSE is sensitive to large deviations and penalizes them more heavily, making it useful for identifying score combinations that generate significant discrepancies – an essential aspect in establishing the most suitable pair of scores for EC and DD. At the same time, MAE indicates the average absolute deviation, offering a clear picture of the average error across the entire dataset. The use of both indicators allows for solid validation and a comprehensive understanding of the method: RMSE helps detect situations with large errors, while MAE provides a general benchmark of the method’s overall accuracy. Although there is no international standard for classifying RMSE and MAE values, applied literature in the fields of climate, energy, and air quality model evaluation frequently uses percentage thresholds to interpret performance. Based on this, we have structured a guideline table (Table 4) that classifies RMSE and MAE values according to their degree of agreement with the reference. In principle, the smaller the error, the more accurate the model [74,75,76,77,78,79,80].
3. Results and Discussion
3.1. Overview of Aerosol Type Distribution (Iasi and Cluj-Napoca)
3.1.1. Iasi AERONET Monitoring Site
For the city of Iasi, 1209 measurements were selected from the period 2012-2023, of which 975 correspond to the elemental carbon category, and 234 to the desert dust category. The aerosols measured by AERONET over Iasi for 12 years (2012 – 2023), in general, were dominated by the occurrence of an elemental carbon (EC) and organic carbon (OC) mixture at 55% (see “EC/OC mixture” in Figure 2). The fine mode particles, grouped as “EC dominated” in Figure 2, indicate that 18% of the aerosol came from combustion/biomass burning or soot particle types. The aerosol types: “Dust/EC mix” (1%), “Mix” (2%), “OC dominated” (3%), “OC/Dust Mix” (6%) and “Coated large particles” (11%) were not discussed here, since they were present in relatively small percentages compared to “EC/OC mixture” and “EC dominated”.
3.1.2. Cluj-Napoca AERONET Monitoring Site
For the city of Cluj-Napoca, 1380 measurements were selected from the period 2011-2023, of which 1222 correspond to the elemental carbon category, and 158 to the desert dust category. Also, the aerosols measured by AERONET over Cluj-Napoca for 13 years (2011 – 2023), in general, were dominated by the occurrence of an elemental carbon (EC) and organic carbon (OC) mixture at 46% (see “EC/OC mixture” in Figure 3). The “EC dominated” in Figure 3 indicates that 22% of the aerosol came from combustion/biomass burning or soot particle types. Similarly, the aerosol types: “Mix” (2%), “Dust/EC mix” (3%), “OC/Dust Mix” (8%), “Coated large particles” (8%) and “OC dominated” (10%), were not discussed here.
3.2. Performance Evaluation Using RMSE and MAE
To validate the rescaling method and identify the most appropriate pair of scores for EC and DD, we based our analysis on the error classification presented in Table 4.
The results showed that, for both cities, the lowest values of both error metrics (RMSE and MAE), located in the percentage range 0-5% (which means a very small error and an excellent performance, according to Table 4) were achieved with importance scores of 0.4 and 0.5 for DD and 1 for EC (Figure 4). Therefore, the error analysis confirms the validity of the selected rescaling thresholds and importance scores, demonstrating their effectiveness in accurately capturing the real differences between aerosol categories.
3.3. Environmental Impact Quantification Calculated Using AERONET Data
Figure 5, Figure 6, Figure 7 and Figure 8 show the rescaled EI, calculated using AOD values from the Iasi and Cluj-Napoca monitoring stations, considering only the ”dust-dominated” and ”EC-dominated” categories. The ”EC-dominated” category falls within the subset of fine particulate matter associated with pollution from anthropogenic sources, such as fossil fuel combustion, industrial emissions, and road traffic. The methodology employed to quantify the impact is described in Section 2 – Materials and Methods.
The categories "EC/OC mixture" and "OC dominated" are also specific to fine particles; however, in terms of health effects, elemental carbon (carbon black) is considered more toxic than organic carbon [29]. The "EC/OC mixture" combines natural and anthropogenic sources, making it complex to consider this category when calculating a risk score and correlating pollution sources with policymaking.
The distribution of the rescaled environmental impact values for the elemental carbon category (EC) in Iasi (Figure 5) shows a predominance in the minor to moderate risk range. More than half of the recorded values (53.3%) fall between 100 and 350, suggesting an acceptable level of impact that still requires monitoring. Only 0.2% of the values exceed the threshold of 500, indicating isolated episodes of severe pollution, likely attributed to meteorological conditions or intense anthropogenic sources. The AOD associated with these episodes ranges from 0.88 to 1.05, reflecting a significant aerosol load on the atmospheric column. Therefore, EC remains a major pollutant of concern for local public health and environmental strategies.
For the desert dust category (DD) in Iasi, the impact distribution is significantly more attenuated (Figure 6). The majority of rescaled values (65.4%) fall below the threshold of 100, reflecting minor or even negligible risks. This trend is consistent with the hypothesis that DD effects diminish significantly with increasing distance from the emissions source. Even during episodes with higher AOD, the rescaled impact rarely exceeds 300, supporting the validity of the differentiated impact assessment method. Thus, DD’s contribution to air quality degradation in Iasi appears to be marginal compared to that of EC.
For Cluj-Napoca, the impact distribution for the EC category (Figure 7) is similar to that observed in Iasi, with 55.9% of values falling between 100 and 350, indicating moderate but acceptable risks. As in Iasi, only 0.2% of the values exceed the threshold of 500, suggesting a low incidence of critical pollution events. The maximum recorded AOD value (0.88) is slightly lower than in Iasi, which may reflect either lower combustion source intensity or more efficient pollutant dispersion. These results confirm that EC remains a dominant factor in atmospheric impact within the urban environment.
For DD in Cluj-Napoca (Figure 8), the impact distribution follows the same pattern as in Iasi, with generally low values; however, the majority (58.9%) falls within the 100-350 range, characteristic of minor risks where monitoring actions are required. The AOD associated with this interval ranges from 0.24 to 0.67. This behaviour confirms the secondary role of DD in the pollution profile of Cluj-Napoca.
Because the traditional approach to air quality assessment does not correlate with ground data, this study's results underscore the urgent need to utilise an AOD risk index to effectively highlight the impact of pollution on the entire atmospheric column. Thus, in addition to the climate change already highlighted by scientists, the radiative budget (influenced by aerosol intrusion) can also negatively impact life quality and may be of interest.
4. Conclusions
This research demonstrated the applicability and relevance of an innovative integrated approach for air quality evaluation and the assessment of impact and risk related to atmospheric pollutants, using AOD (Aerosol Optical Depth) as a key indicator. The study was conducted for two representative Romanian cities – Iasi and Cluj-Napoca – using AERONET data collected over extended periods (12 and 13 years, respectively), ensuring the robustness of the findings.
The results revealed a predominance of elemental carbon (EC) and organic carbon (OC) mixtures in both cities, primarily sourced from traffic emissions, biomass burning, and industrial activities. Specifically, Cluj-Napoca exhibited an EC/OC mixture of 46%, while Iasi had 55%. The impacts and risks calculated as the AOD index for EC show a few major ones, with an AOD index range from 0.88 to 1.05 for Iasi city and 0.73-0.88 for Cluj-Napoca.
By adapting the Integrated Impact and Risk Assessment method to the specific context of aerosol characterization, the study offered a differentiated classification of aerosol types, emphasizing the higher risks associated with EC compared to desert dust. The proposed method was statistically validated using RMSE and MAE indicators, achieving excellent performance (<5%).
Therefore, this study offers an effective and replicable tool to support environmental authorities in monitoring, forecasting, and decision-making processes regarding air quality – especially in urban areas where PM2.5 pollution is persistent and often insufficiently quantified by ground-based monitoring networks.
Given the high performance of the proposed method, a future research direction involves its application at a more detailed temporal scale – enabling the analysis of aerosol pollution risks based on seasonality, specific days, or annual variations – as well as extending the study to other urban or rural regions to allow for comparative assessments and the development of regional pollution control strategies.
Author Contributions
For research articles with several authors, a short paragraph specifying their individual contributions must be provided. The following statements should be used “Conceptualization, X.X. and Y.Y.; methodology, X.X.; software, X.X.; validation, X.X., Y.Y. and Z.Z.; formal analysis, X.X.; investigation, X.X.; resources, X.X.; data curation, X.X.; writing—original draft preparation, X.X.; writing—review and editing, X.X.; visualization, X.X.; supervision, X.X.; project administration, X.X.; funding acquisition, Y.Y. All authors have read and agreed to the published version of the manuscript.” Please turn to the CRediT taxonomy for the term explanation. Authorship must be limited to those who have contributed substantially to the work reported.
Funding
This research paper was supported by the Boosting Ingenium for Excellence (BI4E) project, funded by the European Union's HORIZON-WIDERA-2021-ACCESS-05-01-European Excellence Initiative under the Grant Agreement No. 101071321  .
.
.Data Availability Statement
The dataset regarding AOD for Iasi_LOASL and CLUJ_UBB AERONET stations is available at https://aeronet.gsfc.nasa.gov/new_web/webtool_inv_v3.html
Acknowledgments
The authors would like to thank the PI(s) (Nicolae Ajtai, Dan Costin and Silviu Gurlui) and Co-I(s) for their efort in establishing and maintaining CLUJ_UBB (Cluj-Napoca - part of ACTRIS-RO) and Iasi_LOASL (Iasi) AERONET sites.
Conflicts of Interest
The authors declare no conflicts of interest. The funders had no role in the design of the study; in the collection, analyses, or interpretation of data; in the writing of the manuscript; or in the decision to publish the results.
Abbreviations
The following abbreviations are used in this manuscript:
| AOD | Aerosol Optical Depth |
| EC | Elemental carbon |
| OC | Organic carbon |
| DD | Desert dust |
| RMSE | Root mean square error |
| MAE | Mean absolute error |
| AERONET | Aerosol Robotic Network |
References
- Sicard, P.; Agathokleous, E.; Anenberg, S. C.; Marco, A. D.; Paoletti, E.; Calatayud, V. Trends in urban air pollution over the last two decades: A global perspective. Science of The Total Environment 2023, 858 part 2. [CrossRef]
- Raaschou-Nielsen, O.; Antonsen, S.; Agerbo, E.; Hvidtfeldt, U. A.; Geels, C.; Frohn, L. M.; Christensen, J. H.; Sigsgaard, T.; Brandt, J.; Pedersen, C. B. PM2.5 air pollution components and mortality in Denmark. Environment International 2023, 171. [CrossRef]
- Wang, J.; Wan, Y.; Cheng, L.; Xia, W.; Li, Y.; Xu, S. Arsenic in outdoor air particulate matter in China: Tiered study and implications for human exposure potential. Atmospheric Pollution Research 2020, 11(4). [CrossRef]
- Chifflet, S.; Guyomarc’h, L.; Dominutti, P.; Heimbürger-Boavida, L. E.; Angeletti, B.; Louvat, P.; Jaffrezo, J. L.; Vu, C. T.; Uzu, G.; Mari, X. Seasonal variations of metals and metalloids in atmospheric particulate matter (PM2.5) in the urban megacity Hanoi. Atmospheric Pollution Research 2024, 15(1). [CrossRef]
- Bartholy, J.; Pongrácz, R. A brief review of health-related issues occurring in urban areas related to global warming of 1.5°C. Current Opinion in Environmental Sustainability 2018, 30, 123-132. [CrossRef]
- Wang, P. China's air pollution policies: Progress and challenges. Current Opinion in Environmental Science&Health 2021 19. [CrossRef]
- He, C.; Jiang, K.; Chen, S.; Jiang, W.; Liu, J. Zero CO2 emissions for an ultra-large city by 2050: case study for Beijing. Current Opinion in Environmental Sustainability 2019, 36, 141-155. [CrossRef]
- Naser, H. A. Technology for environmental management in Small Island Developing States: the case of Bahrain. Current Opinion in Environmental Sustainability 2022, 59. [CrossRef]
- Simionescu, M.; Neagu, O.; Gavurova, B. The role of quality of Governance in reducing pollution in Romania: an ARDL and nonparametric bayesian approach. Frontiers in Environmental Science 2022, 10. [CrossRef]
- Sopčić, S.; Godec, R.; Jakovljević, I.; Bešlić, I. The influence of biomass burning on the organic content of urban aerosols. Biomass 2025. [CrossRef]
- Wang, W.; Zhou, H.; Lyu, R.; Shao, L.; Li, W.; Xing, J.; Zhao, Z.; Li, X.; Zhou, X.; Zhang, D. Organic carbon and elemental carbon in two dust plumes at a coastal city in North China. Aerosol and air quality research 2024. [CrossRef]
- Hou, D.; Zhang, X.; Zhao, J.; Qiang, J.; Wang, J.; Wang, P.; An, Q.; Wang, Y.; Wang, L.; Yuan, S.; Zhang, F. Source apportionment of elemental carbon in different seasons in Hebei, China. Frontiers in environmental science 2022. [CrossRef]
- Filonchyk, M.; Peterson, M. P.; Zhang, L.; Yan, H. An analysis of air pollution associated with the 2023 sand and dust storms over China: Aerosol properties and PM10 variability. Geoscience Frontiers 2024. [CrossRef]
- Georgakopoulou, V. E.; Taskou, C.; Diamanti, A.; Beka, D.; Papalexis, P.; Trakas, N.; Spandidos, D. A. Saharan dust and respiratory health: Understanding the link between airborne particulate matter and chronic lung diseases (Review). Experimental and Therapeutic Medicine 2024. [CrossRef]
- Sadeghimoghaddam, A.; Khankeh, H.; Norozi, M.; Fateh, S.; Farrokhi, M. Investigating the effects of dust storms on morbidity and mortality due to cardiovascular and respiratory diseases: A systematic review. Journal of Education and Health Promotion 2021. [CrossRef]
- Pardo, M.; Li, C.; He, Q.; Levin-Zaidman, S.; Tsoory, M.; Yu, Q.; Wang, X.; Rudich, Y. Mechanisms of lung toxicity induced by biomass burning aerosols. Particle and Fibre Toxicology 2020. [CrossRef]
- Sigsgaard, T.; Forsberg, B.; Annesi-Maesano, I.; Blomberg, A.; Bølling, A.; Boman, C.; Bønløkke, J.; Brauer, M.; Bruce, N.; Héroux, M. E.; Hirvonen, M. R.; Kelly, F.; Künzli, N.; Lundbäck, B.; Moshammer, H.; Noonan, C.; Pagels, J.; Sallsten, G.; Sculier, J. P.; Brunekreef, B. Health impacts of anthropogenic biomass burning in the developed world. European Respiratory Journal 2015. [CrossRef]
- Assad, N. A.; Kapoor, V.; Sood, A. Biomass smoke exposure and chronic lung disease. Current Opinion in Pulmonary Medicine 2016. 10.1097/MCP.0000000000000246.
- Amnuaylojaroen, T.; Parasin, N. Perspective on Particulate Matter: from biomass burning to the health crisis in Mainland Southeast Asia. Toxics 2023. [CrossRef]
- Sangkham, S.; Phairuang, W.; Sherchan, S. P.; Pansakun, N.; Munkong, N.; Sarndhong, K.; Islam, M. A.; Sakunkoo, P. An update on adverse health effects from exposure to PM2.5. Environmental Advances 2024. [CrossRef]
- FERN. Available online: https://www.fern.org/fileadmin/uploads/fern/Documents/briefingnote%20burning%20biomass.pdf (2025).
- Yin, S. Effect of biomass burning on premature mortality associated with long-term exposure to PM2.5 in Equatorial Asia. Journal of Environmental Management 2023. [CrossRef]
- Water and Air Quality Bureau, Health Canada. Available online: https://www.canada.ca/en/health-canada/services/publications/healthy-living/human-health-effects-wildfire-smoke.html (2025).
- Karanasiou, A.; Alastuey, A.; Amato, F.; Renzi, M.; Stafoggia, M.; Tobias, A.; Reche, C.; Forastiere, F.; Gumy, S.; Mudu, P.; Querol, X. Short-term health effects from outdoor exposure to biomass burning emissions: A review. Science of The Total Environment 2021. [CrossRef]
- Habybabady, R. H.; Sis, H. N.; Paridokht, F.; Ramrudinasab, F.; Behmadi, A.; Khosravi, B.; Mohammadi, M. Effects of dust exposure on the respiratory health symptoms and pulmonary functions of street sweepers. The Malaysian Journal of Medical Science 2018. [CrossRef]
- Bostan, D. C.; Miclaus, I. M.; Apetroaie, C.; Voiculescu, M.; Timofte, A.; Cazacu, M. M. Long-Range Transport Analysis Based on Eastern Atmospheric Circulation and Its Impact on the Dust Event over Moldavia, Romania in August 2022. Atmosphere 2023. [CrossRef]
- Marmureanu, L.; Vasilescu, J.; Slowik, J.; Prévôt, A. S. H.; Marin, C. A.; Antonescu, B.; Vlachou, A.; Nemuc, A.; Dandocsi, A.; Szidat, S. Online Chemical Characterization and Source Identification of Summer and Winter Aerosols in Magurele, Romania. Atmosphere 2020, 11. [CrossRef]
- Liu, F.; Peng, L.; Dai, S.; Bi, X.; Shi, M. Size-Segregated Characteristics of Organic Carbon (OC) and Elemental Carbon (EC) in Marine Aerosol in the Northeastern South China Sea. Atmosphere 2023, 14. [CrossRef]
- Hussein, T.; Li, X.; Bakri, Z.; Alastuey, A.; Arar, S.; Al-Hunaiti, A.; Viana, M.; Petäjä, T. Organic and Elemental Carbon in the Urban Background in an Eastern Mediterranean City. Atmosphere 2022, 13. [CrossRef]
- Xu, D.; Lin, W.; Gao, J.; Jiang, Y.; Li, L.; Gao, F. PM2.5 Exposure and Health Risk Assessment Using Remote Sensing Data and GIS. International Journal of Environmental Research and Public Health 2022, 19. [CrossRef]
- Matandirotya, N. R.; Anoruo, C. M. An assessment of aerosol optical depth over three AERONET sites in South Africa during the year 2020. Scientific African 2023, 19. [CrossRef]
- Tariq, S.; Qayyum, F.; Ul-Haq, Z.; Mehmood, U. Remote sensing of nighttime air quality over the megacity of Lahore, Pakistan. Urban Climate 2023, 49. [CrossRef]
- Said, S.; Salah, Z.; Abdel Wahab, M. M.; Alfaro, S. C. Retrieving PM10 Surface Concentration from AERONET Aerosol Optical Depth: The Cairo and Delhi Megacities Case Studies. Journal of the Indian Society of Remote Sensing 2023, 51, 1797-1807. [CrossRef]
- Nguyen, T. T. N.; Pham, H. V.; Lasko, K.; Bui, M. T.; Laffly, D.; Jourdan, A.; Bui, H. Q. Spatiotemporal analysis of ground and satellite-based aerosol for air quality assessment in the Southeast Asia region. Environmental Pollution 2019, part 1. [CrossRef]
- Verma, J.; Singh, P. Air pollution induced biochemical changes in the selected roadside ornamental tree in Ludhiana city, India. Environmental Engineering and Management Journal 2025. http://doi.org/10.30638/eemj.2025.018.
- Tanasa, I.; Cazacu, M.; Sluser, B. Air Quality Integrated Assessment: Environmental Impacts, Risks and Human Health Hazards. Applied Sciences 2023, 13(2). [CrossRef]
- AERONET. Available online: https://aeronet.gsfc.nasa.gov/ (2025).
- Stefanie, H. I.; Radovici, A.; Mereuta, A.; Arghius, V.; Camarasan, H.; Costin, D.; Botezan, C.; Ginsca, C.; Ajtai, N. Variation of Aerosol Optical Properties over Cluj-Napoca, Romania, Based on 10 Years of AERONET Data and MODIS MAIAC AOD Product. Remote Sensing 2023, 15(12). [CrossRef]
- IQAir. Available online: https://www.iqair.com (2024).
- Civitas. Available online: https://civitas.eu/cities/iasi (2024).
- Ajtai, N.; Stefanie, H.; Ozunu, A. Description of aerosol properties over Cluj-Napoca derived from AERONET sun photometric data. Environmental Engineering and Management Journal 2013, 12, 227-232. [CrossRef]
- Sfica, L.; Iordache, L.; Ichim, P.; Leahu, A.; Cazacu, M. M.; Gurlui, S.; Trif, C. T. The influence of weather conditions and local climate on particulate matter (PM10) concentration in metropolitan area of Iasi, Romania. Present Environment and Sustainable Development 2018, 11, 109-117. [CrossRef]
- Tîmpu, S.; Sfica, L.; Dobri, R. V.; Cazacu, M. M.; Nita, A. I.; Birsan, M. V. Tropospheric Dust and Associated Atmospheric Circulations over the Mediterranean Region with Focus on Romania’s Territory. Atmosphere 2020, 11, 349. [CrossRef]
- Nemuc, A.; Belegante, L.; Radulescu, R. One year of sunphotometer measurements in Romania. Romanian Journal of Physics 2011, 56, 550-562.
- Laszlo, I.; Liu, H. EPS Aerosol Optical Depth (AOD) Algorithm Theoretical Basis Document, NOAA NESDIS Center for Satellite Appllications and Research, 2020.
- Daxini, R.; Wu, Y. Review of methods to account for the solar spectral influence on photovoltaic device performance. Energy 1 2024. [CrossRef]
- Jin, J.; Henzing, B.; Segers, A. How aerosol size matters in aerosol optical depth (AOD) assimilation and the optimization using the Ångström exponent. Atmospheric Chemistry and Physics 2023. [CrossRef]
- Xun, L.; Lu, H.; Qian, C.; Zhang, Y.; Lyu, S.; Li, X. Analysis of Aerosol Optical Depth from Sun Photometer at Shouxian, China. Atmosphere 2021. [CrossRef]
- Earth Observatory, Aerosol Optical Depth. Available online: https://earthobservatory.nasa.gov/global-maps/MODAL2_M_AER_OD (2024).
- Huang, F.; Ma, W.; Wang, S.; Feng, C.; Kong, X.; Liu, H. Analysis and Validation of the Aerosol Optical Depth of MODIS Products in Gansu Province, Northwest China. Remote Sensing 2023. [CrossRef]
- Tian, Z.; Wei, J.; Li, Z. How Important Is Satellite-Retrieved Aerosol Optical Depth in Deriving Surface PM2.5 Using Machine Learning?. Remote Sensing 2023. [CrossRef]
- Singh, D.; Nanda, C. Aerosol Optical Depth (AOD) Variation Over Haryana Due to Lockdown Amid Covid-19 as an Indicator of Air Quality. IEEE India Geoscience and Remote Sensing Symposium (InGARSS) 2020, 170-172, Ahmedabad, India. [CrossRef]
- Talib, N.; Sa’aidi, N. A. M.; Narashid, R. H.; Zaki, N. A. M.; Saad, N. M.; Abdullah, S.; Mohd, F. A. Relationship between Particulate Matter (PM2.5) Concentration and Aerosol Optical Depth (AOD) throughout Peninsular Malaysia. IOP Conference Series: Earth and Environmental Science 2022. [CrossRef]
- Cazacu, M; Timofte, A.; Unga, F.; Albina, B.; Gurlui, S. AERONET data investigation of the aerosol mixtures over Iasi area, One-year time scale overview. Journal of Quantitative Spectroscopy and Radiative Transfer 2015. [CrossRef]
- Ajtai, N.; Mereuta, A.; Stefanie, H.; Radovici, A.; Botezan, C.; Zawadzka-Manko, O.; Stachlewska, I. S.; Stebel, K.; Zehner, C. SEVIRI Aerosol Optical Depth Validation Using AERONET and Intercomparison with MODIS in Central and Eastern Europe. Remote Sensing 2021. [CrossRef]
- Callewaert, S.; Vandenbussche, S.; Kumps, N.; Kylling, A.; Shang, X.; Komppula, M.; Goloub, P.; Maziere, M. D. The Mineral Aerosol Profiling from Infrared Radiances (MAPIR) algorithm: version 4.1 description and evaluation. Atmospheric Measurement Techniques 2019. [CrossRef]
- Holben, B. N.; Eck, T. F.; Slutsker, I.; Smirnov, A.; Sinyuk, A.; Schafer, J.; Giles, D.; Dubovik, O. AERONET’s Version 2.0 quality assurance criteria. Available online: http://aeronet.gsfc.nasa.gov/new_web/Documents/AERONETcriteria_final1.pdf.
- Zheng, C. Chapter 9 -Assessment Methods for Air Pollution Exposure, Spatiotemporal Analysis of Air Pollution and Its Application in Public Health, 2020, 197-206. [CrossRef]
- Cazorla, A.; Bahadur, R.; Suski, K. J.; Cahill, J. F.; Chand, D.; Schmid, B.; Ramanathan, V.; Prather, K. A. Relating aerosol absorption due to soot, organic carbon, and dust to emission sources determined from in-situ chemical measurements. Atmospheric Chemistry and Physics 2013, 13, 9337-9350. [CrossRef]
- Dubovik, O.; Holben, B.; Eck, T. F.; Smirnov, A.; Kaufman, Y. J.; King, M. D.; Tanré, D.; Slutsker, I. Variability of Absorption and Optical Properties of Key Aerosol Types Observed in Worldwide Locations. Journal of the Atmospheric Sciences 2002, 59, 590-608. [CrossRef]
- Giles, D. M.; Sinyuk, A.; Sorokin, M. G.; Schafer, J. S.; Smirnov, A.; Slutsker, I.; Eck, T. F.; Holben, B. N.; Lewis, J. R.; Campbell, J. R. et al. Advancements in the Aerosol Robotic Network (AERONET) Version 3 database—Automated near-real-time quality control algorithm with improved cloud screening for Sun photometer aerosol optical depth (AOD) measurements. Atmospheric Measurement Techniques 2019, 12, 169-209. [CrossRef]
- Russell, P. B.; Bergstrom, R. W.; Shinozuka, Y.; Clarke, A. D.; DeCarlo, P. F.; Jimenez, J. L.; Livingston, J. M.; Redemann, J.; Holben, B; Dubovik, O. et al. Absorption Angstrom Exponent in AERONET and related data as an indicator of aerosol composition. Atmospheric Chemistry and Physics 2010, 10, 1155-1169. [CrossRef]
- Sluser, B.; Plavan, O.; Teodosiu, C. Environmental Impact and Risk Assessment. In Assessing Progress Towards Sustainability, Elsevier Ed., 2022.
- Neamtu, R.; Sluser, B.; Plavan, O.; Teodosiu, C. Environmental monitoring and impact assessment of Prut River cross-border pollution. Environmental Monitoring and Assessment, 2021, 193.
- Zait, R.; Fighir, D.; Sluser, B.; Plavan, O.; Teodosiu, C. Priority Pollutants Effects on Aquatic Ecosystems Evaluated through Ecotoxicity, Impact, and Risk Assessments. Water 2022, 14(20):3237. [CrossRef]
- Zait, R.; Sluser, B.; Fighir, D.; Plavan, O.; Teodosiu, C. Priority Pollutants Monitoring and Water Quality Assessment in the Siret River Basin, Romania. Water, 2022, 14(1):129. [CrossRef]
- Niculae, A.L.; Racovitza, A.; Chiriac, R. Study of the influence of nanoparticle addition in diesel-ethanol blend on fuel jet characteristics. Environmental Engineering and Management Journal 2024, 23(7): 1383-1389.
- Ealo, M.; Alastuey, A.; Ripoll, A.; Pérez, N.; Minguillón, M. C.; Querol, X.; Pandolfi, M. Detection of Saharan dust and biomass burning events using near-real-time intensive aerosol optical properties in the north-western Mediterranean. Atmospheric Chemistry and Physics 2016. [CrossRef]
- Bauer, S. E.; Im, U.; Mezuman, K.; Gao, C. Y. Desert dust, industrialization, and agricultural fires: health impacts of outdoor air pollution in Africa. Journal of Geophysical Research: Atmospheres 2019. [CrossRef]
- Zhou, D.; Ding, K.; Huang, X.; Liu, L.; Liu, Q.; Xu, Z.; Jiang, F.; Fu, C.; Ding, A. Transport, mixing and feedback of dust, biomass burning and anthropogenic pollutants in eastern Asia: a case study. Atmospheric Chemistry and Physics 2018. [CrossRef]
- Dong, X.; Fu, J. S.; Huang, K.; Zhu, Q.; Tipton, M. Regional climate effects of biomass burning and dust in East Asia: Evidence from modeling and observation. Geophysical Research Letters 2019. [CrossRef]
- Gama, C.; Pio, C.; Monteiro, A.; Russo, M.; Fernandes, A. P.; Borrego, C.; Baldasano, J. M.; Tchepel, O. Comparison of methodologies for assessing desert dust contribution to regional PM10 and PM2.5 levels: a one-year study over Portugal. Atmosphere 2020. [CrossRef]
- Chen, J.; Li, C.; Ristovski, Z.; Milic, A.; Gu, Y.; Islam, M. S.; Wang, S.; Hao, J.; Zhang, H.; He, C.; Guo, H.; Fu, H.; Miljevic, B.; Morawska, L; Thai, P.; LAM, Y. F.; Pereira, G.; Ding, A.; Huang, X.; Dumka, U. C. A review of biomass burning: Emissions and impacts on air quality, health and climate in China. Science of The Total Environment 2017. [CrossRef]
- Chai, T.; Draxler, R. R. Root mean square error (RMSE) or mean absolute error (MAE)? - Arguments against avoiding RMSE in the literature. Geoscientific Model Development 2014. [CrossRef]
- Hodson, T. O. Root-mean-square error (RMSE) or mean absolute error (MAE): when to use them or not. Geoscientific Model Development 2022. [CrossRef]
- ASHRAE. ASHRAE Guideline 14-2002: Measurement of Energy and Demand Savings. American Society of Heating, Refrigerating and Air-Conditioning Engineers. Available online: https://www.ashrae.org/technical-resources/bookstore/guideline-14-2002 (2025).
- Efficiency Valuation Organization (EVO), 2017. International Performance Measurement and Verification Protocol: Concepts and options for determining energy and water savings – Volume I (IPMVP). Available online: https://evo-world.org/en/products-services-mainmenu-en/protocols/ipmvp.
- Coakley, D.; Raftery, P.; Keane, M. A review of methods to match building energy simulation models to measured data. Renewable and Sustainable Energy Reviews 2014. [CrossRef]
- Willmott, C. J.; Matsuura, K. Advantages of the mean absolute error (MAE) over the root mean square error (RMSE) in assessing average model performance. Climate Research 2005. [CrossRef]
- Hyndman, R. J.; Koehler, A. B. Another look at measures of forecast accuracy. International Journal of Forecasting 2006. [CrossRef]
Figure 1.
Iasi city and Cluj-Napoca city air quality monitoring network.
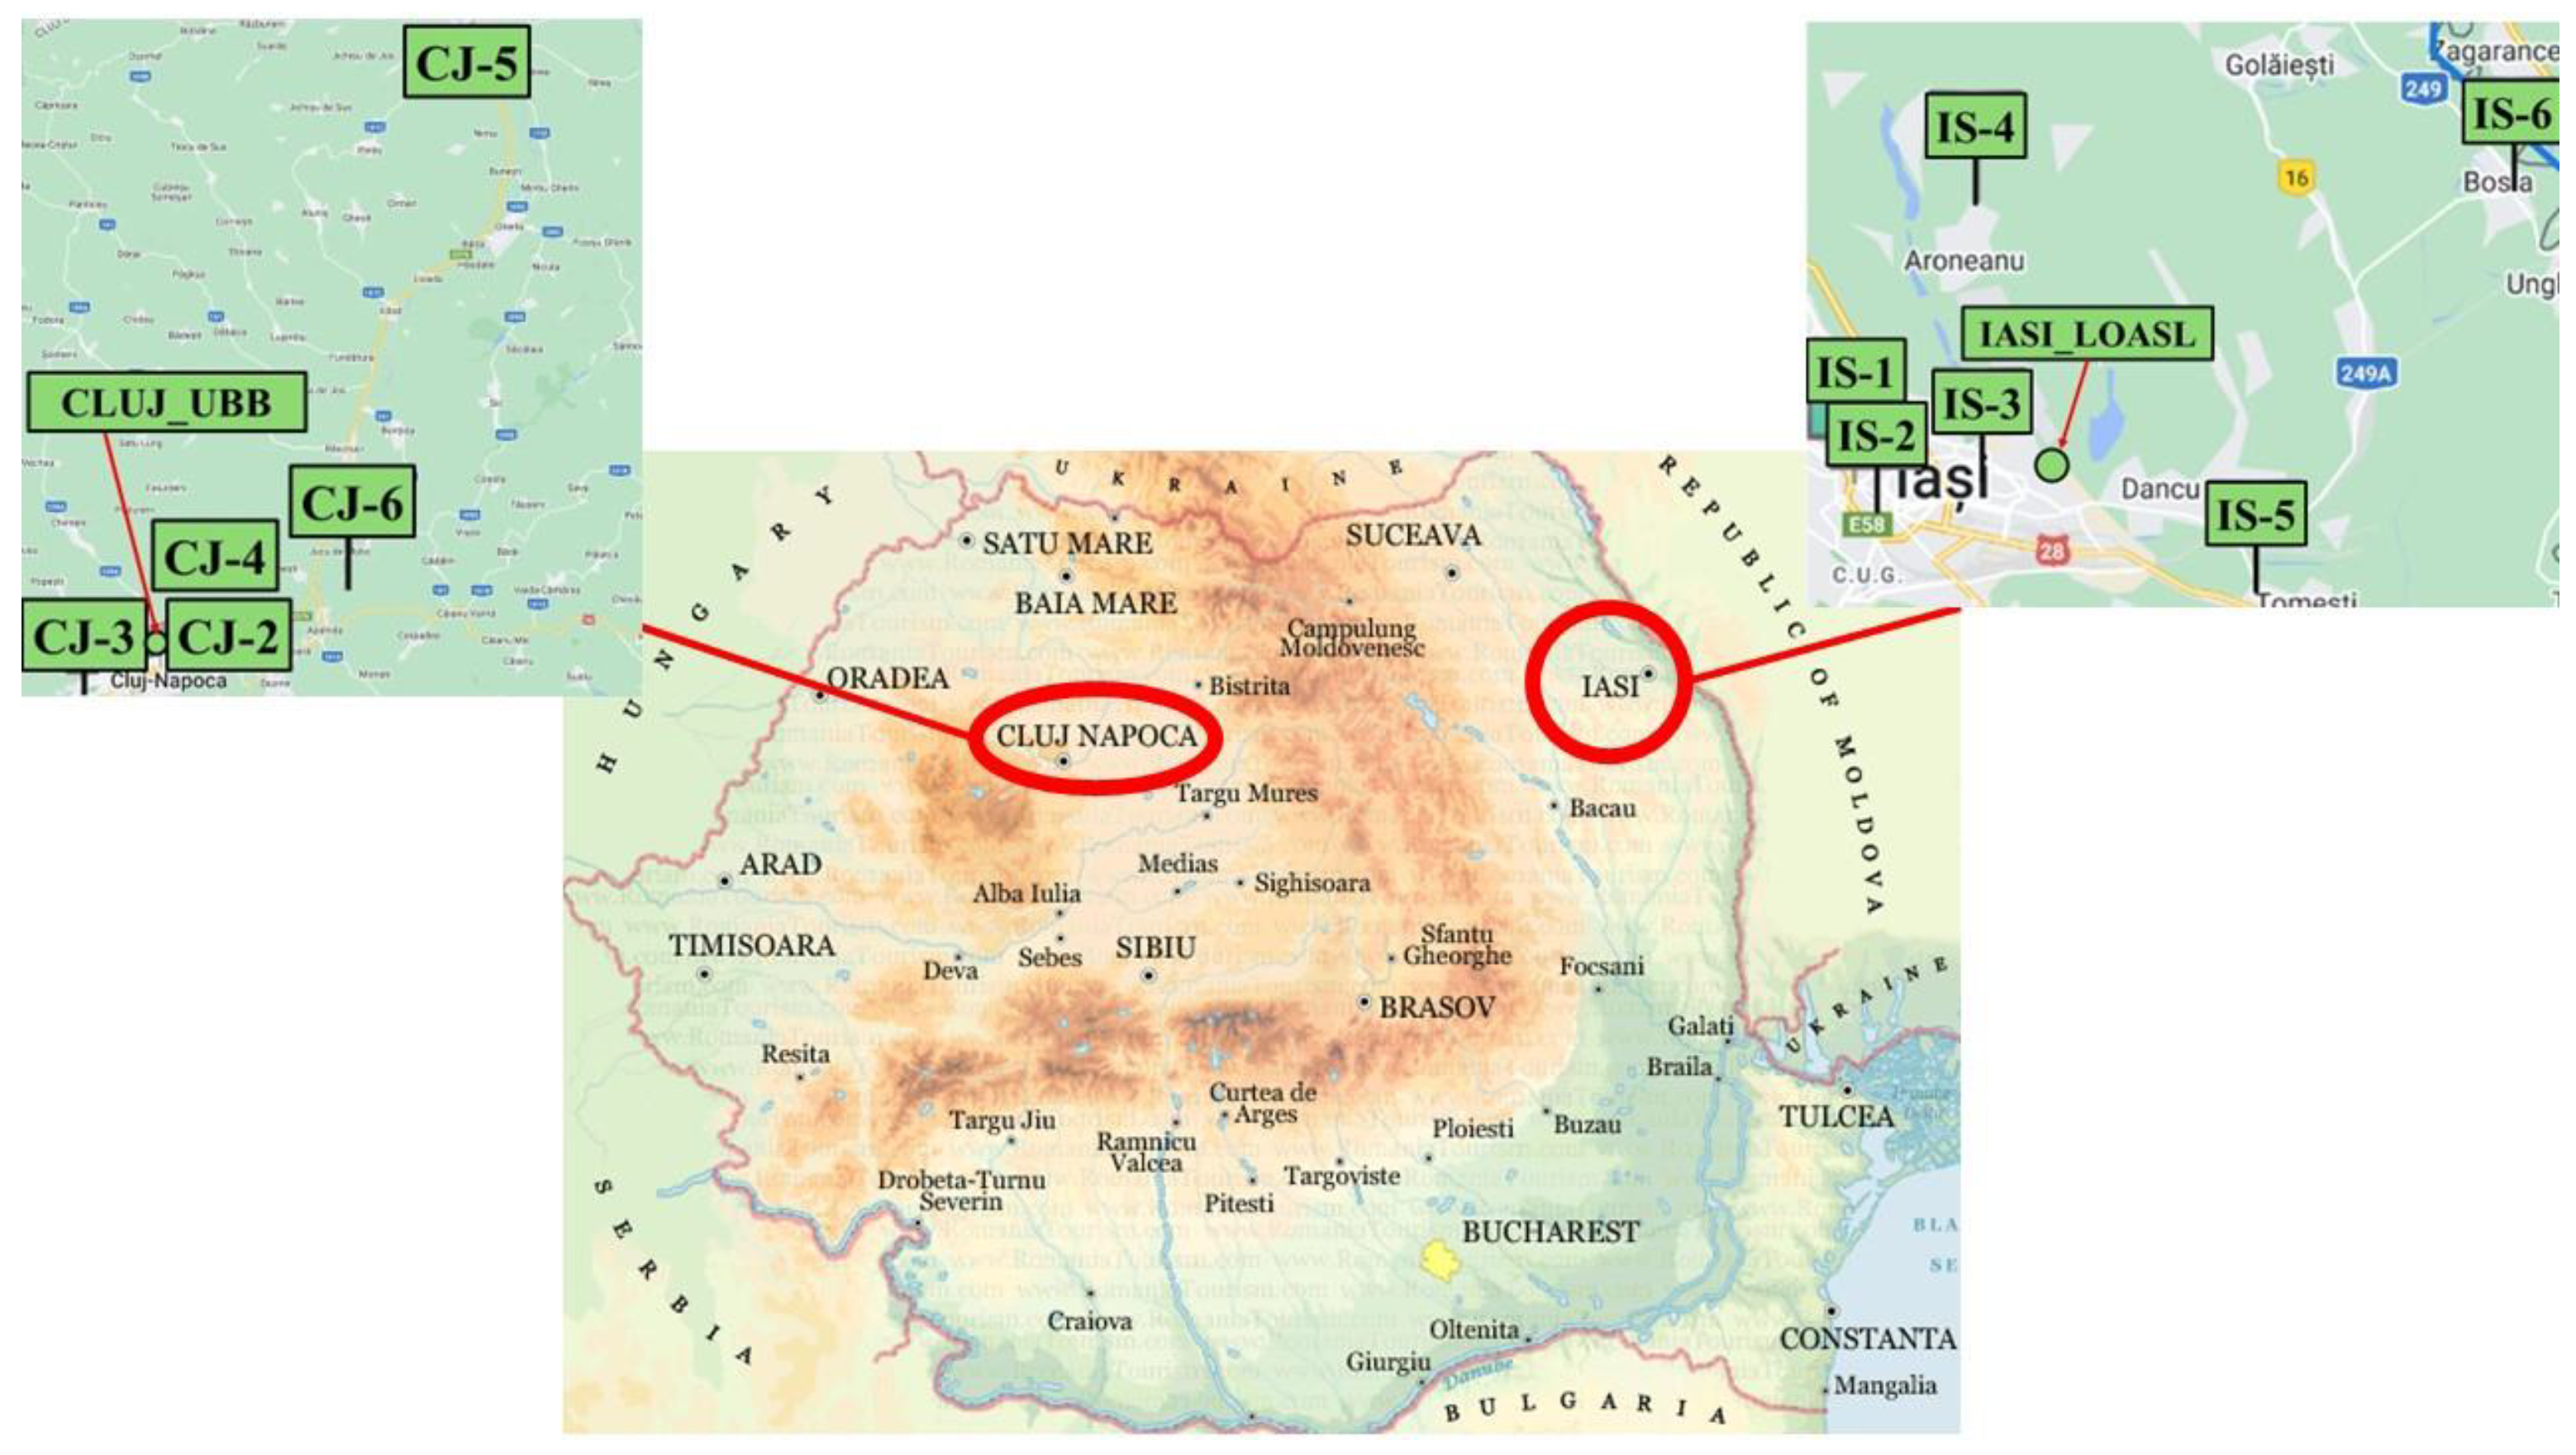
Figure 2.
Absorption Ångström Exponent [AAE at 440-675 nm] vs. Scattering Ångström Exponent [SAE at 440-675 nm] in the number density plot from Iasi monitoring site (2012 - 2023).
Figure 2.
Absorption Ångström Exponent [AAE at 440-675 nm] vs. Scattering Ångström Exponent [SAE at 440-675 nm] in the number density plot from Iasi monitoring site (2012 - 2023).
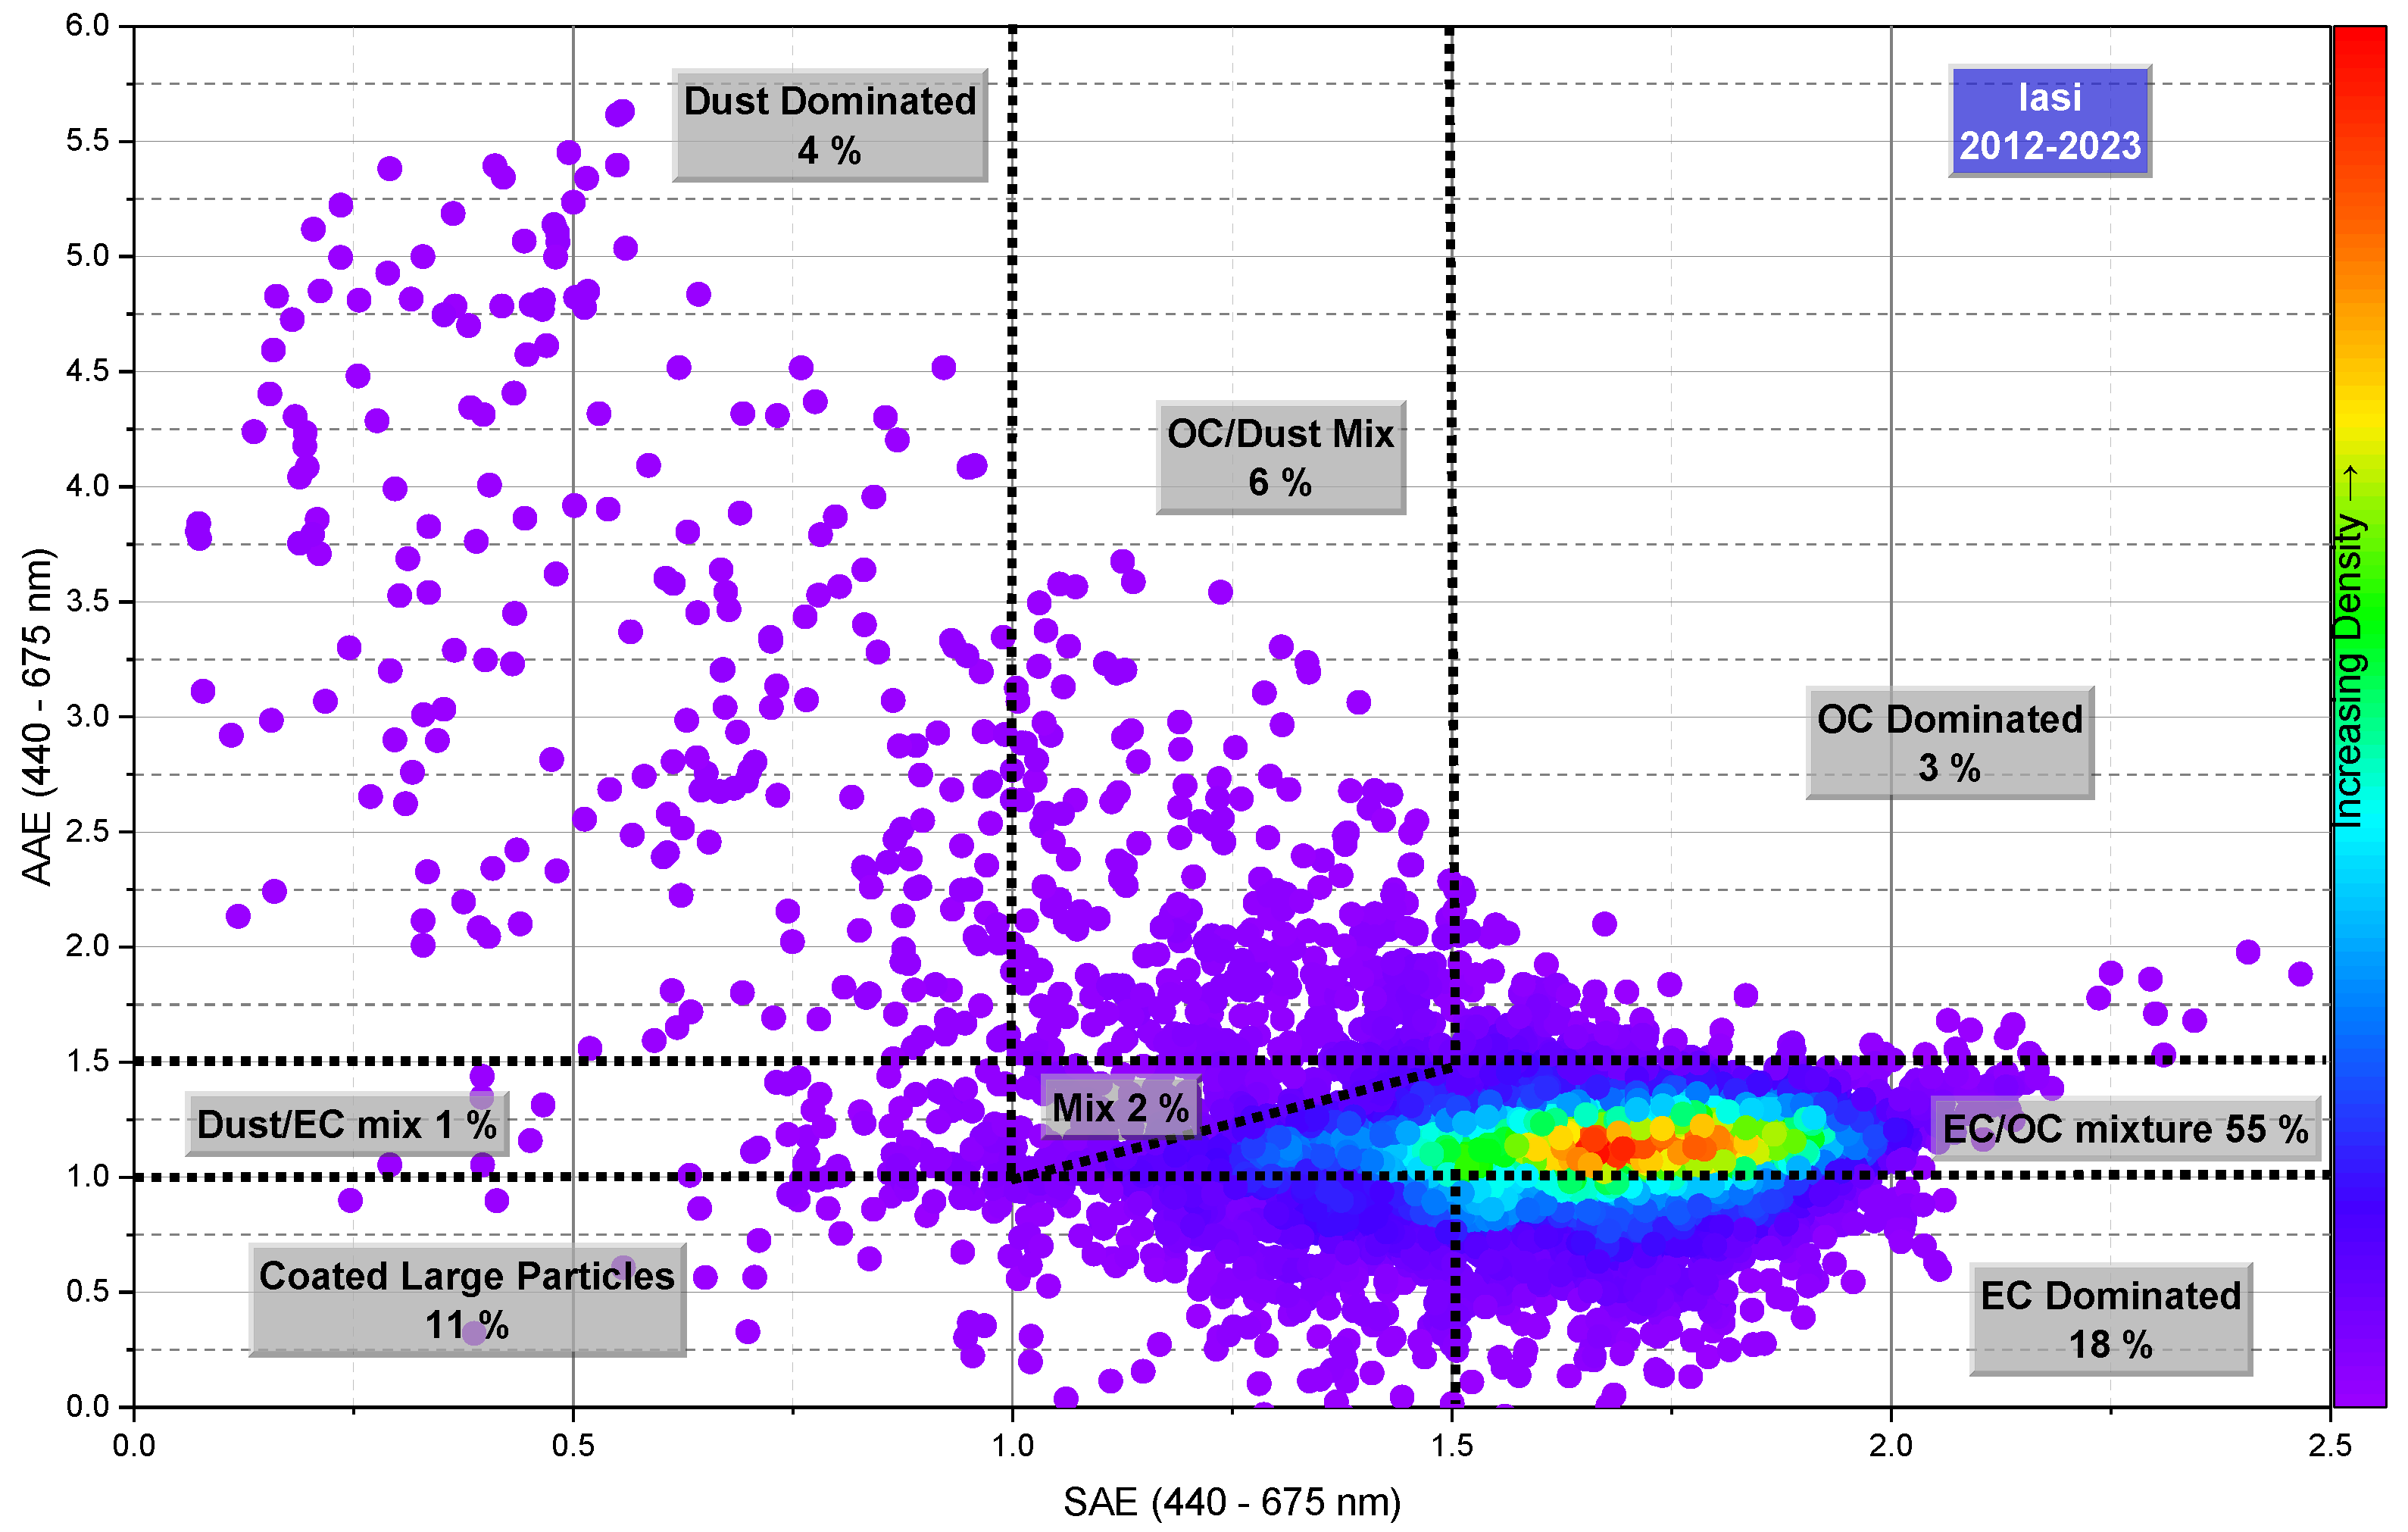
Figure 3.
Absorption Ångström Exponent [AAE at 440-675 nm] vs. Scattering Ångström Exponent [SAE at 440-675 nm] in the number density plot from Cluj-Napoca monitoring site (2011 - 2023).
Figure 3.
Absorption Ångström Exponent [AAE at 440-675 nm] vs. Scattering Ångström Exponent [SAE at 440-675 nm] in the number density plot from Cluj-Napoca monitoring site (2011 - 2023).
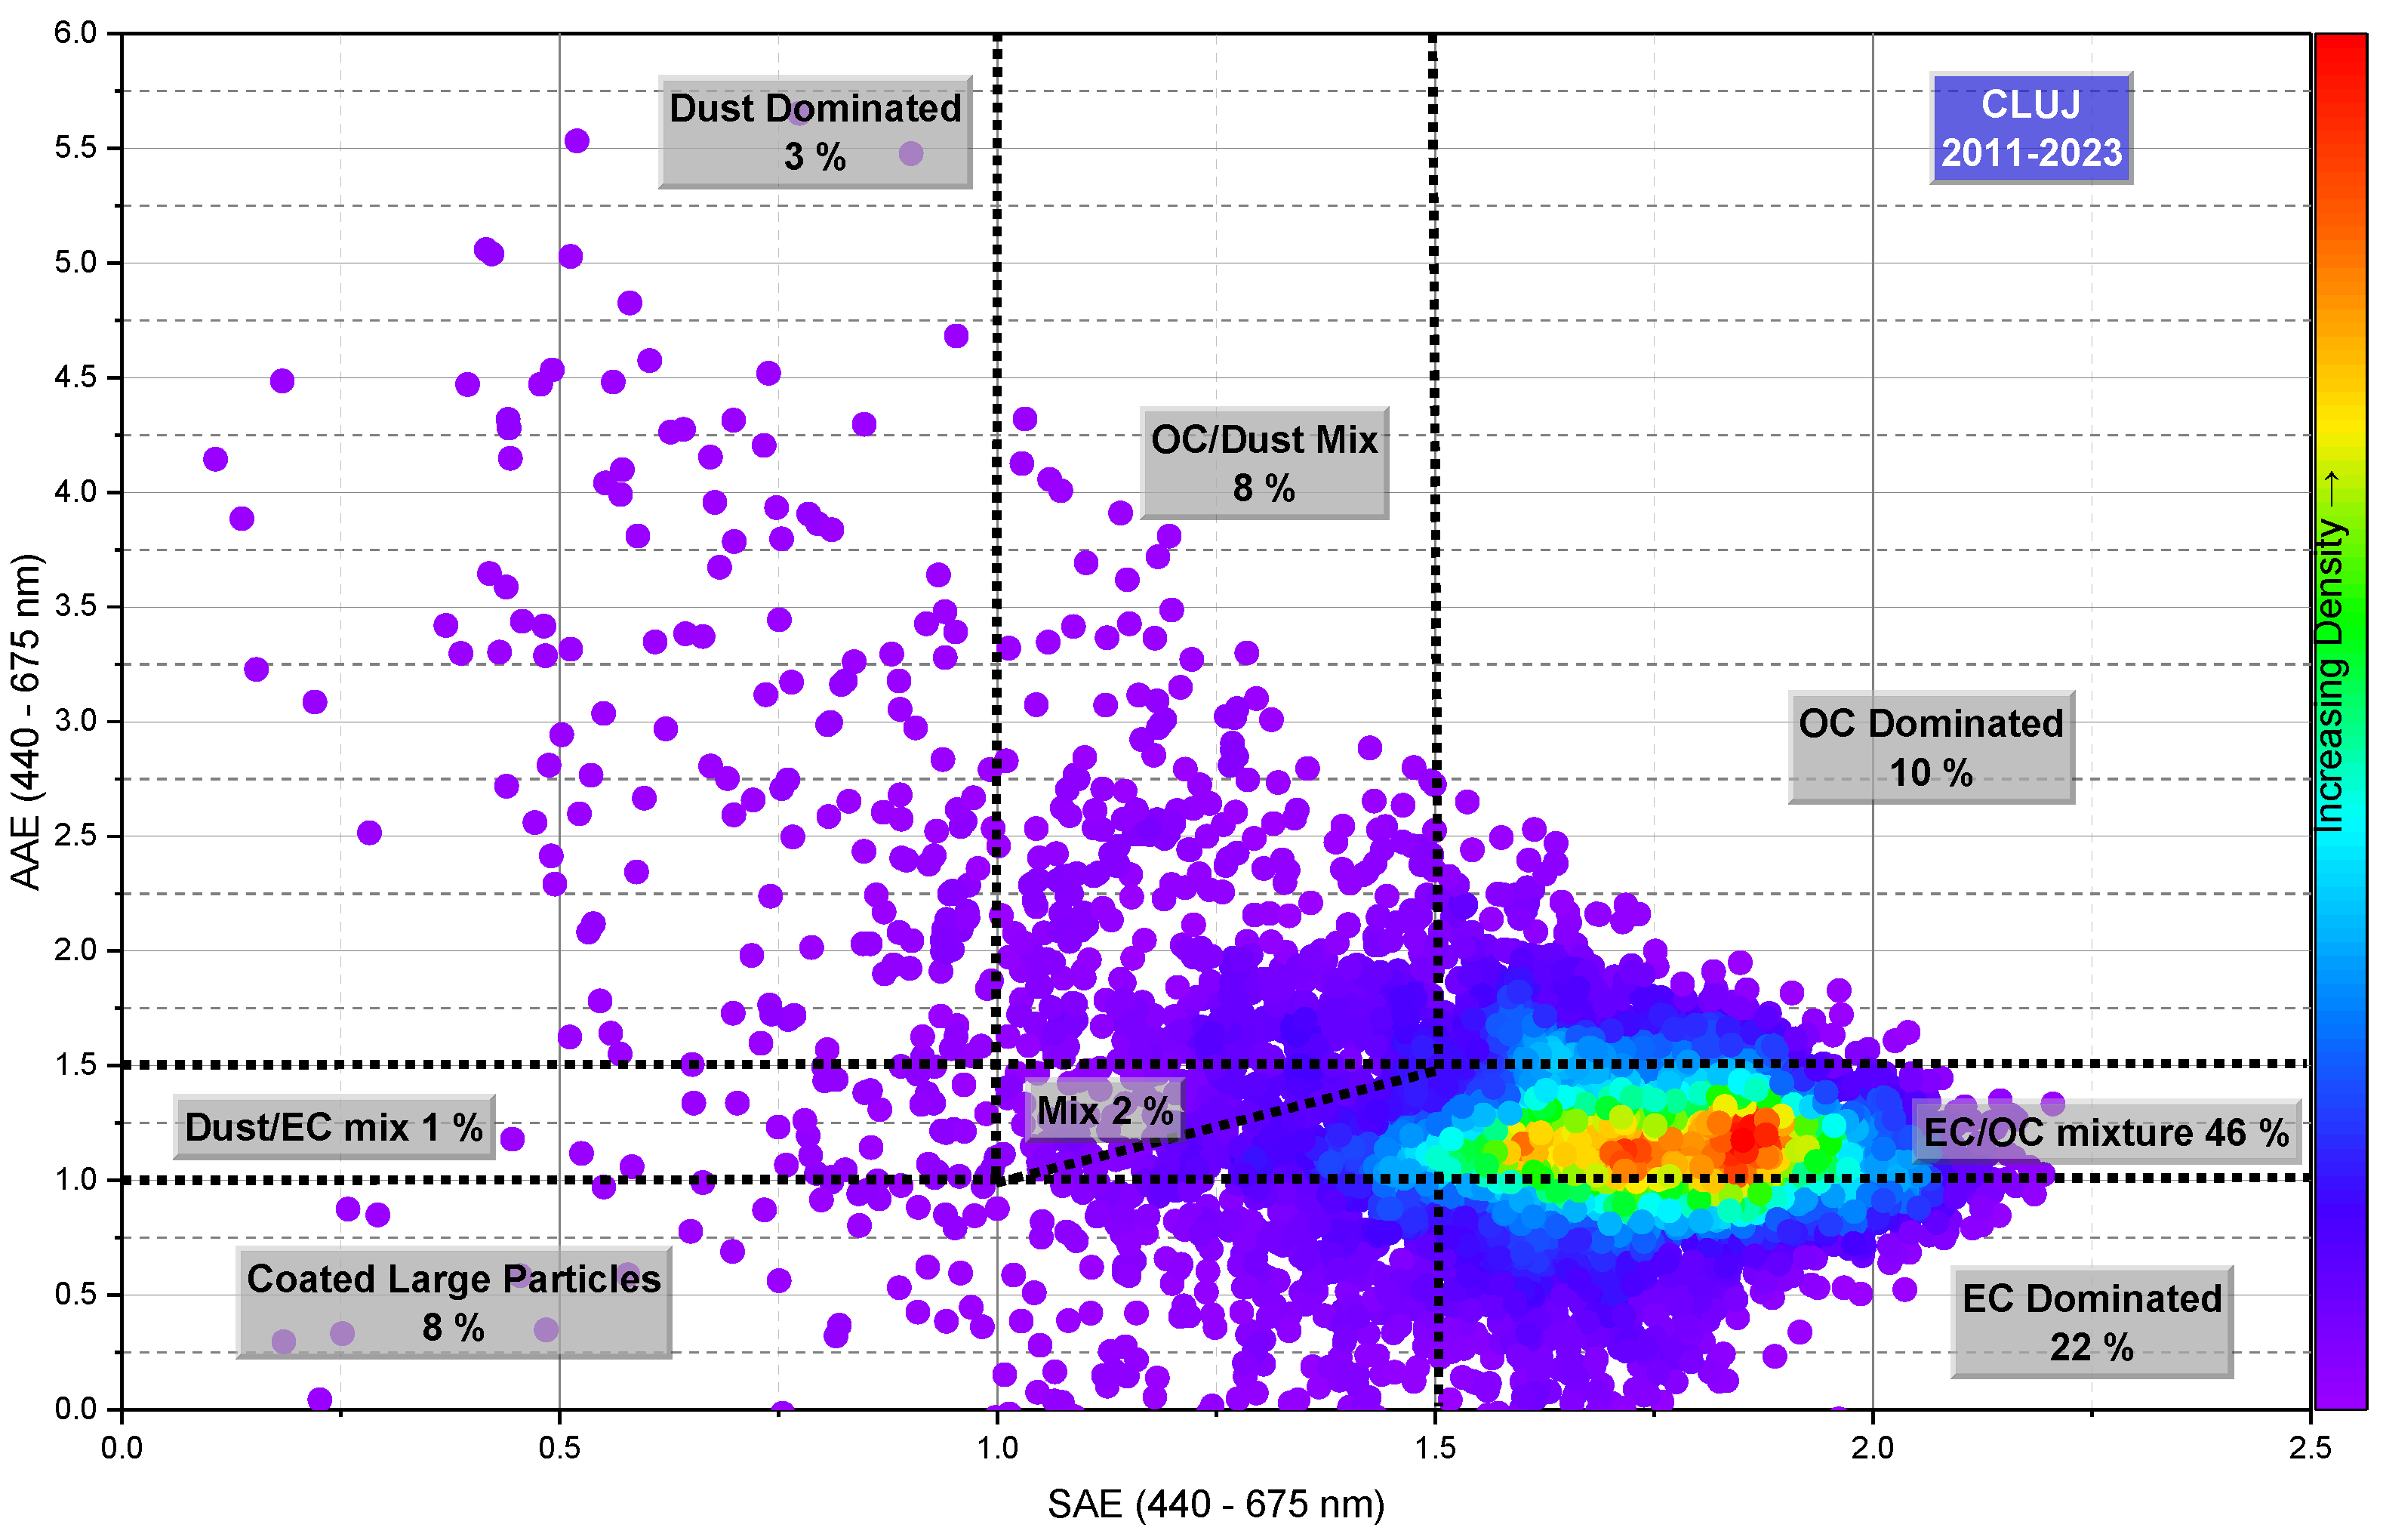
Figure 4.
(a) RMSE variation for Iasi; (b) MAE variation for Iasi; (c) RMSE variation for Cluj-Napoca; (d) MAE variation for Cluj-Napoca.
Figure 4.
(a) RMSE variation for Iasi; (b) MAE variation for Iasi; (c) RMSE variation for Cluj-Napoca; (d) MAE variation for Cluj-Napoca.
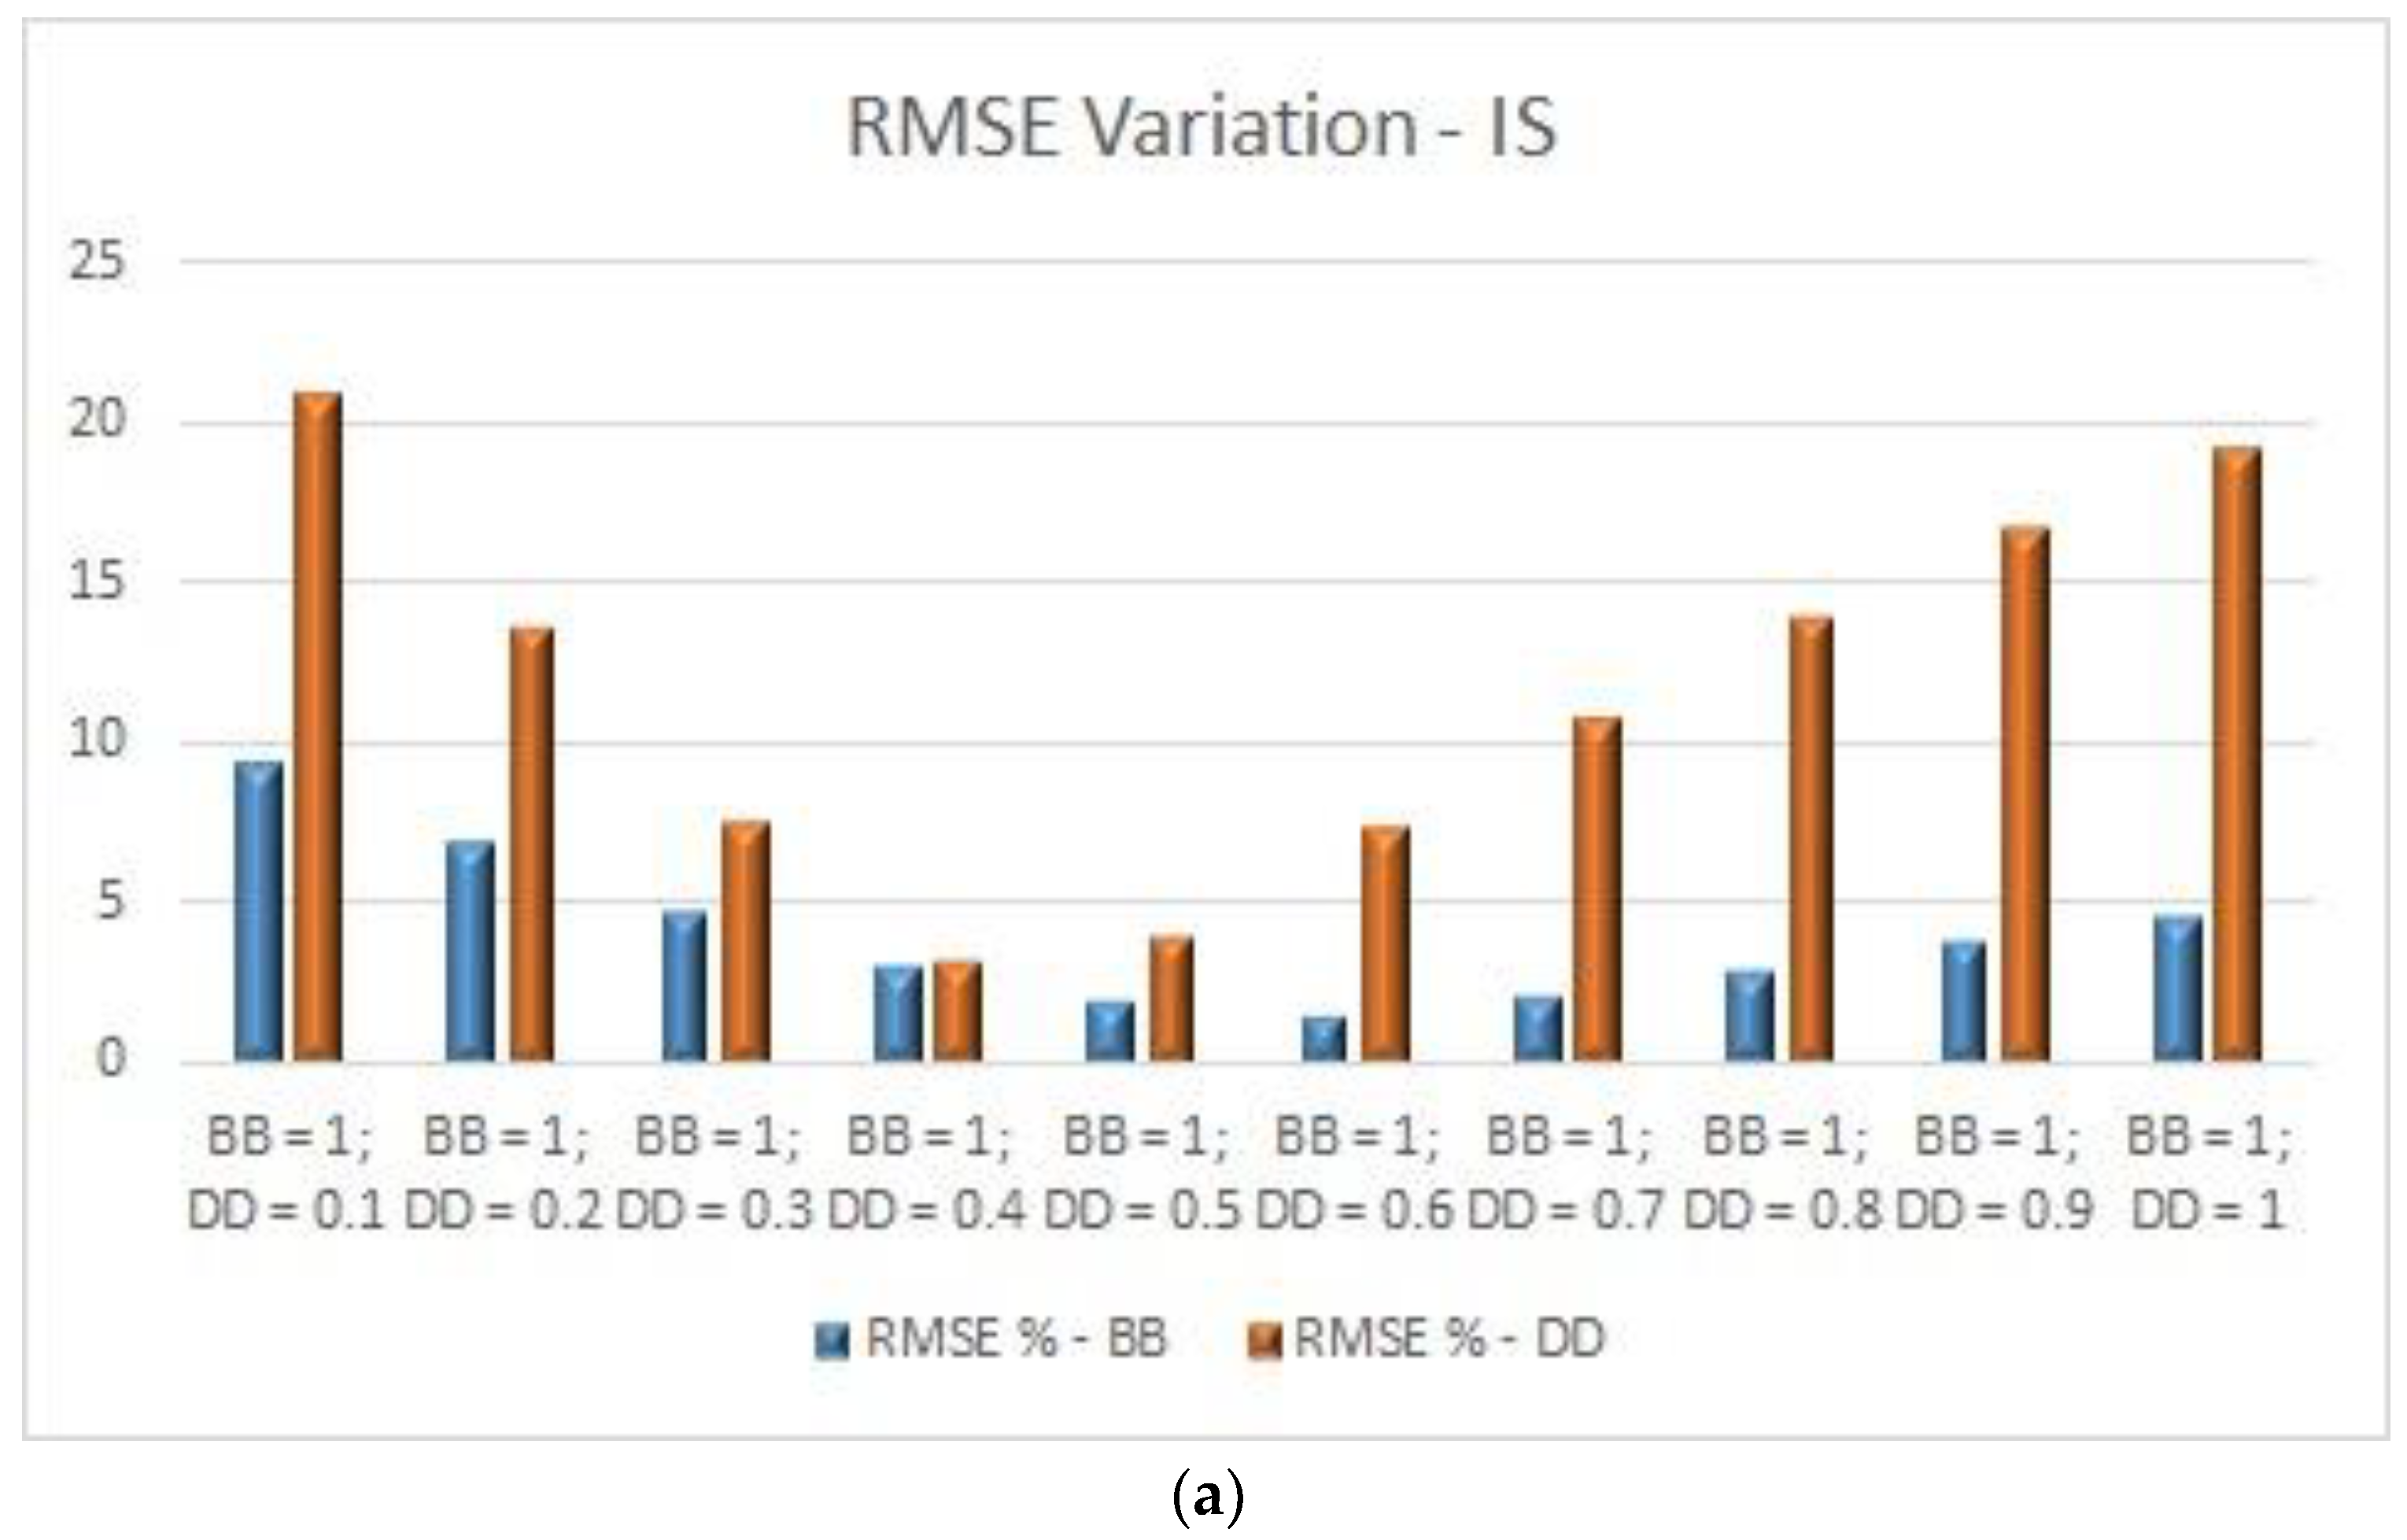
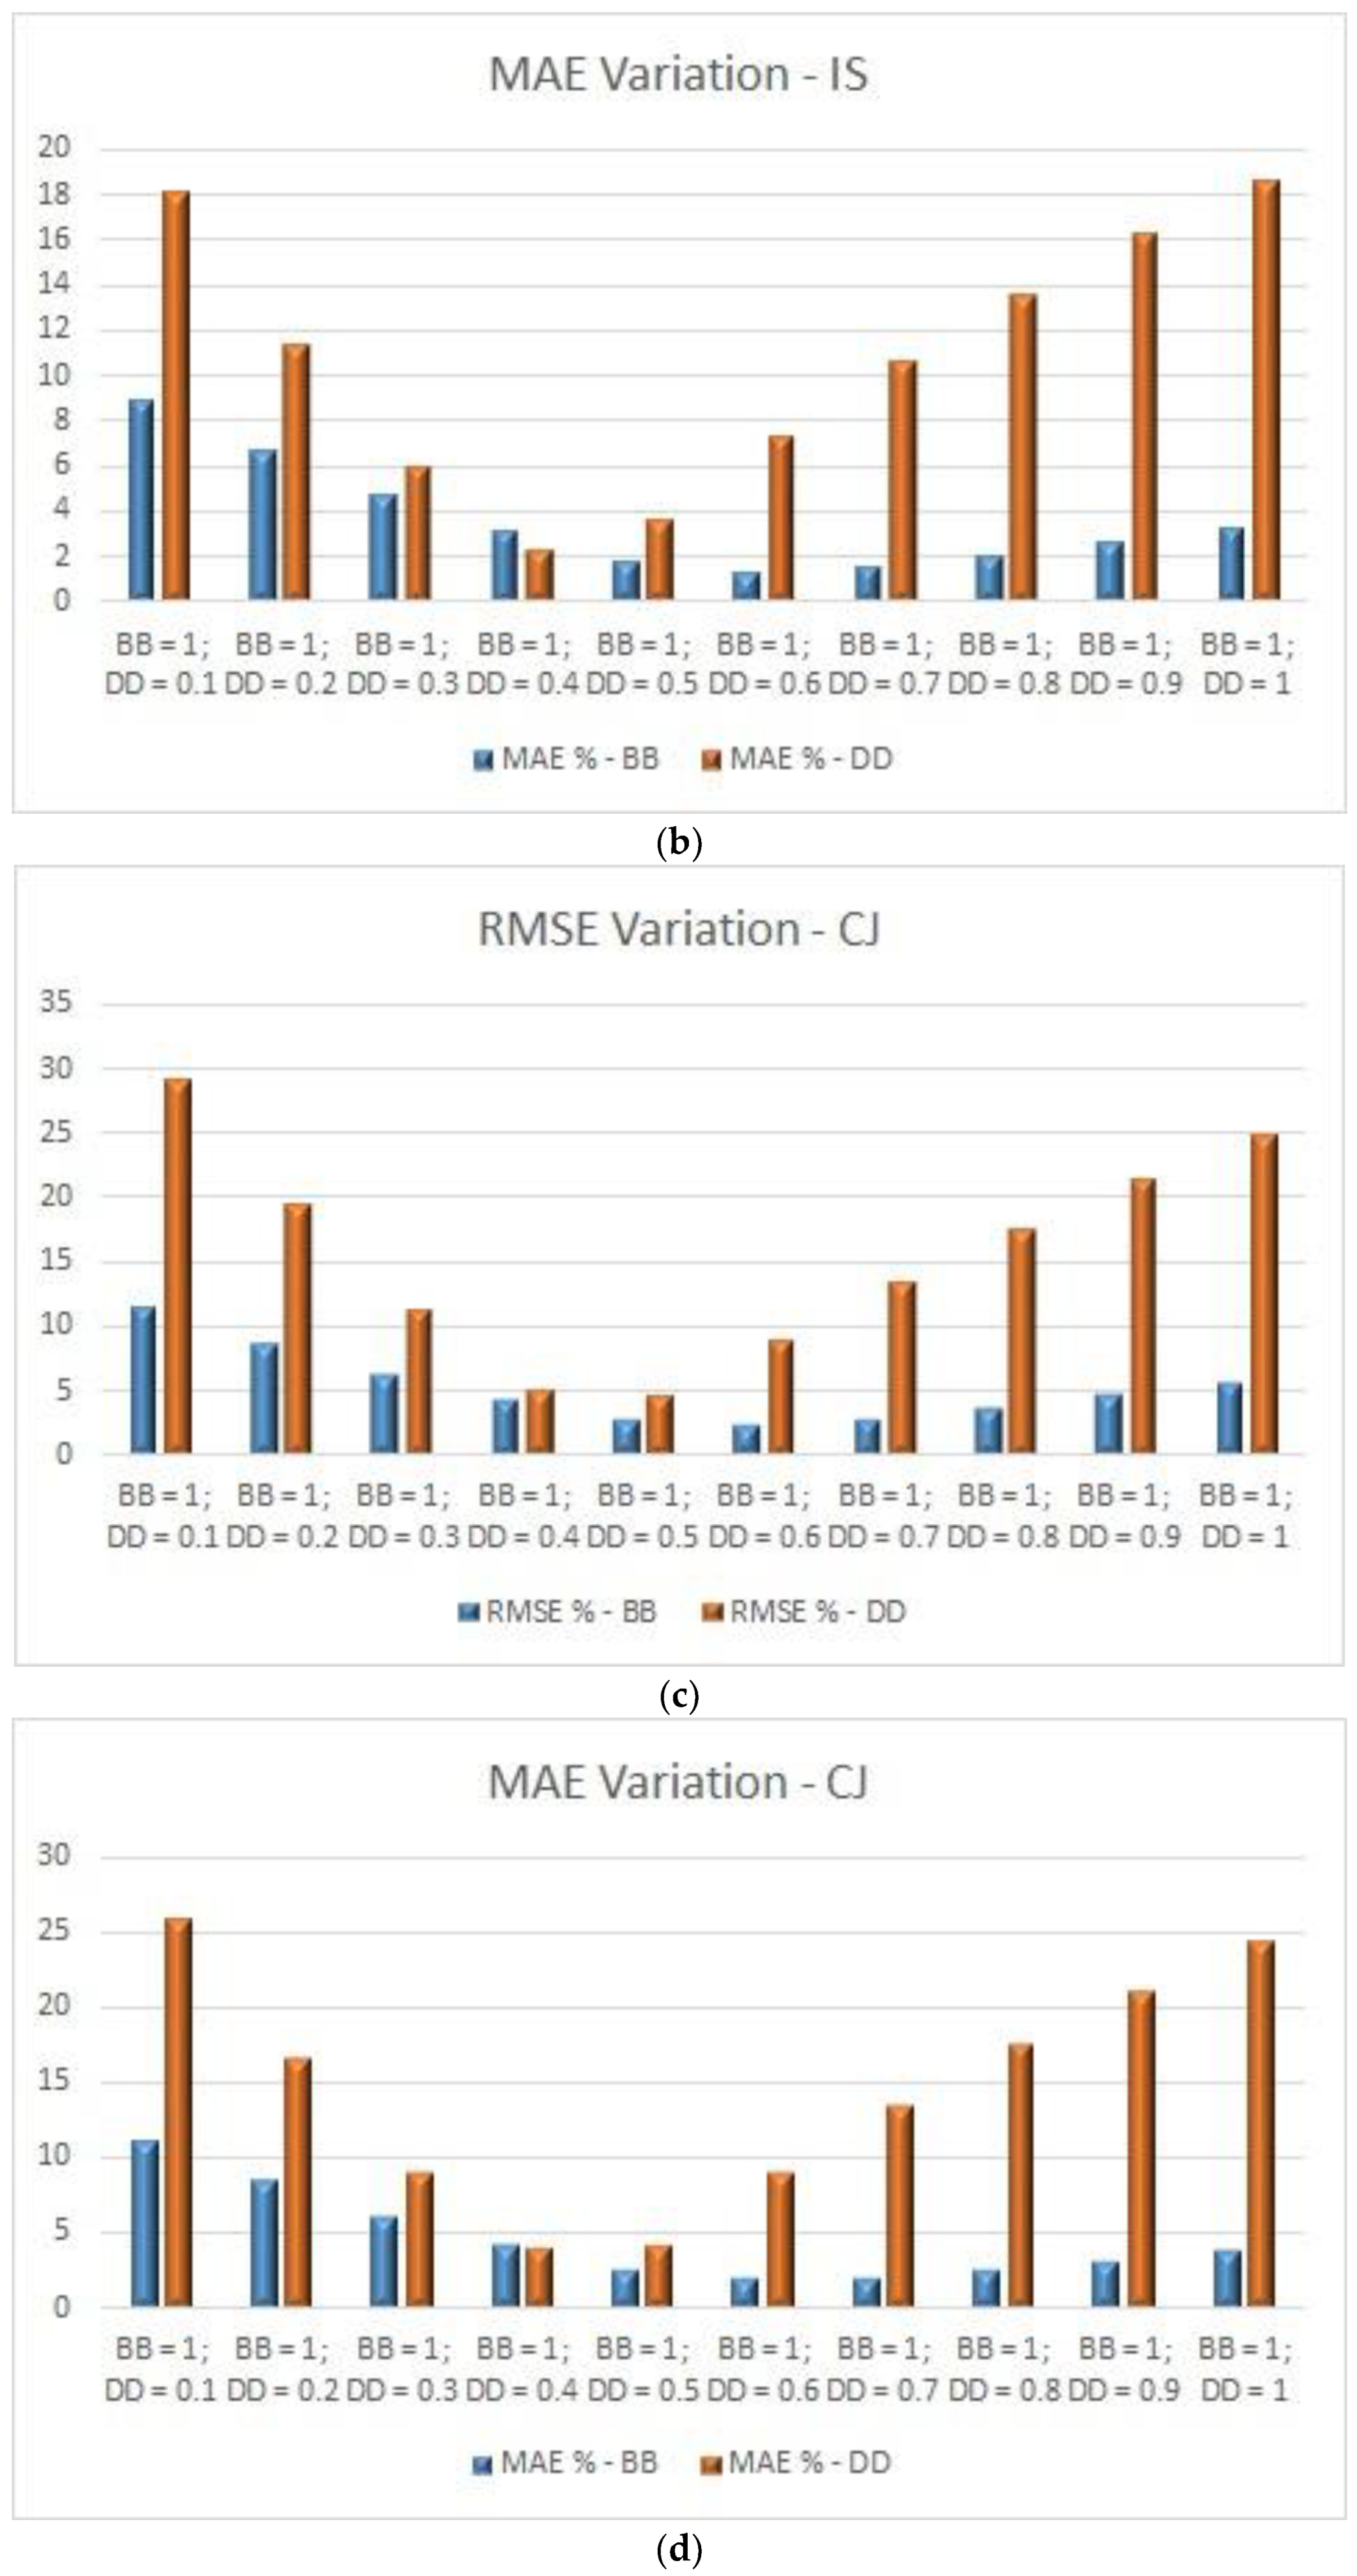
Figure 5.
Environmental impact quantification statistics for elemental carbon category (EC), by using AERONET data from the Iasi monitoring site for 12 years (2012 – 2023).
Figure 5.
Environmental impact quantification statistics for elemental carbon category (EC), by using AERONET data from the Iasi monitoring site for 12 years (2012 – 2023).
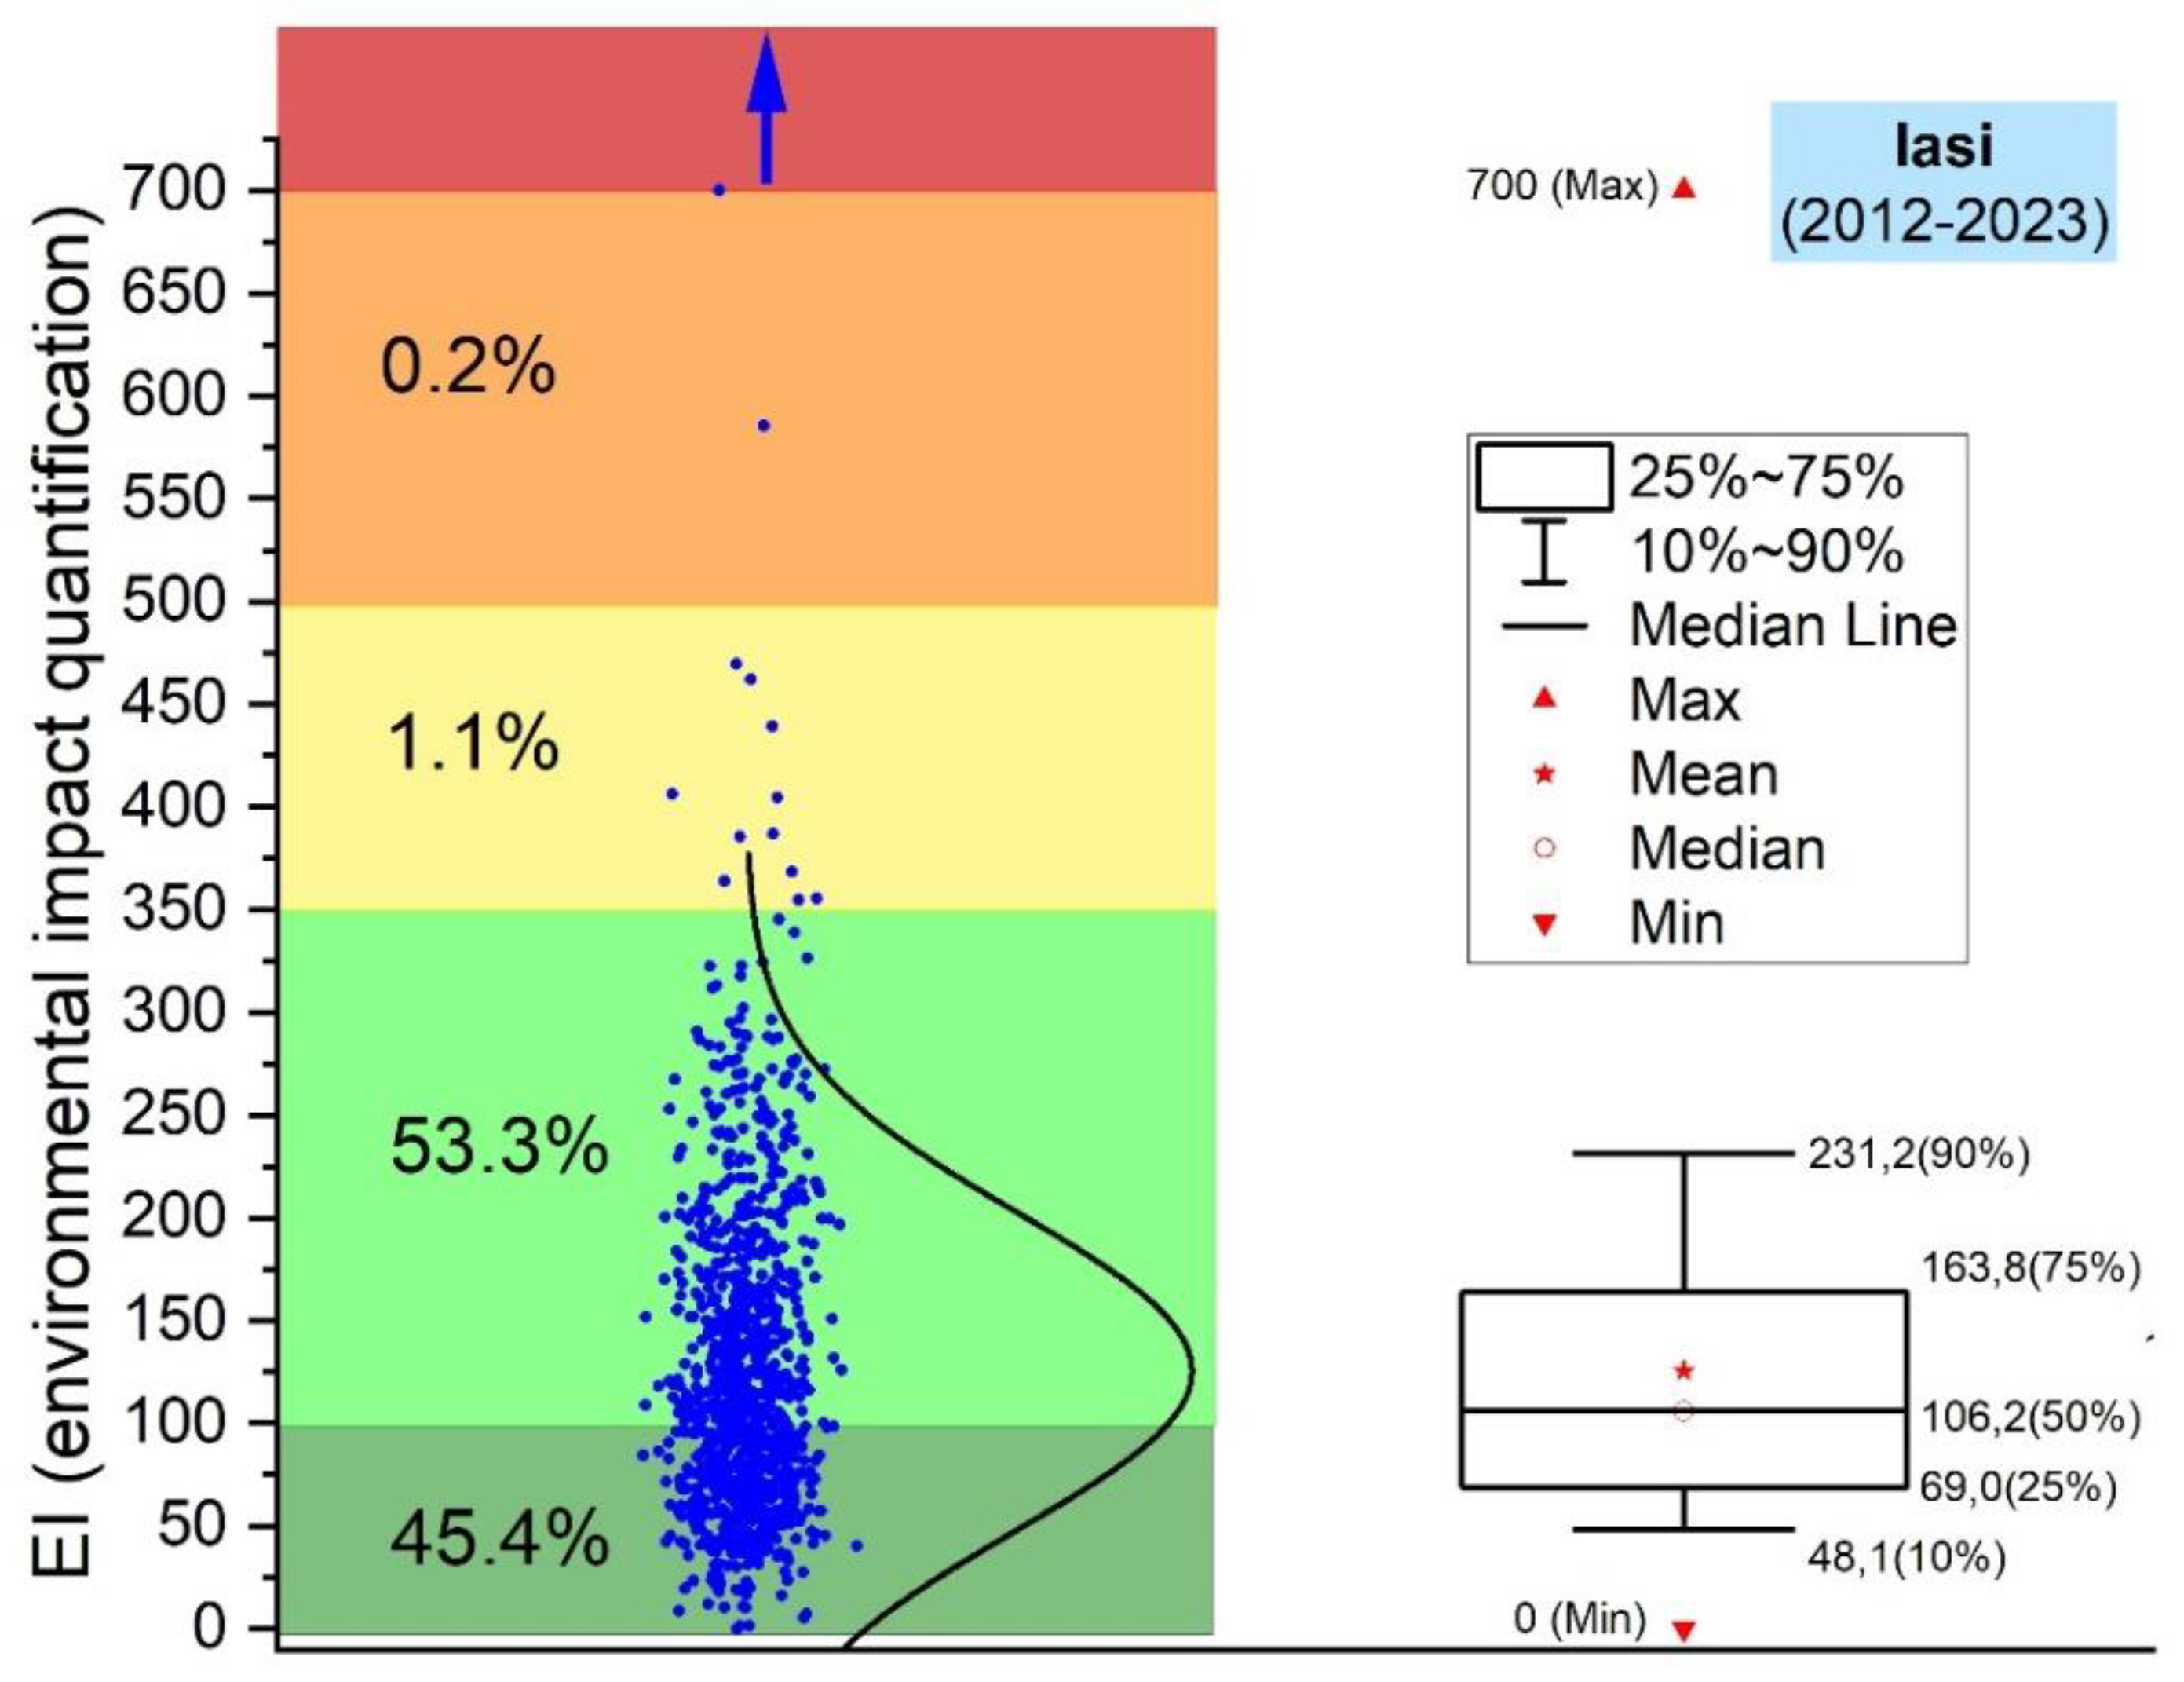
Figure 6.
Environmental impact quantification statistics for desert dust category (DD), by using AERONET data from the Iasi monitoring site for 12 years (2012-2023).
Figure 6.
Environmental impact quantification statistics for desert dust category (DD), by using AERONET data from the Iasi monitoring site for 12 years (2012-2023).
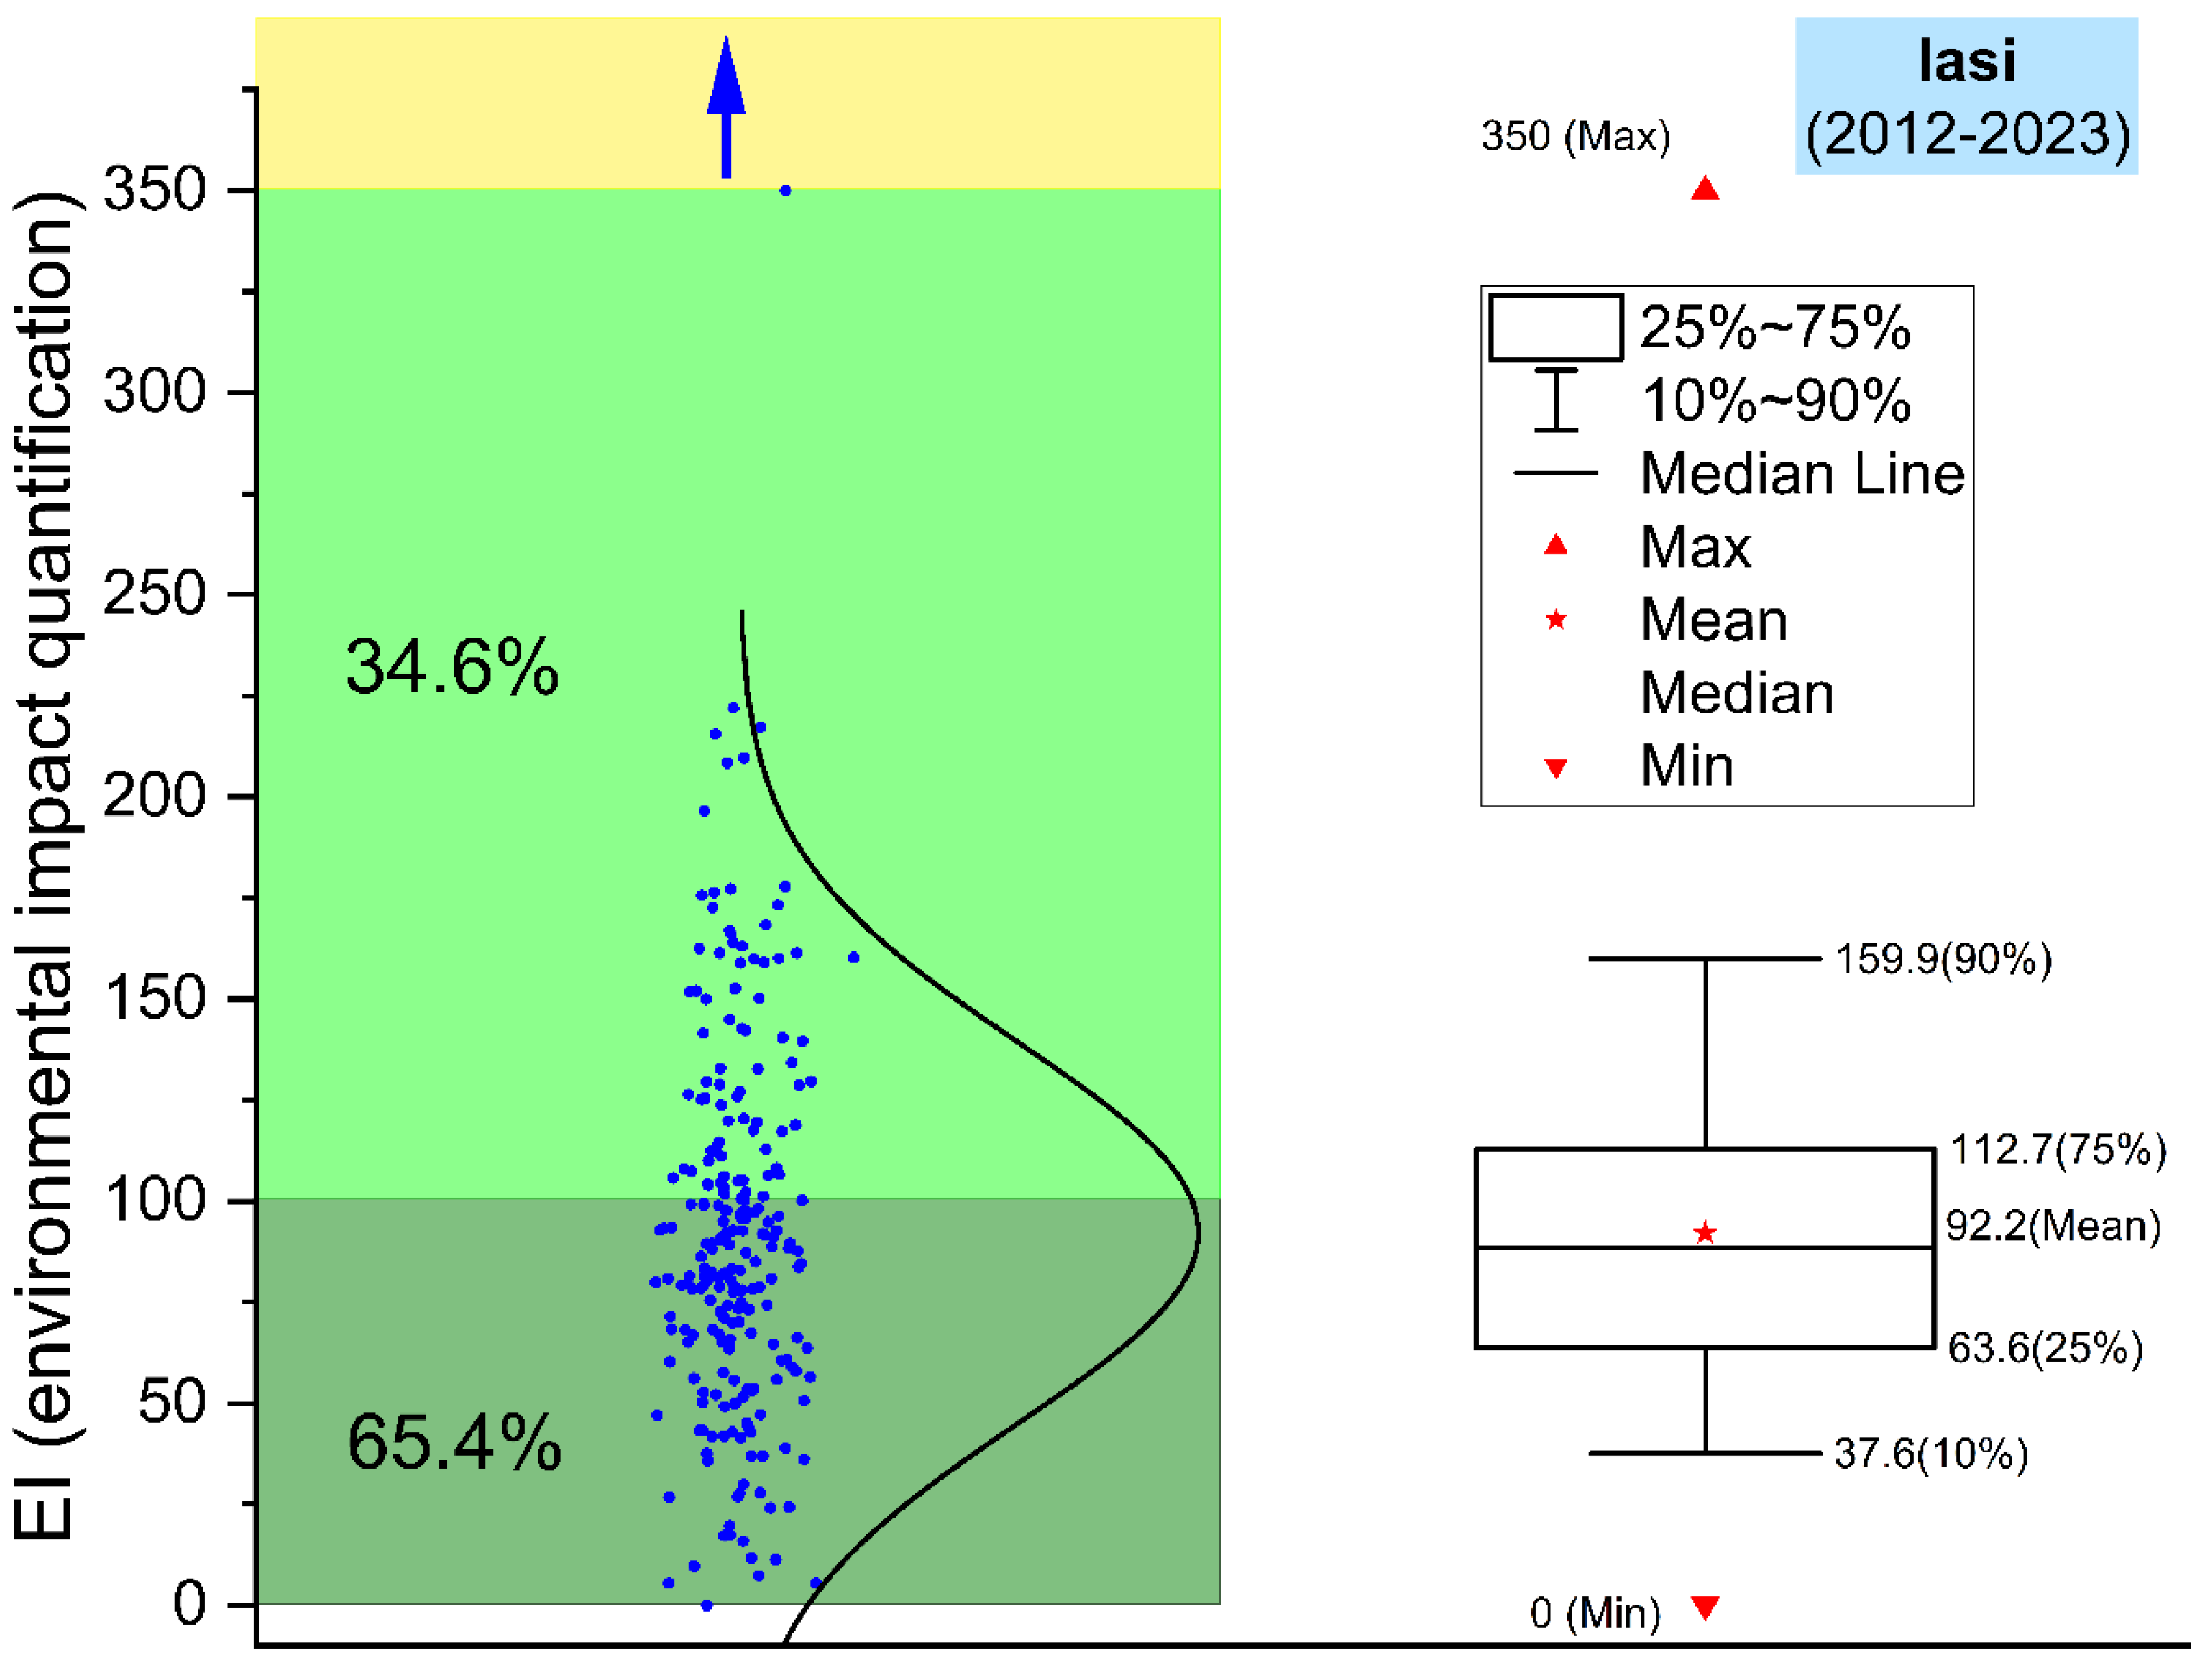
Figure 7.
Environmental impact quantification statistics for elemental carbon category (EC), by using AERONET data from the Cluj-Napoca monitoring site for 13 years (2011 – 2023).
Figure 7.
Environmental impact quantification statistics for elemental carbon category (EC), by using AERONET data from the Cluj-Napoca monitoring site for 13 years (2011 – 2023).
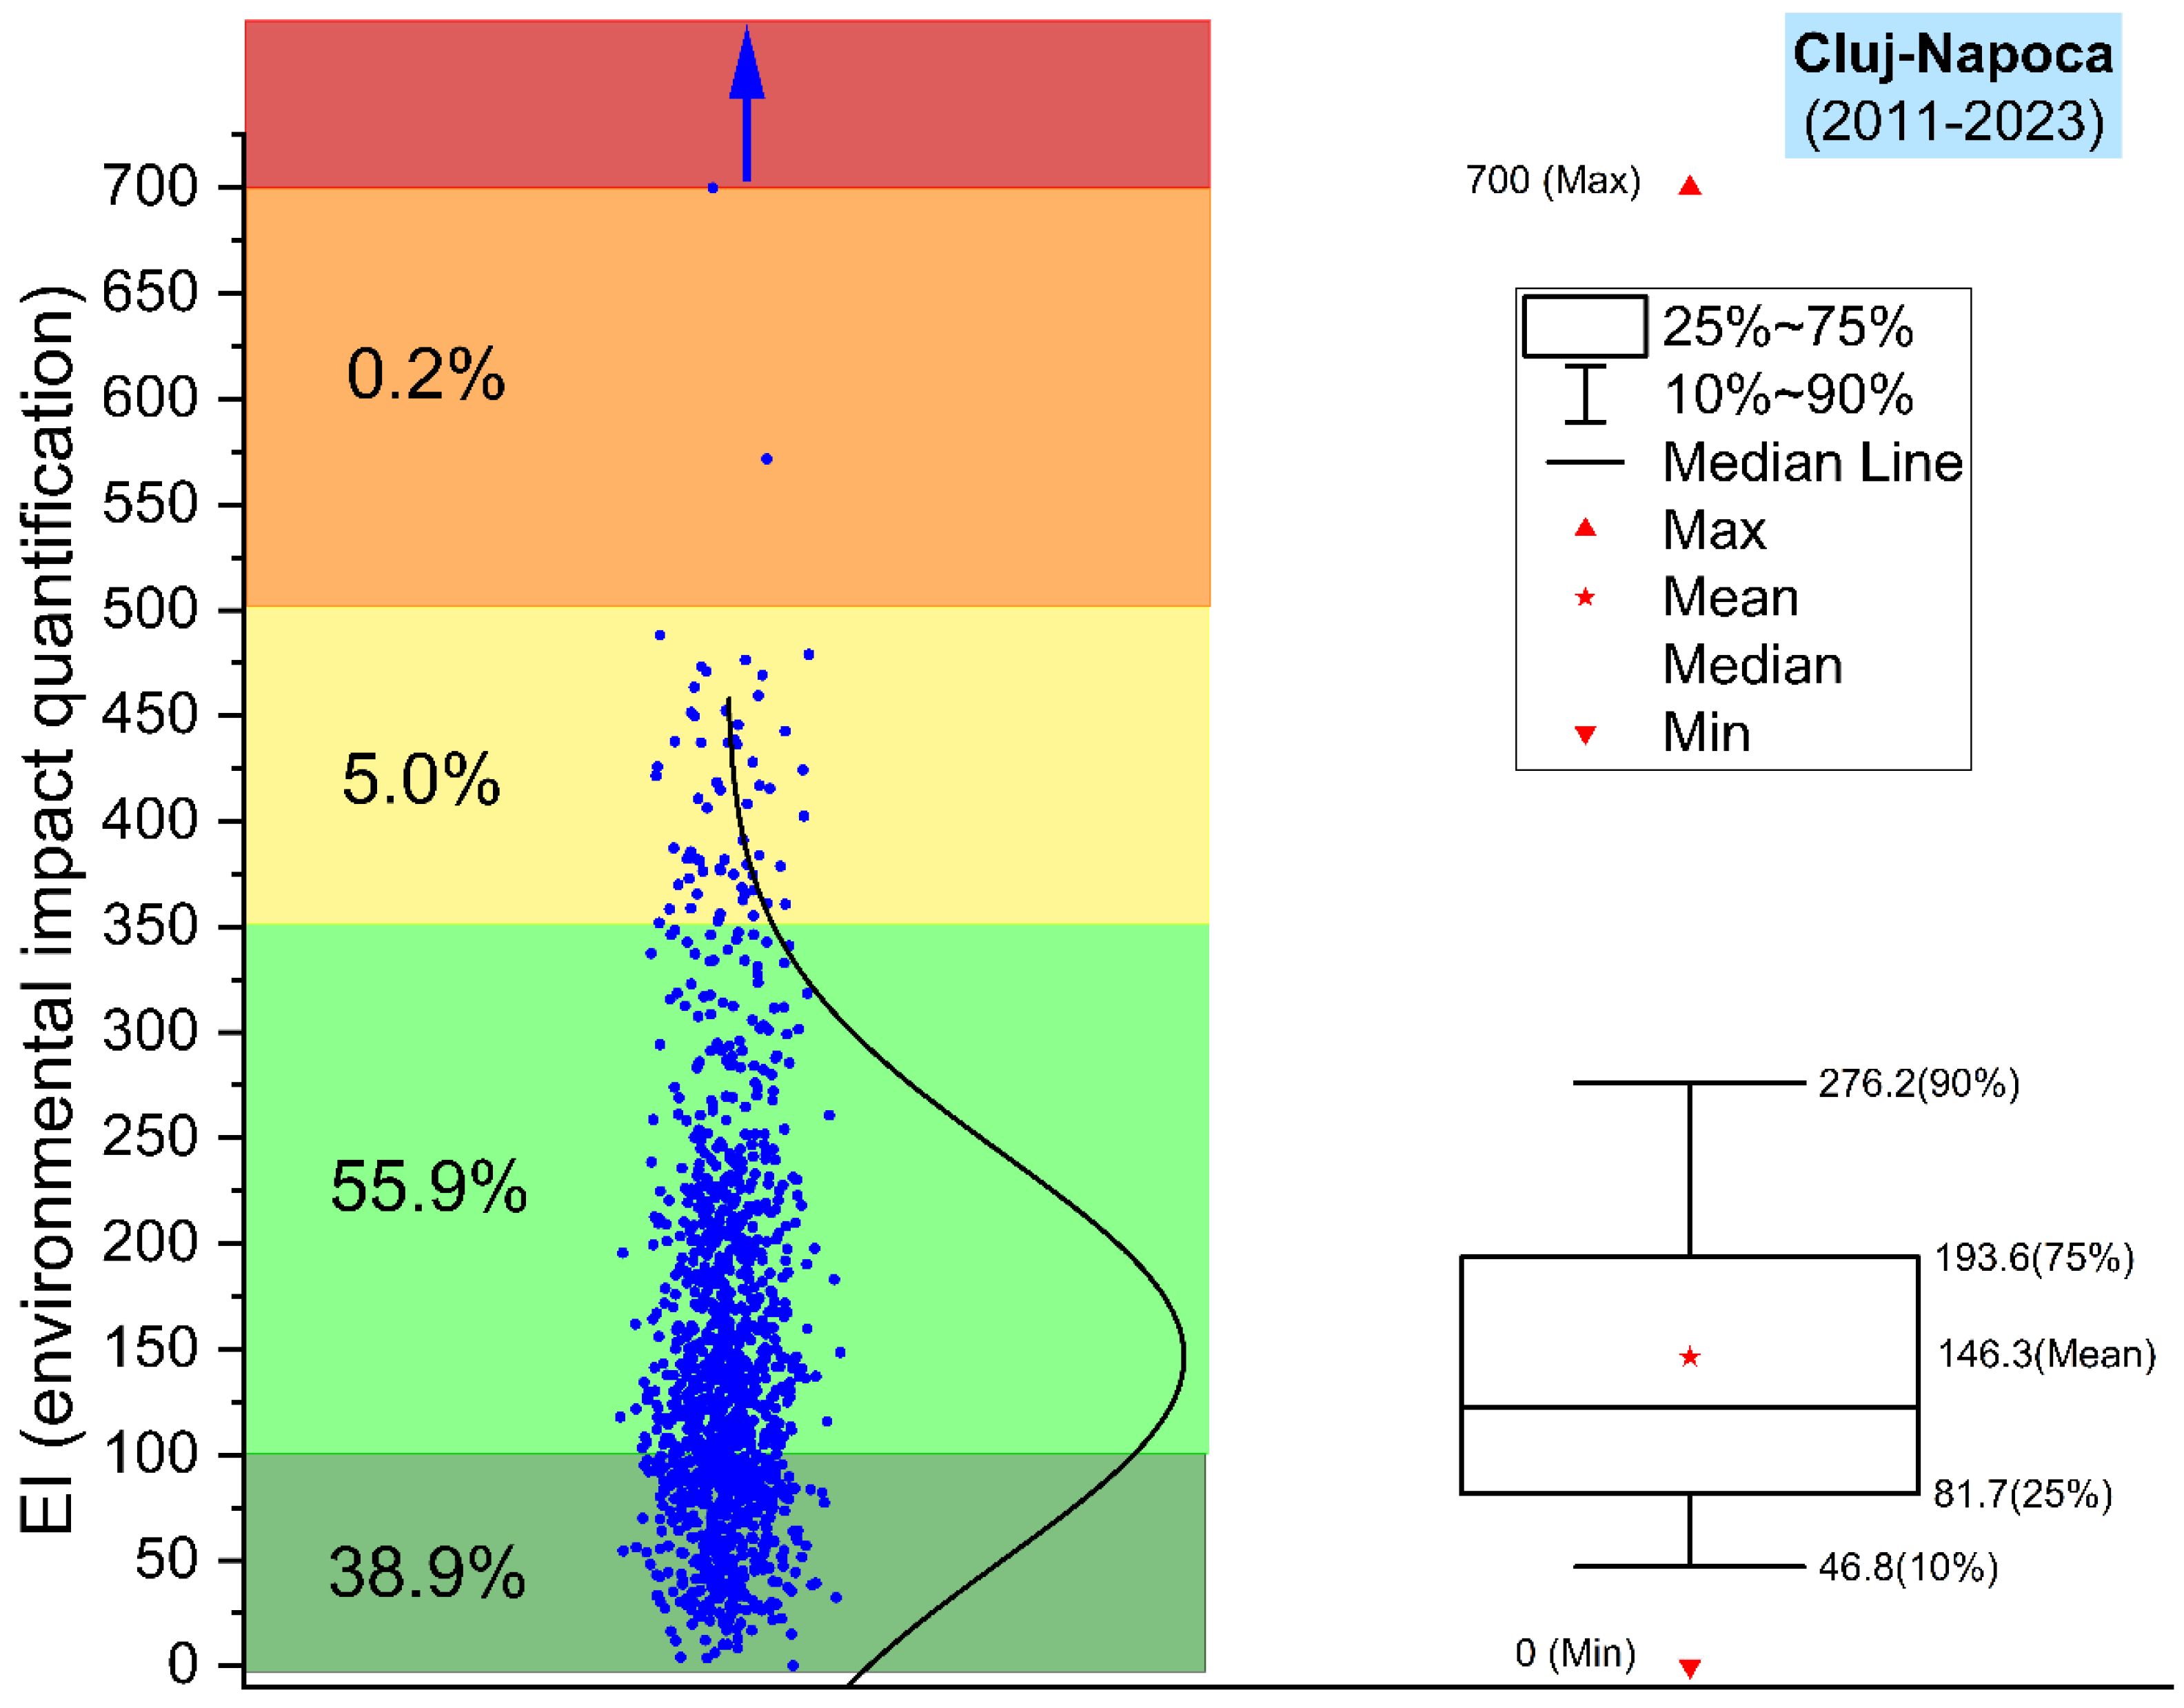
Figure 8.
Environmental impact quantification statistics for the desert dust category (DD), by using AERONET data from the Cluj-Napoca monitoring site for 13 years (2011-2023).
Figure 8.
Environmental impact quantification statistics for the desert dust category (DD), by using AERONET data from the Cluj-Napoca monitoring site for 13 years (2011-2023).
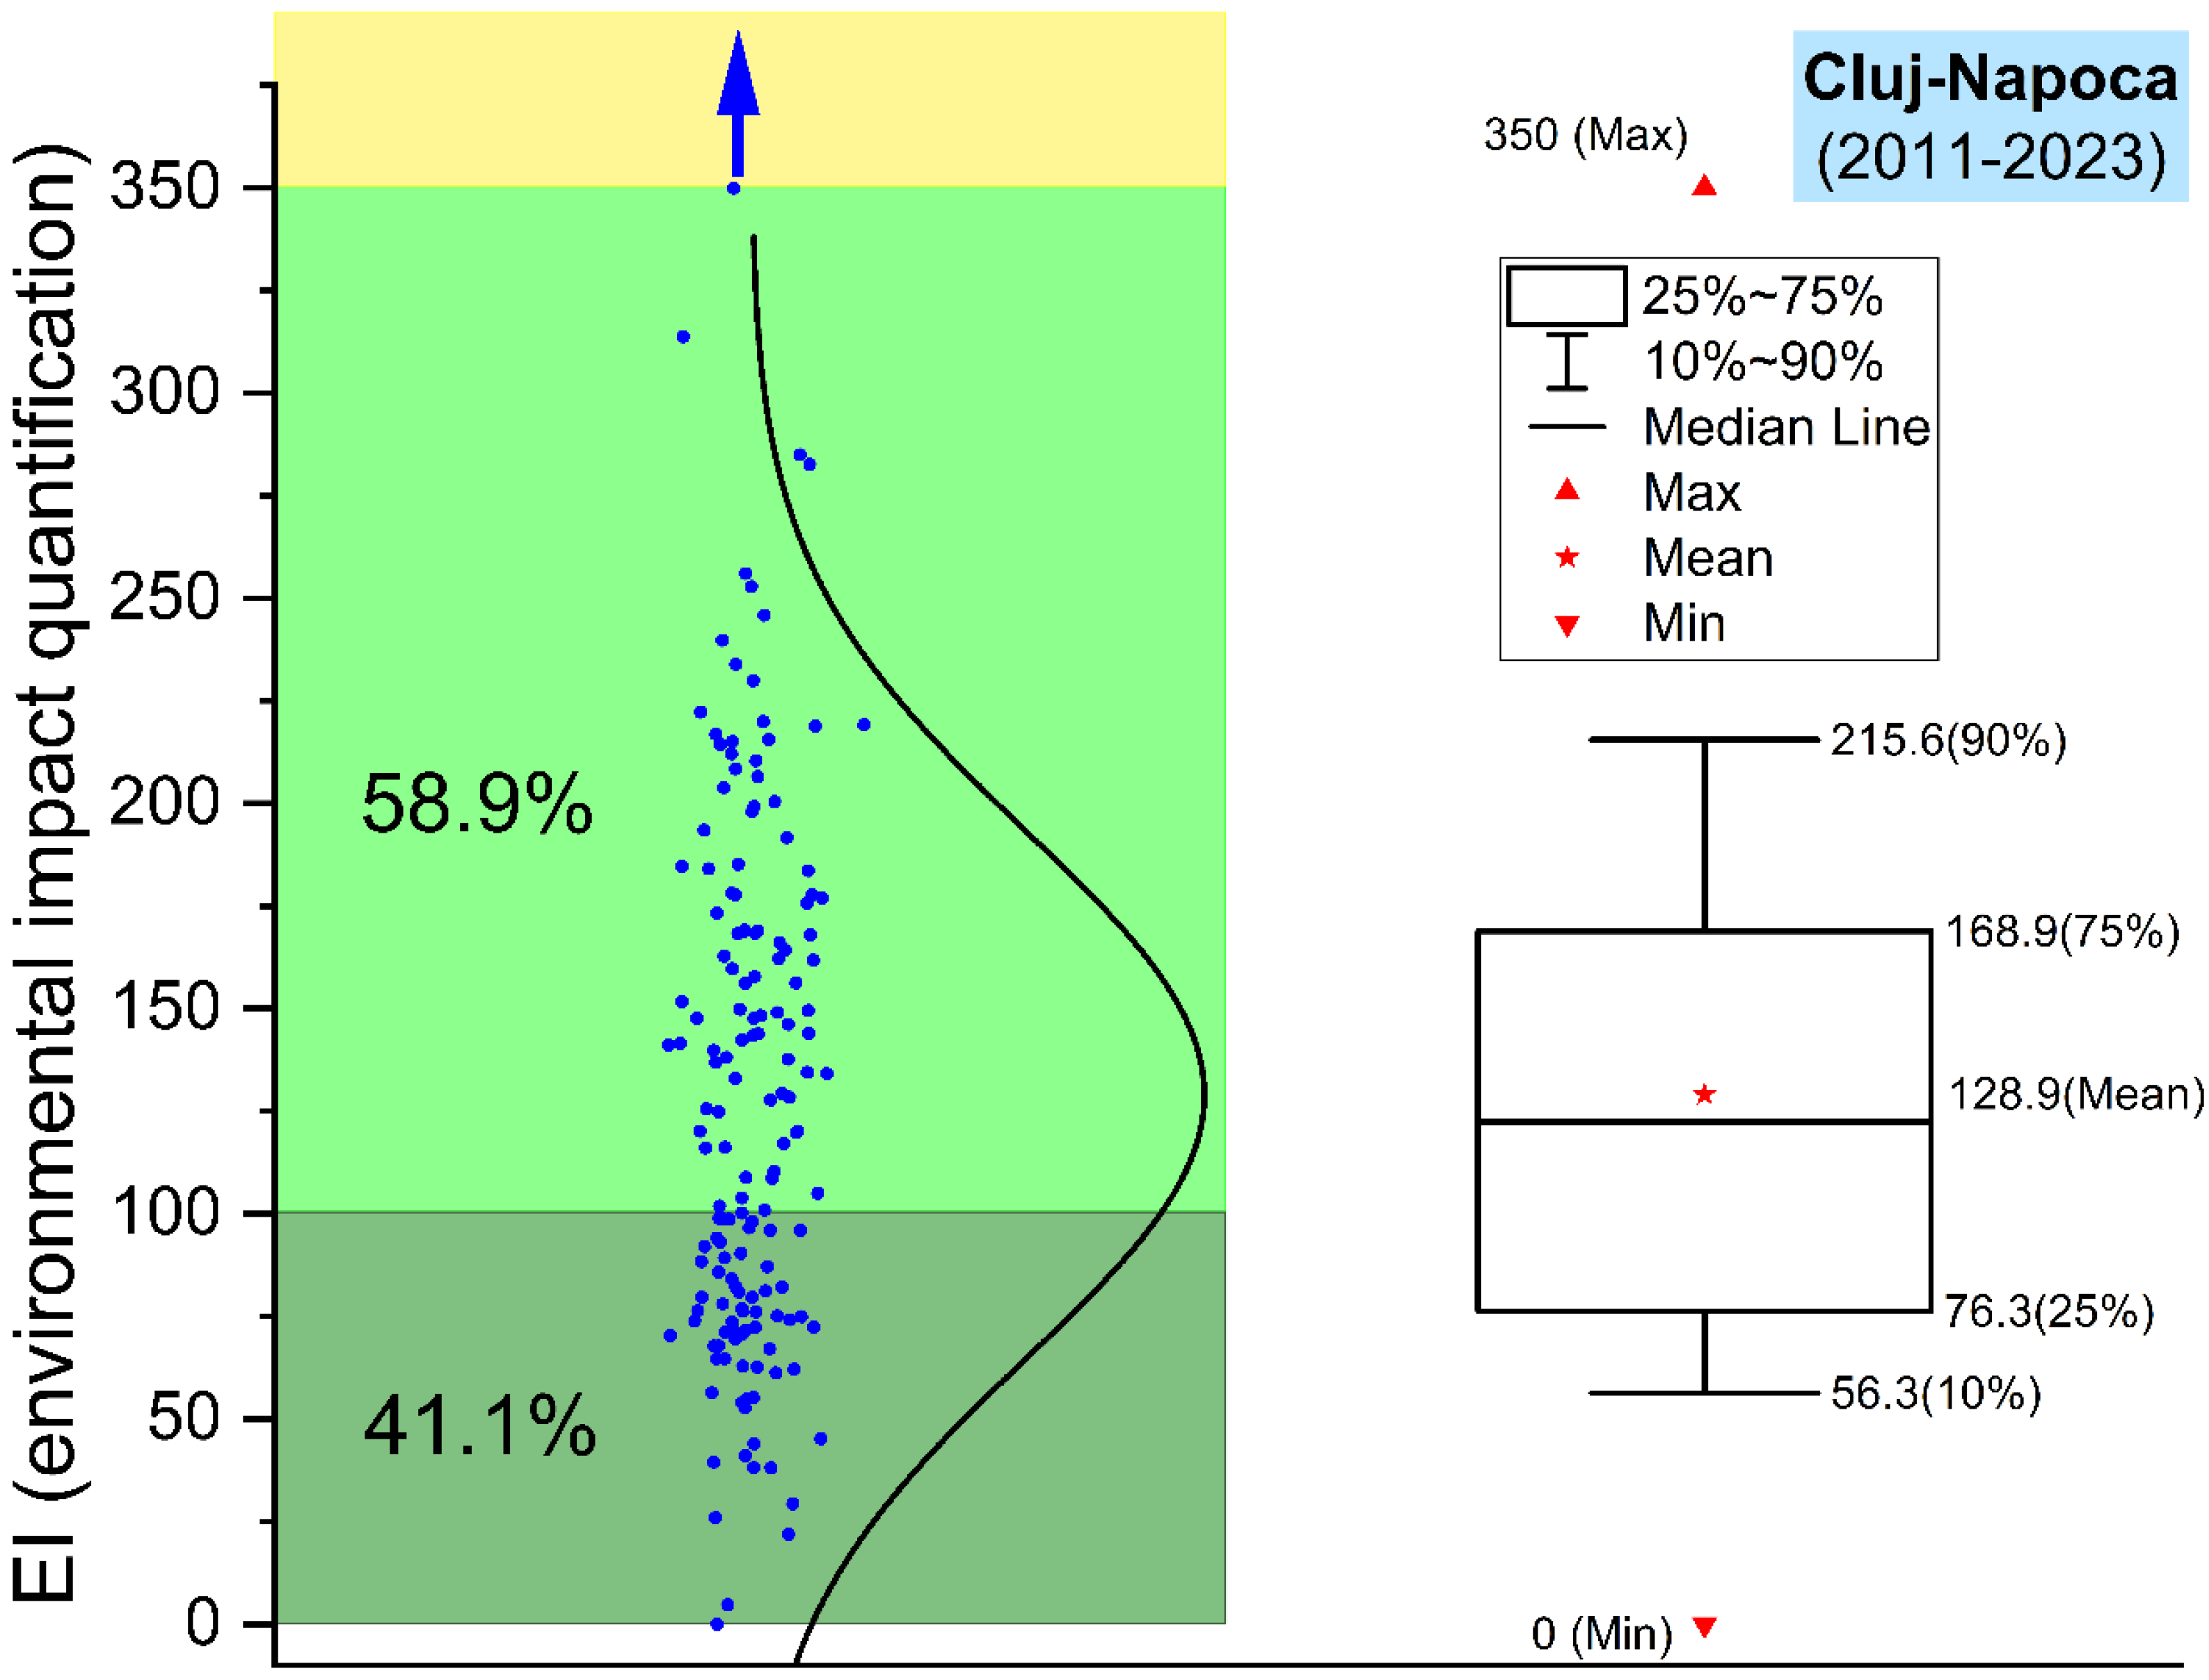

Table 1.
Health Effects of Aerosol Exposure.
| Aerosol Type | Main health effects |
|---|---|
| Biomass burning | Pulmonary toxicity, respiratory and cardiovascular diseases, chronic obstructive pulmonary disease, infections, cancer, and premature death. |
| Mixtures (Fine&Coarse Particles) | Influenza, tuberculosis, skin reactions, inflammation, oxidative stress, and cardiorespiratory risks. |
| Desert Dust | Asthma, coughing, wheezing, bronchitis, pneumonia, allergic rhinitis, high blood pressure, and heart issues. |
| Impact scale | Description | Risk scale | Description |
|---|---|---|---|
| <100 | Natural environment, not affected by industrial/human activities | <100 | Negligible/insignificant risks |
| 100-350 | Environment modified by industrial activities within admissible limits | 100-200 | Minor risks, and monitoring actions are required |
| 350-500 | Environment modified by industrial activities causing discomfort conditions | 200-350 | Moderate risks at an acceptable level, monitoring and prevention actions are required |
| 500-700 | Environment modified by industrial activities causing distress to life forms | 350-700 | Moderate risks at an unacceptable level, control and prevention measures are needed |
| 700-1000 | Environment modified by industrial activities, dangerous for life forms | 700-1000 | Major risks, remediation, control and prevention measures are needed |
| >1000 | Degraded environment, not proper for life forms | >1000 | Catastrophic risks, all activities should be stopped |
Table 3.
Variation in the intensity of desert dust environmental and health effects depending on the distance from the source.
Table 3.
Variation in the intensity of desert dust environmental and health effects depending on the distance from the source.
| Distance from the source | Health/environmental impact | Example evidence |
|---|---|---|
| Close to the source | High PM, severe health effects, frequent exposure | Most epidemiological studies, systematic reviews |
| Far from source | Lower PM, milder or less frequent health effects, still detectable dust | WHO fact sheet, atmospheric transport studies |
Table 4.
Guideline table for classification of RMSE and MAE.
| Percentage Range (%) | Interpretation of RMSE % / MAE % | Comments/Observations |
|---|---|---|
| 0-5 | Very low error, excellent performance | The model predicts with very high accuracy, errors almost negligible |
| 5-10 | Low error, good performance | The model provides good predictions, acceptable errors for many applications |
| 10-15 | Moderate error | Performance is decent, but errors can be significant in sensitive applications |
| 15-20 | Relatively high error | Errors are noticeable; model accuracy is limited for critical applications |
| >20 | High error, poor performance | The model struggles to make accurate predictions, requiring major improvements |
Disclaimer/Publisher’s Note: The statements, opinions and data contained in all publications are solely those of the individual author(s) and contributor(s) and not of MDPI and/or the editor(s). MDPI and/or the editor(s) disclaim responsibility for any injury to people or property resulting from any ideas, methods, instructions or products referred to in the content. |
© 2025 by the authors. Licensee MDPI, Basel, Switzerland. This article is an open access article distributed under the terms and conditions of the Creative Commons Attribution (CC BY) license (http://creativecommons.org/licenses/by/4.0/).
Copyright: This open access article is published under a Creative Commons CC BY 4.0 license, which permit the free download, distribution, and reuse, provided that the author and preprint are cited in any reuse.


