
Submitted:
30 October 2025
Posted:
03 November 2025
You are already at the latest version
Abstract
Air quality is a critical factor for public health and the balance of urban ecosystems, with aerosols playing a key role in environmental risk assessment. This study proposes an in-tegrated method for evaluating air quality and associated risks using Aerosol Optical Depth (AOD) measurements obtained with a Calitoo sun photometer. Applied to the metropolitan area of Iasi, Romania, throughout 2024, the method combines aerosol clas-sification into three main categories – biomass burning (BB), fine and coarse particles (FCP), and desert dust (DD) – with a quantitative assessment of environmental impact and risk. To better reflect the severity of effects specific to each aerosol type, the impact values were rescaled accordingly. The results indicate that BB and FCP aerosols have a major influence on air quality, while DD shows a more moderate impact. Method vali-dation was performed through Root Mean Square Error (RMSE) analysis, which con-firmed the accuracy of the proposed approach. This integrated methodology offers an ef-ficient tool for monitoring pollution dynamics and supporting evidence-based environ-mental decision-making at urban and regional levels.
Keywords:
Aerosol Optical Depth (AOD)
; air pollution risk assessment
; environmental monitoring
; CALITOO
; integrated assessment framework
1. Introduction
Maintaining good air quality is vital for protecting public health, preserving environmental balance, and supporting economic stability. Air pollution is linked to numerous health problems, such as cardiovascular and respiratory diseases, and is responsible for millions of premature deaths worldwide annually, particularly affecting vulnerable groups like children, the elderly, and individuals with pre-existing conditions. Air quality depends on a multitude of factors, including the characteristics of the pollutant sources, meteorological conditions and the characteristics of aerosols [1,2,3,4]. These aerosols are very small particles (liquid or solid) that are in the atmosphere and can come from various human activities (industry, transport) or from natural sources (volcanic eruptions). Aerosols have a different impact on visibility, human and environmental health, depending on the characteristics of each category (biomass burning, mixtures and desert dust). To better illustrate the distinct impacts of different aerosol categories, Table 1 provides a comparative overview of their main components, associated health risks, and environmental effects, highlighting the greater toxicity and complexity of aerosols from biomass burning (BB, resulting from vegetation combustion) and fine and coarse particles mixtures (FCP, formed through atmospheric mixing of various sources) compared to desert dust (DD, originating from natural wind-driven soil erosion and sand particles in semi-arid and arid regions) [5,6,7,8,9,10,11,12,13,14,15,16,17,18,19,20,21,22,23,24,25,26,27].
The study of aerosol properties and their effects is crucial for climate modeling and risk assessment. Aerosol Optical Depth (AOD) is a key parameter used to understand air quality and aerosol types, measured via ground-based sun photometers or remote sensing, as it is the AERONET network. Aerosols are classified using AOD and the Ångström coefficient, revealing seasonal and regional variations in aerosol types. Studies from across the world – including Europe – show that AOD varies with local conditions and seasons. Additionally, AOD mapping aids in assessing aerosols’ climate influence globally [28,29,30,31,32,33,34,35,36,37,38,39,40,41].
Considering the consequences of air pollution on the environment and implicitly on human health (Table 1), a useful tool for developing effective strategies for managing air quality risks is the assessment of environmental impacts and risks. One of the approaches used in such assessments consists of the analysis of certain indices, facilitating the subsequent application of specific risk assessment and impact methodologies. The integration of environmental impact and risk assessment methods is essential to understand the complexity of environmental problems, to improve decision-making and to guide investments in health and infrastructure, and the effectiveness of this approach has been demonstrated in studies from various regions of the world [42,43,44,45,46,47]. Considering all the aspects mentioned above, the primary aim of this study is to develop and apply an integrated methodology for assessing air quality and environmental risks using AOD-based aerosol analysis. By correlating data collected with a portable solar photometer (Calitoo) with aerosol classification based on optical and health-related characteristics, the study introduces a framework adapted to urban environments in Romania. This approach allows for both pollution impact quantification and the identification of high-risk periods, offering valuable support for public policy and air quality management decisions. In addition, this study presents a novel, locally adapted method that leverages a portable photometer as a practical alternative to satellite or fixed station monitoring networks, particularly suited for under-monitored areas, thereby filling a critical gap in aerosol risk assessment.
2. Materials and Methods
2.1. Site Description
In Romania, atmospheric aerosol monitoring is carried out through 8 AERONET stations located in Timisoara, Bucharest, Cluj-Napoca and Iasi. Additionally, 148 air quality monitoring stations operate nationwide: 58 industrial, 30 traffic-related, 37 urban, and 13 suburbans. Given recent pollution trend analysis, the city of Iasi has been identified as one of the most affected areas, which led to the focus of this study. The choice was also supported by a prior statistical analysis conducted in four major Romanian cities and published in 2023, which ranked Iasi as the most polluted. In the present study, aerosol measurements were conducted on-site in Iasi using the Calitoo sun photometer. Located in northeastern Romania, Iasi is a major historical and cultural center with approximately 271,700 inhabitants. Key economic sectors include the chemical, pharmaceutical, food, and metallurgical industries. The city has a continental climate, and air quality is assessed through six monitoring stations, which report suspended particle concentrations about twice the normal limit. As part of the local air quality monitoring system, Iasi hosts an AERONET station (Iasi_LOASL) that enables atmospheric aerosol measurements (Figure 1) [48,49,50,51,52].
2.2. Experimental Data and Calitoo Photometer
The Calitoo photometer (Figure 2), a handheld portable device, provides information on aerosol concentrations, recording certain essential data, such as time, pressure, GPS position and Ångström coefficient. It is easy to use in field work, operating with four AA batteries, but respecting certain conditions. Measurements must be made in stable weather conditions, daytime, without clouds. The device is activated by pressing a central button for a few seconds, thus entering the measurement mode. The user must face the sun and adjust the position of the photometer, so that direct sunlight falls centered in the viewfinder. The photometer can store a number of 999 measurements, which can later be transferred and analyzed on a computer, using the accompanying software. With its help, AOT (aerosol optical thickness) values can be calculated, as well as other parameters, and various graphs can be created, contributing to broader environmental studies. The photometer operates at three wavelengths, namely 465 nm (blue), 540 nm (green) and 619 nm (red) [53,54,55].
The data used in this study were collected using the Calitoo photometer in the south-east part of the Iasi metropolitan area throughout the year 2024. Measurements were performed under specific conditions – during the daytime, with stable weather and clear sky – at different time intervals. All the data from the photometer were downloaded to the computer, followed by their organization and sorting. In this study, we use the term Aerosol Optical Depth (AOD), which is equivalent to Aerosol Optical Thickness (AOT), as provided by the Calitoo solar photometer at 465 nm and to comply with the criteria for the classification of the type of aerosol as indicated by the manufacturer. Therefore, AOD at 465 nm – recorded with a Calitoo handheld sun photometer – was used to implement our integrated method, which we initially introduced and validated in the AERONET framework. To our knowledge, this is the first application of the method to Calitoo measurements [56]. The aerosols were classified into three main categories based on specific ranges for AOD (465) and Ångström exponent (AE). Biomass burning (BB) aerosols were identified under conditions where AOD465 was greater than or equal to 0.25 and the Ångström exponent ranged between 1 and 2.4 (1 < AE ≤ 2.4), indicating a high concentration of fine particles. The fine and coarse particles (FCP) category was associated with AOD (465) ≥ 0.25 and AE values between 0.7 and 1 (0.7 ≤ AE ≤1), suggesting a mixed presence of fine and coarse aerosol modes. Desert dust events were characterized by AOD (465) ≥ 0.25 and AE ≤ 0.5, typical for large, coarse-mode particles. Additionally, ”Clear” category, defined by AOD (465) < 0.25 and 1.5 < AE ≤ 2.4, was identified, but is not further analyzed in this study, as it corresponds to low aerosol loading conditions [57,58].
Bayat and Assarenayati present a classification of aerosols based on data collected using the Calitoo instrument. Their study shows that the 'Dust' category is defined by an AOD ≥ 0.25 and an AE ≤0.75 [59]. However, the authors also consider values for an AOD < 0.25 in their discussion of “dust plus mixed” aerosols. In our study, we retained the classification presented in references [57,58], adding that we named the category of aerosols with an AOD (465) ≥0.25 and AE ≤ 0.5 as “Dust Dominated” (DD). This "Dust Dominated" category of aerosols is often used in the literature [56,60,61]. We have chosen this name because we could not validate all the measurements in this category as being of the mineral or long-range dust transport type. Furthermore, since the Calitoo instrument is mobile and measurements are performed manually, even data with R² < 0.80 is eliminated. This means that the instrument mainly captures local pollution events (local dispersion).
2.3. Integrated Assessment Methodology
An efficient approach to quantifying environmental impact is the integrated impact and risk assessment method [48,56,62]. In the first phase, the environmental components are established and given an importance score, with values between 0 and 1 (maximum importance). Further, the normalized scores and importance units (IU) are obtained, based on matrices. These will be used later in the calculations. Then follows the application of Equation 1, representing the quantification of environmental quality (Q), and finally EI (quantification of environmental impact - Equation 2) and ER (quantification of risk - Equation 3) are determined, based on importance units (IU) and environmental quality (Q) [63,64,65,66]. In our work, we adjusted the method, considering the maximum value for the importance of the environmental component (value 1). This results in values of 1000 for IU. Also, in the case of the probability of pollution occurrence (p), the maximum value was 1, resulting in a similarity between ER and EI, ultimately having the same values.
Equation 1. Environmental quality quantification (Q)
Where:
Q - environmental quality;
MAC - the maximum allowed concentration (in the absence of specific limits established by legislation for atmospheric aerosols, it was necessary to adjust the integrated assessment method; thus, after aerosol classification, for each aerosol category, we defined the MAC as the highest AOD value recorded in our dataset; this approach resulted in three distinct MAC values, as it follows: 0.6203 for BB, 0.6887 for FCP, and 1.3809 for DD). BB, FCP and DD were determined based on the results discussed in chapter 3.1;
MC - measured concentration.
Equation 2. Impact on environmental quality quantification (EI)
Where:
EIᵢ - environmental impact considering the quality indicator i;
IU – unit of importance assigned to each environmental component;
Q - quality of the environmental component considering the quality indicator i.
Equation 3. Environmental risk quantification (ER)
Where:
ERi - environmental risk;
EIᵢ - environmental impact considering the quality indicator i;
p - probability of the impact/pollution occurring.
Finally, after the values for the environmental impact and risk quantification have been obtained, their classification follows, according to Table 2.
2.4. Rescaling Method and Its Validation with Statistical Indicators (Error Calculation: Root Mean Square Error – RMSE)
Since the application of the integrated assessment method led to high impact scores – suggesting a strongly affected environment – yet the AOD values measured with the Calitoo photometer did not reflect conditions of extreme or catastrophic risk, it became necessary to rescale the Environmental Impact (EI) distribution. This adjustment, described in Equation 4, was introduced to align the results more closely with the specific characteristics of the measured data, while maintaining the integrity of the original assessment framework.
Equation 4. Rescaling formula
Where:
x - the value to be adjusted;
xmax, xmin - the boundaries of the original interval (EI calculated);
ymax, ymin - the boundaries of the new interval (we set the upper bound at 700 for BB and FCP, and at 350 for DD, as no measurements were conducted under the specific conditions corresponding to intervals exceeding these limits, as described in Table 2));
y - the rescaled value.
Scientific research highlights that various aerosol categories have distinct effects on health and the environment. Accordingly, and following the classification described in Section 2.2, we grouped aerosols into three categories for analysis: biomass burning (BB), fine and coarse particles (FCP), and dust dominated (DD), applying tailored rescaling for each. BB and FCP are linked to serious health issues and higher mortality rates, whereas DD aerosols generally cause less severe health effects (Table 1). Their environmental impacts also vary notably. While DD pollution carries risks, especially in dry regions, its overall environmental burden is lower than that of BB and FCP. The latter emit complex toxic substances and have a greater role in climate change, whereas DD primarily increases particulate matter with more localized, milder consequences [5,6,7,8,9,10,11,12,13,14,15,16,17,18,19,20,21,22,23,24,25,26,27]. Reflecting these distinctions and the risk thresholds in Table 2, we rescaled the environmental impact (EI) values for BB and FCP between 100 and 700, and for DD between 100 and 350. This scaling starts at 100, as we excluded pollution-free scenarios, thereby better representing the varying severity of effects among aerosol types.
In addition, to assess the validity of the rescaling approach, we re-applied the standard evaluation method, this time incorporating differentiated weights for each aerosol category. BB and FCP were treated as having the highest relevance in terms of impact (with a score of 1), while DD was assigned gradually increasing scores between 0.1 and 1, reflecting its comparatively lower significance.
To further support the proposed rescaling and the differentiated risk-based scoring system, we also computed a standard statistical metric – the Root Mean Square Error (RMSE). This indicator serves to quantify the discrepancy between the rescaled values and those derived from the application of the integrated method for the aerosol categories examined in this study, offering a reliable and objective mean of assessing the method’s effectiveness. Due to its sensitivity to larger deviations, RMSE penalizes them more heavily, making it particularly suitable for identifying scoring combinations that lead to major inconsistencies – a crucial factor when determining the most appropriate score allocation for each aerosol type. Additionally, RMSE is effective in highlighting scenarios with substantial estimation errors [67,68,69,70,71,72]. The formula used to compute RMSE is presented in Equation 5.
Equation 5. RMSE formula
The amplitude of the distribution was determined based on the specific pollutant category. As previously explained, an EI range of 100 to 700 was assigned for BB and FCP, while a range of 100 to 350 was selected for DD, considering several factors outlined earlier.
This integrated assessment methodology has previously been applied by us using AERONET data over Cluj-Napoca and Iasi, demonstrating its capacity to evaluate pollution risk and differentiate between aerosol types based on optical parameters [56]. In the present study, the method is adapted for field-based measurements using the Calitoo sun photometer, offering new insights based on direct local monitoring.
3. Results and Discussion
3.1. Overview of Aerosol Type Distribution
Depending on the weather conditions, a total of 498 measurements were conducted over 69 days, between April 1, 2024, and November 30, 2024. Of the 498 measurements, 86 were associated with biomass burning (BB), 42 with fine&coarse particles (FCP), 33 with dust dominated (DD), and 4 of them indicated a clean atmosphere (”Clear” category). The remaining 333 measurements were attributed to unidentifiable sources.
The aerosols measured over the study period were primarily dominated by biomass burning particles, which accounted for 52.1% of the total (see ”Biomass fires and pollution” in Figure 3). FCP represented 25.5% of the aerosols, indicating a significant contribution from combustion and urban sources. Dust dominated aerosols comprised 20% of the total measured particles. The assessment was limited to the three main groups, as the role of additional, unclassified sources could not be evaluated with confidence.
3.2. Performance Evaluation Using RMSE
Furthermore, to support the validation of the rescaling method, we employed error analysis using the Root Mean Square Error (RMSE) metric.
The rescaled RMSE% for FCP and BB shows a reduced variation, indicating lower sensitivity to these parameters compared to DD, which significantly influences RMSE. FCP and BB were rescaled between 100 and 700 (justified by the far more severe effects on health and the environment, due to the release of toxic compounds and their stronger contribution to global warming), resulting in a wider amplitude for the FCP and BB variables, which leads to a more attenuated variation of RMSE% in relation to these parameters. In contrast, DD was rescaled between 100 and 350 (due to its comparatively lower and more localized impact on both health and the environment), generating a more sensitive RMSE variation and thus highlighting more clearly the influence of DD fluctuations. The results show that the lowest values of both error metrics (RMSE variation for BB-DD and FCP-DD) were achieved with importance scores of 0.5 and 0.6 for DD, and 1 for BB and FCP (see Figure 4). Similar results were obtained by Tanasa et al., 2025 using data from the AERONET network [56].
The MAC was defined as the maximum AOD value for each pollutant category. As the measurements were not taken under controlled pollution conditions, it was not possible to establish a standardised MAC value. Furthermore, the measurements are significantly affected by local dispersion conditions. For this reason, the RMSE values reported here are slightly higher than those reported by Tanasa et al., who used a solar photometer to perform measurements under the conditions imposed by the AERONET network (i.e. on tall buildings or in areas far from them).
3.3. Environmental Impact Quantification Calculated Using Calitoo Sun Photometer Data
Figure 5, Figure 6 and Figure 7 illustrate the rescaled Environmental Impact (EI) values, calculated based on AOD measurements obtained with the Calitoo photometer, and considering only the categories ”biomass burning”, ”fine&coarse particles”, and ”dust dominated”. The methodology applied for impact quantification is detailed in Section 2 – Materials and Methods.
The distribution of rescaled environmental impacts values for the biomass burning category in Iasi (Figure 5) shows a clear predominance in the minor risk range, accounting for 77.9% of the recorded values. Approximately 20% fall within the 350-700 interval, indicating moderate risks at both acceptable and unacceptable levels, and suggesting a notable environmental burden associated with this aerosol type. The AOD values corresponding to these moderate-impact events range from 0.43 to 0.62, reflecting elevated aerosol concentrations in the atmospheric column. These results emphasize the significant contribution of BB aerosols to local air quality degradation and their potential implications for public health. Consequently, BB represents a key target for local environmental monitoring and risk mitigation strategies.
For the FCP category (Figure 6), the distribution of rescaled environmental impact values shows that 85.7% fall within the minor risk range, associated with AOD values between 0.26 and 0.43. A smaller proportion, 14.3%, indicates moderate risks (500-700), corresponding to AOD values ranging from 0.64 to 0.69. These measurements reflect aerosol pollution from mixed sources such as traffic and industrial activities. The results confirm the significant impact of FCP particles on air quality and emphasize the need for targeted monitoring in urban environments.
For the DD category (Figure 7), all rescaled environmental impact values fall within the minor risk range (100-350), indicating a low impact on air quality. The associated AOD values range from 0.34 to 1.38, reflecting the presence of coarse-mode particles predominantly of natural origin. While generally less toxic than aerosols from anthropogenic sources, such particles may still affect air quality temporarily, depending on atmospheric conditions. The findings suggest that, despite the low direct risk, monitoring these events is important for a comprehensive evaluation of local atmospheric variability.
4. Conclusions
Air quality is a critical factor for public health and environmental protection, and aerosols from various sources contribute differently to associated risks. This study proposed and applied an integrated methodology for assessing environmental impact and risk, based on Aerosol Optical Depth (AOD), measurements collected with the Calitoo photometer in the metropolitan area of Iasi during 2024.
By classifying aerosols into three main categories – biomass burning (BB), fine and coarse particles (FCP), and dust dominated (DD) – the analysis enabled a differentiated evaluation of their influence on air quality. The rescaled impact values showed that BB and FCP were associated with moderate risk episodes, while all DD values remained within the minor risk range. The recorded AOD values supported this differentiation, and RMSE analysis validated the rescaled method used in the assessment.
These findings underscore the importance of integrating AOD into environmental evaluation frameworks and classifying aerosols to better understand pollution dynamics. The proposed methodology offers an effective tool for monitoring, supporting data-driven and locally adapted policy decisions. In the context of urbanization and climate change, such an approach contributes to the development of effective risk reduction strategies and the protection of public health.
Author Contributions
Conceptualization, I.T, M.C. and B.S.; methodology, M.C. and B.S..; software, I.T., M.C., D.B, and W.W.; validation, M.C., W.W and B.S.; formal analysis, D.B. and I.T.; investigation, I.T. and M.C; resources, I.T., B.S.; data curation, M.C., I.T, B.S. and W.W.; writing—original draft preparation, I.T and D.B; writing—review and editing, B.S. and M.C.; visualization, I.T., M.C. and B.S.; supervision, B.S. and M. C.; project administration, M.C. and B.S..; funding acquisition, B.S. All authors have read and agreed to the published version of the manuscript.
Funding
This article is based upon work from the COST ACTION CA 23157 ”European Network for Multiple View Life Cycle Sustainability Assessment – MultiViewLCSA” supported by COST (European Cooperation in Science and Technology).
Data Availability Statement
The raw data supporting the conclusions of this article will be made available by the authors without undue reservation.
Conflicts of Interest
The authors declare no conflicts of interest. The funders had no role in the design of the study; in the collection, analyses, or interpretation of data; in the writing of the manuscript; or in the decision to publish the results.
Abbreviations
The following abbreviations are used in this manuscript:
| AOT | Aerosol Optical Thickness |
| AOD | Aerosol Optical Depth |
| BB | Biomass burning |
| FCP | Fine and coarse particles |
| DD | Desert dust/Dust dominated |
| RMSE | Root mean square error |
References
- World Health Organization. Available online: https://www.who.int/news-room/fact-sheets/detail/ambient-(outdoor)-air-quality-and-health (2024).
- Ministry for the Environment, New Zealand. Available online: https://environment.govt.nz/facts-and-science/air/why-air-quality-matters/ (2023).
- World Health Organization. Available online: https://www.who.int/teams/environment-climate-change-and-health/air-quality-energy-and-health/health-impacts (2024).
- National Air Quality Monitoring Network. Available online: https://www.calitateaer.ro/public/home-page/?__locale=ro (2024).
- Filonchyk, M.; Peterson, M. P.; Zhang, L.; Yan, H. An analysis of air pollution associated with the 2023 sand and dust storms over China: Aerosol properties and PM10 variability. Geoscience Frontiers 2024. [CrossRef]
- Georgakopoulou, V. E.; Taskou, C.; Diamanti, A.; Beka, D.; Papalexis, P.; Trakas, N.; Spandidos, D. A. Saharan dust and respiratory health: Understanding the link between airborne particulate matter and chronic lung diseases (Review). Experimental and Therapeutic Medicine 2024. [CrossRef]
- Sadeghimoghaddam, A.; Khankeh, H.; Norozi, M.; Fateh, S.; Farrokhi, M. Investigating the effects of dust storms on morbidity and mortality due to cardiovascular and respiratory diseases: A systematic review. Journal of Education and Health Promotion 2021. 10.4103/jehp.jehp_1272_20.
- Pardo, M.; Li, C.; He, Q.; Levin-Zaidman, S.; Tsoory, M.; Yu, Q.; Wang, X.; Rudich, Y. Mechanisms of lung toxicity induced by biomass burning aerosols. Particle and Fibre Toxicology 2020. [CrossRef]
- Sigsgaard, T.; Forsberg, B.; Annesi-Maesano, I.; Blomberg, A.; Bølling, A.; Boman, C.; Bønløkke, J.; Brauer, M.; Bruce, N.; Héroux, M. E.; Hirvonen, M. R.; Kelly, F.; Künzli, N.; Lundbäck, B.; Moshammer, H.; Noonan, C.; Pagels, J.; Sallsten, G.; Sculier, J. P.; Brunekreef, B. Health impacts of anthropogenic biomass burning in the developed world. European Respiratory Journal 2015. [CrossRef]
- Assad, N. A.; Kapoor, V.; Sood, A. Biomass smoke exposure and chronic lung disease. Current Opinion in Pulmonary Medicine 2016. 10.1097/MCP.0000000000000246.
- Amnuaylojaroen, T.; Parasin, N. Perspective on Particulate Matter: from biomass burning to the health crisis in Mainland Southeast Asia. Toxics 2023. [CrossRef]
- Sangkham, S.; Phairuang, W.; Sherchan, S. P.; Pansakun, N.; Munkong, N.; Sarndhong, K.; Islam, M. A.; Sakunkoo, P. An update on adverse health effects from exposure to PM2.5. Environmental Advances 2024. [CrossRef]
- FERN. Available online: https://www.fern.org/fileadmin/uploads/fern/Documents/briefingnote%20burning%20biomass.pdf (2025).
- Yin, S. Effect of biomass burning on premature mortality associated with long-term exposure to PM2.5 in Equatorial Asia. Journal of Environmental Management 2023. [CrossRef]
- Water and Air Quality Bureau, Health Canada. Available online: https://www.canada.ca/en/health-canada/services/publications/healthy-living/human-health-effects-wildfire-smoke.html (2025).
- Karanasiou, A.; Alastuey, A.; Amato, F.; Renzi, M.; Stafoggia, M.; Tobias, A.; Reche, C.; Forastiere, F.; Gumy, S.; Mudu, P.; Querol, X. Short-term health effects from outdoor exposure to biomass burning emissions: A review. Science of The Total Environment 2021. [CrossRef]
- Habybabady, R. H.; Sis, H. N.; Paridokht, F.; Ramrudinasab, F.; Behmadi, A.; Khosravi, B.; Mohammadi, M. Effects of dust exposure on the respiratory health symptoms and pulmonary functions of street sweepers. The Malaysian Journal of Medical Science 2018. [CrossRef]
- Ealo, M.; Alastuey, A.; Ripoll, A.; Pérez, N.; Minguillón, M. C.; Querol, X.; Pandolfi, M. Detection of Saharan dust and biomass burning events using near-real-time intensive aerosol optical properties in the north-western Mediterranean. Atmospheric Chemistry and Physics 2016. [CrossRef]
- Bauer, S. E.; Im, U.; Mezuman, K.; Gao, C. Y. Desert dust, industrialization, and agricultural fires: health impacts of outdoor air pollution in Africa. Journal of Geophysical Research: Atmospheres 2019. [CrossRef]
- Zhou, D.; Ding, K.; Huang, X.; Liu, L.; Liu, Q.; Xu, Z.; Jiang, F.; Fu, C.; Ding, A. Transport, mixing and feedback of dust, biomass burning and anthropogenic pollutants in eastern Asia: a case study. Atmospheric Chemistry and Physics 2018. [CrossRef]
- Dong, X.; Fu, J. S.; Huang, K.; Zhu, Q.; Tipton, M. Regional climate effects of biomass burning and dust in East Asia: Evidence from modeling and observation. Geophysical Research Letters 2019. [CrossRef]
- Gama, C.; Pio, C.; Monteiro, A.; Russo, M.; Fernandes, A. P.; Borrego, C.; Baldasano, J. M.; Tchepel, O. Comparison of methodologies for assessing desert dust contribution to regional PM10 and PM2.5 levels: a one-year study over Portugal. Atmosphere 2020. [CrossRef]
- Chen, J.; Li, C.; Ristovski, Z.; Milic, A.; Gu, Y.; Islam, M. S.; Wang, S.; Hao, J.; Zhang, H.; He, C.; Guo, H.; Fu, H.; Miljevic, B.; Morawska, L; Thai, P.; LAM, Y. F.; Pereira, G.; Ding, A.; Huang, X.; Dumka, U. C. A review of biomass burning: Emissions and impacts on air quality, health and climate in China. Science of The Total Environment 2017. [CrossRef]
- Ramachandran, S.; Sristava, R. Mixing states of aerosols over four environmentally distinct atmospheric regimes in Asia: coastal, urban, and industrial locations influenced by dust. Environmental Science and Pollution Research 2016. [CrossRef]
- Gidarakou, M.; Papayannis, A.; Kokkalis, P.; Evangeliou, N.; Vratolis, S.; Remoundaki, E.; Zwaaftink, C. G.; Eckhardt, S.; Veselovskii, I.; Mylonaki, M.; Argyrouli, A.; Eleftheriadis, K.; Solomos, S.; Gini, M. I. Optical and microphysical properties of the aerosols during a rare event of biomass-burning mixed with polluted dust. Atmosphere 2024. [CrossRef]
- Kelly, F. J.; Fussell, J. C. Global nature of airborne particle toxicity and health effects: a focus on megacities, wildfires, dust storms and residential biomass burning. Toxicology Research 2020. [CrossRef]
- Luo, X-S.; Huang, W.; Guofeng, S.; Yuting, P.; Tang, M.; Li, W.; Zhao, Z.; Li, H.; Wei, Y.; Xie, L.; Mehmood, T. Source differences in the components and cytotoxicity of PM2.5 from automobile exhaust, coal combustion, and biomass burning contributing to urban aerosol toxicity. Atmospheric Chemistry and Physics 2024. [CrossRef]
- H. Brown, X. Liu, R. Pokhrel, S. Murphy, Z. Lu, R. Saleh, T. Mielonen, H. Kokkola, T. Bergman, G. Myhre, R. B. Skeie, D. Watson-Paris, P. Stier, B. Johnson, N. Bellouin, M. Schulz, V. Vakkari, J. P. Beukes, P. G. van Zyl, S. Liu, D. Chand, Biomass burning aerosols in most climate models are too absorbing, Nature Communications (2021). [CrossRef]
- C. Liu, C. E. Chung, F. Zhang, Y. Yin, The colors of biomass burning aerosols in the atmosphere, Scientific reports (2016). [CrossRef]
- Health risk assessment of air pollution - general principles, Copenhagen: WHO Regional Office for Europe 2016.
- Gilardi, L.; Marconcini, M.; Metz-Marconcini, A.; Esch, T.; Erbertseder, T. Long-term exposure and health risk assessment from air pollution: impact of regional scale mobility. International Journal of Health Geographics 2023. [CrossRef]
- Bhat, T. H.; Jiawen, G.; Farzaneh, H. Air Pollution Health Risk Assessment (AP-HRA), Principles and Applications. International Journal of Environmental Research and Public Health 2021. [CrossRef]
- United States Environmental Protection Agency. Available online: https://www.epa.gov/air-quality-management-process/managing-air-quality-human-health-environmental-and-economic (2024).
- Matandirotya, N. R.; Anoruo, C. M. An assessment of aerosol optical depth over three AERONET sites in South Africa during the year 2020. Scientific African 2023. [CrossRef]
- Gharibzadeh, M.; Alam, K.; Abedini, Y.; Bidokhti, A. A. Classification of aerosols using multiple clustering techniques over Zanjan, Iran, during 2010-2014. E3S Web of Conferences 99 2019. [CrossRef]
- Xun, L.; Lu, H.; Qian, C.; Zhang, Y.; Lyu, S.; Li, X. Analysis of Aerosol Optical Depth from Sun Photometer at Shouxian, China. Atmosphere 2021. [CrossRef]
- Chen, L.; Zhang, L.; She, Y.; Zeng, Z.; Zheng, Y.; Tian, B.; Zhang, W.; Liu, Z.; Che, H.; Ding, M. Measurement report: Analysis of aerosol optical depth variation at Zhongshan Station in Antarctica. Atmospheric Chemistry and Physics 2025. [CrossRef]
- EUMETSAT. Available online: https://www.eumetsat.int/S3-AOD (2024).
- Zhang, L.; Wang, X.; Huang, G.; Zhang, S. Comprehensive Assessment and Analysis of the Current Global Aerosol Optical Depth Products. Remote Sensing 2024. [CrossRef]
- Di Antonio, L.; Di Biagio, C.; Foret, G.; Formenti, P.; Siour, G.; Doussin, J. F.; Beekmann, M. Aerosol optical depth climatology from the high-resolution MAIAC product over Europe: differences between major European cities and their surrounding environments. Atmospheric Chemistry and Physics 2023. [CrossRef]
- Glantz, P.; Freud, E.; Johansson, C.; Noone, K. J.; Tesche, M. Trends in MODIS and AERONET derived aerosol optical thickness over Northern Europe. Tellus B: Chemical and Physical Meteorology 2019. 10.1080/16000889.2018.1554414.
- Caburao, E. A. What is environmental risk assessment?. Safety Culture 2024.
- European Food Safety Authority. Available online: https://www.efsa.europa.eu/en/topics/topic/environmental-risk-assessment (2024).
- Jagals, P.; Kim, I.; Brereton, C.; Lau, C. L. Assessment of environmental impacts on health: examples from the Pacific Basin. Annals of Global Health 2022. [CrossRef]
- Ezinne, O.; Okeke, O.; Irefin, M. O.; Ezeala, H. I.; Amadi, C. Environmental impact assessment and environmental risk assessment: review of concepts, steps and significance. IIARD International Journal of Geography and Environmental Management 2023. [CrossRef]
- Caetano, N. S.; Martins, F.; Oliveira, G. M. Life cycle assessment of renewable energy technologies. The Renewable Energy-Water-Environment Nexus 2024. [CrossRef]
- Zeleňáková, M.; Zvijáková, L.; Peptenatu, D.; Pintilii, R. D. Risk analysis within environmental impact assessment-a review. 14th International Multidisciplinary Scientific GeoConference SGEM 2014. 10.5593/sgem2017/51/S20.109.
- Tanasa, I.; Cazacu, M.; Sluser, B. Air Quality Integrated Assessment: Environmental Impacts, Risks and Human Health Hazards. Applied Sciences 2023, 13(2). [CrossRef]
- AERONET. Available online: https://aeronet.gsfc.nasa.gov/ (2024).
- IQAir. Available online: https://www.iqair.com (2024).
- Civitas. Available online: https://civitas.eu/cities/iasi (2024).
- Britannica. Available online: https://www.britannica.com/ (2025).
- Calitoo SunPhotometer User Manual, Tenum (2013).
- Calitoo Sun Photometer. Available online: https://www.calitoo.fr/index.php?page=en (2025).
- The Globe Program. Available online: https://www.globe.gov/globe-community/blogs/community-blogs/-/blogs/38286100/maximized (2025).
- Tanasa, I.; Cazacu, M.; Botan, D.; Atkinson, J.D.; Sebestyen, V.; Sluser, B. From Aerosol Optical Depth to Risk Assessment: A Novel Framework for Environmental Impact Statistics of Air Quality Using AERONET. Environments 2025, 12, 285. [CrossRef]
- TENUM. Calitoo SunPhotometer – User Manual, Version 3.0; Toulouse, France, October 2020. Available online: https://www.calitoo.fr/.
- Derimian, Y. Aerosol Classification Diagram. Laboratoire d’Optique Atmosphérique (LOA), Lille, France, 2016. Referenced in: Calitoo SunPhotometer User Manual, Version 3.0, TENUM, 2020.
- Bayat, A., & Assarenayati, A. (2023). How to Measure the Amount of Aerosol Optical Thickness in the Atmosphere in a Simple Way: A Calitoo Handheld Sun-Photometer Measurement. Atmospheric Environment, 295, 119570. [CrossRef]
- Cazorla, A.; Bahadur, R.; Suski, K. J.; Cahill, J. F.; Chand, D.; Schmid, B.; Ramanathan, V.; Prather, K. A. Relating aerosol absorption due to soot, organic carbon, and dust to emission sources determined from in-situ chemical measurements. Atmospheric Chemistry and Physics 2013, 13, 9337-9350. [CrossRef]
- Russell, P. B.; Bergstrom, R. W.; Shinozuka, Y.; Clarke, A. D.; DeCarlo, P. F.; Jimenez, J. L.; Livingston, J. M.; Redemann, J.; Holben, B; Dubovik, O. et al. Absorption Angstrom Exponent in AERONET and related data as an indicator of aerosol composition. Atmospheric Chemistry and Physics 2010, 10, 1155-1169. [CrossRef]
- Robu, B.; Macoveanu, M. Evaluari de Mediu pentru Dezvoltare Durabila (Environmental Assessments for Sustainable Development); EcoZone: Iasi, Romania, 2010.
- B. Slușer, O. Plavan, C. Teodosiu, Environmental Impact and Risk Assessment, In Assessing Progress Towards Sustainability, Elsevier Ed. (2022).
- Neamtu, R.; Sluser, B.; Plavan, O.; Teodosiu, C. Environmental monitoring and impact assessment of Prut River cross-border pollution. Environmental Monitoring and Assessment, 2021, 193.
- Zait, R.; Fighir, D.; Sluser, B.; Plavan, O.; Teodosiu, C. Priority Pollutants Effects on Aquatic Ecosystems Evaluated through Ecotoxicity, Impact, and Risk Assessments. Water 2022, 14(20):3237. [CrossRef]
- Zait, R.; Sluser, B.; Fighir, D.; Plavan, O.; Teodosiu, C. Priority Pollutants Monitoring and Water Quality Assessment in the Siret River Basin, Romania. Water, 2022, 14(1):129. [CrossRef]
- Chai, T.; Draxler, R. R. Root mean square error (RMSE) or mean absolute error (MAE)? - Arguments against avoiding RMSE in the literature. Geoscientific Model Development 2014. [CrossRef]
- Hodson, T. O. Root-mean-square error (RMSE) or mean absolute error (MAE): when to use them or not. Geoscientific Model Development 2022. [CrossRef]
- ASHRAE. ASHRAE Guideline 14-2002: Measurement of Energy and Demand Savings. American Society of Heating, Refrigerating and Air-Conditioning Engineers. Available online: https://www.ashrae.org/technical-resources/bookstore/guideline-14-2002 (2025).
- Efficiency Valuation Organization (EVO), 2017. International Performance Measurement and Verification Protocol: Concepts and options for determining energy and water savings – Volume I (IPMVP). Available online: https://evo-world.org/en/products-services-mainmenu-en/protocols/ipmvp.
- Coakley, D.; Raftery, P.; Keane, M. A review of methods to match building energy simulation models to measured data. Renewable and Sustainable Energy Reviews 2014. [CrossRef]
- Hyndman, R. J.; Koehler, A. B. Another look at measures of forecast accuracy. International Journal of Forecasting 2006. [CrossRef]
Figure 1.
Site boundaries and Iasi city air quality monitoring network.
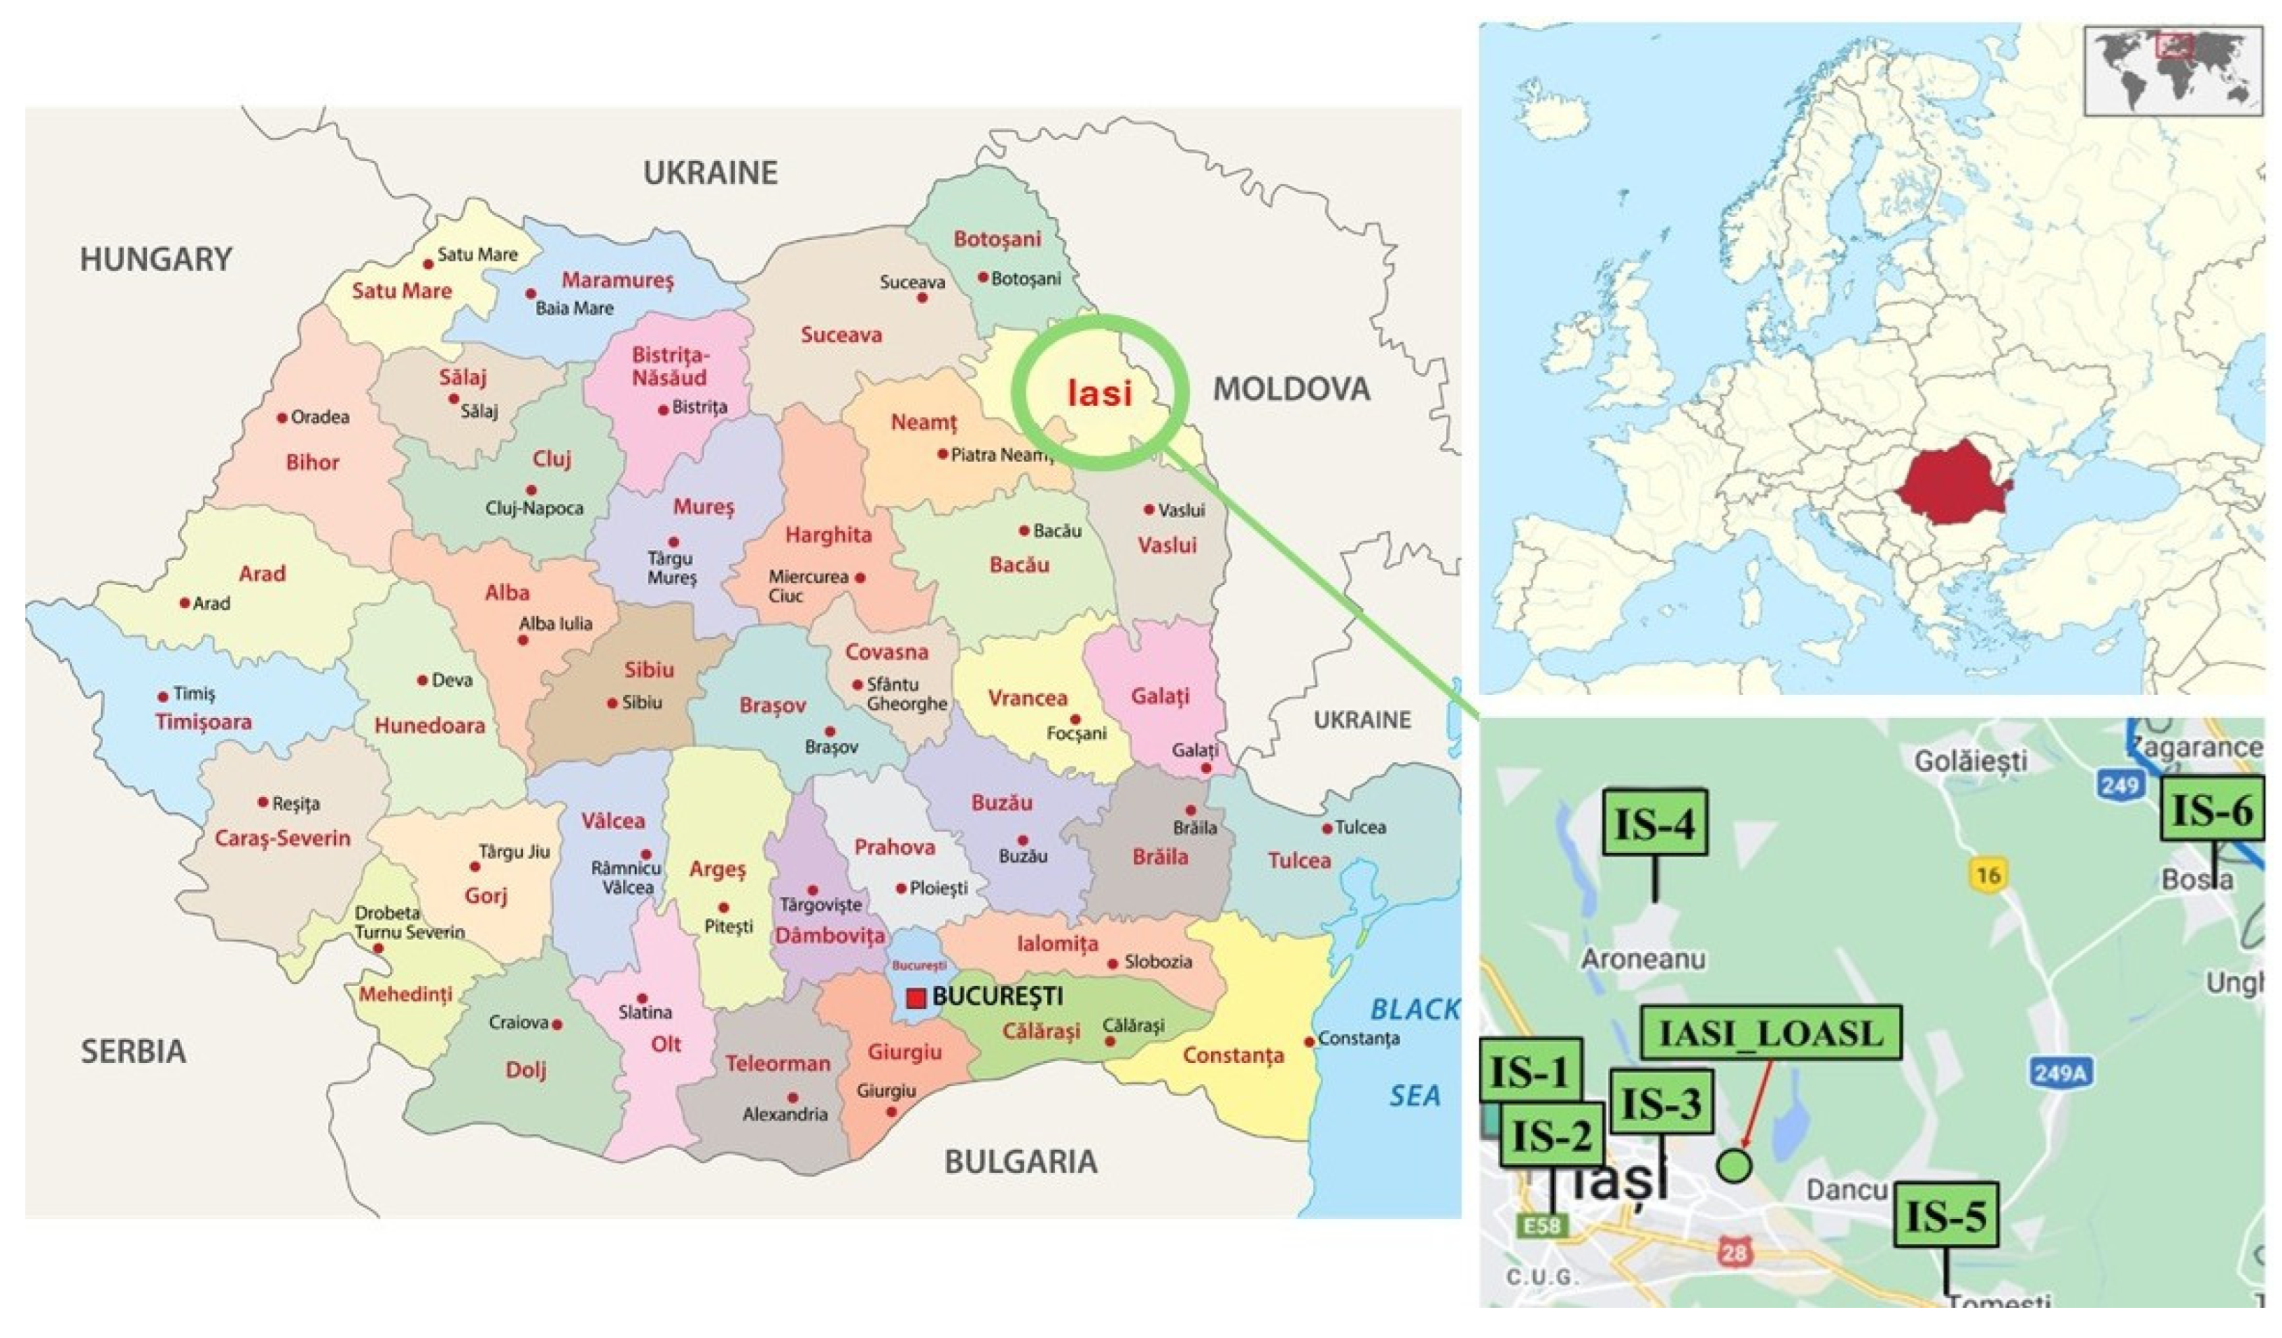
Figure 2.
Calitoo photometer in measurement mode (original photo).
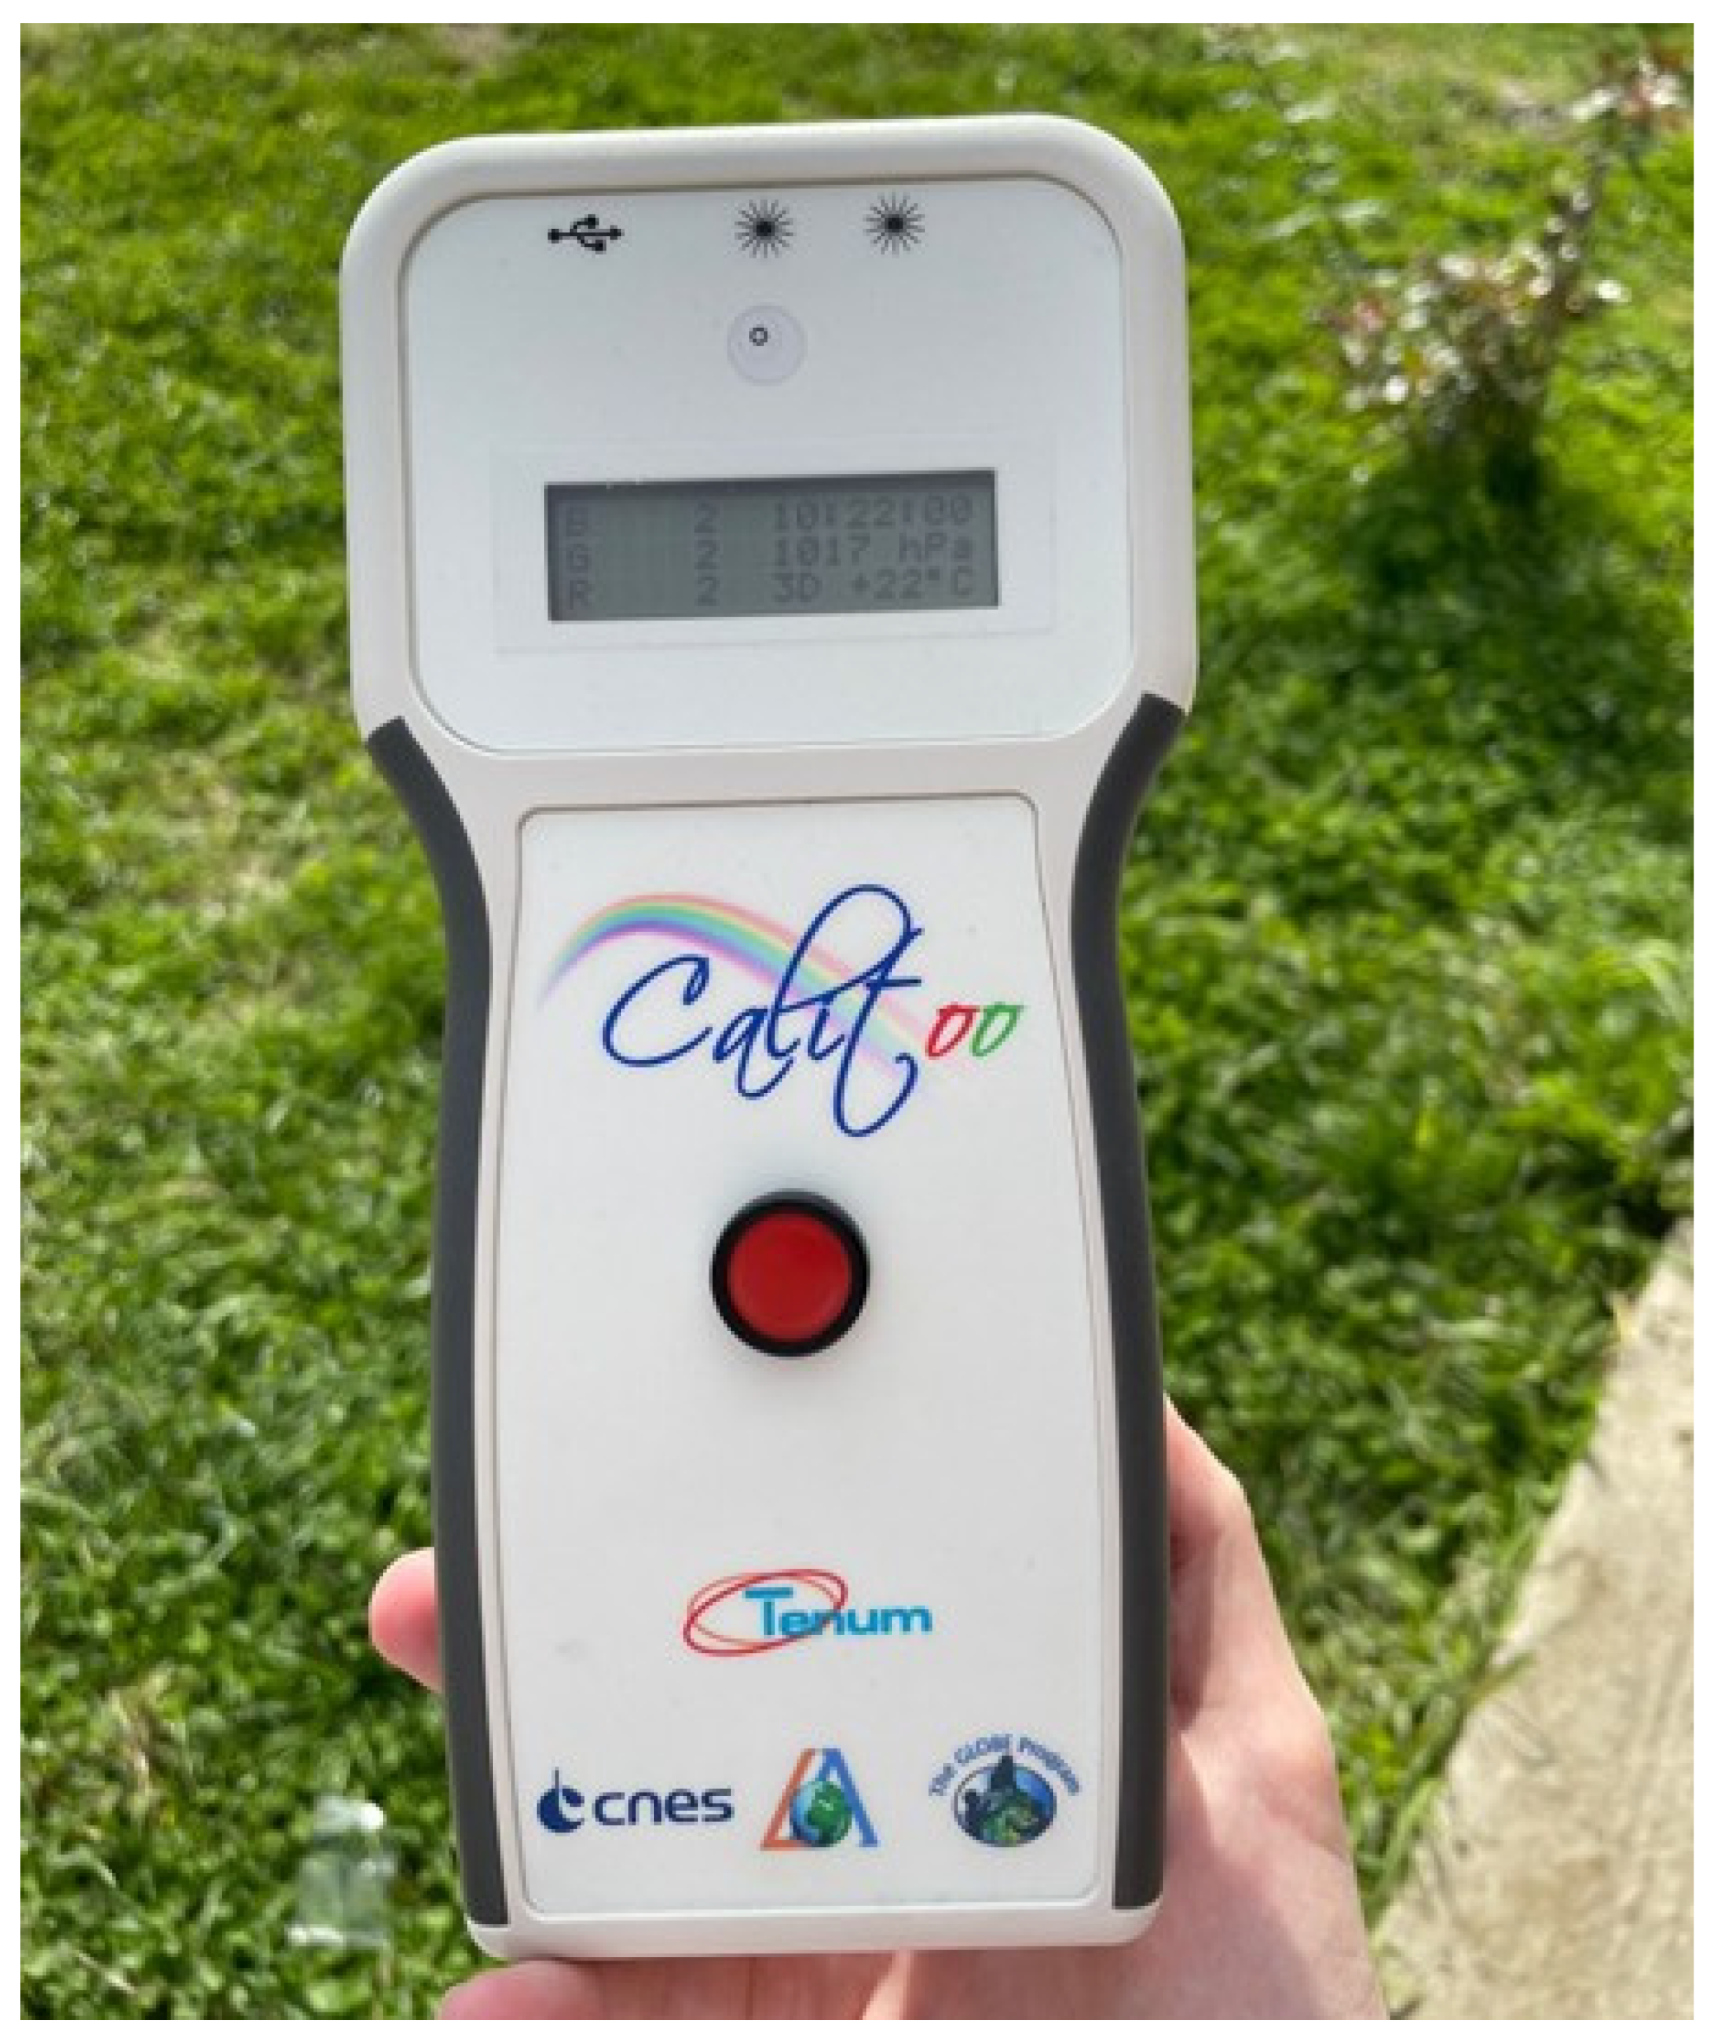
Figure 3.
Aerosol type distribution (Iasi, 2024).
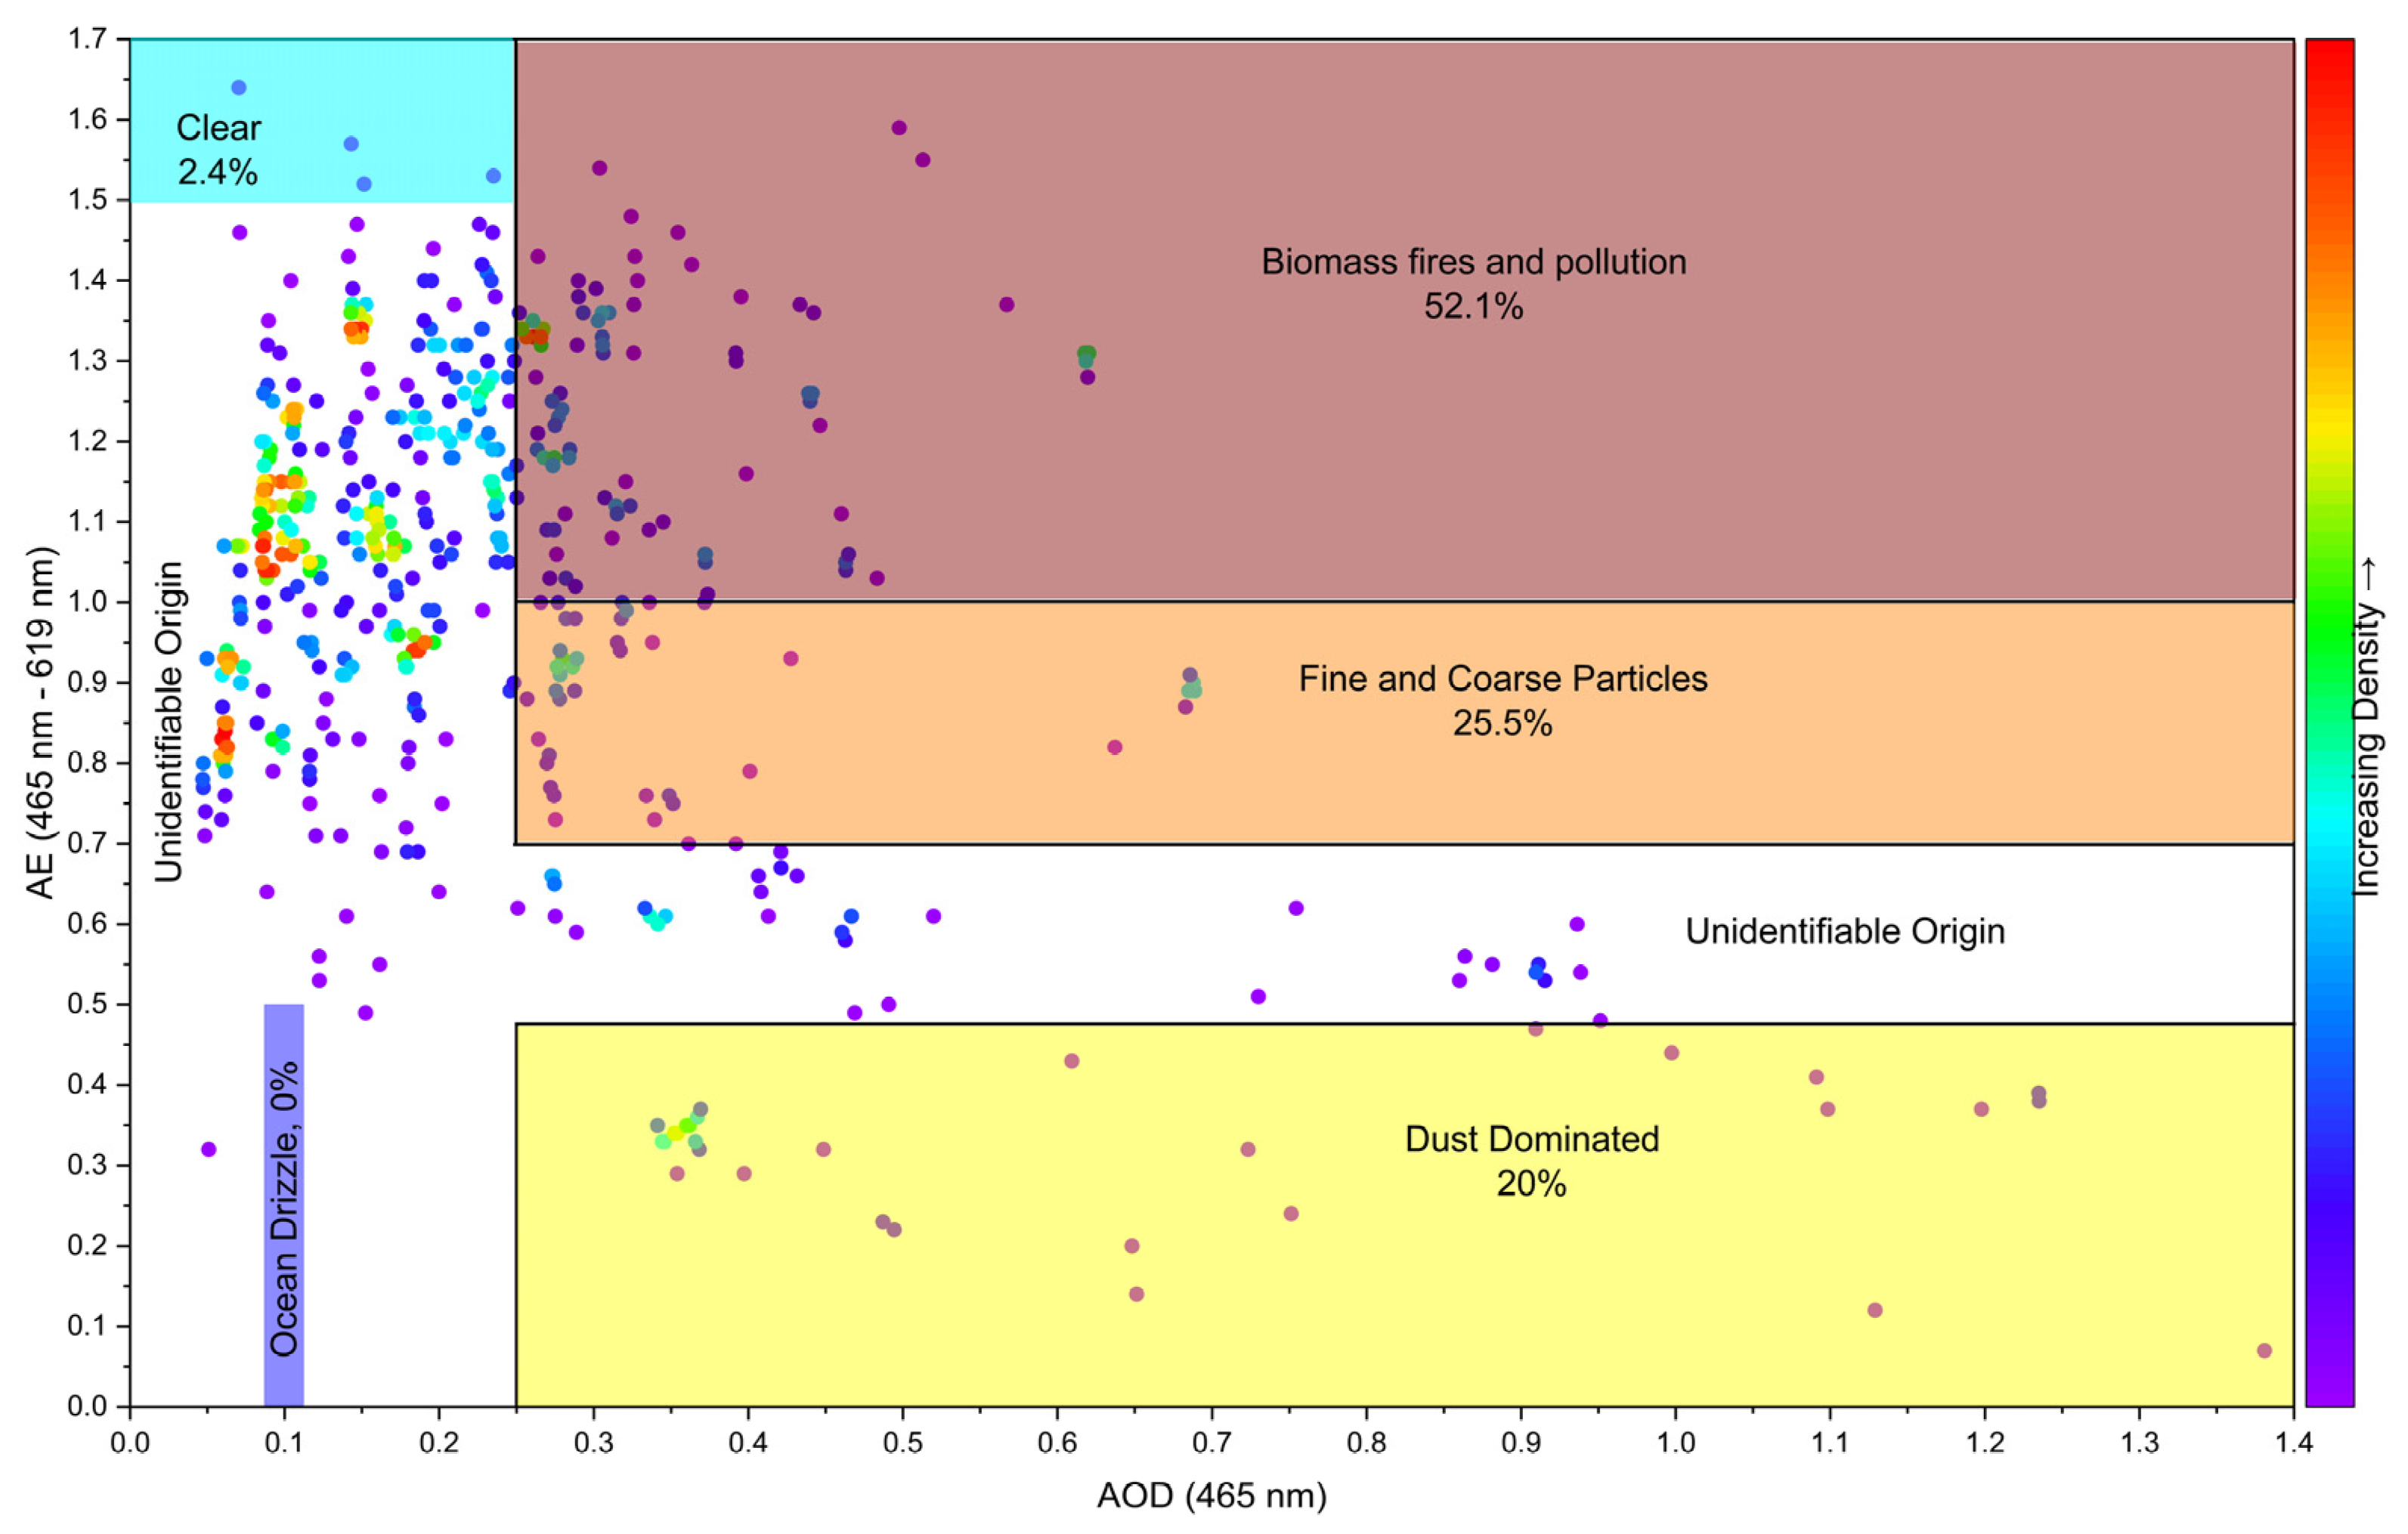
Figure 4.
(a) RMSE variation for BB-DD; (b) RMSE variation for FCP-DD.
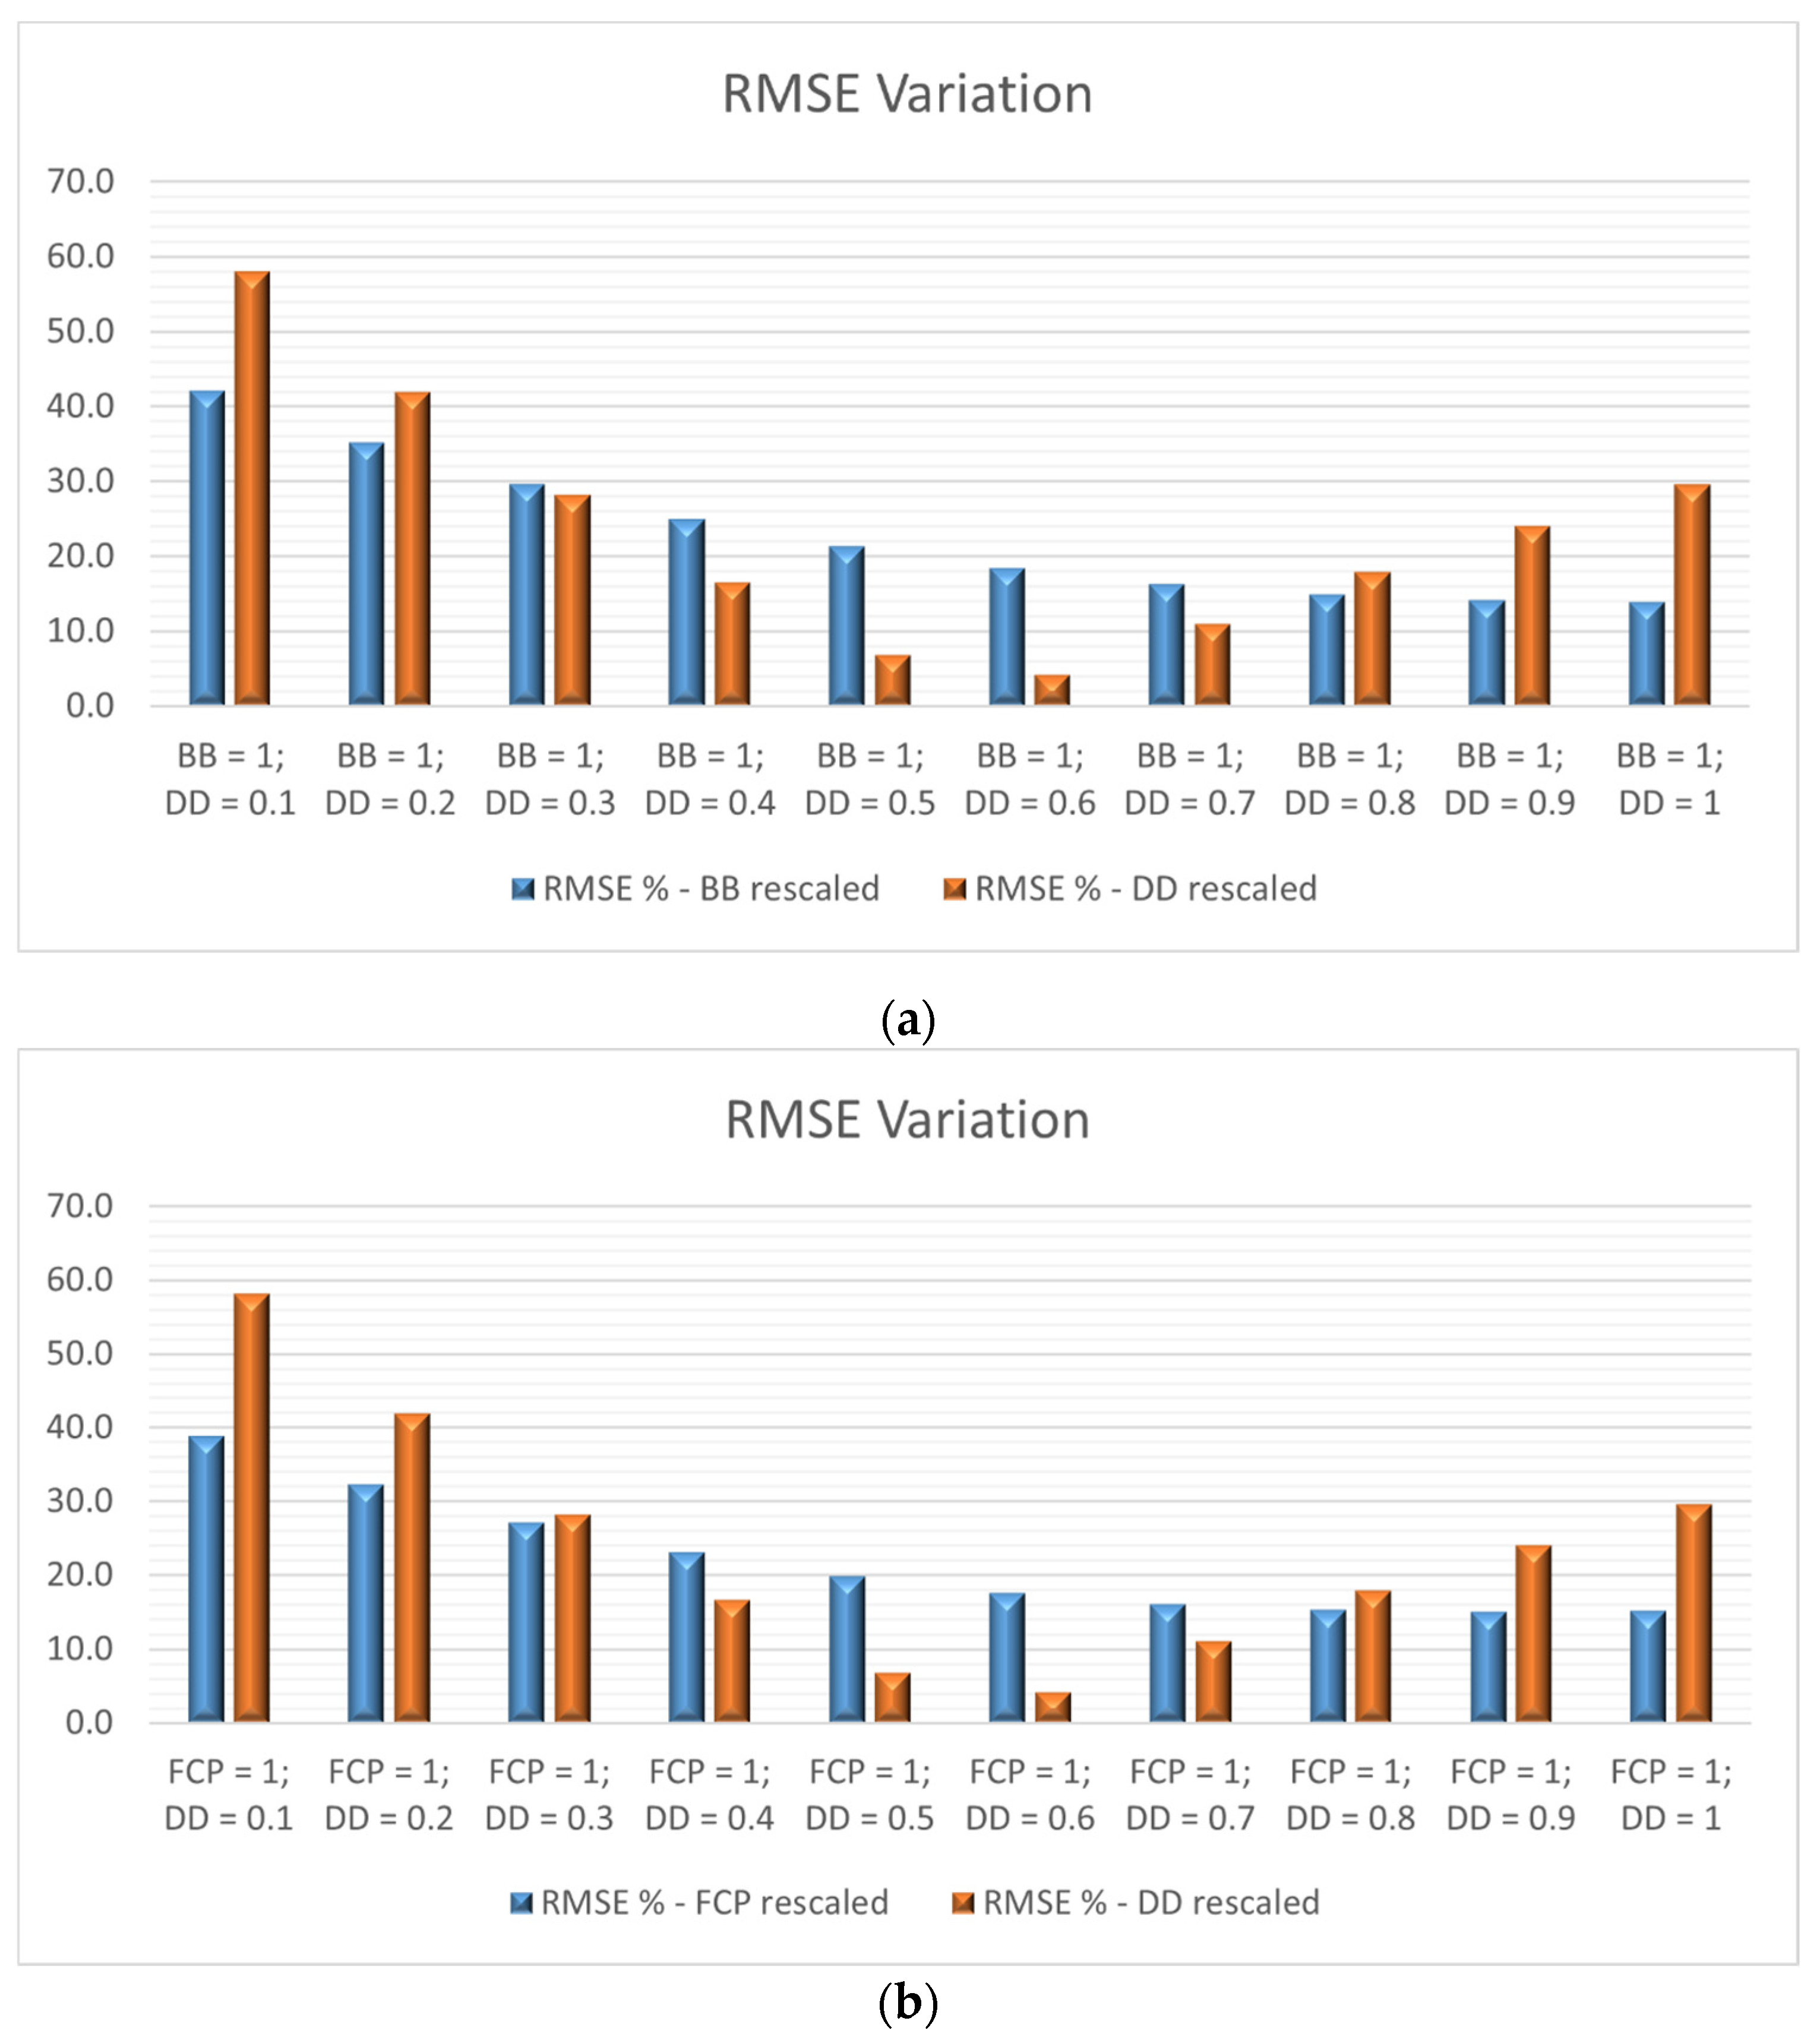
Figure 5.
Environmental impact quantification statistics for biomass burning category (BB) – Iasi, 2024.
Figure 5.
Environmental impact quantification statistics for biomass burning category (BB) – Iasi, 2024.
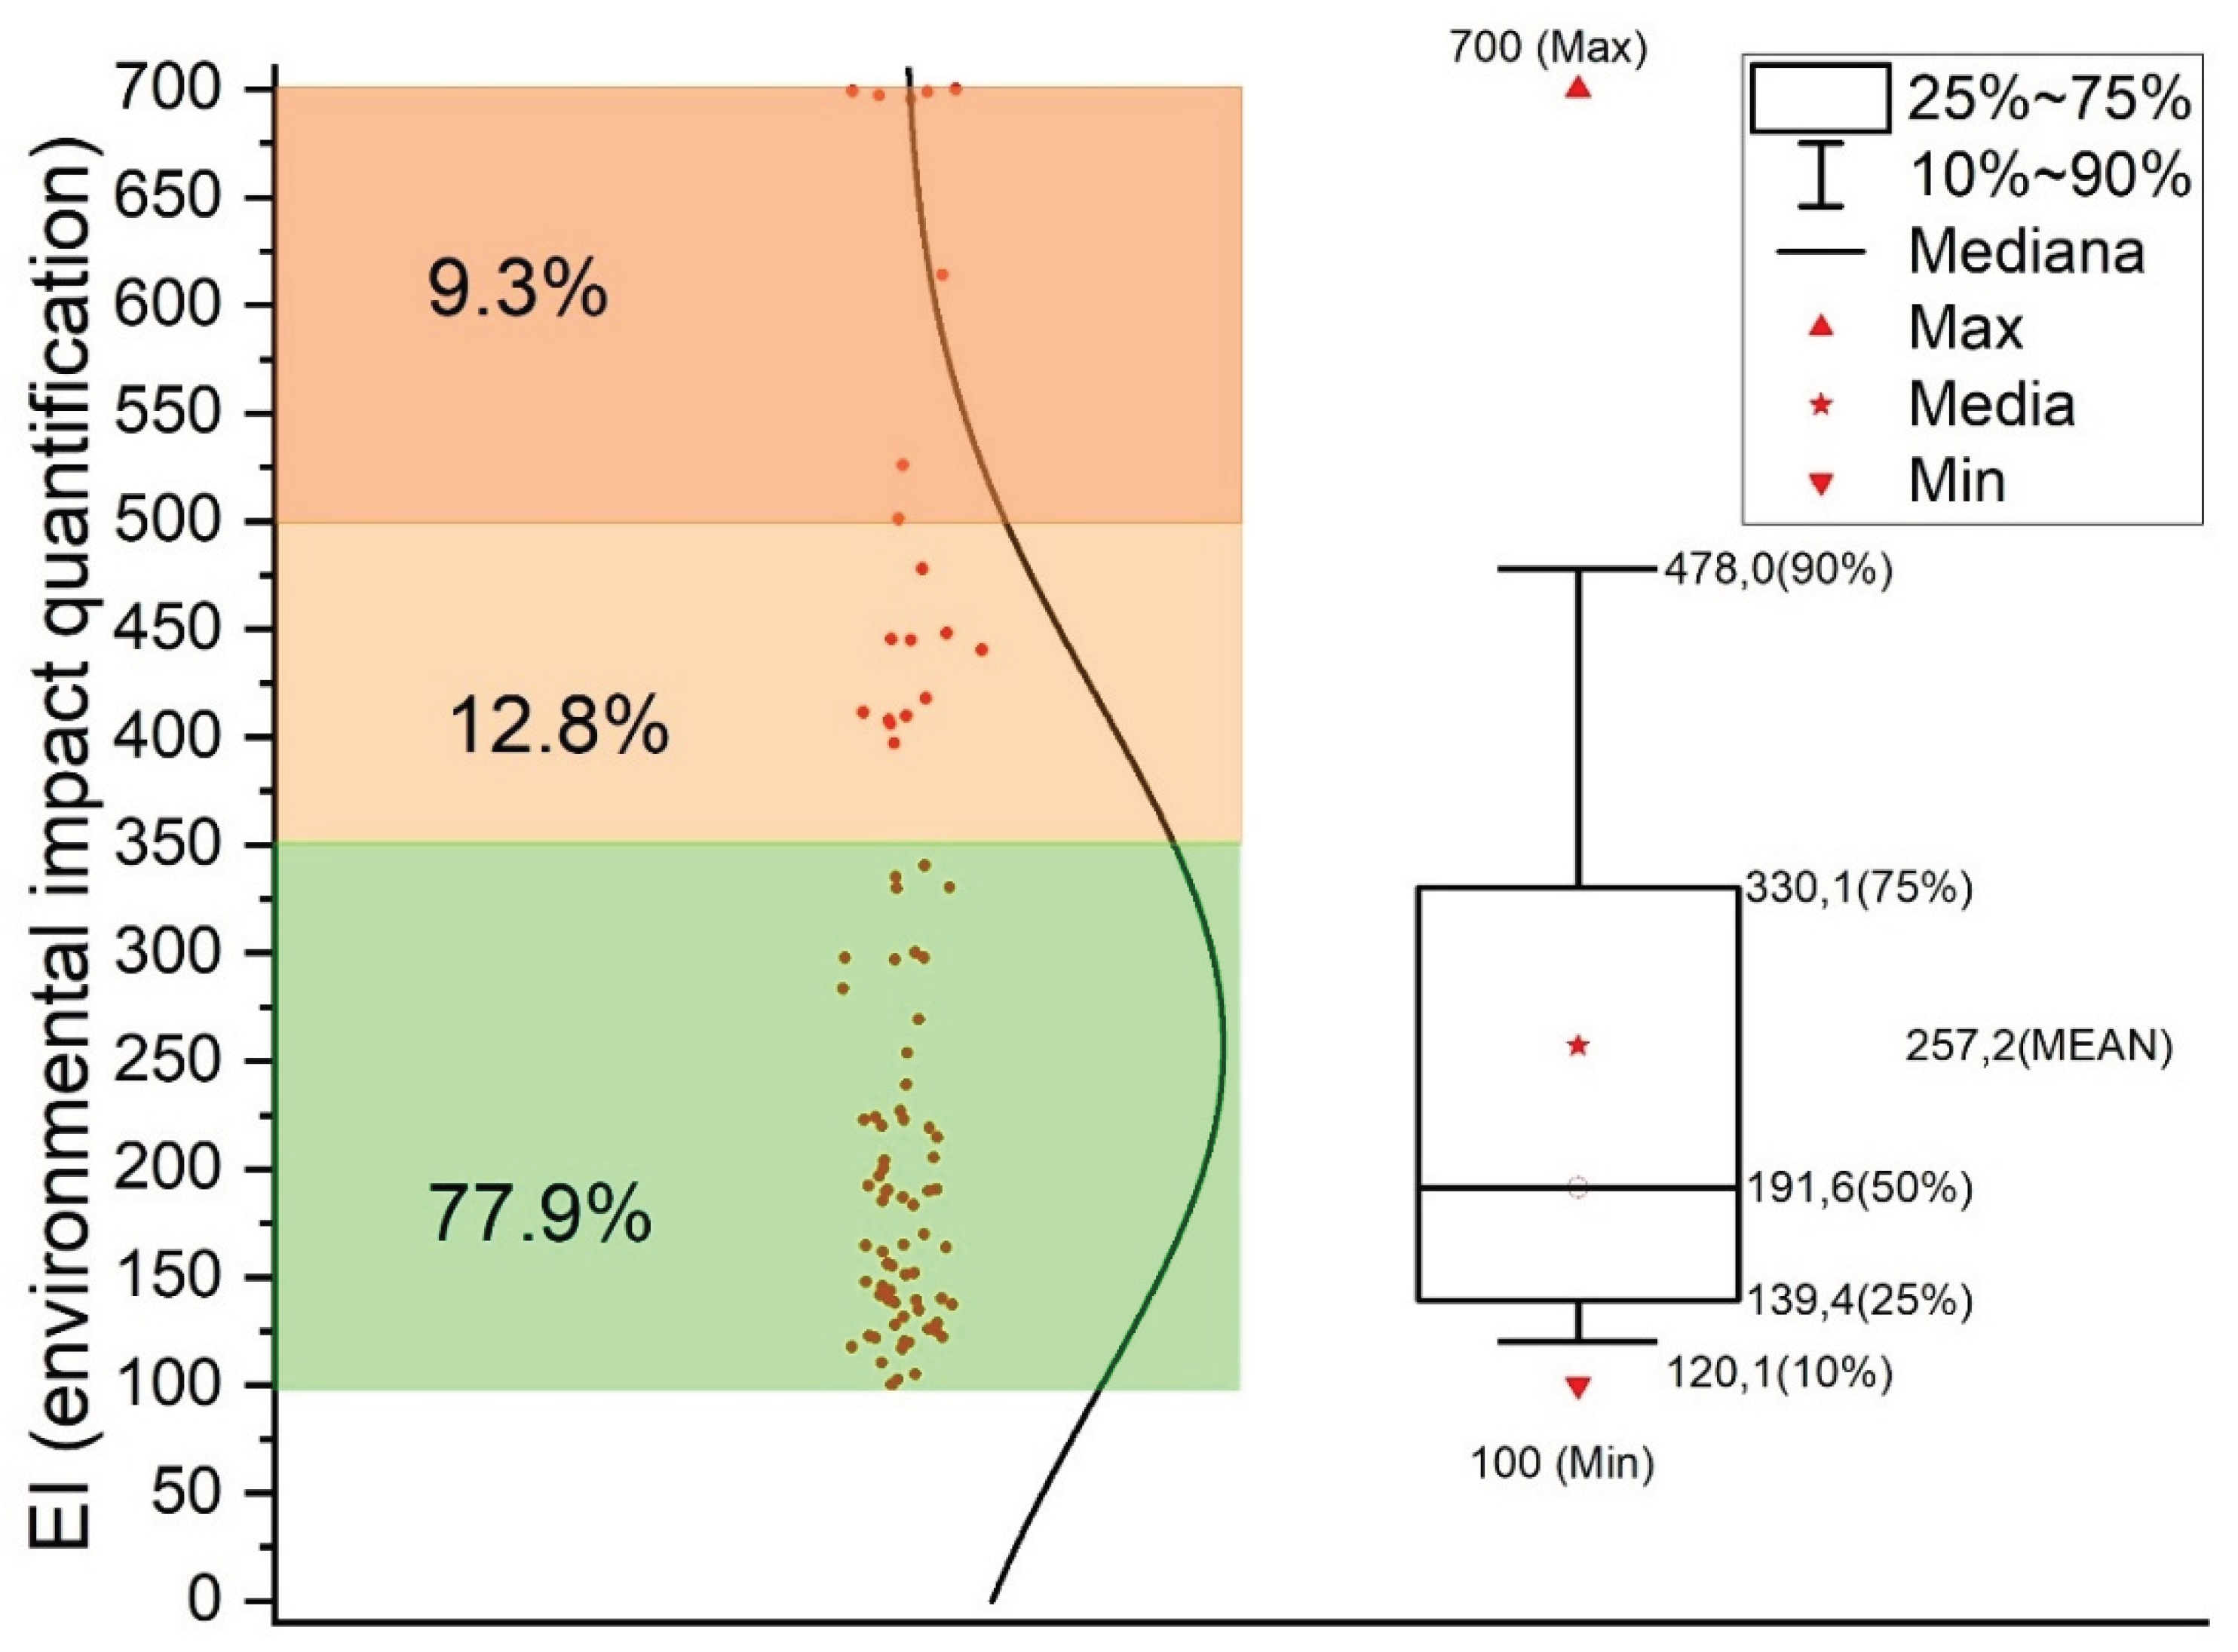
Figure 6.
Environmental impact quantification statistics for fine&coarse particles category (FCP) – Iasi, 2024.
Figure 6.
Environmental impact quantification statistics for fine&coarse particles category (FCP) – Iasi, 2024.
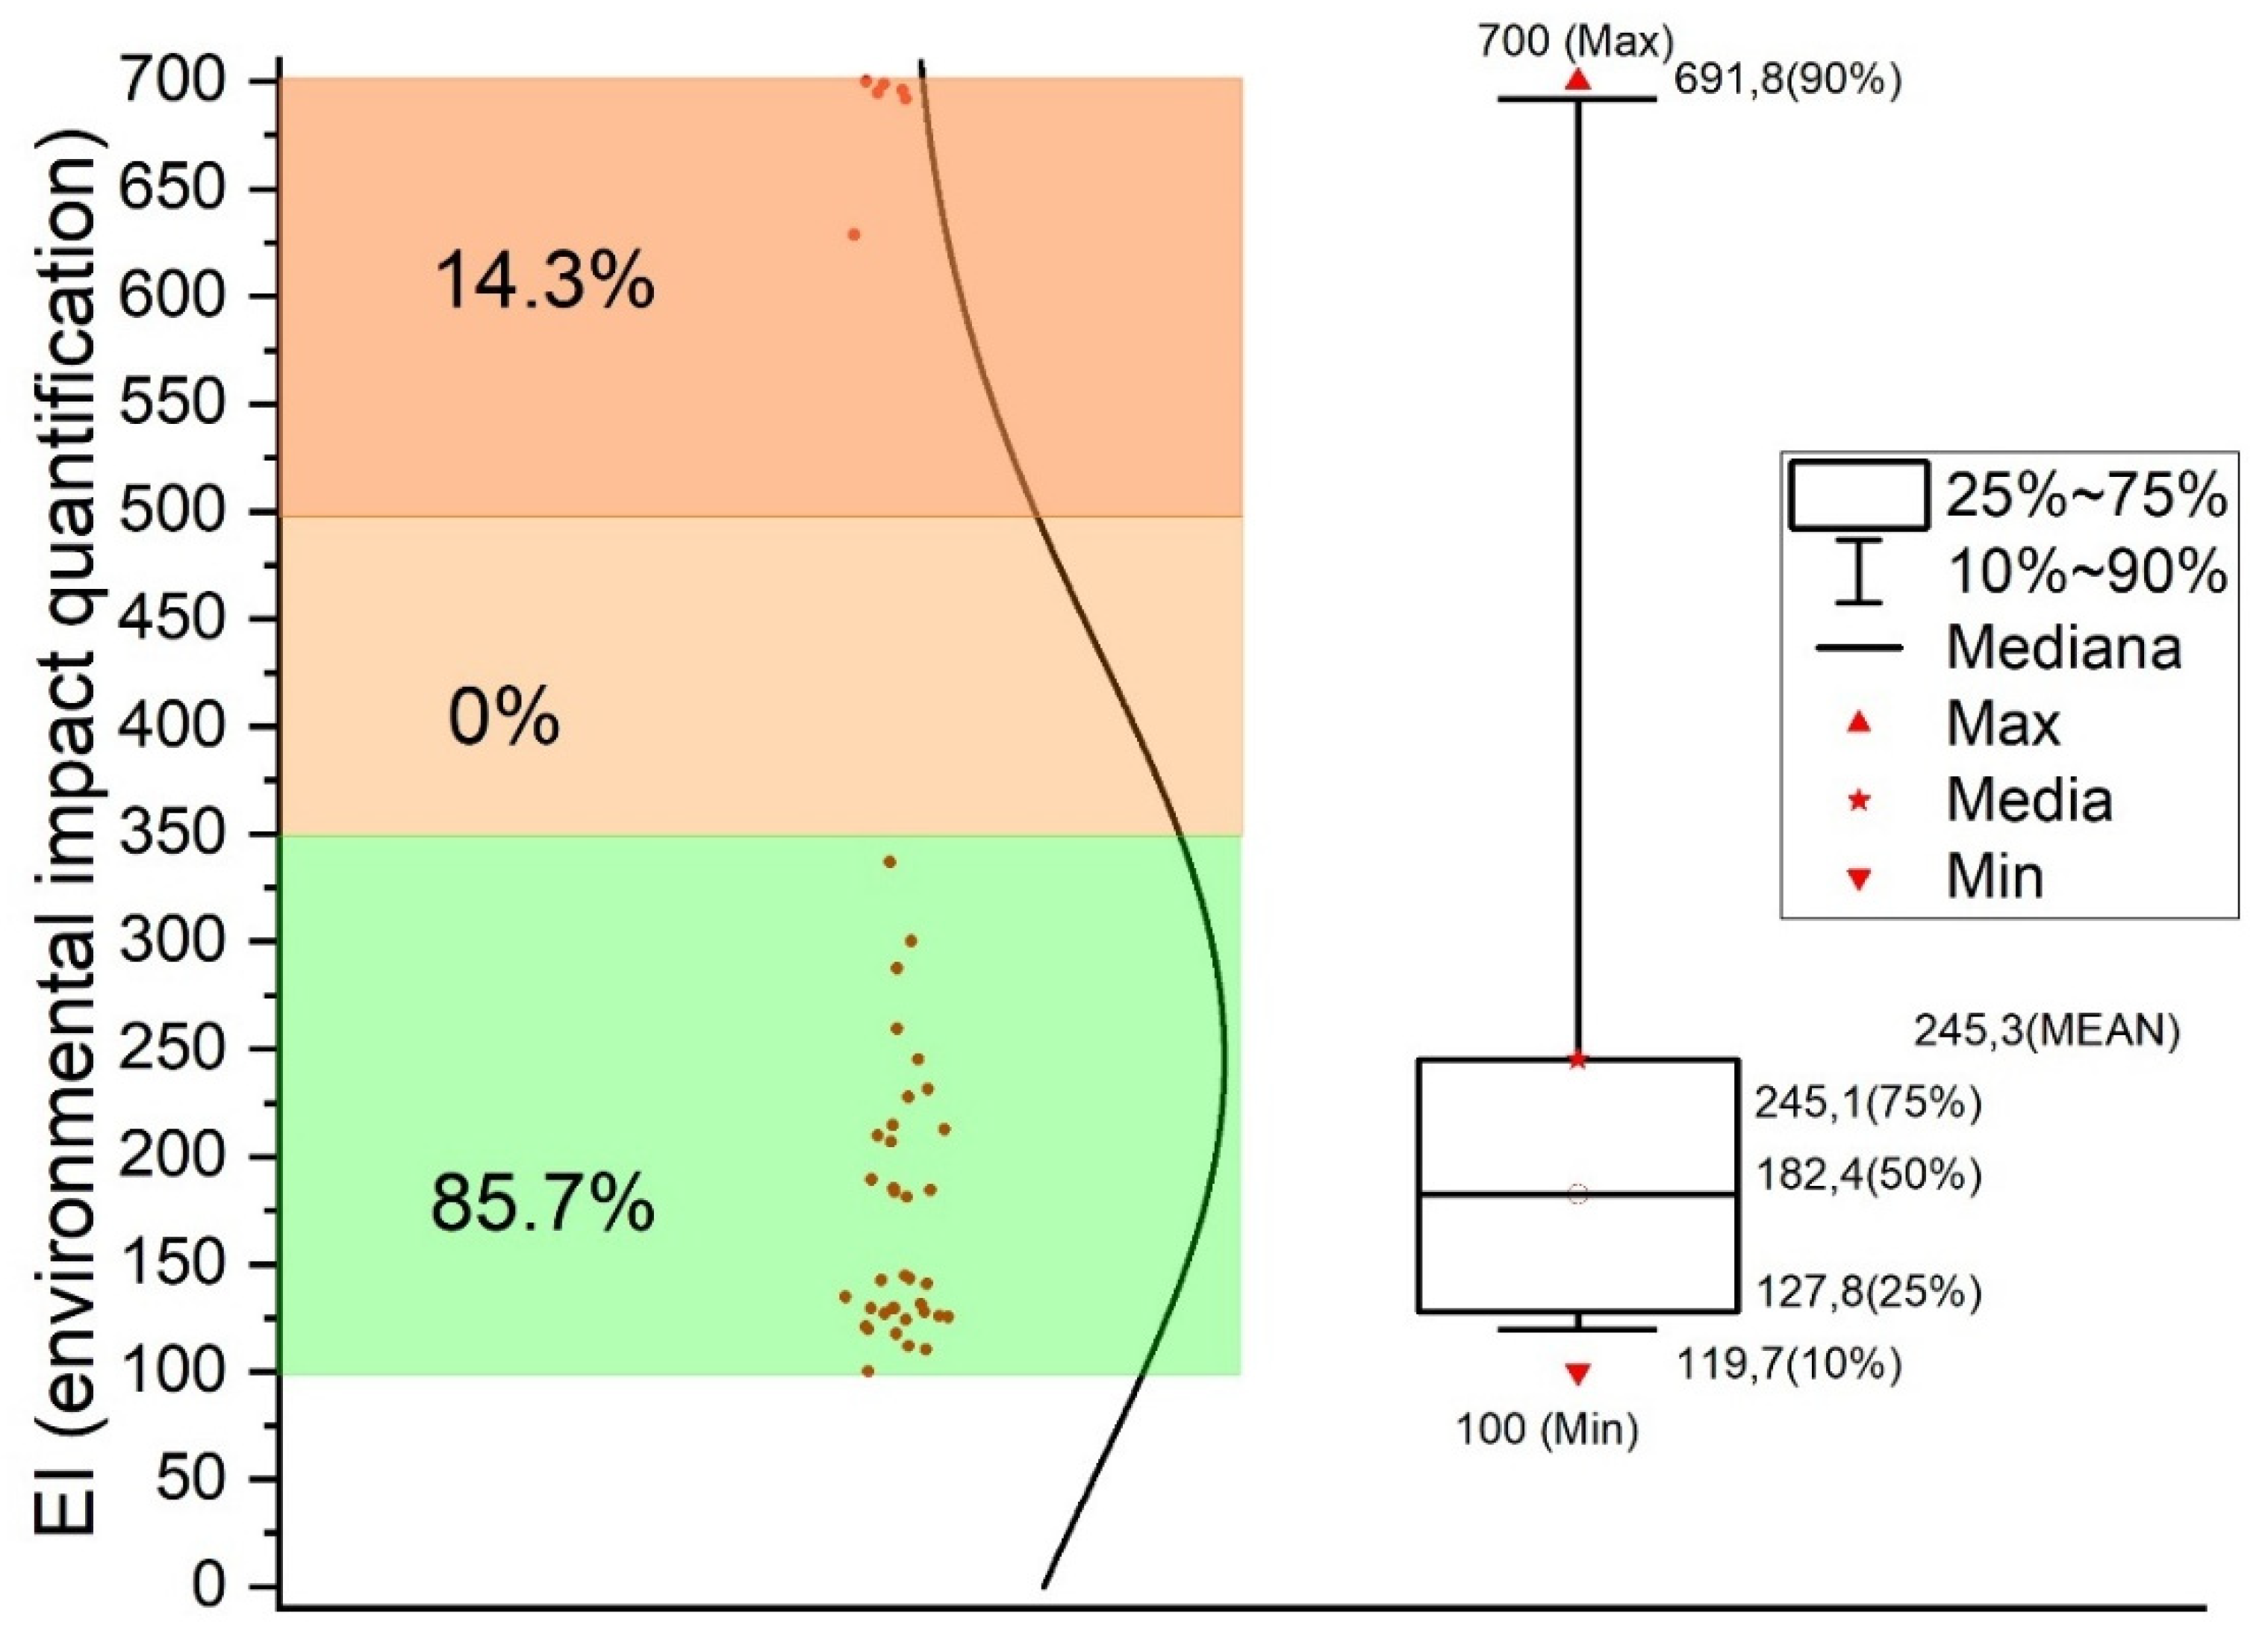
Figure 7.
Environmental impact quantification statistics for dust dominated category (DD) – Iasi, 2024.
Figure 7.
Environmental impact quantification statistics for dust dominated category (DD) – Iasi, 2024.
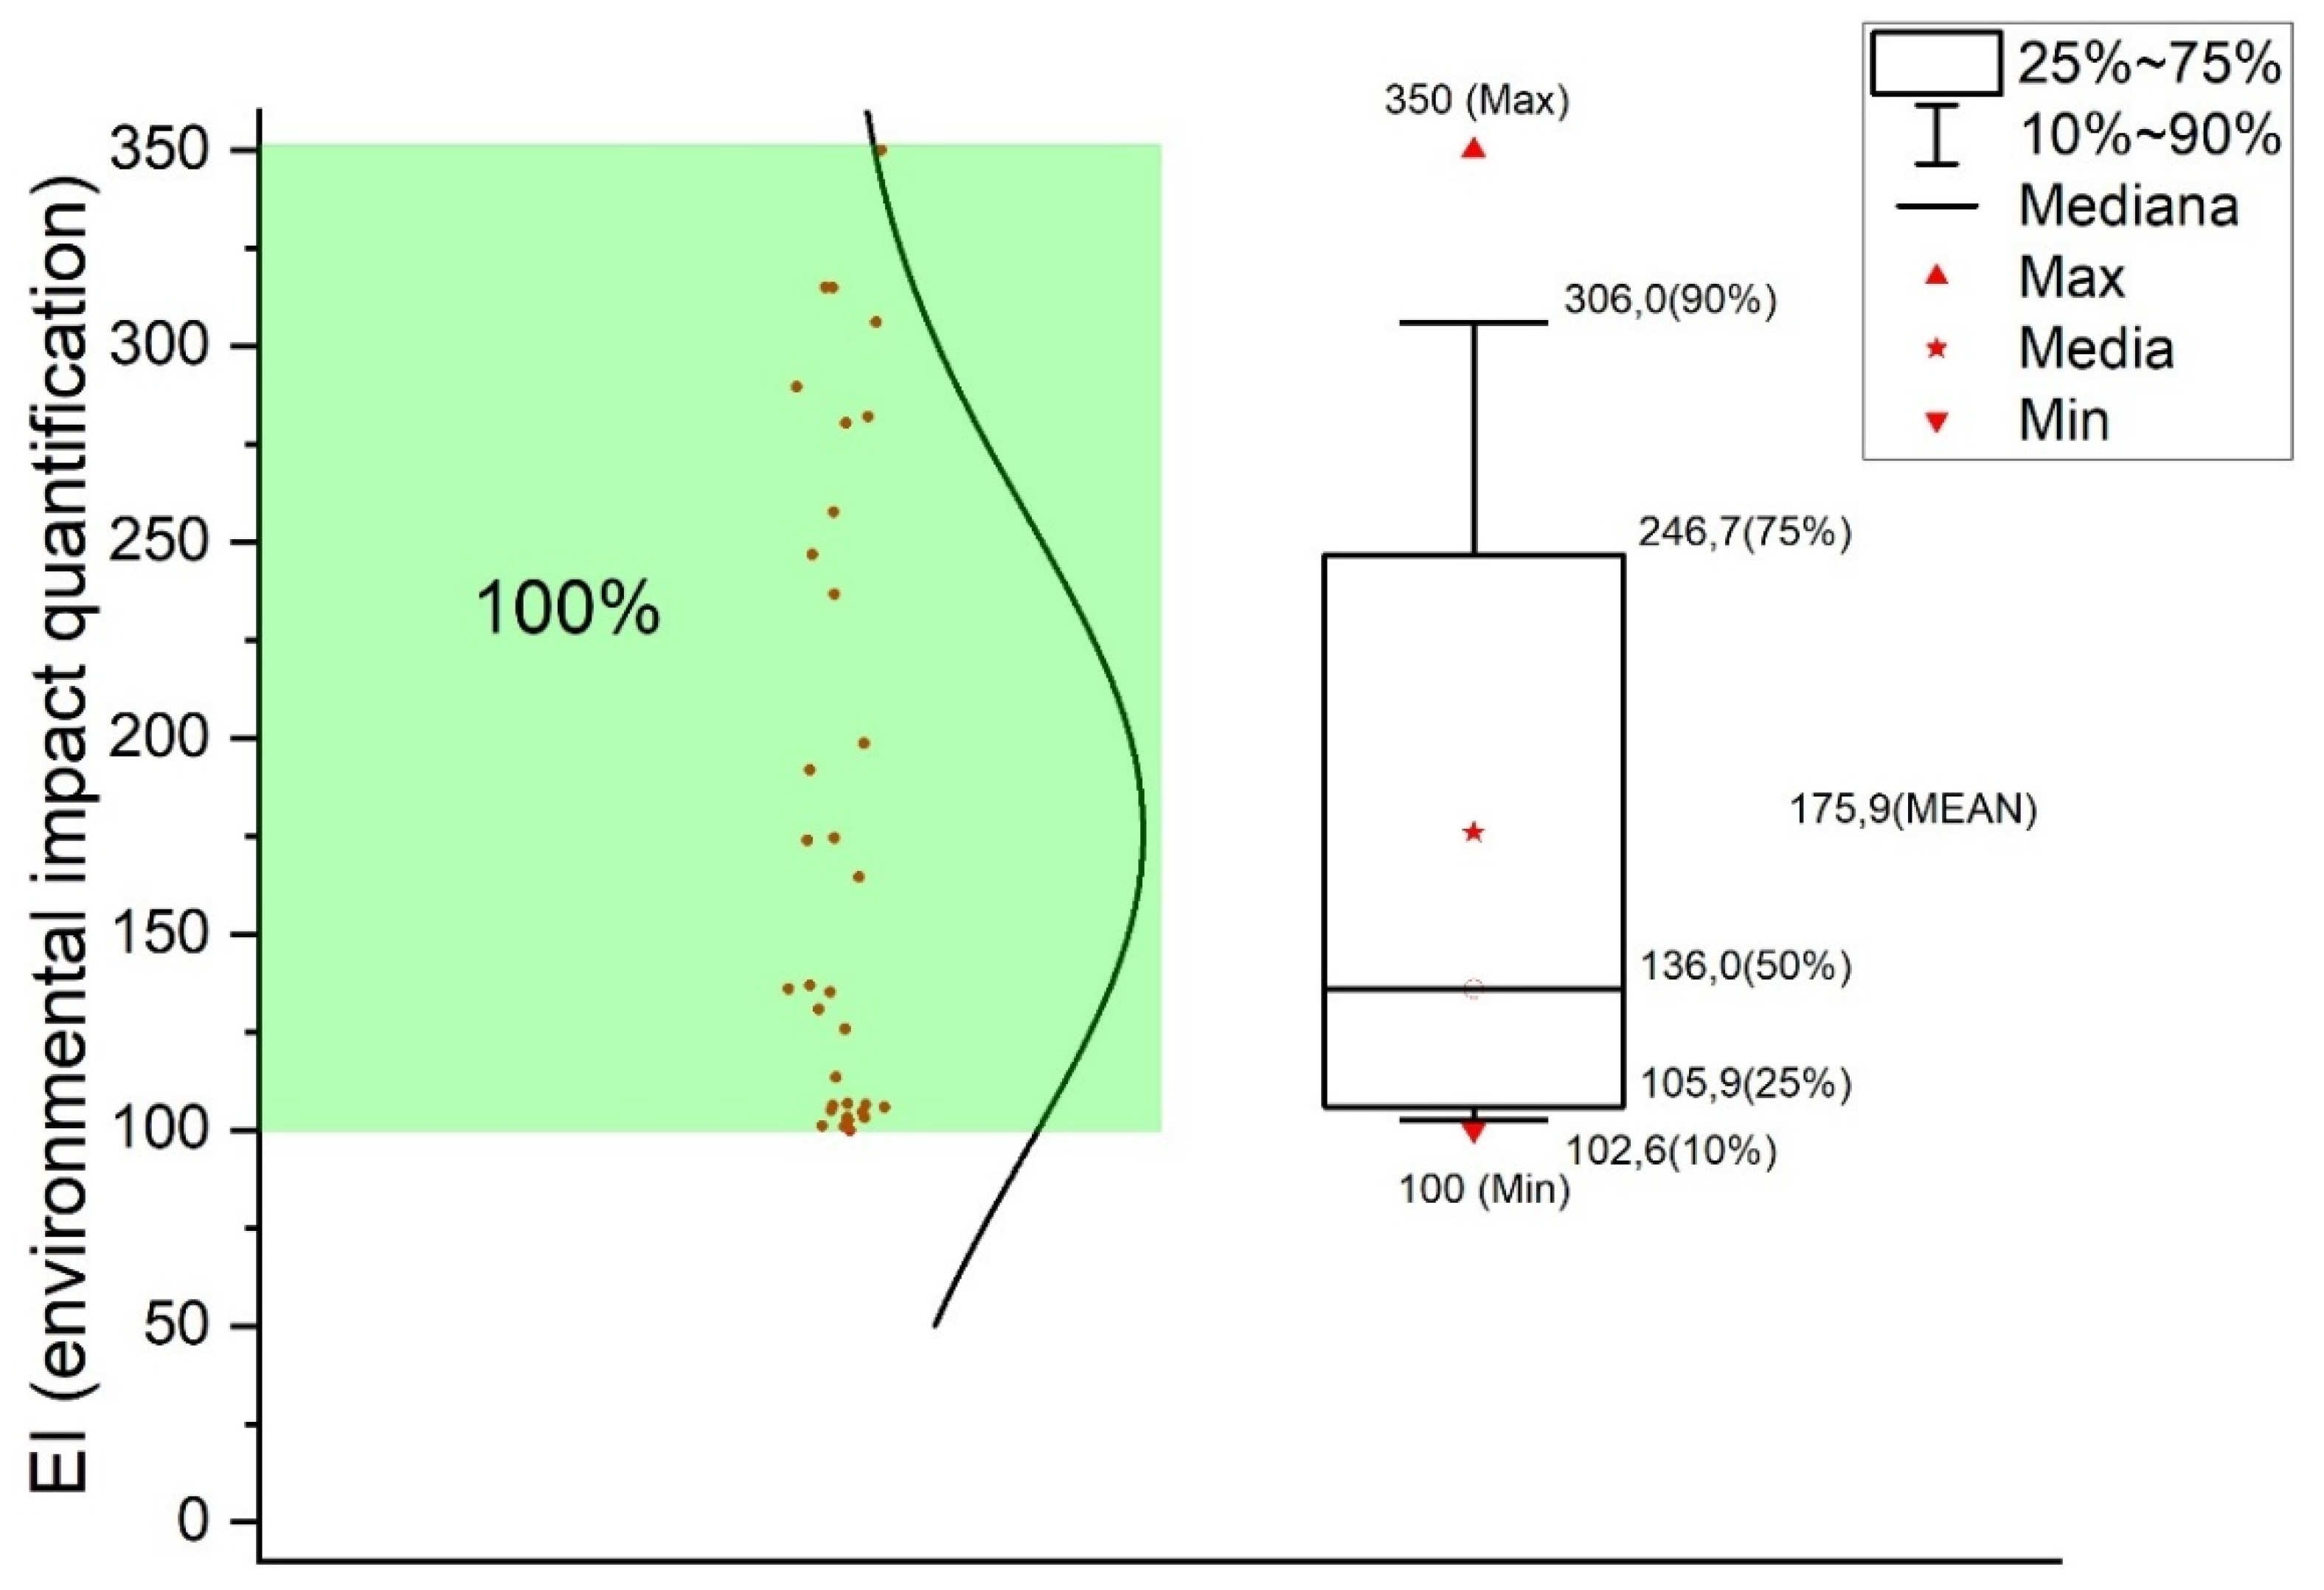

Table 1.
Environmental and human health effects of aerosol exposure.
| Category/characteristic | Biomass burning (BB) | Fine and coarse particles (FCP) | Desert dust (DD) |
|---|---|---|---|
| Main components | Organic compounds, black carbon, heavy metals [9,12,15,18] | Organic compounds, carbon, metals [16,27] | Mineral particles [6,19,26] |
| Health risks | Respiratory, cardiovascular, cancer, higher mortality [8,9,10,11,15,19] | Respiratory, cardiovascular, cancer [16,27] | Respiratory, allergic, some cardiovascular [6,7,17,26] |
| Inflammation and oxidative stress | Strong imflammation, high oxidative stress [8,9,15,19] | Inflammation, oxidative stress [16,27] | Induces inflammation, lower oxidative stress [6,17,26] |
| Toxicity | High oxidative potential, more toxic [8,9,23] | High oxidative potential, toxic [16,27] | Lower oxidative potential, less toxic [6,17,26] |
| Cardiovascular risk | Strongly linked to heart disease, stroke [9,19,26] | Increased risk of cardiovascular disease [16,27] | Present, but less pronounced [6,7,17,26] |
| Allergenicity | Less about allergens, more about toxic chemicals [8,19,26] | Less about allergens, more about toxic chemicals [16,27] | Can carry allergens and microbes [6,17,26] |
| Vulnerable populations | All people, with higher risk for vulnerable groups [8,9,10,11,15,19] | All people, with higher risk for vulnerable groups [16,27] | Children, elderly, people with pre-existing conditions [6,17,26] |
| Air quality | Very high PM [8,11,13,23] | High PM [20,24] | Increased PM [6] |
| Climate impact | Strong warming (black carbon), climate feedbacks, ozone formation [8,14,16,21,25] | Altered radiative forcing, complex effects [20,24] | Mixed radiative effects, more scattering/cooling [5,21] |
| Ecosystem effects | Soil degradation, carbon sink loss, nutrient depletion, biodiversity loss [14,16,23] | Combined soil and nutrient effects, possible acidification and toxicity [20,24] | Nutrient deposition, moderate soil effects, some ecosystem benefits [6] |
| Socioeconomic impact | Severe haze, agricultural losses, indoor air pollution [13,14,16,19,23] | Haze, reduced visibility, potential infrastructure risks [20,24] | Reduced visibility, infrastructure damage [6] |
| Impact scale | Description | Risk scale | Description |
|---|---|---|---|
| <100 | Natural environment, unaffected by industrial/human activities | <100 | Negligible/insignificant risks |
| 100-350 | Environment modified by industrial activities within admissible limits | 100-200 | Minor risks, and monitoring actions are required |
| 350-500 | Environment modified by industrial activities that cause discomfort | 200-350 | Moderate risks at an acceptable level, monitoring and prevention actions are required |
| 500-700 | Environment modified by industrial activities that cause suffering to life forms | 350-700 | Moderate risks to an unacceptable level, control and prevention measures are required |
| 700-1000 | Environment modified by industrial activities, dangerous for life forms | 700-1000 | Major risks, remediation, control and prevention measures are required |
| >1000 | Degraded environment, unsuitable for life forms | >1000 | Catastrophic risks, all activities should be stopped |
Disclaimer/Publisher’s Note: The statements, opinions and data contained in all publications are solely those of the individual author(s) and contributor(s) and not of MDPI and/or the editor(s). MDPI and/or the editor(s) disclaim responsibility for any injury to people or property resulting from any ideas, methods, instructions or products referred to in the content. |
© 2025 by the authors. Licensee MDPI, Basel, Switzerland. This article is an open access article distributed under the terms and conditions of the Creative Commons Attribution (CC BY) license (http://creativecommons.org/licenses/by/4.0/).
Copyright: This open access article is published under a Creative Commons CC BY 4.0 license, which permit the free download, distribution, and reuse, provided that the author and preprint are cited in any reuse.


