
Submitted:
23 September 2025
Posted:
24 September 2025
You are already at the latest version
Abstract
Regular monitoring of mineral dust is essential in order to assess its impact on air quality, human health, and climate, with satellite observations in recent decades play-ing a crucial role by providing consistent global coverage of various aerosol properties. In this study, the Dust Flag product of the Infrared Atmospheric Sounding Interferom-eter (IASI), onboard the Meteorological Operational (MetOp) satellites, is evaluated using ground-based measurements from 120 Aerosol Robotic Network (AERONET) sites worldwide. The Dust Flag serves as both an indicator of dust presence and a pseudo-indicator of dust loading. To evaluate this product, a well-established aerosol classification scheme was applied, based on AERONET Aerosol Optical Depth (AOD) and Angstrom Exponent products. Results show that the Dust Flag reliably identifies dust, achieving a 74.1% agreement score with AERONET, although some cases are misclassified. Also, this study concludes that the Dust Flag signal increases with parti-cle load, reaching maximum values during extreme coarse dust events. Cases when IASI does not agree with AERONET are further examined and may be caused either from limitations in the AERONET classification methodology or from low atmospheric particle concentrations. Finally, the spatial variability of the agreement score is exam-ined, with the highest scores found within and near the global “dust belt.”
Keywords:
satellite
; IASI
; AERONET
; dust
; aerosol typing
; remote sensing
1. Introduction
Mineral dust aerosols are released primarily from deserts, arid and semi-arid regions around the world. Globally, approximately 1.000 to 3.000 Mt of dust particles are emitted each year, accounting for more than half of the total aerosol mass in the atmosphere [1]. Accurate estimations are challenging, as emissions are dependent on a variety of factors, such as wind speed and surface type [2]. About 40% of the Earth’s land surface is characterized by low precipitation, with major drylands located in northern Africa and central east Asia. With an average lifespan of around 2 weeks in the atmosphere, dust particles can be transported thousands of kilometers before they are deposited, affecting areas far away from principal sources [3,4]. Almost all major deserts are located in the Northern Hemisphere. The Sahara Desert, by far the largest contributor of mineral dust particles in the world, emits more than half of the total load every year [5]. The Southern Hemisphere accounts for only 6.7% of all emissions, with smaller deserts found in Australia, southern Africa, and South America [6]. In Figure 1. Μajor mineral dust sources around the world (As per Figure 1 from Alsharif et al., 2020)., the most important dust sources are presented and a visible “dust belt” can be identified, extending from western Sahara to northeastern China [7].
Besides natural sources, human activities also contribute to dust emissions, accounting for up to 20–30% of the total [8,9]. Construction, transportation, and industrial activities can directly introduce dust particles into the atmosphere, while the modification and disturbance of land for agricultural purposes can enhance wind erosion, making it easier to dislodge soil particles from the ground [10]. Anthropogenic sources, though less important, can produce larger dust fluxes than natural ones, due to large numbers of fine particles generated and deposited on the ground from various activities [11,12].
Dust particles affect the climate by interacting with shortwave or longwave radiation both directly and indirectly [13,14]. Since mineral dust particles can display a variety of different sizes, they can scatter and absorb radiation from the visible up to the infrared regions of the electromagnetic spectrum. The type and intensity of these interactions can result in a positive or negative total radiative flux, triggering the warming or cooling of the environment, respectively [15]. Aerosols can indirectly affect radiative forcing by working as cloud and ice condensation nuclei [16]. Generally, the radiative flux of mineral aerosols at the shortwave region depends on their size, chemical compositions, as well as from the albedo of the surface below the dust layer. On the other hand, in the infrared part of the electromagnetic spectrum, the radiative flux depends on the particle size, the presence and type of clouds and from the temperature difference between the dust layer and the surface below. In total, mineral dust particles have a radiative forcing of -0.4±0.4Wm−2, tending to cool the atmosphere, but at a quite smaller rate than the principal drivers of global climate change [17,18,19].
Ground-based remote sensing instruments have been invaluable in monitoring mineral dust aerosols, providing many decades worth of measurements. In this study, the data used is derived from the Aerosol Robotic NETwork (AERONET), one of the biggest scientific networks in the world, consisting of more than 500 active stations as of 2025. Cimel sunphotometers perform daily automated radiation measurements, the data are then collected and processed by NASA, with the final products concerning various aerosol properties. Some AERONET sites have been operating almost continuously for more than 30 years, resulting in many long-term available timeseries, working as a foundation for studies regarding climate change, air-quality and satellite validation [20,21,22,23,24].
In the last decades, satellite remote sensing instruments have been revolutionary in studying and monitoring various atmospheric parameters, including mineral dust aerosols. The purpose of this study is the evaluation of the Dust Flag product of the Infrared Atmospheric Sounding Interferometer (IASI), an infrared spectrometer on top of the polar-orbiting Meteorological Operational satellites (MetOp), using ground-based data derived from AERONET on a global scale.
In the next section, a brief overview of the instrument in question, as well as the reference instruments are presented, with the methodology implemented also described in detail. Afterwards, in Section 3 the final results concerning the evaluation are thoroughly presented. In Section 4, the general conclusions of this study are summarized and discussed.
2. Materials and Methods
2.1. IASI/MetOp
The Infrared Atmospheric Sounding Interferometer (IASI) is a Fourier Transform Spectrometer (FTS) on top of the polar-orbiting Meteorological Operational satellites (MetOp), a part of the European Space Agency (ESA) which are operated by the European Organization for the Exploitation of Meteorological Satellites (EUMETSAT). First deployed in 2006, IASI has since been constantly providing data concerning trace gases total columns, cloud characteristics, temperature and humidity vertical profiles as well as aerosol properties. IASI has a spectral range from 3.62μm to 15.5μm, a region which covers the atmospheric window but also a number of absorption bands for some of the most important atmospheric constituents, such as CO2, O3, H2O, CH4 and N2O. Infrared measurements can also be performed during nighttime, they are not immensely dependent on surface type and albedo and they are more sensitive to coarse particles. The instrument performs scans at a perpendicular axis to the satellite orbit. Each scan lasts around 8 minutes and ranges from -48.3o to 48.3o relative to the nadir. Since MetOp orbits at an altitude of around 840km, IASI swath is approximately 2400km. The field of view (FOV) consists of circular pixels, each with a diameter of 12km. IASI orbital period is 101.4 minutes, with each repeat cycle lasting around 29 days. MetOp, being a sun-synchronous satellite, passes over the equator at around 9:30 local time during the descending part of the orbit, with the ascending overpass 12 hours later [25,26,27,28,29].
In this study, the Dust Flag (DF) product of IASI is evaluated, available freely since June of 2017 via the EUMETSAT Data Store (https://data.eumetsat.int/). According to the IASI Level 2: Product Guide, DF is a pseudo-quantitative dust index, meaning that it indicates the presence and possibly the amount of dust particles, though it is not directly related to the latter. DF typically ranges from 0 to about 10, with higher values corresponding to extreme dust cases, meaning those loaded with particles. The presence of dust is suspected for DF values greater than approximately two. The evaluation of DF should comprise methodologies for each individual property of the product., working
The algorithm producing the Dust Flag is developed by L. Clarisse [30]. It identifies five distinct aerosol types using the brightness temperature difference technique. The retrieved categories are volcanic ash, sulfuric acid droplets, ammonium sulfate particles, smoke particles and windblown dust. The presence of a particular aerosol type is suspected by calculating the radiative temperature difference (ΔT) at selected wavelengths. In the case of mineral dust, 3.7 and 11μm were selected , whereas different studies may provide different wavelength combinations [31]. Dust presence is strengthened for large values of ΔT [32]. The final product is calculated from the following equation.
where G is the gain matrix, which determines the sensitivity of the final product to each wavelength, r is the satellite radiation measurement, ch(i) are the different wavelength channels selected for retrieving dust information, bias is a calibration offset and m is the background reference spectrum. Finally, R is the Dust Flag index, the product evaluated in the current study, designating the presence of dust as well as large aerosol loading for higher values [33].
In Figure 2. Dust transport cases over the Atlantic (“Godzilla” events) during July 11, 2023 and February 21, 2023 as derived by (left) VIIRS Suomi (https://wvs.earthdata.nasa.gov/) and IASI-C (right)., two dust transport cases are presented. The Sahara Desert provides a number of dust transport cases throughout each year. About 80% of total emissions from this region follow a westward trajectory, reaching the Caribbean Sea and other sites after 5 to 7 days. [34]. A smaller portion, around 15%, originating mostly from the northwestern regions of Africa, moves north over Europe [35]. Events when desert dust is emitted from the Sahara Desert, crosses the Atlantic Ocean and reaches the Americas, are known as “Godzilla” [36,37,38]. The two images on the left are derived from the Visible Infrared Imaging Radiometer Suite (VIIRS) onboard the Suomi National Polar-Orbiting Partnership (Suomi NPP) weather satellite [39], whereas on the right the IASI Dust Flag is depicted for the same region. During the 11th of July 2023 (Figure 2. Dust transport cases over the Atlantic (“Godzilla” events) during July 11, 2023 and February 21, 2023 as derived by (left) VIIRS Suomi (https://wvs.earthdata.nasa.gov/) and IASI-C (right)., upper row), a large air mass can be spotted, traveling from the Sahara Desert to Central and South America, extending more than 4.000km. The beginning of a similar transport event is seen during the 21st of February 2023 (Figure 2. Dust transport cases over the Atlantic (“Godzilla” events) during July 11, 2023 and February 21, 2023 as derived by (left) VIIRS Suomi (https://wvs.earthdata.nasa.gov/) and IASI-C (right)., lower row). What can be derived from both maps is that at the center of the plumes, the Dust Flag shown in the right column presents maximum values, ranging from 9 to 12, whereas at the limits the values are smaller than 6 and outside of the plumes, Dust Flag is less than 2.
The IASI Dust Flag product is also accompanied by a number of other flags. A cloudiness indicates the presence of clouds in the instrument’s field of view. IASI performs a series of three cloud tests in order to determine the presence and amount of clouds. No-cloud state is signified with the value 0, a few clouds with the value 1, a total fractional cloud cover less and more than 80% with the values 2 and 3, respectively. According to the IASI Level 2 Product Guide, data with cloudiness flag equal to either 0 or 1 are characterized by the highest confidence. A few instances where dust particles were misidentified as clouds by this specific flag have been reported [40]. A landsea flag identifies the type of surface, an important parameter in satellite monitoring, as different values of albedo can affect measurement retrievals. In the case of dust monitoring it is even more important, as deserts are much more reflective than other surfaces. The landsea flag can take six possible values, ranging from 0 to 5. An ocean pixel is denoted with the value 0. Land pixels with low and high variability at the surface topography are denoted with the values 1 and 2, respectively. Pixels corresponding to an area containing both sea and land can take the values 3 and 4, depending once again on low and high surface variability. Lastly, value 5 concerns pixels over an ice surface. Finally, a sunglint flag is available, indicating the presence (value=1) or absence (value=0) of sunglint, meaning the areas above oceans where sunlight is highly reflected, resulting in much larger detected optical signals [33]. In this study, all available data was used, regardless of flags.
2.2. AERONET
The AErosol RObotic NETwork (AERONET) was initiated in 1993 by NASA and the French National Centre for Scientific Research (CNRS). It consists of ground-based remote sensing pyrheliometers, capable of performing autonomous spectral measurements of sun and sky radiance [20]. Since its beginning, more than 1600 sites have been used around the world, with 580 being active as of 2025. AERONET principal instrument is the CIMEL Electronique 318A, developed by CIMEL in France specifically for the launch and operation of the network. It is a sun/sky spectral radiometer with a spectral range from around 300 to 1020nm and a field of view of 1.2°. Using proper filters, radiation is measured at 340, 380, 440, 500, 675, 870, 940 and 1020nm. The radiometer is on top of a robotic system which tracks the sun’s position using time and coordinates. A variety of measurement options are available, with almucantar and principal plane being the most popular ones. The former is a series of measurements performed at the sun’s zenith angle, whereas the latter refers to measurements performed at the sun’s azimuthal angle [21,41].
All AERONET data used in this study are Version 3 Level 2. These are quality assured, calibrated data, which is the most reliable option available. All data was retrieved from the official AERONET website (https://aeronet.gsfc.nasa.gov/), belonging to the category of Aerosol Optical Depth (AOD) with Precipitable Water and Angstrom Parameter. In total, 120 stations around the world were selected for the analysis presented in this work. The selection aims to ensure global coverage through station location, include stations both close to and far from major dust sources, contain sites with sufficient data since 2017, when the IASI Dust Flag became available. In Figure 3. In total, 120 AERONET sites were selected for the evaluation of the IASI/MetOp Dust Flag., the location of each site is presented, with more information about each one available in Appendix A.
Aerosol Optical Depth (AOD) is the main product provided by AERONET. It is a unitless value indicating the radiant power of the medium in which radiation is being transmitted. High AOD values mean that many particles are scattering or absorbing radiation, resulting in a shorter optical path [42,43]. Though AOD is affected by the size, shape and number of particles in the atmosphere, it cannot be directly attributed to any of these parameters. Another popular AERONET product used in this study is the Angstrom Exponent (AE), also unitless, which describes the dependence of AOD on different wavelengths. Generally, higher and smaller AE values are caused by fine and coarse aerosols, respectively [44].
2.3. Aerosol Classification Using AERONET
Though AERONET does not provide an aerosol classification product, Aerosol Optical Depth and Angstrom Exponent are frequently implemented in such typing schemes. In this study, a well-established methodology using AOD and AE values was implemented, based on studies by Dubovik et al., 2006 [45] and Raptis et al., 2020 [46]. The former conducted a climatology study based on 12 AERONET sites in specific locations and calculated various properties for dust, urban, biomass burning and marine aerosols. Concerning dust, the sites selected were in Bahrain located in the Persian Gulf, Saudi Arabia, Cape Verde and Lanai in Hawaii. As mentioned before, these locations will typically provide mineral aerosols with similar properties concerning shape and size.
Raptis et al. 2020, designed an aerosol classification methodology based on threshold AOD and AE values in conformity with the work of Dubovik et al., 2006. According to the scheme, an aerosol type is identified only by the values of Aerosol Optical Depth and Angstrom Exponent. In this study, AOD at 440nm and AE 440-870nm were used, with the exact aerosol type threshold values derived from Raptis et al., 2020. Aerosols are characterized as dust for AOD>0.1 and AE<1.1, marine for AOD<0.1 and AE<1.1, continental for AOD<0.1 and AE>1.1, mixed for AOD>0.1 and 1.1<AE<1.6, polluted for 0.1<AOD<0.3 and AE>1.6 and biomass burning for AOD>0.3 and AE>1.6. Particle clusters are presented in Figure 4. Retrieved aerosol categories using AOD and AE threshold values for the 120 selected AERONET stations, based on Dubovik et al., 2002 and Raptis et al., 2020. for the total 120 stations used. It is worth noticing that the specific values concerning dust aerosols produce a broad cluster, aiming to detect even the cases with minimal dust loading. Other similar schemes classify aerosols as dust for AOD>0.6 and AE<0.6 [47], AOD>0.4 and AE<1 [48], with AOD and AE at 440nm and 440-870nm, respectively. Zachary et al., 2018, using a more complicated approach, assumes mixed aerosol at the borders of the clusters shown in Figure 4. Retrieved aerosol categories using AOD and AE threshold values for the 120 selected AERONET stations, based on Dubovik et al., 2002 and Raptis et al., 2020.
2.4. Methodology
In this section, the methodology of the study is described. Since Dust Flag (DF) provides two pieces of information concerning dust, working as an index of both the presence and of the particle amount, research results are presented in two parts, each one corresponding to a different DF property.
Firstly, both IASI and AERONET must measure similar atmospheric conditions, so that DF can safely be evaluated. In order to ensure this, the closest pixel approach was implemented. Only satellite pixels that are less than 20km from each AERONET site (Δx), as well as less than 60min of time difference (Δt) between IASI and AERONET measurements were selected for the study. If Δx and Δt are decreased, the number of collocations is sufficiently limited. On the other hand, if Δx and Δt are increased, other atmospheric parameters become important. The specific numbers selected were chosen as the optimal combination providing both sufficient number of collocations and similar atmospheric conditions. The duality of the Dust Flag, indicating both the presence and the amount of dust aerosols in the atmosphere, is studied in two parts, with results presented in the next section.
In the first part, some general information regarding the range and values of the Dust Flag are described, as well as the ability of IASI to identify dust and separate it from the other possible retrieved aerosol types. Next, the agreement score between IASI and AERONET is calculated for all available sites, as well as the percentage of total dust cases identified by IASI. The agreement score is a value equal to the percentage of dust classifications by AERONET, when IASI detects dust. It is a measure of the reliability of the satellite product, meaning that a high or low agreement score indicates that most of the time that IASI detects dust, AERONET either does or does not detect dust, respectively.
In the second part, the quantitative aspect of the Dust Flag is examined. The effects of the Aerosol Optical Depth and Angstrom Exponent are studied, with both products being immensely important for the aerosol characterization scheme implemented in this work. Next, the cases characterized as dust only by AERONET are inspected. Lastly, the spatial variability of the agreement score is studied on a global scale, in order to extract information about a dependence on latitude, longitude, as well as on the distance from dust sources.
3. Results
3.1. Dust Flag as an Indicator of Dust Presence
A total of 120 global AERONET stations were selected for the evaluation of IASI/MetOp Dust Flag, with most of them located near deserts and semi-arid regions, providing mineral dust aerosols frequently. Out of all sites, 90 are found in the northern hemisphere. Since AERONET does not provide measurements when precipitation or heavy cloudiness take place, around 35.6% of the collocations occur during the time period between June and August, when the majority of stations are operating on a daily basis, with only 14.2% occurring between December and February.
As mentioned before, Dust Flag (DF) is a unitless product which indicates the presence of dust for values greater than 2. For the 105.383 collocations between IASI and AERONET, 77% of the time DF is less or equal to 2, meaning that for most of the time IASI does not detect dust. This result is expected, as aerosols in general are not uniformly distributed in the atmosphere, with most dust particles being present mostly over and relatively near their sources. Figure 5. IASI Dust Flag histogram per aerosol type, showcasing an exponential-like decay. The dust contribution percentage, shown on top of each Dust Flag bin, is found to increase with increasing Dust Flag value. presents a histogram of DF values, for all 120 AERONET stations selected. Colors in each bin indicate the contribution of each aerosol type, as derived by the implemented classification scheme. On top of each bin, the dust contribution is displayed. An exponential-like decay is noticeable, starting from the dataset’s minimum value of 0.2 up to the maximum value of 12.7, with a mean value of 1.53. This trend is present for all separate aerosol types, colored differently. All aerosols, except dust, have a mean DF value less than 2. Mean DF for polluted aerosols is 0.98, for mixed is 1.04, for continental 0.84, for biomass burning 1.09 and for marine 0.95. As for dust, the DF mean value is 2.45. This is an indicator that IASI is able to identify mineral dust particles in the atmosphere and that the threshold value of 2 is appropriate.
At the same Figure, on each Dust Flag bin, the aerosol classification scheme mentioned in section 2.3 is applied, indicating the fraction of collocations attributed to each type. On top of each bin the dust contribution percentage for each one is displayed. It is evident that the higher the Dust Flag values, the more dominant dust is, meaning that that the larger Dust Flag values are almost exclusively the result of dust aerosols. The conditions providing such high values are discussed in section 3.2, examining the mineral dust loading of an air mass.
In Figure 6, the agreement score of dust aerosol identification between IASI and AERONET is presented. When IASI detects dust (Figure 6a), meaning when it provides a Dust Flag value greater than 2, AERONET also detects dust for 74.12% of the instances. This is a very promising result, considering the different operations by each instrument, which indicates that the IASI Dust Flag is able to detect satisfactorily the presence of dust aerosols. All the other aerosol types retrieved using this classification methodology are much less frequent when Dust Flag is greater than 2, with mixed aerosols being the second most frequent type. On the other hand, when IASI does not detect dust, meaning when it provides a Dust Flag value lesser or equal to 2 (Figure 6b), dust is not a standout category, though it is still the most frequent one, but only by a slight margin. Nevertheless, 55.45% of the total dust cases detected by AERONET are not detected by the IASI Dust Flag. Besides dust, mixed, marine and continental aerosols also present high percentages when Dust Flag is lesser or equal to 2, something that could be caused by similar Aerosol Optical Depth (AOD) and Angstrom Exponent (AE) values. As seen in Figure 4. Retrieved aerosol categories using AOD and AE threshold values for the 120 selected AERONET stations, based on Dubovik et al., 2002 and Raptis et al., 2020., these three types are located near each other in the AOD-AE scatterplot. Overall, the fact that the IASI Dust Flag is missing around half of the total dust cases identified by AERONET could indicate two things; either the threshold value of 2 is not strict enough or the AOD and AE threshold values implemented should be revisited since they result in a false aerosol characterization. This is extensively discussed in Section 3.2.
3.2. Dust Flag as an Indicator of Dust Load
The Dust Flag, besides being an index of the presence of dust, is also a pseudo-quantitative index of mineral dust loading, as mentioned in the IASI Level 2 Product Guide. This property is extensively examined in the following subsection.
Aerosol load is related to both the Aerosol Optical Depth and Angstrom Exponent products provided by AERONET. The Aerosol Optical Depth (AOD) is a measure of the total aerosol loading of an air mass. The more particles that can scatter and absorb electromagnetic radiation at a certain wavelength, the highest the AOD value. On the other hand, the Angstrom Exponent (AE) is an index of particle size. Smaller Angstrom Exponent corresponds to larger particles. By using these two products synergistically, information about the total mineral dust loading of an air mass can be derived, as described in section 2.3. Since the Aerosol Optical Depth and Angstrom exponent are crucial in the aerosol classification scheme implemented for the evaluation of the IASI Dust Flag, it is worth examining the relation between the satellite and AERONET products.
In Figure 7a, the mean Aerosol Optical Depth and Angstrom Exponent values are calculated and presented for collocations characterized with a certain range of Dust Flag values. As Dust Flag increases, AOD (blue line) and AE (red line) present a monotonic increase and decrease, respectively. This means that the higher Dust Flag values are the result of air masses which contain a large number of particles (high AOD) and in which coarse particles are dominant (low AE). The standard deviation (std) of the AERONET products is also noted around each line, with the mean values of 0.35 and 0.33 corresponding to AOD and AE, respectively. As Dust Flag rises, the AOD std seems to decrease, dropping below 0.2. On the other hand, the AE std seems to increase with Dust Flag, presenting values greater than 0.4 for the maximum values. Overall, it appears that air masses loaded with coarse particles produce the highest Dust Flag values.
In Figure 7b, a scatterplot of Dust Flag values with relation to AOD and AE is presented. A dashed line indicating the cluster of dust aerosols, as derived from the aerosol classification methodology implemented (Figure 1 and Figure 4), is also drawn. Points that are located inside this region are characterized as dust by AERONET, with points located outside the region corresponding to one of the other possible five aerosol types. Each point is colored according to the Dust Flag value provided by IASI, with aerosols characterized as dust for Dust Flag values greater than 2. It is evident that the higher Dust Flag values, showcased with the warmest colors, are located mostly at the bottom right part of the scatterplot, corresponding to high AOD and low AE values. A visible region can be identified, with AOD ranging from 0.2 to 3 and AE ranging from 0 to 0.7. This indicates that the maximum Dust Flag values are most likely to be the product of coarse particles with large sizes, hence the low AE values, whereas a similar conclusion concerning the AOD is much more difficult to extract, although the mean AOD is still relatively high with most points producing an AOD value greater than 0.5. Only a few points with Dust Flag value greater than 2 are located outside the dust region.
As mentioned before, IASI is unable to detect about 54% of the dust cases identified by AERONET, which correspond to blue points located inside the dust region of Figure 7b. Collocations typed as dust by AERONET can be identified as dust [Dust Flag >2] or non-dust [Dust Flag <2] by IASI. Those identified by IASI as dust have a mean Aerosol Optical Depth value of 0.43±0.36 and a mean Angstrom Exponent value of 0.64±0.48. Those identified as non-dust by IASI have a mean Aerosol Optical Depth value of 0.25±0.27 and a mean Angstrom Exponent value of 1.11±0.46. The above findings indicate that the IASI Dust identification algorithm is able to correctly type dust for significant mineral dust loadings and for particles of larger sizes.
As examined in Section 3.1, the Dust Flag is a reliable index of the presence of dust particles, with an agreement score of 74% with the AERONET dust identifications when Dust Flag > 2. Although this is a very promising finding, the IASI dust algorithm appears to not classify as dust around 55% of the total dust cases provided by AERONET, an issue which demands further study.
In Figure 8, two density scatterplots between the Aerosol Optical Depth at 440nm and Angstrom Exponent at 440-870nm are presented, corresponding to when IASI does not detect dust (8a) and when IASI does detect dust (8b). In both plots the dashed lines represent the dust cluster, as defined in Figure 4. It is evident that when IASI does not detect dust (Figure 8a), most cases are associated with relatively low Aerosol Optical Depth (AOD) values at 550 nm, typically below 0.1. In contrast, the Ångström Exponent (AE) at 440–870 nm spans a broader range, from 0.4 to 1.6. The dense point region falls outside the dust cluster boundaries, although it remains closely adjacent. When IASI indicates the presence of dust (Figure 8b), most cases are characterized by AOD values ranging from 0.1 to 0.5 and AE values between 0.1 and 0.4. In this case, the dense point region lies within the dust cluster boundaries.
Cases when only AERONET identifies dust can be interpreted in two ways, being the result of either issues of the IASI dust identification algorithm or the aerosol classification methodology implemented in this study (Figure 4). From Figure 8a, a sufficient number of points is located inside the dust cluster, close to the cluster boundaries. At such regions, different aerosol types are characterized by similar AOD and AE values, making separation difficult. Aerosols can as a result be misclassified as dust by AERONET, while in reality they are marine or mixed type.
3.3. Spatial Variability
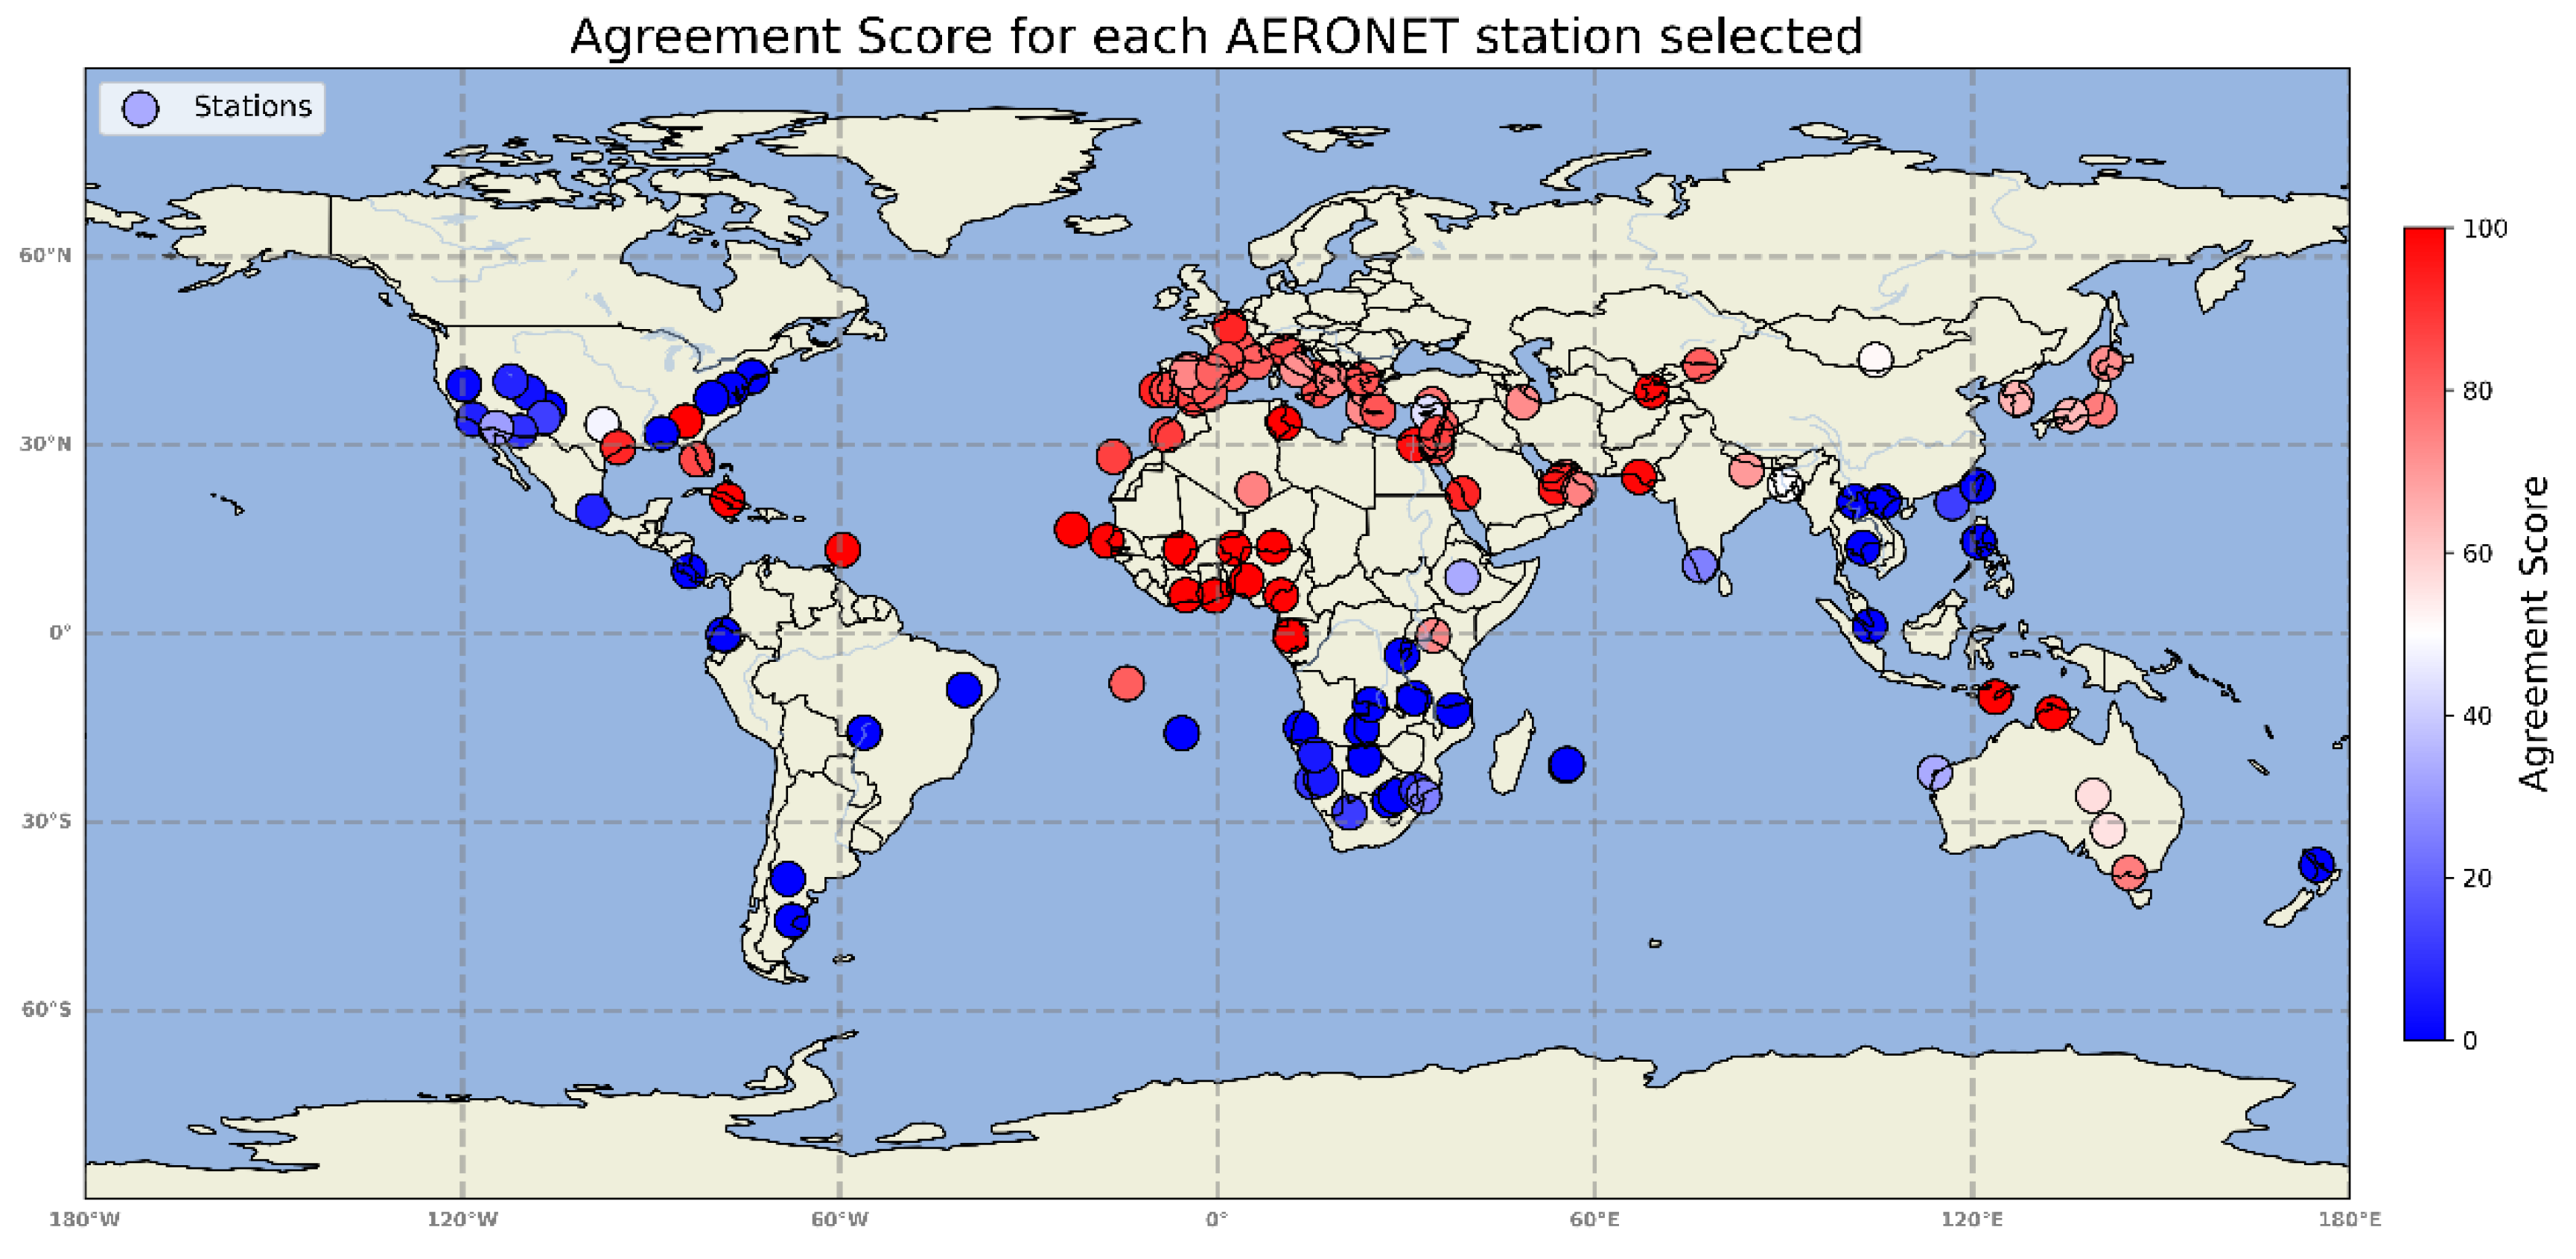
In the last subsection, the spatial variability of the agreement score is examined. The calculation of the agreement score was performed separately for each AERONET station participating in the evaluation, with results for each one included in Table A1 of Appendix A. From the 120 total AERONET sites selected for the study, 20 provided an Agreement Score larger than 95%, showcasing a near perfect agreement between both instruments, whereas the agreement score for 39 stations was smaller than 10%. As presented in Figure 9, the maximum values of the Agreement Score correspond to sites inside or near the Sahara and the Arabian deserts. These stations are the recipients of dust plumes that are both rich in aerosols and young in lifetime, thus as a result the air masses carry many large particles, characterized by large Aerosol Optical Depth and small Angstrom Exponent values. A visible dust belt, mentioned also in Figure 1, is evident over the Atlantic Ocean between the west coast of Africa and South America. Maximum Agreement Score values, greater than 75%, form an imaginary line connecting the Caribbean Sea to western Africa and eastern Asia. The geographical extent of the “dust belt” presented in Figure 9 agrees with numerous previous works, especially concerning satellite aerosol index and AOD [49,50,51,52].
Sites with minimal agreement scores are also worth investigating. Although 23 stations provided more than 100 collocations between the instruments, they showcase an agreement score of 0, meaning that when and if IASI detected dust, AERONET never detected dust. This is probably caused by the fact that these stations are located far away from deserts and drylands, making dust one of the least frequent aerosol types detected by AERONET. If such particles do arrive above the AERONET stations, it means that they have travelled a great distance from their sources, resulting in the deposition of most coarse particles and the general decrease of dust loading. This fact makes the simultaneous dust aerosol identification by both IASI and AERONET difficult, resulting in few cases when both instruments detected such aerosols.
All the above indicate that overall Dust Flag is a reliable index of both the presence and the loading of dust particles in regions inside or near deserts and semi-arid areas where such particles are frequent in the atmosphere. Far from such regions, the reliability of the product is questionable, as dust is sparser in the atmosphere. It is also worth noticing that the total Agreement Score of 74.12% described in section 3.1 is highly dependent on the dataset selected. If most sites are located near major dust sources, the Agreement Score is going to be much larger compared to the including most sites located in regions away from deserts and arid areas.
4. Conclusions
This study evaluated the performance of the Dust Flag product of the Infrared Atmospheric Sounding Interferometer (IASI) on board the Meteorological Operational satellites (MetOp). Dust Flag provides two key properties, a dust presence index and a dust load pseudo-index, both of which were assessed against global ground-based Aerosol Robotic Network (AERONET) observations using an aerosol typing methodology [45,46]. Dust was defined as cases with Aerosol Optical Depth (AOD) at 550 nm greater than 0.1 and Ångström Exponent (AE) at 440–870 nm lesser than 1.1, with collocations restricted to within 20 km and 60 minutes of the selected ground stations.
The analysis of the Dust Flag showed that IASI is reliable in identifying dust events. When Dust Flag indicated dust (value > 2), AERONET confirmed its presence in about 74% of cases, a statistical metric which was labeled as agreement score throughout the study. The second property of Dust Flag is examined in section 3.2, where its relation with the two principal AERONET products, Aerosol Optical Depth and Angstrom Exponent, is examined. It is found that major dust transport cases are characterized by abnormally high and low AOD and AE values, respectively. For those instances, Dust Flag seems to present the maximum values of the whole dataset used, meaning that it responds appropriately to dust particle abundance in the atmosphere. Nevertheless, limitations were also identified and inspected. IASI failed to detect about half of the total dust cases reported by AERONET. This under-detection appears to stem from two main factors, weak dust signals associated with low atmospheric particle load, which do not exceed the detection threshold, and aerosol mixtures misclassified as dust by AERONET, whose optical properties concerning AOD and AE can resemble other aerosol types. Finally, the spatial variability of the agreement score, presented in section 3.3, revealed a clear geographical pattern. Stations located within or near major dust source regions, such as the Sahara Desert, exhibited the highest agreement, while stations at great distances from such regions showed much lower values. This spatial distribution highlights the instrument’s greater sensitivity to dust in regions of strong dust particle presence and transport. The extensively studied “dust belt” can be recognized as the area where the agreement score presents its maximum values, stretching from Central America to eastern Asia.
In general, IASI appears to detect dust and pseudo-quantify dust sufficiently. It is worth noticing that this study did not intend to re-estimate the threshold Dust Flag value of 2, derived by the EUMETSAT Level 2 Product Guide, but to evaluate it. By selecting a similar value, either larger or smaller, the agreement score is expected to change, yet slightly. The same can be said about the threshold Aerosol Optical Depth and Angstrom Exponent values selected for the aerosol characterization scheme. Different values are going to present slightly different outcomes. A separate future study could re-evaluate this product, selecting a Dust Flag value that presents an even higher agreement score but also identifying a larger percentage of the cases derived by AERONET.
Author Contributions
Conceptualization, D.B., K.M.; methodology, K.M.; software, C.B.; formal analysis, C.B.; investigation, C.B., K.M..; data curation, M-E.K., C.B.; writing—original draft preparation, C.B., M-E.K.; supervision, D.B. All authors have read and agreed to the published version of the manuscript.
Funding
This research received no external funding.
Institutional Review Board Statement
Informed Consent Statement
Data Availability Statement
The official AERONET L2 data are freely available through the website (https://aeronet.gsfc.nasa.gov/). The operational IASI Dust Flag data are freely available through the EUMETSAT Data Store (https://data.eumetsat.int/).
Acknowledgments
Results presented in this work have been produced using the Aristotle University of Thessaloniki (AUTh) High Performance Computing Infrastructure and Resources. The authors would further like to acknowledge the support provided by the IT Center of the AUTh throughout the progress of this research work. The authors would like to thank Dr. Lieven Clarisse of the Université libre de Bruxelles for his valuable insight into the aerosol detection algorithm.
Conflicts of Interest
The authors declare no conflicts of interest.
Appendix A

Table A1.
The 120 AERONET stations selected for the evaluation.
| Station name | Latitude (deg.) | Longitude (deg.) | Agreement Score |
| Banizoumbou | 13.58 | 2.6 | 100.0 |
| Camaguey | 21.28 | -77.82 | 100.0 |
| Capo_Verde | 16.58 | -23.03 | 100.0 |
| Georgia_Tech | 33.78 | -84.49 | 100.0 |
| IER_Cinzana | 13.45 | -5.88 | 100.0 |
| Jabiru | -12.69 | 132.78 | 100.0 |
| Koforidua_ANUC | 6.03 | -0.39 | 100.0 |
| Kupang | -10.1 | 123.63 | 100.0 |
| LAMTO-STATION | 6.09 | -4.98 | 100.0 |
| Ragged_Point | 13.3 | -59.52 | 100.0 |
| SEGC_Lope_Gabon | -0.34 | 11.68 | 100.0 |
| Zinder_Airport | 13.75 | 8.94 | 100.0 |
| Ilorin | 8.47 | 4.7 | 99.84 |
| Medenine-IRA | 33.5 | 10.62 | 99.67 |
| CATUC_Bamenda | 6.06 | 10.15 | 99.04 |
| Dakar_Belair | 14.75 | -17.53 | 98.88 |
| Karachi | 24.92 | 67.03 | 98.8 |
| Dushanbe | 38.56 | 69.05 | 98.17 |
| Cairo_EMA_2 | 30.01 | 31.34 | 97.03 |
| Mezaira | 23.14 | 53.76 | 95.99 |
| IMAA_Potenza | 40.64 | 15.73 | 93.58 |
| Cabo_da_Roca | 38.74 | -9.64 | 93.22 |
| KAUST_Campus | 22.27 | 39.03 | 92.61 |
| Paris | 48.82 | 2.11 | 92.59 |
| Univ_of_Houston | 29.61 | -95.2 | 92.31 |
| Masdar_Institute | 24.39 | 54.76 | 91.3 |
| Saada | 31.58 | -8.06 | 88.27 |
| Izana | 28.13 | -16.46 | 87.38 |
| Weizmann_Institute | 31.9 | 34.91 | 86.73 |
| Granada | 37.3 | -3.65 | 86.25 |
| Evora | 38.74 | -7.89 | 85.94 |
| SP_Bayboro | 27.72 | -82.7 | 85.71 |
| Modena | 44.79 | 10.86 | 85.19 |
| Eilat | 29.59 | 34.96 | 84.67 |
| Lamezia_Terme | 38.81 | 16.07 | 83.67 |
| Toulouse_MF | 43.58 | 1.53 | 83.65 |
| Thessaloniki | 40.56 | 23.12 | 83.54 |
| Aubiere_LAMP | 45.68 | 3.25 | 83.33 |
| Finokalia-FKL | 35.34 | 25.6 | 82.96 |
| SEDE_BOKER | 30.81 | 34.84 | 82.2 |
| Barcelona | 41.34 | 2.24 | 82.08 |
| Murcia | 38.17 | -1.17 | 81.8 |
| Issyk-Kul | 42.65 | 76.77 | 81.4 |
| Ascension_Island | -7.91 | -14.33 | 81.25 |
| Toulon | 43.19 | 6.08 | 81.19 |
| Zaragoza | 41.62 | -0.7 | 80.69 |
| Palencia | 42.1 | -4.43 | 80.0 |
| Migal | 33.19 | 35.57 | 79.5 |
| IMS-METU-ERDEMLI | 36.48 | 34.15 | 77.21 |
| Chiba_University | 35.67 | 140.16 | 75.61 |
| Aspendale_Mel_AU | -38.09 | 144.9 | 75.0 |
| Tamanrasset_INM | 22.86 | 5.68 | 74.55 |
| University_of_Nizwa | 22.88 | 57.51 | 74.54 |
| Lecce_University | 40.39 | 18.29 | 74.33 |
| Valladolid | 41.6 | -4.84 | 73.81 |
| DEWA_ResearchCentre | 24.91 | 55.37 | 73.39 |
| ICIPE-Mbita | -0.31 | 34.33 | 73.33 |
| Antikythera_NOA | 35.78 | 23.2 | 72.6 |
| ATHENS_NTUA | 38.04 | 23.65 | 72.41 |
| IASBS | 36.79 | 48.58 | 72.41 |
| Hokkaido_University | 43.02 | 141.3 | 72.0 |
| Rome_La_Sapienza | 41.95 | 12.64 | 71.75 |
| Madrid | 40.44 | -3.82 | 70.23 |
| Gandhi_College | 26.01 | 84.14 | 69.67 |
| Seoul_SNU | 37.47 | 126.97 | 64.79 |
| Osaka | 34.72 | 135.69 | 63.89 |
| Birdsville | -25.8 | 139.22 | 56.47 |
| Fowlers_Gap | -31.24 | 141.59 | 55.56 |
| Dalanzadgad | 43.53 | 104.61 | 51.42 |
| Dhaka_University | 23.67 | 90.22 | 50.32 |
| NEON_CLBJ | 33.27 | -97.69 | 48.0 |
| Nicosia | 35.13 | 33.57 | 43.94 |
| AAU_Jackros_ET | 8.94 | 38.93 | 33.33 |
| Learmonth | -22.15 | 114.04 | 33.33 |
| YUMA_SL | 32.73 | -114.58 | 30.98 |
| Karunya_University | 10.88 | 76.7 | 25.0 |
| UEM_Maputo | -25.93 | 32.79 | 25.0 |
| Dongsha_Island | 20.81 | 116.81 | 12.3 |
| Sevilleta | 34.35 | -107.02 | 12.26 |
| Upington | -28.47 | 21.01 | 12.0 |
| Gobabeb | -23.64 | 15.09 | 10.06 |
| Tucson | 32.18 | -110.84 | 9.76 |
| Skukuza | -24.93 | 31.74 | 9.09 |
| NEON_ONAQ | 40.15 | -112.28 | 7.34 |
| Mexico_City | 19.48 | -99.19 | 6.67 |
| MISR-JPL | 34.11 | -118.3 | 6.25 |
| Windpoort | -19.3 | 15.55 | 5.06 |
| HESS | -23.15 | 16.52 | 4.72 |
| NEON_MOAB | 38.33 | -109.39 | 3.12 |
| Univ_of_Nevada-Reno | 39.61 | -119.74 | 1.32 |
| Bujumbura | -3.49 | 29.35 | 0.0 |
| CCNY | 40.88 | -73.96 | 0.0 |
| CEILAP-Comodoro | -45.68 | -67.62 | 0.0 |
| CEILAP-Neuquen | -39.04 | -68.25 | 0.0 |
| CUIABA-MIRANDA | -15.75 | -56.13 | 0.0 |
| GasLab_SJ_CostaRica | 9.92 | -83.9 | 0.0 |
| Howard_Univ-IRB | 38.91 | -77.23 | 0.0 |
| Los_Alamos | 35.74 | -106.25 | 0.0 |
| Luang_Namtha | 21.0 | 101.29 | 0.0 |
| Lubango | -15.04 | 13.35 | 0.0 |
| Lulin | 23.46 | 120.8 | 0.0 |
| Maido_OPAR | -20.99 | 55.41 | 0.0 |
| Manila_Observatory | 14.64 | 121.03 | 0.0 |
| Maun_Tower | -19.93 | 23.41 | 0.0 |
| Metsi | -26.58 | 27.29 | 0.0 |
| Misamfu | -10.27 | 31.3 | 0.0 |
| Mongu_Inn | -15.23 | 22.98 | 0.0 |
| NEON_LENO | 31.82 | -88.32 | 0.0 |
| NEON_MLBS | 37.46 | -80.36 | 0.0 |
| NGHIA_DO | 21.04 | 105.92 | 0.0 |
| Niassa | -12.22 | 37.46 | 0.0 |
| Petrolina_SONDA | -8.94 | -40.24 | 0.0 |
| Pretoria_CSIR-EC | -25.87 | 28.29 | 0.0 |
| Quito_USFQ | -0.17 | -78.44 | 0.0 |
| REUNION_ST_DENIS | -20.78 | 55.61 | 0.0 |
| Sakeji_School | -11.28 | 24.31 | 0.0 |
| Singapore | 1.18 | 103.69 | 0.0 |
| Sra_Kaeo | 13.67 | 102.62 | 0.0 |
| St_Helena | -15.86 | -5.62 | 0.0 |
| Univ_of_Auckland | -36.85 | 174.78 | 0.0 |
References
- Zender, C.; Bian, H.; Newman, D., Mineral Dust Entrainment And Deposition (DEAD) model: Description and 1990s dust cli-matology. J. Geophys. Res 2003, 108. [CrossRef]
- von Holdt, J.; Eckardt, F.; Baddock, M.; Wiggs, G., Assessing Landscape Dust Emission Potential Using Combined Ground-Based Measurements and Remote Sensing Data, J. Geophys. Res. 2019, 124. [CrossRef]
- Kok, J.; Adebiyi, A.; Albani, S.; Balkanski, Y.; Checa-Garcia, R.; Chin, M.; Colarco, P.; Hamilton, D.; Huang, Y.; Ito, A.; Klose, M.; Li, L.; Mahowald, N.M. Miller, R. L. Obiso, V.; Pérez García-Pando, C.; Rocha-Lima, A.; Wan, J.S., Contribution of the world’s main dust source regions to the global cycle of desert dust. Atmos. Chem. Phys. 2021, 21, 8169-8193. [CrossRef]
- Seinfeld, J.H.; Pandis, S.N.; Noone, K., Atmospheric Chemistry and Physics: From Air Pollution to Climate Change. Phys. Today 1998, 51, 88. [CrossRef]
- Middleton, N.; Goudie, A., Saharan dust: Sources and trajectories, Trans. Inst. Br. 2002, 26, 165 – 181. [CrossRef]
- Choobari, O.A.; Zawar-Reza, P.; Sturman, A., The global distribution of mineral dust and its impacts on the climate system: A review, Atmos. Res. 2014, 138, 152-165. [CrossRef]
- Alsharif, W.; Saad, M.; Hirt, H., Desert Microbes for Boosting Sustainable Agriculture in Extreme Environments. Front. Microbiol. 2020, 11. [CrossRef]
- Ginoux, P.; Chin, M.; Tegen, I.; Prospero, J.; Holben, B.; Dubovik, O.; Lin, S.J., Sources and distributions of dust aerosols simulated with the GOCART model. J. Geophys. Res., 2001, 106, 20255-20274. [CrossRef]
- Ginoux, P.; Prospero, J.; Gill, T.; Hsu, N.; Zhao, M., Global-scale attribution of anthropogenic and natural dust sources and their emission rates based on MODIS Deep Blue aerosol products. Rev. Geophys. 2012, 50, 3005. [CrossRef]
- Chen, S.; Chen, J.; Zhang, Y.; Lin, J.; Bi, H.; Song, H.; Chen, Y.; Lulu, L.; Liu, C.; Zhang, R., Anthropogenic dust: sources, characteristics and emissions. Environ. Res. Lett. 2023, 18. [CrossRef]
- Tegen, I.; Fung, I., Contribution to the atmospheric mineral aerosol load from land surface modification, J. Geophys. Res., 1995, 100, 18707–18726. [CrossRef]
- Csavina, J.; Field, J.; Taylor, M.; Gao, S.; Landázuri, A.; Betterton, E.; Sáez, A.; A Review on the Importance of Metals and Metalloids in Atmospheric Dust and Aerosol from Mining Operations. Sci. Total Environ. 2012, 433, 58-73. [CrossRef]
- Kok, J.; Ward, D.; Mahowald, N.; Evan, A., Global and regional importance of the direct dust-climate feedback, Nat. Commun. 2018, 9. [CrossRef]
- Kok, J.; Storelvmo, T.; Karydis, V.; Adebiyi, A.; Mahowald, N.; Evan, A.; He, C.; Leung, D., Mineral dust aerosol impacts on global climate and climate change, Nat. Rev. Earth Environ. 4, 2023. [CrossRef]
- Shao, Y.; Klose, M.; Wyrwoll, K.H., Recent global dust trend and connections to climate forcing: GLOBAL DUST TREND, J. Geophys. Res. 2013, 118. [CrossRef]
- Koehler, K.; DeMott, P.; Petters, M.; Prenni, A.; Carrico, C., Hygroscopicity and cloud droplet activation of mineral dust aerosol, Geophysical Research Letters, 2009, 36. [CrossRef]
- Intergovernmental Panel on Climate Change (IPCC). The Earth’s Energy Budget, Climate Feedbacks and Climate Sensitivity. In: Climate Change 2021 – The Physical Science Basis: Working Group I Contribution to the Sixth Assessment Report of the Intergovernmental Panel on Climate Change. Cambridge: Cambridge University Press, 2023, 923–1054. [CrossRef]
- Iacono, M.; Delamere, J.; Mlawer, E.; Shephard, M.; Clough, S.; Collins, W., Radiative Forcing by Long-Lived Greenhouse Gases: Calculations with the AER Radiative Transfer Models. J. Geophys. Res. 2008, 113. [CrossRef]
- Etminan, M.; Myhre, G.; Highwood, E.; Shine, K., Radiative forcing of carbon dioxide, methane, and nitrous oxide: A significant revision of the methane radiative forcing: GREENHOUSE GAS RADIATIVE FORCING, Geophys. Res. Lett. 2016, 43. [CrossRef]
- Holben, B.; Nakajima, T.; Lavenu, I.; Jankowiak, I.; Smirnov, A.; Eck, T.; Slutsker, I.; Tanre, D.; Buis, J.P.; Setzer, A.; Vermote, E.; Reagan, J.; Kaufman, Y., AERONET-A Federated Instrument Network and Data Archive for aerosol characterization, Remote Sens. Environ. 1998, 66. [CrossRef]
- Holben, B.; Tanre, D.; Smirnov, A.; Eck, T.; Slutsker, I.; Abuhassan, N.; Newcomb, W.W.; Schafer, J.; Chatenet, B.; Lavenue, F.; Kaufman, Y.J.; Castle, J.V.; Setzer, A.; Markham, B.; Clark, D.; Frouin, R.; Halthore, R.; Karnieli, A.; O’Neill, N.; Zibordi, G., An emerging ground-based aerosol climatology: Aerosol Optical Depth from AERONET. J. Geophys. Res. 2001, 106. [CrossRef]
- Siomos, N.; Balis, D.; Voudouri, K.A.; Giannakaki, E.; Filioglou, M.; Amiridis, V.; Papayannis, A.; Fragkos, K., Are EARLINET and AERONET climatologies consistent? The case of Thessaloniki, Greece. Atmos. Chem. Phys. 2018, 1-29. [CrossRef]
- Garane, K.; Chan, K.L.; Koukouli, M.; Loyola, D.; Balis, D., TROPOMI/S5P Total Column Water Vapor validation against AERONET ground-based measurements. Atmos. Meas. Tech. 2023, 16, 57-74. [CrossRef]
- Michailidis, K.; Garane, K.; Karagkiozidis, D.; Georgia, P.; Voudouri, K.; Balis, D.; Bais, A., Extreme wildfires over northern Greece during summer 2023 – Part A: Effects on aerosol optical properties and solar UV radiation. Atmos. Res. 2024, 311. [CrossRef]
- Clerbaux, C.; Boynard, A.; Clarisse, L.; George, M.; Hadji-Lazaro, J.; Herbin, H.; Hurtmans, D.; Pommier, M.; Razavi, A.; Turquety, S.; Wespes, C.; Coheur, P.F., Monitoring of atmospheric composition using the thermal infrared IASI/MetOp sounder, Atmos. Chem. Phys., 2009, 9, 6041–6054. [CrossRef]
- Clarisse, L.; Clerbaux, C.; Franco, B.; Hadji-Lazaro, J.; Whitburn, S.; Kopp, A; Hurtmans, D.; Coheur, P.F., A decadal data set of global atmospheric dust retrieved from IASI satellite measurements, J. Geophys. Res. 2019, 124, 1618–1647. [CrossRef]
- Clerbaux, C.; Hadji-Lazaro, J.; Turquety, S.; George, M.; Boynard, A.; Pommier, M.; Safieddine, S.; Coheur, P.F.; Hurtmans, D.; Clarisse, L.; Van Damme, M., Tracking pollutants from space: Eight years of IASI satellite observation. C. R. - Geosci. 2015, 347. [CrossRef]
- Blumstein, D.; Chalon, G.; Carlier, T.; Buil, C.; Hébert, P.; Maciaszek, T.; Ponce, G.; Phulpin, T.; Tournier, B,; Simeoni, D.; Astruc, P.; Clauss, A., IASI instrument: Technical overview and measured performances. Proc. SPIE - Int. Soc. Opt. Eng. 2004, 5543. [CrossRef]
- Hilton, F.; Armante, R.; August, T.; Barnet, C.; Bouchard, A.; Camy-Peyret, C.; Capelle, V.; Clarisse, L.; Clerbaux, C.; Coheur, P.F.; Collard, A.; Crevoisier, C.; Dufour, Gaëlle.; Edwards, D.; Faijan, F.; Fourrié, N.; Gambacorta, A.; Goldberg, M.; Guidard, V.; Zhou, D., Hyperspectral Earth Observation from IASI: Five Years of Accomplishments. Bull. Am. Meteorol. Soc. 2012, 93, 347-370. [CrossRef]
- EUMETSAT, IASI Level 2: Product Guide, EUM/OPS-EPS/MAN/04/0033.
- Ackerman, S., Using the radiative temperature difference at 3.7 and 11-μm to track dust outbreaks, Remote Sens. Environ. 1989, 27, 129-133. [CrossRef]
- Clarisse, L.; Coheur, P.F.’; Prata, F.; Hadji-Lazaro, J.; Hurtmans, D.; Clerbaux, C., A unified approach to infrared aerosol remote sensing and type specification, Atmos. Chem. Phys. 2013, 13. [CrossRef]
- EUMETSAT, IASI Level 2: Product Generation Specification, EPS.SYS.SPE.990013.
- Washington, R.; Todd, M.; Engelstaedter, S.; Mbainayel, S.; Mitchell, F., Dust and the low-level circulation over the Bodélé Depression, Chad: Observations from BoDEx 2005. J. Geophys. Res. 2006, 111. [CrossRef]
- De Rosa, B.; Mytilinaios, M.; Amodeo, A.; Colangelo, C.; D’Amico, G.; Dema, C.; Gandolfi, I.; Giunta, A.; Gumà-Claramunt, P.; Laurita, T.; Lolli, S.; Papagiannopoulos, N.; Papanikolaou, C. A.; Rosoldi, M.; Donato, S.; Mona, L., Observations of Saharan Dust Intrusions over Potenza, Southern Italy, During 13 Years of Lidar Measurements: Seasonal Variability of Optical Properties and Radiative Impact. Remote Sens. 2025, 17, 453. [CrossRef]
- Pacheco, S.; Guidos-Fogelbach, G.; Pawankar, R.; D’Amato, G.; Latour-Staffeld, P.; Urrutia-Pereira, M.; Kesic, M.; Hernandez, M., Climate Change and Global Issues in Allergy and Immunology, J. Allergy Clin. Immunol. 2021, 148. [CrossRef]
- Mayol-Bracero, O.; Prospero, J.; Sarangi, B.; Andrews, E.; Colarco, P.; Cuevas, E.; Girolamo, L.; Garcia, R.; Gaston, C.; Holben, B.; Ladino, L.; León, P.; Losno, R.; Martínez, O.; Martínez-Huertas, B.; Molinie, J.; Muller-Karger, F.; Otis, D.; Zuidema, P., “Godzilla”, the extreme African dust event of June 2020: Origins, Transport, and Impact on Air Quality in the Greater Caribbean Basin. Bull. Am. Meteorol. Soc. 2025. [CrossRef]
- Chang, C.H.; Hosseinpour, F., Relationships between Aerosols and Marine Clouds during the “Godzilla” Dust Storm: Perspective of Satellite and Reanalysis Products. Atmos. 2023, 15, 13. [CrossRef]
- Jackson, J.; Liu, H.; Laszlo, I.; Kondragunta, S.; Remer, L.; Huang, J.; Huang, H.-C., Suomi-NPP VIIRS aerosol algorithms and data products, J. Geophys. Res. 2013, 118. [CrossRef]
- Whitburn, S.; Clarisse, L.; Crapeau, M.; August, T.; Hultberg, T.; Coheur, P.F.; Clerbaux, C., A CO2-independent cloud mask from Infrared Atmospheric Sounding Interferometer (IASI) radiances for climate applications. Atmos. Meas. Tech. 2022, 15, 6653-6668. [CrossRef]
- 41. CIMEL manual.
- Torres, O.; Bhartia, P.; Herman, J.; Sinyuk, A.; Ginoux, P.; Holben, B., A Long-Term Record of Aerosol Optical Depth from TOMS Observations and Comparison to AERONET Measurements, J. Atmos. S. 2002, 59. [CrossRef]
- Smirnov, A.; Holben, B.; Eck, T.; Slutsker, I.; Chatenet, B.; Pinker, R., Diurnal variability of aerosol optical depth observed at AERONET (Aerosol Robotic Network) sites, Geophys. Res. Lett. 2002, 29. [CrossRef]
- Eck, T.; Holben, B.; Reid, J,.; Dubovik, O.; Smirnov, A.; Smirnov, N.; Slutsker, I.; Kinne, S., Wavelength dependence of the optical depth of biomass burning, urban, and desert dust aerosols, J. Geophys. Res. 1999, 104349, 333-31. [CrossRef]
- Dubovik, O.; Holben, B.; Eck, T.; Smirnov, A.; Kaufman, Y.; King, M.; Tanré, D.; Slutsker, I., Variability of Absorption and Optical Properties of Key Aerosol Types Observed in Worldwide Locations. J.bAtmos. S. 2002, 59, 590-608. [CrossRef]
- Raptis, P.; Kazadzis, S.; Amiridis, V.; Gkikas, A.; Gerasopoulos, E.; Mihalopoulos, N., A Decade of Aerosol Optical Properties Measurements over Athens, Greece, Atmos. 2020, 11, 154. [CrossRef]
- Zachary, M.; Niu, S.; Lü, J., Aerosol Optical and Micro-Physical Characteristic Derived from AERONET in Kenya*, Open Access Lib. J. 2018, 5, 1-16. [CrossRef]
- Basheer, K.; Rajab, J.; Al-Salihi, A., Climatology and classification of aerosols based on optical properties over selected stations in Iraq. AIP Conf. Proc. 2020, 2290, 050041 . [CrossRef]
- Ashrafi, K.; Shafiepour-Motlagh, M.; Aslemand, A.; Ghader, S., Dust storm simulation over Iran using HYSPLIT. Iran. J. Environ. Health Sci. Eng. 2014, 12, 9. [CrossRef]
- Varga, G., Spatio-temporal distribution of dust storms - A global coverage using NASA TOMS aerosol measurements, Foldrajzi Ertesito. Hung. Geogr. Bull. 2012, 61, 275-298.
- Schepanski, K., Transport of Mineral Dust and Its Impact on Climate. Geosci. J. 2018, 8, 151. [CrossRef]
- Tindan, J.; Jin, Q.; Pu, B., Understanding day-night differences in dust activities over the dust belt of North Africa, the Middle East, and Asia, Atmos. Chem. Phys. 2022, 23, 5435–5466. [CrossRef]
Figure 1.
Μajor mineral dust sources around the world (As per Figure 1 from Alsharif et al., 2020).
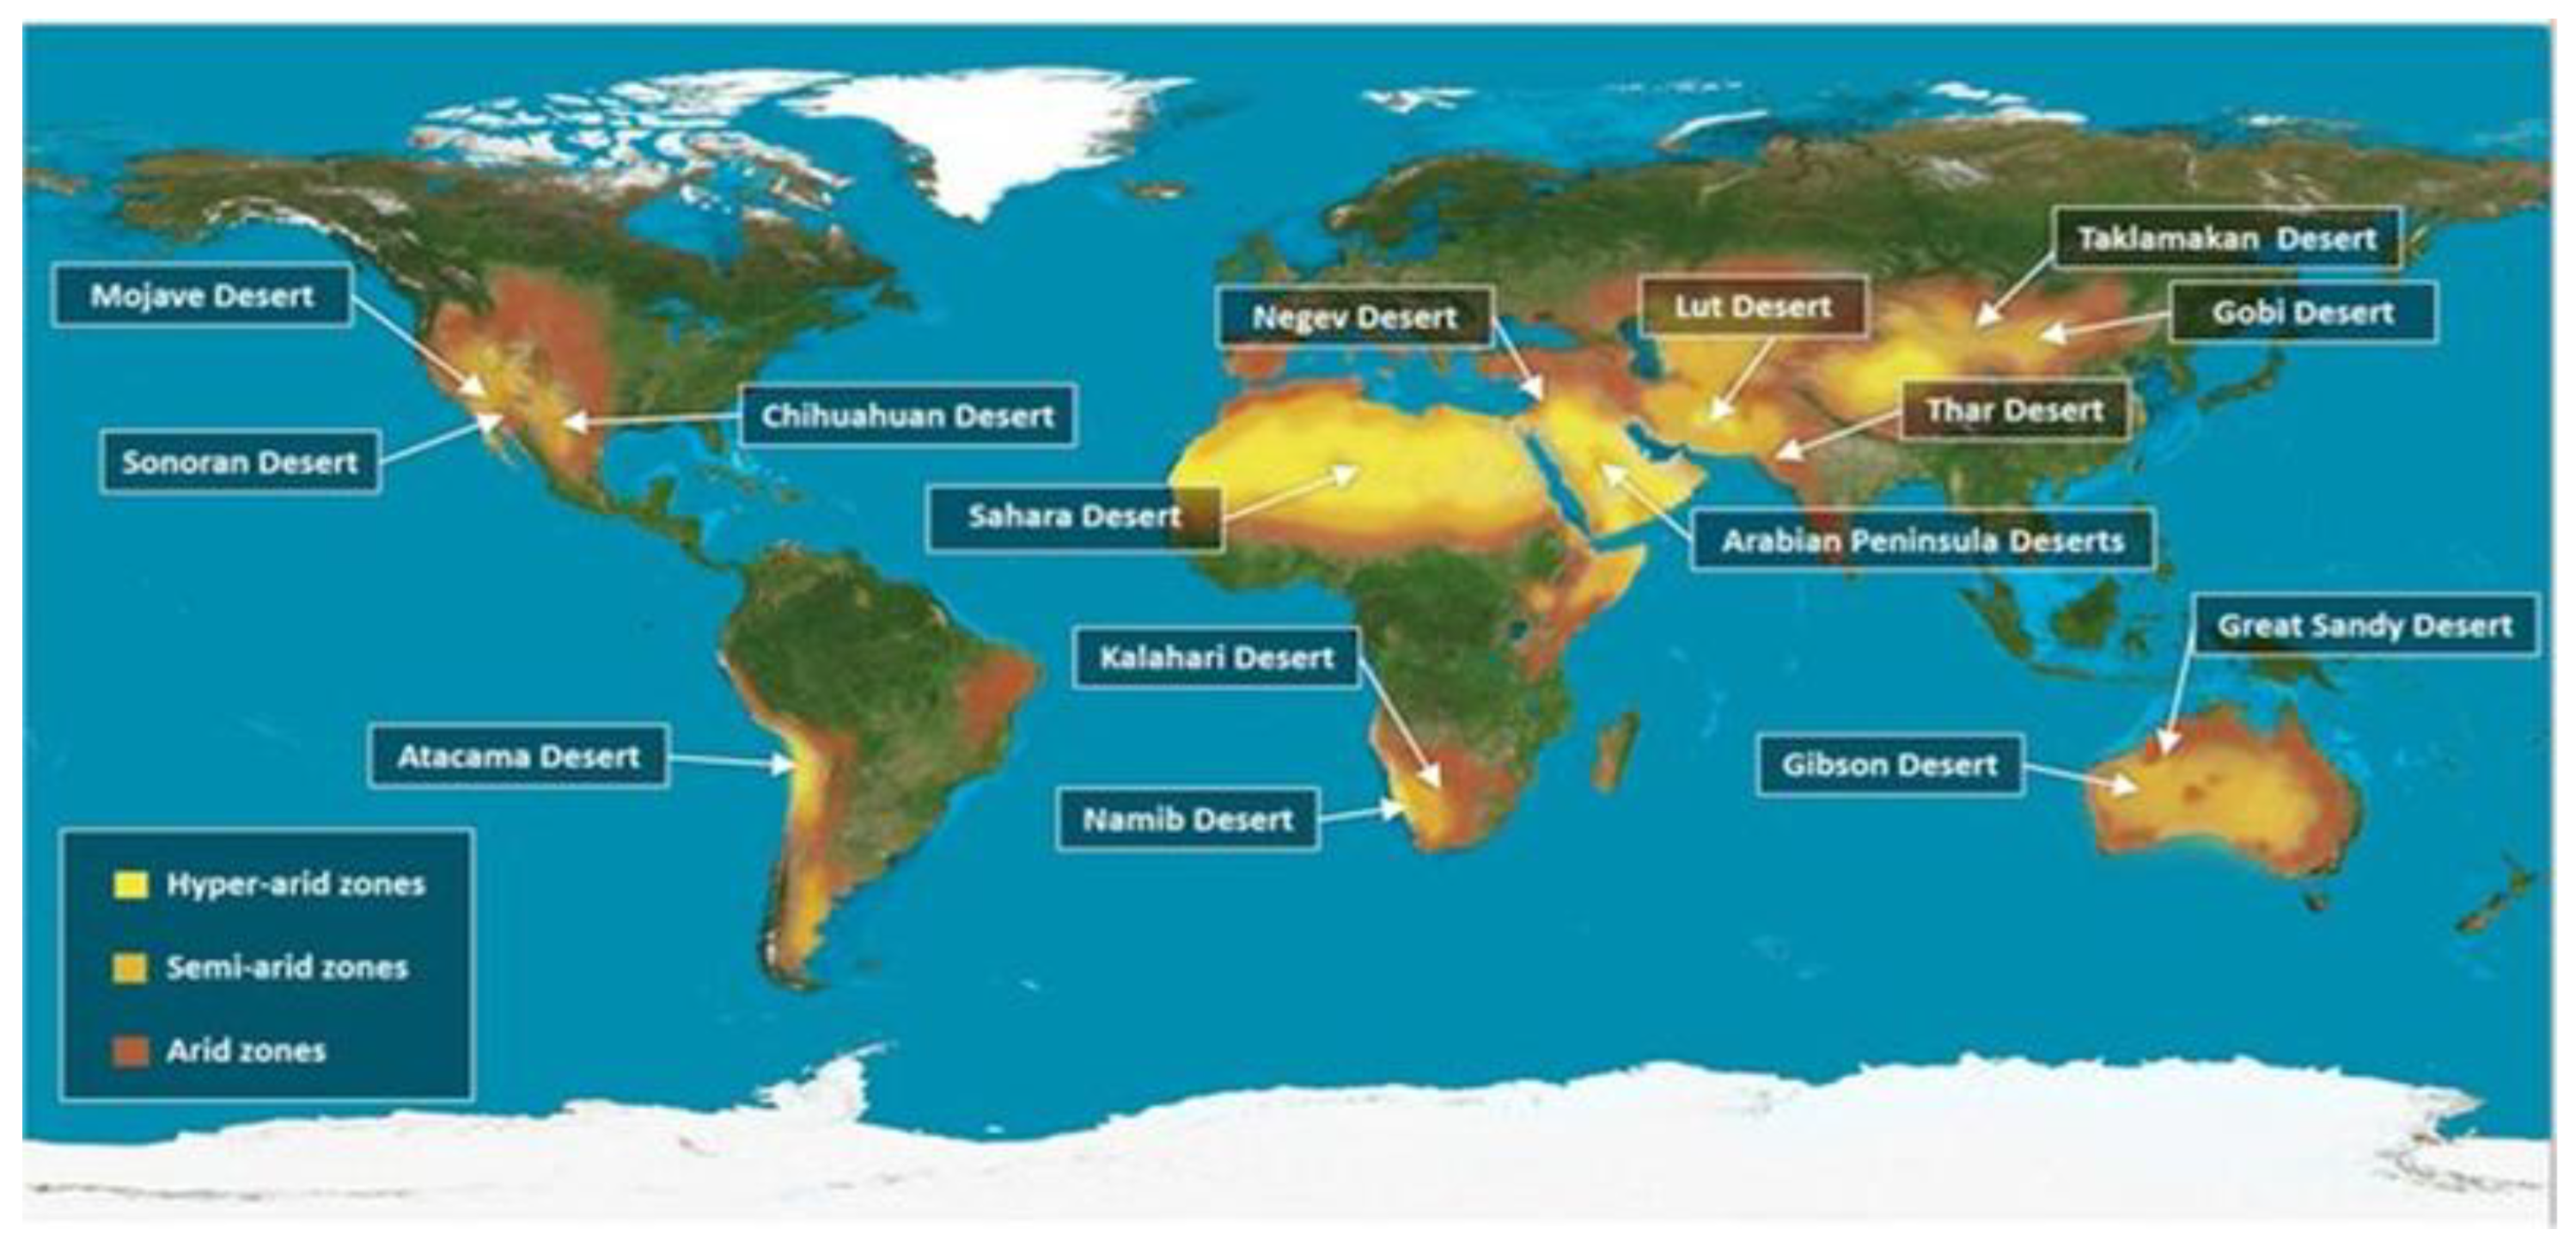
Figure 2.
Dust transport cases over the Atlantic (“Godzilla” events) during July 11, 2023 and February 21, 2023 as derived by (left) VIIRS Suomi (https://wvs.earthdata.nasa.gov/) and IASI-C (right).
Figure 2.
Dust transport cases over the Atlantic (“Godzilla” events) during July 11, 2023 and February 21, 2023 as derived by (left) VIIRS Suomi (https://wvs.earthdata.nasa.gov/) and IASI-C (right).
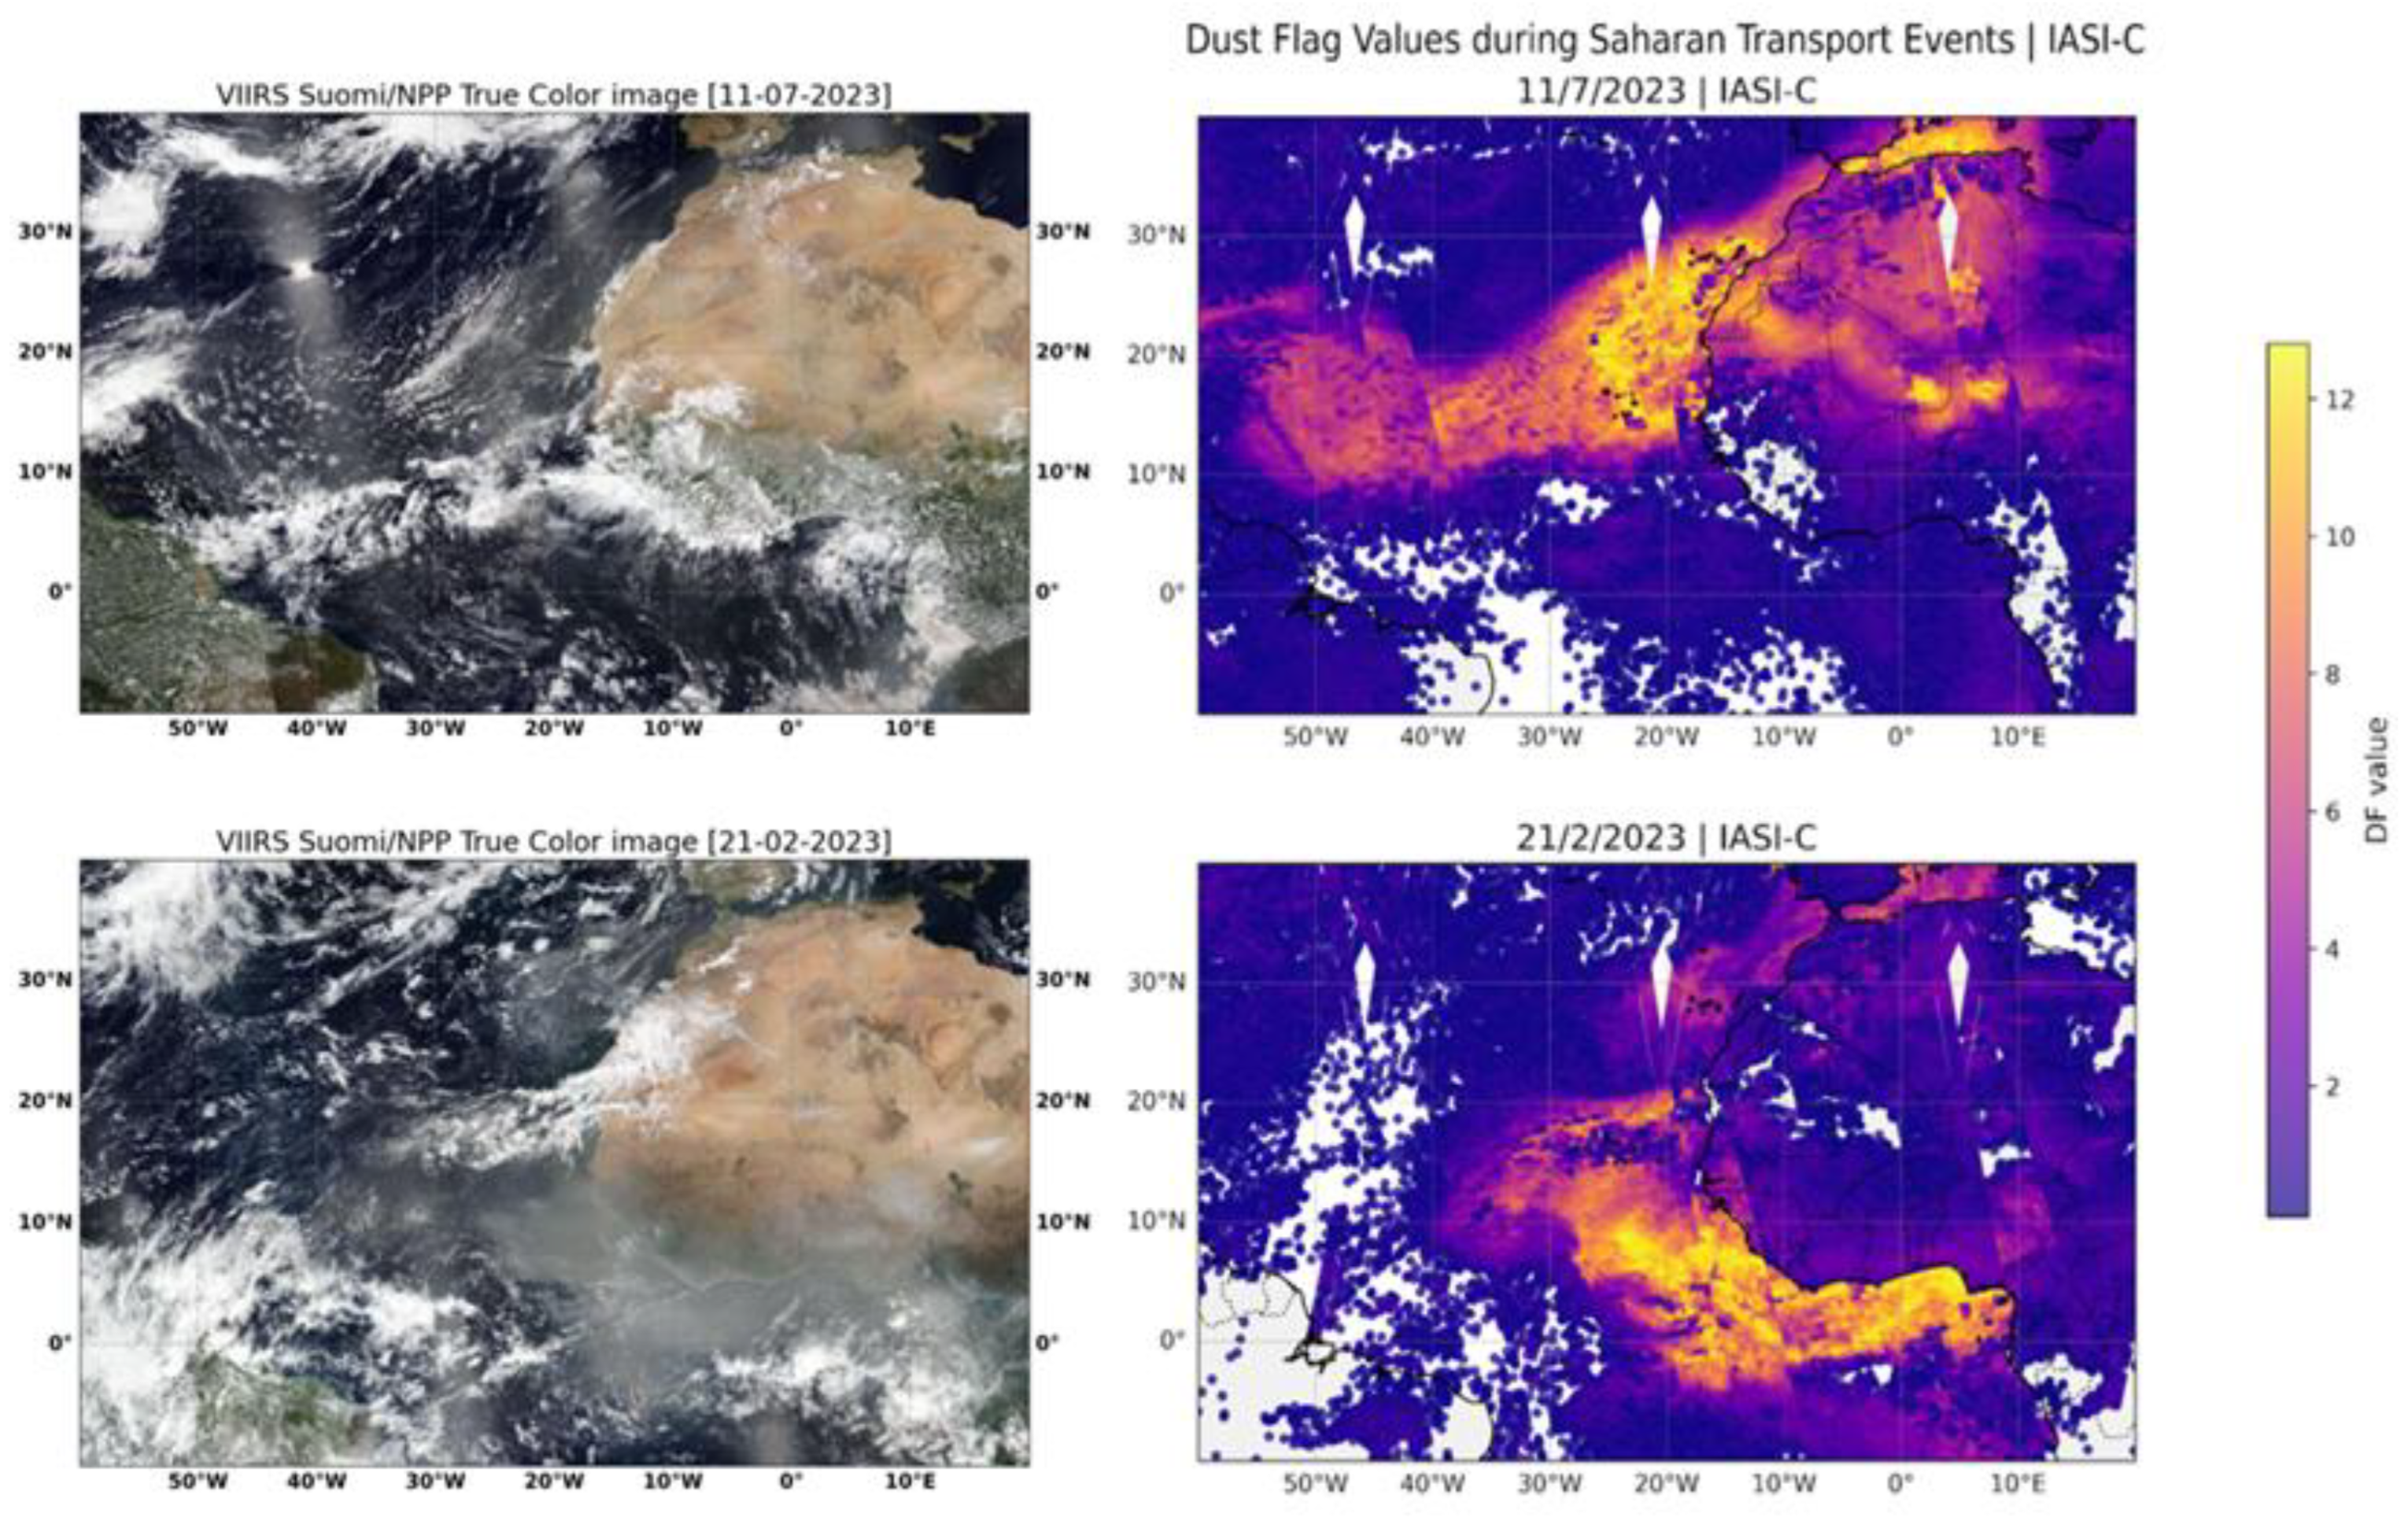
Figure 3.
In total, 120 AERONET sites were selected for the evaluation of the IASI/MetOp Dust Flag.
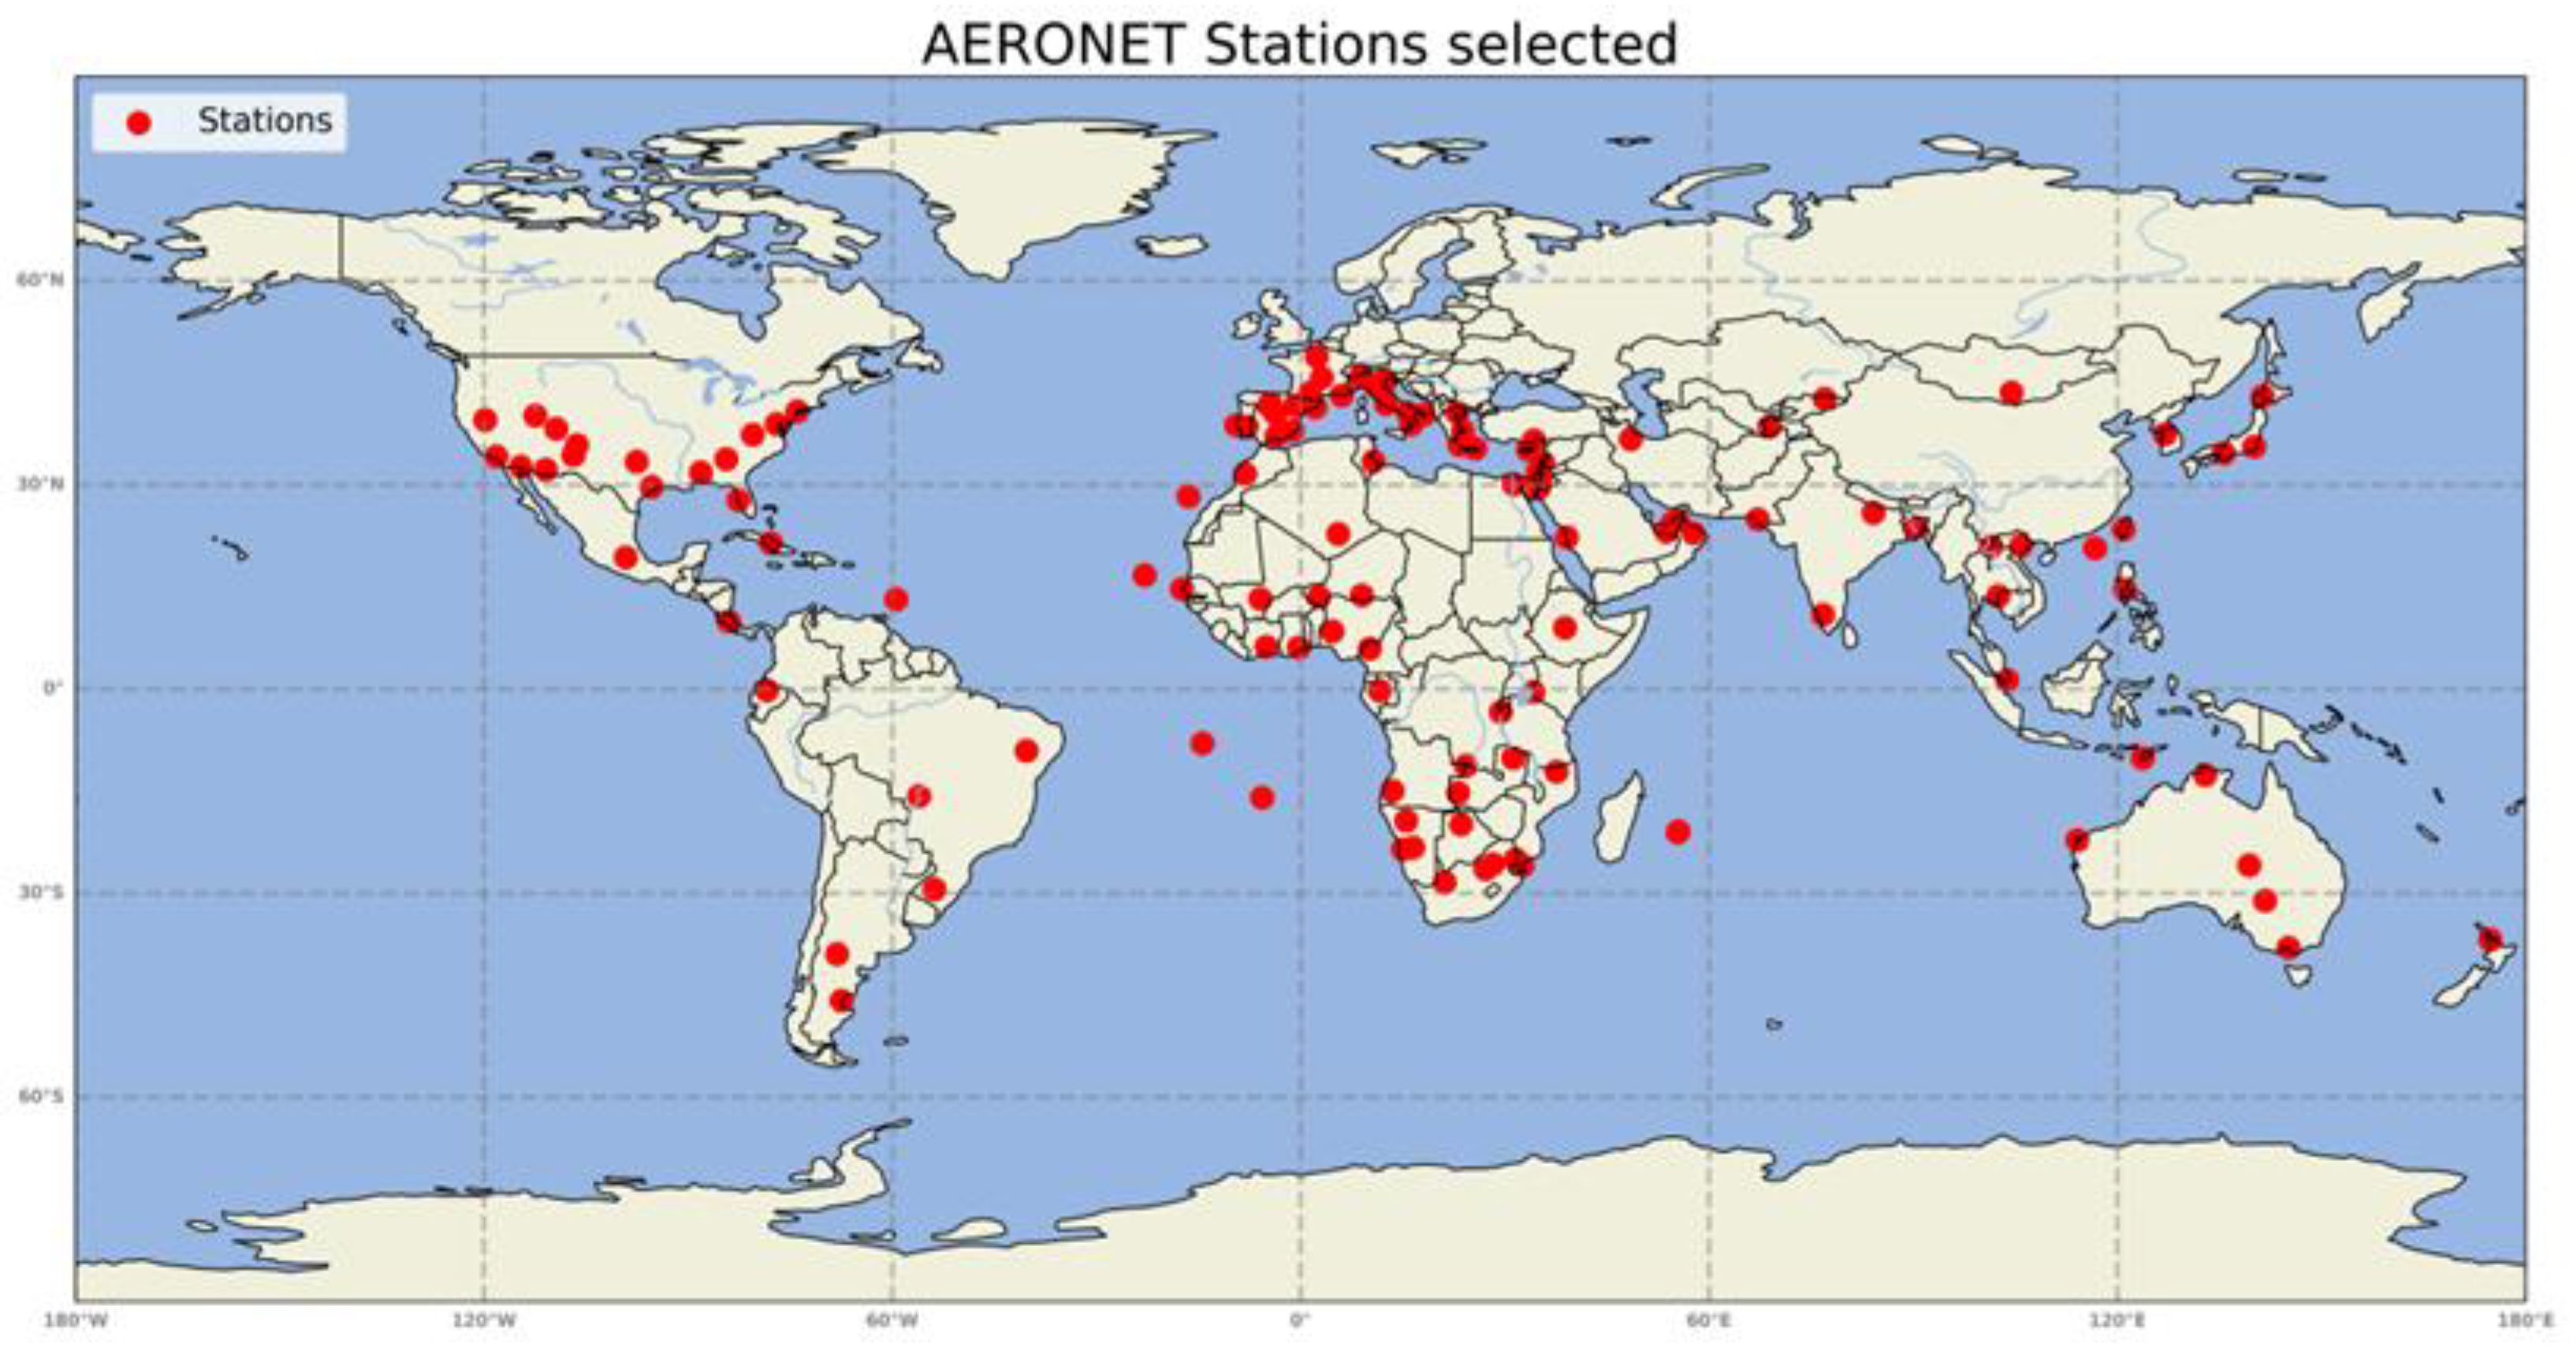
Figure 4.
Retrieved aerosol categories using AOD and AE threshold values for the 120 selected AERONET stations, based on Dubovik et al., 2002 and Raptis et al., 2020.
Figure 4.
Retrieved aerosol categories using AOD and AE threshold values for the 120 selected AERONET stations, based on Dubovik et al., 2002 and Raptis et al., 2020.
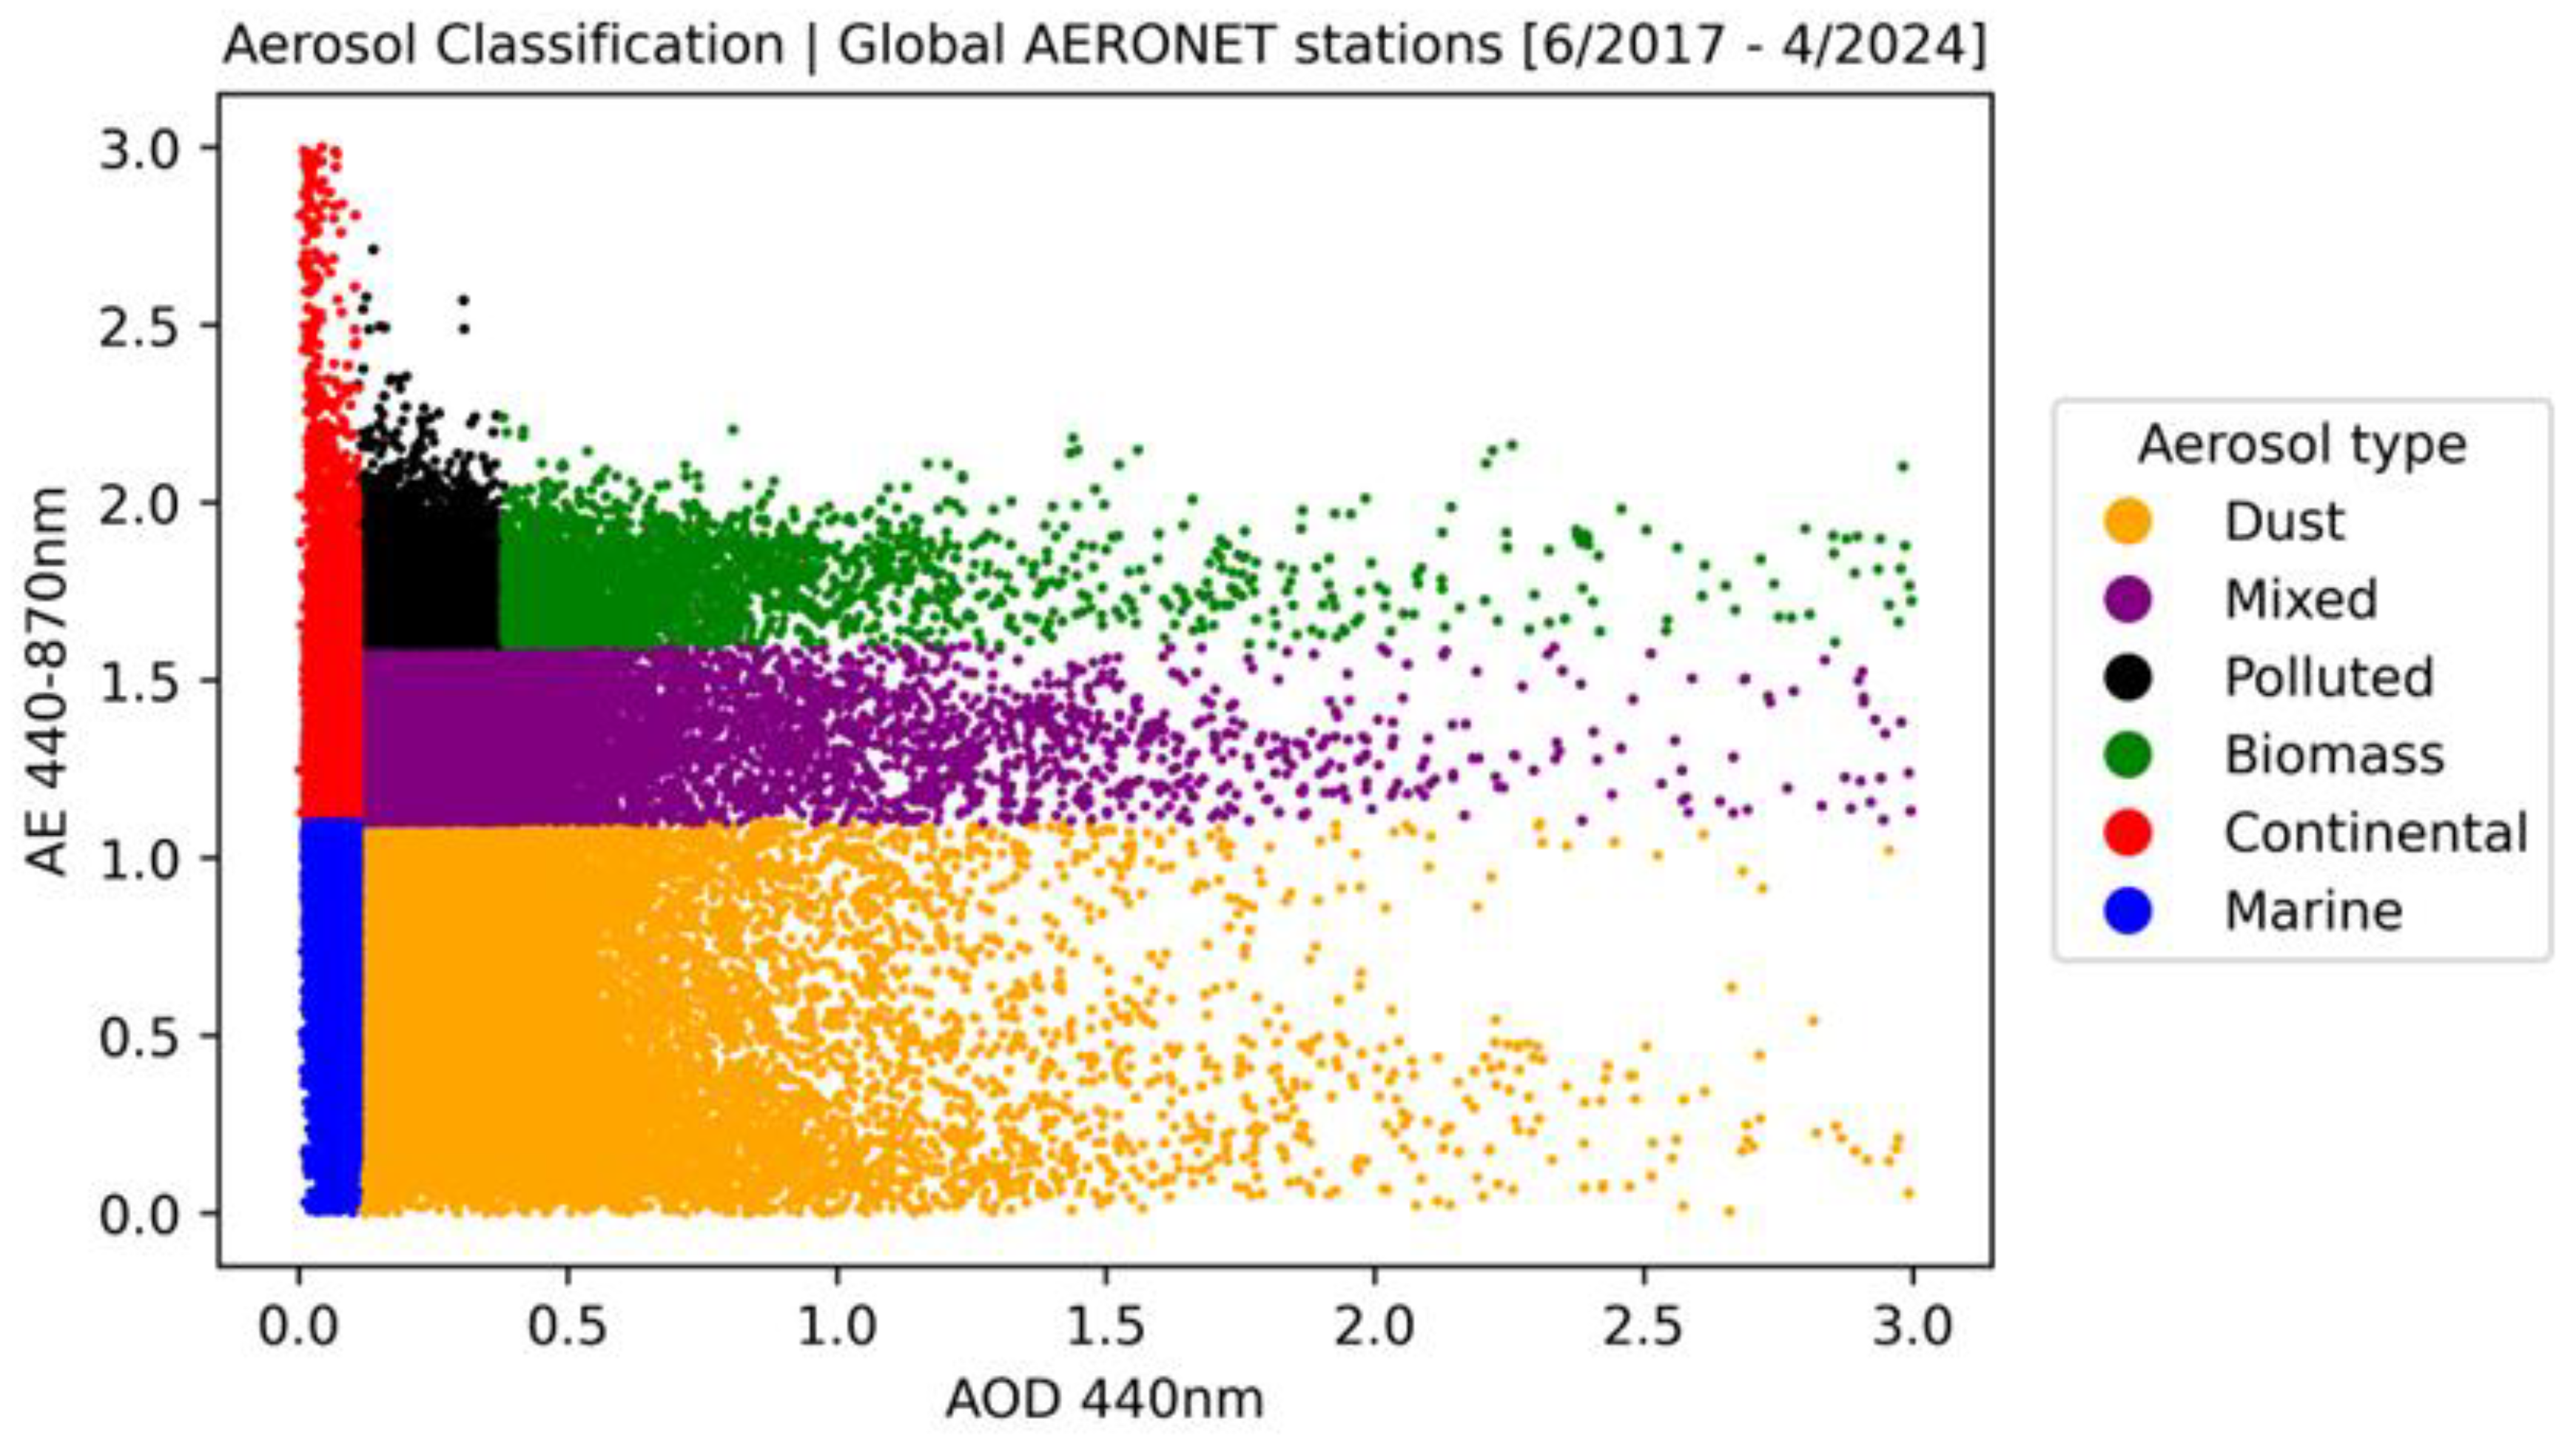
Figure 5.
IASI Dust Flag histogram per aerosol type, showcasing an exponential-like decay. The dust contribution percentage, shown on top of each Dust Flag bin, is found to increase with increasing Dust Flag value.
Figure 5.
IASI Dust Flag histogram per aerosol type, showcasing an exponential-like decay. The dust contribution percentage, shown on top of each Dust Flag bin, is found to increase with increasing Dust Flag value.
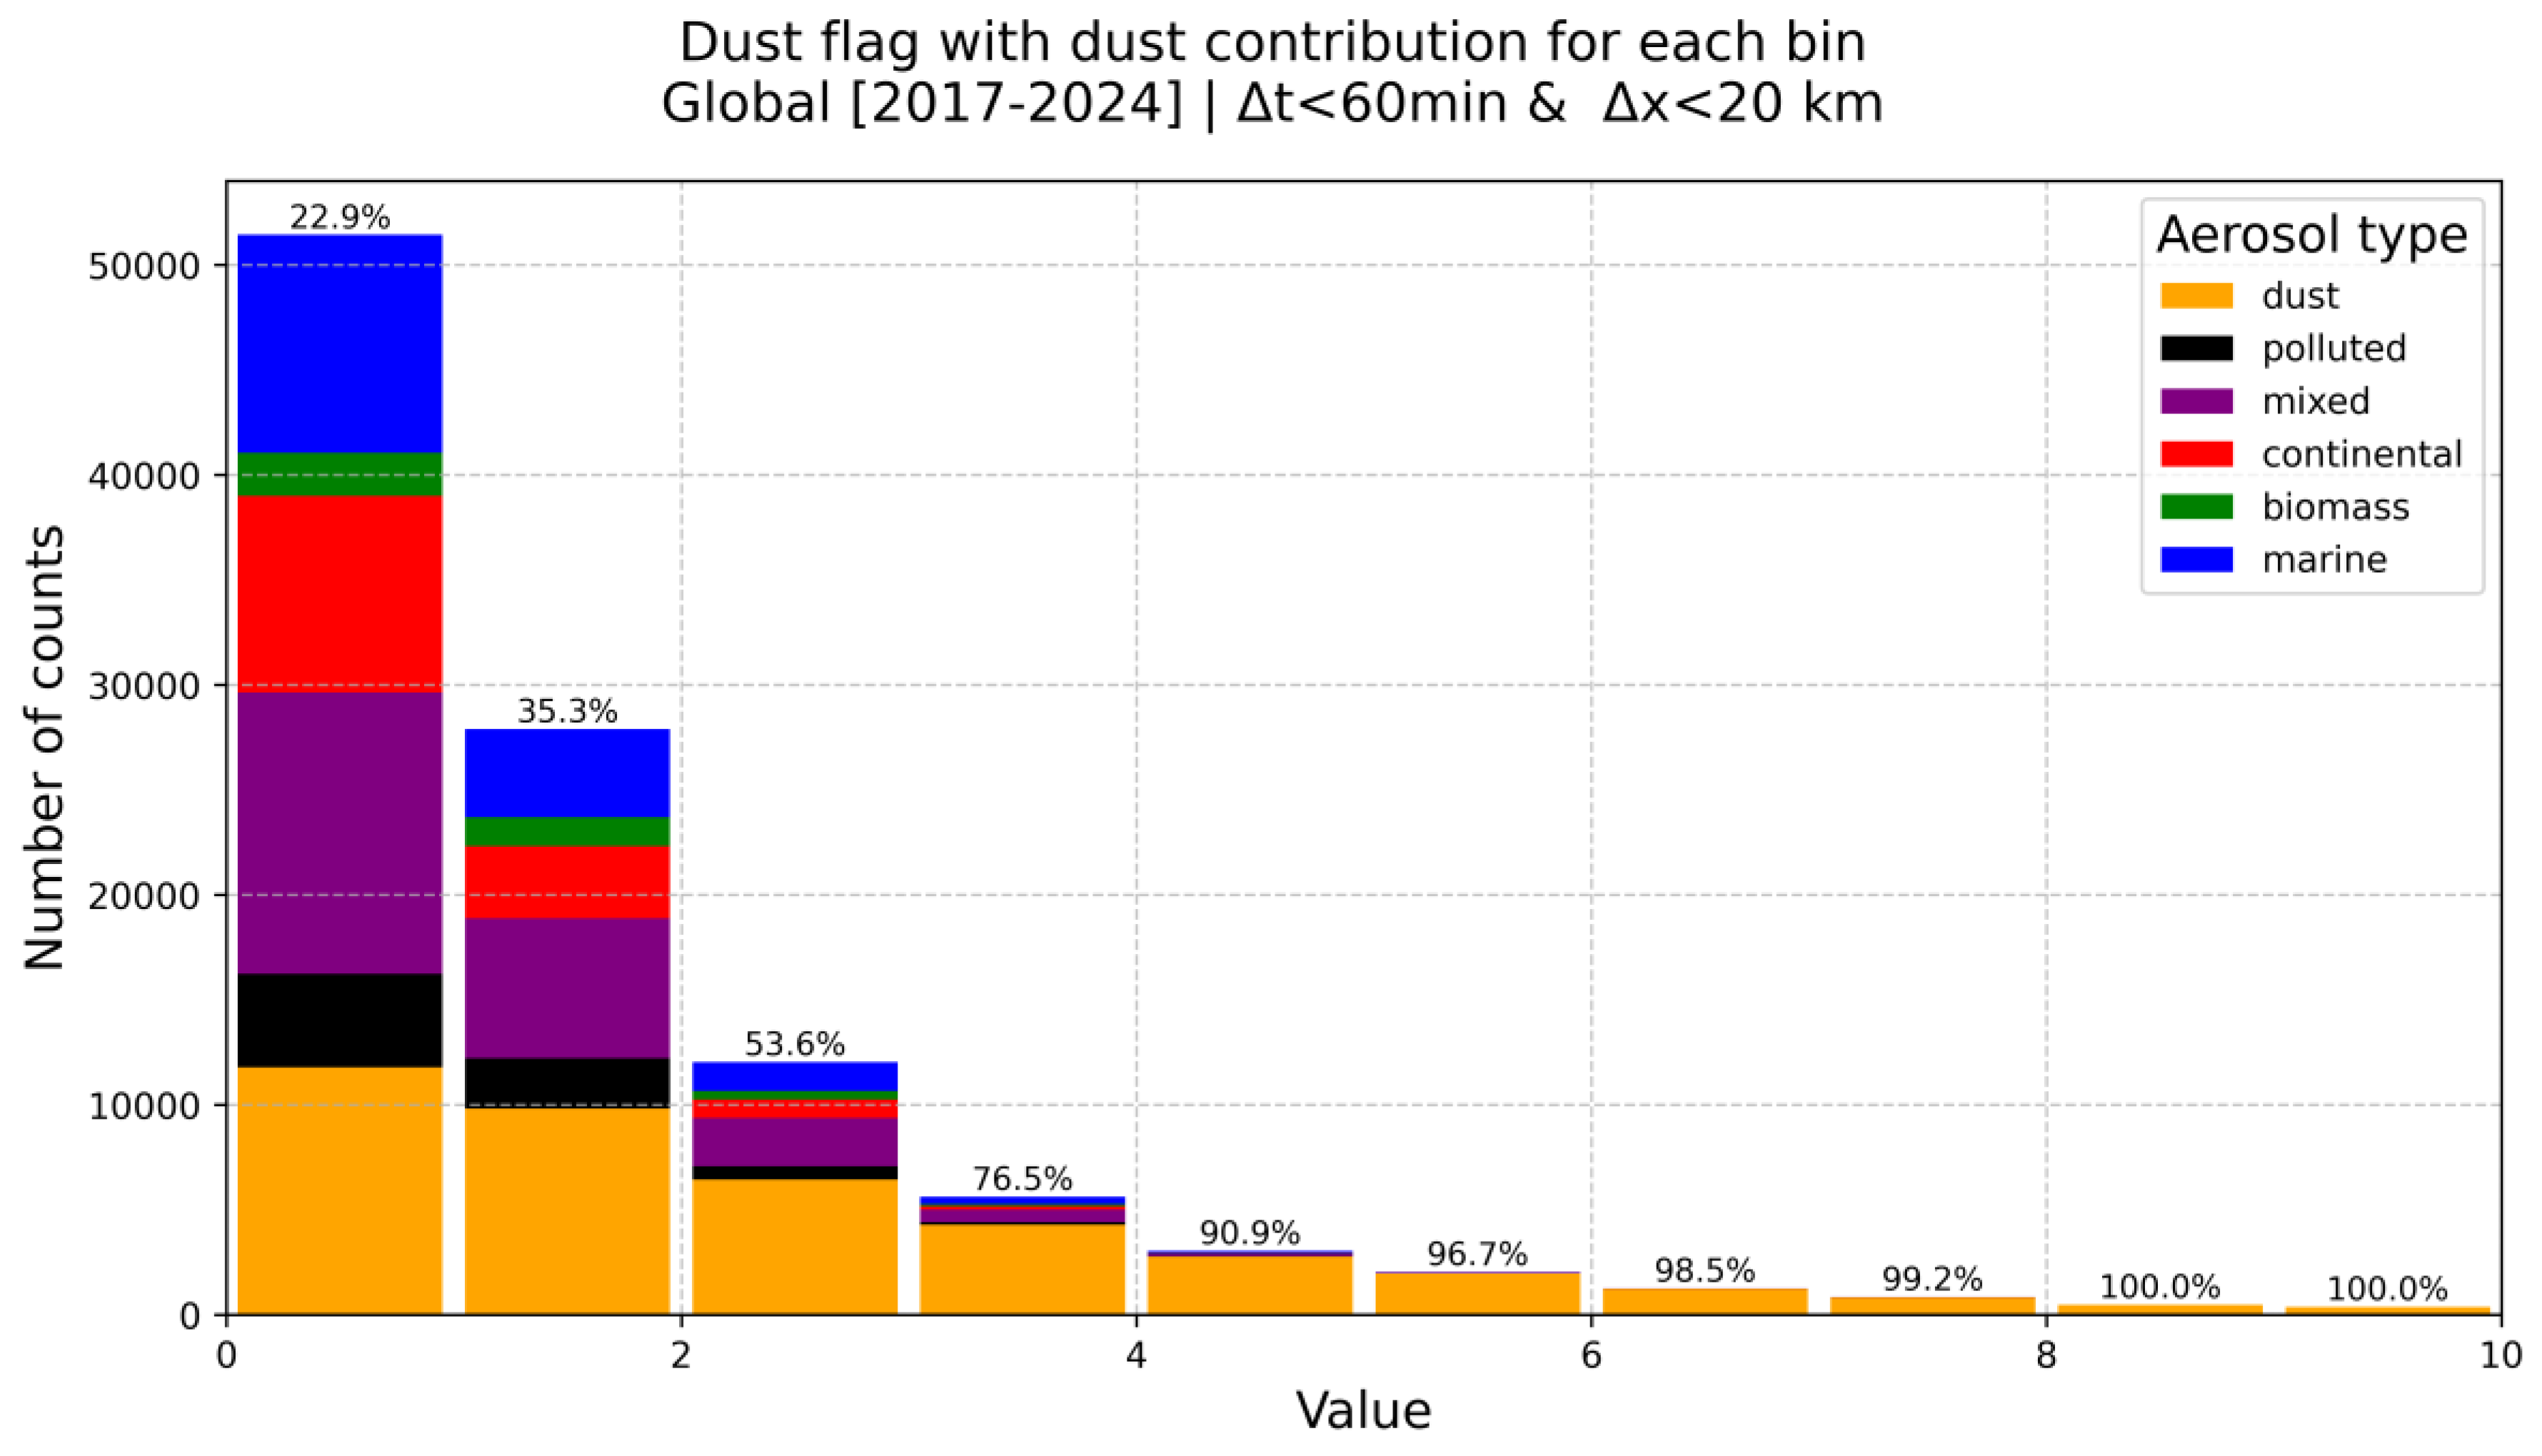
Figure 6.
The agreement Score between IASI and AERONET. When IASI detects dust (Figure 6a), dust particles dominate according to AERONET at 74.12%. When IASI does not detect dust (Figure 6b), no category is standing out, with the contribution of the three major aerosol types being similar.
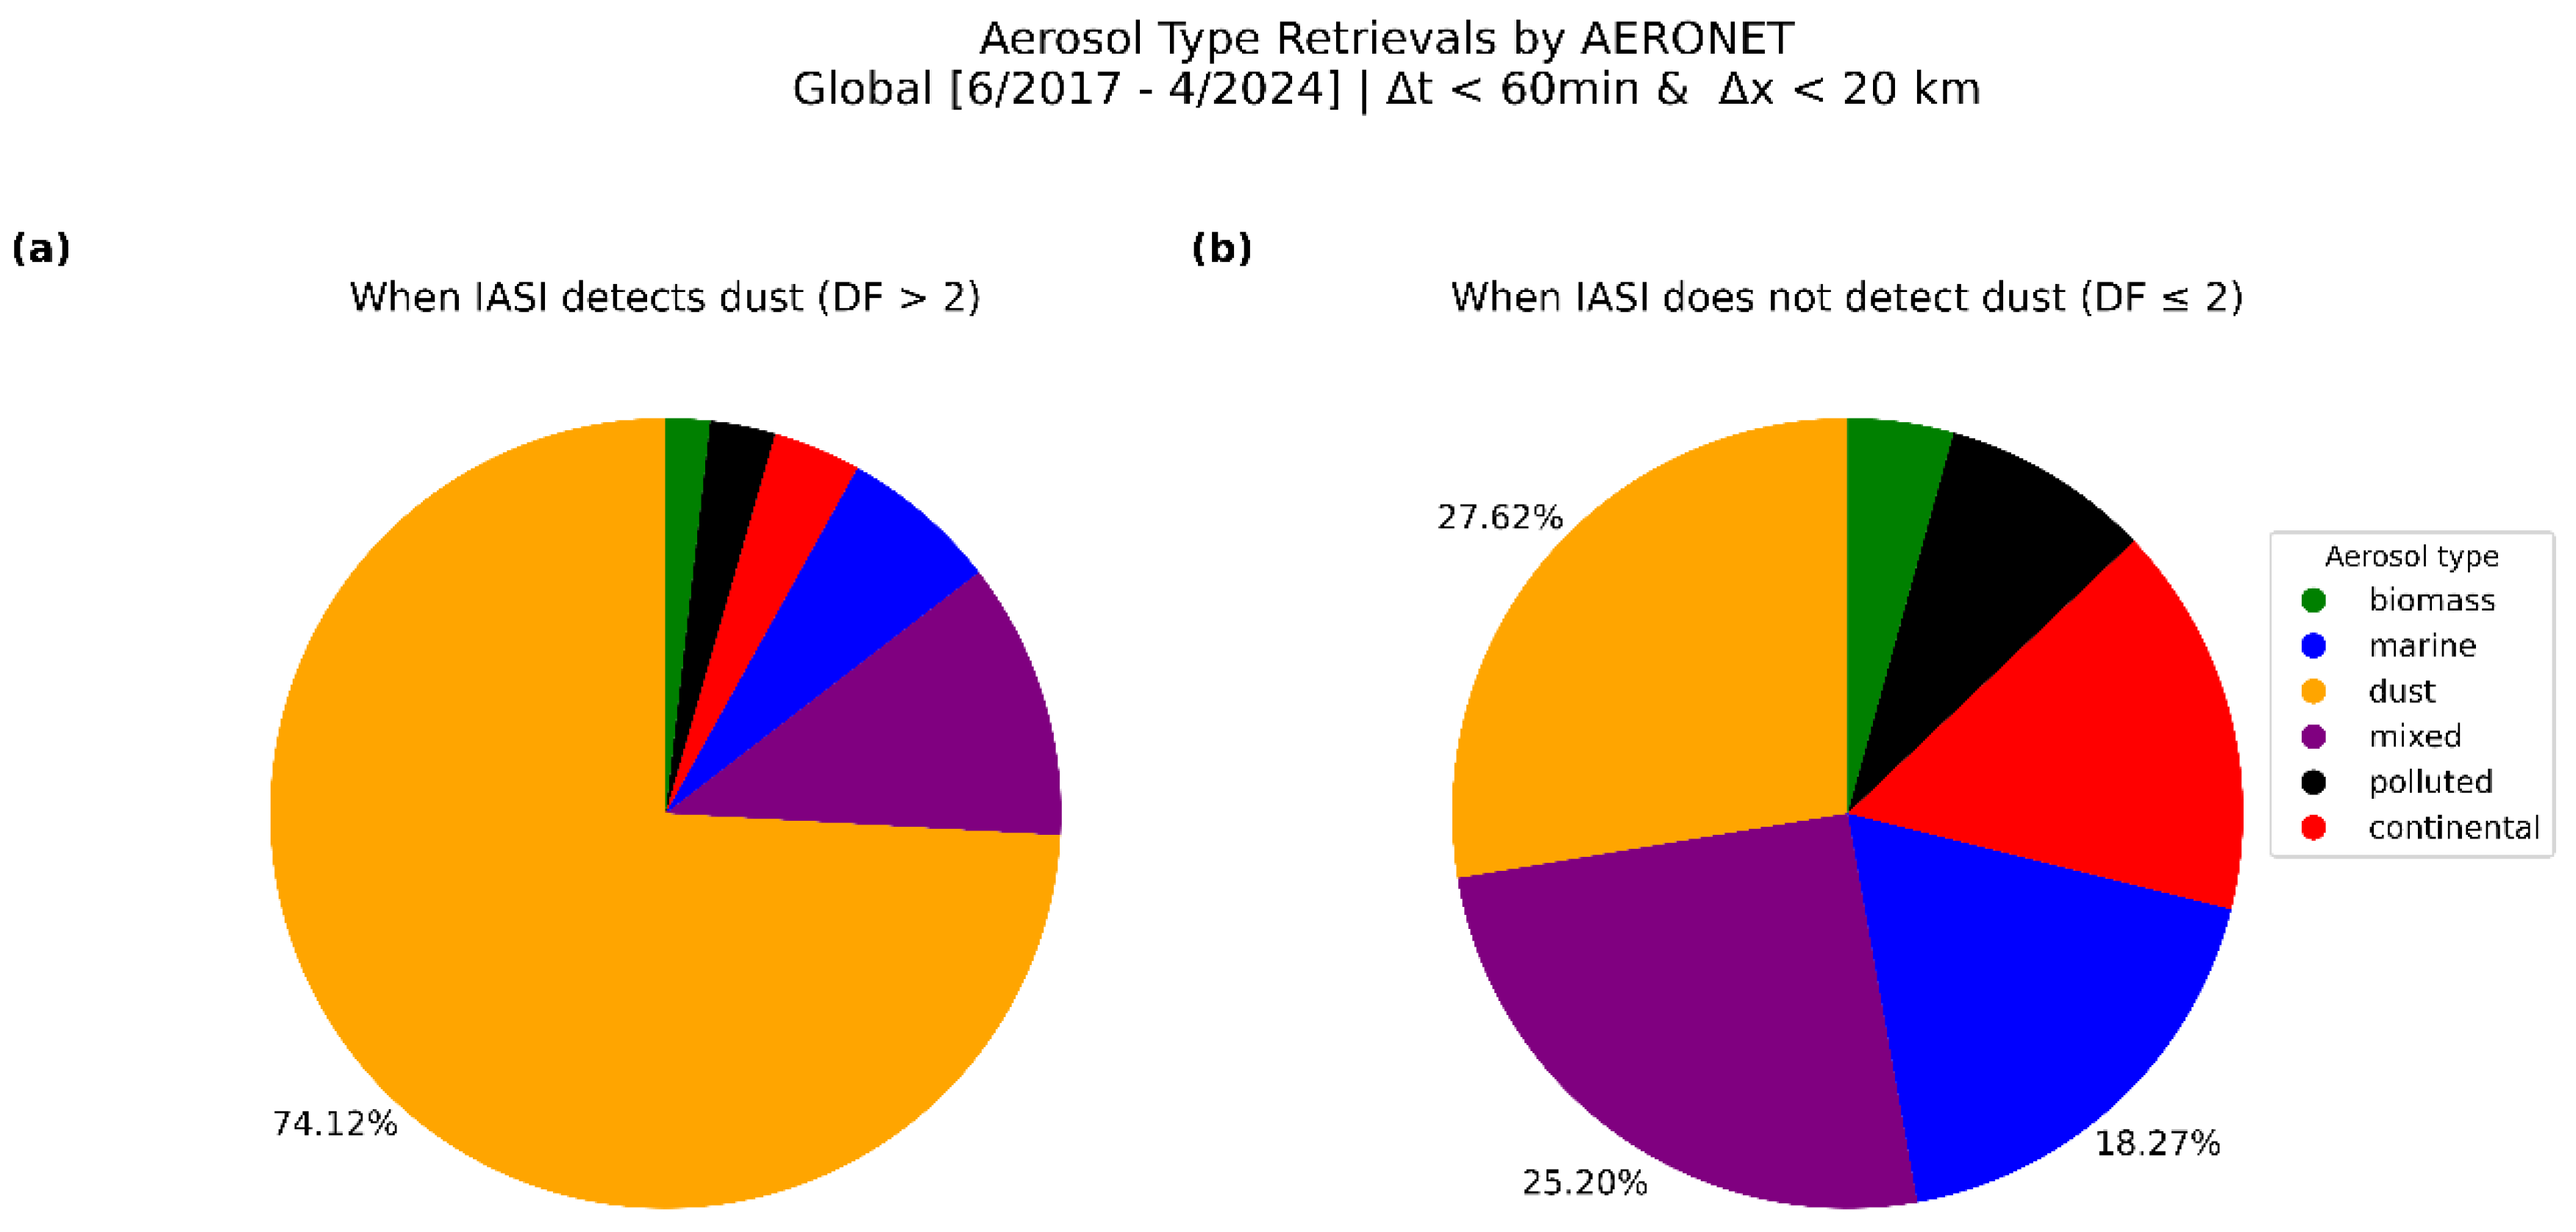
Figure 7.
Mean Aerosol Optical Depth and Angstrom Exponent for each Dust Flag bin (7a) indicate that the highest Dust Flag values correspond to higher dust particle loading. Scatterplot depicting Dust Flag values (7b) compared with AOD and AE. The dashed line indicates the dust cluster derived by AERONET based on Dubovik et al., 2006 ; Raptis et al., 2020. The highest Dust Flag values are found in the bottom left corner of the plot, way inside the dust cluster.
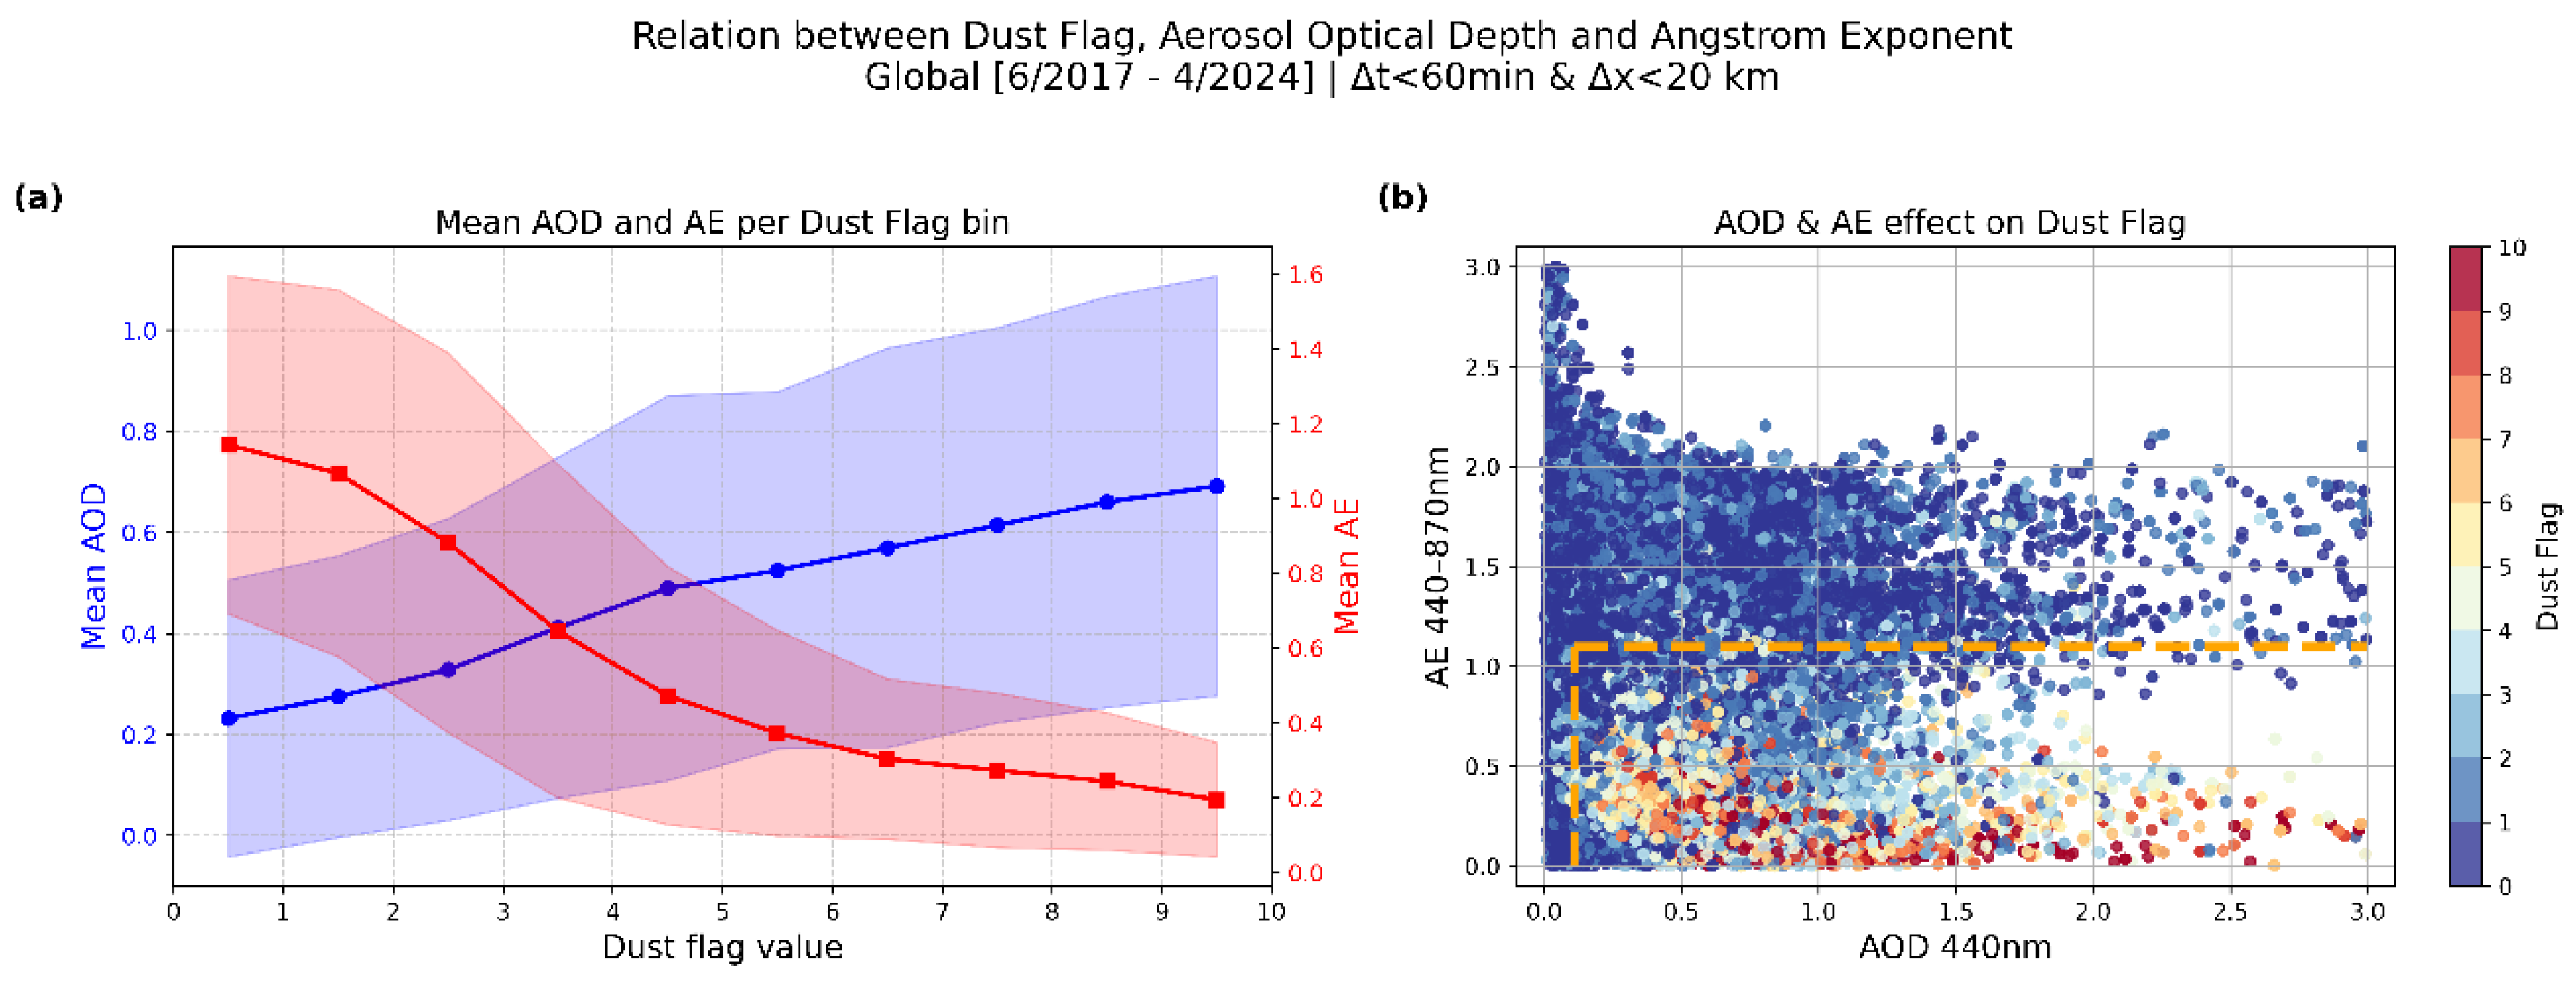
Figure 8.
Scatterplots of AOD 440nm versus AE 440–870nm for non-dust (a) and dust (b) events, according to IASI. The dashed lines denote the dust classification regions of the aerosol typing scheme. Color scale indicates point density, with maximum values corresponding to the most probable AOD–AE combinations.
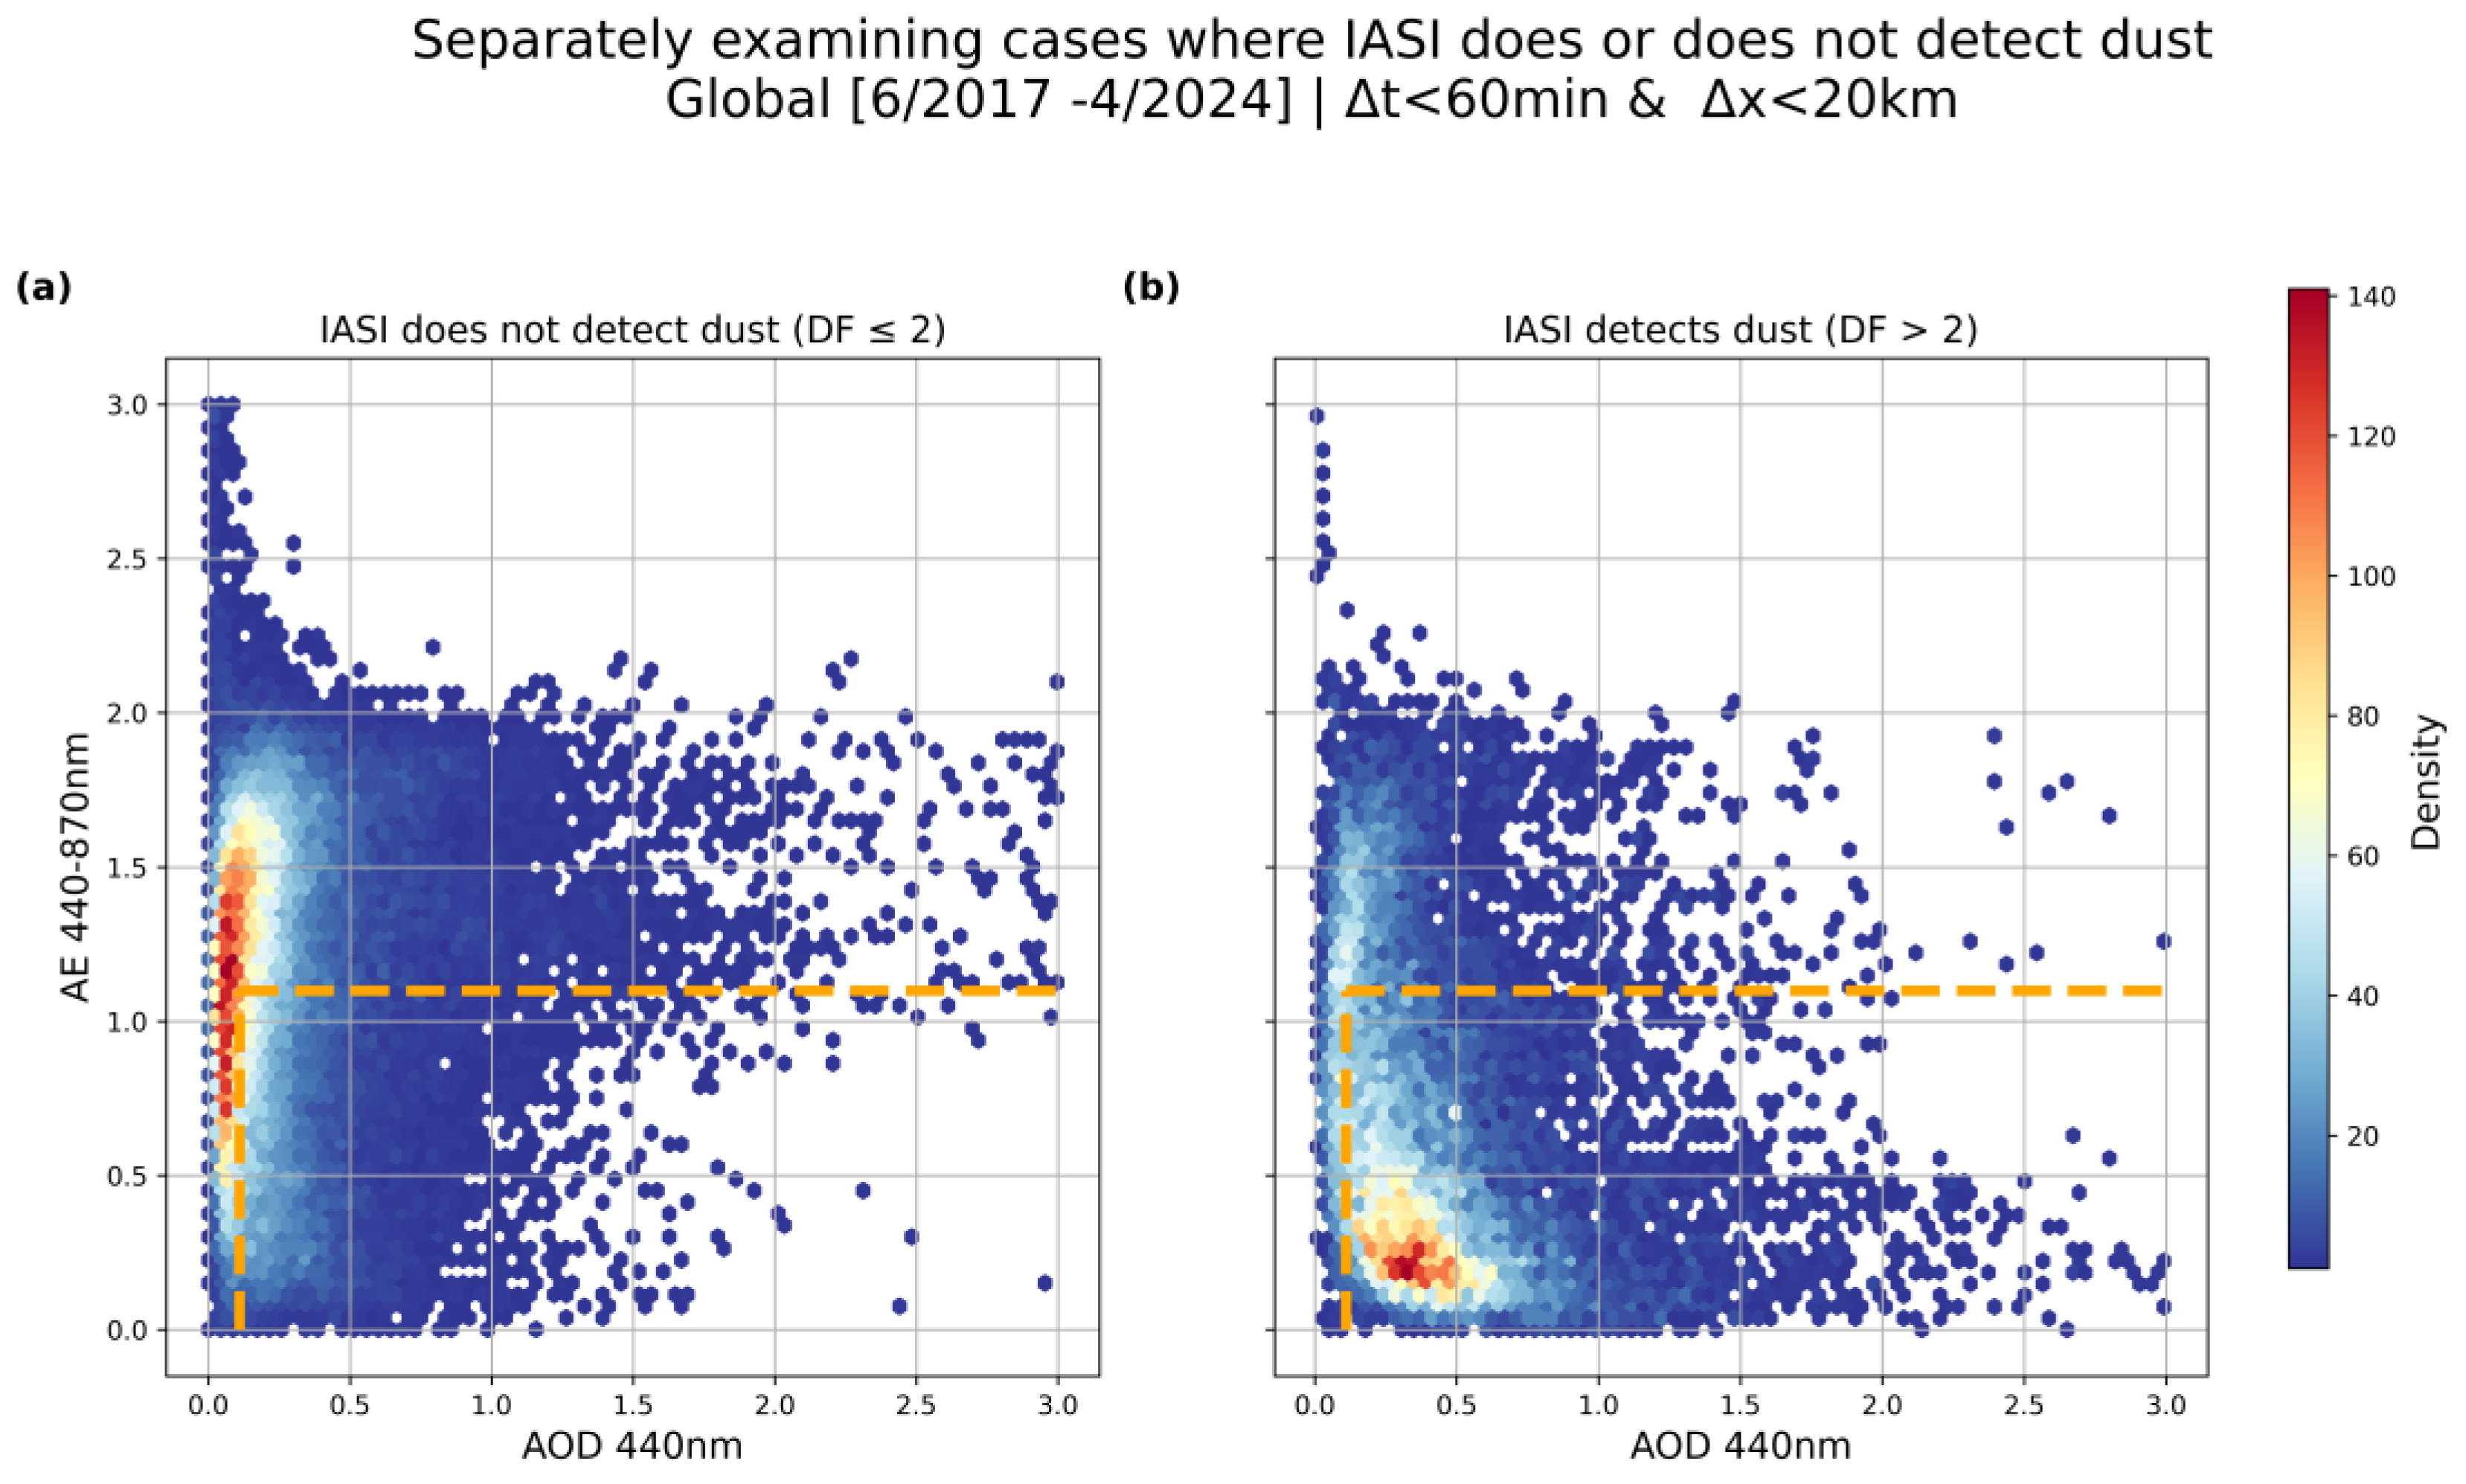
Figure 9.
Spatial variability of the Agreement Score between IASI and AERONET around the globe. Circles with reddish hues indicating the stations with the highest agreement score, above 60%, form a distinct dust belt ranging from Central America to eastern Asia. These stations are located inside or close to major dust sources, such as the Sahara and the Arabian deserts. Stations at Central America are the recipients of dust particles transported over the At-lantic, originating from northern Africa.
Disclaimer/Publisher’s Note: The statements, opinions and data contained in all publications are solely those of the individual author(s) and contributor(s) and not of MDPI and/or the editor(s). MDPI and/or the editor(s) disclaim responsibility for any injury to people or property resulting from any ideas, methods, instructions or products referred to in the content. |
© 2025 by the authors. Licensee MDPI, Basel, Switzerland. This article is an open access article distributed under the terms and conditions of the Creative Commons Attribution (CC BY) license (http://creativecommons.org/licenses/by/4.0/).
Copyright: This open access article is published under a Creative Commons CC BY 4.0 license, which permit the free download, distribution, and reuse, provided that the author and preprint are cited in any reuse.


