
Submitted:
20 August 2025
Posted:
22 August 2025
You are already at the latest version
Abstract
Directive (EU) 2024/2881 introduces stricter daily standards and alert thresholds for particulate matter, which will be applicable starting in 2030. Member States must transpose these standards by 2027. This study retrospectively applies the new framework to daily data from three urban areas in Romania from 2019 to 2024. The objective is to evaluate the risks of noncompliance and test additional, more sensitive indicators of pollution severity and source characteristics. The results show that the new standards would cause the daily and annual limits for PM2.5 and PM10 to be exceeded in at least two of the three analyzed cities. Three indicators are proposed and applied: (i) Excess Concentration (EC), which quantifies the total amount of daily exceedances of the limit value; (ii) Toxic Load Index (TLI), which integrates the PM2.5/PM10 ratio as a proxy for toxicological potential; and (iii) Episode Index (EI), which captures the magnitude and duration of episodes that would trigger alert thresholds.
The study includes a summary review of the air quality legislative framework and contributes to public policy literature by emphasizing risk-proportionate interventions. The proposed indicators support a smoother transition to forthcoming Euro-pean requirements.
Keywords:
particulate matter
; PM10
; PM2.5
; Directive (EU) 2024/2881
; air pollution
; Romania
; Excess Concentration
; Toxic Load Index
; Episode Index
1. Introduction
Air pollution is considered the greatest environmental health risk in Europe [1], contributing to a significant burden of cardiovascular, respiratory, and other chronic diseases. Worldwide, air pollution is estimated to cause millions of premature deaths and lost years of healthy life each year [2].
Particulate matter (PM) is among the most harmful atmospheric pollutants [1].
The EEA’s annual estimates for Romania for 2022 attribute 17900 deaths each year (or 185100 years of life lost) to fine particulate matter PM2.5 [3].
The toxic effects of particle pollution on humans depend on the particles’ size and chemical composition [4,5].
The two regulated sizes of particulates are PM10 (particles with a diameter of 10 μm or less) and PM2.5 (particles with a diameter of 2.5 μm or less) [6,7]. Of these particles, fine particles (PM2.5) are considered the most dangerous to human health. They penetrate deep into the lungs and can reach the alveolar region [1]. There is a strong causal relationship between PM2.5 exposure and increased risk of all-cause mortality, acute respiratory infections, chronic obstructive pulmonary disease, ischemic heart disease [8,9], cancer [10] ischemic stroke [2,11].
The coarse fraction of particles, PM10-2.5(coarse fraction, particles with an aerodynamic diameter between 2.5 and 10 mm) is mainly deposited in the upper respiratory tract (thoracic region) [12]. Exposure to this type of PM has been associated with adverse respiratory effects, including chronic obstructive pulmonary disease, asthma, and respiratory hospitalizations. Sometimes, the short-term effects are stronger than those associated with fine particles [13].
1.1. The Legislative Framework
The European Union updates its air quality directives regularly to reflect the latest scientific findings on the connection between pollution and human health.
Directive 96/62/EC on ambient air quality assessment and management, known as the “Framework Directive,” laid the foundations for the assessment and management of ambient air quality and was supplemented by daughter directives for specific pollutants: Directive 1999/30/EC (for sulfur dioxide, nitrogen dioxide and oxides of nitrogen, particulate matter and lead), Directive 2000/69/EC (for benzene and carbon monoxide) and Directive 2002/3/EC (for ozone).
These directives were subsequently consolidated and simplified by Directive 2008/50/EC on ambient air quality and cleaner air for Europe, which became the main legislative act in this field. The World Health Organization’s (WHO) guidelines were used as a reference point for setting air quality standards. Directive 2008/50/EC was transposed into Romanian law by Law No. 104/2011 on ambient air quality.
In 2021, the WHO published new Global Air Quality Guidelines based on scientific evidence showing that air pollution has adverse effects even at exposure levels lower than previously considered safe. The document establishes significantly more restrictive guideline values for key air pollutants, including PM10 and PM2.5. These values correspond to concentrations at which the risk to health is minimal, according to the most recent scientific data [2].
In accordance with the 2021 WHO guidelines, the European Union adopted Directive (EU) 2024/2881 on ambient air quality and cleaner air for Europe. Member States shall transpose this Directive into national legislation by no later than 11 December 2026.
The directive reforms previous legislation, Directive 2008/50/EC, by introducing ambitious targets aimed at reducing the impact of pollution on health by 2030 and achieving “zero pollution” by 2050.
Directive (EU) 2024/2881 significantly reduces the limit values for PM10 and PM2.5, bringing them closer to WHO recommendations (Table 1). For example, the annual limit value for PM2.5 decreases from 25 μg/m3 to 10 μg/m3. Pentru PM10, the daily limit value is reduced from 50 μg/m3 to 45 μg/m3, with a significant reduction in the number of permitted exceedances per year from 35 to just 18 exceedances per year. A new feature is the introduction of daily limit value for PM2.5 [6,7].
The new directive provides for the establishment of alert and information plans to manage episodes of intense pollution. It sets two types of thresholds: alert thresholds, which signal a risk to the health of the entire population in the context of short-term exposure and require immediate measures; and information thresholds, which indicate an increased risk to vulnerable groups and sensitive individuals and require the rapid and appropriate dissemination of relevant information. Alert thresholds for PM10 and PM2.5 are assessed based on daily averages over a period of up to three consecutive days (or less), while information thresholds are determined based on a single day’s daily average. According to Directive (EU) 2024/2881, exceeding the alert threshold results in the activating of the short-term action plan for the protection of public health [6].
1.2. Need for Complementary Air Quality Indicators
Directive (EU) 2024/2881 establishes standard indicators for assessing air quality for PM10 and PM2.5, including annual limit values, daily limit values and the maximum number of daily exceedances, alert and information thresholds (Table 1 and Table 2). These indicators do not always capture the magnitude of daily exceedances or pollution episodes. Assessments based only on the frequency of daily exceedances or the annual average concentration may underestimate acute exposures that have significant health impacts.
In this context, we propose developing and applying complementary indicators that consider the number of exceedances, their magnitude, and the characterization of pollution sources.
This study proposes three indicators: 1) Excess Concentration (EC), which sums the excess concentration relative to the daily limit value over a calendar year, 2) Episode Index (EI), which integrates the magnitude of pollution episodes throughout each episode, and 3) Toxic Load Index, which considers both the PM2.5/PM10 ratio necessary to identify potential dominant sources of pollution and the excess relative to the limit value.
Abbey et al. [14] previously used EC in the analysis of total suspended particles and other pollutants, which highlighted the importance of including the magnitude of limit value exceedances in air quality assessments. EC also reflects exposure epidemiology principles, which state that the „cumulative dose” of a pollutant determines long-term health risks [14,15].
Epidemiological studies have shown that the adverse effects of particulate matter (PM10 and PM2.5) depend not only on the concentration level on a given day, but also on the number of consecutive days with high exposure. This justifies the need for indicators that integrate this type of data [2,15].
In this context, an additional indicator, such as the pollution episode index (EI), can provide a more precise assessment of health risks by quantifying the excess PM accumulated during the entire pollution episode when the alert threshold is exceeded.
The third indicator proposed and applied in the study is the Toxic Load Index (TLI). The TLI was designed to quantify the potential toxicological impact of fine particle PM2.5 by integrating the magnitude of exposure and the nature of the particles. This allows us to highlight the degree of risk depending on the particles’ origin or composition. Sometimes, PM10 levels are high, but the composition is dominated by coarse dust with low toxicity, such as mineral particles or Saharan dust. In other cases, the PM10 level is moderate but dominated by fine particles from combustion.
Park et al. (2018) demonstrated that the toxicity of PM2.5 particles depends on their source. They proposed a differentiated toxicity score [16], which supports the idea that an indicator combining PM2.5 excess with the PM2.5/PM10 ratio is necessary for a more accurate assessment of health risks.
A study of 4.47 million deaths in 75 U.S. cities found that the chemical composition of PM2.5 matters for health, not just its total mass. An increase of 10 μg/m3 in the two-day average of PM2.5 is linked to an overall increase in mortality of 1.18%, especially in the spring. Sulfur, silicon, and calcium amplify the risk, with sulfur correlating with a respiratory mortality increase of up to 8.96% [17]. In these situations, the TLI provides a more relevant assessment of the risk to public health.
1.3. Research Objectives and Contributions
In preparation for compliance with the new European air quality standards, this study compares the concentrations of PM10 and PM2.5 to the current and future limit values established in Directives 2008/50/EC and (EU) 2024/2881, respectively. The future limit values will be mandatory starting January 1, 2030. The analysis includes three urban background air quality monitoring stations, one industrial station in an urban area, and one rural background station to provide a representative comparison point of areas with lower anthropogenic influence. The aim is to assess compliance and identify gaps in relation to future legislative requirements to support public policy formulation.
This paper expands on two previous studies [18,19] which analyzed trends in PM10 and PM2.5 concentrations in Suceava, Botoșani, and Iași, as well as spatial differences in these three northeastern Romanian urban areas. One of these studies examined the PM2.5/ PM10 ratio as an indicator of particle origin and composition.
This study makes new contributions by integrating data from 2024 and including a rural background station as a baseline pollution level reference. It also uses three complementary indicators, which are described in Section 1.2. These improvements enable a more accurate characterization of air quality, population exposure, and proximity to the new limit values that will be mandatory starting in 2030, as outlined in Directive (EU) 2024/2881. The ultimate objective is to propose measures and recommendations to reduce PM concentrations below the future limit values and manage situations where alert thresholds are exceeded, adapted to each area.
2. Materials and Methods
2.1. Study Area
2.2. Air Quality Data
This study uses data on daily concentrations of PM10 and PM2.5. These concentrations were determined using the gravimetric reference method at air quality monitoring stations within the National Air Quality Monitoring Network from 2019 to 2024. The data are available to the public on the website https://www.calitateaer.ro (accessed on 04 June 2025).
Daily data were not collected in years when the fixed measurement data collection requirement was not met, nor when the legal requirements for data quality and aggregation, as set out in Annex 4 to Law 104/2011, were not fulfilled.
Table 3 shows the locations of the stations in the study.
2.3. Definition and Calculation of the Proposed Indicators
All of the proposed indicators relate to the future limit values established in Directive (EU) 2024/2881.
2.2.1. Excess Concentration (EC)
The EC is an additional indicator that complements the annual number of daily exceedances. It provides more information about the magnitude of daily limit value exceedances. The EC indicator for a calendar year is calculated by adding the differences between the daily concentrations of particles matter and the daily limit value. This calculation only considers days on which the limit was exceeded.
The formula for EC is given by
where
Ci = daily concentration of PM (µg/m3)
LV= daily limit value (45 µg/m3 for PM10 and 25 µg/m3 for PM2.5)
n = the duration in days when Ci > LV.
The annual EC is calculated by adding together all the daily EC values obtained from a station throughout the calendar year.
Classification thresholds for the EC indicator were established to assess the population’s exposure to particulate matter (Table 4).
These thresholds were set based on the daily limit values of 45 µg/m3 for PM10 and 25 µg/m3 for PM2.5, the maximum of 18 daily exceedances per year, as specified in Directive (EU) 2024/2881, and the daily exceedance values recorded at all air quality monitoring stations during the study period.
Based on data from all stations included in the study, the mean daily exceedance above the limit value in the future directive would be 13.1 µg/m3 for PM10. Assuming 18 permitted annual exceedances, the average annual EC would be 236 µg/m3. Rounding this value down, the lower threshold of 250 µg/m3 is chosen for PM10, which corresponds to low but frequent exposure in areas that comply with the directive.
For PM2.5, the daily excess average calculated over the entire study period was not used because the data set is more limited. Only three stations monitor PM2.5, and the available data do not fully cover all the analyzed years (Table 8). Therefore, the lower threshold for EC for PM2.5 was determined by adjusting the reference EC value for PM10 using the ratio of the corresponding daily limit values (25 µg/m3 for PM2.5 and 45 µg/m3 for PM10). This results in an adjustment factor of 0.56, corresponding to a reference EC of approximately 140 µg/m3.
However, the data analysis shows that the EC of 142 µg/m3 was reached at the SV-1 station in 2022 with only 15 values above 25 µg/m3. This suggests that a threshold of 140 µg/m3 may underestimate exposure in real-life scenarios, even when the number of exceedances is below the legal limit. The threshold for the low PM2.5 exposure category is 150 µg/m3, a value that considers the ratio to the thresholds set for PM10 and the actual situations observed in the available data.
The annual analysis of EC values for monitored stations (Section 3.3.1), shows that the upper threshold of 750 µg/m3 for PM10 in the Moderate EC category indicates situations in which exposure is moderate, though frequent, and not persistently severe. The PM2.5 equivalent was set at 500 µg/m3, considering the PM2.5/PM10 ratio, which aligns with the average values observed in the study areas [19].
EC values become chronic and fall into the High or Very High EC category above values of 750 µg/m3 for PM10 and 500 µg/m3 for PM2.5.
Annual EC values above 1000 µg/m3 for PM10 and above 800 µg/m3 for PM2.5 coincide with years in which extremely high daily concentrations are not just occasional. Further details can be found in Section 3. Results.
These thresholds were proposed as guidelines for assessing pollution levels at different stations and in different years. They were not regulated by any normative act.
2.2.2. Episode Index (EI)
The pollution episode index (EI) was used to characterize PM10 and/or PM2.5 pollution episodes. The EI integrates the magnitude of the excess above the alert threshold over the entire duration of the episode, thus providing a better estimate of the potential health risk.
They are calculated as the sum of the daily differences between the recorded daily concentrations and the alert threshold set by the directive, for each day on which the threshold is exceeded. An episode of pollution is defined as a succession of at least three consecutive days (or two days with very high values) during which the alert threshold is exceeded.
The formula for EI is given by
where
Ci = the concentration on day i (µg/m3)
Palert= alert threshold (Directive (EU) 2024/2881:.≥ 50 µg/m3 for PM2. 5 and ≥ 90 µg/m3 for PM10).
n=number of consecutive days din episodul de poluare where Ci> Palert
The classification of PM10 and PM2.5 pollution magnitude starts at a high level because the identification of these episodes begins with the alert thresholds of 90 µg/m3 and 45 µg/m3, respectively, as specified in Directive (EU) 2024/2881. Exceeding these thresholds requires the implementation of urgent measures, which will be included in short-term action plans aimed at reducing the immediate risk or duration of exceeding the alert thresholds. Since these values are double the daily limit values (45 µg/m3 and 25 µg/m3, respectively), any episode reaching or exceeding the alert threshold is considered a high-risk health event.
The thresholds for separating classes were established by considering the concentrations recorded during the study period and the references used in international practice. These references include the daily classifications applied in the United Kingdom, in accordance with air quality assessment guidelines [11].
For PM10, data from the study period showed that the EI values tended to be concentrated around 25 µg/m3 and 100 µg/m3 (Section 3.3.2). These values were used to classify the data in Table 5, which reflects both the magnitude of the exceedance and the duration of exposure.
The limit values and alert thresholds for PM2.5 differ from those for PM10. However, similar classification intervals were used (Table 5). This is because the EI is calculated relative to the alert threshold specific to each pollutant. This approach allows for comparison of the magnitude of episodes between the two particle fractions based on total exposure above the threshold, regardless of the concentration value.
2.2.3. Toxic Load Index (TLI)
The TLI aims to supplement traditional quantitative indicators, such as the daily average, the maximum number of daily exceedances, and the annual average, as well as the other two indicators proposed in this study, EC and EI, by integrating qualitative characteristics related to the toxic potential of suspended particles. TLI takes into account the excess of PM2.5 concentration above the daily limit value as well as the proportion of PM2.5 in total PM10, expressed as the PM2.5/PM10 ratio.
The daily calculation of the TLI indicator enables the quick and precise evaluation of the health risks posed by fine particle pollution on a given day. It captures the fluctuating variations in PM2.5 and PM10 levels, which differ significantly from day to day depending on weather conditions and emission sources. Thus, this indicator identifies acute pollution episodes.
The TLI can be integrated into air quality warning systems to provide summary information on pollution episode risk. This supports rapid decision-making by authorities.
The formula for TLI is given by:
where
- = TLI daily
- Ci = the PM2.5 concentration on day i, when the LV is exceeded (µg/m3)
- PM2.5, i/PM10,i = the ratio of concentrations on day i
-25 ( µg/m3) = daily limit value for PM2.5
On days when the PM2.5 concentration does not exceed the daily limit value, the TLI value will be zero, indicating an absence of significant toxicity.
Conversely, as the PM2.5/PM10 ratio increases, so does the TLI, reflecting a higher proportion of PM2.5 in the total mass of PM, which is associated with increased toxicological potential [19].
While there is no indicator identical to the TLI in the literature, the TLI is based on principles used by other authors in environmental risk assessment, such as quantifying excess over limit values associated with acute adverse health effects [14], using the PM2.5/PM10 ratio to indicate the source and nature of the particles [19,23], and integrating these principles into a single indicator. Combining quantity and relative toxicity is a common approach in environmental risk assessment. For instance, cumulative risk assessment uses products of exposure and toxicity coefficients [22].
The classification thresholds for daily TLI values were established based on methodological and toxicological considerations. For the excess component, the daily limit value of 25 µg/m3 for PM2.5 was used. Thus, the zero reference value for TLI directly corresponds to an absence of exceedances and an insignificant toxic load. Subsequent thresholds were set according to the severity levels of PM2.5 excess, weighted by the PM2.5/PM10 ratio.
This ratio varies from approximately 0.3 (in episodes with coarse dust) to 0.9–1.0 (in cases of combustion-source pollution with increased toxic potential) [23].
Thus, with an excess of 10 µg/m3 and a high PM2.5 proportion (e.g., 0.8), the TLI reaches 8, corresponding to a moderate–high risk zone. Threshold values of 5, 12, and 20 were selected as progressive benchmarks to distinguish between different exposure types (e.g., occasional or hazardous). These thresholds were derived mathematically.
3. Results
3.1. Measured Annual Mean Concentrations Compared with Current and Future Limit Value
3.1.1. Annual Mean Concentrations of PM10
Between 2019 and 2024, annual mean PM10 concentrations were below the limit value in force. Applying the new limit from Directive (EU) 2024/2881, compliance was observed only at SV-1 and IS-4 in 2022–2023. For SV-2 (2022–2024) and IS-4 (2024), compliance could not be assessed due to insufficient data. (Table 7).
3.1.2. Annual Mean Concentrations of PM2.5
For the years in the analysed period for which the data quality objective was met, it can be concluded that the annual mean concentrations of PM2.5 were below the annual limit value in force. However, if the annual limit value set in Directive (EU) 2024/2881 had been applied, the concentrations recorded at the stations in Suceava and Iași would have exceeded the future limit value (Table 8).
3.2. Daily Exceedances Relative to Current and Future Daily Limit Values for PM10 and PM2.5
3.2.1. Analysis of Daily Exceedances for PM10
During the analyzed period, the maximum number of 35 daily exceedances permitted by Law 104/2011 (which transposes Directive 2008/50/EC) was not exceeded at any station except in 2019 at IS-2, where 36 values were above 50 μg/m3. This threshold was also reached in 2019 at SV-2 and in 2020 at IS-2.
For IS-4 in 2024 and for SV-2 in 2022, the 90.4th percentile is used to verify compliance with regard to the number of exceedances of the daily limit value since the annual PM10 data capture did not meet the target for fixed measurements. This value must be less than or equal to the limit value of 50 μg/m3. In 2024, the 90.4 percentile at IS-4 was 30.93 μg/m3, and at SV-2 in 2022 was 39.82 μg/m3 (In 2023 and 2024, the data coverage at SV-2 was 0% and 8%, respectively).
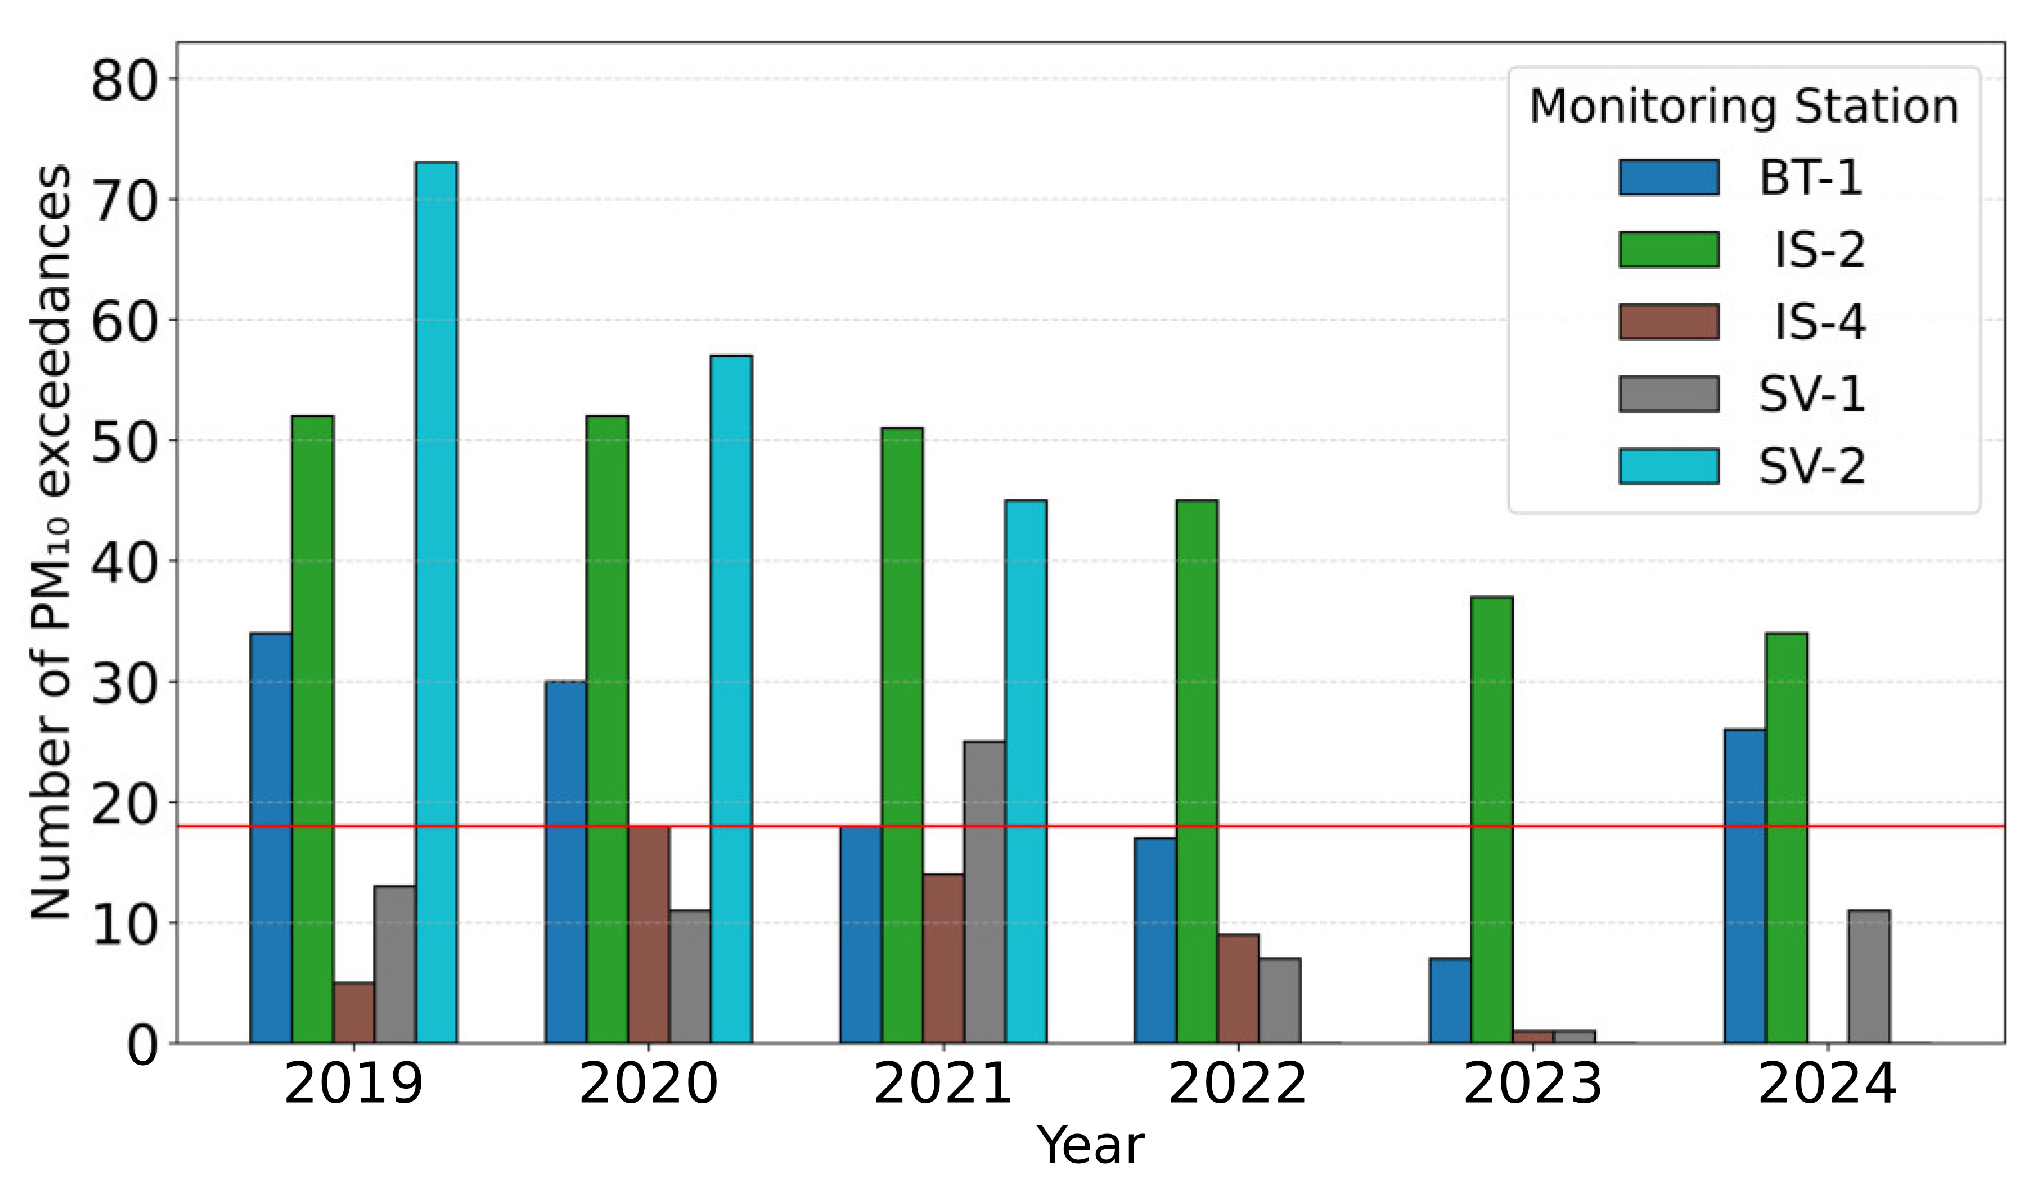
Applying the future daily limit value of 45 µg/m3 (not to be exceeded more than 18 times a calendar year), as set out in Directive (EU) 2024/2881, results in a substantial increase in hypothetical exceedances at all analysed stations. This suggests that, under the stricter standard, the assessment framework for population exposure to PM10 pollution would flag exceedances more frequently, reflecting higher sensitivity in evaluating air quality impacts.
Stations IS-2 and SV-2 would be the most affected by the application of the new directive. For example, in 2019, SV-2 registered 35 exceedances, but would record 73 hypothetical exceedances when applying the future daily limit value of 45 µg/m3 (not to be exceeded more than 18 times a calendar year). Similarly, IS-2 recorded 36 exceedances in 2019, but would reach 52 hypothetical exceedances under the new directive, almost three times the future permitted maximum.
Stations IS-4 and SV-1, which typically record lower PM10 levels, are less affected by the future daily limit value. Regardless of the legislative requirements applied, a decrease in the number of exceedances at all stations between 2019 and 2023. In 2024, however, a partial increase was noted at several locations (e.g., BT-1, IS-2 and SV-1), although the number of exceedances remained below the maximum values recorded in 2019. This trend may suggest a general improvement in air quality, potentially due to measures implemented to reduce PM10 pollution[20,21], but it is also influenced by meteorological conditions.
Figure 1.
Annual number of PM10 exceedance days (Directive 2008/50/CE) — not to be exceeded more than 35 times a calendar year.
Figure 1.
Annual number of PM10 exceedance days (Directive 2008/50/CE) — not to be exceeded more than 35 times a calendar year.
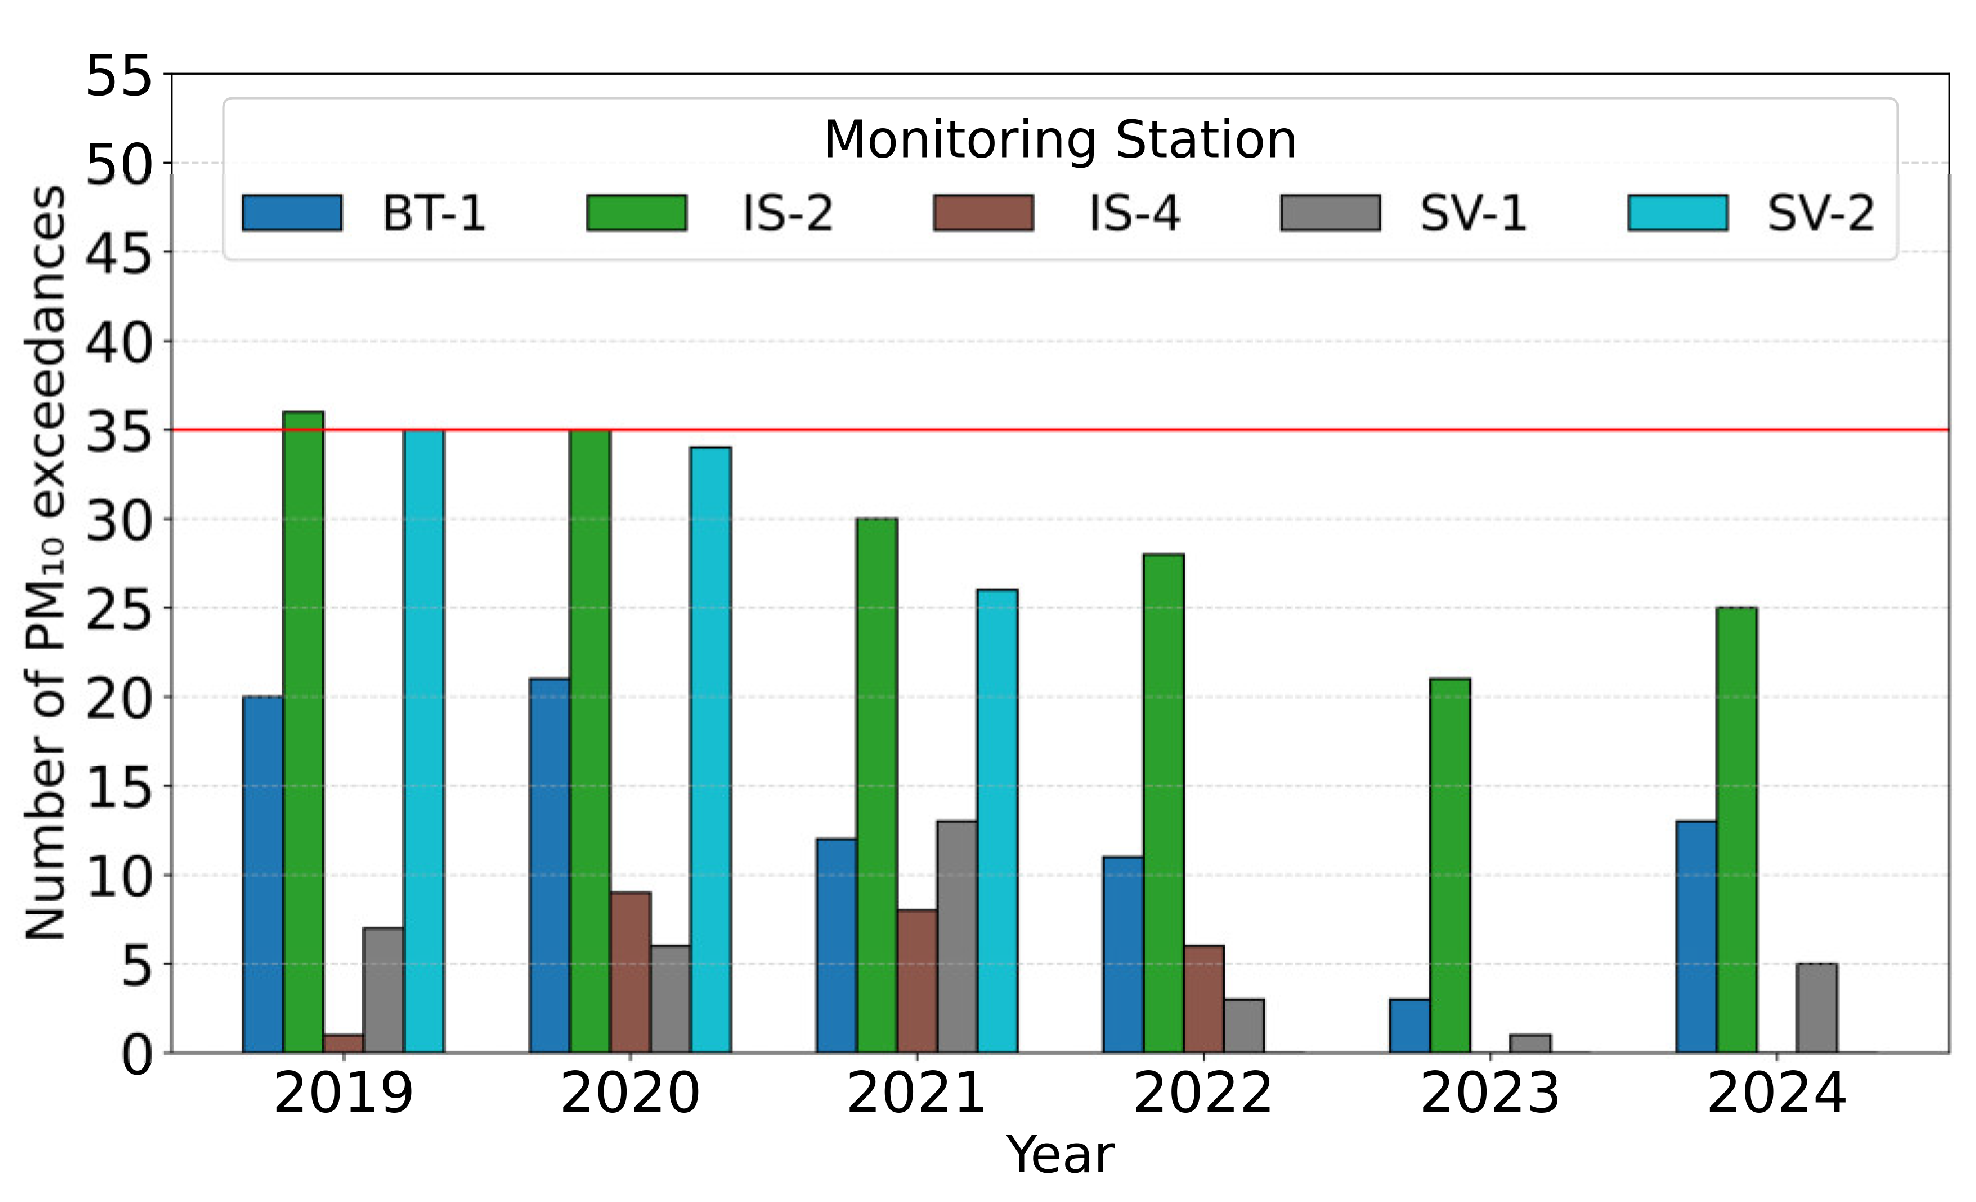
Figure 2.
Annual number of PM10 exceedance days (Directive (EU) 2024/2881) — not to be exceeded more than 18 times a calendar year Values for years prior to the directive’s entry into force represent a hypothetical comparison.
Figure 2.
Annual number of PM10 exceedance days (Directive (EU) 2024/2881) — not to be exceeded more than 18 times a calendar year Values for years prior to the directive’s entry into force represent a hypothetical comparison.
3.2.2. Analysis of Daily Exceedances for PM2.5
Current legislation does not specify a daily limit for PM2.5.
Based on the data from the study period and the future daily limit value (25 µg/m3, not to be exceeded more than 18 times a calendar year) established in Directive (EU) 2024/2881, the limit value would have been exceeded at all stations except SV-1 in 2022 and 2023 (Figure 3).
3.3. Proposed Supplementary Indicators for PM10 and PM2.5
In order for the daily and annual mean PM values to fall below the limit values set by the new directive, additional measures to reduce emissions are necessary. When identifying and prioritising the most effective measures, the meteorological characteristics of the area and the following additional indicators can be taken into account: Excess Concentration, Episode Index and Toxic Load Index.
3.3.1. Excess Concentration
The EC indicator, as defined in point 2.2.1, was correlated with the number of daily exceedances of the future daily limit values for PM10 and PM2.5 for the purposes of interpretation.
Figure 2 and Figure 4 show that assessing exposure to PM10 involves quantifying both the frequency and magnitude of hypothetical exceedances of the daily limit value. A similar pattern is observed for PM2.5, as illustrated in Figure 3 and Figure 5.
Therefore, correlating the number of hypothetical daily exceedances with the annual excess concentration enables differentiation between situations characterised by frequent, low-magnitude exceedances, and situations with fewer, but significantly higher, exceedances.
The highest cumulative excess (1165 µg/m3) would have been recorded in 2019 at station SV-2, corresponding to 73 hypothetical daily exceedances, if the future PM10 limit values had been applied. In 2020, a cumulative excess of 1064 µg/m3 would have been recorded with 57 hypothetical exceedances.
At station IS-2, a cumulative PM10 excess of 677 µg/m3 would have been recorded in 2019, increasing to 1202 µg/m3 in 2020. However, there were only 52 hypothetical exceedances in both years (Figure 2 and Figure 4). According to the classification in section 2.1 of the annual PM concentration excess magnitude, stations SV-2 and IS-2 fell into the Very High EC category in 2019 and 2020, indicating severe pollution.
From 2021 to 2023, the number of hypothetical daily exceedances of the future daily limit value for PM10 decreased, as did excess magnitude at all stations. Most stations fell into the Low EC category, with IS-2 and SV-2 in the Moderate EC category.
EC increased in 2024 compared to 2023. BT-1 returned to the Moderate EC category, but values remained below 2019–2020 levels. The trend for station SV-2 from 2022 to 2024 cannot be interpreted due to a lack of data.
IS-4 and SV-1 stations were in the Low EC category in all years for which data was available, with fewer exceedances and lower magnitude (Figure 2 and Figure 4).
Based on the classification of annual PM excess magnitude (Table 4), the results show significant variations in PM2.5 levels between years and locations. In 2021, station IS-2 was in the Very High EC category, with an annual excess of 973 µg/m3 and 83 hypothetical exceedances of the daily limit value. This indicates severe, sustained PM2.5 pollution levels. During the same period, the BT-1 and SV-1 stations recorded 30 and 37 hypothetical exceedances, respectively, reflecting their Moderate EC classification. At IS-2, the cumulative excess decreased from high EC in 2022 to Low EC in 2024, with fewer and less intense exceedances. At SV-1, cumulative exceedances remained low in 2022 and 2023, but in 2024 they returned to Moderate EC, below 2021 levels (Figure 5).
3.3.2. Episode Index (EI)
To characterise the magnitude of PM pollution episodes, the EI indicator was applied, which takes into account both the duration and the average excess concentration above the alert threshold.
Of the data analysed for the period 2019–2024, the highest EI values for PM10 were recorded at stations IS-2 and SV-2, where short episodes of very high concentrations occurred. For instance, IS-2 recorded an episode in February 2021 with an average excess of 23.34 µg/m3 over three days, resulting in an EI of 70.03 µg/m3, which was the highest value during the analysed period. Similar values were also identified at SV-2 in 2020 (Table 9).
The longest PM2.5episode above 50 µg/m3, with the highest mean daily excess, was recorded in Iași in 2021 (Table 10). In the same 4-day interval, Suceava recorded one value above 50 µg/m3 on 22.02.2021, one day earlier, while no significant increases were observed in Botoșani. In Iași, PM10 also exceeded the future directive’s alert threshold during this period (Table 9), while no significant increases were observed in Suceava and Botoșani.
3.3.3. Toxic Load Index (TLI)
Figure 6 illustrates the annual TLI totals that met PM2.5 data quality objectives, classified according to the criteria in Table 6.
The TLI distribution shows large inter-annual and inter-urban variability. The most pronounced toxic episodes were recorded at IS-2 in 2021, which had the highest proportion of High and Very High days. In contrast, BT-1 showed mostly Low toxicity, while SV-1 showed intermediate values with peaks in 2021–2022.
4. Discussion
The retrospective analysis shows compliance with the current Air Quality Directive for both PM fractions, except for daily PM10 exceedances at IS-2 in 2019 and at SV-2 in 2019 and IS-2 in 2020, when the maximum number of exceedances was reached (Table 7, Table 8, Figure 2, Figure 3).
Stricter standards set out in the Directive (EU) 2024/2881, highlight probable non-compliance, raising questions about these areas’ ability to comply with future limit values.
This misalignment underscores the importance of assessment indicators that can capture risks before future limits take effect. The study’s three indicators represent a step towards a more detailed and proactive assessment of air quality, supporting trend analysis and developing concrete measures to improve air quality.
The discussion then focuses on compliance with future standards, the relevance of the proposed indicators, interpreting the results in a local context, and the implications for public policy.
4.1. Compliance with Future Standards
The application of Directive (EU) 2024/2881 leads to a stricter reassessment of air quality, in which previously acceptable values become relevant in terms of exposure.
The new annual limit value established by Directive (EU) 2024/2881 indicates that only the annual mean concentrations measured in 2022 and 2023 at SV-1 and IS-4 would comply with the future standard. Since the data collection requirement was not met between 2022 and 2024 at SV-2 and in 2024 at IS-2, it is not possible to assess compliance for these stations in the respective years (Table 9).
Applying the daily limit values for PM10 and PM2.5, which will be in effect starting in 2030, provides a useful estimate of current exposure in relation to future standards. Retrospective analysis shows that, in almost all years analyzed, most stations would have exceeded the threshold of 18 daily exceedances per year. The exceptions for PM10 include stations IS-4 (2019–2023; no data available for 2024), SV-1 (2019–2020; 2023–2024), and BT-1 (2021–2023). The only exception for PM2.5 is station SV-1 in 2022 and 2023.
The downward trend observed between 2021 and 2023 regarding the number of days exceeding the future daily limit value and cumulative excess for PM10 and PM2.5 suggests an improvement in air quality at most monitored stations. This development may reflect the implementation of emission reduction measures [18,19] or more favorable weather conditions for pollutant dispersion. In 2024, there was a slight increase in the number of daily PM10 exceedances at SV-1 and BT-1 compared to the previous year due to unfavorable meteorological conditions for pollutant dispersion. However, this increase remains considerably lower than in 2019, indicating a possible stabilization of pollution at a lower level than in previous years. At IS-2, the number of daily PM10 exceedances decreased in 2024. The lack of a similar increase at IS-2 may be due to these developments not always reflecting a general regional trend but rather local factors.
This conclusion indicates that achieving the targets set for 2030 will require sustained efforts to reduce emissions in the absence of additional measures. Specific exceptions, such as station SV-1 in 2022 and 2023, demonstrate that compliance with the daily limit value is possible but depends on favorable local conditions and/or effective measures. The lack of PM10 data for station SV-2 from 2022 to 2024 prevents an assessment of compliance or noncompliance with future PM10 limit values.
4.2. Analysis and Relevance of the Proposed Additional Indicators
Analyzing the excess concentration and the number of hypothetical daily exceedances under the conditions of applying future limit values for PM10 and PM2.5, the results show that SV-2 station would face the highest exposure levels in terms of the frequency and magnitude of exceedances. The high number of daily PM10 hypothetical exceedances in 2019 and 2020 (73 and 57, respectively) and the annual excess of over 1000 µg/m3 indicate a significant and sustained PM10 load.
The high pollution levels recorded at the SV-2 station in 2019 and 2020 can be attributed to unfavorable weather conditions that limited pollutant dispersion, as well as residential and industrial emission sources [18]. These causes also explain why the cumulative annual PM10 excess values are high, despite a slight decrease in the number of exceedances between the two years.
In contrast, if the future limit value of 45 µg/m3 had been applied at the IS-2 station, there would have been 52 concentrations above this limit in both 2019 and 2020. Assuming the same number of hypothetical exceedances, the cumulative excess of PM10 relative to the limit value of 45 µg/m3 increased from 676.83 µg/m3 in 2019 to 1201.67 µg/m3 in 2020. This suggests an increase in daily PM10 concentrations during pollution episodes, possibly due to sporadic local sources and specific meteorological variations. This shows that the excess concentration does not always follow the same trend as the number of exceedances.
A comparison of the two stations underscores the importance of incorporating both the number of exceedances and the cumulative excess into the analysis of PM pollution. A low number of exceedances may correspond to a low excess if the exceedances are mild. Conversely, a high excess may result from a few severe exceedances, even if the number of days is low. For instance, frequent, moderate PM10 exceedances at SV-2 generated sustained exposure, whereas rare, intense PM10 pollution episodes at IS-2 may acutely impact the population’s health.
The results regarding annual PM2.5 excess highlight spatial differences and significant temporal variations between analyzed stations. The most severe situation occurred in 2021 at station IS-2, where 83 hypothetical exceedances of the future daily limit value and an annual PM2.5 excess of over 970 µg/m3 were recorded. These values indicate high exposure to fine particles and significant potential to affect population health. Values recorded between 2022 and 2024 mainly fall into the Moderate or Low EC categories, suggesting an improved air quality trend, likely due to favorable weather conditions for dispersion and PM reduction measures currently being implemented or completed as part of air quality plans [20,21]. However, the persistence of moderate values at stations IS-2 and SV-1 indicates that PM2.5 pollution episodes have not been completely eliminated and could reoccur in contexts of unfavorable atmospheric conditions or intensified human activities. For BT-1 station, only data from 2018 and 2021 are available.
The data show that not all exceedances are the same, so differentiated emission reduction measures tailored to local source profiles and area characteristics are needed. Authorities can include the EC indicator in air quality plans or roadmaps to identify high-risk areas, even when exceedances appear low.
EI is used to analyze pollution episodes. It helps to more accurately characterize the intensity and duration of these events. This indicator was selected based on epidemiological evidence linking each 10 µg/m3 increase in PM10 and PM2.5 concentrations with adverse health effects. A meta-analysis of 59 studies in China showed that a 10 μg/m3 increase in the average daily concentration of PM10 is associated with a 0.36% increase in non-accidental mortality, a 0.36% increase in cardiovascular mortality, and a 0.42% increase in respiratory mortality. For PM2.5 , the same increase was correlated with greater effects: a 0.40% increase in non-accidental mortality, 0.63% in cardiovascular mortality, and 0.75% in respiratory mortality [19]. Another study in Brescia, Italy, showed that a 10 μg/m3 increase in the average daily concentration of PM10 leads to a 5.7% increase in emergency room visits and a 6.5% increase in hospitalizations for patients with chronic lung disease, both one day after exposure and after five consecutive days. For PM2.5, the effects were more pronounced: a daily increase of 10 μg/m3 was associated with increased risks of 7.4% for emergency visits and 9.1% for hospitalizations one day after exposure, and 8.3% and 9.9% after five days of exposure [12]. The risk appears to be higher for PM2.5 exposure, due to PM2.5’s ability to penetrate deeper into the respiratory tract [6].
The high PM10 EI values observed at stations IS-2 and SV-2 in 2020 and 2021 reflect short, intense episodes lasting two to four days and characterized by concentrations above the alert threshold. The daily excess average ranged from 6.42 µg/m3 to 23.34 µg/m3.
The highest EI indicator value for the two particle fractions during the entire study period was recorded for PM2.5: 105.82 µg/m3·day at station IS-2 compared to the 50 µg/m3 alert threshold. This episode lasted four days, with an average daily excess of 26.46 µg/m3. This value confirms the Extremely High classification and highlights a high level of sustained exposure with a potentially significant impact on public health.
In 2020, each PM10 pollution episode occurred within the same time intervals at at least two monitoring stations, suggesting that these were not isolated local events but rather influenced by common meteorological conditions (e.g., thermal inversions, air stagnation) or regional pollution sources.
In the case of PM2.5, a pollution episode was observed to occur simultaneously at two different stations in only one situation.
It is more difficult to compare episodes between the analyzed stations for PM2.5, mainly due to the frequent lack of data from the Botoșani station. Even in the four episodes (Table 10), for which there were complete records at all stations, only one station exceeded the 50 µg/m3 threshold for at least two consecutive days, and this was not confirmed in the other two urban areas. Similar situations were recorded when data were available at both SV-1 and IS-2, with the exceedance confirmed at only one station.
This difference can be attributed to the distinct characteristics of the two particle fractions. PM10 is more influenced by common local or regional sources, such as road traffic and resuspension, while PM2.5 frequently originates from combustion and secondary formation processes in the atmosphere. PM2.5 is more influenced by short-term and local atmospheric variations.
Comparing EI between locations and periods allows for better prioritization of interventions and can guide the adoption of appropriate local measures, such as restricting traffic during periods of thermal inversion and closely monitoring emissions from industrial installations.
Analysis of the TLI indicator at the three monitoring stations reveals significant variability in air toxicity among years and stations, with frequent episodes of moderate to very high toxic load. Generally, stations BT-1 and SV-1 recorded the highest proportions of days with low toxicity (>50%) in 2021 and 2023, indicating periods of lower toxicity.
Analysis of the cumulative proportion of days with high and very high toxicity by station shows that no year at station BT-1 exceeded the 25% threshold, indicating a low incidence of episodes with a high toxic load. In contrast, episodes of more severe toxicity were recorded at station SV-1 in 2021 (27.3%), 2022 (26.7%), and 2024 (31.8%). Although the cumulative share did not exceed 25% at station IS-2 in any year (with maximum values of 23% in 2023 and 19% in 2022), the absolute number of days with high toxicity remains significant due to the higher number of daily PM2.5 exceedances. These results confirm the usefulness of the TLI indicator for identifying areas and periods where exposure to pollutants poses a higher risk, even when the number of daily exceedances or annual averages does not indicate noncompliance.
Integrating this indicator into current monitoring would allow for a more comprehensive assessment of health risks and support the development of intervention measures tailored to locally specific conditions.
4.2. Relevance to Public Policy Development
Proposing additional indicators, such as EC, EI, and TLI, could provide a stronger scientific foundation for creating differentiated public policies for urban areas and aligning them with future limit values.
These indicators offer supplementary information beyond that provided in current air quality directives, enabling a more detailed characterization of particulate matter and a clearer understanding of its sources and toxicity. This added value enables the differentiation of pollution reduction measures and facilitates the transition from general interventions based solely on the concentration and frequency of PM10 and PM2.5 exceedances to public policies tailored to local specifics and aimed at reducing the actual impact on public health and the environment.These findings highlight the need for public policies that are adapted to local emission source characteristics and atmospheric dispersion conditions.
Specialist literature and recommendations from advisory bodies, such as COMEAP in the UK, emphasize the necessity of indicators beyond daily average concentrations[11].
One example is the method proposed by Cariolet et al. (2018), which applies the concept of urban resilience to outdoor air pollution. This method defines three “resilience capacities”: reducing emissions, reducing concentrations, and reducing population exposure. In the greater Paris area, the implementation of this GIS-based “quick scan” method, which uses a 500-meter grid, allowed for the precise identification of areas in urgent need of intervention. Combining similar approaches with the indicators proposed in this study could support proactive, tailored policies to reduce air pollution in urban environments[24].
Cazacu et al. (2024) propose a public policy emphasizing the importance of including the “cumulative effect of pollution” in national legislation. This refers to the interaction between multiple pollutants [25]. Although the proposed indicators (EC, EI, and TLI) are limited to particulate matter (PM10 and PM2.5), they could partially fulfill this requirement by quantifying cumulative exceedances, episode duration, and toxicological potential.
4.3. Recommendations for Reducing Particulate Matter
Based on the existing information and results, as well as the analysis of the proposed indicators (EC, EI, and TLI), recommendations can be made to reduce the concentration of particulate matter (PM10 and PM2.5) and decrease population exposure.
According to the Integrated Air Quality Plan for Nitrogen Dioxide/Nitrogen Oxides (NO2/NOx) and PM10 and PM2.5 in the city of Iași [21], in 2018, the main source of particulate emissions was the production of asphalt mixtures for road paving. This process generated 71.767 tonnes of PM10 and 18.074 tonnes of PM2.5. The second-most important source was the residential sector (heating homes and cooking), which emitted 57.97 tonnes of PM10 and 56.61 tonnes of PM2.5. Road transport ranked third, contributing 47.254 tonnes of PM10 and 32.923 tonnes of PM2.5.
Although road paving generated the highest emissions in 2018, the highest concentrations of PM10 and PM2.5 were recorded during the cold season[19], not in the summer when most of the work takes place. Therefore, the direct impact of asphalting on air quality in winter is relatively low. Priority measures should target the dominant sources of pollution during the cold season: residential heating with wood in areas bordering the municipality, heavy road traffic, and polluting vehicles.
Temporary traffic restriction measures have shown varying degrees of effectiveness in reducing concentrations of particulate matter.
In Beijing in 2007, restrictions that were in place for four days, from 6:00 a.m. to 11:00 p.m., led to a 6–15% decrease in hourly PM10 concentrations in the urban area [26]. During international marathons in Lanzhou, implementing traffic restrictions for several hours led to significant reductions in submicron particles. Decreases of up to 67% were recorded for very fine particles in the 100–200 nm range, which are part of PM2.5. This demonstrates that the restrictions are particularly effective in reducing the finest particles [27].
In areas with high cumulative PM levels and fewer exceedances (e.g., IS-2), the following measures are recommended to limit pollution peaks: restricting traffic during periods of thermal inversion, redirecting traffic flows, establishing systems to restrict vehicle access to cities, including low-emission and zero-emission zones, encouraging behavioral changes and protecting the health of children and other sensitive and vulnerable population groups [6].
A steady decline in annual PM concentrations is difficult to predict because weather conditions significantly influence these levels from year to year.
The mentioned plan, which has not yet been adopted [21], provides for measures for the period 2024-2028 to modernize traffic arteries, build a bypass around the municipality of Iași, encouraging the introduction of electric and hybrid vehicles in taxi services, banning cars with lower pollution standards in the municipality of Iasi, encouraging the use of public transport by expanding the tram infrastructure, thermal rehabilitation of residential buildings, maintenance and expansion of green spaces, etc. By implementing these measures, IS-2 forecasts an average annual concentration of 32.163 µg/m3 for PM10 and 20.204 µg/m3 for PM2.5 in the projection year 2024, values below the VL according to current legislation, but above the future directive limits. Also, according to this plan, it is expected that by the end of 2028, the current limit value of 50 µg/m3 will be exceeded on 32 days for PM10.
According to the Air Quality Plan for the Municipality of Suceava, for PM10 suspended particles [20], in 2018, the main source of PM10 emissions in Suceava Municipality was road transport, which contributed 47.197 tons of PM10, followed by electricity and heat production, which generated 24.656 tons of PM10, and residential heating, with 19.358 tons of PM10. Another significant source of emissions was the asphalt mixing process, which contributed 5.018 tons.
Long-term measures are recommended for areas with frequent exceedances and high cumulative excesses, such as the Suceava municipality. One measure is reducing emissions from small and medium-sized stationary combustion sources (including biomass) by replacing them.
Progiou et al. (2023) used a regression model to quantify the impact of biomass heating on PM10 concentrations, highlighting that reducing emissions by 45% could eliminate daily exceedances of the limit value. Based on these results, the researchers proposed a cost-effective package of measures, including replacing biomass heating with natural gas systems, promoting heat pumps, taxing residential biomass, and modernizing the vehicle fleet. When these measures were applied in an air quality modeling simulation, there was a 67% reduction in exceedance episodes [28].
Therefore, similar measures, such as encouraging the transition to clean heating sources and implementing temporary bans during critical episodes, can significantly contribute to meeting the new thresholds established by Directive (EU) 2024/2881.
For coarse particulate matter in urban areas in the summer, street washing is recommended. A study in Krakow showed that sweeping and washing streets reduced PM10 and PM2.5 concentrations by 17.3% and 15.4%, respectively, for up to three days. The greatest reduction was recorded in areas with heavy traffic. The effect was smaller in residential and industrial areas. Although temporary, street cleaning significantly improves air quality [17].
The plan includes measures to modernize the vehicle fleet from 2023 to 2027. These measures include replacing diesel buses with electric buses, modernizing traffic arteries, thermally rehabilitating residential buildings, expanding the natural gas network, and offering tax incentives for citizens to connect to the natural gas system[20]. The plan’s developer predicted that implementing the measures would result in an average annual PM10 concentration of 27.193 µg/m3 at SV-2 and 22.134 µg/m3 at SV-1. These values are below the current legislation’s limit of 40 µg/m3, but above the limit of 20 µg/m3 according to future directives. According to the plan, it was also predicted that, by 2027, there would be 20 values above the limit value of 50 µg/m3 at SV-2 and 6 at SV-1 (below the maximum allowed 35 times).
The decrease in PM concentrations after 2020 suggests that effective measures have been implemented in IS and Suceava to reduce particle emissions. However, it is possible that the reduction observed from 2021 to 2023 will not be sufficient under less favorable atmospheric dispersion conditions.
To fall below the future limit value of 45 µg/m3 (not to be exceeded more than 18 times), it is proposed that additional measures continue to be implemented in both SV-2 and IS-2.
Other measures that may be considered include those set out in Annex VIII, point B of Directive 2024/2881, such as the introduction of low-emission zones (LEZ)
An LEZ is an area that only allows vehicles classified as low PM10 emission vehicles to enter. All highly polluting vehicles are banned from LEZs. To date, LEZs have been implemented in 152 cities across nine EU countries. Germany, in particular, has been at the forefront of global LEZ efforts [29].
Since 2008, Germany has introduced LEZs in numerous cities to comply with air pollutant limit values. These zones have led to reductions of up to 10% in PM10 concentrations [30,31].
In Munich, introducing LEZs and restricting heavy traffic (>3.5 tons) resulted in reductions of up to 19.6% in summer and 6.8% in winter at a traffic monitoring station, as well as reductions of up to 5.7% in summer and 3.2% in winter in urban background areas. The most pronounced effects occurred on Fridays and weekends during the summer [28]. In Berlin, traffic-related soot concentrations decreased by 52% between 2007 and 2010 [31]. Although the overall decrease in PM10 was moderate, the reduction in toxic components, such as very fine particles and components of PM2.5 resulting from diesel combustion that may contain heavy metals and polycyclic aromatic hydrocarbons, indicates significant health benefits.
Classifying the EI indicator into different intervals ensures that the intensity of pollution episodes correlates with differentiated intervention measures. Episodes in the High categorie, for example, can be managed through awareness and prevention measures. In contrast, those in the Very High categorie and Extremely high categorie require restrictive interventions on local sources of pollution. This classification provides a practical tool for rapid decision-making at the local level.
In areas where recurrent or persistent episodes have been identified, such as IS-2 and SV-2 stations, EI can guide investments in local forecasting.
TLI assesses average pollution levels and the temporal and qualitative profile of toxic exposure, making it relevant for planning environmental measures according to each location’s characteristics.
5. Conclusions
A retrospective assessment of PM10 and PM2.5 concentrations in three Romanian cities compared to the 2030 limit values provides an estimate of how close they are to the new European requirements.
The results indicate that Suceava and Iași are likely to exceed the limit values for both PM fractions without additional measures. To achieve this objective, specific measures must be taken at the local level that are adapted to the area’s topography, prevailing weather conditions, and local resources. In Botosani, there is not enough data to assess future limit values.
The study shows that the proposed indicators (EC, EI, and TLI) offer a more detailed characterization of suspended particles. They do so by capturing the magnitude of exceedances, the intensity of pollution episodes, and the toxic load.
Due to their practical nature, these indicators can be useful tools for authorities by facilitating real-time decision-making and the long-term evaluation of pollution reduction measures.
Additionally, the indicators can be correlated with epidemiological data to estimate health impacts and support communication with the population through more easily interpretable indices.
Further studies are needed to validate the proposed indicative thresholds for these indicators depending on dominant pollution sources and urban characteristics to ensure uniform applicability across different regions.
Author Contributions
Conceptualization, L.D., M.-M.C. and I.-G.B.; methodology, L.D., M.-M.C. and I.-G.B.; software, L.D. and M.-M.C.; validation, M.-M.C.; formal analysis, L.D. and M.-M.C.; investigation, L.D.; resources, I.-G.B.; data curation, L.D.; writing—original draft preparation L.D. and M.-M.C.; writing—review and editing, I.-G.B.; visualization, L.D.; supervision, I.-G.B.; funding acquisition, I.-G.B. All authors have read and agreed to the published version of the manuscript.
Funding
This research was funded by Doctoral Grants from the Geoscience Doctoral School in the Department of Geography, Faculty of Geography and Geology.
Data Availability Statement
All data used in the paper are publicly available. We may supply the data that we gathered from public sources upon reasonable request to the corresponding author.
Acknowledgments
L.D. expresses appreciation to the University Alexandru Ioan Cuza for its financial support via the PhD fellowship. M.-M.C. and I.-G.B. wish to extend their appreciation to the Operational Program Competitiveness 2014–2020, Axis 1, related to POC/448/1/1 Research infrastructure projects for public R&D institutions/Sections F 2018, through the Research Center with Integrated Techniques for Atmospheric Aerosol Investigation in Romania (RECENT AIR) project, under grant agreement MySMIS no. 127324.
Conflicts of Interest
The authors declare no conflicts of interest.
Abbreviations
The following abbreviations are used in this manuscript:
| AQG | Air Quality Guidelines |
| EC | Excess Concentration |
| EI | Episode Index |
| PM | Particulate matter |
| TLI | Toxic Load Index |
| WHO | World Health Organization |
| LEZ | Low emission zone |
References
- István, P. The European Environment-State and Outlook 2020. Knowledge for Transition to a Sustainable Europe; 2020; Vol. 60. [CrossRef]
- WHO. WHO global air quality guidelines. Coastal And Estuarine Processes 2021, 1–360. [Google Scholar]
- Directorate-General for Environment. 2025 Environmental Implementation Review Country Report – ROMANIA.
- Philip, S.; Martin, R.V.; Snider, G.; Weagle, C.L.; Van Donkelaar, A.; Brauer, M.; et al. Anthropogenic fugitive, combustion and industrial dust is a significant, underrepresented fine particulate matter source in global atmospheric models. Environmental Research Letters 2017, 12. [Google Scholar] [CrossRef]
- Van Den Heuvel, R.; Staelens, J.; Koppen, G.; Schoeters, G. Toxicity of urban PM10 and relation with tracers of biomass burning. International Journal of Environmental Research and Public Health 2018, 15, 1–19. [Google Scholar] [CrossRef]
- Oficial, J. 2024/2881. 2024, 2881, 1–70.
- Directiva 2008/50/CE. Directiva 2008/50/CE a parlamentului European si a Consiliului din 21 mai 2008 privind calitatea aerului înconjurător si un aer mai curat pentru Europa. Jurnalul Oficial al Uniunii Europene.
- Pražnikar, Z.J.; Pražnikar, J. The effects of particulate matter air pollution on respiratory health and on the cardiovascular system. Zdravstveno Varstvo 2012, 51, 190–199. [Google Scholar] [CrossRef]
- Park, J.; Kim, H.J.; Lee, C.H.; Lee, C.H.; Lee, H.W. Impact of long-term exposure to ambient air pollution on the incidence of chronic obstructive pulmonary disease: A systematic review and meta-analysis. Environmental Research 2021, 194, 110703. [Google Scholar] [CrossRef]
- Taj, T.; Poulsen, A.H.; Ketzel, M.; Geels, C.; Brandt, J.; Christensen, J.H.; et al. Exposure to PM2.5 constituents and risk of adult leukemia in Denmark: A population-based case–control study. Environmental Research 2021, 196. [Google Scholar] [CrossRef]
- Ayres. Aires2011_Review of the UK Air Quality Index COMEAP.
- Withey, J.R. A critical review of the health effects of atmospheric particulates. Toxicology and Industrial Health 1989, 5, 519–554. [Google Scholar] [CrossRef]
- Brunekreef, B.; Forsberg, B. Epidemiological evidence of effects of coarse airborne particles on health. European Respiratory Journal 2005, 26, 309–318. [Google Scholar] [CrossRef]
- Abbey, D.E.; Euler, G.L.; Moore, J.K.; Petersen, F.; Hodgkin, J.E.; Magie, A.R. Applications of a method for setting air quality standards based on epidemiological data. Journal of the Air Pollution Control Association 1989, 39, 437–445. [Google Scholar] [CrossRef]
- Pini, L.; Giordani, J.; Gardini, G.; Concoreggi, C.; Pini, A.; Perger, E.; et al. Emergency department admission and hospitalization for COPD exacerbation and particulate matter short-term exposure in Brescia, a highly polluted town in northern Italy. Respiratory Medicine 2021, 179. [Google Scholar] [CrossRef]
- Park, M.; Joo, H.S.; Lee, K.; Jang, M.; Kim, S.D.; Kim, I.; et al. Differential toxicities of fine particulate matters from various sources. Scientific Reports 2018, 8, 1–11. [Google Scholar] [CrossRef]
- Dai, L.; Zanobetti, A.; Koutrakis, P.; Schwartz, J.D. Associations of fine particulate matter species with mortality in the united states: A multicity time-series analysis. Environmental Health Perspectives 2014, 122, 837–842. [Google Scholar] [CrossRef]
- DRAGOI (ONIU), L.; BREABĂN, I.G.; CAZACU, M.-M. 2017–2020 trends of particulate matter PM10 concentrations in the cities of Suceava and Botoșani. Present Environment and Sustainable Development 2023, 17, 335–349. [Google Scholar] [CrossRef]
- Drăgoi (Oniu), L.; Cazacu, M.-M.; Breabăn, I.-G. Analysis of the PM2.5/PM10 Ratio in Three Urban Areas of Northeastern Romania. Atmosphere 2025, 16, 720. [Google Scholar] [CrossRef]
- Suceava, P. mun. PCA Municipiul Suceava 2023_2027.Pdf.
- Primaria municipiului Iasi. Plan Integrat De Calitate a Aerului Pentru Municipiul Iasi Pentru Indicatorii Dioxid De Azot Și Oxizi De Azot (NO2/NOX) Și Particule in Suspensie.
- Lu, F.; Xu, D.; Cheng, Y.; Dong, S.; Guo, C.; Jiang, X.; et al. Systematic review and meta-analysis of the adverse health effects of ambient PM2.5 and PM10 pollution in the Chinese population. Environmental Research 2015, 136, 196–204. [Google Scholar] [CrossRef]
- Li, Z.; Yang, X. Ratio of PM 2. 5 to PM 10 Mass Concentrations in Beijing and Relationships with Pollution from the North China Plain. 2020, No. Xia 2014.
- Cariolet, J.M.; Colombert, M.; Vuillet, M.; Diab, Y. Assessing the resilience of urban areas to traffic-related air pollution: Application in Greater Paris. Science of the Total Environment 2018, 615, 588–596. [Google Scholar] [CrossRef]
- Cazacu, M.M. , Şchiopu, C.E., Rădulescu, C.M., Falotă, D., Bodnariu, A.I., Politică publică alternativă pentru măsurarea, îmbunătățirea şi păstrarea calităţii aerului ambiental: Propunere de politică publică dezvoltată în cadrul proiectului „Politici publice alternative în domeniul calității aerului”, ISBN: 978-606-48-1175-2, StudIS, Iasi, Romania, 2024.
- Wu, Q.; Wang, Z.; Gbaguidi, A.; Tang, X.; Zhou, W. Numerical study of the effect of traffic restriction on air quality in beijing. Scientific Online Letters on the Atmosphere 2010, 6 A, 17–20. [Google Scholar] [CrossRef]
- Zhao, S.; Yu, Y. Effect of short-term regional traffic restriction on urban submicron particulate pollution. Journal of Environmental Sciences (China) 2017, 55, 86–99. [Google Scholar] [CrossRef]
- Progiou, A.; Liora, N.; Sebos, I.; Chatzimichail, C.; Melas, D. Measures and Policies for Reducing PM Exceedances through the Use of Air Quality Modeling: The Case of Thessaloniki, Greece. Sustainability (Switzerland) 2023, 15. [Google Scholar] [CrossRef]
- Wolff, H.; Perry, L. Trends in clean air legislation in Europe: Particulate matter and low emission zones. Review of Environmental Economics and Policy 2010, 4, 293–308. [Google Scholar] [CrossRef]
- Fensterer, V.; Küchenhoff, H.; Maier, V.; Wichmann, H.E.; Breitner, S.; Peters, A.; et al. Evaluation of the impact of low emission zone and heavy traffic ban in Munich (Germany) on the reduction of PM10 in ambient air. International Journal of Environmental Research and Public Health 2014, 11, 5094–5112. [Google Scholar] [CrossRef]
- Cyrys, J.; Peters, A.; Soentgen, J.; Wichmann, H.E. Low emission zones reduce PM10 mass concentrations and diesel soot in German cities. Journal of the Air and Waste Management Association 2014, 64, 481–487. [Google Scholar] [CrossRef] [PubMed]
Figure 3.
Annual number of PM2.5 exceedance days (Directive (EU) 2024/2881) — not to be exceeded more than 18 times a calendar year. Values for years prior to the directive’s entry into force represent a hypothetical comparison to the future limit value set in Directive (EU) 2024/2881.
Figure 3.
Annual number of PM2.5 exceedance days (Directive (EU) 2024/2881) — not to be exceeded more than 18 times a calendar year. Values for years prior to the directive’s entry into force represent a hypothetical comparison to the future limit value set in Directive (EU) 2024/2881.
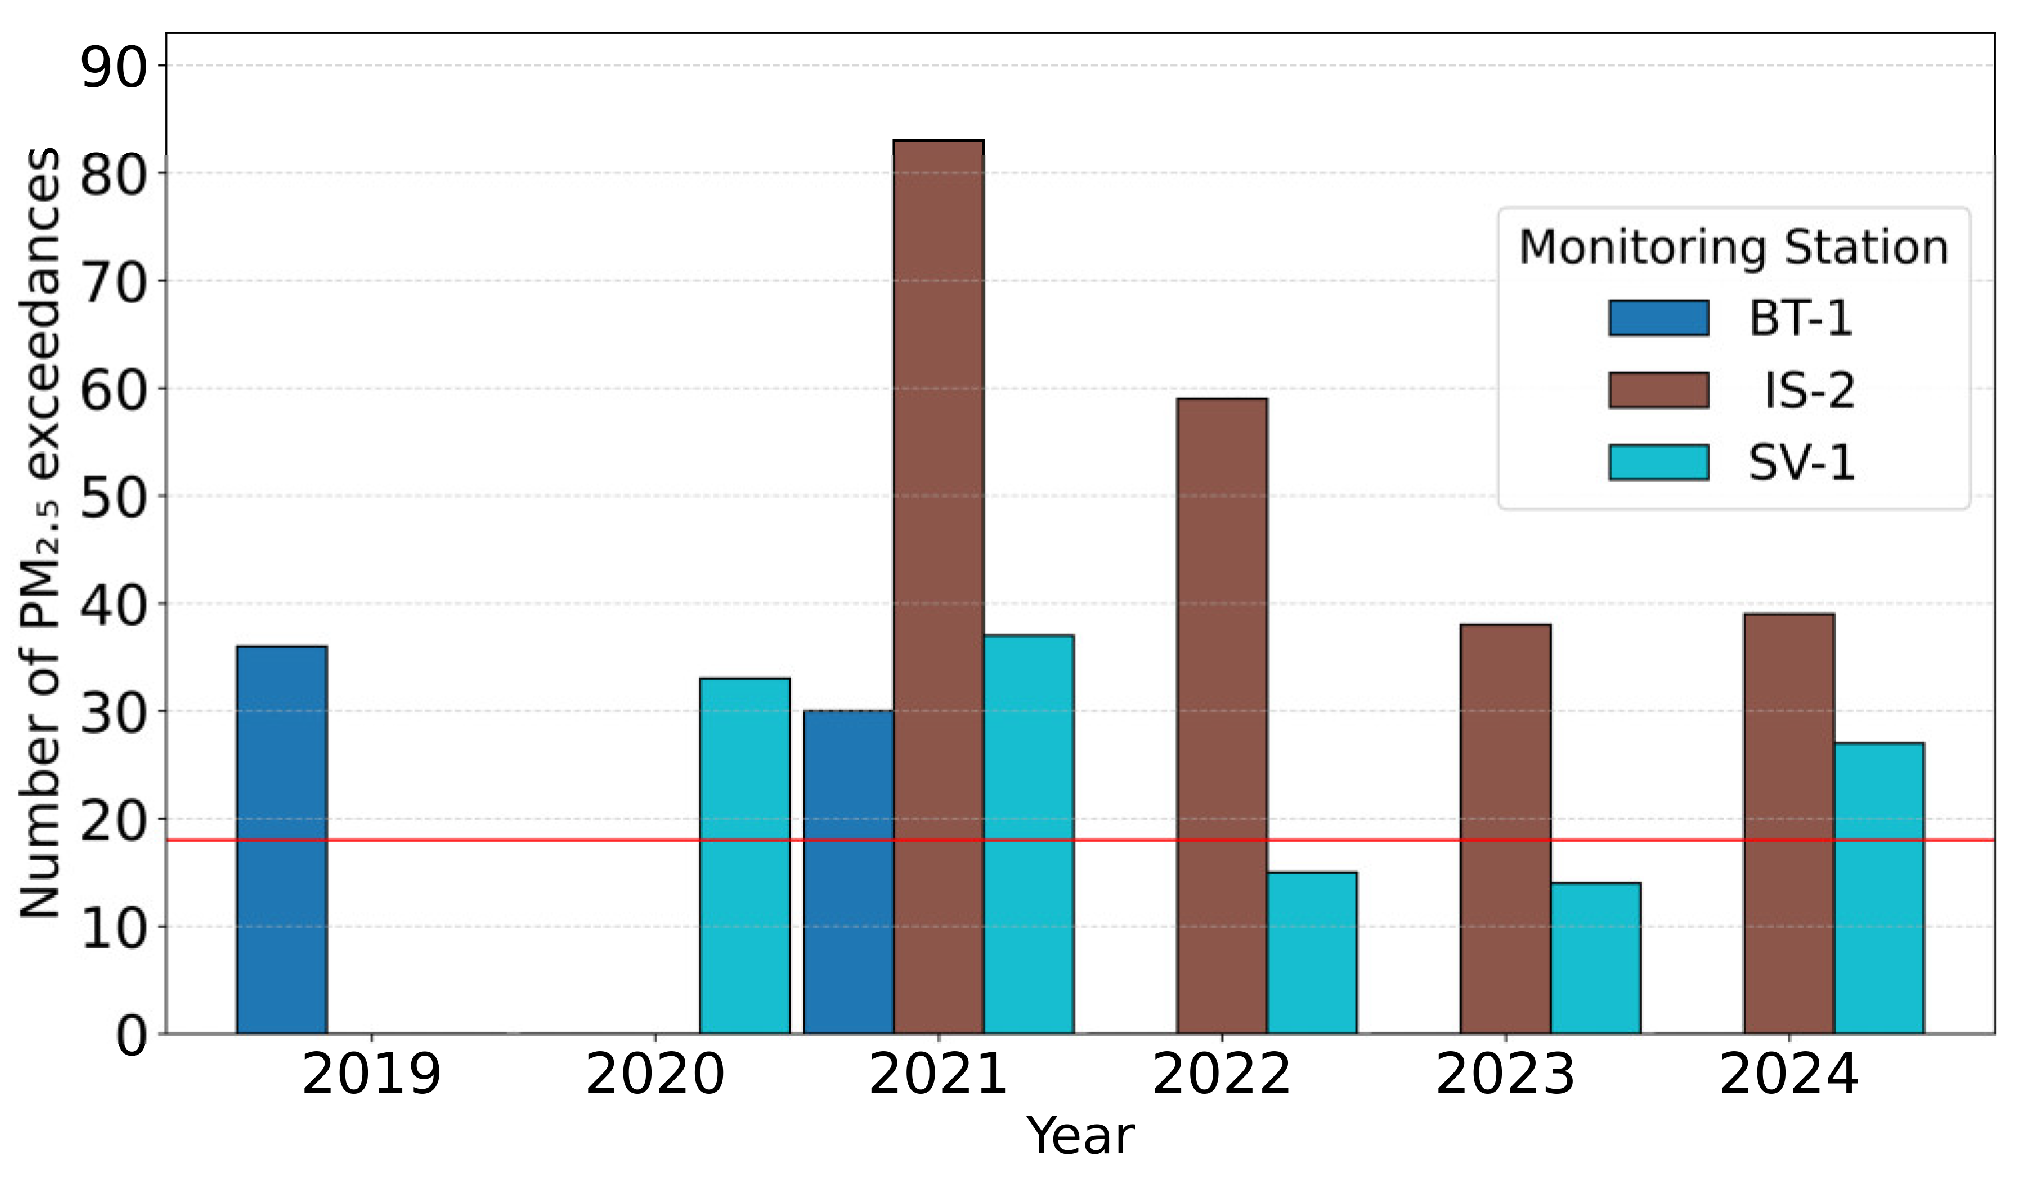
Figure 4.
Annual Excess Concentration PM10 (— EC thresholds according to Table 4).
Figure 4.
Annual Excess Concentration PM10 (— EC thresholds according to Table 4).
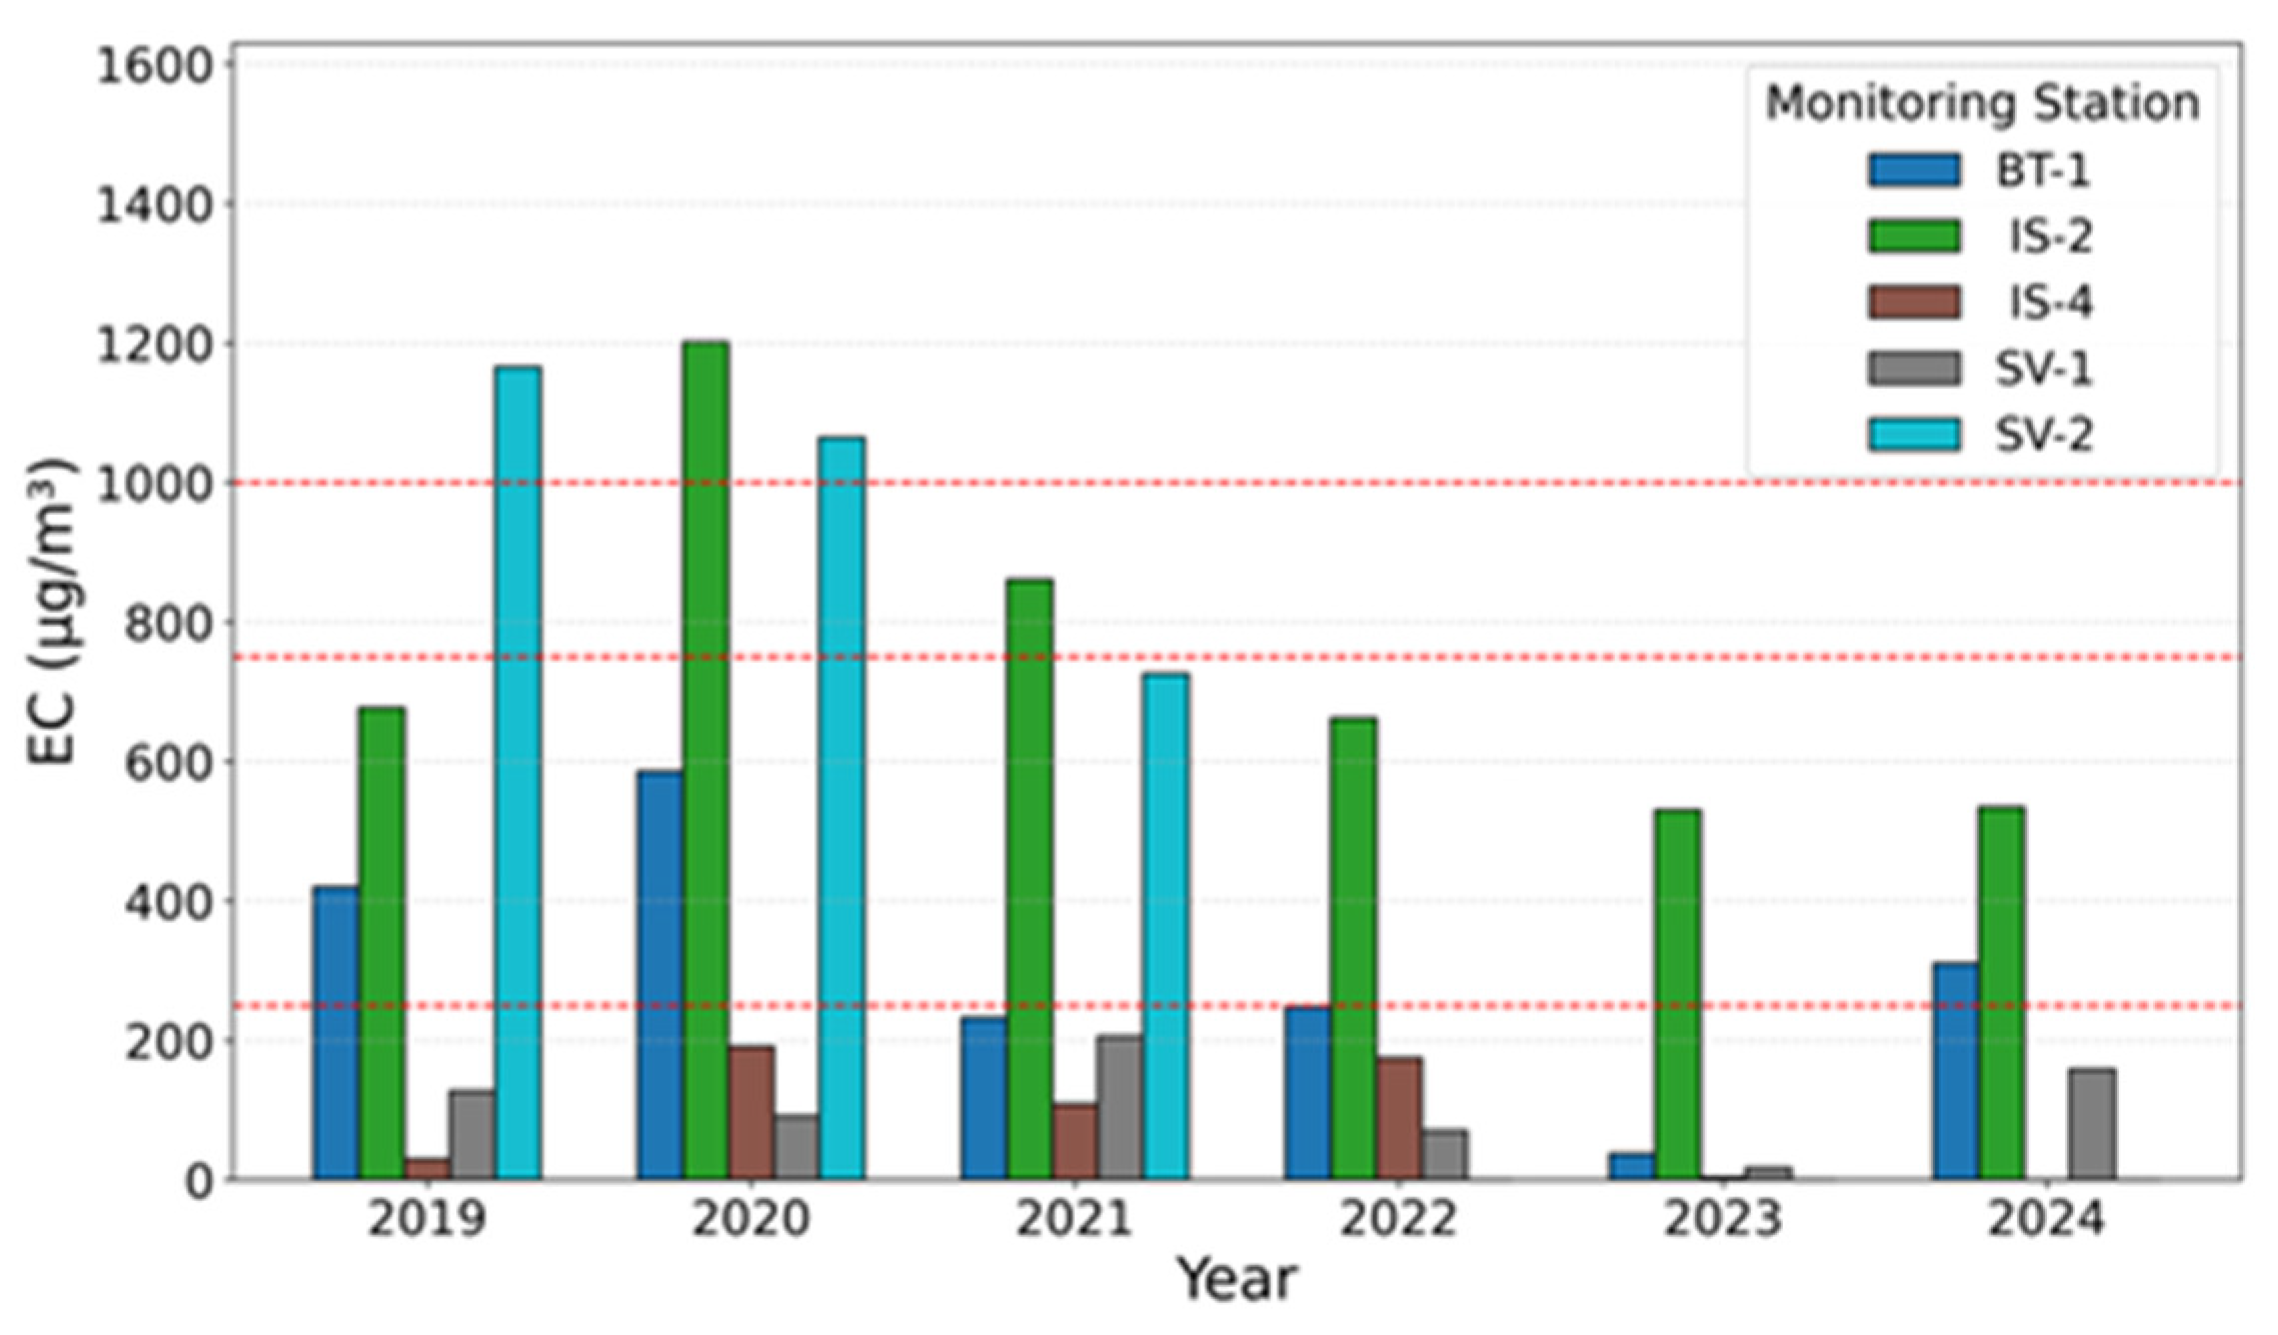
Figure 5.
Annual Excess Concentration PM2.5 (— EC thresholds according to Table 4).
Figure 5.
Annual Excess Concentration PM2.5 (— EC thresholds according to Table 4).
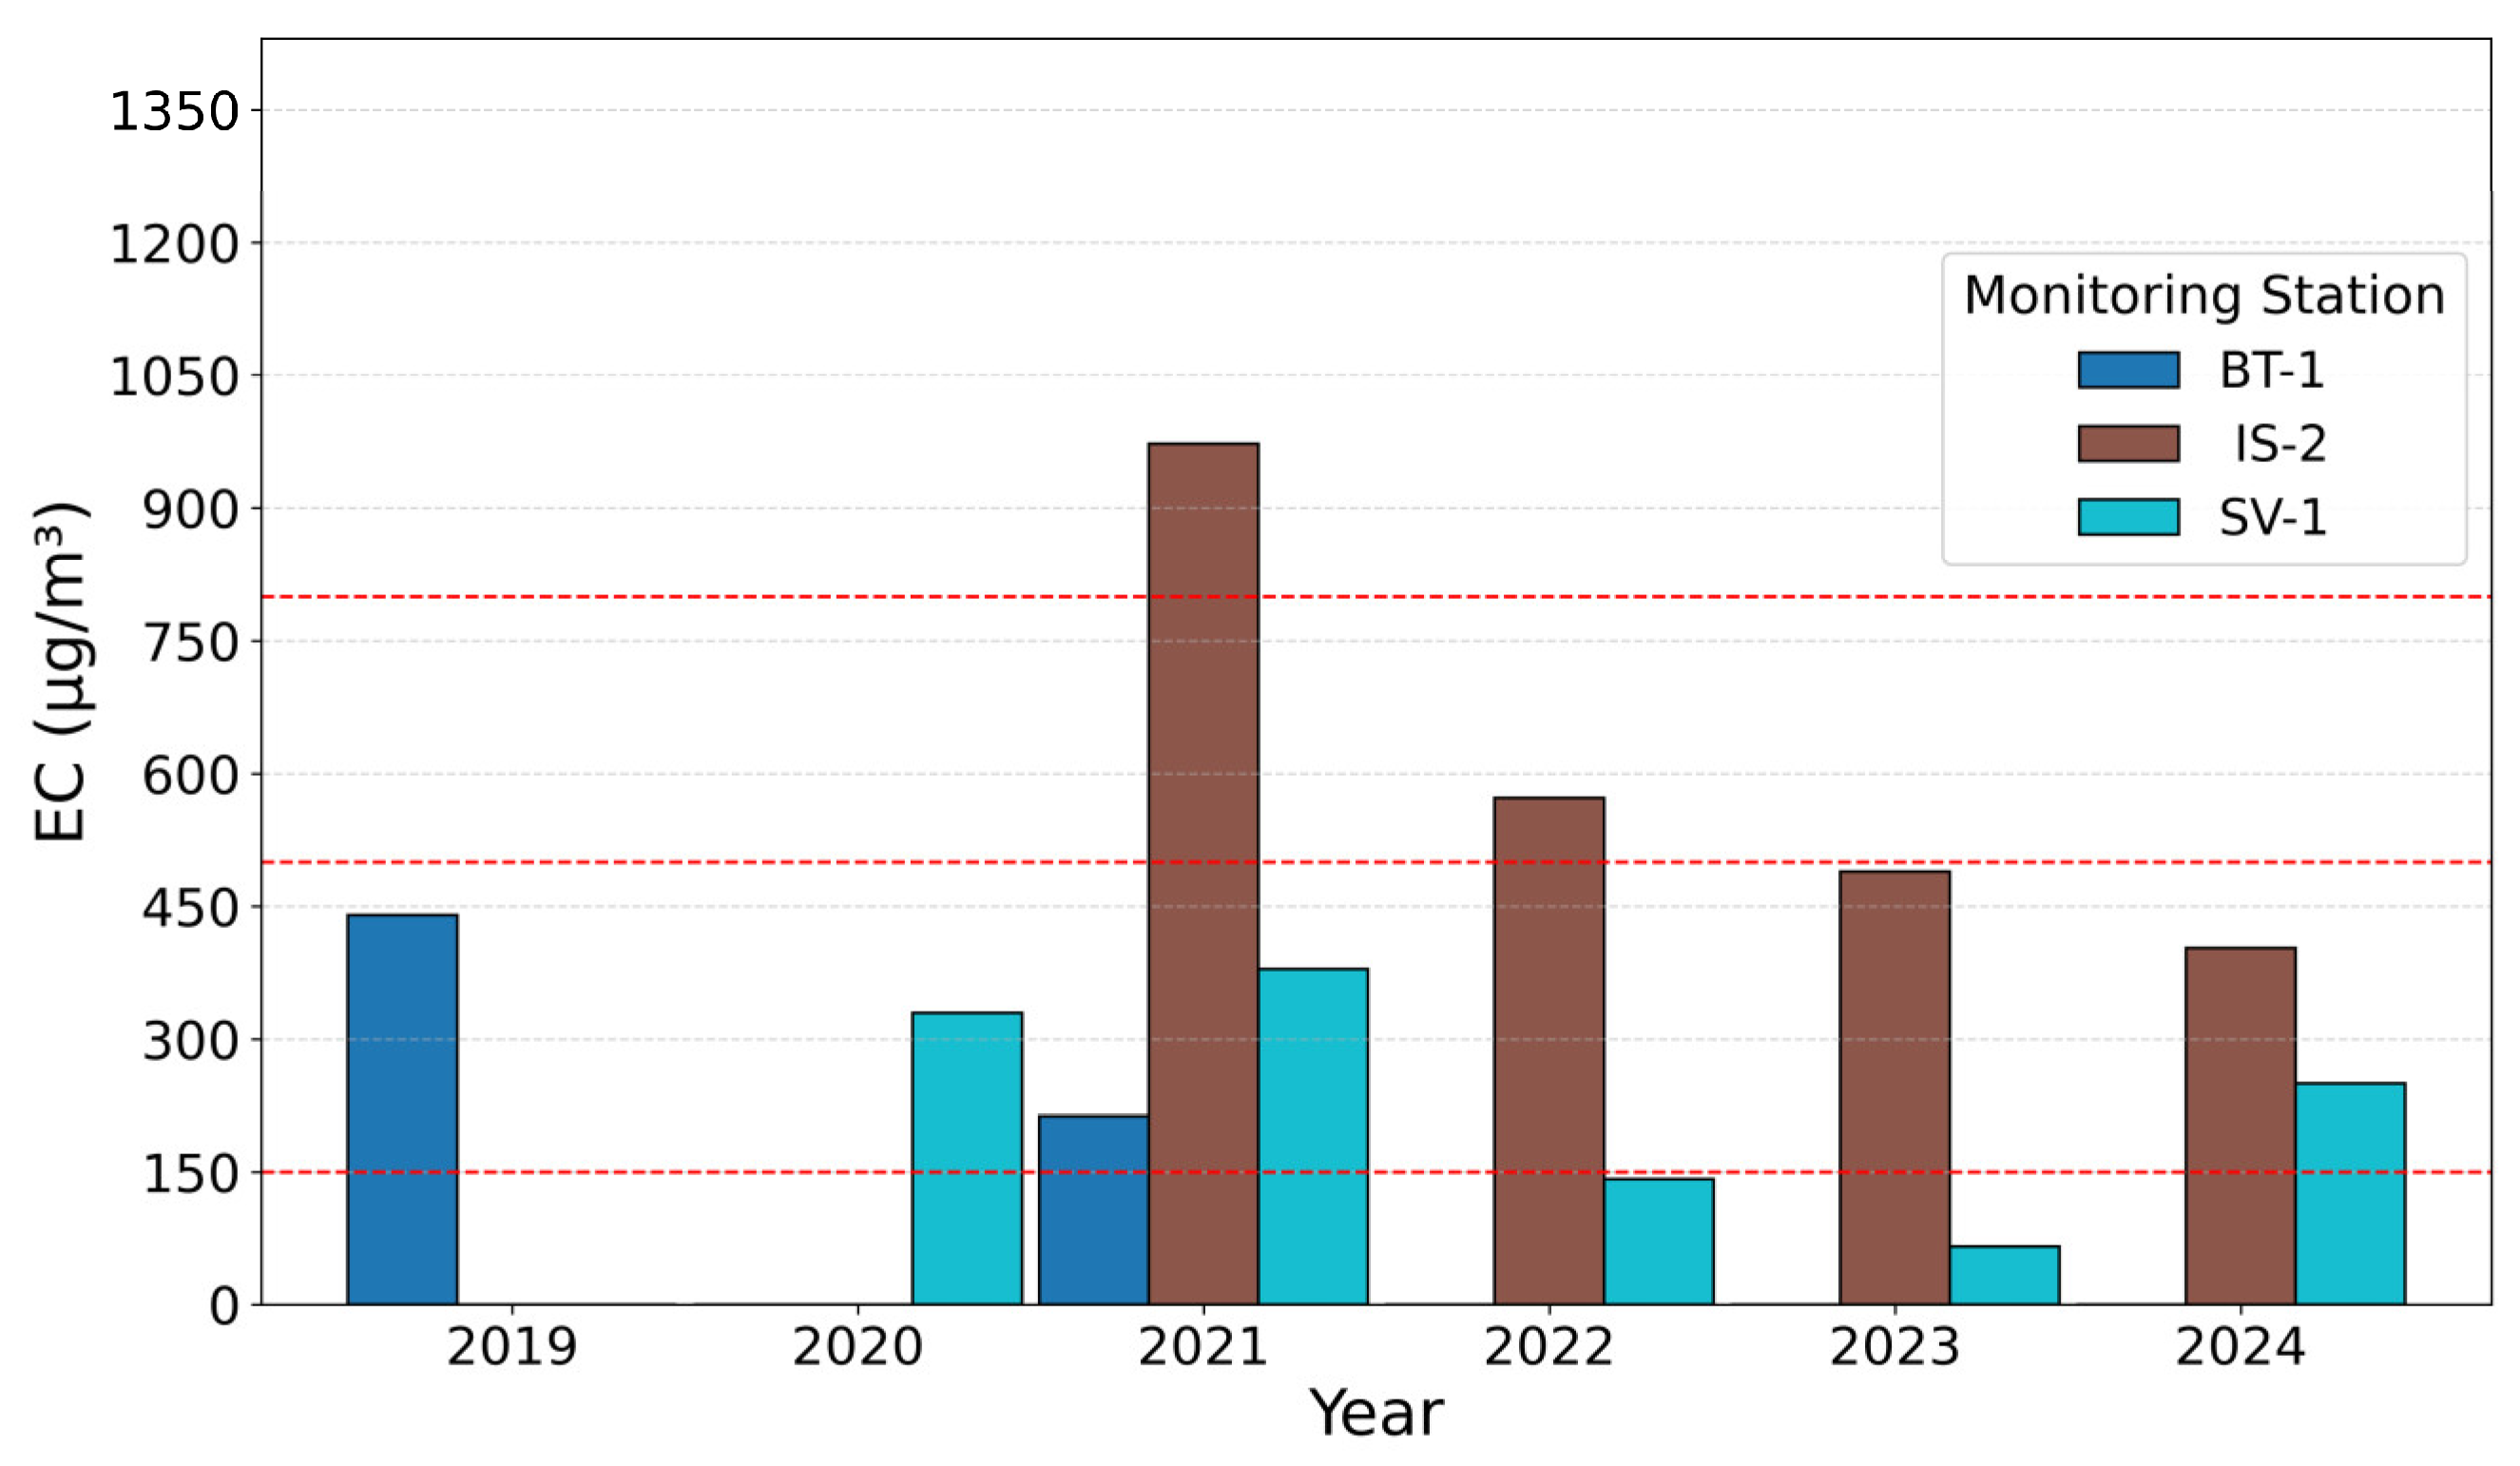
Figure 6.
Distribution of TLI Levels by station and year.
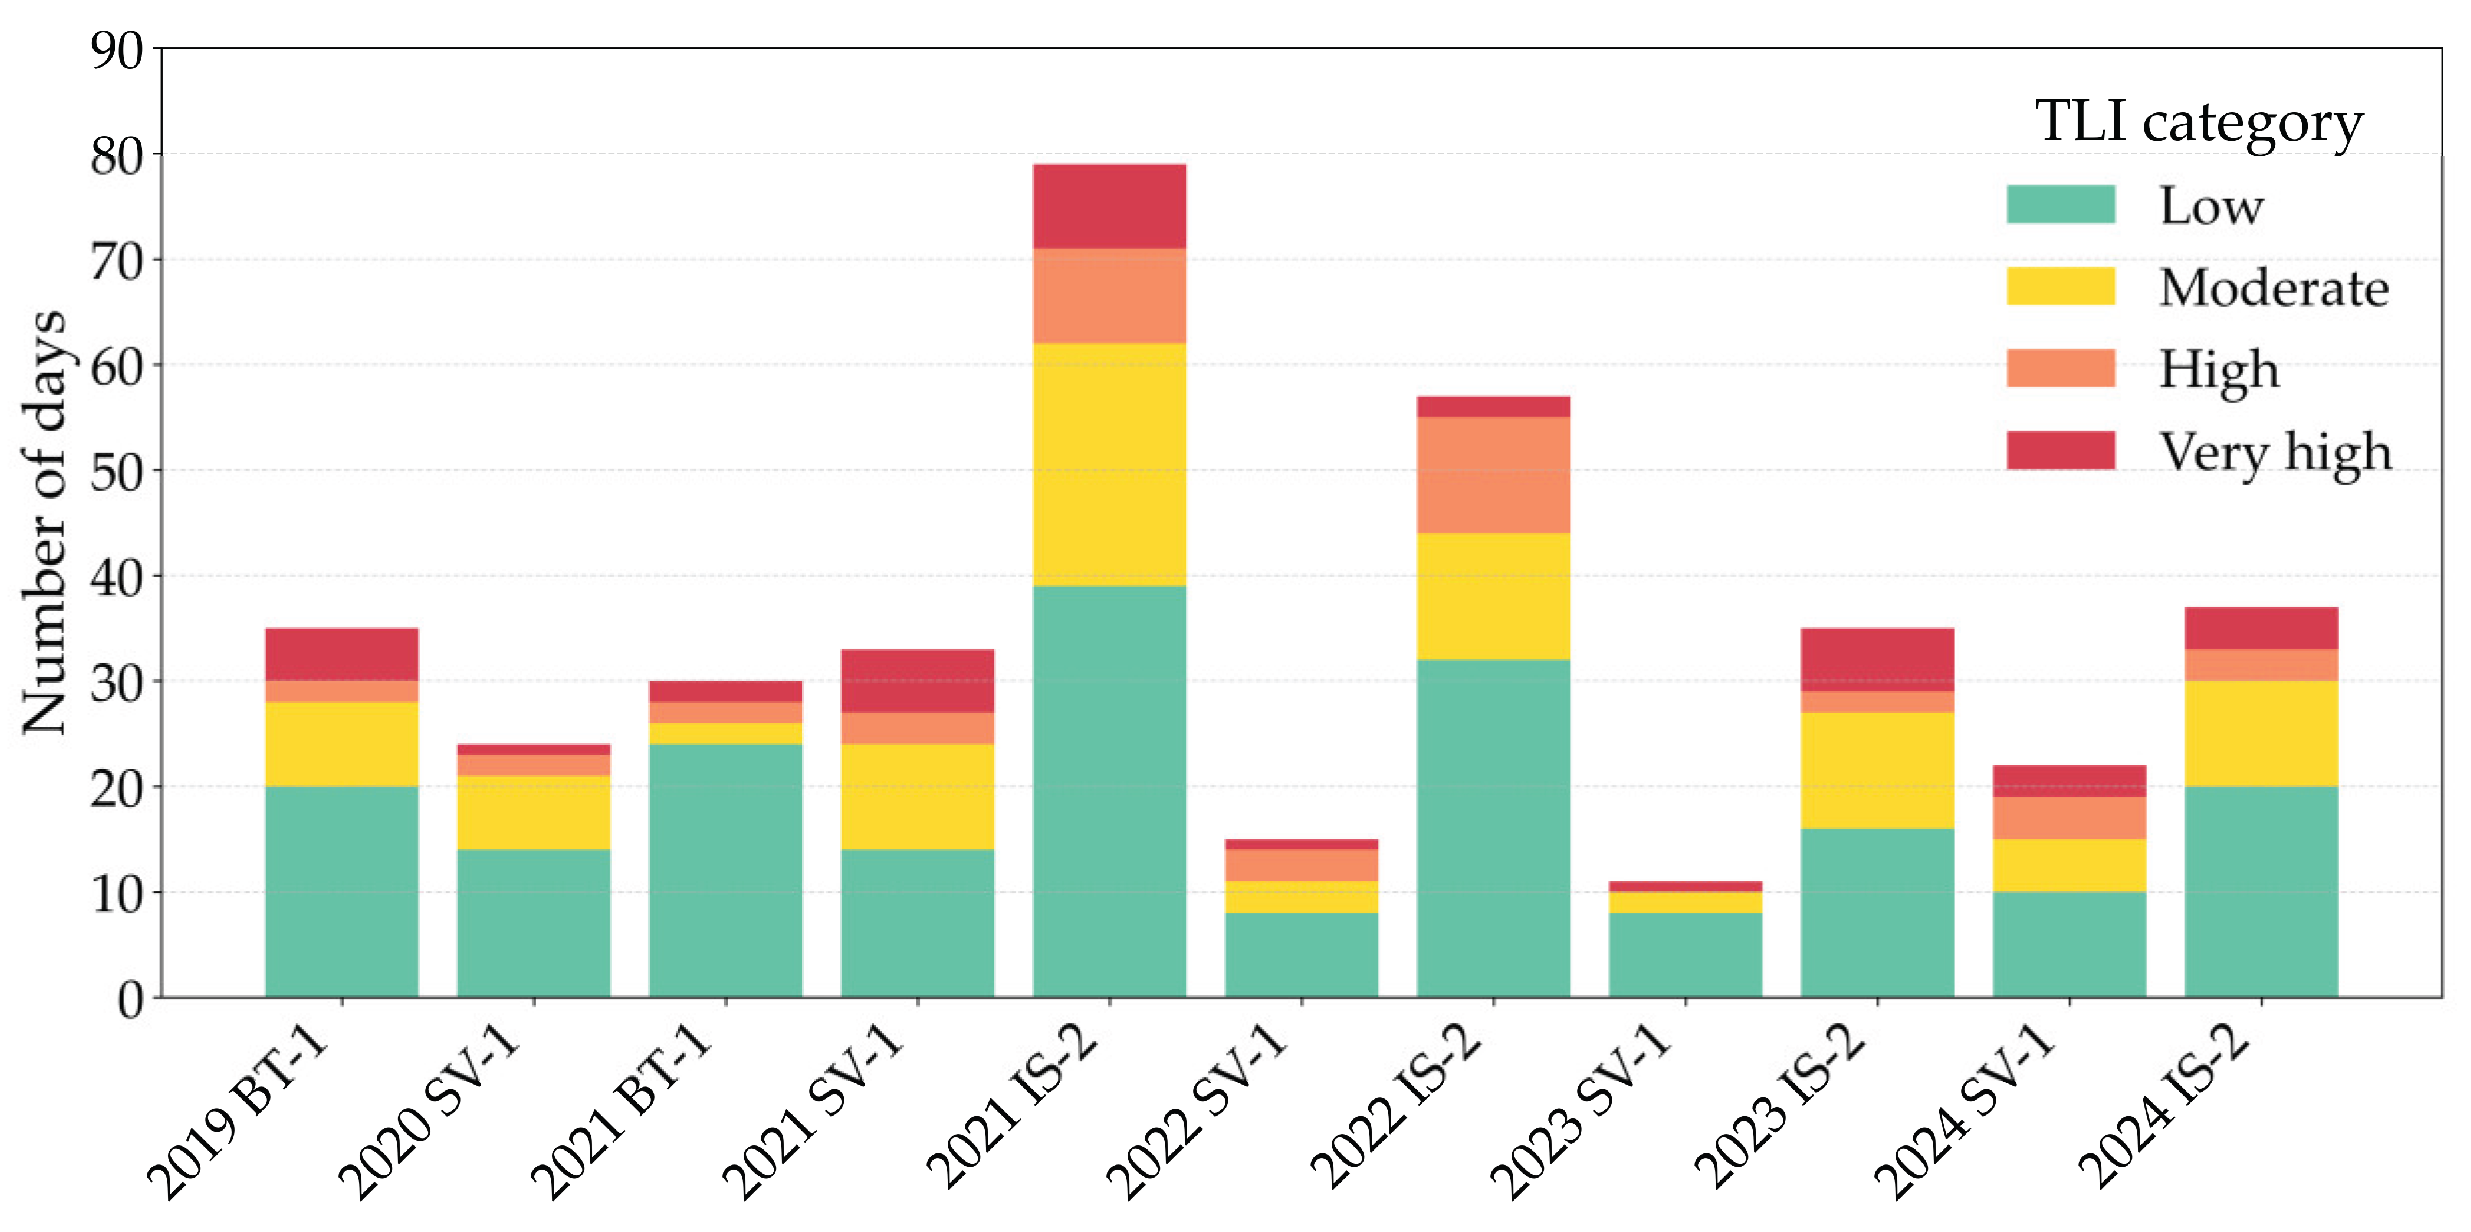

Table 1.
Comparison of Limit Values for human health protection.
|
Pollutant |
Averaging period |
Directive 2008/50/EC* | Directive (EU) 2024/2881** |
WHO, 2021 Recommended |
| Limit value | AQG level | |||
|
PM2.5 µg/m3 |
Calendar year | 25 | 10 | 5 |
| 1 day | - | 25 not to be exceeded more than 18 times per calendar year |
15 not to be exceeded more than 3-4 times per calendar year |
|
|
PM10 µg/m3 |
Calendar year | 40 | 20 | 15 |
| 1 day | 50 not to be exceeded more than 35 times per calendar year |
45 not to be exceeded more than 18 times per calendar year |
45 not to be exceeded more than 3-4 times per calendar year |
|
* to be attained by 11 December 2026. ** to be attained by 1 January 2030.
Table 2.
Alert thresholds and Information thresholds - Directive UE 2024/2881.
| Pollutant | Averaging period | Directive (EU) 2024/2881 |
| PM2.5 | 1 day | 50 µg/m3 |
| PM10 | 1 day | 90 µg/m3 |
Table 3.
Locations of the monitoring stations.
| Station | Latitude | Longitude | Altitude | ||||
| Suceava | SV-1 | 47.649259°N | 26.249009°E | 376 m | |||
| SV-21 | 47.668825°N | 26.281403°E | 289 m | ||||
| Botosani | BT-1 | 47.739945°N | 26.658999°E | 167 m | |||
| Iasi | IS-2 | 47.150951°N | 27.581920°E | 42 m | |||
| IS-41 | 47.213306°N | 27.611074°E | 186 m | ||||
1 The SV-2 and SV-4 stations only provide daily PM10 concentration data.
Table 4.
Exposure categories for annual excess concentrations.
| Categorie | EC annual (µg/m3) | Interpretation criteria. | |
| PM10 | PM2.5 | ||
| Low | <250 | <150 | Less than 18 daily exceedances or low-magnitude daily exceedances |
| Moderate | 251–750 | 151–500 | Frequent moderate daily exceedances, slightly above the value limit and/or occasional high exceedances |
| High | 751–1000 | 501–800 | Frequent daily exceedances and/or high daily concentration levels |
| Very high | >1000 | >800 | Severe pollution or extreme episodes |
Table 5.
Classification of Pollution Episode Index.
| Categorie | EI (µg/m3) | Interpretation criteria. | ||
| PM10 | PM2.5 | PM10 | PM2.5 | |
| High | 1-25 | 1-25 | 2–3 days with 90–100 µg/m3 | 2–3 days, with values slightly above 50 µg/m3 |
| Very high | 26–100 | 26–100 | 3–4 days with 100–115 µg/m3 | 3–4 days with 60–70 µg/m3 |
| Extremely high | >101 | >101 | Long episodes and/or episodes with high peaks (>115 µg/m3). | Long episodes and/or episodes with high peaks (>75-90 µg/m3). |
Table 6.
Classification of daily TLI for PM2.5.
| Categorie | TLI (µg/m3) | Interpretation criteria |
| No risk | 0 | PM2.5 below LV, insignificant toxic load |
| Low | 0.1 – 5 | Slightly exceeded or lower PM2.5/PM10 |
| Moderate | 5.1 – 12 | Significant exceedance and high proportion of PM2.5 |
| High | 12.1 – 20 | Severe pollution with toxic composition |
| Very high | > 20 | Critical episode, major toxicological risk |
Table 7.
Annual mean concentrations of PM10 compared to current and future annual limit value.
| Year | BT-1 | IS-2 | IS-4 | SV-1 | SV-2 |
Directive 2008/50/EC |
Directive (EU) 2024/2881 |
| PM10 | |||||||
| µg/m3 | µg/m3 | µg/m3 | µg/m3 | µg/m3 | LV | LV | |
| 2019 | 27.30 | 32.10 | 20.22 | 22.60 | 32.87 | 40 µg/m3 | 20 µg/m3 |
| 2020 | 25.15 | 30.43 | 20.68 | 20.75 | 30.51 | ||
| 2021 | 23.27 | 30.73 | 20.47 | 22.29 | 28.54 | ||
| 2022 | 21.70 | 29.60 | 18.34 | 17.88 | - | ||
| 2023 | 20.72 | 27.18 | 18.62 | 18.53 | - | ||
| 2024 | 26.23 | 27.53 | - | 21.39 | - | ||
Table 8.
Annual mean concentrations of PM2.5 compared to current and future annual limit.
| Year | BT-1 | IS-2 | SV-1 |
Directive 2008/50/EC |
Directive (UE) 2024/2881 |
| PM2.5 | |||||
| µg/m3 | µg/m3 | µg/m3 | LV | LV | |
| 2019 | 13.34 | - | - | 25 µg/m3 | 10 µg/m3 |
| 2020 | - | - | 14.47 | ||
| 2021 | 13.74 | 20.21 | 15.14 | ||
| 2022 | - | 18.02 | 12.12 | ||
| 2023 | - | 14.91 | 11.23 | ||
| 2024 | - | 15.50 | 13.75 | ||
Table 9.
Episodes of PM10 pollution > 90 µg/m3, 2019 - 2024.
| Station | Period | Duration (days) | Average exceedance (µg/m3) |
EI (µg/m3) |
|
| SV-2 | 08-01-2020 | 10-01-2020 | 3 | 22.11 | 66.33 |
| IS-2 | 09-01-2020 | 10-01-2020 | 2 | 6.56 | 13.11 |
| SV-2 | 25-01-2020 | 28-01-2020 | 4 | 8.89 | 35.56 |
| IS-2 | 25-01-2020 | 28-01-2020 | 4 | 6.42 | 25.68 |
| BT-1 | 26-11-2020 | 27-11-2020 | 2 | 7.69 | 15.37 |
| IS-2 | 26-11-2020 | 28-11-2020 | 3 | 8.61 | 25.83 |
| IS-2 | 24-02-2021 | 26-02-2021 | 3 | 23.34 | 70.03 |
Table 10.
Episodes of PM2.5 pollution PM2.5 > 50 µg/m3, 2019 - 2024.
| Station | Period | Duration (days) | Average exceedance (µg/m3) |
EI (µg/m3) |
|
| BT-1 | 06-12-2019 | 08-12-2019 | 3 | 28.12 | 84.36 |
| SV-1 | 26-01-2020 | 27-01-2020 | 2 | 4.85 | 9.7 |
| BT-1 | 26-11-2020 | 27-11-2020 | 2 | 17.45 | 34.9 |
| SV-1 | 26-11-2020 | 27-11-2020 | 2 | 5.07 | 10.14 |
| SV-1 | 19-01-2021 | 20-01-2021 | 2 | 7.15 | 14.3 |
| IS-2 | 23-02-2021 | 26-02-2021 | 4 | 26.46 | 105.82 |
| BT-1 | 13-11-2021 | 14-11-2021 | 2 | 16.64 | 33.28 |
| IS-2 | 15-03-2022 | 16-03-2022 | 2 | 8.97 | 17.94 |
| IS-2 | 09-02-2023 | 11-02-2023 | 3 | 22.58 | 67.74 |
| IS-2 | 29-12-2023 | 30-12-2023 | 2 | 7.61 | 15.22 |
| IS-2 | 06-11-2024 | 08-11-2024 | 3 | 15.22 | 45.66 |
Disclaimer/Publisher’s Note: The statements, opinions and data contained in all publications are solely those of the individual author(s) and contributor(s) and not of MDPI and/or the editor(s). MDPI and/or the editor(s) disclaim responsibility for any injury to people or property resulting from any ideas, methods, instructions or products referred to in the content. |
© 2025 by the authors. Licensee MDPI, Basel, Switzerland. This article is an open access article distributed under the terms and conditions of the Creative Commons Attribution (CC BY) license (https://creativecommons.org/licenses/by/4.0/).
Copyright: This open access article is published under a Creative Commons CC BY 4.0 license, which permit the free download, distribution, and reuse, provided that the author and preprint are cited in any reuse.


