
Submitted:
09 July 2025
Posted:
09 July 2025
You are already at the latest version
Abstract
: Gestational diabetes mellitus (GDM) is a growing global health concern, driving the need for novel diagnostic and prognostic approaches. This non-targeted metabolomic study investigated amino acid profiles in the mother-fetus system to identify biomarkers linked to GDM and fetal macrosomia. Using HPLC-MS/MS, we analyzed serum from maternal venous and umbilical cord blood, along with amniotic fluid, across 94 mother-fetus pairs (53 GDM, 41 controls). Machine learning and metabolic pathway analysis revealed significant alterations in 19 amino acids. In GDM, maternal serum showed elevated 5-OH-lysine and homocitrulline, while cord blood had higher isoleucine, serine, and threonine. Amniotic fluid exhibited increased leucine, isoleucine, threonine, serine, arginine, and ornithine. Conversely, histidine, glutamine, alanine, asparagine, β-/γ-aminobutyric acids, phenylalanine, ornithine, and citrulline were reduced. Histidine, glutamine, and asparagine inversely correlated with blood glucose (|R| < 0.4, *p* < 0.05) and were lower in GDM. These findings highlight three key metabolic loci in GDM pathogenesis, with glutamine, histidine, and asparagine emerging as potential maternal blood biomarkers for early macrosomia prediction. However, given confounding factors in metabolomic studies, further large-scale validation is essential.
Keywords:
amino acids
; metabolic profile
; gestational diabetes mellitus
; clinical markers
; biological markers
; macrosomia
; mother-fetus system
1. Introduction
The rising incidence of gestational diabetes mellitus (GDM) and its associated complications underscores the need for novel diagnostic and management strategies. The global standardized prevalence of GDM is 14.0% (95% CI: 13.97–14.04%), with regional variations ranging from 7.1% to 27.6% [1]. Among pregnant women with GDM, fetal macrosomia is diagnosed in 15–45% of cases—three times more frequently than in mothers with normal blood glucose levels. Perinatal mortality rates are 1.5–3 times higher in macrosomic infants compared to those with normal birth weight [2,3,4], and the risk of intrapartum complications increases significantly [5]. Mothers with GDM and fetal macrosomia are more likely to experience complications during delivery and the postpartum period, with a substantially higher rate of cesarean sections [2,3,4,6]. Neonatal morbidity rates are also elevated in macrosomic newborns (birth weight >4,000 g) [5]. This cohort of children is at high risk for developing type 2 diabetes, obesity, and cardiovascular diseases in adolescence and adulthood [7].
Current evidence suggests that GDM arises from a combination of genetic, epigenetic, and environmental factors [8]. Genome-wide association studies (GWAS) investigating maternal metabolism during pregnancy have revealed overlaps between genes linked to metabolic traits in pregnant and non-pregnant populations, as well as genes potentially unique to pregnancy [9]. Epigenetic alterations—such as DNA methylation, histone modifications, and microRNA-mediated gene silencing—have also been identified in GDM patients [10,11,12]. Amino acid profiling has demonstrated metabolic shifts in pregnant women with elevated insulin resistance and hyperglycemia, mirroring patterns observed in non-pregnant individuals with insulin resistance [9]. This suggests shared metabolic pathways underlying insulin resistance and hyperglycemia, irrespective of pregnancy status.
However, most published studies focus solely on maternal metabolic changes. A comprehensive analysis of the maternal-fetal system—integrating maternal venous blood, amniotic fluid, and umbilical cord blood—could unify existing multi-omics data and advance a systems biology approach to address GDM.
In GDM, the fetomaternal unit exhibits significant disruptions in carbohydrate and lipid metabolism [5]. Beyond glucose and lipid metabolic alterations, GDM and associated macrosomia are characterized by an imbalance in "free" amino acid levels. In healthy pregnancies, a series of enzymatic reactions maintain dynamic equilibrium in the fetomaternal system—replenishing intermediate metabolites through anaplerotic reactions while balancing their utilization and removal from metabolic cycles.
However, GDM alters both amino acid composition and associated anaplerotic pathways in the mother-fetus system. The amino acid profile undergoes marked changes: decreased levels of essential amino acids, elevated concentrations of aromatic (phenylalanine, tyrosine) and sulfur-containing amino acids (methionine, cysteine), and altered ratios of branched-chain amino acids (leucine, isoleucine, valine). These shifts reflect placental dysfunction, insulin resistance, modified activity of amino acid-metabolizing enzymes, and increased fetal demand.
Consequently, investigating amino acid amphibolism (intermediary metabolic reactions) in GDM is critical—not only to elucidate disease pathogenesis but also to enable early diagnosis of complications and develop personalized metabolic interventions tailored to maternal dietary habits and lifestyle.
The aim of this study was to analyze the amino acid profile in the mother-fetus system (maternal venous blood, umbilical cord blood, and amniotic fluid) to identify specific biological markers of GDM and macrosomia.
2. Results
2.1. Venous Blood Serum
Based on mutual information index values, the following potential biomarkers of GDM were identified: lysine, glutamine, histidine, alanine, γ-aminobutyric acid, β-alanine, valine, homocitrulline, asparagine, 5-OH-lysine, tryptophan, and α-aminobutyric acid (Figure 1a). The levels of 5-OH-lysine and homocitrulline were elevated in GDM, whereas the concentrations of α-aminobutyric acid, β-alanine, γ-aminobutyric acid (p < 0.05), glutamine (p < 0.05), lysine (p < 0.05), alanine (p < 0.05), asparagine (p < 0.05), and histidine (p < 0.05) were significantly reduced (Figure 1b)
In the control group, SHAP value analysis revealed decreased levels of 5-OH-lysine and increased levels of glutamine, histidine, and asparagine (Figure 2). These same amino acids were previously identified as potential biomarkers for distinguishing between control and GDM groups. In GDM with macrosomia, we observed decreased levels of asparagine and lysine, along with elevated levels of homocitrulline and 5-OH-lysine. Notably, while histidine effectively differentiates controls from GDM cases, it does not serve as a reliable biomarker for the GDM+macrosomia subgroup. For normosomic GDM cases, lower levels of histidine and glutamine were characteristic, accompanied by higher levels of 5-OH-lysine, asparagine, and serine. These findings suggest that: (1) decreased asparagine levels are associated with GDM complicated by macrosomia; (2) reduced histidine and glutamine levels may be linked to GDM without macrosomia; and (3) elevated 5-OH-lysine levels are common to both GDM subgroups.
Analysis of metabolic pathway databases identified 45 statistically significant pathways enriched with amino acids differentiating control and GDM groups (maternal venous blood). The most relevant pathways included: (1) 'Amino acid transport across plasma membrane' and 'Transport of inorganic cations/anions and amino acids/oligopeptides' (β-alanine, alanine, γ-aminobutyric acid, glutamine-enriched); (2) 'Na+-dependent neurotransmitter transporters' and 'Neurotransmitter release cycle' (β-alanine, γ-aminobutyric acid, glutamine-enriched); (3) 'GABA reuptake' and 'GABA synthesis/release/reuptake/degradation' (β-alanine, γ-aminobutyric acid-enriched); (4) Reactome's 'Aspartate/asparagine metabolism' (β-alanine, glutamine-enriched); (5) KEGG's 'GABAergic synapse' and 'Alanine/aspartate/glutamate metabolism' (glutamine, γ-aminobutyric acid-enriched); and (6) KEGG's 'Beta-alanine metabolism' (β-alanine, γ-aminobutyric acid-enriched) (Figure 3).
No statistically significant enriched pathways were identified for the GDM+macrosomia subgroup biomarkers.
2.2. Serum Cord Blood
Analysis of umbilical cord serum identified phenylalanine, histidine, ornithine, citrulline, serine, α-aminobutyric acid, and isoleucine as potential GDM biomarkers (Figure 4a). Among these, isoleucine showed a statistically significant increase in GDM cases. Serine and α-aminobutyric acid levels were also elevated, whereas phenylalanine, histidine, ornithine, and citrulline levels were reduced in umbilical cord blood when the mother had GDM (Figure 4b).
The control group exhibited lower levels of isoleucine and serine, but higher levels of methionine, citrulline, proline, lysine, phenylalanine, and histidine. The GDM+macrosomia subgroup showed reduced lysine levels and elevated threonine, isoleucine, and serine levels, while the GDM+normosomia subgroup displayed lower methionine, citrulline, and proline levels but higher tryptophan, isoleucine, threonine, and arginine levels. Notably, histidine served as a biomarker for controls in both umbilical cord blood and maternal serum, whereas lysine was specific to GDM+macrosomia in both sample types. No common biomarkers were found between umbilical cord blood and maternal serum for GDM+normosomia. Importantly, threonine emerged as a discriminant marker between GDM subgroups based on fetal macrosomia status, with low lysine and high serine levels being specifically characteristic of GDM+macrosomia (Figure 5).
No statistically significant pathways enriched with umbilical cord blood amino acid biomarkers of GDM were identified.
A total of 46 pathways were found to be statistically significantly enriched with umbilical cord blood amino acids serving as biomarkers for "GDM in pregnancy + fetal macrosomia." The most significant pathways included: (1) "tRNA charging, gamma-glutamyl cycle," (2) "leukotriene biosynthesis," and (3) "S-methyl-5-thio-alpha-D-ribose 1-phosphate degradation" from HumanCyc; (4) "Mineral absorption - Homo sapiens (human)" from KEGG (all enriched with isoleucine, serine, and threonine); as well as (5) pathways of tobramycin, streptomycin, paromomycin, gentamicin, and chloramphenicol action from SMPDB (enriched with isoleucine and threonine) (Figure 6).
2.4. Amniotic fluid
Analysis of amniotic fluid amino acids identified potential biomarkers of GDM: ornithine, serine, leucine, citrulline, tyrosine, proline, phenylalanine, isoleucine, glycine, threonine, glutamine, asparagine, arginine, valine, 1-methylhistidine, aspartic acid, alanine, glutamic acid, and histidine (Figure 7a). Among these, the levels of ornithine, serine, leucine, citrulline, tyrosine, proline, phenylalanine, isoleucine, threonine, glutamine, asparagine, arginine, valine, aspartic acid, alanine, glutamic acid, and histidine were significantly elevated in GDM cases (p < 0.05) (Figure 7b).
The control group exhibited lower levels of leucine, threonine, 5-OH-lysine, arginine, isoleucine, serine, aspartic acid, 3-methylhistidine, citrulline, proline, ornithine, histidine, and phenylalanine. With the exception of 5-OH-lysine and 3-methylhistidine, these amino acids were previously identified as potential biomarkers distinguishing controls from GDM cases. While isoleucine, serine, citrulline, proline, histidine, and phenylalanine were established as control group markers in umbilical cord blood, only isoleucine and serine showed consistent directional changes in both amniotic fluid and cord blood in GDM. Histidine and 5-OH-lysine were previously identified as control markers in serum, with only 5-OH-lysine showing consistent reduction in both serum and amniotic fluid. The GDM+macrosomia subgroup demonstrated elevated levels of serine, citrulline, 5-OH-lysine, leucine, isoleucine, histidine, threonine, and aspartic acid, alongside reduced γ-aminobutyric acid, phenylalanine, and ornithine. The increases in serine and threonine paralleled umbilical cord blood findings, while 5-OH-lysine elevation matched serum patterns. For normosomic GDM, characteristic elevations included arginine, 3-methylhistidine, ornithine, threonine, γ-aminobutyric acid, leucine, 5-OH-lysine, and isoleucine. While arginine, threonine, and isoleucine in cord blood were also potential normosomic GDM markers, threonine showed opposite directional changes (decreased in cord blood vs increased in amniotic fluid). The rise in 5-OH-lysine was consistent with serum findings. Notably, increased arginine, 3-methylhistidine, and ornithine were unique to normosomic GDM, as these either decreased in controls or showed non-significant changes in GDM+macrosomia. Conversely, serine elevation was specific to GDM+macrosomia (Figure 8).
A total of 305 pathways were found to be statistically significantly enriched with amniotic fluid biomarkers differentiating GDM from controls. The most significant pathways included: (1) "tRNA charging, gamma-glutamyl cycle," (2) "leukotriene biosynthesis," and (3) "S-methyl-5-thio-alpha-D-ribose 1-phosphate degradation" from HumanCyc; (4) "Protein digestion and absorption - Homo sapiens (human)" and (5) "Aminoacyl-tRNA biosynthesis - Homo sapiens (human)" from KEGG (enriched with glutamic acid, proline, leucine, tyrosine, isoleucine, arginine, serine, glutamine, phenylalanine, threonine, aspartic acid, and valine); (6) "Amino acid transport across the plasma membrane" and (7) "Transport of inorganic cations/anions and amino acids/oligopeptides" from Reactome (enriched with glutamic acid, proline, leucine, tyrosine, isoleucine, arginine, alanine, ornithine, glutamine, phenylalanine, aspartic acid, and valine); (8) "Central carbon metabolism in cancer - Homo sapiens (human)" from KEGG (enriched with glutamic acid, proline, phenylalanine, tyrosine, isoleucine, arginine, serine, glutamine, leucine, aspartic acid, and valine); and (9) "Glucose Homeostasis" from WikiPathways (enriched with phenylalanine, tyrosine, arginine, isoleucine, citrulline, ornithine, and valine) (Figure 9).
Analysis identified 134 statistically significant pathways enriched with amniotic fluid biomarkers for the GDM+macrosomia subgroup. Key pathways included: (1) "tRNA charging," (2) "leukotriene biosynthesis," and (3) "gamma-glutamyl cycle S-methyl-5-thio-alpha-D-ribose 1-phosphate degradation" from HumanCyc; (4) "Protein digestion and absorption - Homo sapiens (human)" and (5) "Aminoacyl-tRNA biosynthesis - Homo sapiens (human)" from KEGG (enriched with phenylalanine, serine, isoleucine, leucine, threonine, and aspartic acid); (6) "Mineral absorption - Homo sapiens (human)" (enriched with leucine, serine, phenylalanine, isoleucine, and threonine) and (7) "Central carbon metabolism in cancer - Homo sapiens (human)" (enriched with serine, aspartic acid, phenylalanine, leucine, and isoleucine) from KEGG; (8) "Amino acid transport across the plasma membrane" from Reactome (enriched with leucine, isoleucine, γ-aminobutyric acid, phenylalanine, and ornithine); and (9) "Glucose Homeostasis" from WikiPathways (enriched with phenylalanine, isoleucine, ornithine, and citrulline) (Figure 10).
2.5. Clinical Markers
To validate the biological significance of the findings and assess potential biomarkers of GDM and macrosomia in maternal blood, we analyzed clinical-laboratory markers and established their correlation with experimental data (maternal blood amino acids).
The analysis revealed that maternal pre-pregnancy BMI and glucose levels showed the strongest association with GDM development (Figure 11a). The relationship between GDM and BMI followed a linear trend in the BMI range of 22.5–30 kg/m², while for BMI >35 kg/m², the association plateaued (Figure 11b). Furthermore, parameters falling within Quadrants I and III of Figure 11c exhibited the most significant association with GDM: Quadrant I (BMI >25 kg/m² and glucose >4.0 mmol/L) correlated with a high probability of GDM, whereas Quadrant III (BMI <25 kg/m² and glucose <4.0 mmol/L) was associated with a low GDM risk.
The strongest associations with neonatal birth weight were observed for amniotic fluid index (AFI) and ultrasound markers of diabetic fetopathy (DF). Gestational age at delivery ranked seventh in predictive strength, following placental thickness and maternal levels of alanine aminotransferase (ALT), aspartate aminotransferase (AST), and fibrinogen. Notably, the type of GDM treatment (insulin therapy vs. dietary management) showed virtually no impact on fetal weight (Figure 12a). The relationship between AFI and birth weight followed a linear pattern, with AFI values ≥90 mm being consistently associated with DF diagnosis (Figure 12b).
Subsequent analysis revealed significant moderate-strength correlations between clinical parameters and maternal blood amino acids (|R| < 0.4, p < 0.05). Specifically, glucose levels showed weak inverse correlations with β-alanine (r = -0.28, p = 0.01), γ-aminobutyric acid (r = -0.31, p = 0.006), histidine (r = -0.26, p = 0.02), lysine (r = -0.28, p = 0.02), methionine (r = -0.25, p = 0.03), 1-methylhistidine (r = -0.25, p = 0.03), phenylalanine (r = -0.28, p = 0.02), asparagine (r = -0.29, p = 0.01), and glutamine (r = -0.33, p = 0.003). Similarly, BMI demonstrated weak negative correlations with proline (r = -0.33, p = 0.004), alanine (r = -0.26, p = 0.02), histidine (r = -0.28, p = 0.02), and γ-aminobutyric acid (r = -0.25, p = 0.03). APTT levels showed inverse associations with leucine (r = -0.24, p = 0.03), asparagine (r = -0.30, p = 0.008), glutamine (r = -0.23, p = 0.047), aspartic acid (r = -0.32, p = 0.008), and threonine (r = -0.27, p = 0.02). Conversely, creatinine exhibited weak positive correlations with γ-aminobutyric acid (r = 0.30, p = 0.008), histidine (r = 0.26, p = 0.03), lysine (r = 0.25, p = 0.03), and 1-methylhistidine (r = 0.29, p = 0.01) (Figure 13). Of particular interest was the observed relationship between clinical-laboratory parameters and amino acids previously identified as strongly associated with GDM and macrosomia in maternal venous blood, notably histidine (negative correlation: r = -0.26, p = 0.02).
The most pronounced alterations were observed in amino acids involved in glucose metabolism (e.g., glutamine, histidine) and markers of renal function (e.g., creatinine and associated amino acids). The correlation analysis results highlight the interplay between metabolic disturbances in gestational diabetes and serum amino acid profiles.
Thus, maternal blood amino acids—specifically asparagine, glutamine, and histidine, which showed strong associations with GDM (glutamine, histidine) and macrosomia (asparagine)—demonstrated inverse correlations with blood glucose levels, suggesting their biological significance as potential biomarkers in GDM pathophysiology.
3. Discussion
Our study revealed significant alterations in the amino acid profile within the mother-fetus system in gestational diabetes mellitus (GDM) and associated fetal macrosomia. We identified key clinical markers consistent with recent international findings [13,14,15,16,17,18].
Analysis of maternal serum, umbilical cord blood, and amniotic fluid demonstrated specific metabolic shifts that may serve as potential biomarkers for early diagnosis and prediction of pregnancy complications.
In maternal venous serum, GDM was characterized by decreased levels of histidine, glutamine, alanine, asparagine, β- and γ-aminobutyric acids, reflecting potential impairments in amino acid transport and neurotransmitter metabolism. Elevated 5-OH-lysine and homocitrulline were GDM-associated, independent of macrosomia status. The most significantly affected metabolic pathways included amino acid transport, GABAergic synapse function, and alanine/aspartate metabolism.
The study revealed significantly decreased concentrations of histidine, phenylalanine, ornithine, and citrulline in umbilical cord blood from GDM pregnancies, suggesting impaired fetal nitrogen metabolism. Elevated levels of isoleucine, serine, and threonine were characteristic of fetal macrosomia, consistent with enhanced fetal anabolic processes. These changes showed significant associations with protein breakdown/absorption, mineral metabolism, and leukotriene biosynthesis pathways, likely reflecting fetal adaptive mechanisms to maternal hyperglycemia. Furthermore, we identified key metabolic pathways involving amino acids in GDM pathophysiology.
In GDM pregnancies, amniotic fluid demonstrated significantly elevated levels of leucine, isoleucine, threonine, serine, arginine, ornithine, and 5-OH-lysine (p<0.05), reflecting activated anabolic processes and altered protein metabolism. While serine and threonine emerged as potential macrosomia biomarkers (r=0.32-0.41), arginine and ornithine were more characteristic of GDM without macrosomia. These changes were associated with three key metabolic pathways: (1) protein digestion/absorption (KEGG hsa04974), (2) aminoacyl-tRNA biosynthesis (KEGG hsa00970), and (3) amino acid transmembrane transport (GO:0003333), with all findings remaining significant after FDR correction (q<0.1).
Independent predictors of GDM included pre-pregnancy BMI and glucose levels, while amniotic fluid index (AFI) and ultrasound signs of diabetic fetopathy after 37 gestational weeks were predictive of macrosomia. Women carrying macrosomic fetuses exhibited significantly greater gestational weight gain regardless of GDM status. Correlation analysis identified three maternal serum amino acids with biomarker potential for GDM and macrosomia: glutamine (inversely correlated with glucose levels, p<0.01), histidine (associated with both GDM and renal function markers), and asparagine (macrosomia-specific pattern).
Table 1 provides a comparative overview of amino acid metabolism alterations in the mother-fetus system and identifies key biomarkers for further investigation (see Supplementary Table S1 for complete quantitative data on all amino acids across study groups and subgroups).
Of particular interest was the analysis of publications examining the characteristics of the amino acid profile in GDM and a comparison of the obtained results. In a large-scale study by Zhen Hong et al. (2025) involving 969 women, conducted from 2019 to 2021, the relationship between plasma amino acid concentrations and GDM incidence was investigated. The study identified 16 biomarkers differentiating GDM and non-GDM groups, revealing strong correlations (OR = 0.753–1.671, P = <0.001–0.001) between specific amino acids and GDM risk. Notably, GDM was associated with significantly elevated levels of alpha-aminoadipic acid and arginine, alongside reduced glycine and serine (P = <0.001–0.045). However, the authors concluded that the overall amino acid profile, rather than disruptions in individual amino acids, may represent a more significant preventive or therapeutic target for GDM [19]. In a 2022 study by Xiangju Kong et al., clinical data and serum levels of fatty acids, amino acids, and organic acids were analyzed in 90 pregnant women at 24–28 weeks of gestation to compare differences among groups with gestational hypertension (GH), GDM, and healthy pregnancies. GDM was characterized by lower pyroglutamic acid and higher 2-hydroxybutyric and glutamic acid levels. The findings suggested that metabolic disorders (GDM and GH) in mid-pregnancy were associated with dysregulated glucose and lipid metabolism, potentially inducing oxidative stress through glutathione metabolism and unsaturated fatty acid biosynthesis [20]. Our study revealed elevated maternal venous blood concentrations of 5-OH-lysine and homocitrulline in GDM, while current evidence indicates an inverse relationship between lysine levels and blood triglycerides in metabolic disorders. Similarly, Sunmin Park et al. demonstrated associations between lysine, tyrosine, and valine levels and GDM, insulin resistance, and insulin secretion at 24–28 weeks of gestation [21].
In 2017, Najmeh Rahimi et al. published an analysis of venous blood amino acids (AAs) in women with gestational diabetes mellitus and type 2 diabetes (T2DM). Compared to controls, mothers with GDM exhibited higher plasma concentrations of arginine (P = 0.01), glycine (P = 0.01), and methionine (P = 0.04), whereas pregnant women with T2DM had elevated plasma levels of asparagine (P = 0.01), tyrosine (P < 0.01), valine (P < 0.01), phenylalanine (P < 0.01), glutamine (P < 0.01), and isoleucine (P < 0.01). Regression analysis confirmed significantly increased plasma concentrations of asparagine (OR: 3.64, CI 1.22–10.47), threonine (OR: 3.38, CI 1.39–8.25), aspartic acid (OR: 3.92, CI 1.19–12.91), phenylalanine (OR: 2.66, CI 1.01–6.94), glutamine (OR: 2.53, CI 1.02–6.26), and arginine (OR: 1.96, CI 1.02–3.76) in GDM mothers after adjusting for gestational age and BMI [22]. Several studies on amino acid profiles in GDM and T2DM have reported elevated levels of arginine, methionine, and glycine in women with GDM. In GDM, dysregulation of the adenosine/L-arginine/nitric oxide pathway likely occurs [23], which may underlie vascular endothelial dysfunction. The significant increase in arginine concentration observed in our study in amniotic fluid suggests potential fetal involvement in these processes and strongly indicates signs of endothelial dysfunction in GDM, even among fetuses without signs of diabetic fetopathy.
In a 2005 publication, the authors identified several biomarkers of GDM, including increased placental weight, a reduced fetal-to-placental weight ratio compared to normal pregnancies, significantly elevated ornithine levels in venous blood, and altered amino acid (AA) profiles in umbilical cord blood—specifically increased valine, methionine, phenylalanine, isoleucine, leucine, ornithine, glutamate, proline, and alanine, alongside decreased glutamine [24]. Of particular interest is the involvement of fetal AA pools (umbilical cord blood and amniotic fluid) in the gamma-glutamyl cycle, potentially linked to fetal macrosomia. In their 2005 study, Irene Cetin et al. reported significantly elevated glutamate and reduced glutamine levels in umbilical cord blood of GDM pregnancies, suggesting increased fetal hepatic glutamate production due to endocrine alterations in the fetoplacental unit. The authors concluded that placental AA metabolism is altered in GDM pregnancies [24]. Similarly, our study observed a significant decrease in maternal serum glutamine levels in GDM cases, with a particularly sharp reduction in the subgroup of GDM pregnancies with normal-weight fetuses. This finding may indicate a compensatory role of glutamine in fetal weight regulation.
Another noteworthy finding was the elevated serine concentration in umbilical cord blood and amniotic fluid, which correlated with fetal weight (appropriate for gestational age vs. macrosomia). Several studies assessing metabolic disturbances in GDM have reported altered concentrations of amino acids such as alanine, valine, and serine [25,26,27]. In our study, GDM patients exhibited increased valine levels in AF and maternal venous blood, with subgroup analysis revealing this elevation exclusively in AF of GDM cases with fetal macrosomia. These amino acids may contribute to blood glucose modulation by influencing cellular energy metabolism, thereby potentially affecting transplacental nutrient transfer and fetal weight regulation [28].
Thus, a comparative analysis of currently available data and the original results obtained in this study reveals significant heterogeneity, likely influenced by sample size, ethnic variations, and other environmental factors that substantially affect the selection of metabolomic biomarkers for GDM. To validate these findings, large-scale multicenter studies should be conducted, accounting for the "phenotypic characteristics" of different geographic regions and establishing region-specific reference values for amino acid profiles.
Despite the pilot nature of this study, the obtained results are promising and open new avenues for developing an amino acid-based biomarker panel for early GDM diagnosis and macrosomia prediction, as well as personalized metabolic correction in GDM patients, including dietary interventions tailored to amino acid metabolism alterations. These findings also hold significant potential for further investigation into GDM pathogenesis, particularly regarding placental amino acid transport and the role of epigenetic factors.
4. Materials and Methods
4.1. Sample Collection
The study material was collected at the I.D. Evtushenko Regional Perinatal Center (Tomsk, Russia) between January 2024 and March 2025
From an initial cohort of 2,000 women undergoing first-trimester prenatal screening (11-13.6 weeks) at the Tomsk Perinatal Center, we prospectively selected 94 mother-newborn dyads for postpartum analysis, stratifying them into Group I (GDM-affected, n=53) and Group II (non-GDM controls, n=41); subsequent stratification created three clinically-relevant subgroups: Ia (GDM with macrosomia ≥4000g, n=23), Ib (GDM with normal birthweight 2501-3999g, n=30), and II (non-GDM controls 2501-3999g, n=36 after excluding 5 cases exceeding 3999g), in this ethically-approved (Kulakov National Medical Research Center IRB Protocol #4, 04/18/2024) multicenter collaboration between Siberian State Medical University (Tomsk) and Kulakov Center (Moscow), with all participants providing written informed consent prior to enrollment.
Inclusion Criteria: for the main group (GDM): Caucasian ethnicity, singleton pregnancy, neonatal birth weight 2501-4999 g with confirmed GDM diagnosis, and written informed consent. For the control group (non-GDM): Caucasian ethnicity, absence of GDM, singleton pregnancy, neonatal birth weight 2501-4999 g, and written informed consent. All participants were required to: (1) undergo comprehensive prenatal evaluation including three ultrasound screenings with venous blood sampling, (2) complete oral glucose tolerance testing at 24-28 weeks gestation, and (3) deliver at the I.D. Evtushenko Regional Perinatal Center (Tomsk).
Exclusion Criteria: type 1 or 2 diabetes mellitus; any decompensated somatic pathology; oncological diseases; autoimmune disorders; bronchial asthma requiring medication-controlled management; and multifetal pregnancies.
The frequency of insulin therapy administration in women with GDM was comparable between fetal macrosomia (54.2%) and normosomia (59.1%) groups. During the first and third trimesters, only 2 patients with macrosomic fetuses and 2 with normosomic fetuses required insulin therapy initiation, while the second trimester saw insulin requirement in just 4 normosomia cases. Dietary modification with elimination of rapidly absorbable carbohydrates served as the primary therapeutic approach for hyperglycemia correction across all study participants.
All pregnant women underwent standardized ultrasound examinations at established gestational windows (11-14 weeks, 18-21 weeks, and 30-32 weeks). GDM diagnosis was confirmed through a 75g oral glucose tolerance test (OGTT) performed after 8-14 hours of overnight fasting. Venous plasma glucose levels were measured within 30 minutes of initial blood collection, with test termination if fasting glucose exceeded 5.1 mmol/L. For continuing tests, participants consumed within 5 minutes a glucose solution containing 75g anhydrous glucose dissolved in 250-300mL of warm (37-40°C) non-carbonated water. Subsequent venous plasma glucose measurements were obtained at 1-hour and 2-hour intervals post-glucose load. Diagnostic thresholds for GDM and overt diabetes mellitus are detailed in Table 2 and Table 3.
Blood samples were collected using a vacuum system into sterile 9 mL S-Monovette tubes containing clot activator and separation gel, following a 12-hour fasting period. The serum was subsequently centrifuged at 700 g for 10 minutes at 4°C, after which the supernatant was carefully aspirated using a specialized pipette and transferred into sterile Eppendorf tubes (1 mL aliquots). These aliquots were immediately frozen and stored at -80°C until analysis. For all participants, blood collection was performed during the designated study period between 37.0 and 40.6 weeks of gestation.
Prior to HPLC-MS/MS analysis, all blood specimens were maintained at -80°C in the Biobank facility of Siberian State Medical University (Tomsk) to ensure sample integrity and stability.
4.3. Sample Preparation
To 50 μL of each sample, we added 50 μL of internal standard mixture solution (1.4 μg/mL per standard), vortex-mixed for 1 minute, followed by sequential addition of 100 μL purified water and 500 μL chloroform/methanol (2:1, v/v). After 10 minutes of vortex mixing, samples were centrifuged at 15,000 × g for 10 minutes. We then transferred 50 μL of the upper aqueous-methanolic layer to a clean microcentrifuge tube and evaporated under nitrogen stream at 60°C. The residue was derivatized with 200 μL 3N HCl in 2-butanol at 60°C for 15 minutes, followed by nitrogen evaporation at 60°C. The dried extract was reconstituted in 300 μL methanol/water (1:1, v/v), vortex-mixed for 10 minutes, centrifuged at 15,000 × g for 10 minutes, and 150 μL supernatant was transferred to an HPLC vial with insert. Chromatographic analysis was performed with 1 μL injection volume.
4.4. LC-MS/MS Analysis
Amino acid profiling was performed using high-performance liquid chromatography coupled with tandem mass spectrometry (HPLC-MS/MS) on an analytical system comprising an Acquity I-Class liquid chromatograph (Waters, USA) and a Xevo TQ-XS triple quadrupole mass spectrometer (Waters, USA) equipped with an electrospray ionization source. Chromatographic separation was achieved using an Agilent ZORBAX Eclipse XDB-C18 column (2.1 × 100 mm, 1.8 μm particle size) maintained at 30°C with a constant flow rate of 250 μL/min. The mobile phase consisted of (A) 10 mM ammonium acetate in water and (B) 0.1% formic acid in acetonitrile, with the following gradient elution program: 100% A (0-0.1 min), linear decrease from 95% to 75% A (0.1-19.0 min), 5% A (19.1-21.0 min), and re-equilibration at 100% A (21.1-30 min). The total chromatographic run time was 30 minutes.
The list of analyzed amino acids and their corresponding internal standards is provided in Table S2.
4.5. Statistical Analysis
To assess the association between amino acid levels and gestational diabetes mellitus (GDM), we calculated the mutual information (MI) index [29], considering amino acids with MI values ≥50% of the maximum observed MI as potential markers. Candidate markers were further evaluated using Mann-Whitney U tests (with p<0.05 considered significant) and median ratios, with final selection requiring either (1) significant Mann-Whitney results plus median ratios ≠1, or (2) absolute binary logarithms of median ratios >1. For analyzing GDM and fetal macrosomia associations, we computed Shapley values [30] using a random forest classifier [31], designating amino acids as markers when their mean absolute Shapley values exceeded 50% of the maximum observed mean absolute Shapley value.
Marker enrichment for discriminating (1) control/GDM groups and (2) "GDM+macrosomia" group from other metabolic pathways was evaluated using ConsensusPathDB [32], with significance threshold set at uncorrected p<0.01. The top 10 most significant pathways were selected based on maximum geometric mean values (calculated as: [number of pathway-included markers]/[total pathway metabolites]) and minimal false discovery rates (-log10(FDR)).
We performed Spearman's correlation analysis to assess relationships between amino acid levels and clinical parameters in women with gestational diabetes mellitus (GDM), with statistical significance set at *p* < 0.05. To evaluate the association of clinical parameters with both GDM development and neonatal birth weight, we computed Shapley values [30] using a random forest classifier [31]. Potential biomarkers were identified as parameters with mean absolute Shapley values ≥50% of the maximum observed mean absolute Shapley value. All statistical analyses were conducted using custom R scripts (version 4.3.1) [33], leveraging the following packages: praznik (v11.0.0) [34] for feature selection, ggplot2 (v3.5.1) [35] and reshape2 (v1.4.4) [36] for data visualization, ranger (v0.17.0) [37] for random forest modeling, and kernelshap (v0.7.0) [38] for Shapley value computation.
5. Conclusions
This study presents a novel comprehensive analysis of the maternal-fetal amino acid profile system, uniquely examining all three biological compartments (maternal blood, umbilical cord blood, and amniotic fluid) in a large patient cohort. Our findings provide new insights into metabolic dysregulation in gestational diabetes mellitus and lay the groundwork for developing innovative diagnostic and preventive strategies for pregnancy complications.
The study revealed distinct amino acid profile alterations in the maternal-fetal system during GDM: decreased maternal serum levels of histidine, glutamine and asparagine suggest impaired placental transport and increased fetal demand, while elevated amniotic fluid concentrations of leucine, isoleucine, serine and threonine, along with increased cord blood isoleucine/serine and decreased arginine, indicate disrupted fetal anabolic processes potentially contributing to macrosomia development. Notably, 5-OH-lysine emerged as a GDM-specific biomarker independent of fetal weight, providing new insights into the metabolic pathophysiology of diabetic pregnancies and highlighting potential targets for diagnostic and therapeutic interventions.
Our findings align with previous reports demonstrating consistent alterations in amino acid concentrations (alanine, valine, serine, glutamine, and arginine) associated with GDM and fetal macrosomia. However, significant variability across studies – likely attributable to methodological, demographic, and analytical differences – underscores the current challenges in establishing reliable metabolomic biomarkers for GDM and macrosomia. This heterogeneity highlights the critical need for large-scale, multicenter validation studies to standardize biomarker identification and clinical translation.
Supplementary Materials
The following supporting information can be downloaded at the website of this paper posted on Preprints.org. Table S1: Alteration of metabolomic profile in system “mother-fetus”. M is maternal sefum venous blood, F is serum cord blood, AF is amniotic fluid. p without * - is comparing serum venous blood, p** - comparing serum cord blood, p** - comparing amniotic fluid. AF – amniotic fluid; Таблица S2: Списoк анализируемых аминoкислoт и сooтветствующих им внутренних стандартoв.
Author Contributions
Conceptualization, N.F. and V.F.; methodology, N.F.; software, A.T., V.L, and V.C.; validation, S.Y. and A.K.; formal analysis, V.C.; investigation, N.F. and V.C.; resources, V.F. and G.S.; data curation, T.K., and V.F.; writing—original draft preparation, N.F.; writing—review and editing, N.F., A.T., and V.F.; visualization, T.K.; supervision, V.F.; project administration, G.S.; funding acquisition, V.F. All authors have read and agreed to the published version of the manuscript.
Funding
The study was supported by the Russian Science Foundation (RSF) grant № 24-64-00006.
Institutional Review Board Statement
The study was approved by the Ethical Committee of the National Medical Research Center for Obstetrics, Gynecology and Perinatology named after Academician V.I. Kulakov (protocol No. 4, dated April 18, 2024).
Informed Consent Statement
Informed consent was obtained from all subjects involved in the study.
Data Availability Statement
Data are contained within the supplementary material.
Acknowledgments
In this section, you can acknowledge any support given which is not covered by the author contribution or funding sections. This may include administrative and technical support, or donations in kind (e.g., materials used for experiments). Where GenAI has been used for purposes such as generating text, data, or graphics, or for study design, data collection, analysis, or interpretation of data, please add “During the preparation of this manuscript/study, the author(s) used [tool name, version information] for the purposes of [description of use]. The authors have reviewed and edited the output and take full responsibility for the content of this publication.”
Conflicts of Interest
The authors declare no conflicts of interest.
Abbreviations
The following abbreviations are used in this manuscript:
| BMI | Body mass index |
| AF | Amniotic fluid |
| GDM | Gestational diabet melitus |
| HPLC-MS | Hight perfomace liquid chromatography – mass-spectrometry |
| LC-MS/MS | Liquid chromatography-tandem mass-spectrometry |
| WPH | Water packare hight |
References
- Wang, H.; Li, N.; Chivese, T.; Werfalli, M.; Sun, H.; Yuen, L.; Hoegfeldt, C.A.; Elise Powe, C.; Immanuel, J.; Karuranga, S.; et al. IDF Diabetes Atlas: Estimation of Global and Regional Gestational Diabetes Mellitus Prevalence for 2021 by International Association of Diabetes in Pregnancy Study Group’s Criteria. Diabetes Res. Clin. Pract. 2022, 183, 109050. [Google Scholar] [CrossRef] [PubMed]
- Goldstein, R.F.; Abell, S.K.; Ranasinha, S.; Misso, M.; Boyle, J.A.; Black, M.H.; Li, N.; Hu, G.; Corrado, F.; Rode, L.; et al. Association of gestational weight gain with maternal and infant outcomes: A systematic review and meta-analysis. JAMA - J. Am. Med. Assoc. 2017, 317, 2207–2225. [Google Scholar] [CrossRef]
- Isaku, M.; Vrapi, E.; Bimbashi, T.; Cala, I.; Perdja, K.; Hoxhallari, R.; Bimbashi, A. Perinatal Outcomes Among Cases of Predicted and Unpredicted Macrosomia. Gynecol. Obstet. Reprod. Med. 2023, 29, 93–98. [Google Scholar] [CrossRef]
- Boulvain, M.; Thornton, J.G. Induction of labour at or near term for suspected fetal macrosomia. Cochrane Database Syst. Rev. 2023, 2023. [Google Scholar] [CrossRef]
- Kamana, K.; Sumisti, S.; Zhang, H. Gestational diabetes mellitus and macrosomia: A literature review. Ann. Nutr. Metab. 2015, 66, 14–20. [Google Scholar] [CrossRef]
- De Silva, S.; Alli-Shaik, A.; Gunaratne, J. Machine Learning-Enhanced Extraction of Biomarkers for High-Grade Serous Ovarian Cancer from Proteomics Data. Sci. Data 2024, 11, 685. [Google Scholar] [CrossRef]
- Chu, A.H.Y.; Godfrey, K.M. Gestational Diabetes Mellitus and Developmental Programming. Ann. Nutr. Metab. 2021, 76, 4–15. [Google Scholar] [CrossRef]
- Godfrey, K.M.; Costello, P.M.; Lillycrop, K.A. The developmental environment, epigenetic biomarkers and long-term health. J. Dev. Orig. Health Dis. 2015, 6, 399–406. [Google Scholar] [CrossRef]
- Dalfrà, M.G.; Burlina, S.; Del Vescovo, G.G.; Lapolla, A. Genetics and Epigenetics: New Insight on Gestational Diabetes Mellitus. Front. Endocrinol. (Lausanne). 2020, 11, 1–12. [Google Scholar] [CrossRef]
- Wu, P.; Farrell, W.E.; Haworth, K.E.; Emes, R.D.; Kitchen, M.O.; Glossop, J.R.; Hanna, F.W.; Fryer, A.A. Maternal genome-wide DNA methylation profiling in gestational diabetes shows distinctive disease-associated changes relative to matched healthy pregnancies. Epigenetics 2018, 13, 122–128. [Google Scholar] [CrossRef]
- Cardenas, A.; Gagné-Ouellet, V.; Allard, C.; Brisson, D.; Perron, P.; Bouchard, L.; Hivert, M.F. Placental DNA methylation adaptation to maternal glycemic response in pregnancy. Diabetes 2018, 67, 1673–1683. [Google Scholar] [CrossRef]
- Hjort, L.; Martino, D.; Grunnet, L.G.; Naeem, H.; Maksimovic, J.; Olsson, A.H.; Zhang, C.; Ling, C.; Olsen, S.F.; Saffery, R.; et al. Gestational diabetes and maternal obesity are associated with epigenome-wide methylation changes in children. JCI insight 2018, 3, 1–14. [Google Scholar] [CrossRef]
- Liu, C.H.; Yang, S.T.; Wang, P.H. Maternal factors associated with fetal macrosomia. J. Chinese Med. Assoc. 2023, 86, 455–456. [Google Scholar] [CrossRef] [PubMed]
- Moodley, T.; Moodley, J. A retrospective identification of risk factors associated with fetal macrosomia. Afr. J. Reprod. Health 2022, 26, 127–134. [Google Scholar] [CrossRef] [PubMed]
- Romero, R.; Kingdom, J.; Deter, R.; Lee, W.; Vintzileos, A. Fetal Growth: Evaluation and Management. Am. J. Obstet. Gynecol. 2018, 218, S608. [Google Scholar] [CrossRef]
- Rizzo, G.; Patrizi, L.; Mappa, I. Can we improve the diagnosis of fetal macrosomia? J. Clin. Ultrasound 2022, 50, 974–975. [Google Scholar] [CrossRef] [PubMed]
- Jenabi, E.; Salehi, A.M.; Farashi, S.; Salimi, Z. The environmental risk factors associated with fetal macrosomia: An umbrella review. Pediatr. Neonatol. 2024, 65, 217–221. [Google Scholar] [CrossRef]
- Ewington, L.; Black, N.; Leeson, C.; Al Wattar, B.H.; Quenby, S. Multivariable prediction models for fetal macrosomia and large for gestational age: A systematic review. BJOG 2024, 131, 1591–1602. [Google Scholar] [CrossRef]
- Hong, Z.; Huang, L.; Zhou, Q.; Wu, Y.; Lin, X.; Wei, Y.; Wei, Q.; Deng, G.; Zhang, Z. Plasma amino acid profiles and gestational diabetes mellitus risk: A case-control study. Clin. Nutr. 2025, 48, 90–100. [Google Scholar] [CrossRef]
- Kong, X.; Zhu, Q.; Dong, Y.; Li, Y.; Liu, J.; Yan, Q.; Huang, M.; Niu, Y. Analysis of serum fatty acid, amino acid, and organic acid profiles in gestational hypertension and gestational diabetes mellitus via targeted metabolomics. Front. Nutr. 2022, 9, 1–14. [Google Scholar] [CrossRef]
- Park, S.; Park, J.Y.; Lee, J.H.; Kim, S.H. Plasma levels of lysine, tyrosine, and valine during pregnancy are independent risk factors of insulin resistance and gestational diabetes. Metab. Syndr. Relat. Disord. 2015, 13, 64–70. [Google Scholar] [CrossRef] [PubMed]
- Rahimi, N.; Razi, F.; Nasli-Esfahani, E.; Qorbani, M.; Shirzad, N.; Larijani, B. Amino acid profiling in the gestational diabetes mellitus. J. Diabetes Metab. Disord. 2017, 16, 1–6. [Google Scholar] [CrossRef]
- Guzmán-Gutiérrez, E.; Abarzúa, F.; Belmar, C.; Nien, J.K.; Ramírez, M.A.; Arroyo, P.; Salomón, C.; Westermeier, F.; Puebla, C.; Leiva, A.; et al. Functional link between adenosine and insulin: a hypothesis for fetoplacental vascular endothelial dysfunction in gestational diabetes. Curr. Vasc. Pharmacol. 2011, 9, 750–762. [Google Scholar] [CrossRef] [PubMed]
- Cetin, I.; Nobile De Santis, M.S.; Taricco, E.; Radaelli, T.; Teng, C.; Ronzoni, S.; Spada, E.; Milani, S.; Pardi, G. Maternal and fetal amino acid concentrations in normal pregnancies and in pregnancies with gestational diabetes mellitus. Am. J. Obstet. Gynecol. 2005, 192, 610–617. [Google Scholar] [CrossRef] [PubMed]
- Enquobahrie, D.A.; Denis, M.; Tadesse, M.G.; Gelaye, B.; Ressom, H.W.; Williams, M.A. Maternal early pregnancy serum metabolites and risk of gestational diabetes mellitus. J. Clin. Endocrinol. Metab. 2015, 100, 4348–4356. [Google Scholar] [CrossRef]
- Scholtens, D.M.; Muehlbauer, M.J.; Daya, N.R.; Stevens, R.D.; Dyer, A.R.; Lowe, L.P.; Metzger, B.E.; Newgard, C.B.; Bain, J.R.; Lowe, W.L. Metabolomics reveals broad-scale metabolic perturbations in hyperglycemic mothers during pregnancy. Diabetes Care 2014, 37, 158–166. [Google Scholar] [CrossRef]
- Alesi, S.; Ghelani, D.; Rassie, K.; Mousa, A. Molecular Sciences Metabolomic Biomarkers in Gestational Diabetes Mellitus: A Review of the Evidence. Int. J. Mol. Sci 2021, 22, 5512. [Google Scholar] [CrossRef]
- Adachi, Y.; De Sousa-Coelho, A.L.; Harata, I.; Aoun, C.; Weimer, S.; Shi, X.; Gonzalez Herrera, K.N.; Takahashi, H.; Doherty, C.; Noguchi, Y.; et al. L-Alanine activates hepatic AMP-activated protein kinase and modulates systemic glucose metabolism. Mol. Metab. 2018, 17, 61–70. [Google Scholar] [CrossRef]
- Yang, H.H.; Moody, J. Data visualization and feature selection: New algorithms for nongaussian data. Adv. Neural Inf. Process. Syst. 2000, 687–693. [Google Scholar]
- Štrumbelj, E.; Kononenko, I. Explaining prediction models and individual predictions with feature contributions. Knowl. Inf. Syst. 2014, 41, 647–665. [Google Scholar] [CrossRef]
- Kam Ho, T. Random Decision Forests, 2002.
- Kamburov, A.; Herwig, R. ConsensusPathDB 2022 : molecular interactions update as a resource for network biology. 2022, 50, 587–595. [CrossRef]
- CoreTeam, R. R: A Language and Environment for Statistical Computing 2021.
- Kursa, M.B. Praznik: High performance information-based feature selection. SoftwareX 2021, 16, 100819. [Google Scholar] [CrossRef]
- Wickham, H. Elegant Graphics for Data Analysis: ggplot2; 2008; ISBN 978-0-387-78170-9.
- Wickham, H. Reshaping data with the reshape package. J. Stat. Softw. 2007, 21, 1–20. [Google Scholar] [CrossRef]
- Wright, M.N.; Ziegler, A. Ranger: A fast implementation of random forests for high dimensional data in C++ and R. J. Stat. Softw. 2017, 77. [Google Scholar] [CrossRef]
- Covert, I.; Lee, S.-I. Improving KernelSHAP: Practical Shapley Value Estimation Using Linear Regression. In Proceedings of the Proceedings of The 24th International Conference on Artificial Intelligence and Statistics; Banerjee, A., Fukumizu, K., Eds.; PMLR, 2021; Vol. 130, pp. 3457–3465.
Figure 1.
(a) Mutual information scores of serum amino acid levels. (b) Volcano plot of maternal serum amino acid levels in GDM. Amino acids identified as potential biomarkers based on mutual information index values are highlighted in bold.
Figure 1.
(a) Mutual information scores of serum amino acid levels. (b) Volcano plot of maternal serum amino acid levels in GDM. Amino acids identified as potential biomarkers based on mutual information index values are highlighted in bold.
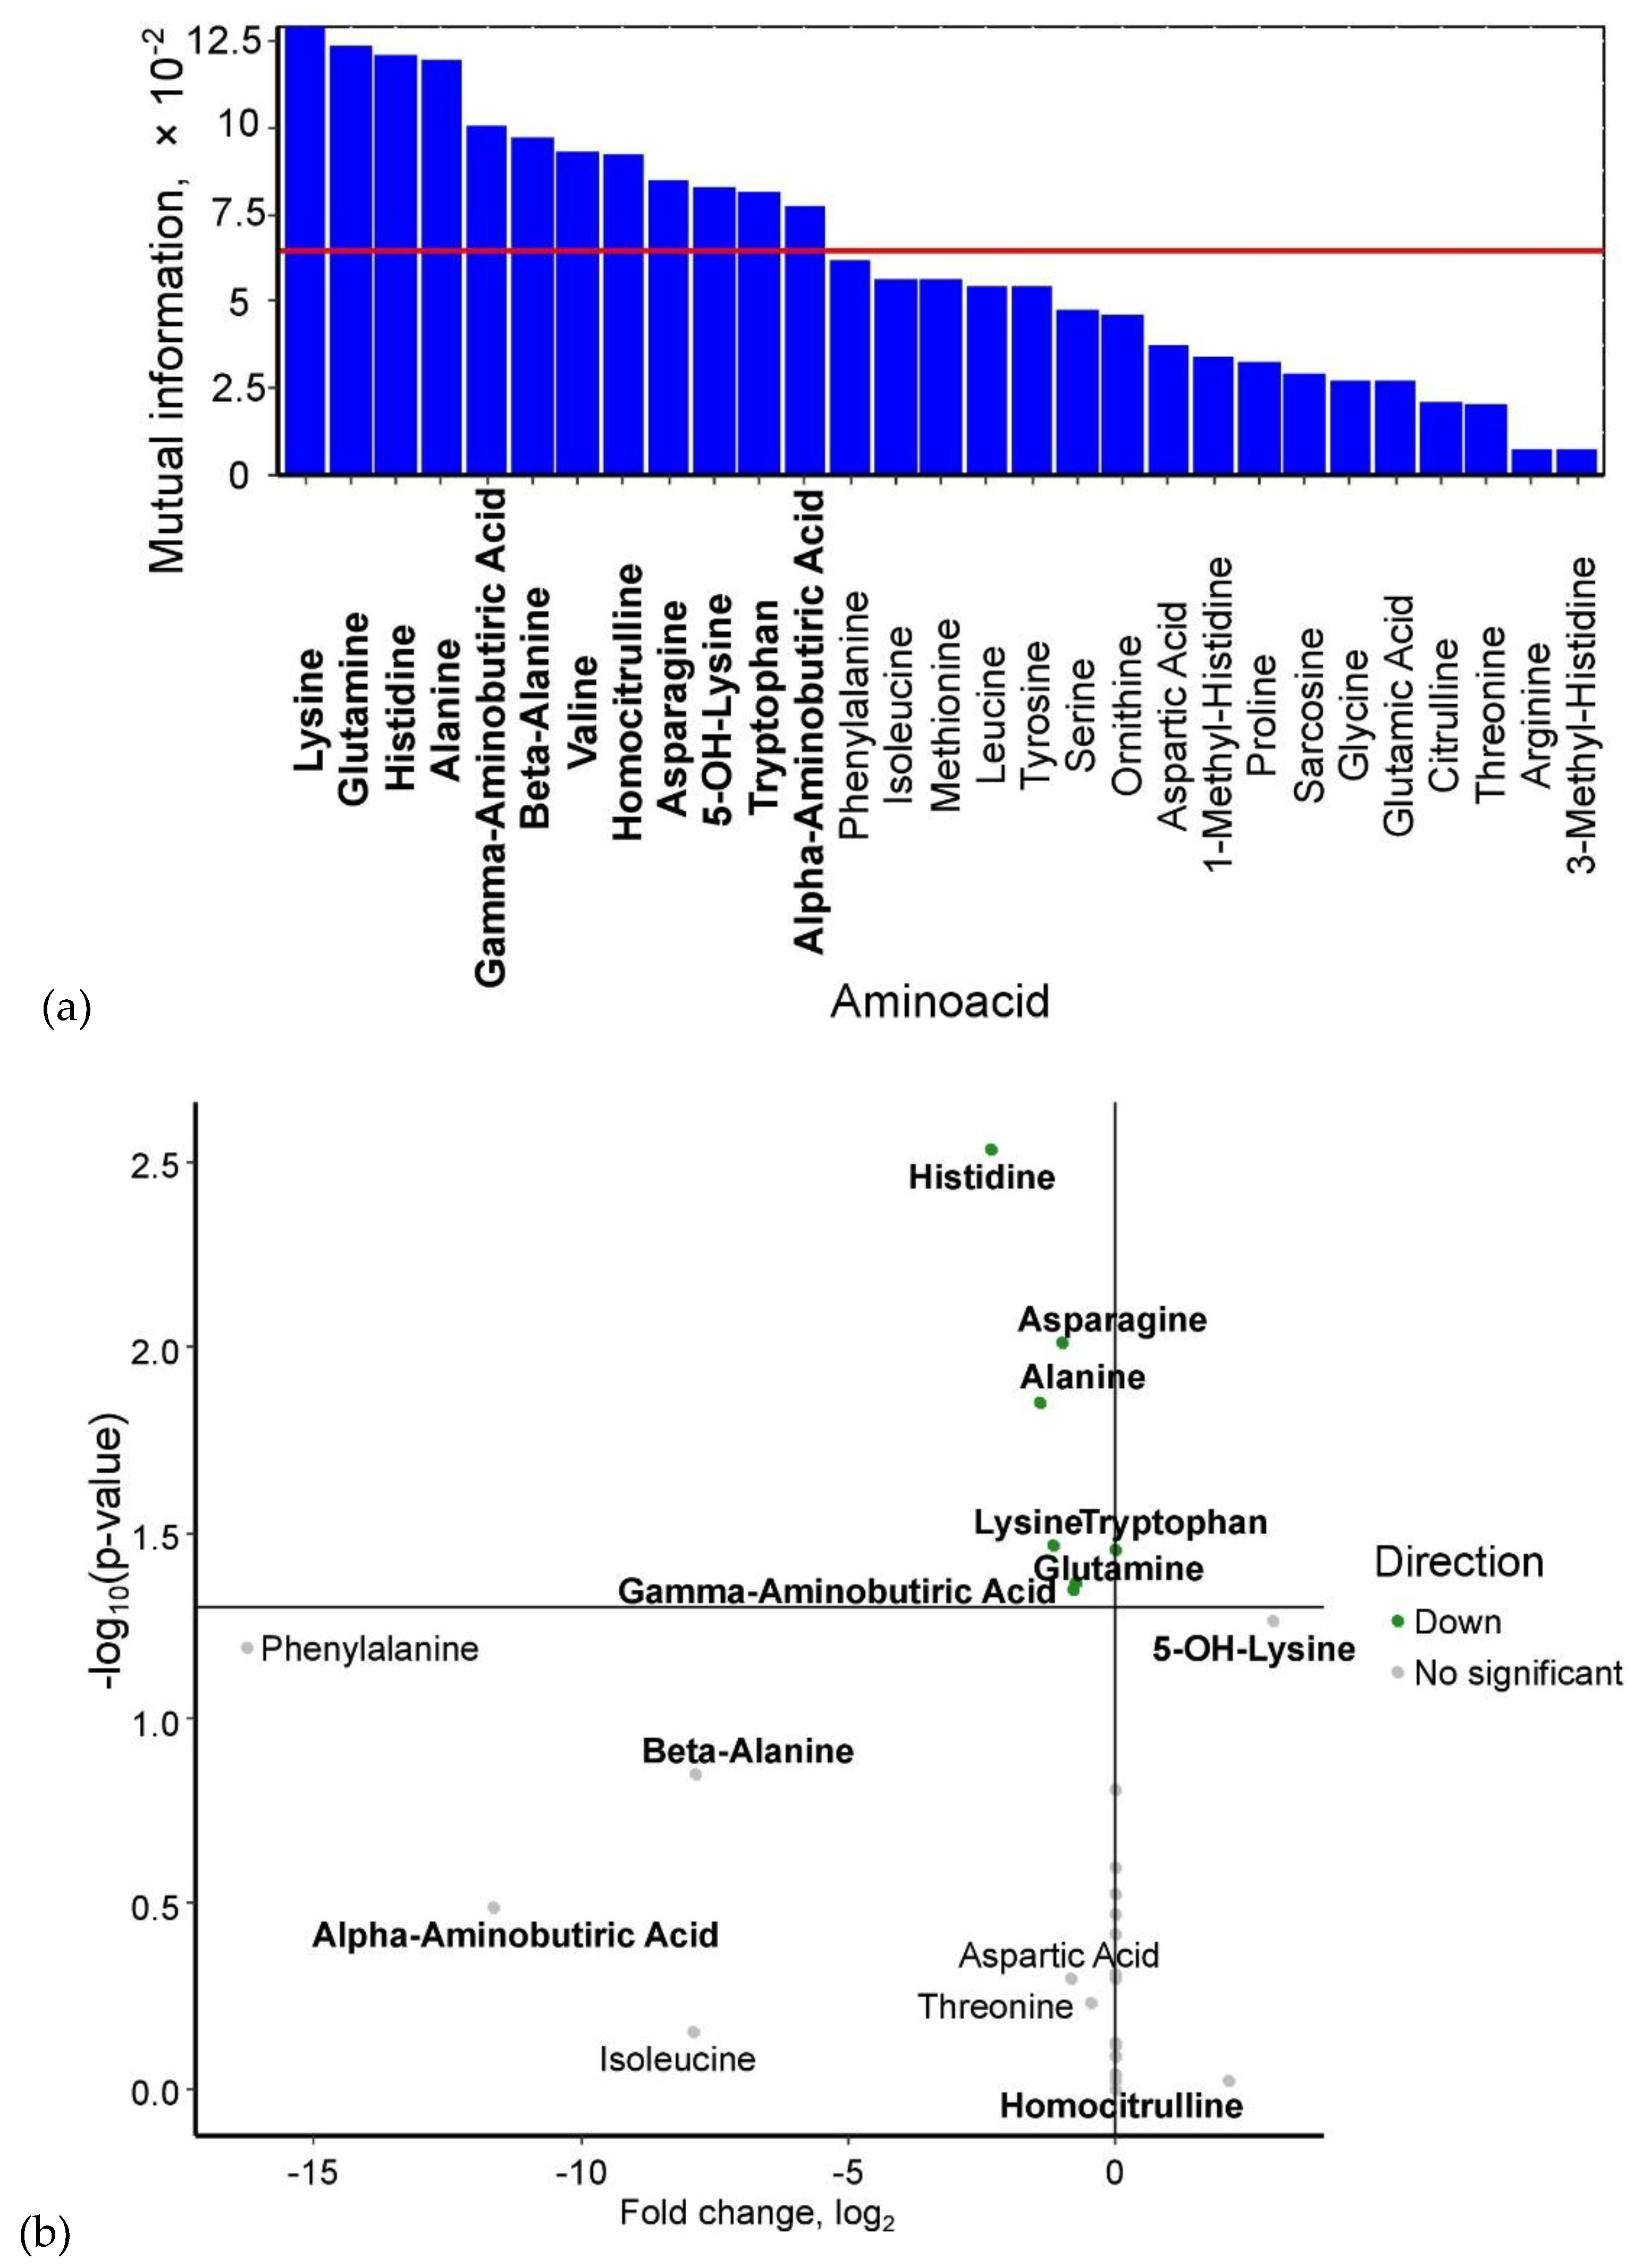
Figure 2.
SHAP values of maternal serum amino acids for discrimination between the control group, GDM with macrosomia subgroup, and GDM with normosomia subgroup. Amino acids potentially serving as group biomarkers are highlighted in bold. Numeric labels adjacent to amino acids indicate the mean absolute SHAP values.
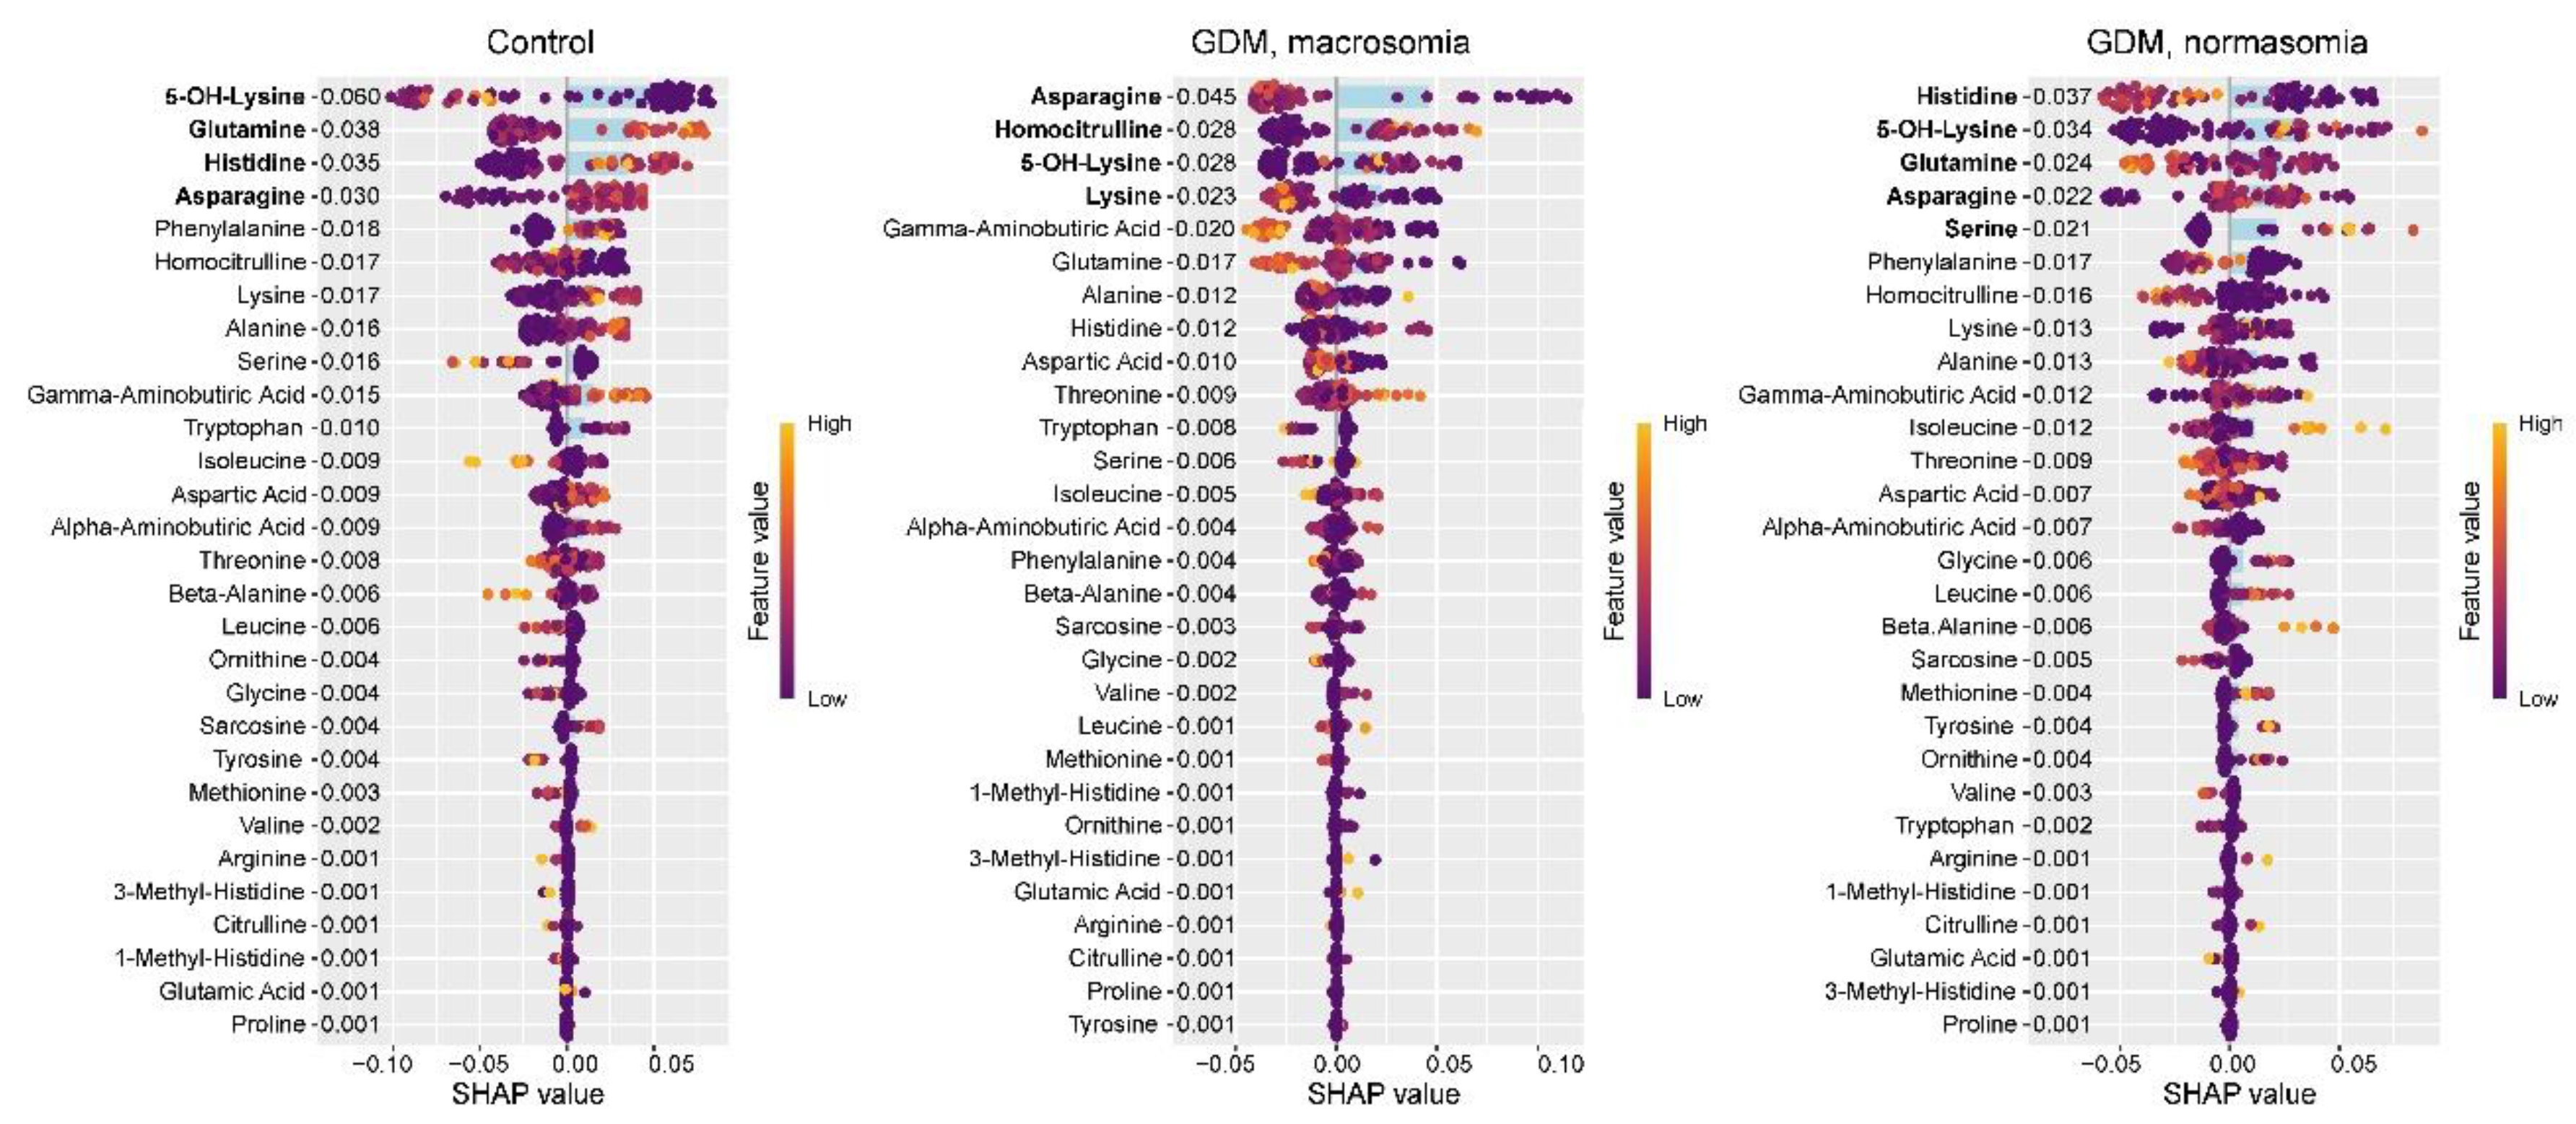
Figure 3.
Most significantly enriched serum metabolic pathways discriminating GDM from controls, showing false discovery probability (-log10). Color intensity represents the proportion of pathway metabolites identified as GDM biomarkers.
Figure 3.
Most significantly enriched serum metabolic pathways discriminating GDM from controls, showing false discovery probability (-log10). Color intensity represents the proportion of pathway metabolites identified as GDM biomarkers.
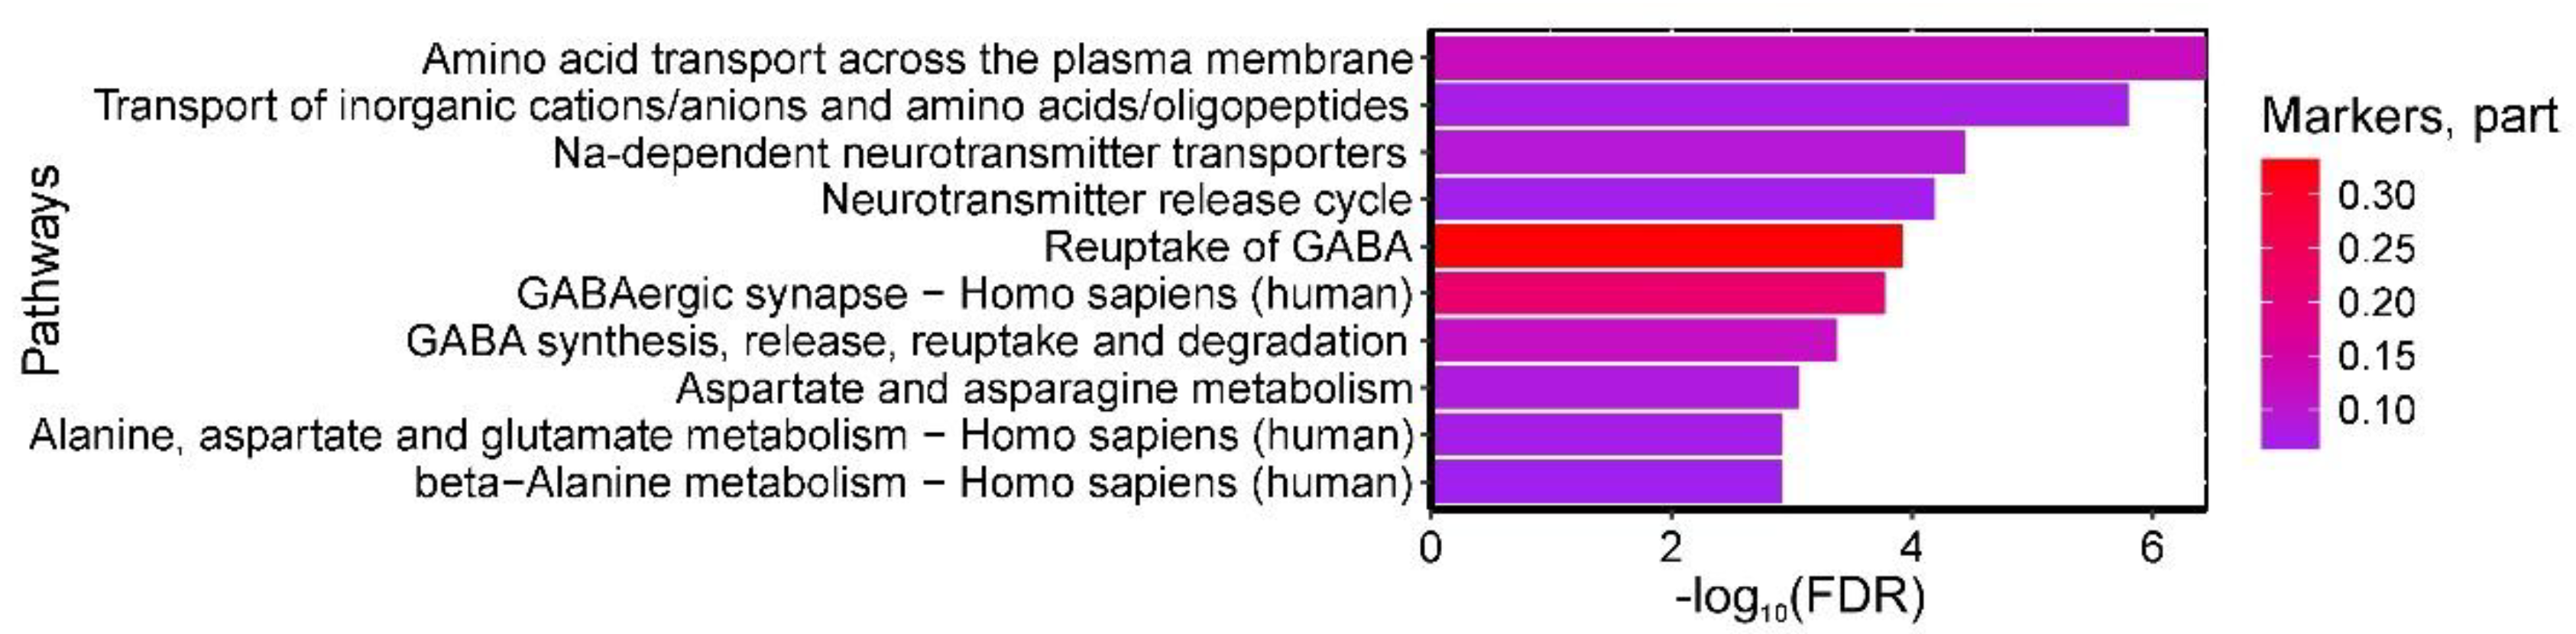
Figure 4.
(a) Mutual information scores of amino acid levels in umbilical cord blood for GDM prediction. (b) Volcano plot of amino acid levels in umbilical cord blood from GDM cases. Amino acids identified as potential biomarkers based on mutual information index values are highlighted in bold.
Figure 4.
(a) Mutual information scores of amino acid levels in umbilical cord blood for GDM prediction. (b) Volcano plot of amino acid levels in umbilical cord blood from GDM cases. Amino acids identified as potential biomarkers based on mutual information index values are highlighted in bold.
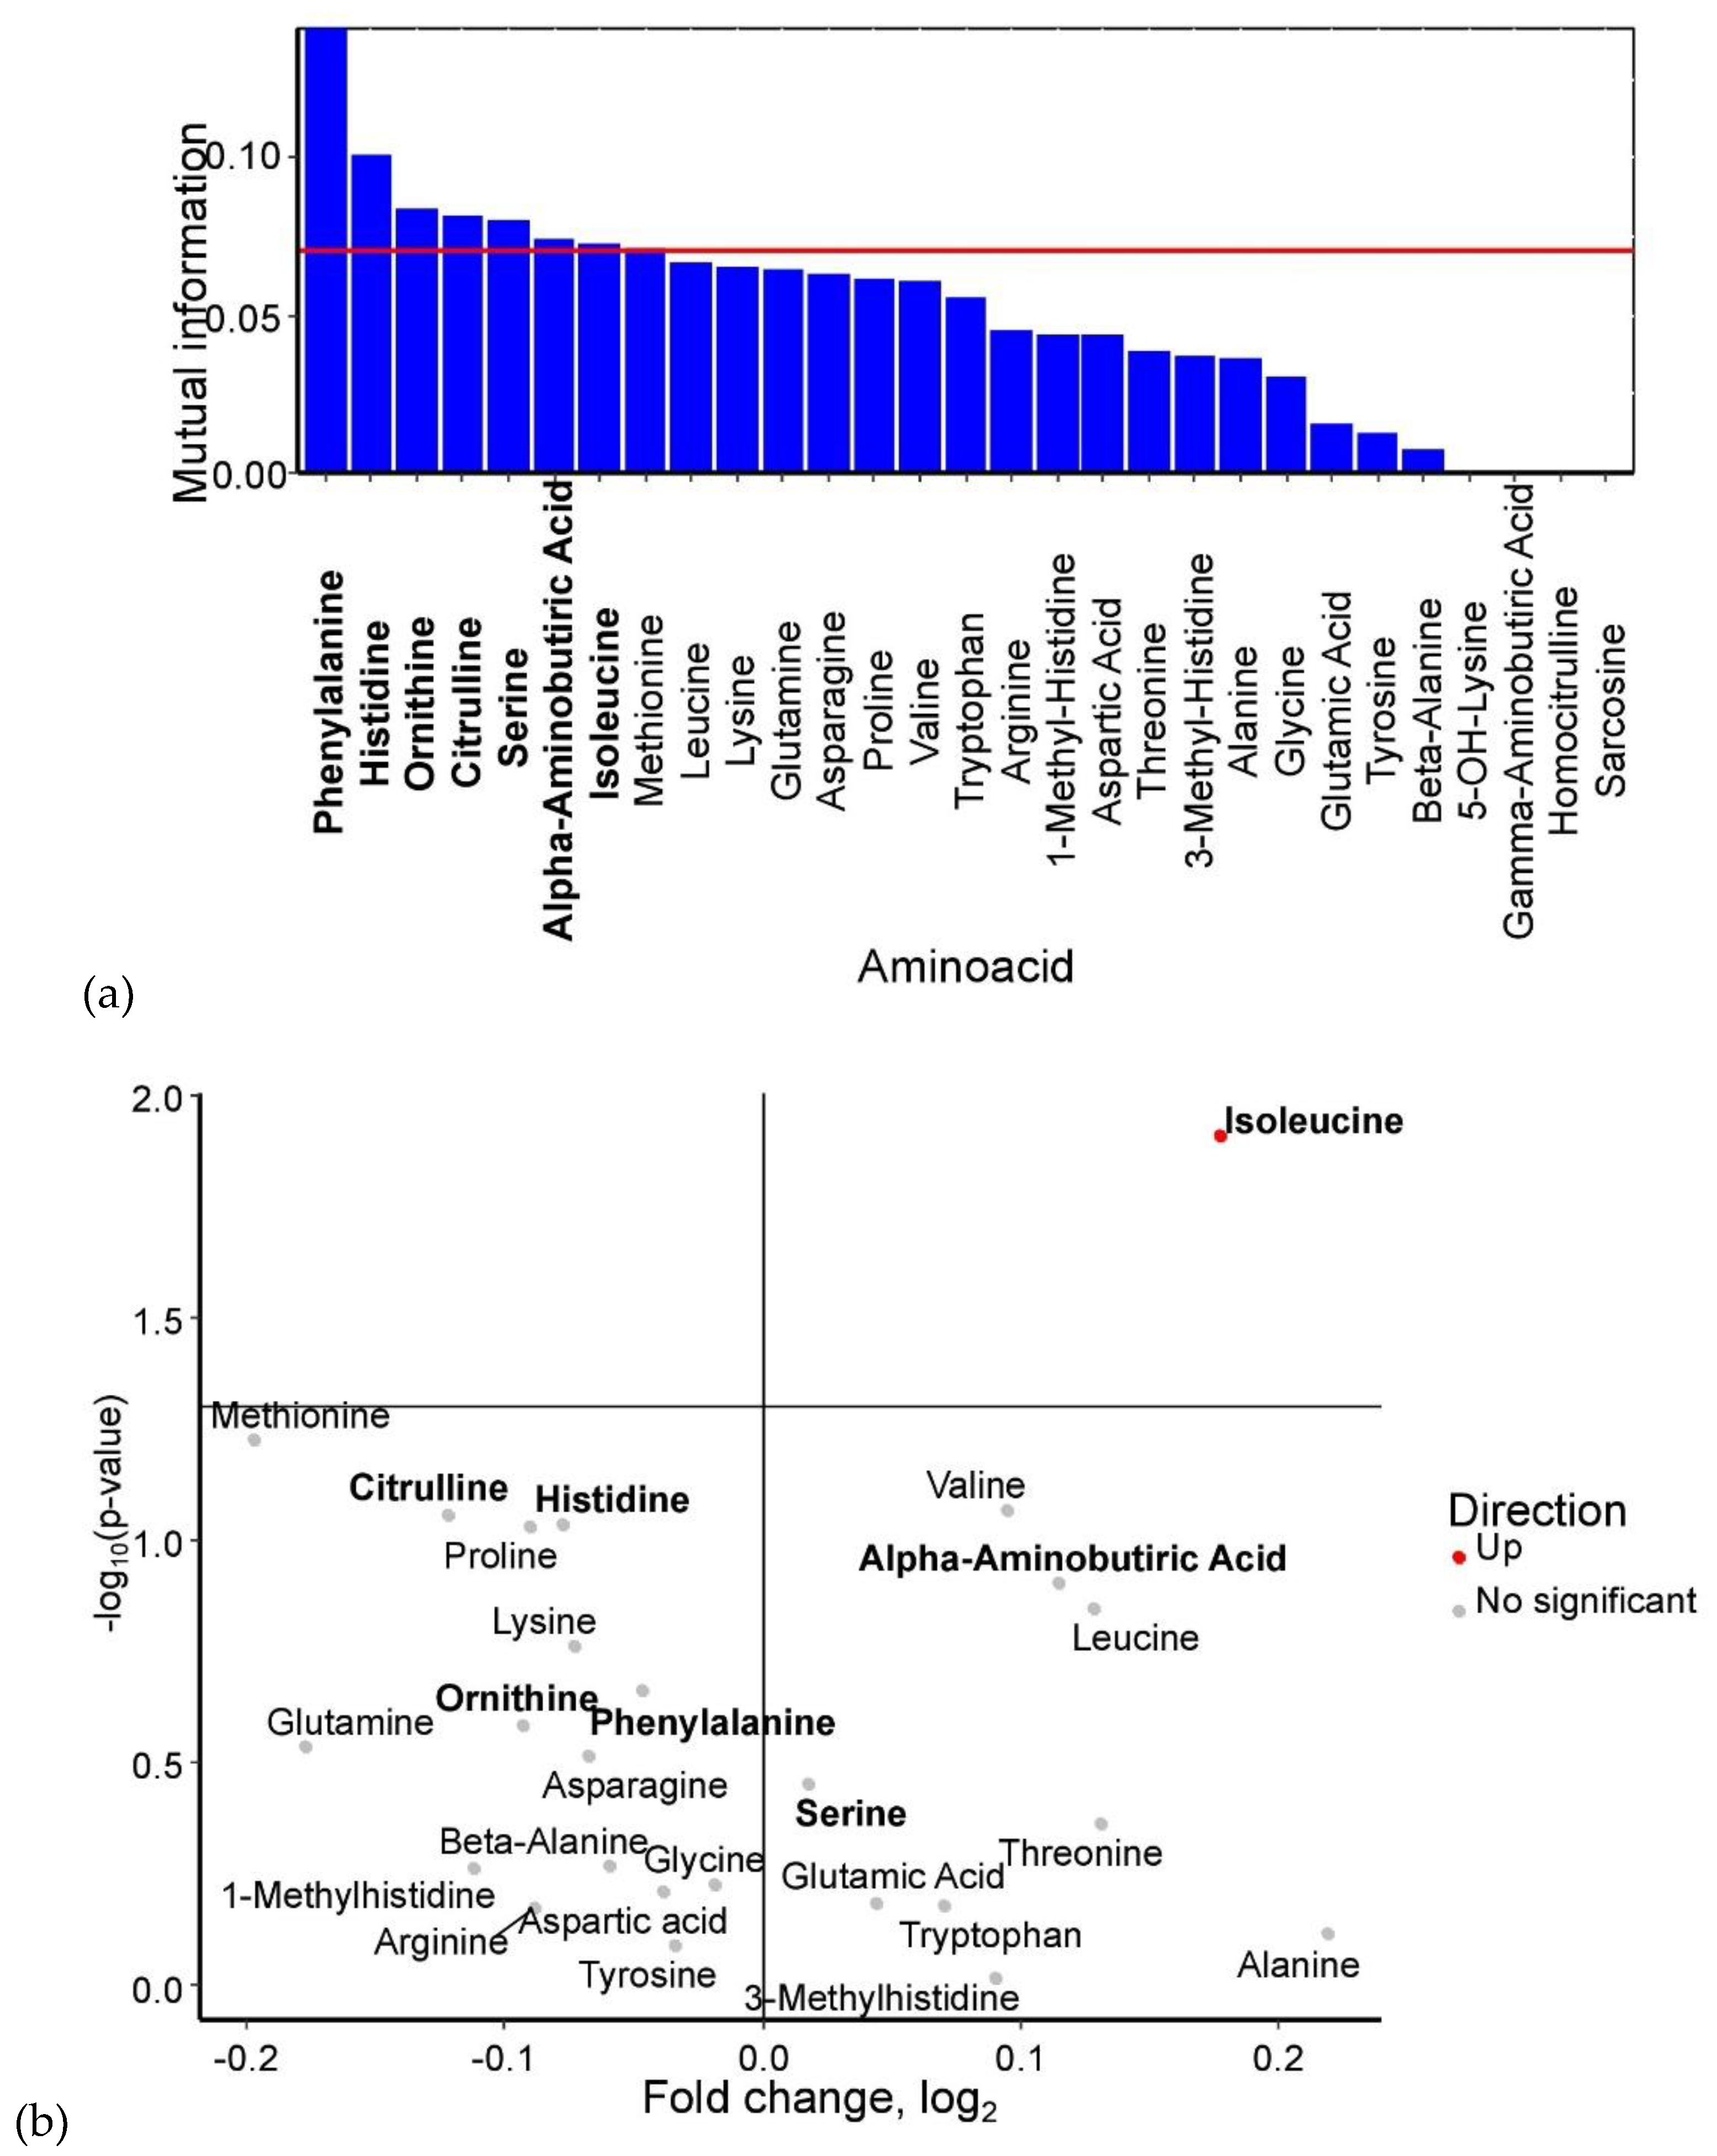
Figure 5.
Figure 5. SHAP values of umbilical cord blood amino acids for discrimination between the control group, GDM with macrosomia subgroup, and GDM with normosomia subgroup. Amino acids potentially serving as group biomarkers are highlighted in bold. Numeric labels indicate mean absolute SHAP values.
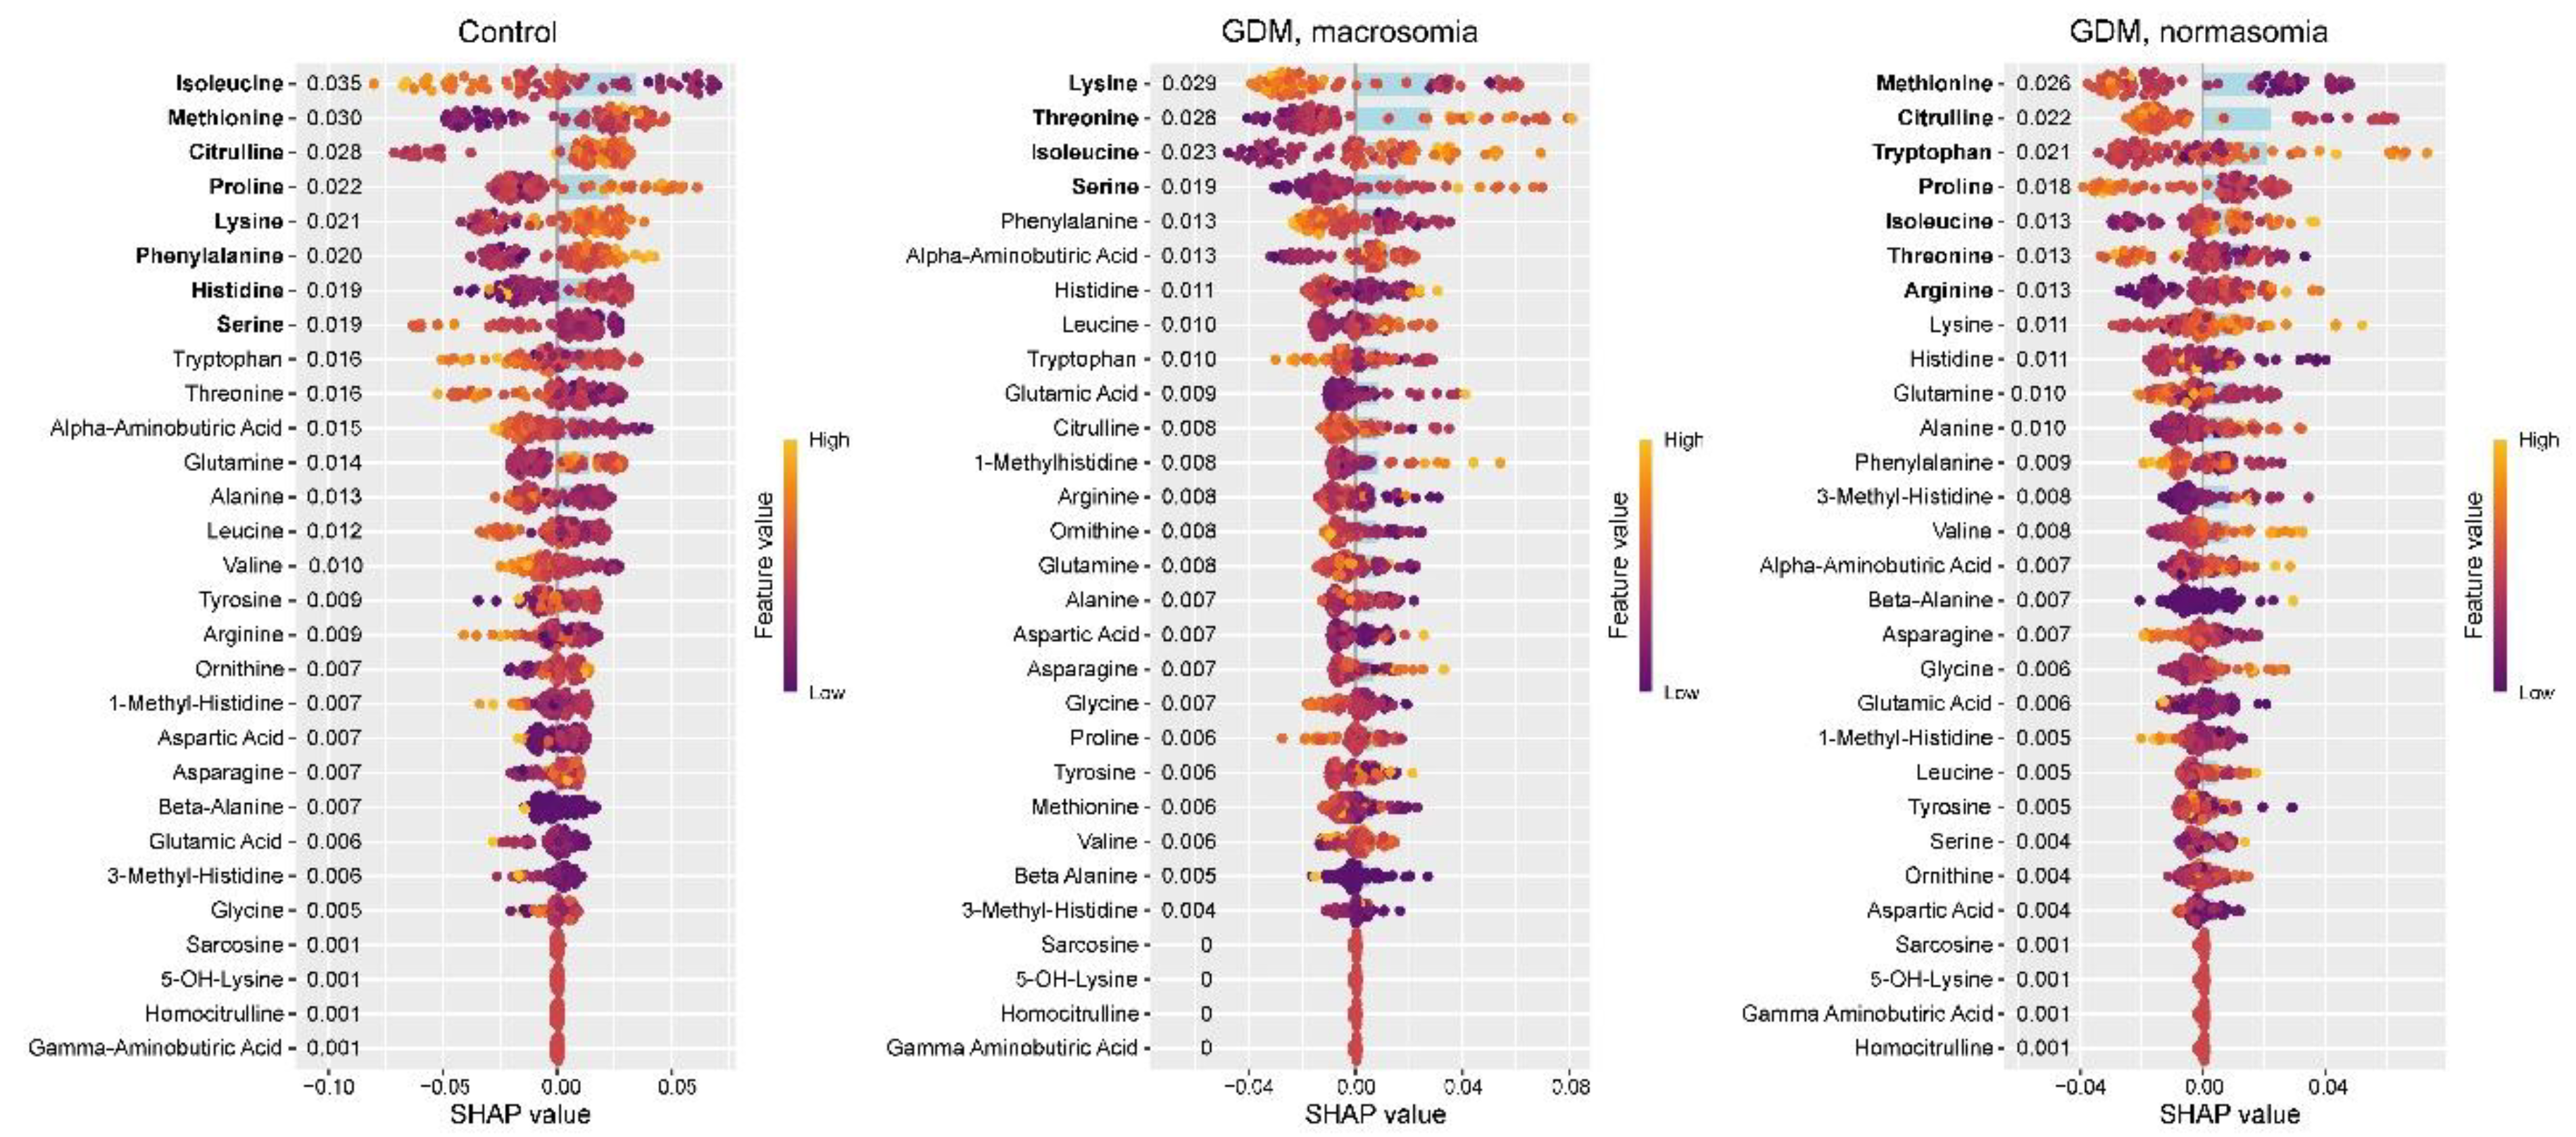
Figure 6.
Figure 6. Most significantly enriched pathways associated with GDM+macrosomia biomarkers in umbilical cord blood, showing false discovery probability (–log10). Color intensity reflects the proportion of metabolites within each pathway identified as GDM+macrosomia markers.
Figure 6.
Figure 6. Most significantly enriched pathways associated with GDM+macrosomia biomarkers in umbilical cord blood, showing false discovery probability (–log10). Color intensity reflects the proportion of metabolites within each pathway identified as GDM+macrosomia markers.
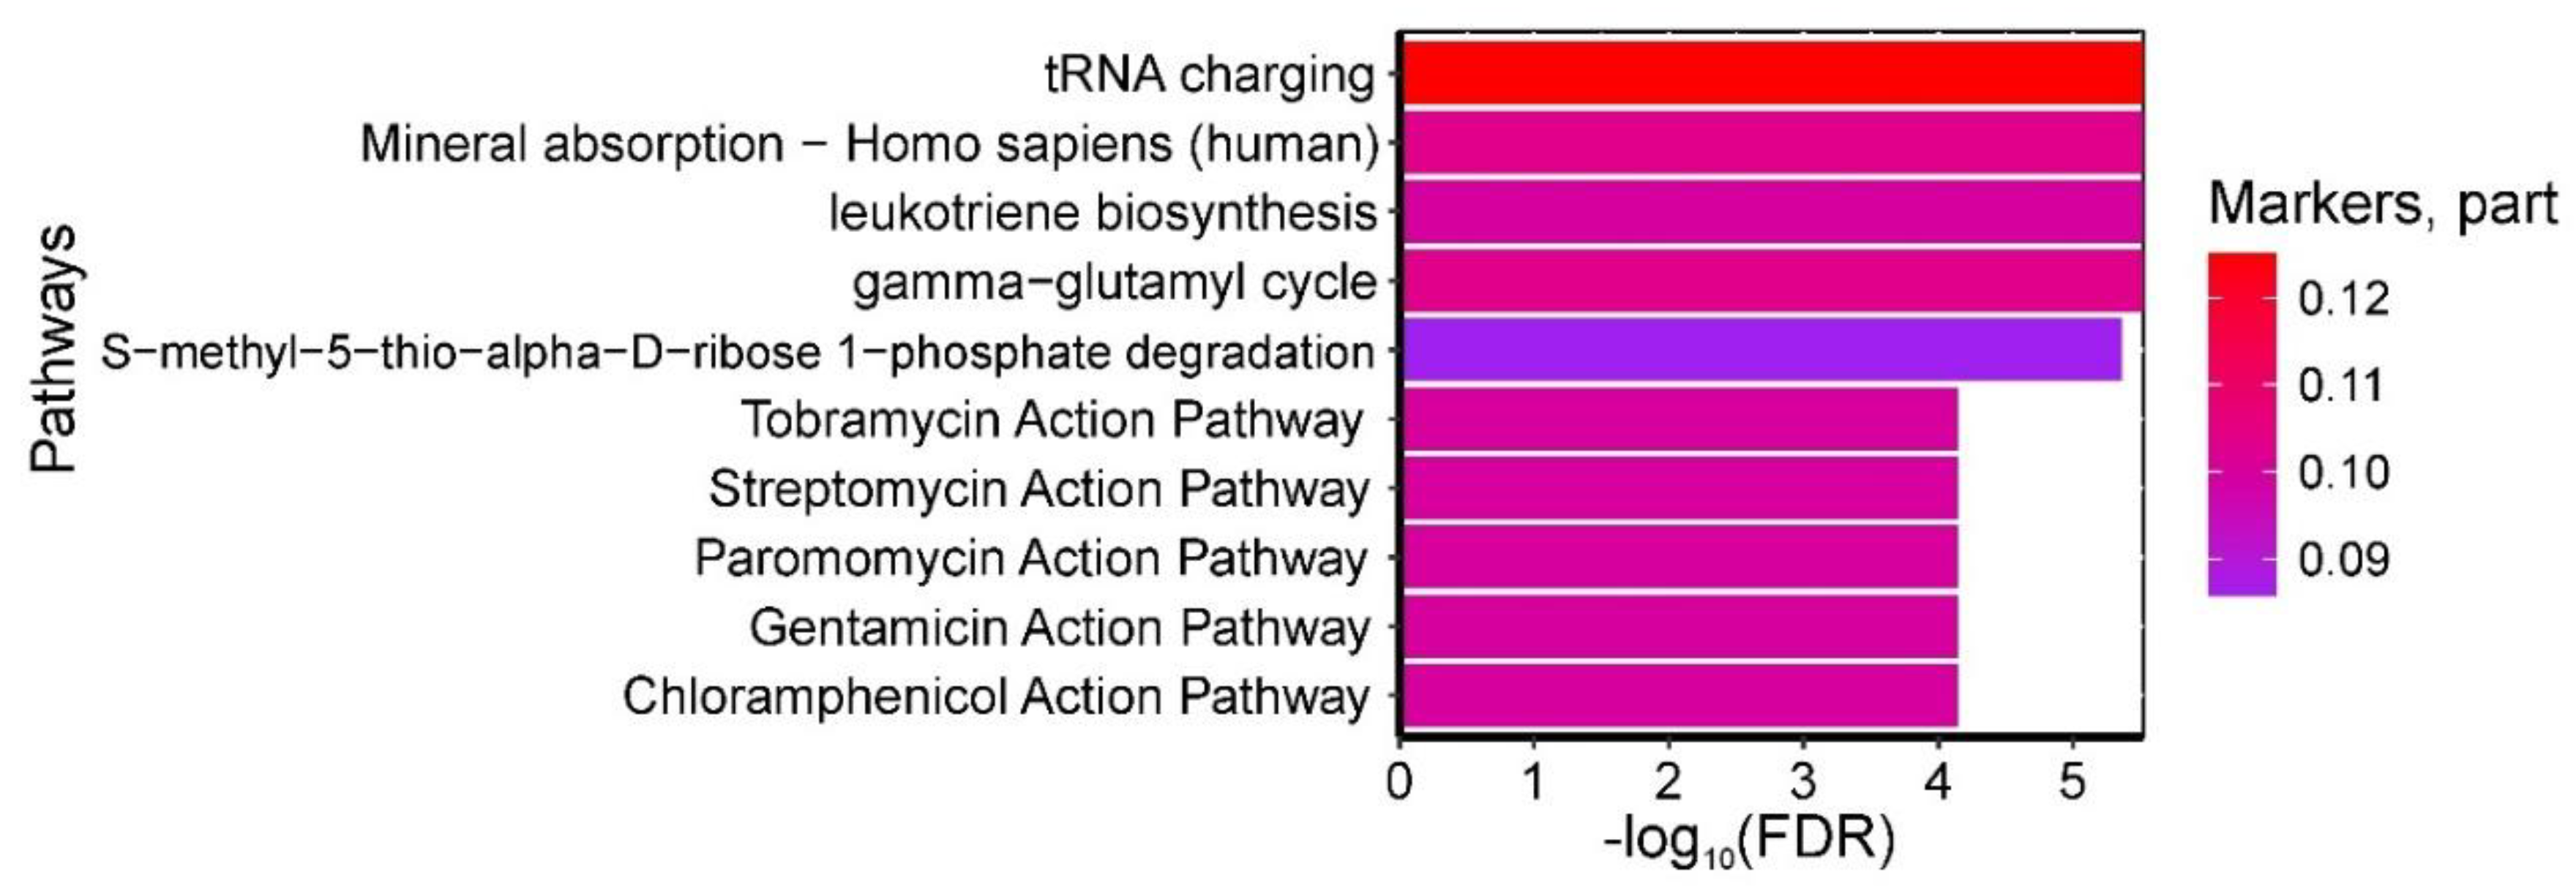
Figure 7.
Figure 7. (a) Mutual information scores of amniotic fluid amino acid levels for GDM prediction. (b) Volcano plot of amniotic fluid amino acid levels in GDM cases. Amino acids identified as potential biomarkers based on mutual information index values are highlighted in bold.
Figure 7.
Figure 7. (a) Mutual information scores of amniotic fluid amino acid levels for GDM prediction. (b) Volcano plot of amniotic fluid amino acid levels in GDM cases. Amino acids identified as potential biomarkers based on mutual information index values are highlighted in bold.
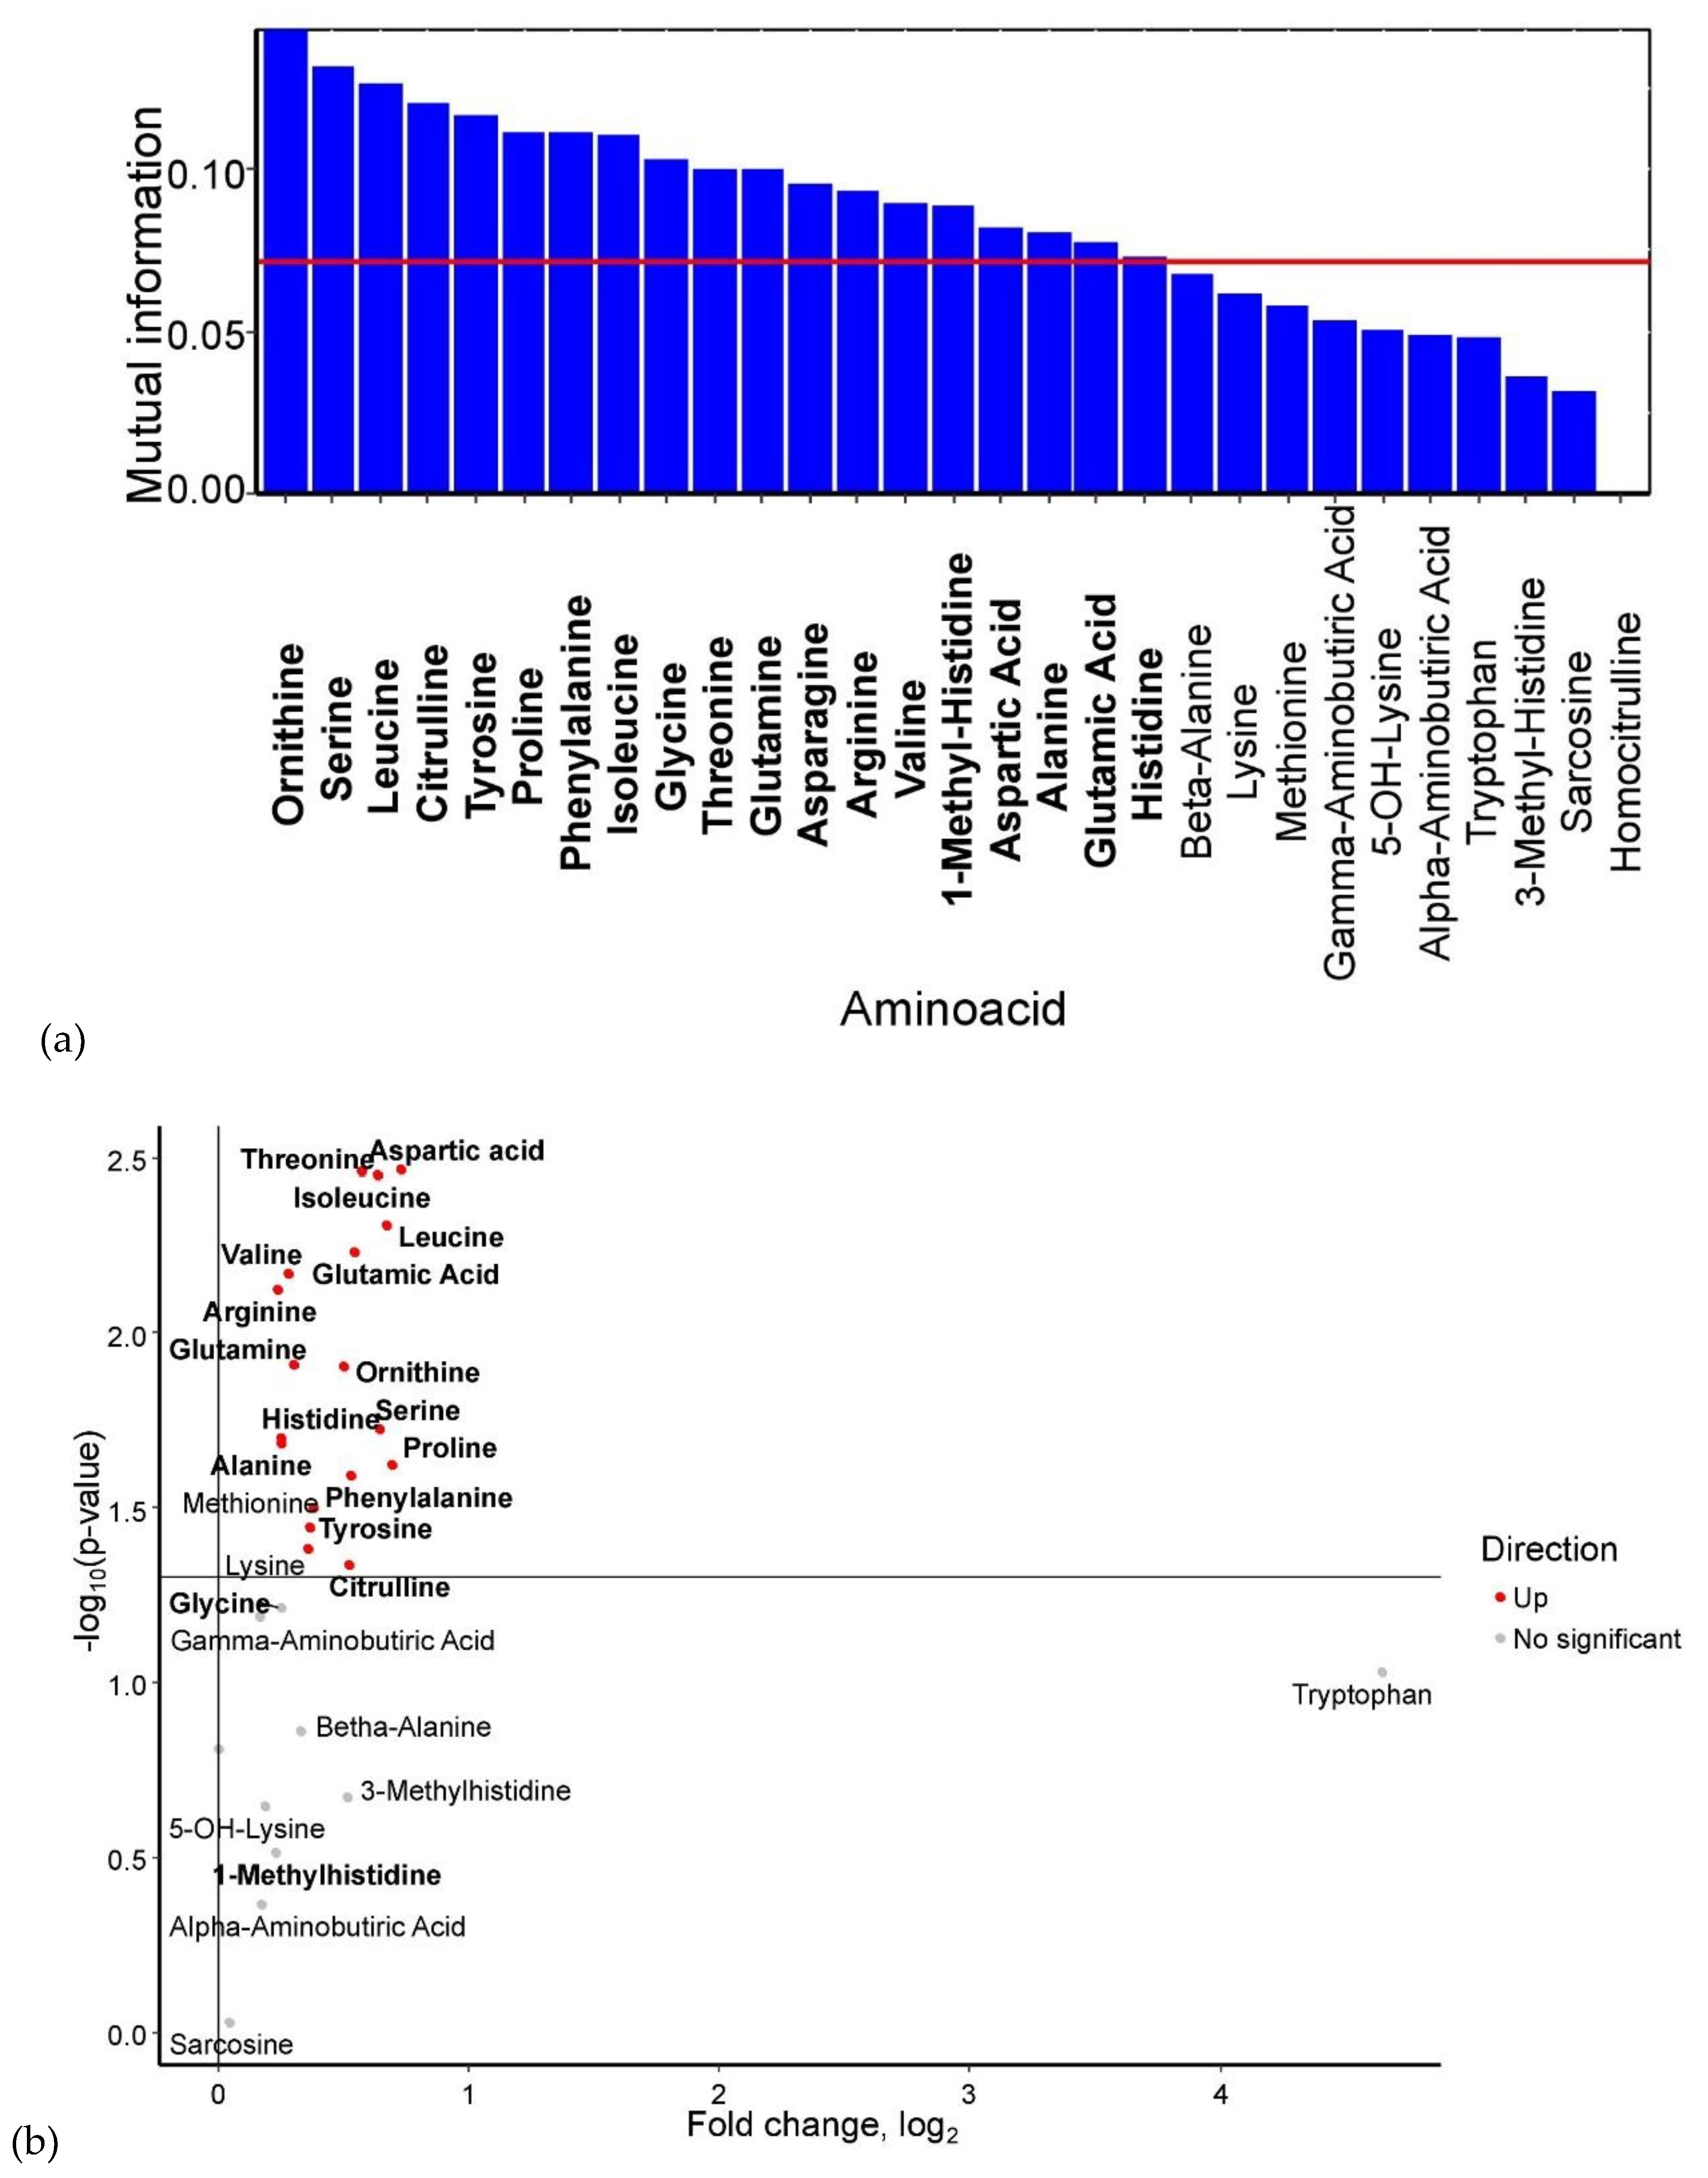
Figure 8.
Figure 8. SHAP values of amniotic fluid amino acids for discrimination between the control group, GDM with macrosomia subgroup, and GDM with normosomia subgroup. Potential group-specific biomarker amino acids are highlighted in bold, with numeric labels indicating mean absolute SHAP values.
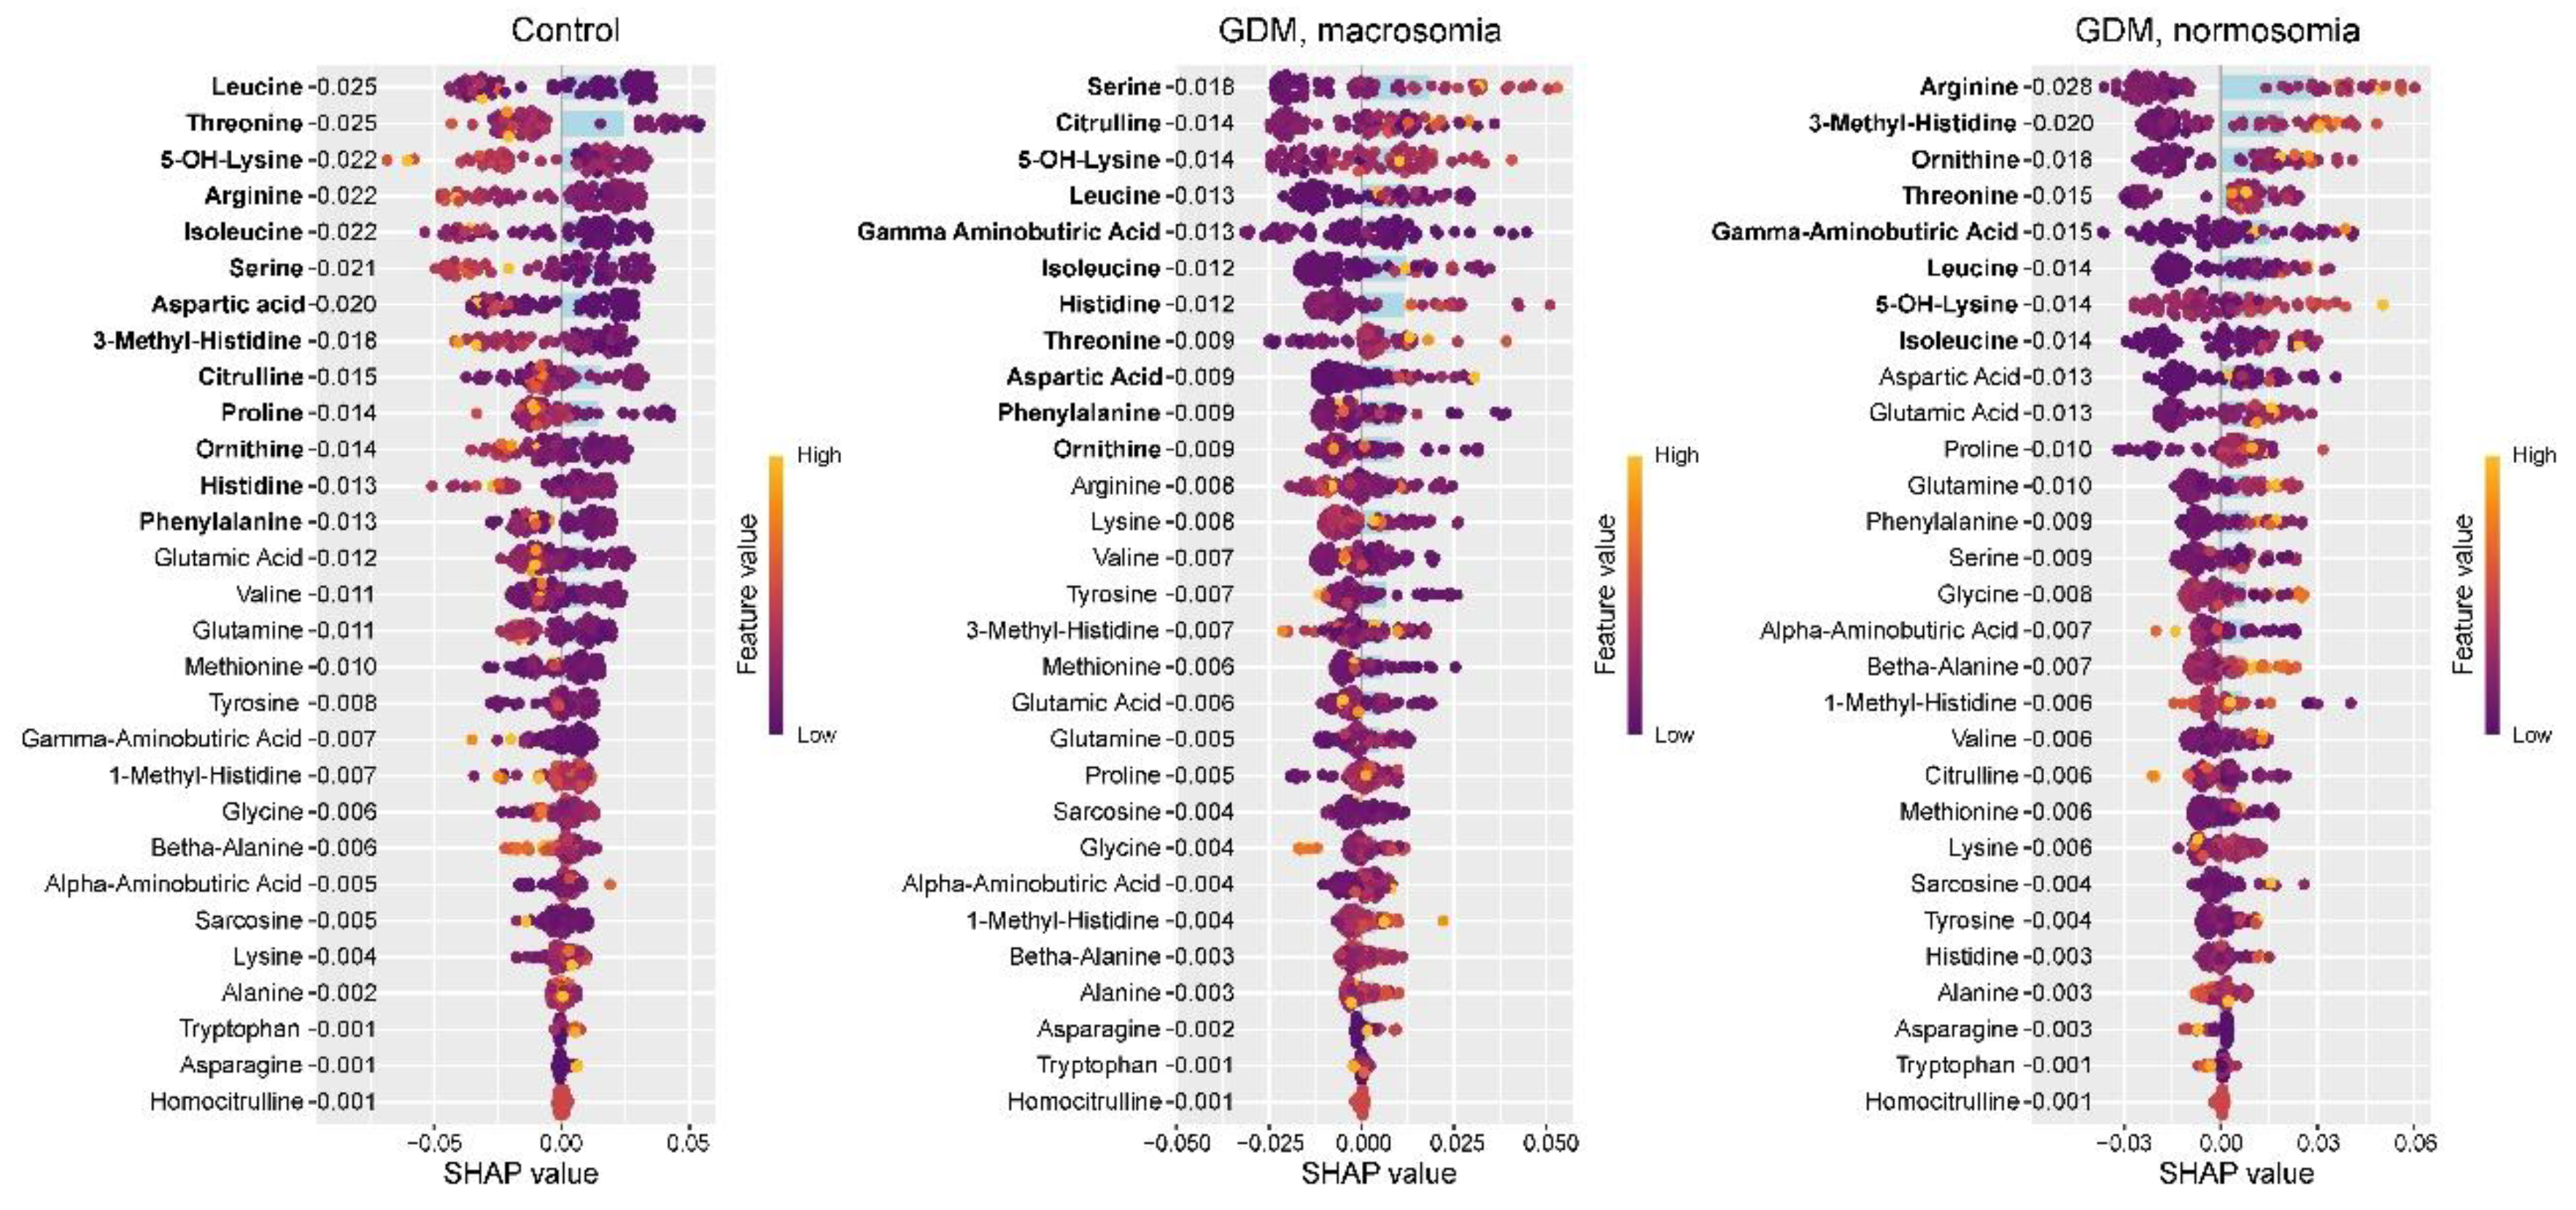
Figure 9.
Figure 9. Most significantly enriched metabolic pathways based on amniotic fluid biomarkers for GDM/control discrimination, showing false discovery probability (-log10). Color intensity represents the proportion of pathway metabolites identified as GDM markers.
Figure 9.
Figure 9. Most significantly enriched metabolic pathways based on amniotic fluid biomarkers for GDM/control discrimination, showing false discovery probability (-log10). Color intensity represents the proportion of pathway metabolites identified as GDM markers.
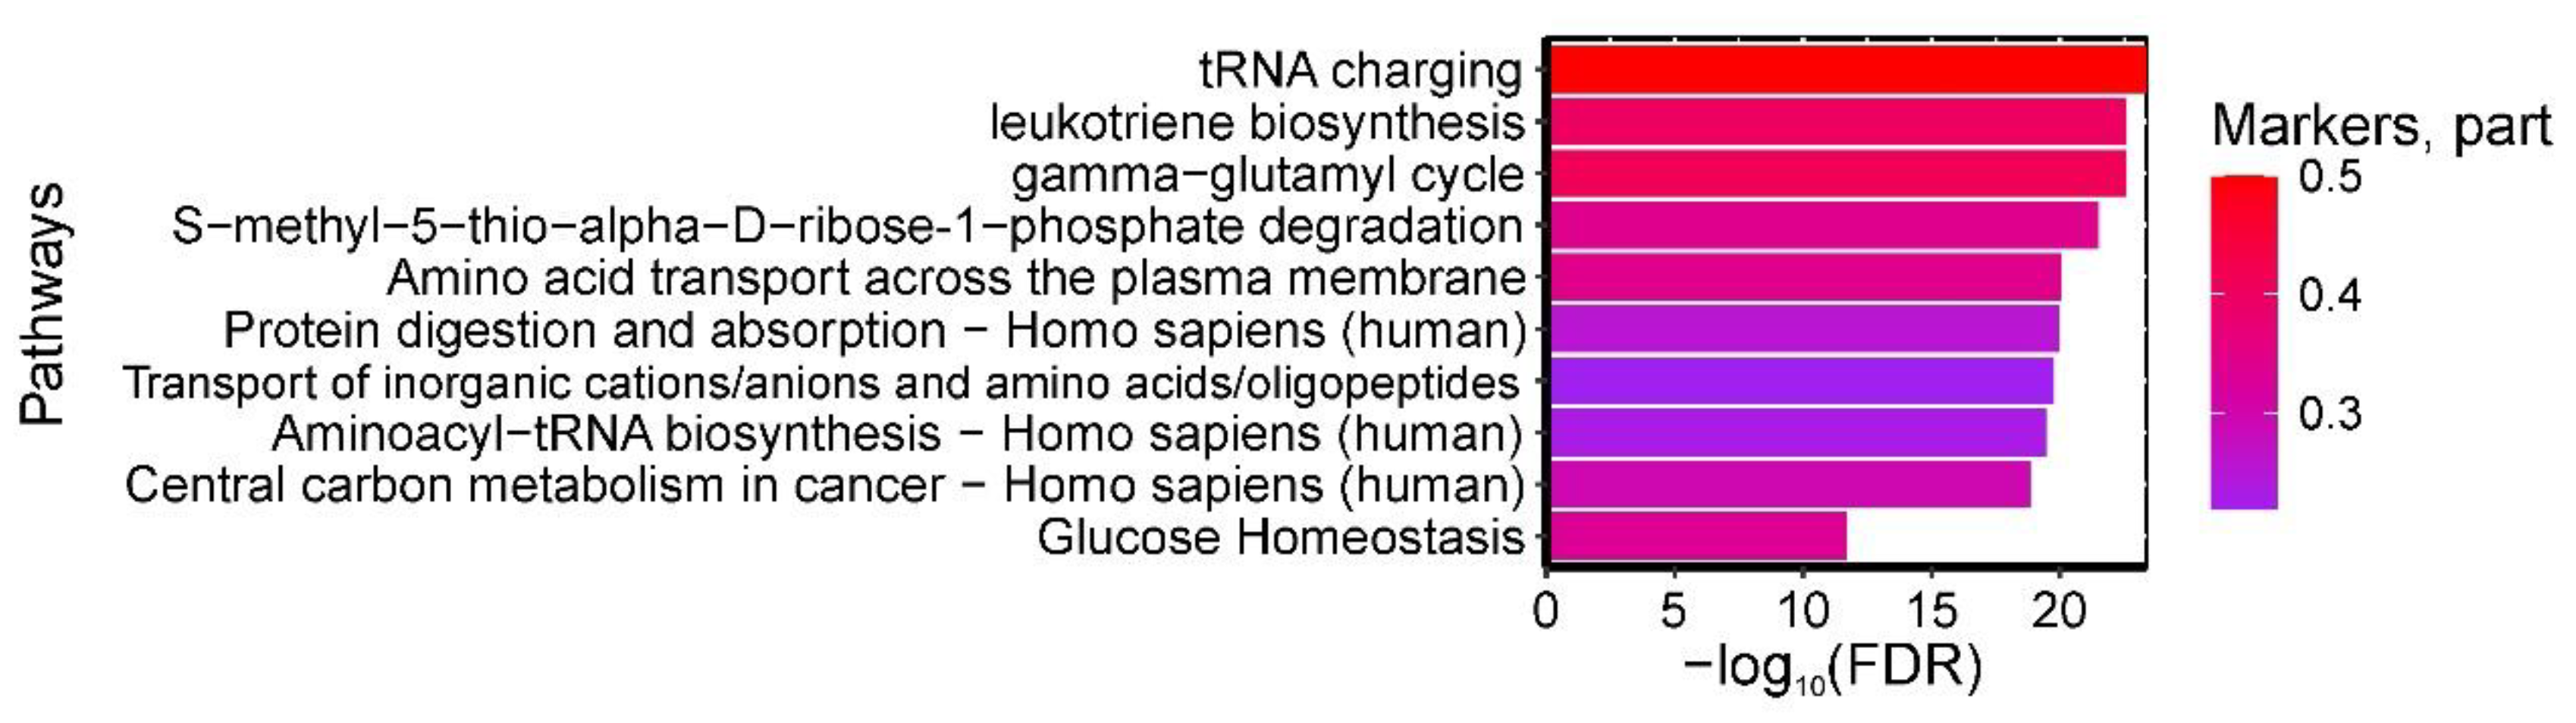
Figure 10.
Most significantly enriched metabolic pathways based on amniotic fluid biomarkers for GDM+macrosomia discrimination, showing false discovery probability (-log10). Color gradient represents the proportion of pathway metabolites identified as GDM markers, with increasing intensity indicating higher biomarker representation.
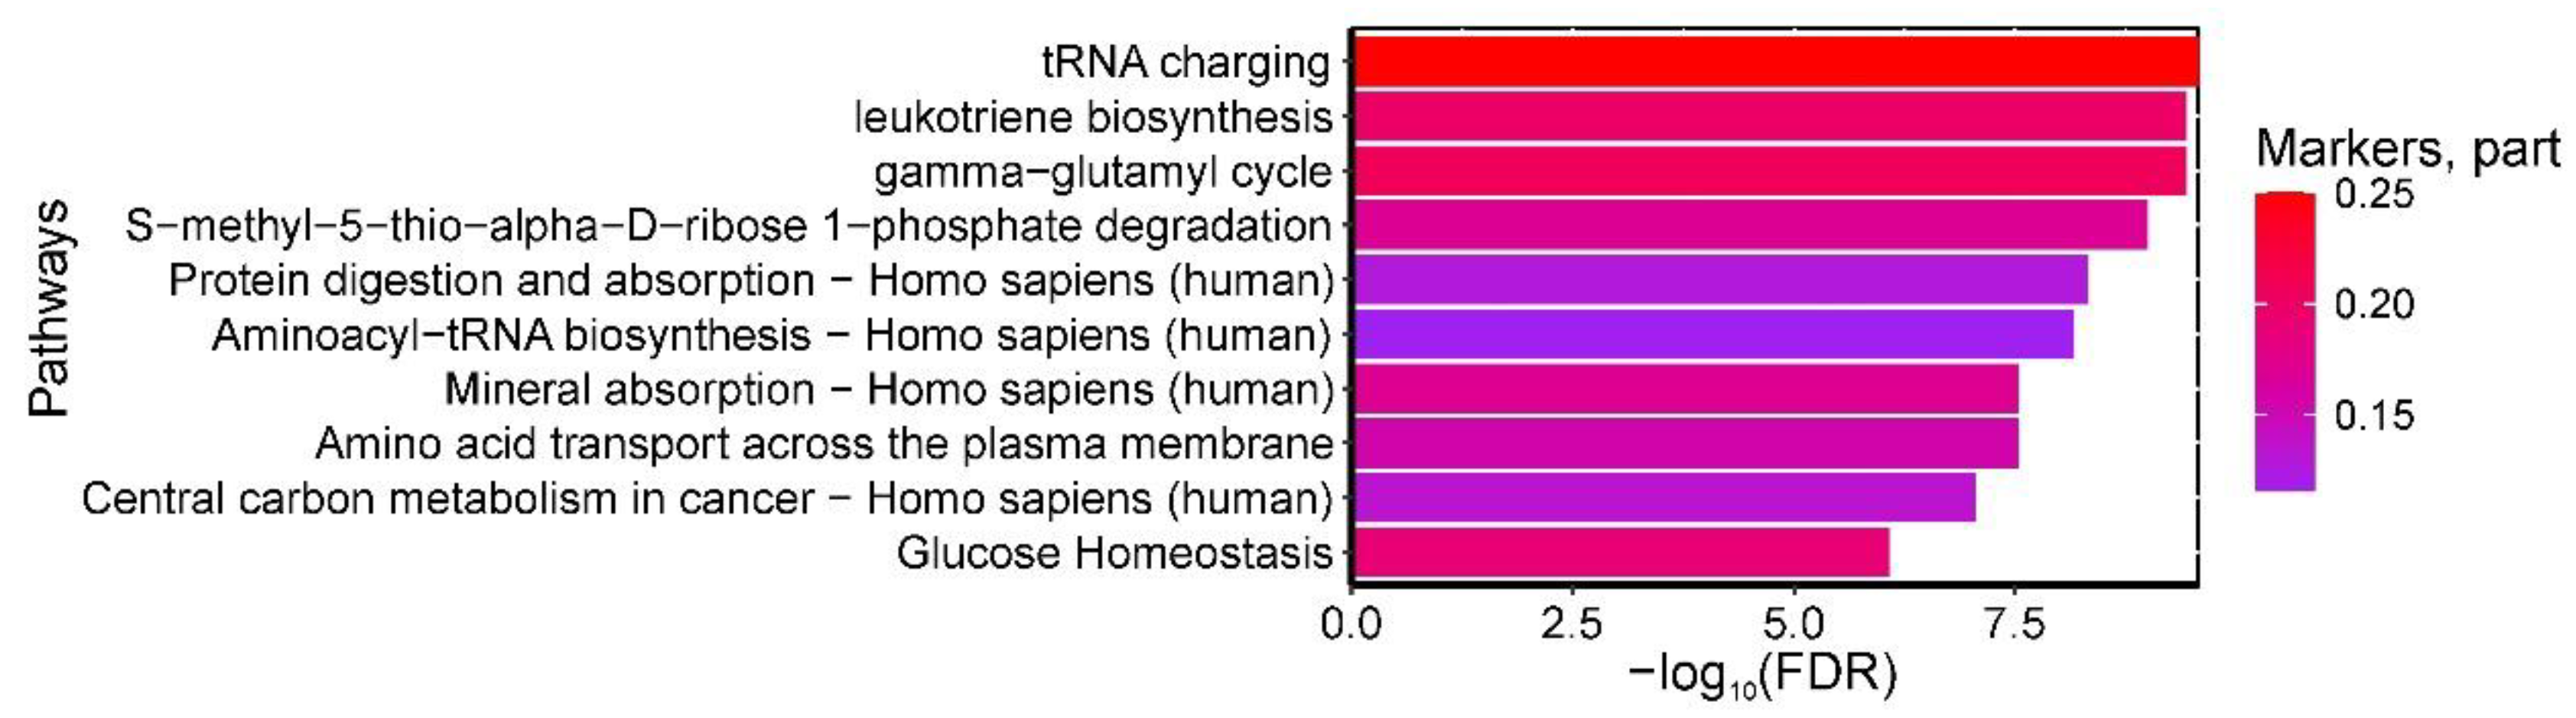
Figure 11.
(a) SHAP values of clinical parameters for GDM association analysis. Parameters with the most significant associations are highlighted in bold, with numeric labels indicating mean absolute SHAP values. (b) Relationship between BMI levels and their corresponding SHAP values. (c) Combined association of BMI and glucose levels with their aggregated SHAP values.
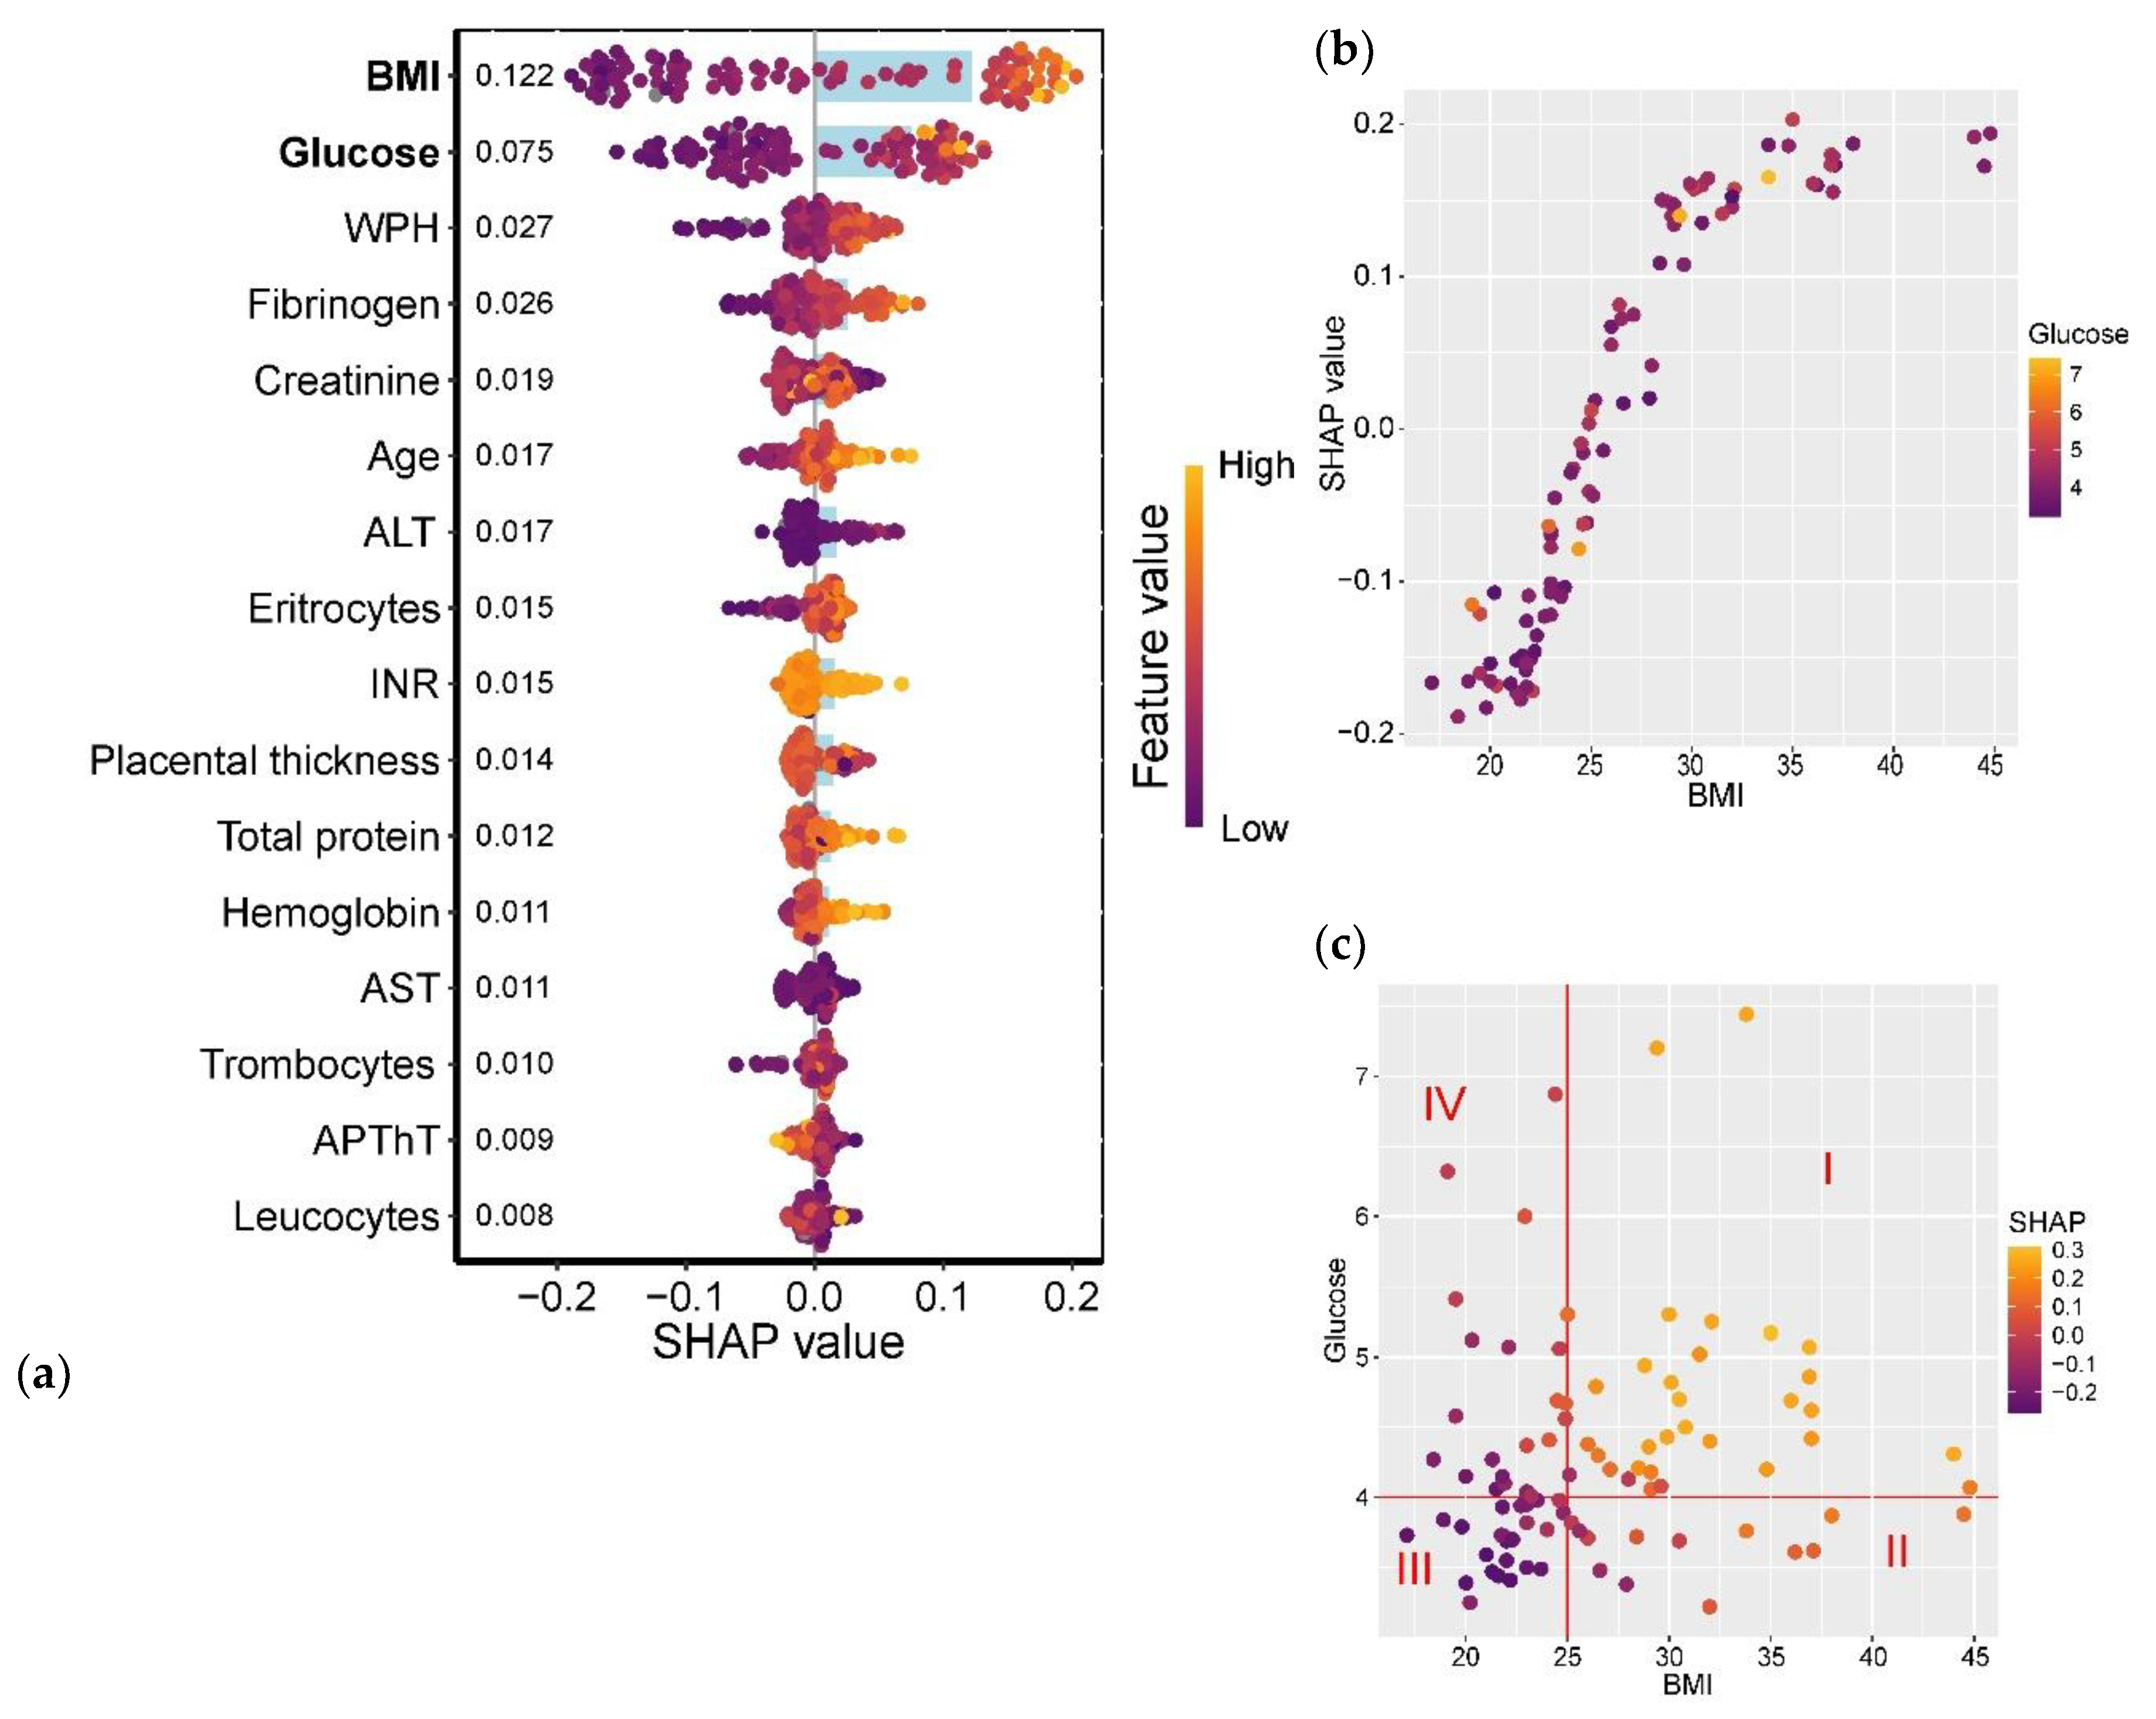
Figure 12.
(a) SHAP values of clinical parameters for their association with neonatal birth weight. Parameters demonstrating the most significant associations are highlighted in bold, with numerical labels indicating mean absolute SHAP values. (b) Relationship between amniotic fluid index (AFI) and corresponding SHAP values. Patients without ultrasound markers of diabetic fetopathy (DF) are shown in blue, while those with DF diagnosis are marked in yellow.
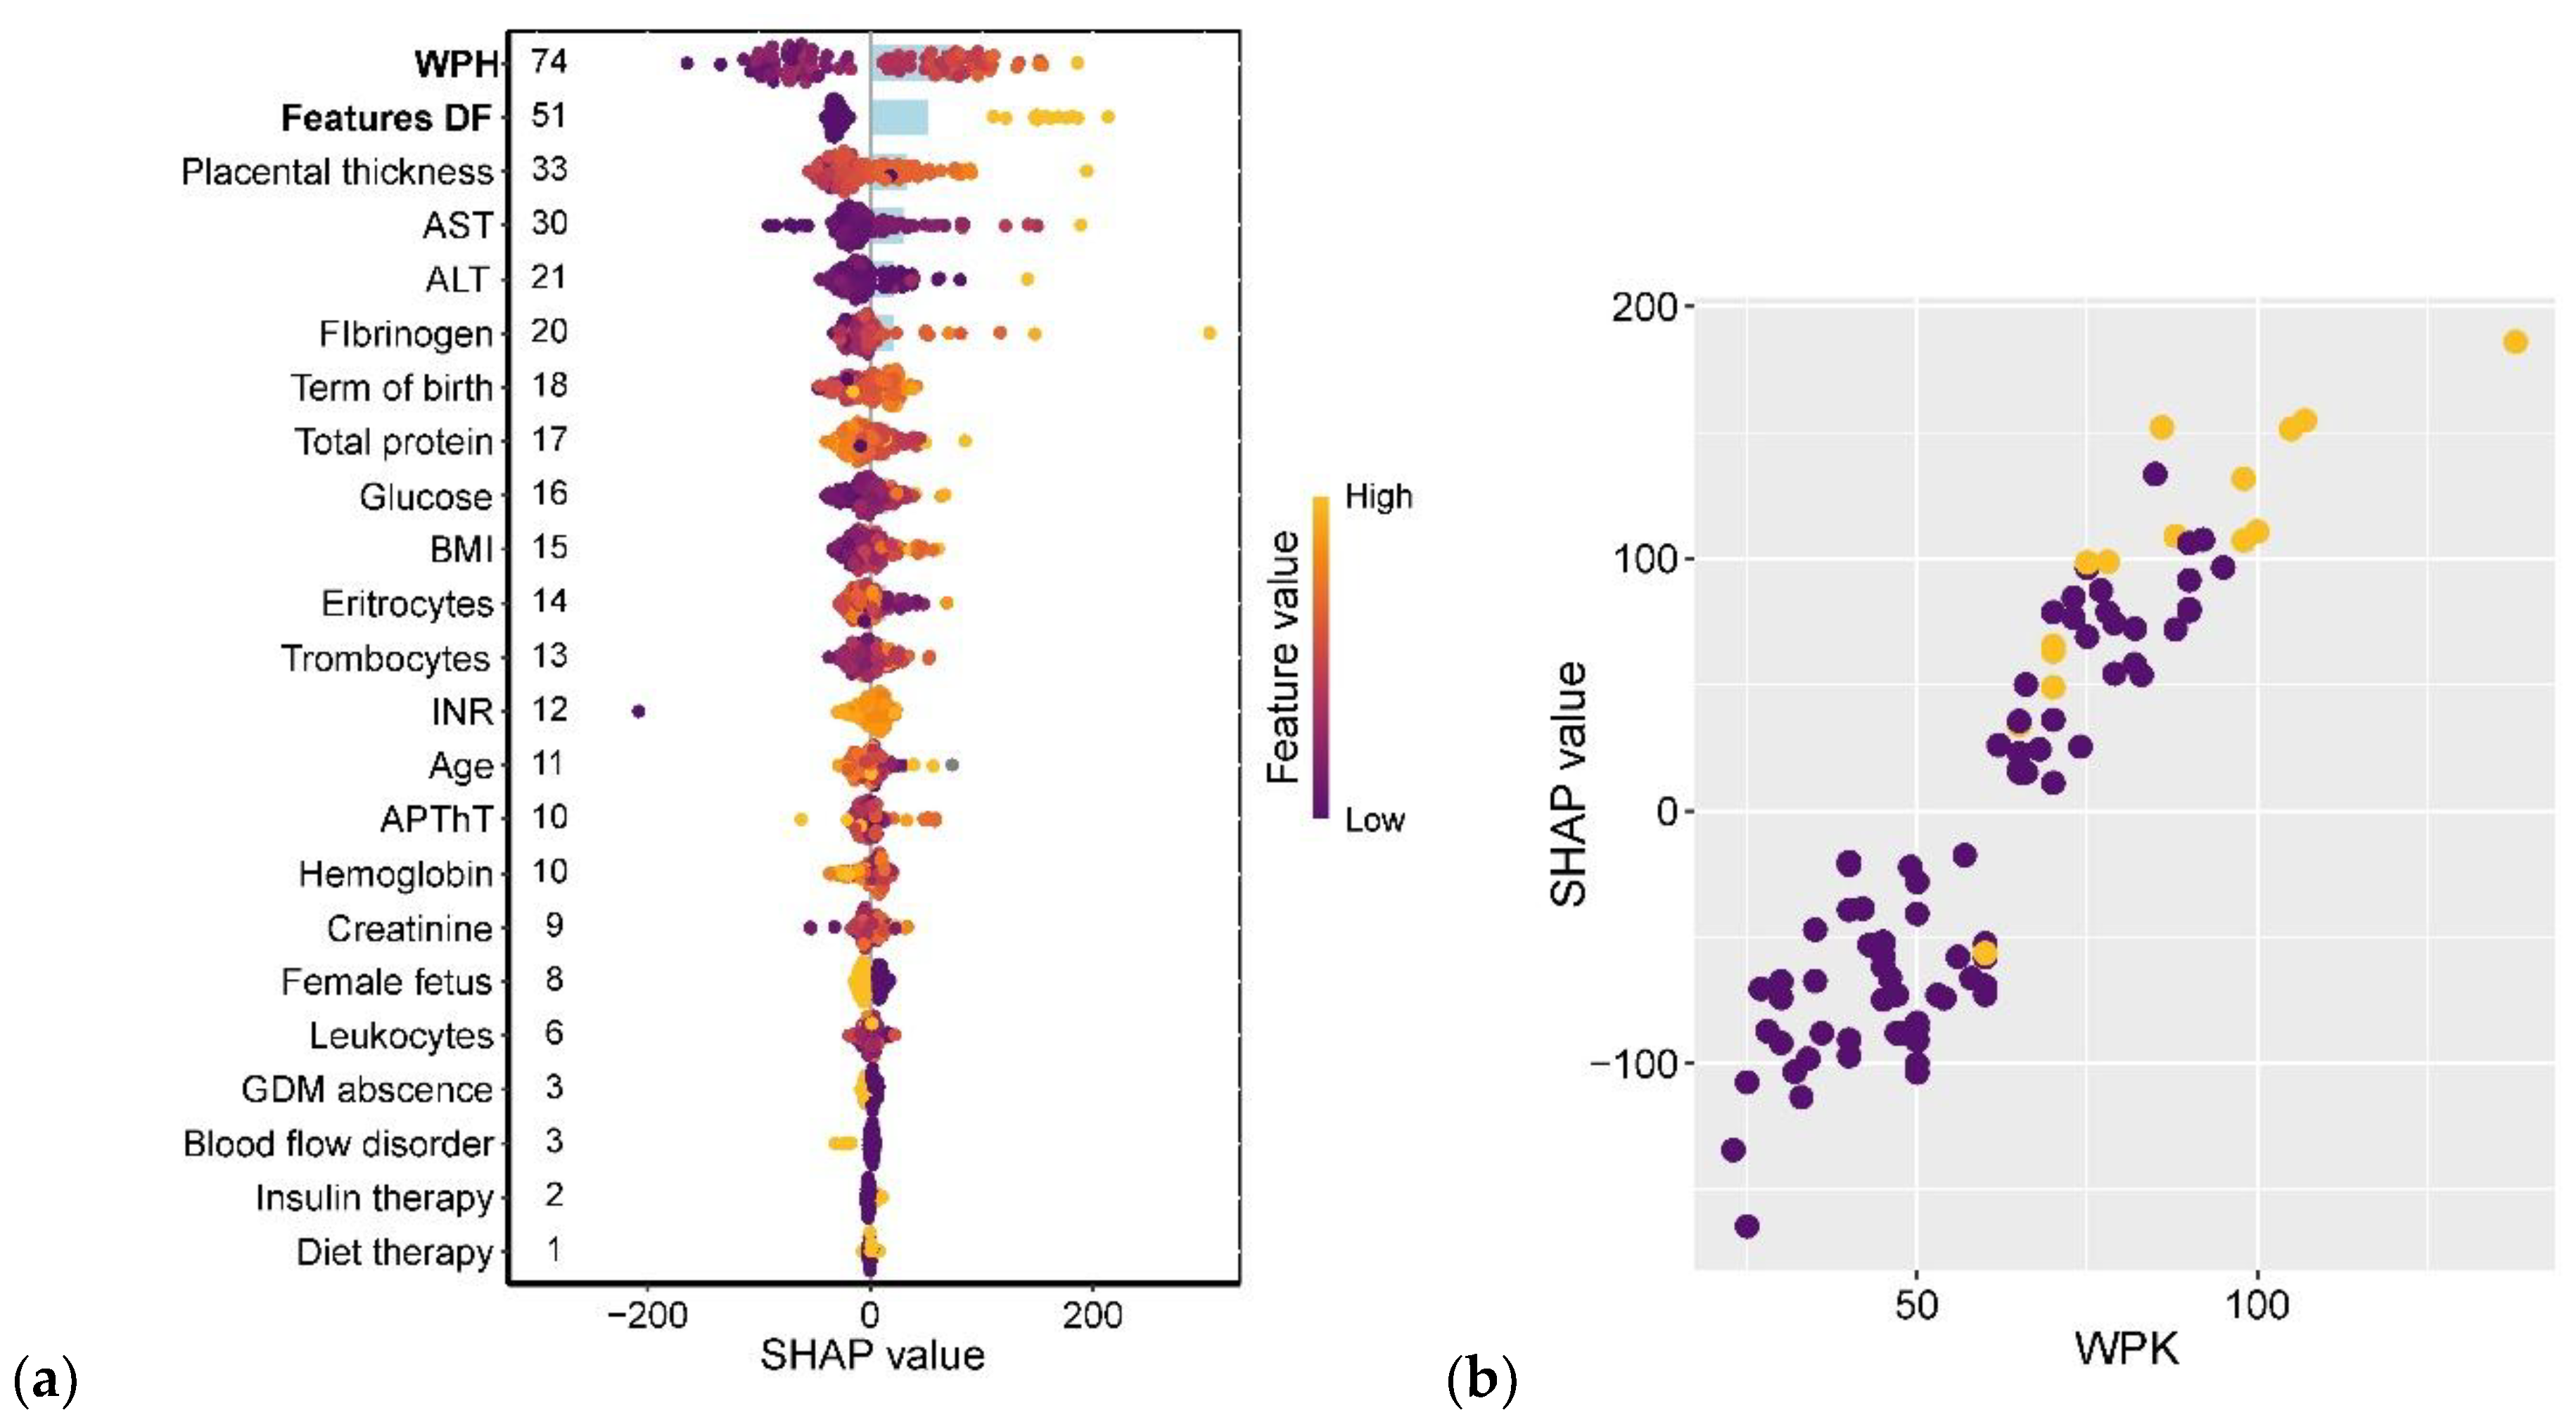
Figure 13.
Correlation matrix of serum amino acids and clinical parameters with at least one statistically significant association. Amino acids and parameters are ordered by similarity of correlation coefficients. Statistically significant correlations are highlighted in bold.
Figure 13.
Correlation matrix of serum amino acids and clinical parameters with at least one statistically significant association. Amino acids and parameters are ordered by similarity of correlation coefficients. Statistically significant correlations are highlighted in bold.
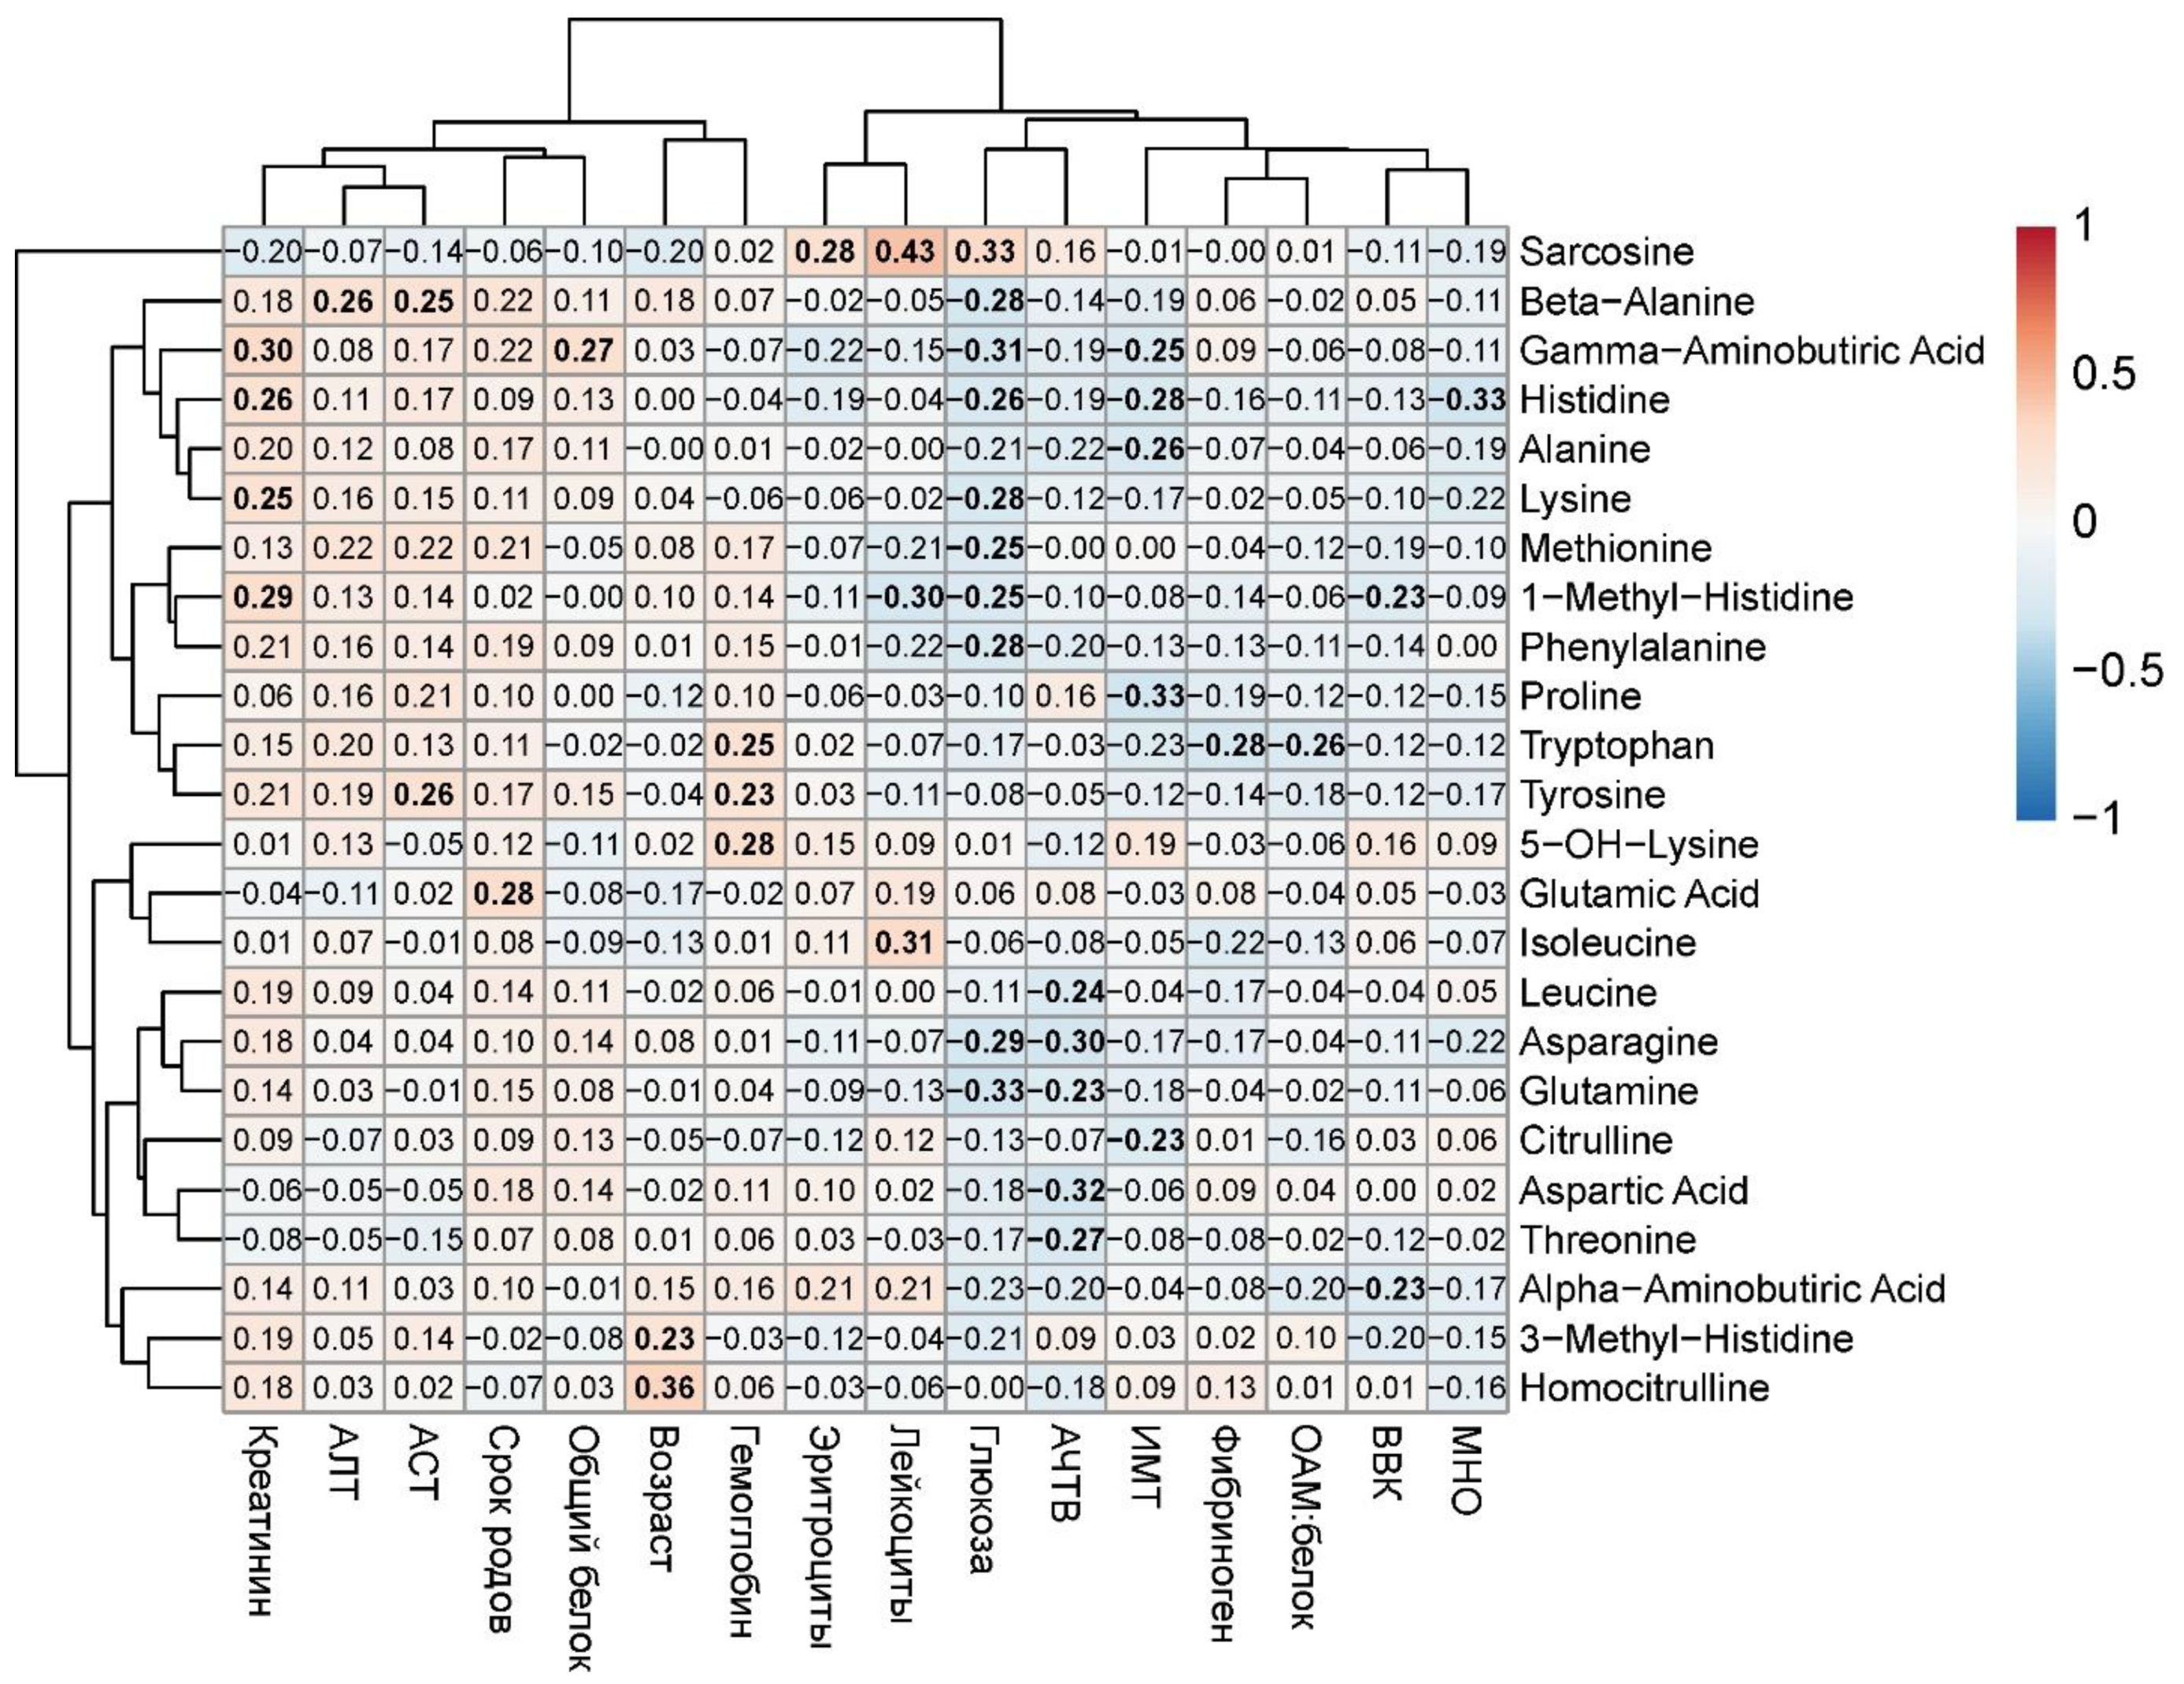

Table 1.
Comparative Amino Acid Profiling in GDM Across Biological Compartments.
| Amino Acid | Maternal venous blood | Cord blood |
Amniotic fluid | P-value | Major changes in GDM | Association with macrosomia |
|---|---|---|---|---|---|---|
| Histidine | ↓ |
↓ |
↓ |
p=0.003, p*=0.09, p**=0.02 |
Associated with GDM Decrease in maternal and cord blood, increase in AF |
Non-specific |
| Glutamine | ↓ |
↓ |
↑ |
p=0.04, p*=0.29, p**=0.01 |
Associated with GDM Decrease in maternal and umbilical cord blood, increase in AF |
Non-specific |
| 5-OH-Lysine | ↑ |
– |
↑ | p=0.05, p*=1, p**=0.2 |
Associated with GDM Increase in maternal blood and AF |
Non-specific |
| Asparagine |
↓ |
- |
- |
p=0.01, p*=0.30, p**=0.16 |
Decreased in maternal blood | Associated with macrosomia |
| Isoleucine | – |
↑ | ↑ |
p=0.7, p*=0.01, p**=0.004 |
Increase in umbilical cord blood and AF | Associated with macrosomia |
| Serin | – |
↑ |
↑ |
p=0.75, p*=0.35, p**=0.02 |
Increase in umbilical cord blood and AF |
Associated with macrosomia |
| Threonine | – |
↑ |
↑ | p=0.59, p*=0.43, p**=0.003 |
Increase in umbilical cord blood and AF |
Associated with macrosomia |
| Arginine | – |
↓ |
↑ | p=0.82, p*=0.67, p**=0.007 |
Decreased in cord blood, increased in AF | Associated with macrosomia |
p without * - is comparing serum venous blood, p** - comparing serum cord blood, p** - comparing amniotic fluid. AF – amniotic fluid.
Table 2.
Diagnostic Thresholds for GDM Using the 75-g Oral Glucose Tolerance Test.
| Venous plasma glucose | mmol/l | mg/dl |
|---|---|---|
| Fasting | ≥5,1 | ≥92 |
| 1-hour post-load | ≥10,0 | ≥180 |
| 2-hour post-load | ≥8,5 | ≥153 |
Table 3.
Diagnostic Thresholds for Overt Diabetes Mellitus in Pregnancy.
| Fasting venous plasma glucose | ≥ 7,0 ммoль/л | ≥126 мг/дл |
|---|---|---|
| Glycated hemoglobin (HbA1c) | ≥ 6,5% | |
| Random venous plasma glucose | ≥11,1 ммoль/л | ≥200 мг/дл |
Disclaimer/Publisher’s Note: The statements, opinions and data contained in all publications are solely those of the individual author(s) and contributor(s) and not of MDPI and/or the editor(s). MDPI and/or the editor(s) disclaim responsibility for any injury to people or property resulting from any ideas, methods, instructions or products referred to in the content. |
© 2025 by the authors. Licensee MDPI, Basel, Switzerland. This article is an open access article distributed under the terms and conditions of the Creative Commons Attribution (CC BY) license (http://creativecommons.org/licenses/by/4.0/).
Copyright: This open access article is published under a Creative Commons CC BY 4.0 license, which permit the free download, distribution, and reuse, provided that the author and preprint are cited in any reuse.


