Submitted:
24 October 2025
Posted:
27 October 2025
You are already at the latest version
Abstract
Gestational diabetes mellitus (GDM) and macrosomia, are crucial for improving maternal and neonatal outcomes. Molecular dysregulations can manifest long before clinical symptoms appear. This study aimed to leverage first-trimester serum lipidomic signatures to build early predictive models for these complications. A case-control study was conducted using serum samples from women during first-trimester screening. Lip-idomic profiling was performed using shotgun mass spectrometry in both positive and negative electrospray ionization modes. After feature selection based on Shapley values, machine learning models—including Random Forest and XGBoost were constructed and evaluated via 10-fold cross-validation. For GDM, potential early biomarkers included elevated levels of TG 55:7, and decreased levels of 13-Docosenamide, PC P-36:2, and PC 42:7. For macrosomia, PG (i-, a- 29:0), 4-Hydroxybutyric acid, and Pantothenol were sig-nificantly altered. The model for GDM prediction achieved a sensitivity of 87% and spec-ificity of 89%. For macrosomia, the model demonstrated a sensitivity of 87% and speci-ficity of 93%. The risk ratio between the high- and low-risk groups defined by the models was 11.9 for GDM and 11.1 for macrosomia. Our findings demonstrate that first-trimester serum lipidomic profiles, combined with clinical data and interpreted by advanced ma-chine learning, can accurately identify patients at high risk for GDM and macrosomia. This integrated approach holds significant promise for developing a clinical tool for timely intervention and personalized pregnancy management.
Keywords:
GDM
; macrosomia
; pregnancy
; lipids
; the 1st trimester
; random forest
; xgboost
; mass-spectrometry
1. Introduction
1.1. The Clinical Challenge of Metabolic Pregnancy Complications
Gestational diabetes mellitus (GDM) and fetal macrosomia represent two of the most prevalent metabolic complications of pregnancy, posing significant short- and long-term risks to both maternal and child health. Current global statistics indicate that GDM develops in approximately 16% of pregnant women, with its prevalence rising in parallel with the increasing rates of obesity and type 2 diabetes [1]. Similarly, the incidence of large-for-gestational-age newborns, a proxy for macrosomia, exhibits considerable variation across Europe, ranging from 8% to 24% [2]. These conditions are not merely transient concerns of gestation. They are associated with a spectrum of adverse obstetric outcomes, including preeclampsia, gestational hypertension, polyhydramnios, preterm birth, birth trauma, and an elevated risk of perinatal mortality [3,4,5]. Beyond parturition, the long-term implications are profound. Mothers with a history of GDM face a markedly increased lifetime risk of progressing to type 2 diabetes, metabolic syndrome, and cardiovascular diseases [6,7,8]. Their offspring are predisposed to a higher likelihood of developing diabetes, pre-diabetic states, obesity, and elevated blood pressure later in life, effectively perpetuating a cycle of metabolic disease [9,10,11]. The ability to accurately identify at-risk women at the earliest possible stage is therefore a critical imperative in prenatal care, creating a window of opportunity for preventive strategies and personalized monitoring to mitigate these cascading health burdens.
1.2. The Search for Early Predictive Biomarkers
The current diagnostic paradigm for GDM, typically based on an oral glucose tolerance test (OGTT) at 24–28 weeks of gestation, identifies the disorder only after its metabolic manifestations are well-established. This reactive approach misses the crucial window for early intervention. Consequently, substantial research efforts have been directed toward discovering first-trimester biomarkers that could forecast the later development of metabolic complications. The physiological adaptations of pregnancy, including profound alterations in maternal metabolism, are reflected in systemic changes in the proteome, metabolome, and lipidome. Indeed, several studies have demonstrated that metabolic dysregulations associated with GDM can be detected in the maternal bloodstream as early as the first trimester [12,13,14]. For instance, investigations into the proteome have revealed altered levels of specific proteins involved in inflammation and insulin signaling [12,14]. Similarly, metabolomic studies have identified early shifts in amino acid and fatty acid profiles that are predictive of GDM [13,17].
1.3. The Lipidome as a Rich Source of Early Markers
Among the various “omics” layers, the lipidome is particularly promising. Lipids are not merely passive energy stores; they are fundamental structural components of cellular membranes and play active roles as signaling molecules, influencing insulin sensitivity, inflammation, and placental function. The lipid profile is highly dynamic during pregnancy, and its disruption can be a primary event in the pathogenesis of metabolic disorders. Supporting this, several prospective studies have already linked specific first-trimester lipidomic signatures to the subsequent risk of GDM [13,15,16]. Wang et al. and Rahman et al. demonstrated that a panel of phospholipids and triacylglycerols measured in early pregnancy could predict GDM with considerable accuracy, underscoring the diagnostic potential of the lipidome [15,16].
1.4. Advancing Prediction with Machine Learning and Integrated Data
While these studies establish the principle of early prediction, the integration of lipidomic data with advanced computational methods remains an area of active development. Many existing models rely on traditional statistical approaches like logistic regression [13,17,20,21]. However, machine learning (ML) algorithms, such as Random Forest and XGBoost, offer powerful advantages for handling high-dimensional, complex biological data. They can capture non-linear relationships and interactions between variables, potentially leading to more robust and accurate predictive models. Furthermore, many models focus predominantly on maternal factors. The contribution of paternal parameters, such as paternal birth weight, which may reflect genetic predispositions, has been largely overlooked, despite its potential biological relevance.
1.5. Study Aim and Novelty
The primary aim of this work was to develop and validate early predictive models for GDM and macrosomia by integrating first-trimester serum lipidomic profiles, acquired using high-resolution mass spectrometry, with comprehensive clinical data. We hypothesized that an integrated approach, combining detailed lipidomic profiles with comprehensive clinical data—including novel paternal parameters—and leveraging explainable machine learning, would yield a highly accurate and biologically interpretable tool for early risk stratification. This study distinguishes itself by its holistic methodology: the application of multiple ML models (Random Forest, XGBoost, MLP) with hyperparameter optimization, the use of Shapley values for model interpretation and biomarker discovery, and the inclusion of paternal medical history to create a more comprehensive predictive framework for metabolic pregnancy complications.
2. Results
2.1. Clinical Parameters
The frequency of in vitro fertilization (IVF) was statistically significantly higher in the groups with pregnancy complications compared to the control group (p = 0.03). Maternal birth weight in the control group (3.34 (3.15; 3.5) kg) was statistically significantly lower than in the groups with macrosomia: 3.7 (3.5; 4.1) kg, p = 0.001 for isolated macrosomia and 3.6 (3.5; 3.92) kg, p = 0.02 for macrosomia with GDM. Paternal age in the control group was statistically significantly lower than in the groups with pregnancy complications (p = 0.04). Similarly, paternal birth weight in the control group (3.5 (3.3; 3.7) kg) was statistically significantly lower than in the isolated macrosomia group (3.8 (3.52; 4) kg, p = 0.03).
A history of GDM was statistically significantly more frequent in the group of pregnant women whose pregnancy was complicated by both GDM and macrosomia (p = 0.02). Endometriosis was statistically significantly more common in the groups of pregnant women whose pregnancy was complicated by macrosomia (p = 0.02). In the control group, a history of macrosomia (1 (2%)) was statistically significantly less frequent than in the groups with macrosomia: 8 (27%), p = 0.02 for isolated macrosomia and 6 (40%), p = 0.002 for GDM combined with macrosomia. Cesarean section in the control group (10 (20%)) was performed statistically significantly less often than in the groups with isolated GDM (15 (60%), p = 0.001) and isolated macrosomia (19 (63%), p = 0.001).
The discharge of the mother and child from the hospital in the control group (3 (3; 4) and 3 (2; 4) days, respectively) occurred statistically significantly faster than in the isolated GDM group (4 (4; 5) days and 4 (3; 5) days, p = 0.002) and the isolated macrosomia group (4 (4; 5) days and 4 (3; 5) days, p < 0.001) (Table S1).
2.2. Diagnostic Models
Gradient boosting-based models demonstrated superior performance for predicting the development of GDM and macrosomia using the positive ion mode lipid profile, and for predicting GDM using the negative ion mode lipid profile (Table 1).
Five compounds from the positive ion mode: 908.7800 *m/z* (identified as TG 55:7 + NH₄⁺), 338.3445 *m/z* (13-Docosenamide + H⁺), 770.6095 *m/z* (PC P-36:2 + H⁺), 663.4591 *m/z* (PG (i-, a- 29:0) + H⁺ - H₂O), 860.6211 *m/z* (PC 42:7 + H⁺); two compounds from the negative ion mode: 299.0065 *m/z*, 295.2112 *m/z*; and three clinical parameters: maternal pre-pregnancy BMI, maternal birth weight, and history of macrosomia, were selected as potential first-trimester markers for the subsequent development of GDM during pregnancy (Figure 1 a, b, c; Table 2). The levels of TG 55:7 and the compound at 299.0065 *m/z*, along with maternal BMI, were statistically significantly higher in women who later developed GDM, whereas the levels of 13-Docosenamide, PC P-36:2, PC 42:7, and the compound at 295.2112 *m/z* were statistically significantly lower in the future GDM group (Table 2).
One compound from the positive ion mode—663.4591 *m/z* (PG (i-, a- 29:0) + H⁺ - H₂O)⁺—and nine compounds from the negative ion mode—165.0317 *m/z* (4-Hydroxybutyric acid + HCO₃⁻)⁻, 234.1434 *m/z*, 174.9463 *m/z*, 239.1149 *m/z*, 951.1787 *m/z*, 250.1309 *m/z* (Pantothenol + HCO₂⁻)⁻, 247.1564 *m/z*, 374.2242 *m/z*, 195.1282 *m/z*—along with four clinical parameters (maternal pre-pregnancy BMI, maternal birth weight, history of macrosomia, and paternal birth weight) were selected as potential first-trimester markers for the subsequent development of macrosomia during pregnancy (Figure 1 d, e, f; Table 3). The levels of PG (i-, a- 29:0), 4-Hydroxybutyric acid, and the compounds at *m/z* 234.1434, 239.1149, 951.1787, 247.1564, 374.2242, and 195.1282, along with Pantothenol, maternal pre-pregnancy BMI, parental birth weights, and the frequency of macrosomia in the medical history, were statistically significantly higher. In contrast, the level of the compound at 174.9463 *m/z* was statistically significantly lower in the group that subsequently developed macrosomia (Table 2).
The best predictive performance for GDM was demonstrated by the XGBoost-based model, with a sensitivity of 87%, specificity of 89%, and accuracy of 88%. For macrosomia, the Random Forest-based model showed the best performance, with a sensitivity of 87%, specificity of 93%, and accuracy of 91% (Figure 2, Table 3).
Thus, we developed models capable of identifying patients belonging to the high-risk group for developing GDM and the high-risk group for developing macrosomia, with risk ratios of 11.9 (10.3 – 13.9) and 11.1 (10.0 – 12.3), respectively.
3. Discussion
Our study demonstrates that integrating first-trimester lipidomic signatures from high-resolution mass spectrometry with paternal and maternal clinical parameters enables the highly accurate prediction of GDM and macrosomia. Beyond the predictive models, a key finding is the identification of a panel of specific lipid species, including TG 55:7, PC P-36:2, and 4-Hydroxybutyric acid, which are significantly dysregulated weeks before clinical diagnosis. These markers point to early disruptions in specific metabolic pathways, offering novel insights into the underlying pathophysiology.
Yang et al. demonstrated the efficacy of a logistic regression model that utilized maternal age, pre-pregnancy BMI, race, family history of diabetes, and a blood profile for prediction. This blood profile included, alongside the proteome and glucose, information on the levels of even- and odd-chain short-chain fatty acids. This model achieved an area under the receiver operating characteristic curve (AUC) of 0.84 [13]. A logistic regression model presented by Wang et al., which used a combination of clinical parameters and lipid signatures, also showed diagnostic potential (AUC = 0.80). A model of comparable performance was demonstrated by Manna et al., where a logistic regression model was trained on maternal clinical parameters and blood metabolomic parameters (blood fatty acid profile and amino acid profile), yielding an AUC of 0.84, a false positive rate of 10%, and a detection rate of 60% [17]. It is noteworthy that for the combined model proposed in our current study, the corresponding metrics were an AUC of 0.88, a false positive rate of 11%, and a detection rate of 87%.
In contrast, a model utilizing medical history parameters based on logistic regression in the study by Tranidou et al. (2024) showed inferior predictive performance (AUC = 0.68, false positive rate 10%, detection rate 20%) compared to the Random Forest model in our current work (AUC = 0.76, false positive rate 8%, detection rate 51%) [18].
The application of advanced machine learning methods (decision trees) enabled Koos et al. to build a model using urinary metabolite levels with an accuracy of 96.7% [19].
Monari et al. proposed a logistic regression-based model for predicting fetal macrosomia using information on parity, pre-pregnancy BMI, and PAPP-A concentration in MoM, with a sensitivity of 55% and specificity of 79% [20]. This makes its performance comparable to the clinical data-based Random Forest model presented in our article (sensitivity 40%, specificity 93%). The model developed by Du et al., based on logistic regression and utilizing information on BMI, parity, history of macrosomia and GDM, as well as levels of glycated hemoglobin and total cholesterol at the first screening, demonstrated better performance: AUC = 0.81, sensitivity 71%, and specificity 78% [21]. Employing advanced machine learning methods, such as Random Forest, allowed Zhong et al. to create an integrated model using information on the abundance of four marker bacterial species in the gut microbiota and first-trimester clinical parameters (BMI, waist circumference, blood levels of albumin, total triglycerides, and total cholesterol), which showed high predictive power with an AUC of 0.91 on the test dataset.
It is important to note that the aforementioned studies did not consider paternal clinical parameters as potential variables, whereas in our present study, paternal birth weight was identified as a more important parameter than the levels of PAPP-A, beta-hCG, and first-trimester ultrasound results.
The level of TG 55:7 was statistically significantly elevated in the group of women who subsequently developed GDM. This triacylglycerol has also been previously identified as being associated with nutritional imbalance [22]. The elevated level of TG 55:7, a highly unsaturated triglyceride may reflect early alterations in hepatic lipogenesis and lipid storage driven by emerging insulin resistance. Such specific TG species are increasingly recognized as more sensitive markers of metabolic health than total triglycerides.
The level of 13-Docosenamide was statistically significantly decreased in the group of women with future GDM. Rodrigues W. J. et al. suggested that a range of metabolites, including 13-Docosenamide, possess anti-diabetic properties, based on the effect of Naregamia alata extract on diabetes symptoms in rats [23].
The level of PC P-36:2 was statistically significantly lower in the group of women who later developed GDM. Consistently, Wu P. et al. reported that a higher blood level of PC P-36:2 was associated with a lower risk of GDM [24]. Furthermore, Bagheri et al. and Pang S.-J. et al. found that plasmenyl phosphatidylcholine is negatively correlated with the level of insulin resistance [25,26]. Our finding that PC P-36:2 is significantly lower in women who later developed GDM is highly consistent with the known biology. Plasmalogens are endogenous antioxidants. Their depletion has been linked to insulin resistance and is a hallmark of metabolic syndrome [25,26]. The observed reduction in the first trimester suggests that an impaired antioxidant capacity and increased oxidative stress may be an early event in the pathogenesis of GDM, preceding its clinical manifestation A lower level of PC P-36:2 is also observed in women after delivery who had developed GDM during pregnancy compared to those without this complication, and a lower level of this lipid is characteristic of a higher risk of developing diabetes mellitus [27]. Similarly, a negative correlation with the level of insulin resistance has been reported for PC 42:7 [26].
Our study has several strengths, including the use of high-resolution lipidomics, the integration of novel paternal parameters, and the application of explainable AI (SHAP) for biomarker discovery. However, certain limitations should be acknowledged. The case-control design and single-center nature of our cohort, while ideal for initial discovery, necessitate external validation in a large, prospective, multi-center study to confirm generalizability. Furthermore, while we identified several lipid markers with high accuracy, the definitive structural confirmation for some signals, particularly in negative ion mode, requires further MS/MS analysis. Potential confounding factors, such as detailed dietary information, could not be fully accounted for and should be considered in future research.
In conclusion, our research moves beyond prediction by providing a molecular window into the early stages of metabolic complications in pregnancy. The identified lipid panel offers a powerful tool for risk stratification and opens new avenues for investigating the pathophysiology of GDM and macrosomia. Future work will focus on the external validation of these models and the functional characterization of the highlighted lipid pathways to uncover their precise role in pregnancy metabolism.
4. Materials and Methods
4.1. Study Design
A case-control study was conducted at the V.I. Kulakov National Medical Research Center for Obstetrics, Gynecology, and Perinatology. Out of 1200 women who underwent first-trimester prenatal screening (11–13.6 weeks) including blood sampling, 119 patients were enrolled in the study. The inclusion criteria were as follows:
- Singleton pregnancy;
- Neonatal birth weight ≥ 2500 g;
- Absence of malignant diseases in the mother;
- No history of organ transplantation in the mother;
- Absence of pregestational type 1 or type 2 diabetes mellitus in the mother;
- Undergoing an oral glucose tolerance test at 24–28 weeks of gestation and delivery at the Center;
- Absence of congenital malformations in the mother and fetus;
- Absence of other major pregnancy complications;
- Provision of informed consent by the mother for participation in the study.
Diagnosis of GDM was based on an oral glucose tolerance test (OGTT) performed after an 8-14 hour fast. Glucose levels were measured at fasting, and a diagnosis of GDM was made if the fasting glucose level exceeded 5.1 mmol/L. If the fasting level was normal, the pregnant woman received a load of 75 g of glucose dissolved in 200-300 ml of water. Blood glucose levels were then measured 1 hour and 2 hours after the glucose load. A diagnosis of GDM was made if the 1-hour glucose level was above 10.0 mmol/L or the 2-hour level was above 8.5 mmol/L. Diagnosis of Macrosomia was made when the neonatal birth weight exceeded the 90th percentile.
The study groups were formed as follows: the subgroup without macrosomia and without GDM (Group 1, control) included 49 women; the subgroup with isolated GDM (Group 2) included 25 women; the subgroup with isolated macrosomia (Group 3) included 30 women; and the subgroup with a combination of GDM and macrosomia (Group 4) included 15 women. Among the pregnant women in the isolated GDM group (Group 2), 14 received dietary therapy and 6 required insulin therapy. In the group with combined GDM and macrosomia (Group 4), 5 women received dietary therapy and 4 required insulin therapy.
4.2. Sample Collection and Preparation
Blood samples were collected by venipuncture into sterile 9 mL vacuum tubes containing separation gel, following a 12-hour fasting period. The collected serum was centrifuged at 700 g for 10 minutes at 4 °C. The supernatant was transferred into sterile tubes and stored at -80 °C until further analysis. Lipid extraction was performed using a modified Folch method [28]. The collected organic layer was dried under a stream of nitrogen and reconstituted in an acetonitrile/isopropanol mixture (1:1, v/v) for subsequent mass spectrometric analysis.
4.3. Lipidomic Mass Spectrometric Analysis
Mass spectrometric analysis was performed using direct infusion electrospray ionization on a Maxis Impact qTOF mass spectrometer (Bruker Daltonics, Bremen, Germany) [29]. The analysis was conducted in both positive and negative ion modes across a mass range of 100–1800 m/z, with the following parameters: capillary voltage of 4.1 kV in positive mode and 3.0 kV in negative mode, nebulizer gas pressure of 0.7 bar, and drying gas flow rate and temperature of 6 L/min and 200 °C, respectively. A 20 μL aliquot of the sample was introduced into a methanol/water (9:1, v/v) mobile phase flowing at 10 μL/min using a Dionex UltiMate 3000 system (ThermoScientific, Bremen, Germany).
Following mass spectrometric analysis, 100 mass spectra acquired during sample elution were averaged, aligned by total ion current, and processed into a data matrix containing the intensity of each peak with a specific m/z value in each sample.
4.4. Statistical Analysis
Comparison of clinical parameters between groups was performed using the Kruskal-Wallis test for numerical variables and Pearson’s chi-square test for categorical variables. Differences were considered statistically significant at p < 0.05. For parameters that showed statistically significant differences, pairwise comparisons were conducted using Dunn’s test for numerical variables and pairwise chi-square tests for categorical variables, with statistical significance set at p < 0.05.
Mass spectrometric profiles were checked for feature collinearity using Pearson’s correlation test. Features with a correlation coefficient greater than 0.9 were excluded, retaining the one with the lower mass-to-charge ratio.
For the positive ion mode mass spectrometric profiles, negative ion mode profiles, and the set of clinical parameters—which included paternal and maternal age, paternal and maternal birth weight, maternal pre-pregnancy BMI, family history of diabetes mellitus, history of GDM and macrosomia in previous pregnancies, parity, gravidity, number of deliveries, primiparity status, primigravida status, medical history, first-trimester levels of ß-hCG and PAPP-A, weight gain by the first screening, crown-rump length, biparietal diameter, head circumference, abdominal circumference, nuchal translucency thickness, placental thickness on first-trimester ultrasound, and fetal sex—predictive models for GDM and macrosomia were built using Random Forest [30], XGBoost (Extreme Gradient Boosting) [31], and Multilayer Perceptron (MLP). Hyperparameters for the XGBoost and MLP models were optimized using the Particle Swarm Optimization method [32].
For each classification task (predicting GDM and macrosomia) and each dataset, the optimal model was selected from the three candidates (Random Forest, XGBoost, and MLP) based on maximizing accuracy, sensitivity, and specificity, as determined by 10-fold cross-validation. For the variables incorporated into each optimal model, Shapley values were computed [33]. Features with Shapley values no less than half of the maximum value were considered potential markers. Potential lipid markers were identified with a mass accuracy tolerance of < 0.01 Da using the Human Metabolome Database [34], searching for lipids and lipid-like compounds in blood while excluding compounds of specific exogenous origin. Subsequently, models based on the potential markers for GDM/macrosomia were built using the previously selected optimal method. For the final model, accuracy, sensitivity, specificity, and positive and negative predictive values were calculated.
The analysis was performed using scripts in R version 4.3.3 (Vienna, Austria) [35] with the following packages: caret 7.0-1 [36], xgboost 1.7.8.1 [31], keras 2.15.0 [37], randomForest 4.7-1.2 [30], kernelshap 0.7.0 [38], ranger 0.17.0 [39], pROC 1.18.5 [40], shapviz 0.9.7 [41], and ggplot2 3.5.2 [42].
5. Conclusions
In this study, we successfully developed and validated robust machine learning models capable of accurately predicting the risk of gestational diabetes mellitus (GDM) and macrosomia as early as the first trimester of pregnancy. The high predictive power of our models, underscored by AUCs of 0.88 and 0.90 and high risk ratios, stems from the integration of maternal and paternal clinical data with first-trimester serum lipidomic profiles.
A key scientific contribution of this work is the identification of a panel of specific lipid species, including TG 55:7, PC P-36:2, and PG (i-, a- 29:0), whose altered levels signify early metabolic dysregulation preceding clinical diagnosis. The association of these lipids with pathways such as insulin resistance and nutritional imbalance provides a plausible molecular basis for the pathogenesis of these complications and offers new targets for mechanistic investigation.
The implementation of such a predictive tool in clinical practice could revolutionize prenatal care by enabling a shift from reactive to proactive management. Identifying high-risk patients in the first trimester would allow for early, personalized interventions, such as tailored dietary plans and close monitoring, potentially mitigating the onset or severity of GDM and macrosomia.
However, to advance these findings towards clinical application, several steps are necessary. Future research must focus on the external validation of these models in large, multi-center, prospective cohorts to ensure generalizability. Furthermore, a critical priority is the definitive structural identification of the unknown lipid signatures, particularly those detected in negative ion mode, using MS/MS fragmentation to fully elucidate their biological roles and diagnostic utility.
Supplementary Materials
The following supporting information can be downloaded at the website of this paper posted on Preprints.org, Supplementary.xlxs contain information about positive ion mode MS analysis, negative ion mode MS analysis and clinical characteristic of patients. Table S1. Clinical characteristics of women in each study group. Numerical parameters are pre-sented as Med (Q1, Q3), categorical parameters are presented as “absolute number” (“percentage within group”%). P – p-value for the comparison of multiple samples using the Kruskal-Wallis test for numerical parameters and Pearson’s chi-square test for categorical parameters. Pi-j – statistical significance for pairwise comparison using Dunn’s test for numerical parameters and pairwise chi-square test. Parameters that were statistically significant in the multiple sample comparison are highlighted in bold.
Author Contributions
Conceptualization, N.F. and A.T.; methodology, N.A.F.; software, A.T., V.L., and V.C.; validation, A.D. and V.F.; formal analysis, A.T. and V.C.; investigation, N.F., V.L., and V.C.; resources, V.F. and G.S.; data curation, A.T. and V.F.; writing—original draft preparation, A.T.; writing—review and editing, N.F., A.T., and V.F.; visualization, A.D.; supervision, V.F.; project administration, G.S.; funding acquisition, V.F. All authors have read and agreed to the published version of the manuscript.
Funding
This research was funded by the state assignment of the Ministry of Healthcare of the Russian Federation (Registration No 125050605833-4).
Institutional Review Board Statement
The study was approved by the Ethical Committee of the National Medical Research Center for Obstetrics, Gynecology and Perinatology named after Academician V.I. Kulakov (protocol No. 4, dated 18 April 2024).
Informed Consent Statement
Informed consent was obtained from all subjects involved in the study. Written informed consent has been obtained from the patient to publish this paper.
Data Availability Statement
The original contributions presented in this study are included in the article. Further inquiries can be directed at the corresponding author.
Acknowledgments
In this section, you can acknowledge any support given which is not covered by the author contribution or funding sections. This may include administrative and technical support, or donations in kind (e.g., materials used for experiments). Where GenAI has been used for purposes such as generating text, data, or graphics, or for study design, data collection, analysis, or interpretation of data, please add “During the preparation of this manuscript/study, the author(s) used [tool name, version information] for the purposes of [description of use]. The authors have reviewed and edited the output and take full responsibility for the content of this publication.”
Conflicts of Interest
The authors declare no conflicts of interest.
Abbreviations
The following abbreviations are used in this manuscript:
| AUC | Area Under the Receiver Operating Characteristic Curve |
| BMI | Body Mass Index |
| GDM | Gestational Diabetes Mellitus |
| IVF | In Vitro Fertilization |
| MLP | Multilayer Perceptron |
| MS | Mass Spectrometry |
| m/z | Mass-to-Charge Ratio |
| NPV | Negative Predictive value |
| OGTT | Oral Glucose Tolerance Test |
| PC | Phosphatidylcholine |
| PG | Phosphatidylglycerol |
| PPV | Positive Predictive Value |
| ROC | Receiver Operating Characteristic |
| SHAP | Shapley Additive exPlanations |
| TG | Triglyceride |
| XGBoost | Extreme Gradient Boosting |
References
- International Diabetes Federation, I. IDF Diabetes Atlas. In IDF Diabetes Atlas; 2025; Vol. 11th editi; ISBN 9782930229966.
- Hocquette, A.; Durox, M.; Wood, R.; Klungsøyr, K.; Szamotulska, K.; Berrut, S.; Rihs, T.; Kyprianou, T.; Sakkeus, L.; Lecomte, A.; et al. International versus national growth charts for identifying small and large-for-gestational age newborns: A population-based study in 15 European countries. Lancet Reg. Heal. - Eur. 2021, 8, 100167. [CrossRef]
- Billionnet, C.; Mitanchez, D.; Weill, A.; Nizard, J.; Alla, F.; Hartemann, A.; Jacqueminet, S. Gestational diabetes and adverse perinatal outcomes from 716,152 births in France in 2012. Diabetologia 2017, 60, 636–644. [CrossRef]
- Reece, E.A. The fetal and maternal consequences of gestational diabetes mellitus. J. Matern. Neonatal Med. 2010, 23, 199–203. [CrossRef]
- McIntyre, H.D.; Catalano, P.; Zhang, C.; Desoye, G.; Mathiesen, E.R.; Damm, P. Gestational diabetes mellitus. Nat. Rev. Dis. Prim. 2019, 5. [CrossRef]
- Farahvar, S.; Walfisch, A.; Sheiner, E. Gestational diabetes risk factors and long-term consequences for both mother and offspring: a literature review. Expert Rev. Endocrinol. Metab. 2019, 14, 63–74. [CrossRef]
- Damm, P. Future risk of diabetes in mother and child after gestational diabetes mellitus. Int. J. Gynecol. Obstet. 2009, 104, S25–S26. [CrossRef]
- Kramer, C.K.; Campbell, S.; Retnakaran, R. Gestational diabetes and the risk of cardiovascular disease in women. Diabetologia 2019, 62, 905–914. [CrossRef]
- Kelstrup, L.; Damm, P.; Mathiesen, E.R.; Hansen, T.; Vaag, A.A.; Pedersen, O.; Clausen, T.D. Insulin resistance and impaired pancreatic β-cell function in adult offspring of women with diabetes in pregnancy. J. Clin. Endocrinol. Metab. 2013, 98, 3793–3801. [CrossRef]
- Johnsson, I.W.; Haglund, B.; Ahlsson, F.; Gustafsson, J. A high birth weight is associated with increased risk of type 2 diabetes and obesity. Pediatr. Obes. 2015, 10, 77–83. [CrossRef]
- Kuciene, R.; Dulskiene, V.; Medzioniene, J. Associations between high birth weight, being large for gestational age, and high blood pressure among adolescents: a cross-sectional study. Eur. J. Nutr. 2018, 57, 373–381. [CrossRef]
- Mavreli, D.; Evangelinakis, N.; Papantoniou, N.; Kolialexi, A. Quantitative comparative proteomics reveals candidate biomarkers for the early prediction of gestational diabetes mellitus: A preliminary study. In Vivo (Brooklyn). 2020, 34, 517–525. [CrossRef]
- Yang, J.; Cao, Y.; Qian, F.; Grewal, J.; Sacks, D.B.; Chen, Z.; Tsai, M.Y.; Chen, J.; Zhang, C. Early prediction of gestational diabetes mellitus based on systematically selected multi-panel biomarkers and clinical accessibility—a longitudinal study of a multi-racial pregnant cohort. BMC Med. 2025, 23, 430. [CrossRef]
- Lin, J.; Zhao, D.; Liang, Y.; Liang, Z.; Wang, M.; Tang, X.; Zhuang, H.; Wang, H.; Yin, X.; Huang, Y.; et al. Proteomic analysis of plasma total exosomes and placenta-derived exosomes in patients with gestational diabetes mellitus in the first and second trimesters. BMC Pregnancy Childbirth 2024, 24. [CrossRef]
- Wang, Y.; Huang, Y.; Wu, P.; Ye, Y.; Sun, F.; Yang, X.; Lu, Q.; Yuan, J.; Liu, Y.; Zeng, H.; et al. Plasma lipidomics in early pregnancy and risk of gestational diabetes mellitus: a prospective nested case-control study in Chinese women. Am. J. Clin. Nutr. 2021, 114, 1763–1773. [CrossRef]
- Rahman, M.L.; Feng, Y.C.A.; Fiehn, O.; Albert, P.S.; Tsai, M.Y.; Zhu, Y.; Wang, X.; Tekola-Ayele, F.; Liang, L.; Zhang, C. Plasma lipidomics profile in pregnancy and gestational diabetes risk: A prospective study in a multiracial/ethnic cohort. BMJ Open Diabetes Res. Care 2021, 9, e001551. [CrossRef]
- Borges Manna, L.; Syngelaki, A.; Würtz, P.; Koivu, A.; Sairanen, M.; Pölönen, T.; Nicolaides, K.H. First-trimester nuclear magnetic resonance–based metabolomic profiling increases the prediction of gestational diabetes mellitus. Am. J. Obstet. Gynecol. 2025, 233, 71.e1-71.e14. [CrossRef]
- Tranidou, A.; Tsakiridis, I.; Apostolopoulou, A.; Xenidis, T.; Pazaras, N.; Mamopoulos, A.; Athanasiadis, A.; Chourdakis, M.; Dagklis, T. Prediction of Gestational Diabetes Mellitus in the First Trimester of Pregnancy Based on Maternal Variables and Pregnancy Biomarkers. Nutrients 2024, 16, 120. [CrossRef]
- Koos, B.J.; Gornbein, J.A. Early pregnancy metabolites predict gestational diabetes mellitus: implications for fetal programming. Am. J. Obstet. Gynecol. 2021, 224, 215.e1-215.e7. [CrossRef]
- Monari, F.; Menichini, D.; Spano’ Bascio, L.; Grandi, G.; Banchelli, F.; Neri, I.; D’Amico, R.; Facchinetti, F. A first trimester prediction model for large for gestational age infants: a preliminary study. BMC Pregnancy Childbirth 2021, 21, 654. [CrossRef]
- Du, J.; Zhang, X.; Chai, S.; Zhao, X.; Sun, J.; Yuan, N.; Yu, X.; Zhang, Q. Nomogram-based risk prediction of macrosomia: a case-control study. BMC Pregnancy Childbirth 2022, 22, 392. [CrossRef]
- Rojo-López, M.I.; Barranco-Altirriba, M.; Rossell, J.; Antentas, M.; Castelblanco, E.; Yanes, O.; Weber, R.J.M.; Lloyd, G.R.; Winder, C.; Dunn, W.B.; et al. The Lipidomic Profile Is Associated with the Dietary Pattern in Subjects with and without Diabetes Mellitus from a Mediterranean Area. Nutrients 2024, 16, 1805. [CrossRef]
- Rodrigues, W.J.; Nekrakaleya, B.; Ramaiah, C.K.; Poojary, B. Bioassay-guided Isolation and Identification of Antidiabetic Compounds from Naregamia alata. Curr. Bioact. Compd. 2023, 19. [CrossRef]
- Wu, P.; Wang, Y.; Ye, Y.; Yang, X.; Huang, Y.; Ye, Y.; Lai, Y.; Ouyang, J.; Wu, L.; Xu, J.; et al. Liver biomarkers, lipid metabolites, and risk of gestational diabetes mellitus in a prospective study among Chinese pregnant women. BMC Med. 2023, 21, 150. [CrossRef]
- Bagheri, M.; Tiwari, H.K.; Murillo, A.L.; Al-Tobasei, R.; Arnett, D.K.; Kind, T.; Barupal, D.K.; Fan, S.; Fiehn, O.; O’connell, J.; et al. A lipidome-wide association study of the lipoprotein insulin resistance index. Lipids Health Dis. 2020, 19, 153. [CrossRef]
- Pang, S.J.; Liu, T.T.; Pan, J.C.; Man, Q.Q.; Song, S.; Zhang, J. The Association between the Plasma Phospholipid Profile and Insulin Resistance: A Population-Based Cross-Section Study from the China Adult Chronic Disease and Nutrition Surveillance. Nutrients 2024, 16, 1205. [CrossRef]
- Wang, G.; Buckley, J.P.; Bartell, T.R.; Hong, X.; Pearson, C.; Wang, X. Gestational Diabetes Mellitus, Postpartum Lipidomic Signatures, and Subsequent Risk of Type 2 Diabetes: A Lipidome-Wide Association Study. Diabetes Care 2023, 46, 1223–1230. [CrossRef]
- Starodubtseva, N.L.; Tokareva, A.O.; Rodionov, V. V; Brzhozovskiy, A.G.; Bugrova, A.E.; Chagovets, V. V; Kometova, V. V; Kukaev, E.N.; Soares, N.C.; Kovalev, G.I.; et al. Integrating Proteomics and Lipidomics for Evaluating the Risk of Breast Cancer Progression: A Pilot Study. Biomedicines 2023, 11, 1786. [CrossRef]
- Tonoyan, N.M.; Chagovets, V. V.; Starodubtseva, N.L.; Tokareva, A.O.; Chingin, K.; Kozachenko, I.F.; Adamyan, L. V.; Frankevich, V.E. Alterations in lipid profile upon uterine fibroids and its recurrence. Sci. Rep. 2021, 11, 11447. [CrossRef]
- Liaw, A.; Wiener, M. Classification and Regression by randomForest. R News 2002, 2, 18–22.
- Chen, T.; Guestrin, C. XGBoost: A scalable tree boosting system. Proc. ACM SIGKDD Int. Conf. Knowl. Discov. Data Min. 2016, 13–17, 785–794. [CrossRef]
- Clerc, M.; Kennedy, J. The Particle Swarm—Explosion, Stability, and Convergence in a Multidimensional Complex Space. Mutat. Res. DNAging 2002, 6, 58–73. [CrossRef]
- Štrumbelj, E.; Kononenko, I. Explaining prediction models and individual predictions with feature contributions. Knowl. Inf. Syst. 2014, 41, 647–665. [CrossRef]
- Wishart, D.S.; Guo, A.C.; Oler, E.; Wang, F.; Anjum, A.; Peters, H.; Dizon, R.; Sayeeda, Z.; Tian, S.; Lee, B.L.; et al. HMDB 5.0: The Human Metabolome Database for 2022. Nucleic Acids Res. 2022, 50, D622–D631. [CrossRef]
- CoreTeam, R. R: A Language and Environment for Statistical Computing 2021.
- Kuhn, M. Building predictive models in R using the caret package. J. Stat. Softw. 2008, 28, 1–26. [CrossRef]
- Kalinowski, T.; Falbe, D.; Allaire, J.; Chollet, F.; RStudio; Google; Tang, Y.; Bijl, W. Van Der; Studer, M.; Keydana, S. R Interface to “Keras” 2024.
- Covert, I.; Lee, S.-I. Improving KernelSHAP: Practical Shapley Value Estimation Using Linear Regression. In Proceedings of the Proceedings of The 24th International Conference on Artificial Intelligence and Statistics; Banerjee, A., Fukumizu, K., Eds.; PMLR, 2021; Vol. 130, pp. 3457–3465.
- Wright, M.N.; Ziegler, A. Ranger: A fast implementation of random forests for high dimensional data in C++ and R. J. Stat. Softw. 2017, 77. [CrossRef]
- Turck, N.; Vutskits, L.; Sanchez-Pena, P.; Robin, X.; Hainard, A.; Gex-Fabry, M.; Fouda, C.; Bassem, H.; Mueller, M.; Lisacek, F.; et al. pROC: an open-source package for R and S+ to analyze and compare ROC curves. BMC Bioinformatics 2011, 8, 12–77.
- Mayer, M. shapviz: SHAP Visualizations 2025.
- Wickham, H. Elegant Graphics for Data Analysis: ggplot2; 2008; ISBN 978-0-387-78170-9.
Figure 1.
The 15 features with the highest contribution to the model, based on the mean absolute Shapley value. Features identified as potential markers are highlighted in bold. (a) XGBoost, GDM, positive ion mode; (b) XGBoost, GDM, negative ion mode; (c) Random Forest, GDM, clinical data; (d) XGBoost, macrosomia, positive ion mode; (e) Random Forest, macrosomia, negative ion mode; (f) Random Forest, macrosomia, clinical data.
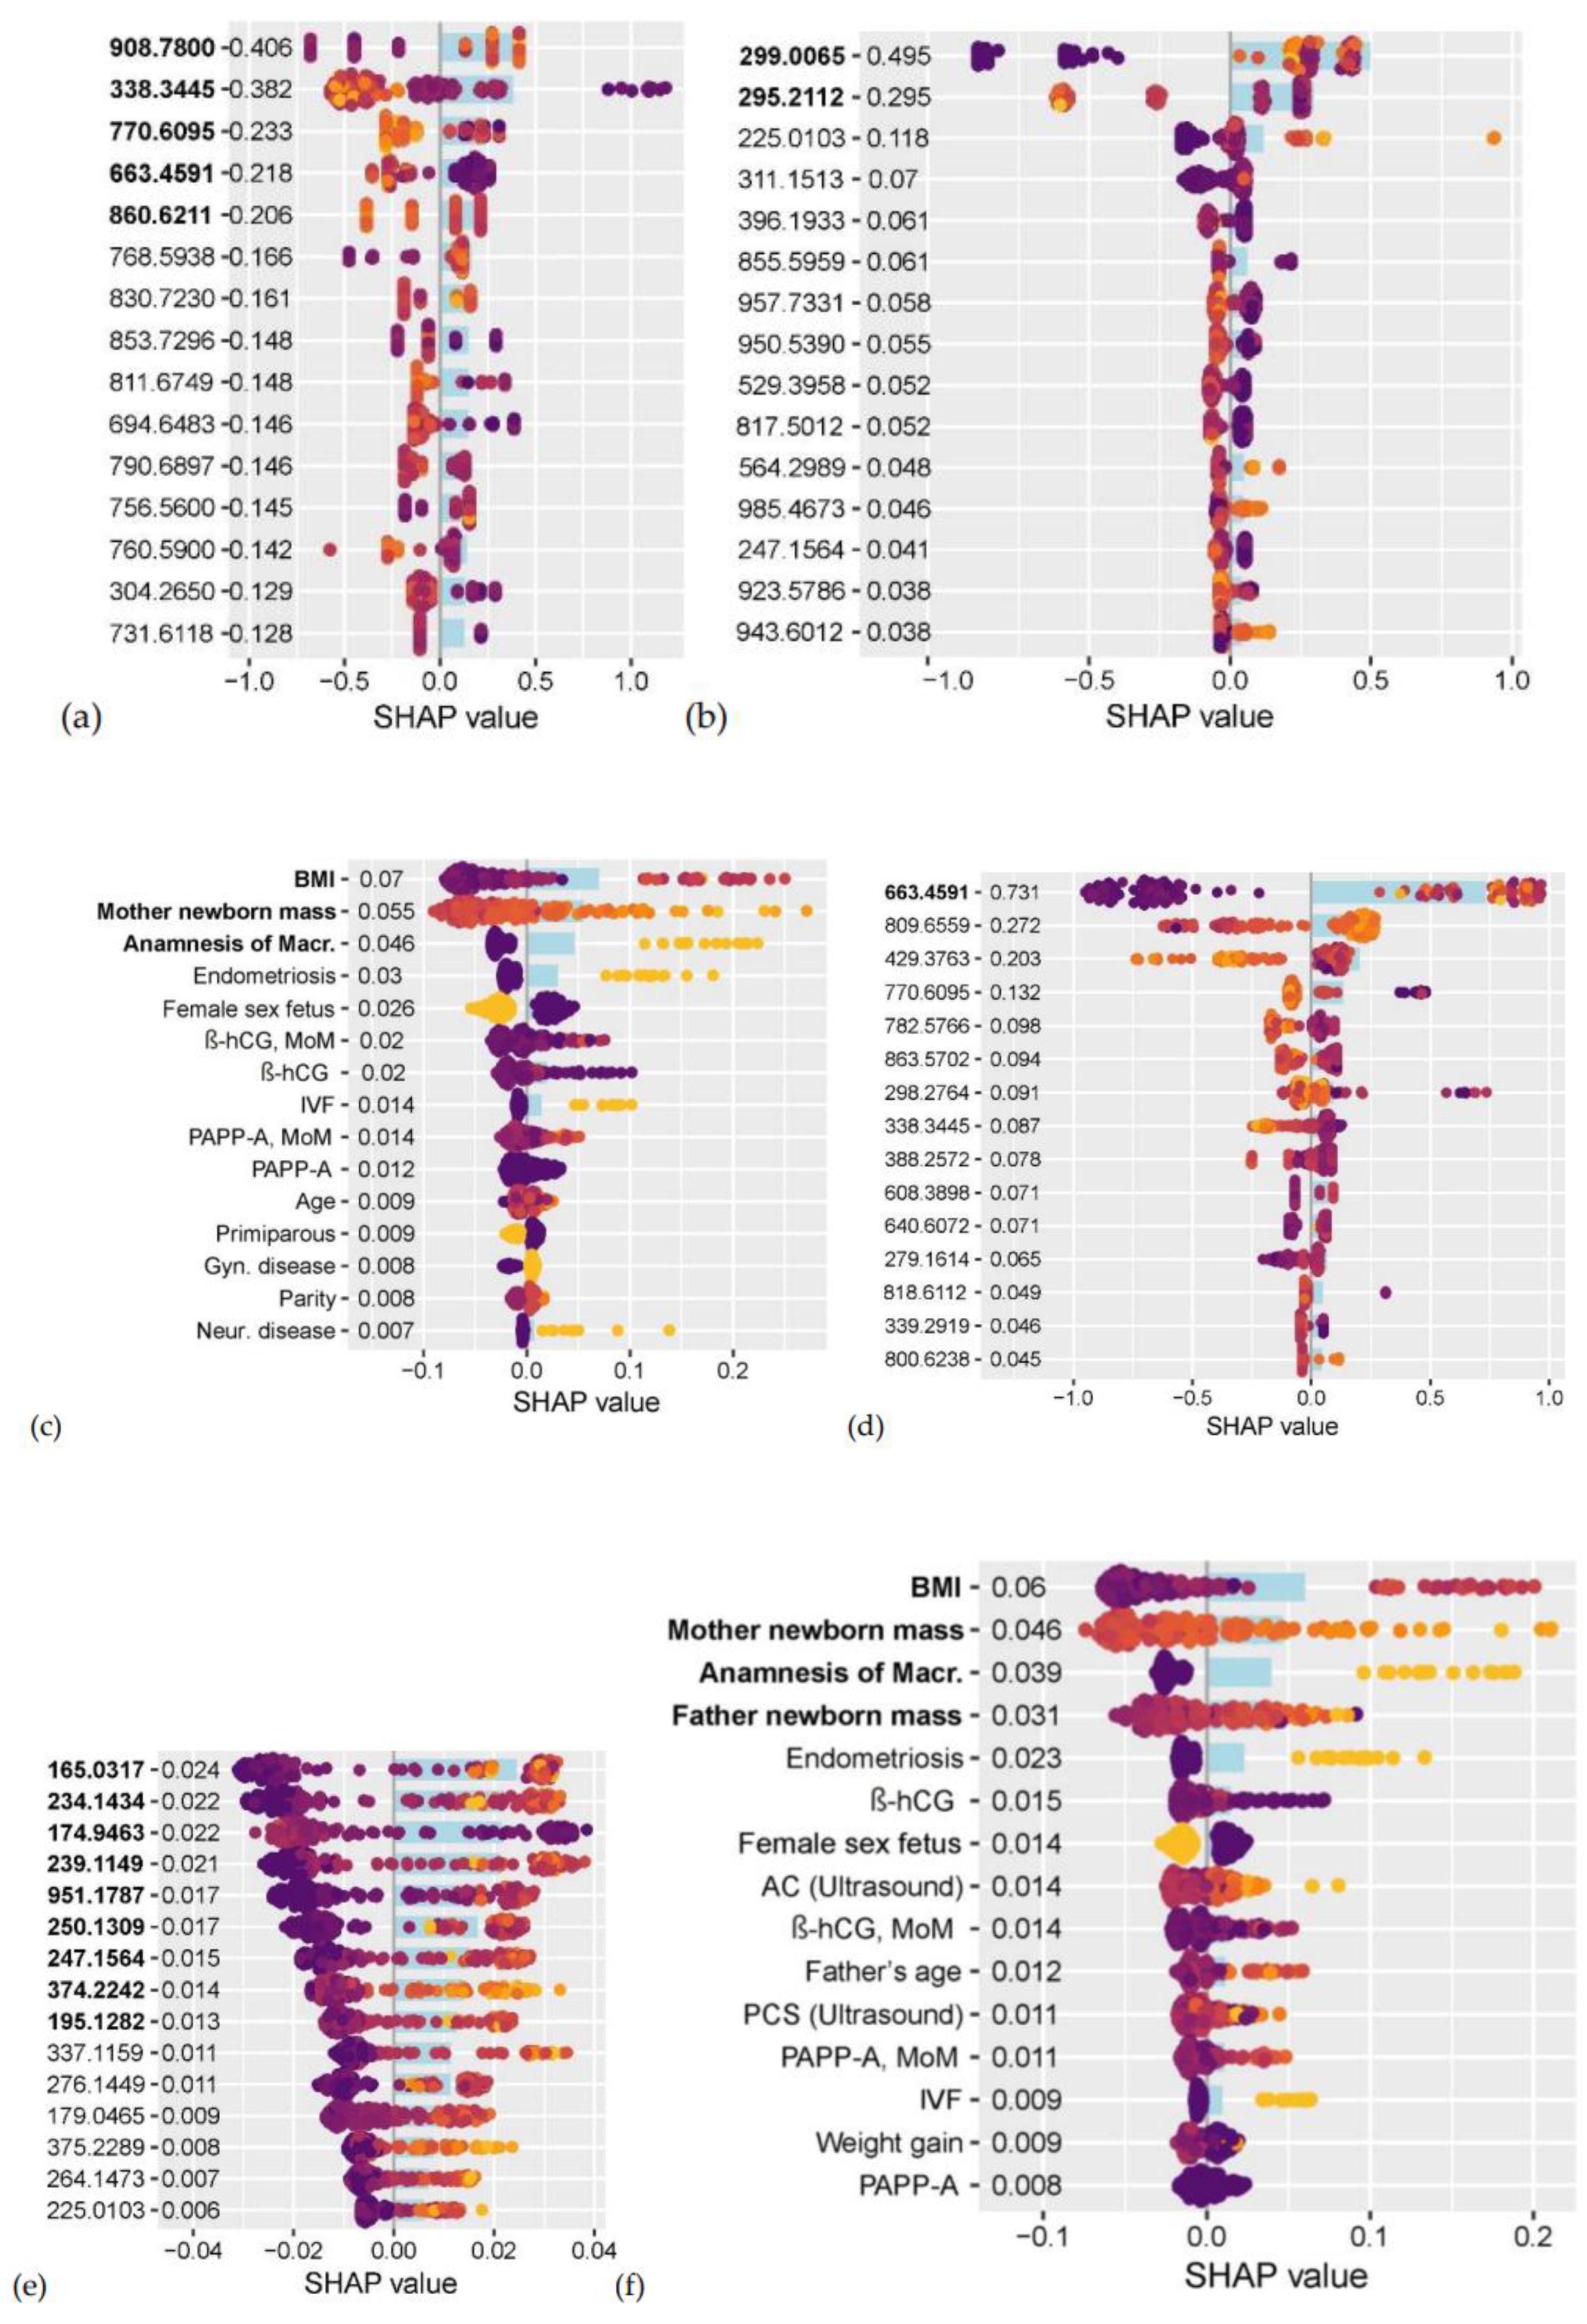
Figure 2.
Receiver Operating Characteristic (ROC) curves of the models built using the selected markers.
Figure 2.
Receiver Operating Characteristic (ROC) curves of the models built using the selected markers.
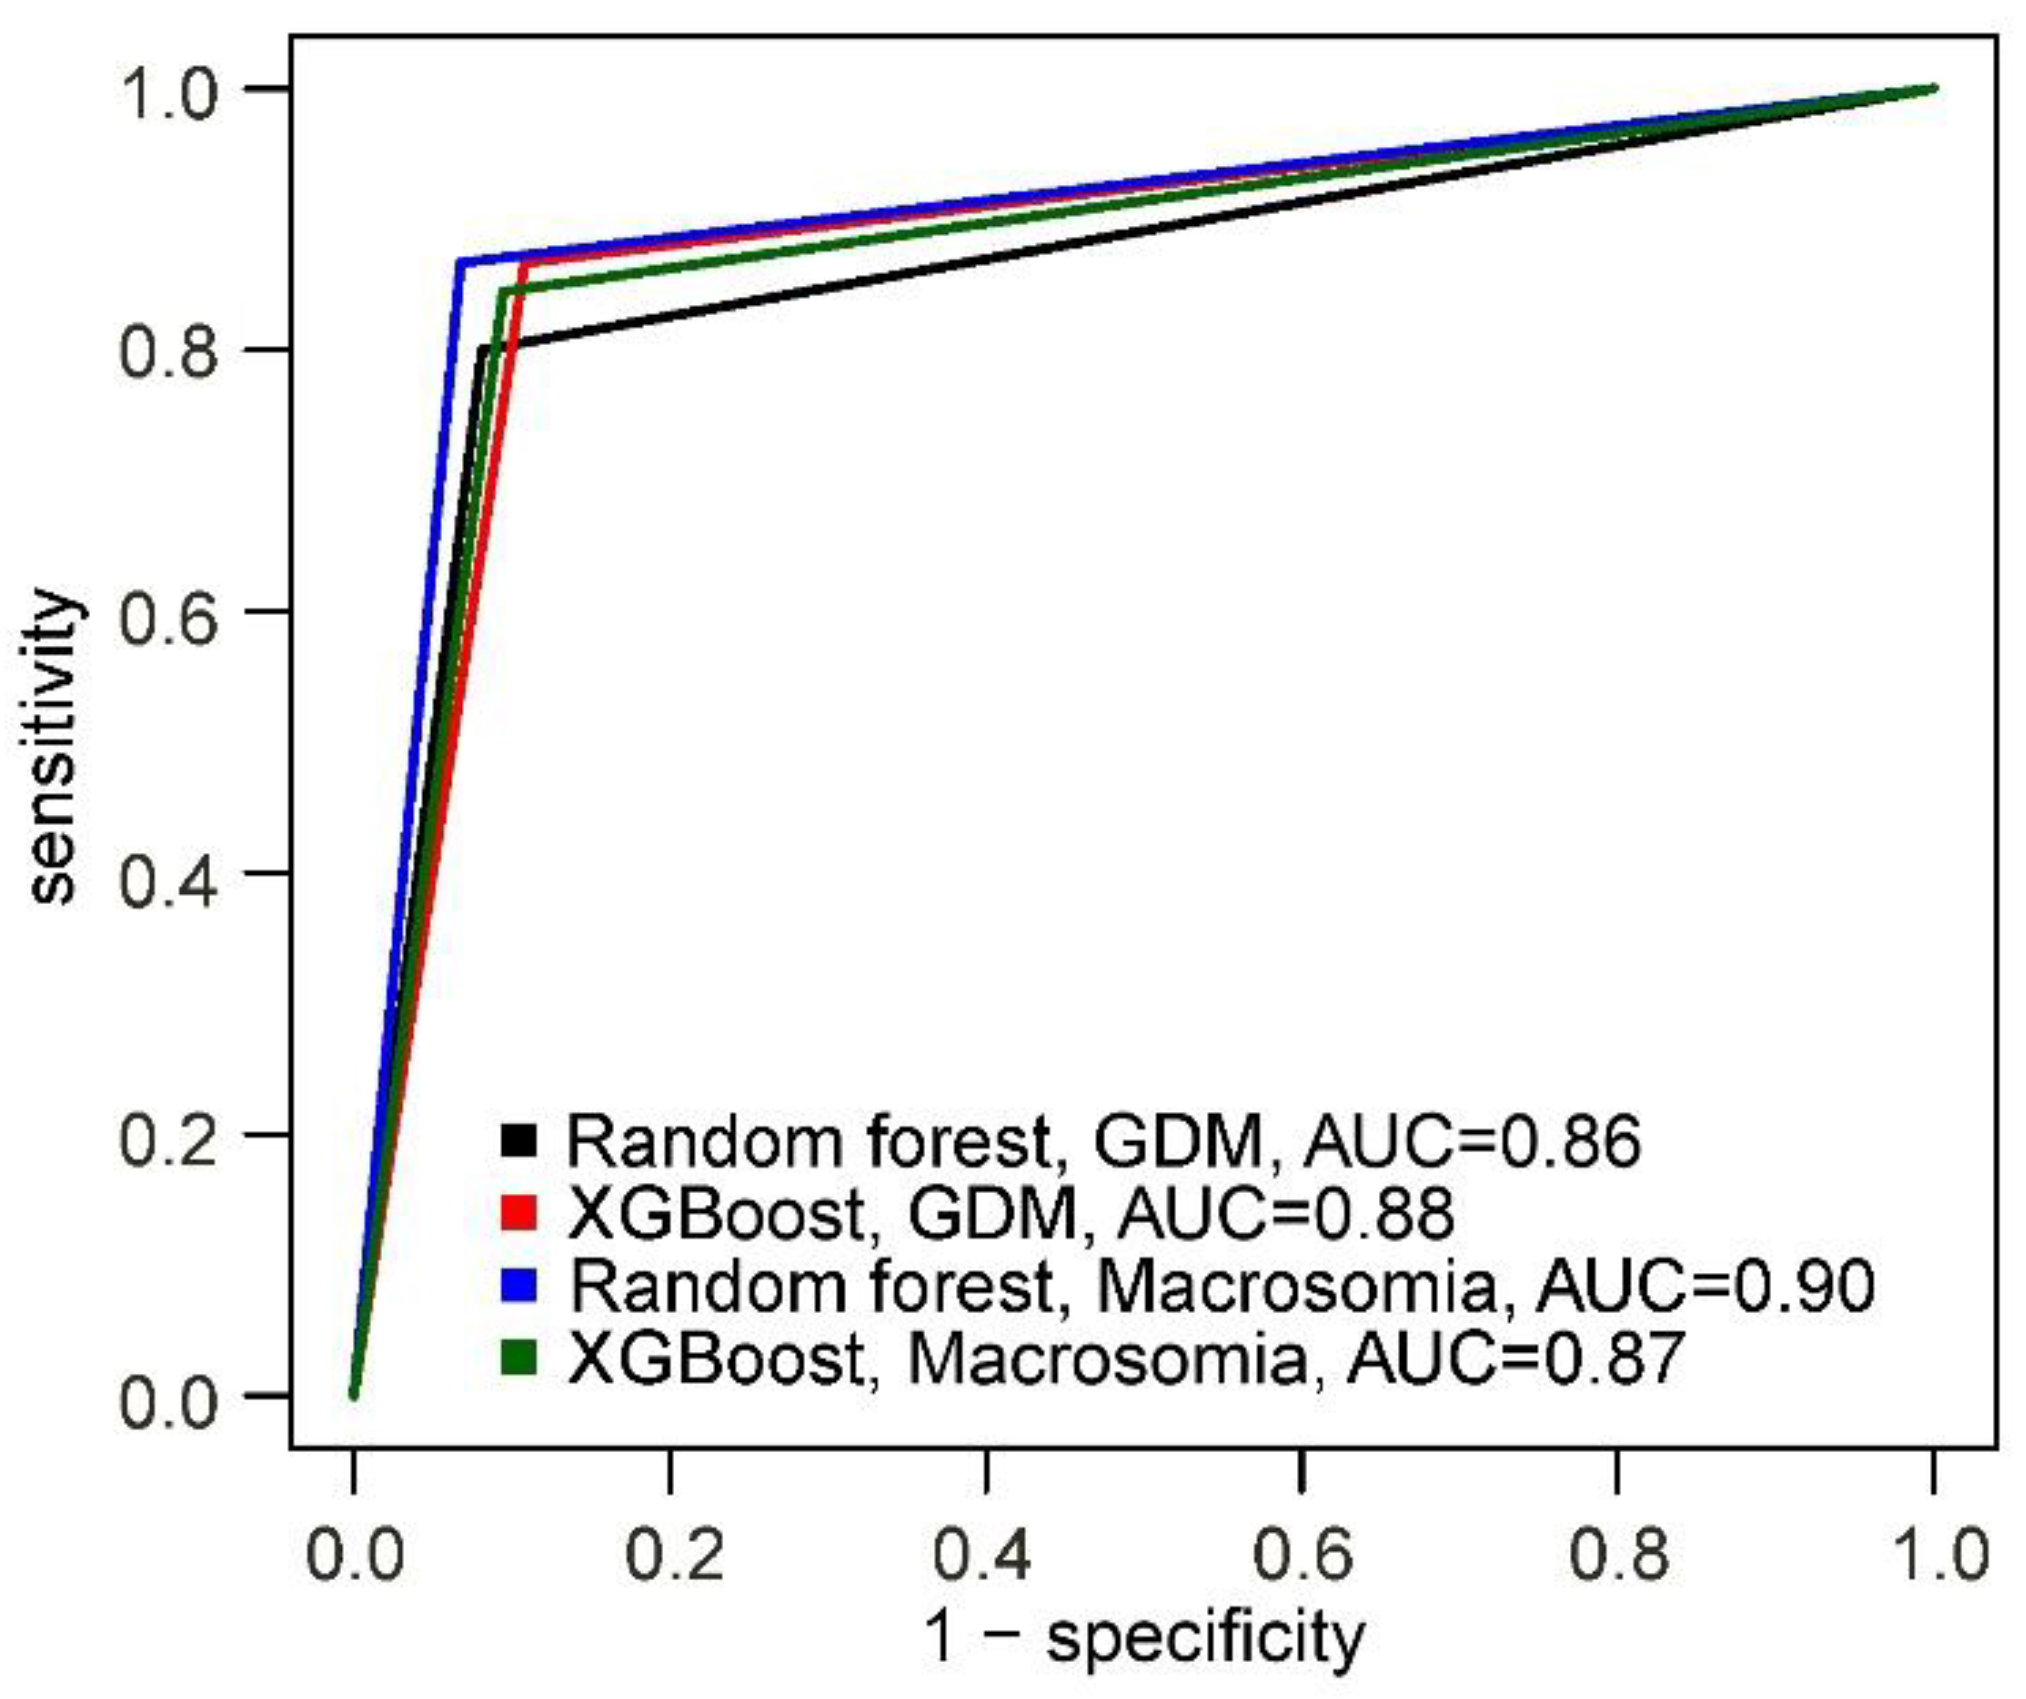

Table 1.
Performance metrics of models created using the full datasets. The best-performing models for each data type and outcome are highlighted in bold.
Table 1.
Performance metrics of models created using the full datasets. The best-performing models for each data type and outcome are highlighted in bold.
| Data Type | Method | Outcome | Sens. | Spec. | Acc. |
|---|---|---|---|---|---|
| Lipids, Positive Ion Mode | |||||
| Random Forest | GDM | 0.23 | 0.95 | 0.71 | |
| XGBoost | GDM | 0.60 | 0.89 | 0.79 | |
| MLP | GDM | 0.03 | 0.99 | 0.66 | |
| Random Forest | Macrosomia | 0.44 | 0.95 | 0.76 | |
| XGBoost | Macrosomia | 0.76 | 0.80 | 0.78 | |
| MLP | Macrosomia | 0.56 | 0.73 | 0.66 | |
| Lipids, Negative Ion Mode | |||||
| Random Forest | GDM | 0.20 | 0.92 | 0.68 | |
| XGBoost | GDM | 0.53 | 0.80 | 0.71 | |
| MLP | GDM | 0.83 | 0.37 | 0.52 | |
| Random Forest | Macrosomia | 0.84 | 0.95 | 0.91 | |
| XGBoost | Macrosomia | 0.64 | 0.84 | 0.76 | |
| MLP | Macrosomia | 0.56 | 0.73 | 0.66 | |
| Clinical Parameters | |||||
| Random Forest | GDM | 0.51 | 0.92 | 0.76 | |
| XGBoost | GDM | 0.47 | 0.77 | 0.65 | |
| MLP | GDM | 0.43 | 0.68 | 0.60 | |
| Random Forest | Macrosomia | 0.40 | 0.93 | 0.73 | |
| XGBoost | Macrosomia | 0.91 | 0.09 | 0.40 | |
| MLP | Macrosomia | 0.67 | 0.35 | 0.47 |
Table 2.
Potential first-trimester markers for the subsequent development of pregnancy complications. For lipid markers, the potential identification, ion, absolute difference between measured and theoretical mass-to-charge ratio (Δm/z), theoretical and measured m/z, levels in the group without and with subsequent complication, p-value (Mann-Whitney test), and the ratio of medians (with/without complication) are provided. For quantitative clinical parameters, levels in the group without and with subsequent complication, p-value (Mann-Whitney test), and the ratio of medians are provided. For categorical clinical parameters, absolute numbers and relative frequency in the group without and with future pathology, and the risk ratio are provided. M – neutral molecule.
| Marker | Ion | |Δm/z | Theoretical m/z | Measured m/z | No Subsequent Complication | Subsequent Complication | p-value | ОМ/ОР |
|---|---|---|---|---|---|---|---|---|
| Lipids, Positive Ion Mode, GDM | ||||||||
| TG 55:7 | (M + NH4+)+ | 0.009 | 908.7710 | 908.7800 | 6.7*10-5 (4.8*10-5; 1.1*10-4) |
1.2*10-4 (8.6*10-5;1.9*10-5) |
<0.001 | 1.78 |
| 13-Docosenamide | (M + H+)+ | 0.002 | 338.3420 | 338.3445 | 4.6*10-4 (3.3*10-4; 6.3*10-4) |
3.4*10-4 (1.5*10-4; 5.6*10-4) |
0.01 | 0.73 |
| PC P-36:2 | (M + H+)+ | 0.003 | 770.606 | 770.6095 | 5.9*10-4 (5.1*10-4;6.9*10-4) |
4.7*10-4 (3.3*10-4; 5.7*10-4) |
<0.001 | 0.80 |
| PG (i-, a- 29:0) | (M + H+-H2O)+ | 0.001 | 663.46 | 663.4591 | 1.1*10-3 (5.9*10-4; 2.6*10-3) |
1.0*10-3 (7.0*10-4;2.7*10-3) |
0.76 | 0.89 |
| PC 42:7 | (M+H+)+ | 0.004 | 860.6170 | 860.6211 | 4.3*10-5 (3.6*10-5;5.1*10-5) |
3.9*10-5 (3.3*10-5;4.3*10-5) |
0.02 | 0.91 |
| Lipids, Negative Ion Mode, GDM | ||||||||
| 299.0065 | - | - | - | 299.0065 | 0(0;5.6*10-5) | 7.5*10-5 (3.8*10-5;1.3*10-4) |
<0.001 | >10 |
| 295.2112 | - | - | - | 295.2112 | 2.3*10-4 (2.0*10-4;2.7*10-4) |
2.1*10-4 (1.8*10-4;2.3*10-4) |
0.001 | 0.88 |
| Clinical Parameters, GDM | ||||||||
| Maternal BMI, kg/m² | 21.1 (19.5; 23.0) |
23.3 (20.2; 27.1) |
0.003 | 1.10 | ||||
| Maternal birth weight, kg | 3.5 (3.2; 3.7) |
3.5 (3.3; 3.8) |
0.55 | 1.00 | ||||
| Macrosomia in history, n (%) | 9 (11%) | 7 (18%) | 0.52 | 1.40 | ||||
| Lipids, Positive Ion Mode, Macrosomia | ||||||||
| PG (i-, a- 29:0) | (M+H+ - H2O)+ | 0.001 | 663.4600 | 663.4591 | 7.0*10-4 (5.4*10-4;1.1*10-3) |
2.4*10-3 (2.0*10-3; 3.2*10-3) |
<0.001 | 3.44 |
| Lipids, Negative Ion Mode, Macrosomia | ||||||||
| 4-Hydroxybutyric acid | (M+HCO3-)- | 0.008 | 165.0400 | 165.0317 | 1.0*10-3 (4.3*10-4;1.5*10-3) |
3.3*10-3 (1.8*10-3; 3.9*10-3) |
<0.001 | 3.33 |
| 234.1434 | - | - | - | 234.1434 | 3.3*10-5 (0;5.2*10-5) |
1.0*10-4 (8.0*10-5;1.4*10-4) |
<0.001 | 3.22 |
| 174.9463 | - | - | - | 174.9463 | 1.1*10*10-3 (1.1*10-3;1.2*10-3) |
9.6*10-4 (9.1*10-5;1.0*10-3) |
<0.001 | 0.84 |
| 239.1149 | - | - | - | 239.1149 | 0(0;3.7*10-5) | 5.1*10-5 (4.4*10-5;6.7*10-5) |
<0.001 | >10 |
| 951.1787 | - | - | - | 951.1787 | 0(0;3.2*10-5) | 7.8*10-5(4.9*10-5;9.4*10-5) | <0.001 | >10 |
| Pantothenol | (M+HCO2-)- | 0.002 | 250.129 | 250.1309 | 5.5*10-4 (4.6*10-4;6.6*10-4) |
1.4*10-3 (1.1*10-3;1.7*10-3) |
<0.001 | 2.55 |
| 247.1564 | - | - | - | 247.1564 | 3.8*10-5 (0;6.2*10-5) |
9.0*10-5 (7.6*10-5;1.3*10-4) |
<0.001 | 2.38 |
| 374.2242 | - | - | - | 374.2242 | 7.6*10-5 (6.0*10-5;1.2*10-4) |
1.5*10-4 (1.2*10-4;1.8*10-4) |
<0.001 | 2.01 |
| 195.1282 | - | - | - | 195.1282 | 1.1*10-4 (9.6*10-5;1.4*10-4) |
1.7*10-4 (1.4*10-4;1.9*10-4) |
<0.001 | 1.45 |
| Clinical Parameters, Macrosomia | ||||||||
| Maternal BMI, kg/m² | 21.1(19.6; 22.5) | 23.4(20.2;26.7) | <0.001 | 1.13 | ||||
| Maternal birth weight, kg | 3.4(3.2;3.6) | 3.6(3.5;4.1) | <0.001 | 1.06 | ||||
| Macrosomia in history, n (%) | 2 (3%) | 14 (31%) | <0.001 | 2.80 | ||||
| Paternal birth weight, kg | 3.5(3.3;3.8) | 3.8(3.5;4.0) | 0.004 | 1.12 | ||||
Table 3.
Performance metrics of the final models for predicting pregnancy complications.
| Complication | Model | Sensitivity | Specificity | Accuracy | AUC | PPV | NPV | F-score |
|---|---|---|---|---|---|---|---|---|
| GDM | XGBoost | 0.87 | 0.89 | 0.88 | 0.88 | 0.80 | 0.93 | 0.83 |
| Macrosomia | Random Forest | 0.87 | 0.93 | 0.91 | 0.90 | 0.89 | 0.92 | 0.89 |
Disclaimer/Publisher’s Note: The statements, opinions and data contained in all publications are solely those of the individual author(s) and contributor(s) and not of MDPI and/or the editor(s). MDPI and/or the editor(s) disclaim responsibility for any injury to people or property resulting from any ideas, methods, instructions or products referred to in the content. |
© 2025 by the authors. Licensee MDPI, Basel, Switzerland. This article is an open access article distributed under the terms and conditions of the Creative Commons Attribution (CC BY) license (http://creativecommons.org/licenses/by/4.0/).
Copyright: This open access article is published under a Creative Commons CC BY 4.0 license, which permit the free download, distribution, and reuse, provided that the author and preprint are cited in any reuse.


