
Submitted:
06 July 2025
Posted:
07 July 2025
You are already at the latest version
Abstract
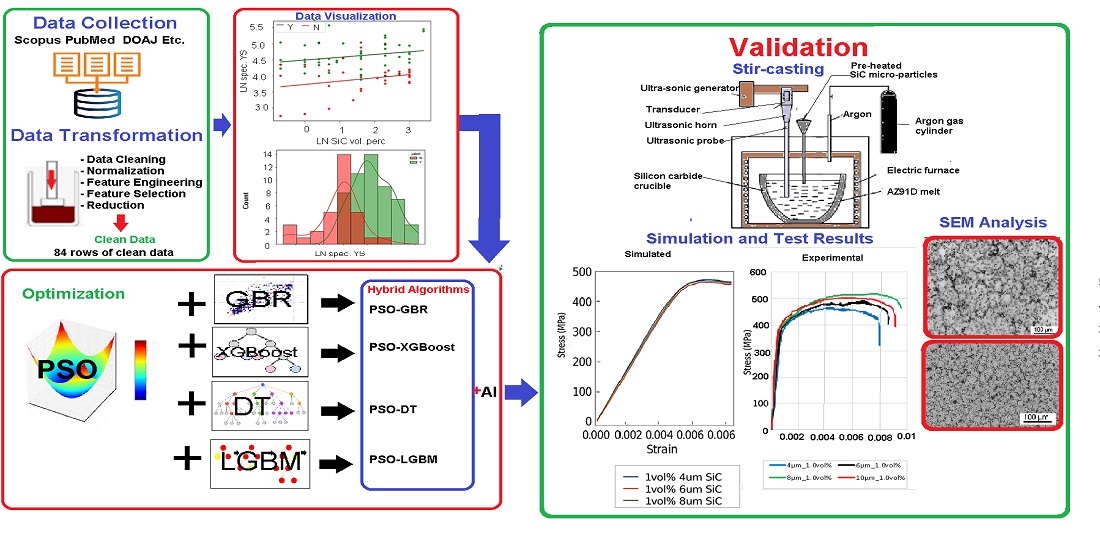
Ceramic reinforcements are known to improve mechanical properties of magnesium alloys. Modern research shows potential use of silicon carbide (SiC) in boosting strength and stiffness of the alloys. In this study, the influence of volume and size of SiC micro-particles in improving specific strength and modulus of AZ91D was examined. The research employed an optimization framework involving data collection from 65 scholarly articles, followed by cleaning, normalization, and feature selection. Dimensionality was reduced using a five-stage scheme. Hybrid machine learning algorithms employed were Particle Swarm Optimization-Light Gradient Boosting Machine (PSO-LGBM), PSO-XGBoost, PSO-Decision Tree (PSO-DT), and PSO-Gradient Boosting Regressor (PSO-GBR). Mechanical properties were simulated in SolidWorks 2020. Model performance was evaluated using accuracy, precision, recall, and F1-score. SiC-AZ91D composites were produced using stir-casting technique followed by machining and tested according to ASTM E8 standard. Tensile properties, density, and Young’s modulus were assessed. Microstructural analysis using SEM verified distribution of micro-particles and grain sizes. PSO-LGBM outperformed all models with perfect recall, highest F1-score and AUC, showing superior predictive accuracy and classification reliability. It was also found that increase of SiC particle size and volume was associated with improved yield strength and Young’s modulus. However, such increase resulted into decreased ductility.
Keywords:
explainable machine learning
; artificial intelligence
; magnesium alloy
; light-vehicle
; aerospace
; composite material
; material science
1. Introduction
The quest for materials that exhibit exceptional mechanical properties is a pivotal aspect of modern materials research [1,2,3]. Improvement of strength and stiffness of light metals is the focus of current research in light-vehicle and aerospace industries [4,5,6,7,8,9]. High strength magnesium alloys such as AZ91D have attracted attention of light-vehicle and aerospace material researchers who are concerned with improving their strength and modulus [10]. The challenge of achieving high modulus and strength in AZ91 alloys has not been substantively addressed in literature. Efforts to improve the properties using different alloying methods have limited effects on stiffness though some remarkable enhancement of strength can be achieved [11,12]. Recent studies have shown that introduction of ceramic particles improves both strength and elastic modulus of AZ91D [3,13,14]. Among the ceramics that are promising in achieving such improvements is silicon carbide (SiC) due to its high modulus and strength [15,16]. Various studies detail the influence of SiC contents on the microstructural evolution and mechanical behaviour of AZ91 composites [17,18]. Some studies focus on the development of AZ91 hybrid metal matrix composites with SiC micro and nano reinforcements [19,20,21,22,23]. Others focus on the fabrication, microstructure, and mechanical properties of reinforced hybrid composites using different processing approaches such as rotary-die equal-channel angular pressing (RD-ECAP) [24], stir casting, extrusion and electro-pulsing treatment (EPT) [16,21,25]. Ponhan et al. [26], Nie et al. [27] and Wang et al. [20] used pellet feeding and stir casting technique coupled with ultrasonic vibration. Xiao et al. [28] used reho-squeeze casting technique with varied calcium content in AZ91-1Ce-xCa alloys to enhance both strength and microstructure. Some researchers have also used friction stir processing coupled with other approaches such as Taguchi-Grey Relational Analysis [29,30].
Despite the extensive research and development efforts in SiC reinforced AZ91, there remains a research gap in achieving the desired modulus and strength levels. Particularly, research has not focused on improvement of specific strengths and modulus. Specific strength and modulus are important factors in light vehicle and aerospace industries in achieving high performance per unit weight and minimization of carbon footprint through weight reduction [12]. Recent studies suggest a variation in the percentage composition of SiC particles (SiCp), typically recommending a range of 5-20% by volume, with particle sizes between 5-10 microns [3,24,31]. However, the modulus achieved is still considered low, even with the application of various casting and extrusion methods. Also, increase in SiC composition beyond certain levels compromises strength of the composite. Traditional composite design approaches have failed to effectively address the problems of achieving high specific strengths and modulus across different SiC-AZ91 compositions and properties [32]. These challenges open the door to exploring advanced techniques, such as machine learning approaches and evolutionary computation, to optimize the composite structure [33,34,35]. Recent publications indicate that particle swarm optimization is promising in predicting and enhancing the properties of the composites [11,33,36,37,38]. Hybrid algorithms can yield better results as confirmed in literature [33,39]. Particle swarm optimization has been widely applied in design of composites of ceramics and alloys for high strength and corrosion resistance [40,41,42].
This research proposed a novel hybrid algorithm of particle swarm optimization coupled with Light Gradient Boosting Machine (PSO-LGBM) and explainable machine learning (EML) as part of explainable artificial intelligence (XAI). PSO-LGBM was able to handle sparse features. Its Gradient-based One-Side Sampling (GOSS) and Exclusive Feature Bundling (EFB) techniques allowed it to focus on the most informative instances during training, boosting its speed and accuracy. PSO-LGBM employs Bayesian optimization techniques to efficiently search the hyperparameter space and identify the most promising configurations. It was able to efficiently handle categorical features and had capability to discretize continuous features into histogram bins, making it a robust choice for small dataset. EML used accumulated local effects (ALE), Shapley additive explanations (SHAP) and local interpretable model-agnostic explanations (LIME). ALE was used to identify the importance of each feature by showing how changes in feature values affected PSO-LGBM predictions. SHAP provided insights into how different features affected output of the predictions. LIME was used to provide interpretable explanations of individual predictions to provide insights into why a specific prediction was made for particular data points. The performance of the proposed algorithm was compared with three algorithms, two of which were proposed by [33]. The two were particle swarm optimization coupled with decision trees (PSO-DT) and particle swarm optimization coupled with gradient boosting regressor (PSO-GBR). The third algorithm was PSO-XGBoost that has ability to efficiently build ensembles of weak predictive decision trees into strong model iteratively. SiC/AZ91D was produced using stir casting technique with ultrasonic vibration for even distribution of SiC micro-particles within the magnesium matrix. Experimental observations of tensile and microstructural behaviour of the composites at various percentages and sizes of SiC micro-particles in AZ91D matrix made up the dataset for the study. The other novelty of the research was that it sought to optimize four factors simultaneously: particle size, composite percentage volumetric composition across samples, its average metal matrix grain sizes and density.
2. SiC Particle Reinforced AZ91 Composites
The presence of SiC particles in matrix of alpha-Mg often leads to the formation of new phases at the particle-matrix interfaces [13]. The phases act as barriers to dislocation movement, thereby increasing the strength of the material. The size, distribution, and volume fraction of SiC particles are key factors that influence the microstructural characteristics and, consequently, the mechanical properties of the SiC/AZ91 composites [21,22,24]. Fine SiC particles contribute to homogeneous distribution of phases which correlates with superior mechanical performance [2,24].
Matta et al. [13] reviewed literature on recent particulate reinforcement of magnesium alloys and found that stir casting is commonly used to enhance mechanical properties of molten AZ91 with SiCp. The technique ensured a uniform dispersion that enhanced the strength of the SiC/AZ91 composite. Ponhan, et al. [26] incorporated master pellet feeding technique combined with ultrasonic vibration in stir casting. The approach further refined the microstructural evolution and mechanical behaviour of the composites. Properties studied include tensile and compression [3,21,24], compression, wear or tribological behaviour [2,14,29,34,43] and corrosion resistance [15,44].
Lu et al. [3] utilized semisolid injection moulding to manufacture SiC particles reinforced Mg matrix composites, achieving high strength and toughness. The process resulted in composites with tensile strength up to 10% higher than that of AZ91D and 18% higher than composites with 1 wt% SiCp. Furthermore, the tribological behaviour of AZ91D composites at room and elevated temperatures was investigated by [14], who found that the addition of ultra-high-temperature ceramic particulates, including SiC, improved wear resistance. The particle size of SiC used in these studies typically ranged from 1-3 μm, with volume percentages varying according to the specific requirements of the composite’s intended application. Chen et al. [45] demonstrated that the incorporation of a high volume fraction of SiC particles into a Mg–6Zn–1Gd–0.3Ca matrix composite significantly improved the modulus, thermal expansion coefficient, and wear resistance. This enhancement was attributed to the inherent stiffness and strength of SiCp. Zhang et al. [46] further corroborated these findings by showing that the strength and ductility of as-extruded AlN/AZ91 composites could be simultaneously enhanced through nano-precipitation and pyramidal slip mechanisms. The addition of SiC particles facilitated these processes by providing nucleation sites for nano-precipitates and altering the slip behaviour of the matrix material. The enhancement in mechanical properties can be directly attributed to the presence of SiC particles. The SiC particles contribute to the overall performance of the composites by improving their structural integrity and resistance to deformation under stress.
Guo et al. [16] reported enhanced tensile properties in Mg–3Y magnesium alloy due to the SiC particles addition. Deng et al. [19] and Wang et al. [20] observed that the microstructure of SiC/AZ91 composites underwent significant evolutions during hot compression, leading to improved elevated tensile properties. Emadi et al. [47] explored the strengthening effects of SiC/Al nanocomposite extrusion on a Mg-Al-Zn-Mn alloy, revealing that the dispersion of SiC particles within the metal matrix could effectively enhance yield strength and UTS. The uniform distribution of SiC particles plays a critical role in hindering dislocation movement, which is a key factor in the deformation process of metallic materials. Xu et al. [24] reported that the RD-ECAP processing of SiC/AZ91 composites led to an increase in yield strength to 306 MPa after 4 passes, with ductility also increasing to 6.4%. The associated elastic modulus was 47.81GPa, a slight increase from 45GPa in AZ91D. Du et al. [22] prepared SiC/AZ91 magnesium matrix laminar materials and found ultimate compressive strength (UCS) of approximately 622 MPa, indicating a significant enhancement compared to the monolithic AZ91 alloy. According to [14] addition of SiC particles assisted by dynamically precipitated Mg17Al12 phase increased the yield strength of SiC/AZ91 composites to about 348 MPa and improved ductility with an elongation of approximately 6.3%. The associated elastic modulus was 55GPa, representing a 22.2% improvement of monolithic AZ91 alloy. Nasker and Mondal [48] also contributed to this field by evaluating the microstructure and mechanical properties of Mg-5.0Al-2.0Ca-0.3Mn alloy with added SiC nanoparticles. The percentage composition of the SiC nanoparticle reinforcement in the composites were in the range of 0.5-3.0wt%. Yield strength was in the range of 80-130MPa, ultimate tensile strength (UTS) ranged between 110-180MPa and elongation in the range of 1.2-3.2% as contents of SiC nanoparticle increased from 0-2.0wt%. Young’s Modulus was in the range of 40.63-66.7MPa. They noted that the alloy had a marked improvement in strength but slight enhancement of elastic modulus.
Variation of percentage composition and size of SiC micro-particles reinforcement in AZ91 alloys have been found to affect mechanical properties and microstructure of the composites. Deng et al. [19] fabricated 1.5 vol.% submicron-SiC/AZ91 of particle size of 0.2 μm using both forging and extrusion. They found that hot forging and extrusion resulted into fine grains of ∼3 μm. In an earlier study, [49] fabricated six different volume percentages of SiC/AZ91 in the range of 0.5-5% of 0.2 μm SiC particles content using stir casting technique followed by forging. They found that yield strength, elastic modulus and UTS increased as SiC content varied from 0.5-2vol%. However, beyond 2vol%, there was decrease of the mechanical properties. Zhu et al. [11] took a novel approach by employing a machine learning algorithm to design magnesium-based composite materials with a high elastic modulus. Their study suggests that the strategic placement and percentage composition of SiCp, as determined by predictive modelling, can lead to significant improvements in Young’s Modulus without compromising elongation.
Though the studies contributed to enhanced strength and ductility of the SiC/AZ91 composites, they did not lead to remarkable improvement in elastic modulus. Research shows that the use of SiC micro-particles enhances tensile and microstructural properties of SiC/AZ91composites, but there is no clear simultaneous relationship between particle size, composite density and volume composition of SiC and tensile properties of the composites. Studies have not found the combined or simultaneous effects of the factors on specific tensile properties and microstructure of SiC/AZ91. Optimization approaches available in literature focus on one of the items at time; being size versus the properties, percentage composition by volume and the properties. No previous work on SiC/AZ91 composite has focused on optimization of specific yield strength, UTS and modulus.
3. Materials and Methods
3.1. Optimization Framework
Figure 1 illustrates the optimization framework. It details data collection, cleaning and transformation. This was followed by dimensionality reduction and multicollinearity test. Optimization was done through modelling and simulation of mechanical properties in SolidWorks 2020 while machine learning prediction was carried out in Python. The results were compared and the process of modelling, simulation and machine learning was iterated with tuned parameters.
3.2. Collection and Selection of Data
Data was collected from 65 Scopus, PubMed, Web of Science, Engineering Index (EI) Compendex and Directory of Open Access Journals (DOAJ) indexed publications on the topic area within the period of 2010 and 2024. Data cleaning was carried out by handling missing values and correcting errors to improve the quality and accuracy of the data. Data transformation process followed. It included normalization of data that brought it within a specific range for each mechanical and physical property suitable for the intended algorithms. Normalization helped in improving the learning process of the algorithms and boosting model accuracy by avoiding vanishing or exploding gradients. Dimensionality reduction through feature selection was used to select a subset of specific relevant features for use in model construction. A five-stage feature selection scheme similar to that developed by [12] was used to reduce dimensionality of the data. Such features included specific strength and modulus drawn from other original features. Clean data was drawn from a total of 23 articles. Out of these, four articles were published in the period of 2010-2015, seven in the period of 2016-2020 and the rest between 2021 and 2024. Six articles were published in 2024. The resulting dataset was composed of 84 rows of data and 15 columns. A total of 12 features were obtained, out of which eight original features were drawn from literature and four were calculated. The light vehicle and aerospace features were finally reduced from 12 to 9. The eight original features included production technique (Treatment), percentage composition by volume of SiC particles (SiC_vol_perc), size of the particles in micrometres (SiC_size_um), average grain size of the metal matrix in the composite in micrometres (av_grain_um), yield strength in MPa (YS_MPa), ultimate tensile strength in MPa (UTS_MPa), Young’s Modulus in GPa (E_GPa) and percentage elongation at fracture (total_perc_elong). Four light vehicle and aerospace specific features were derived from the existing features using feature engineering techniques. These were calculated density in g/cm3 (Density_gcc), specific strength at yield in kNm/kg (spec_YS), specific strength with UTS in kNm/kg (spec_UTS) and specific modulus in MNm/kg (spec_E). A feature named obj was introduced as geometric mean of the product spec_YS, spec_UTS and spec_E divided by density. The difference between obj obtained from experimental values from literature and those of log-linear regression was obtained for each row of data. Differences that exceeded three standard deviations from mean difference were indicated as not meeting threshold and labelled as ‘N’ and the rest as ‘Y’. The first column of data was the ID, indicated as serial numbers of rows of data. The next column was obj containing categorical variables of ‘Y’ and ‘N’. Natural logarithm of the rest of the columns of independent variables of SiC_vol_perc, SiC_size_um and av_grain_um followed. Natural logarithm of dependent variables Density_gcc, YS_MPa, UTS_MPa, total_perc_elong and E_GPa were in subsequent columns.
Density was calculated based on percentage composition by volume of AZ91 and SiC micro-particles used. Equation (1) illustrates the feature engineering formula for density.
Where,
= Density of composite, represented as Density_gcc in dataset;
= Percentage composition by volume of SiC micro-particles, represented as SiC_vol_perc in dataset;
= Density of SiC micro-particles, average of 3.21g/cm3 was used in the calculations [50];
= Density of AZ91 used, an average of 1.81g/cm3 was used in the calculations [51];
Specific strength at yield, , was calculated based on composite density and yield strength as illustrated in Equation (2).
Where,
= Yield strength, represented as YS_MPa in dataset.
Similarly, specific strength with UTS, , was calculated based on composite density and UTS as illustrated in Equation (3).
Where,
= Ultimate tensile strength, represented as UTS_MPa in dataset
Equation (4) illustrates the formula used in finding specific modulus, , represented as spec_E in dataset.
Where,
= Young’s modulus, represented as E_MPa in dataset
Multicollinearity test in the dataset was carried out using the Variance Inflation Factor (VIF). First, a multiple linear regression model was fitted with spec_E as the dependent variable and the other eight variables as predictors. VIF value for each variable was calculated to quantify how much the variance of the estimated regression coefficient increased due to collinearity. VIF value of above 10 could indicate a significant multicollinearity issue, while values below 5 were acceptable [52]. Any variable with VIF of 5 and above was either combined with others or removed [52,53]. The process was iterated until the VIF values for all variables in the model were at acceptable levels, ensuring the reliability of the results. The final dataset with acceptable variables was used for further analysis.
3.3. Modelling of Tensile Properties
The relationship between specific modulus, percentage by volume of SiC micro-particles, particle size and grain size of metal component of the composite was modelled using log-linear regression. Equation (5) illustrates the relationship.
Where,
= Grain size in micrometres;
= Size of SiC micro-particles in micrometres;
= Regression constant;
= Beta coefficient of in the log-linear regression
= Beta coefficient of ;
= Beta coefficient of ; and
= Error term.
Specific modulus was then defined as shown in Equation (6).
Where,
= Constant equal to .
Specific strength at yield was also obtained from log-linear regression as shown in Equation (7).
Where,
= exponent of regression constant of the log-linear regression
= Beta coefficient of in the regression model;
= Beta coefficient of in the regression model; and
= Beta coefficient of in the regression model.
Specific strength with UTS was also obtained from log-linear regression as shown in Equation (8).
Where,
= exponent of regression constant of the log-linear regression
= Beta coefficient of in the regression model;
= Beta coefficient of in the regression model; and
= Beta coefficient of in the regression model.
At yield, strain, , was expressed as shown in Equation (9).
Substituting Equation (6) and 7 into Equation (9), strain at yield was expressed as shown below.
Using a similar approach, total percentage elongation, , was modelled as illustrated in Equation (11).
Where,
= exponent of regression constant of the log-linear regression
= Beta coefficient of in the regression model;
= Beta coefficient of in the regression model; and
= Beta coefficient of in the regression model.
3.4. Optimization and Performance Evaluation
Four algorithms PSO-LGBM, PSO-XGBoost, PSO-DT and PSO-GBR were used. The proposed PSO-LGBM was used because of its robustness and Tree-structured Parzen Estimator (TPE) that systematically navigates and optimise the hyperparameter space of the model [54,55]. The cross-validation aspect of the PSO-LGBM algorithm helped to mitigate overfitting and effectively handled the complex relationships and non-linearities that were present within and across features in the dataset [55]. PSO-DT was selected due to its capability of finding optimal split criteria and tree depth to minimize error. It helped to improve convergence rates and solution quality as well as handling of non-linear relationships in the dataset. The PSO-DT algorithm had low sensitivity to the scaling of features and reduced the need for manual parameter tuning [33]. PSO-GBR algorithm was used due to its efficiency and insensitivity to feature scaling. The hybrid algorithm addressed the limitations of PSO, such as premature convergence and trapping in local optima. The gradient boosting regressor iteratively corrects the errors of a weak learner, leading to improved model performance of PSO [33].
The dataset was split into 80% for training and 20% for testing. PSO-LGBM was implemented in Python by initializing the PSO with a population of candidate solutions. The hyperparameters of the PSO-LGBM model were then iteratively optimised. EML/XAI was utilized using ALE and SHAP as was proposed by [56]. Additionally, LIME was used to provide human interpretable explanations of effects of SiC volume percentage, particle size and metal matrix grain size on model output. Similarly, PSO-DT, the PSO was used to select the optimal set of decision tree parameters. The PSO-GBR algorithm followed a comparable procedure where PSO was optimized with gradient boosting regressor.
Performance metrics were calculated as using accuracy, precision, recall and F1-score based on how they predicted the 21 rows of the test data. Accuracy was used to measure the overall correctness of the algorithms. Precision evaluated the ability of the algorithms to classify positive instances correctly. Recall identified all relevant instances while the F1-score was particularly important because it provided a balance between precision and recall [12].
Accuracy, , was expressed as shown in Equation (12).
Where,
TP = True Positives, occurred when model correctly predicted that a value fell within the acceptable range;
TN = True Negatives, occurred when model correctly predicted that a value did not fall within the acceptable range;
FP = False Positives, occurred when model incorrectly predicted that a value fell within the acceptable range when it actually did not; and
FN = False Negatives, occurred when model incorrectly predicted that a value did not fall within the acceptable range when it actually did.
Precision, , was calculated as shown in Equation (13).
Recall, , was determined as illustrated in Equation (14).
The F1 score, the harmonic mean of precision and recall, was computed using Equation (15).
3.5. Simulation of Mechanical Behaviour
Tensile test-piece conforming to ASTM E8M standard was modelled in SolidWorks 2020. The overall length of the modelled test-piece was 150mm, thickness was 5mm, gauge length was 50mm and width of 12.5mm was used. Composite material was defined based on theoretical yield strength, UTS, density, Young’s Modulus and volume percentages of AZ91D and SiC. Loadings were defined in accordance with ASTM E8M standard. Upper end of the test model was fixed and the other end was displaced. Adaptable meshing scheme was implemented after custom material definition. Fixtures, connections and loadings were added and the non-linear simulation model was run.
3.6. Production and Validation of Tensile Properties
Matrix of the proposed composite was AZ91D magnesium alloy obtained from Qingdao Hengyuan Machine Company Limited. AZ91D was selected due to its high strength, low density and good corrosion resistance. About 200g of AZ91D alloy was melted at 720 °C in argon gas protective atmosphere using electric coil furnace as recommended by [27]. The melt was cooled to a temperature of 590 °C when it became semi-solid. SiC micro-particles were preheated to 550 °C and added into the melt [27]. Stirring at 300 rpm coupled with ultrasonic vibration was done in accordance with guidelines of [57]. Ultrasonic vibration equipment with speed of 400 rpm, power of 20 kW ultrasonic was used to enhance mechanical stirring technique in order to prevent formation of SiC micro-particle clusters by reducing stir time [57,58].
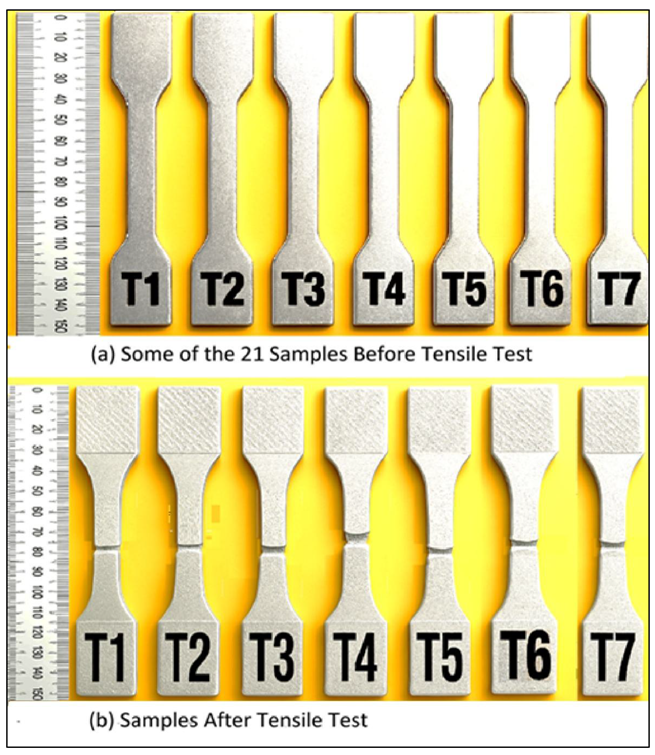
SiC micro-particles of average diameters 4 μm, 6μm, 8μm and 10μm were selected as the reinforcement. 4 μm 1 vol% SiC/AZ91D magnesium matrix composite was the optimal sample in the current study based on the optimization results. The researchers also fabricated the optimal composite as well as three more with different volume percentages of 1.0 vol%, 1.5 vol% and 2.0 vol% with average diameter of SiC micro-particles of 4 μm. Specifically, they were 4 μm 1.0 vol% SiC/AZ91D, 4 μm 1.5 vol% SiC/AZ91D and 4 μm 2.0 vol% SiC/AZ91D. In order to study effects of variation of particle sizes, three more composites of sizes 6μm, 8μm and 10μm were produced. These were 6 μm 1 vol% SiC/AZ91D, 8 μm 1 vol% SiC/AZ91D and 10 μm 1 vol% SiC/AZ91D. From each of the six composites, three test-pieces for tensile test were produced, totalling to 18 test-pieces. A set of three control test-pieces were made from the AZ91D with no added SiC micro-particles. The test-pieces were numbered T1, T2, T3 upto T21. Appendix A.1 illustrates some of the test-pieces before and after tensile tests.
Prior to testing, density of each of the test-pieces was determined using Archimedes principle. Tensile tests were carried out based on ASTM E8M standard that conforms with ISO units. Strain rate control of the universal testing machine (UTM) was kept at 0.015 ± 0.006 mm/mm per minute within the ASTM E8M defined tolerance range of 40% for stable speed control. Characteristic values that were determined included yield strength, UTS and percentage elongation. Young’s modulus for each test-piece was calculated from the linear regions of the stress-strain graphs. Specific strength at yield and with UTS as well as specific modulus were calculated based on results of tensile tests and density.
3.7. Microstructural Examination
Samples for SEM analysis of dimensions 20mm by 20mm by 5mm were produced from each of the six categories of the composites, representing variations in %vol and sizes of SiC micro-particles. Control sample from AZ91D without SiC micro-particles was also produced. The samples were prepared by sectioning and mounting, followed by polishing to obtain flat, smooth surfaces suitable for examination. They were coated with gold to prevent charging under the electron beam. They were then bombarded with high-energy electrons to form images. Grain size and phase analysis was done using ASTM E112 standard in Olympus Stream and Metkon MetExpert tools. Image segmentation was carried out and average matrix grain sizes and SiC micro-paricle sizes were estimated.
4. Results and Discussions
4.1. Results of Exploratory Data Analysis
The variance inflation factors (VIF) in Table 1 suggested that there was a low to moderate multicollinearity between the features, which is not uncommon in composite materials data. The PCA results indicated that the first principal component (PC-1) did not strongly correlate with the target variable that combined specific strengths, specific modulus and density. This implied that the variation in SiC volume percentage and size, as well as average grain size, did not significantly affect the mechanical properties and density. However, PC-2 showed a strong positive correlation with the properties, suggesting that one or a combination of the independent variables could be a good predictor. The explained variance indicated that nearly half of the variability in the dataset could be attributed to the significant variations in SiC volume percentage. Shapiro-Wilk test of normality showed that the variables were not normally distributed possibly as a result of non-random dataset caused by variability in material processing, the distribution of SiC particles within the matrix, and the complex interactions between the SiC micro-particle reinforcement and the AZ91 matrix material. Scatter plots and Histograms in Figure 2 illustrate the distributions.
Ordinary least squares regression of target variable with independent variables in Table 1 indicated that SiC volume percentage positively and significantly influenced composite density, specific strengths and modulus.
Metal matrix grain size had positive but insignificant effects on the properties. However, the results showed that SiC particle size had significant negative relationship with the properties. This suggested that smaller SiC particles had a higher surface area-to-volume ratio that enhanced precipitation hardening than larger particles. Durbin-Watson statistic was 0.662, suggesting some autocorrelation in the residuals. Omnibus test had a probability of 0.850, indicating that the residuals were normally distributed. Jarque-Bera test also supported the normality of residuals with probability of 0.782. Condition number was 9.52, that did not indicate multicollinearity issues. Results of ANOVA showed that both the size and volume percentage of SiC particles, along with the metal matrix grain size, were critical factors in determining the mechanical properties of the AZ91 alloy. However, the residual values indicate that there could be other variables not accounted for in the model that could influence the results.
4.2. Results of Optimization and Performance Evaluation
The results of performance of algorithms in Table 2 showed that PSO-LGBM achieved the highest accuracy of 88.2%, followed by PSO-DT and PSO-XGBoost both at 82.4%. PSO-GBR had lowest accuracy 76.5%. The accuracy of PSO-DT was higher than that of PSO-GBR contrary to findings of [33] possibly due to difference of dataset and materials in both cases. PSO-DT and PSO-XGBoost were the fastest with about 12.56 seconds and 25.55 seconds, respectively, followed by PSO-LGBM at 41.87 seconds. PSO-GBR was considerably slower taking over six minutes. Therefore, PSO-LGBM was the most promising model for this specific dataset since it balanced strong accuracy with a relatively fast execution time. PSO-DT, while slightly less accurate, offered a significant speed advantage.
The results showed that all models had high precision of 83.3% indicating that they were highly reliable in their positive predictions, with a low rate of false positives. PSO-LGBM had a perfect recall of 100%, capturing all actual positive instances, minimizing false negatives. This was crucial in identifying all cases of a mechanical and microstructural properties. Both PSO-DT and PSO-XGBoost followed with a recall of 90.9%.
PSO-LGBM achieved the highest F1-score of 90.9%, followed by PSO-XGBoost and PSO-DT both at 86.95% and PSO-GBR at 83.3%. PSO-LGBM demonstrated the strongest balance between precision and recall, indicating its overall effectiveness in correctly classifying instances. According to results in Figure 2, PSO-LGBM had the highest AUC score of 0.92, followed by PSO-DT and PSO-XGBoost at 0.82, and PSO-GBR at 0.72. This confirmed that PSO-LGM had the best ability to distinguish between positive and negative instances, suggesting greater reliability in making predictions.
PSO-LGBM consistently ranked among the best performers in all metrics, demonstrating strong accuracy, precision, recall, F1-score, and AUC score, while maintaining a relatively fast execution time. PSO-DT offered a good compromise between accuracy, F1-score, and execution time, especially where speed could be a primary concern. PSO-GBR could be considered for tasks where precision is more important than recall, although it had low overall F1 and AUC scores. PSO-XGBoost, while it was relatively fast, it lagged in precision, recall, F1-score, and AUC score compared to the top performers.
The optimization of parameters yielded significant results as shown in Table 3. The optimal SiC volume percentage was slightly above 1%, that suggested a minimal but effective reinforcement. This could enhance the mechanical properties of the composite without compromising its density and was within the range recommended in literature. Optimal density was 1.847993 g/cm3 well below the values found in previous research. Optimal size of SiC particles was 4.21µm and the optimal average grain size was 9.58 µm. These values were well within the range that typically improves the mechanical properties of metal matrix composites. The specific YS and UTS were considerably high, at 235.38 kNm/kg and 282.77 kNm/kg, respectively. They were indicative of the ability of the composite to withstand applied stresses without yielding or breaking in light vehicle and aerospace applications. The total percentage elongation at 0.80% reflected the low ductility of the composite. The specific modulus of 56.19 MNm/kg aligned with the expected stiffness of the material, balancing rigidity with flexibility. The values of optimal YS and UTS were found as 434.97 MPa and 522.56 MPa, respectively, significantly higher than those of typical AZ91D.
The optimal modulus of elasticity was 103.85 GPa indicated a material that was stiff yet not overly brittle. These optimized parameters suggested a composite material that was robust and suitable for high-performance applications in light vehicle and aerospace industries.
Results in ALE and SHAP plots were as shown in Figure 3. SHAP plots illustrate that high values of UTS, YS, E, SiC particle size, and elongation positively influenced the output of PSO-LGBM model. Low composite density and SiC volume percentage also had a positive influence, suggesting optimal balance between reinforcement and matrix properties, indicating suitability for aerospace and light-vehicle application. Conversely, average metal matrix grain size and treatment techniques showed no significant effect on the output. Larger SiC particles contributed to larger nucleation surfaces and bigger strengthening precipitates. This enhanced YS, UTS and E. Variation of treatments showed that specific techniques used did not significantly affect the model output. ALE plots in Figure 3 showed that metal matrix grain sizes had no significant influence on the predicted material properties. The plots also showed that SiC volume below 0.545% had no significant influence on model output while higher volumes had significant negative effects. The plateau nature of ALE plot showed that increasing SiC volumes beyond 1.064% neither aggravated nor improved the effects on desired material properties. Also, very small SiC particles had little to no influence. Both ALE and SHAP analyses revealed an optimal SiC particle size and volume percentage ranges for enhancing properties. While very small particles below 1µm had minimal impact, mid-sized particles ranging between 1 µm and 1.65 µm improved performance. Excessive size beyond 1.65 µm led to saturation, likely due to agglomeration, hindering further grain refinement or dispersion strengthening. Results of impact of metal matrix grain size with ALE was consistent with findings with SHAP.
Results of LIME table in Figure 4 showed that the PSO-LGBM model could predict local effects relating to desired mechanical properties with probability of 71% and undesired ones with probability of 29%. Variation of SiC particle size from 0.657 µm to 1.01 µm (from to ) was associated with enhanced mechanical properties (specific strengths and modulus). Variations of SiC volume percent from 1.0618% to1.9155% (from to ) and of average metal matrix grain size from 2.075µm to 2.508µm also led to similar results.
Results of optimization showed acceptable ranges of parameters across analysis techniques. SiC volume percentage was in the range of 1.0618% to 1.064%. SiC particle sizes were in the range of 1 µm to 1.65 µm. Acceptable metal matrix grain sizes were in the range of 2.075µm to 9.58µm.
4.3. Results of Simulation of Mechanical Behaviour
Results in Table 3 illustrates the relationship between the SiC particle size and volume percentage with the mechanical properties. As the SiC particle size increased from 4 µm to 10 µm at a constant volume percentage of 1%, there was an increase in yield strength, from 435 MPa to 448 MPa, and an increase in E, from 107.61 GPa to 110.57 GPa. UTS also generally increased with increase of particle size. This showed that larger SiC particles contributed to a stiffer composite material as suggested by [14,24,48] .
Table 3 also shows that increase of SiC volume percentage at constant the particle size of 4 µm was associated with increase in yield strength from 435 MPa to 501 MPa. UTS increased as volume increased from 1.0% to 1.5% but dropped at 2.0%. There was also a remarkable increase in E from 107.61 GPa to 122.66 GPa. The trend was consistent with research findings that show mechanical properties of composites improve with increasing SiC percentage volume of particles [13]. The simulation results align with the general understanding that the addition of SiC particles to a magnesium alloy matrix can significantly improve the stiffness and strength of the composite as found by [14]. The findings on total percentage elongation showed that there was general decrease in ductility as SiC particle size increased contrary findings of [14] and [24]. This could be because of differences in processing methods. As size of SiC particles increased, the composite became more rigid and less able to absorb energy through plastic deformation resulting into rigidity and decrease in ductility. Figure 5 illustrates stress-strain curves of the composites. The graphs confirm that there was improvement in yield strength and UTS with increase in SiC particle size and volume percentage.
The predicted optimal density with 1vol% and 4µm SiC micro-particle size was found as 1.847993 g/cm3. The predicted specific strength at yield is 235.376 kNm/kg, suggesting a high capacity to resist deformation under initial loading. Moreover, at ultimate tensile stress, the predicted specific strength rises to 282.771 kNm/kg.
4.4. Results of Validation of Tensile Properties
Figure 6 illustrates variation of stress with size of SiC micro-particles. The stress–strain curves showed that increasing the SiC particle diameter from 4 µm to 10 µm at a constant 1 vol % led to systematic enhancements in yield strength, rising from 361.22 MPa to 398.07 MPa. The ultimate tensile strength inincreased from 466.59 MPa at 4 µm, peaked at 516.69 MPa for 8 µm particles, and then marginally declined to 502.87 MPa at 10 µm. This reflected an optimum reinforcement size for maximum tensile resistance. Young’s modulus increased steadily from 109 GPa at 4 µm to 125 GPa at 10 µm. There was progressive stiffening with coarser particles. Elongation at failure initially improved from 0.80 % to 0.95 % as particle size grew to 8 µm but then slightly fell to 0.91 % at 10 µm, suggesting a subtle trade-off between strength and ductility at larger reinforcements.
The stress–strain curves in Figure 7 illustrates that increasing the SiC volume fraction from 1.0 vol % to 2.0 vol % at a fixed 4 µm particle size improved the strength and stiffness of the composite. However, it slightly enhanced ductility. At 1.0 vol %, the composite yielded at 361.22 MPa and reached UTS of 466.59 MPa. It also exhibited an elastic modulus of 109 GPa, and fractured at 0.80 % elongation. When the volume fraction rose to 1.5 vol %, yield strength increased to 385.41 MPa and UTS to 542.60 MPa. Young’s modulus of 121.83 GPa and elongation of 0.95 % were also achieved at the volume percentage. Further boosting SiC content to 2.0 vol % raised yield to 400.95 MPa and UTS to 563.33 MPa. It also elevated the modulus to 125 GPa, and elongation to 0.97 %. The results indicated that particle networks formed more effectively at higher SiC volume percentages. This enhanced load transfer and resistance to deformation. The modest increase in ductility suggested that crack propagation continued to undergo significant deflection, maintaining a complex fracture morphology despite the increased reinforcement. Appendix A2 illustrates mechanical properties that were obtained from tensile tests.
Experimental value of average density of the composite at 1.0vol% and 4µm SiC micro-particles was 1.790 g/cm3 lower than the predicted density was 1.847993 g/cm3. Experimental values of specific strengths at yield and UTS were 201.772 and 260.630 kN·m/kg, respectively. This was lower than the predicted values possibly due to idealized assumptions of uniform dispersion and flawless interfacial bonding. Conversely, the predictive model underestimated the specific modulus, with the model yielding 56.194 MN·m/kg versus the measured sample average of 60.886 MN·m/kg. This was possibly due to enhanced matrix stiffness or superior particle–matrix load transfer in the actual specimens.
A comparison between SolidWorks simulations and experimental results in Appendix A.3 showed that simulations tended to overpredict yield strength and Young’s modulus. Across all 1 vol % cases of varying sizes of SiC micro-particles, simulated yield strengths exceeded experimental values by roughly 12–25 %, and ultimate tensile strengths by 1–12 %. The simulated elastic moduli were within ±3 % of the test results. This indicated good accuracy in stiffness prediction. Simulations also slightly overestimated elongation at low SiC volume fractions (1 vol %, by up to 10 %). These findings suggest that increasing SiC particle size and volume fraction improved both yield strength and UTS at the cost of marginal stiffness reduction, without compromising formability.
The predictive model for optimal properties at 1 vol% and 4µm SiC slightly overestimated yield strength. It forecast it at 434.97 MPa versus the experimental value of 361.22 MPa, an absolute error of 73.75 MPa (20.4 % in percentage error). UTS was likewise overpredicted by 55.97 MPa. In contrast, the predicted Young’s modulus of 103.85 GPa was slightly lower than the experimental value 109.00 GPa by 5.15 GPa (–4.7 %). Total elongation was essentially exact, with a predicted 0.8015 % versus 0.80 %, yielding an error of only 0.19 %. The fidelity of the prediction model was strongest for ductility, acceptable for stiffness, and weakest for strength parameters, resulting in a mean absolute percentage error of 9.83 %.
4.5. Results of Microstructural Examination
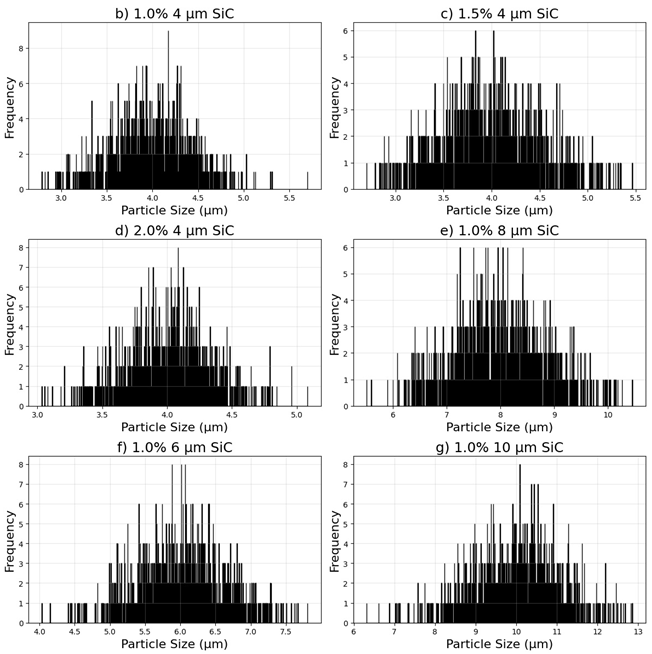
Figure 8 illustrates SEM micrographs of as cast AZ91D as well as SiC/AZ91D composites. Analysis of the SiC particle size distribution histograms for composites related to microstructure were as presented in Appendix A.4. SiC micro-particles in Figure 8(b)–(d) exhibited well-defined Gaussian peaks centered around 4 µm. Each featured a relatively narrow standard deviation of approximately 0.4 µm. In contrast, the 6–10 µm SiC composites for samples in Figure 8(e)–(g) presented broader distributions whose mean values aligned closely with their nominal particle sizes. They displayed larger spreads, with standard deviations on the order of 1 µm.
The microstructure of the as-cast AZ91D in Figure 8(a) revealed dendritic α-Mg with sparse nucleation sites. In contrast, the 1.0–2.0 % 4 µm SiC micro-particle reinforced AZ91D composites Figure 8(b)–(d) exhibited uniform heterogeneous nucleation on the SiC surfaces. This drove progressive grain refinement as the reinforcement content increased. Composites reinforced with larger SiC micro-particles of size 6–10 µm in Figure 8(e)–(g) displayed fewer active nucleation sites per unit volume. It meant that there was localized grain refinement near the micro-particulates and only modest overall grain size reduction. Composites with upto 2.0 % SiC micro-particles and of size 4 µm achieved optimal strength by balancing particle density and grain refinement. Larger SiC particles in the Figure 8(e)–(g), however, tended to act as stress concentrators, slightly reducing the UTS compared to the ones with 4 µm SiC micro-particles.
5. Conclusions
The study demonstrated the effectiveness of incorporating SiC micro-particles in enhancing the mechanical performance of AZ91D magnesium alloys. By varying both the size and volume percentage of SiC, specific strength and stiffness were significantly improved. The application of a structured optimization framework, combined with hybrid machine learning algorithms, enabled accurate prediction and interpretation of material behaviour. Among the models applied, PSO-LGBM consistently outperformed others. It exhibited exceptional recall, F1-score, and AUC values, validating its robustness for predictive modeling in materials science. Experimental validation further confirmed simulation results. Experimental specific strengths and modulus were found to be close to simulated values. It also aligned with microstructural evidence from SEM analysis. As-cast AZ91D had dendritic α-Mg cells and sparse nucleation. 4 µm SiC/AZ91D composites with 1–2 % SiC micro-particles provided uniform nucleation and optimal refinement 2%. Larger SiC microparticles of 6–10 µm yielded localized refinement and broader size distributions. Although increasing SiC content enhanced strength and Young’s modulus, it inversely affected ductility. This suggested a trade-off between stiffness and deformability. These findings reaffirm the potential of SiC reinforcement for aerospace and light-vehicle applications where specific strength, and stiffness are critical. Moreover, the integration of explainable AI provided valuable insights into feature influence. This has implications in helping to advance transparent decision-making in materials design.
Author Contributions
The following statements should be used “Conceptualization, Robert Kennedy Otieno and Edward Odhong; methodology, Robert Kennedy Otieno, Edward Odhong and Alex Muumbo; software, Robert Kennedy Otieno.; validation, Robert Kennedy Otieno and Edward Odhong; formal analysis, Robert Kennedy Otieno; investigation, Robert Kennedy Otieno; resources, Robert Kennedy Otieno and Edward Odhong; data curation, Robert Kennedy Otieno and Edward Odhong; writing—original draft preparation, Robert Kennedy Otieno; writing—review and editing, Robert Kennedy Otieno and Edward Odhong; visualization, Robert Kennedy Otieno and Edward Odhong; supervision, Edward Odhong and Alex Muumbo; project administration, Robert Kennedy Otieno, Edward Odhong and Alex Muumbo.
Funding
This research received no external funding.
Institutional Review Board Statement
Not applicable.
Informed Consent Statement
Not applicable.
Data Availability Statement
Data available at https://data.mendeley.com/datasets/nk4tttpzyy/1 .
Acknowledgments
This is to acknowledge Semi-Conductor Technologies Limited for their help with SEM scanning and analysis. We also thank Xian Lyphar Biotech Company Limited for providing silicon carbide powders and Qingdao Hengyuan Machine Company Limited for providing AZ91D. Guidance on machine learning and mathematical modelling from Prof Su Zhixun of Dalian University of Technology, P. R. China and Prof Seyed Ali Mirjalili of Torrens University Australia and the director, Centre for Artificial Intelligence Research and Optimization (AIRO), were very useful in the realization of this work.
Conflicts of Interest
The authors declare no conflicts of interest.
Abbreviations
The following abbreviations are used in this manuscript:
| ALE | Accumulated Local Effects |
| ASTM | American Society for Testing and Materials |
| AUC | Area Under Curve |
| DOAJ | Directory of Open Access Journals |
| DT | Decision Trees |
| E | Young’s Modulus |
| EFB | Exclusive Feature Bundling |
| EI | Engineering Index |
| EML | Explainable Machine Learning |
| EPT | Electro-Pulsing Treatment |
| GOSS | Gradient-based One-Side Sampling |
| LGBM | Light Gradient Boosting Machine |
| LIME | Local Interpretable Model-agnostic Explanations |
| LN | Natural Logarithm |
| PCA | Principal Component Analysis |
| PC-1 to 4 | Principal Components 1 to 4 |
| PDP | Partial Dependence Plot |
| PSO | Particle Swarm Optimization |
| PubMed | Public/Publisher MEDLINE (Medical Literature Analysis and Retrieval System Online) |
| RD-ECAP | Rotary-Die Equal-Channel Angular Pressing |
| ROC | Receiver Operating Characteristics |
| SEM | Scanning Electron Microscope |
| SHAP | SHAPley additive explanations |
| TPE | Tree-structured Parzen Estimator |
| UTM | Universal Testing Machine |
| UTS | Ultimate Tensile Strength |
| VIF | Variance Inflation Factor |
| XAI | eXplainable Artificial Intelligence |
| YS | Yield Strength |
Appendix A
Appendix A.1. Some Test-Pieces Before and After Tensile Test
Appendix A.2. Mechanical Properties from Tensile Tests
| Particle size (µm) | Volume (%) | Yield (MPa) | UTS | E(GPa) | Elongation (%) |
| 4 | 1 | 361.22 | 466.59 | 109.00 | 0.80% |
| 6 | 1 | 387.13 | 490.78 | 110.93 | 0.86% |
| 8 | 1 | 394.91 | 516.69 | 111.24 | 0.95% |
| 10 | 1 | 398.07 | 502.87 | 112.75 | 0.91% |
| 4 | 1.5 | 385.41 | 542.60 | 121.83 | 0.95% |
| 4 | 2 | 400.95 | 563.33 | 125.00 | 0.97% |
Appendix A.3. Comparison of Mechanical Properties between Simulation and Experiment
| Size (µm) | Vol (%) | Property | Experimental | Simulation | Δ (Sim–Exp) | Δ% |
| 4 | 1 | Yield Strength (MPa) | 361.22 | 435 | 73.78 | 20.40% |
| UTS (MPa) | 466.59 | 523.3 | 56.71 | 12.20% | ||
| E (GPa) | 109 | 107.61 | –1.39 | –1.3 % | ||
| Elongation (%) | 0.8 | 0.8843 | 0.0843 | 10.50% | ||
| 6 | 1 | Yield Strength (MPa) | 387.13 | 439 | 51.87 | 13.40% |
| UTS (MPa) | 490.78 | 530.9 | 40.12 | 8.20% | ||
| E (GPa) | 110.93 | 108.69 | –2.24 | –2.0 % | ||
| Elongation (%) | 0.86 | 0.89 | 0.03 | 3.50% | ||
| 8 | 1 | Yield Strength (MPa) | 394.91 | 443 | 48.09 | 12.20% |
| UTS (MPa) | 516.69 | 522.3 | 5.61 | 1.10% | ||
| E (GPa) | 111.24 | 108.96 | –2.28 | –2.1 % | ||
| Elongation (%) | 0.95 | 0.88 | –0.07 | –7.4 % | ||
| 10 | 1 | Yield Strength (MPa) | 398.07 | 448 | 49.93 | 12.50% |
| UTS (MPa) | 502.87 | 535.2 | 32.33 | 6.40% | ||
| E (GPa) | 112.75 | 110.57 | –2.18 | –1.9 % | ||
| Elongation (%) | 0.91 | 0.84 | –0.07 | –7.7 % | ||
| 4 | 1.5 | Yield Strength (MPa) | 385.41 | 465 | 79.59 | 20.70% |
| UTS (MPa) | 542.6 | 532.1 | –10.50 | –1.9 % | ||
| E (GPa) | 121.83 | 114.88 | –6.95 | –5.7 % | ||
| Elongation (%) | 0.95 | 0.82 | –0.13 | –13.7 % | ||
| 4 | 2 | Yield Strength (MPa) | 400.95 | 501 | 100.05 | 25.00% |
| UTS (MPa) | 563.33 | 524.2 | –39.13 | –6.9 % | ||
| E (GPa) | 125 | 122.66 | –2.34 | –1.9 % | ||
| Elongation (%) | 0.97 | 0.8 | –0.17 | –17.5 % |
Appendix A.4. Some Test-Pieces Before and After Tensile Test
References
- Babu, P.; Solomon, D.G. Mechanical and Tribological Properties of Magnesium Composites– A Review. Materials Today: Proceedings 2023. [CrossRef]
- Birsen, D.; Tütük, İ.; Acar, S.; Karabeyoğlu, S.S.; Özer, G.; Güler, K.A. Microstructure and Wear Characteristics of Hybrid Reinforced (Ex-Situ SiC–in-Situ Mg2Si) Al Matrix Composites Produced by Vacuum Infiltration Method. Materials Chemistry and Physics 2023, 302, 127743. [CrossRef]
- Lu, X.; Hao, W.; Kuang, S.; Zhang, Y.; Wu, M.; Zhao, Y. High-Strength, High-Toughness SiCp Reinforced Mg Matrix Composites Manufactured by Semisolid Injection Molding. Journal of Materials Research and Technology 2023, 26, 4219–4228. [CrossRef]
- Taub, A.I.; Luo, A.A. Advanced Lightweight Materials and Manufacturing Processes for Automotive Applications. Mrs Bulletin 2015, 40, 1045–1054.
- Zhang, W.; Xu, J. Advanced Lightweight Materials for Automobiles: A Review. Materials & Design 2022, 221, 110994.
- Czerwinski, F. Current Trends in Automotive Lightweighting Strategies and Materials. Materials 2021, 14, 6631.
- Soni, R.; Verma, R.; Garg, R.K.; Sharma, V. A Critical Review of Recent Advances in the Aerospace Materials. Materials Today: Proceedings 2023.
- Sehgal, A.K.; Juneja, C.; Singh, J.; Kalsi, S. Comparative Analysis and Review of Materials Properties Used in Aerospace Industries: An Overview. Materials Today: Proceedings 2022, 48, 1609–1613.
- Zhang, J.; Zheng, Z.; Zhao, X.; Gong, F.; Huang, G.; Xu, X.; Wang, Z.; Yang, Y. Elongation Prediction of Die-Cast Aluminum Alloy Based on 3D Convolutional Neural Network Model. SAE International Journal of Materials and Manufacturing 2025, 18. [CrossRef]
- Song, J.; She, J.; Chen, D.; Pan, F. Latest Research Advances on Magnesium and Magnesium Alloys Worldwide. Journal of Magnesium and Alloys 2020, 8, 1–41.
- Zhu, Z.; Ning, W.; Niu, X.; Wang, Q.; Shi, R.; Zhao, Y. Designing High Elastic Modulus Magnesium-Based Composite Materials via Machine Learning Approach. Materials Today Communications 2023, 37, 107249. [CrossRef]
- Otieno, R.K.; Odhong, E.V.; Ondieki, C. Prediction of Phases and Mechanical Properties of Magnesium-Based High-Entropy Alloys Using Machine Learning. Journal of King Saud University - Science 2024, 36.
- Matta, A.K.; Koka, N.S.; Devarakonda, S.K. Recent Studies on Particulate Reinforced AZ91 Magnesium Composites Fabricated by Stir Casting–a Review. Journal of Mechanical and Energy Engineering 2020, 4, 115–126.
- Sunu Surendran, K.; Gnanavelbabu, A. Tribological Behaviour of AZ91D/Ultra-High-Temperature Ceramic Composites at Room and Elevated Temperatures. Proceedings of the Institution of Mechanical Engineers, Part J: Journal of Engineering Tribology 2022, 236, 1855–1870.
- Lv, X.; Deng, K.; Wang, C.; Nie, K.; Wang, X.; Shi, Q. The Corrosion Resistance of Homogenized AZ91 Alloy Influenced by Submicron SiCp Content. Materials Today Communications 2023, 34, 105060. [CrossRef]
- Guo, R.; Le, Q.; Zhou, W.; Wang, T.; Ren, L.; Jiang, Y.; Zou, Q.; Liao, Q.; Yu, F.; Aranas Jr., C. Effect of SiCp on the Microstructure and Tensile Properties of the Mg–3Y Magnesium Alloy. Journal of Materials Research and Technology 2023, 24, 4232–4241. [CrossRef]
- Shi, Q.; Cui, P.; Hu, M.; Wang, F.; Xu, H.; Zhou, X. Solid-State Synthesis of SiC Particle-Reinforced AZ91D Composites: Microstructure and Reinforcement Mechanisms. Metals 2024, 14, 434. [CrossRef]
- Yang, Q.; Li, X.; Xu, J.; Yin, C.; Zhang, X.; Yang, H.; Zhou, N.; Zhang, J.; Zheng, K.; Jiang, B.; et al. Effect of SiC Particles on the Microstructures and Mechanical Properties of Mg–9Al–1Zn Based Composites. Journal of Alloys and Compounds 2025, 1016, 178908. [CrossRef]
- Deng, K.; Wang, C.; Wang, X.; Wu, K.; Zheng, M. Microstructure and Elevated Tensile Properties of Submicron SiCp/AZ91 Magnesium Matrix Composite. Materials & Design 2012, 38, 110–114. [CrossRef]
- Wang, X.J.; Hu, X.S.; Wang, Y.Q.; Nie, K.B.; Wu, K.; Zheng, M.Y. Microstructure Evolutions of SiCp/AZ91 Mg Matrix Composites during Hot Compression. Materials Science and Engineering: A 2013, 559, 139–146. [CrossRef]
- Sun, X.; Wang, C.; Deng, K.; Nie, K.; Zhang, X.; Xiao, X. High Strength SiCp/AZ91 Composite Assisted by Dynamic Precipitated Mg17Al12 Phase. Journal of Alloys and Compounds 2018, 732, 328–335. [CrossRef]
- Du, Z.; Deng, K.; Nie, K.; Wang, C.; Xu, C.; Shi, Q. Preparation, Microstructure, and Mechanical Properties of SiCp/AZ91 Magnesium Matrix Laminar Material. Materials Science and Engineering: A 2024, 891, 145977. [CrossRef]
- Fayomi, J.; Popoola, A.P.I.; Popoola, O.M.; Aigbodon, V.S. Magnesium-Based Composite by Nano-Nucleation of β-Mg17Al12 Using Spark Plasma Sintering Route for Advanced Structural Application. Journal of Materials Research and Technology 2023, 24, 1547–1561. [CrossRef]
- Xu, Q.; Ma, A.; Saleh, B.; Li, Y.; Yuan, Y.; Jiang, J.; Ni, C. Enhancement of Strength and Ductility of SiCp/AZ91 Composites by RD-ECAP Processing. Materials Science and Engineering: A 2020, 771, 138579. [CrossRef]
- Yeh, J.-W.; Chen, S.-K.; Lin, S.-J.; Gan, J.-Y.; Chin, T.-S.; Shun, T.-T.; Tsau, C.-H.; Chang, S.-Y. Nanostructured High-Entropy Alloys with Multiple Principal Elements: Novel Alloy Design Concepts and Outcomes. Advanced engineering materials 2004, 6, 299–303.
- Ponhan, K.; Weston, D.; Tassenberg, K. Influence of SiC Nanoparticle Contents on Microstructural Evolution and Mechanical Behavior of AZ91D Magnesium Matrix Composites Synthesised through a Combination of a Master Pellet Feeding Technique and Stir Casting Assisted by Ultrasonic Vibration. Materials Today Communications 2023, 36, 106785. [CrossRef]
- Nie, K.B.; Wang, X.J.; Wu, K.; Hu, X.S.; Zheng, M.Y.; Xu, L. Microstructure and Tensile Properties of Micro-SiC Particles Reinforced Magnesium Matrix Composites Produced by Semisolid Stirring Assisted Ultrasonic Vibration. Materials Science and Engineering: A 2011, 528, 8709–8714. [CrossRef]
- Xiao, R.; Liu, W.; Wu, G.; Zhang, L.; Liu, B.; Ding, W. Effect of Ca Content and Rheo-Squeeze Casting Parameters on Microstructure and Mechanical Properties of AZ91−1Ce−xCa Alloys. Transactions of Nonferrous Metals Society of China 2021, 31, 1572–1586. [CrossRef]
- Jolokhani, A.; Razaghian, A.; Moharami, A.; Emamy, M. Microstructure and Tribological Properties of As-Cast and Multi-Pass Friction Stir Processed Mg-0.5Zn-0.5Zr/SiC Composite Fabricated by Stir Casting Technique. Journal of Materials Research and Technology 2023, 27, 7823–7838. [CrossRef]
- Marode, R.V.; Awang, M.; Lemma, T.A.; Pedapati, S.R.; Hassan, A.; Janga, V.S.R.; Alam, M.A.; Loyte, A.; Devarajan, Y. Friction Stir Processing of AZ91 Hybrid Composites with Exfoliated Multi-Layered Graphene: A Taguchi-Grey Relational Analysis. Journal of Alloys and Compounds 2024, 972, 172703. [CrossRef]
- Shi, H.; Xu, C.; Hu, X.; Gan, W.; Wu, K.; Wang, X. Improving the Young’s Modulus of Mg via Alloying and Compositing – A Short Review. Journal of Magnesium and Alloys 2022, 10, 2009–2024. [CrossRef]
- Song, J.; Chen, J.; Xiong, X.; Peng, X.; Chen, D.; Pan, F. Research Advances of Magnesium and Magnesium Alloys Worldwide in 2021. Journal of Magnesium and Alloys 2022, 10, 863–898.
- Mishra, A.; Jatti, V.S.; Sefene, E.M. Exploratory Analysis and Evolutionary Computing Coupled Machine Learning Algorithms for Modelling the Wear Characteristics of AZ31 Alloy. Materials Today Communications 2023, 37, 107507. [CrossRef]
- Aydin, F.; Durgut, R. Estimation of Wear Performance of AZ91 Alloy under Dry Sliding Conditions Using Machine Learning Methods. Transactions of Nonferrous Metals Society of China 2021, 31, 125–137. [CrossRef]
- Kumar, R.; Channi, A.S.; Kaur, R.; Sharma, S.; Grewal, J.S.; Singh, S.; Verma, A.; Haber, R. Exploring the Intricacies of Machine Learning-Based Optimization of Electric Discharge Machining on Squeeze Cast TiB2/AA6061 Composites: Insights from Morphological, and Microstructural Aspects in the Surface Structure Analysis of Recast Layer Formation and Worn-out Analysis. Journal of Materials Research and Technology 2023, 26, 8569–8603. [CrossRef]
- Azad, H.K.M.; Rahman, M.Z. A Critical Review of Developments in the Characterization of Metal Matrix Composites with Particulate Reinforcements. In Reference Module in Materials Science and Materials Engineering; Elsevier, 2024 ISBN 978-0-12-803581-8.
- Fang, J.; Xie, M.; Zhang, J.; Hu, J.; Liu, G.; Zhao, S.; Chen, Y.; He, X.; Jin, Q. Optimized Design of Composition and Brazing Process for Cu-Ag-Zn-Mn-Ni-Si-B-P Alloy Brazing Material Based on Machine Learning Strategy to Improve Brazing Properties. Materials Today Communications 2024, 109317. [CrossRef]
- Fang, J.; Xie, M.; He, X.; Zhang, J.; Hu, J.; Chen, Y.; Yang, Y.; Jin, Q. Machine Learning Accelerates the Materials Discovery. Materials Today Communications 2022, 33, 104900. [CrossRef]
- Tiwari, A.; Kumar, N.; Banerjee, M.K. Applications of Genetic Algorithm in Prediction of the Best Achievable Combination of Hardness and Tensile Strength for Graphene Reinforced Magnesium Alloy (AZ61) Matrix Composite. Results in Control and Optimization 2024, 14, 100334. [CrossRef]
- Padmanaban, R.; Vignesh, R.V.; Povendhan, A.P.; Balakumharen, A.P. Optimizing the Tensile Strength of Friction Stir Welded Dissimilar Aluminium Alloy Joints Using Particle Swarm Optimization. Materials Today: Proceedings 2018, 5, 24820–24826. [CrossRef]
- Chen, C.; Ma, L.; Zhang, Y.; Liaw, P.K.; Ren, J. Accelerating the Design of High-Entropy Alloys with High Hardness by Machine Learning Based on Particle Swarm Optimization. Intermetallics 2023, 154, 107819. [CrossRef]
- Prakash, C.; Singh, S.; Singh, M.; Verma, K.; Chaudhary, B.; Singh, S. Multi-Objective Particle Swarm Optimization of EDM Parameters to Deposit HA-Coating on Biodegradable Mg-Alloy. Vacuum 2018, 158, 180–190. [CrossRef]
- Fathi, R.; Ma, A.; Saleh, B.; Xu, Q.; Jiang, J. Investigation on Mechanical Properties and Wear Performance of Functionally Graded AZ91-SiCp Composites via Centrifugal Casting. Materials Today Communications 2020, 24, 101169. [CrossRef]
- Lv, X.; Deng, K.-K.; Wang, C.-J.; Nie, K.-B.; Shi, Q.-X.; Liang, W. The Corrosion Properties of AZ91 Alloy Improved by the Addition of Trace Submicron SiCp. Materials Chemistry and Physics 2022, 286, 126143. [CrossRef]
- Chen, S.; Aitken, Z.H.; Pattamatta, S.; Wu, Z.; Yu, Z.G.; Srolovitz, D.J.; Liaw, P.K.; Zhang, Y.-W. Simultaneously Enhancing the Ultimate Strength and Ductility of High-Entropy Alloys via Short-Range Ordering. Nat Commun 2021, 12, 4953. [CrossRef]
- Zhang, B.; Sun, Y.; Liang, T.; Li, Y.; Li, T.; Wang, J.; Cai, R.; Yang, C. Simultaneously Enhancing the Strength and Ductility of As-Extruded AlN/AZ91 Composites via Nano-Precipitation and Pyramidal Slip. Journal of Materials Science & Technology 2024, 172, 240–254. [CrossRef]
- Emadi, P.; Andilab, B.; Borodianskiy, K.; Ravindran, C. Strengthening of Mg-Al-Zn-Mn Alloy Using SiC/Al Nanocomposite Extrusion. Journal of Alloys and Compounds 2022, 922, 166243. [CrossRef]
- Nasker, P.; Mondal, A.K. SiC Nanoparticles Additions to Squeeze-Cast Mg-5.0Al-2.0Ca-0.3Mn Alloy: An Evaluation of Microstructure and Mechanical Properties. Materials Characterization 2024, 212, 113984. [CrossRef]
- Deng, K.K.; Wu, K.; Wu, Y.W.; Nie, K.B.; Zheng, M.Y. Effect of Submicron Size SiC Particulates on Microstructure and Mechanical Properties of AZ91 Magnesium Matrix Composites. Journal of Alloys and Compounds 2010, 504, 542–547. [CrossRef]
- Washington Mills SiC Properties Meeting Tough Standards Available online: https://www.washingtonmills.com/silicon-carbide/sic-properties (accessed on 5 October 2024).
- Kumar, A.; Kumar, S.; Mukhopadhyay, N.K.; Yadav, A.; Winczek, J. Effect of SiC Reinforcement and Its Variation on the Mechanical Characteristics of AZ91 Composites. Materials 2020, 13, 4913. [CrossRef]
- Katrutsa, A.; Strijov, V. Comprehensive Study of Feature Selection Methods to Solve Multicollinearity Problem According to Evaluation Criteria. Expert Systems with Applications 2017, 76, 1–11.
- Yu, H.; Jiang, S.; Land, K.C. Multicollinearity in Hierarchical Linear Models. Social science research 2015, 53, 118–136.
- Demir, S.; Sahin, E.K. Predicting Occurrence of Liquefaction-Induced Lateral Spreading Using Gradient Boosting Algorithms Integrated with Particle Swarm Optimization: PSO-XGBoost, PSO-LightGBM, and PSO-CatBoost. Acta Geotech. 2023, 18, 3403–3419. [CrossRef]
- Fan, M.; Luo, Z.; Liu, Y.; Feng, Y. Hot Deformation Behavior of 30MnB5V Steel: Phenomenological Constitutive Model, Ensemble Learning Algorithm, Hot Processing Map and Microstructure Evolution. Journal of Materials Research and Technology 2024, 32, 2675–2690.
- Machaka, R.; Radingoana, P.M. Prediction of Narrow HT-SMA Thermal Hysteresis Behaviour Using Explainable Machine Learning. Materials Today Communications 2023, 35, 105806. [CrossRef]
- Wang, X.J.; Wang, N.Z.; Wang, L.Y.; Hu, X.S.; Wu, K.; Wang, Y.Q.; Huang, Y.D. Processing, Microstructure and Mechanical Properties of Micro-SiC Particles Reinforced Magnesium Matrix Composites Fabricated by Stir Casting Assisted by Ultrasonic Treatment Processing. Materials & Design 2014, 57, 638–645. [CrossRef]
- Kumar, D.; Thakur, L. Influence of Hybrid Reinforcements on the Mechanical Properties and Morphology of AZ91 Magnesium Alloy Composites Synthesized by Ultrasonic-Assisted Stir Casting. Materials Today Communications 2023, 35, 105937. [CrossRef]
Figure 1.
Optimization and machine learning framework.
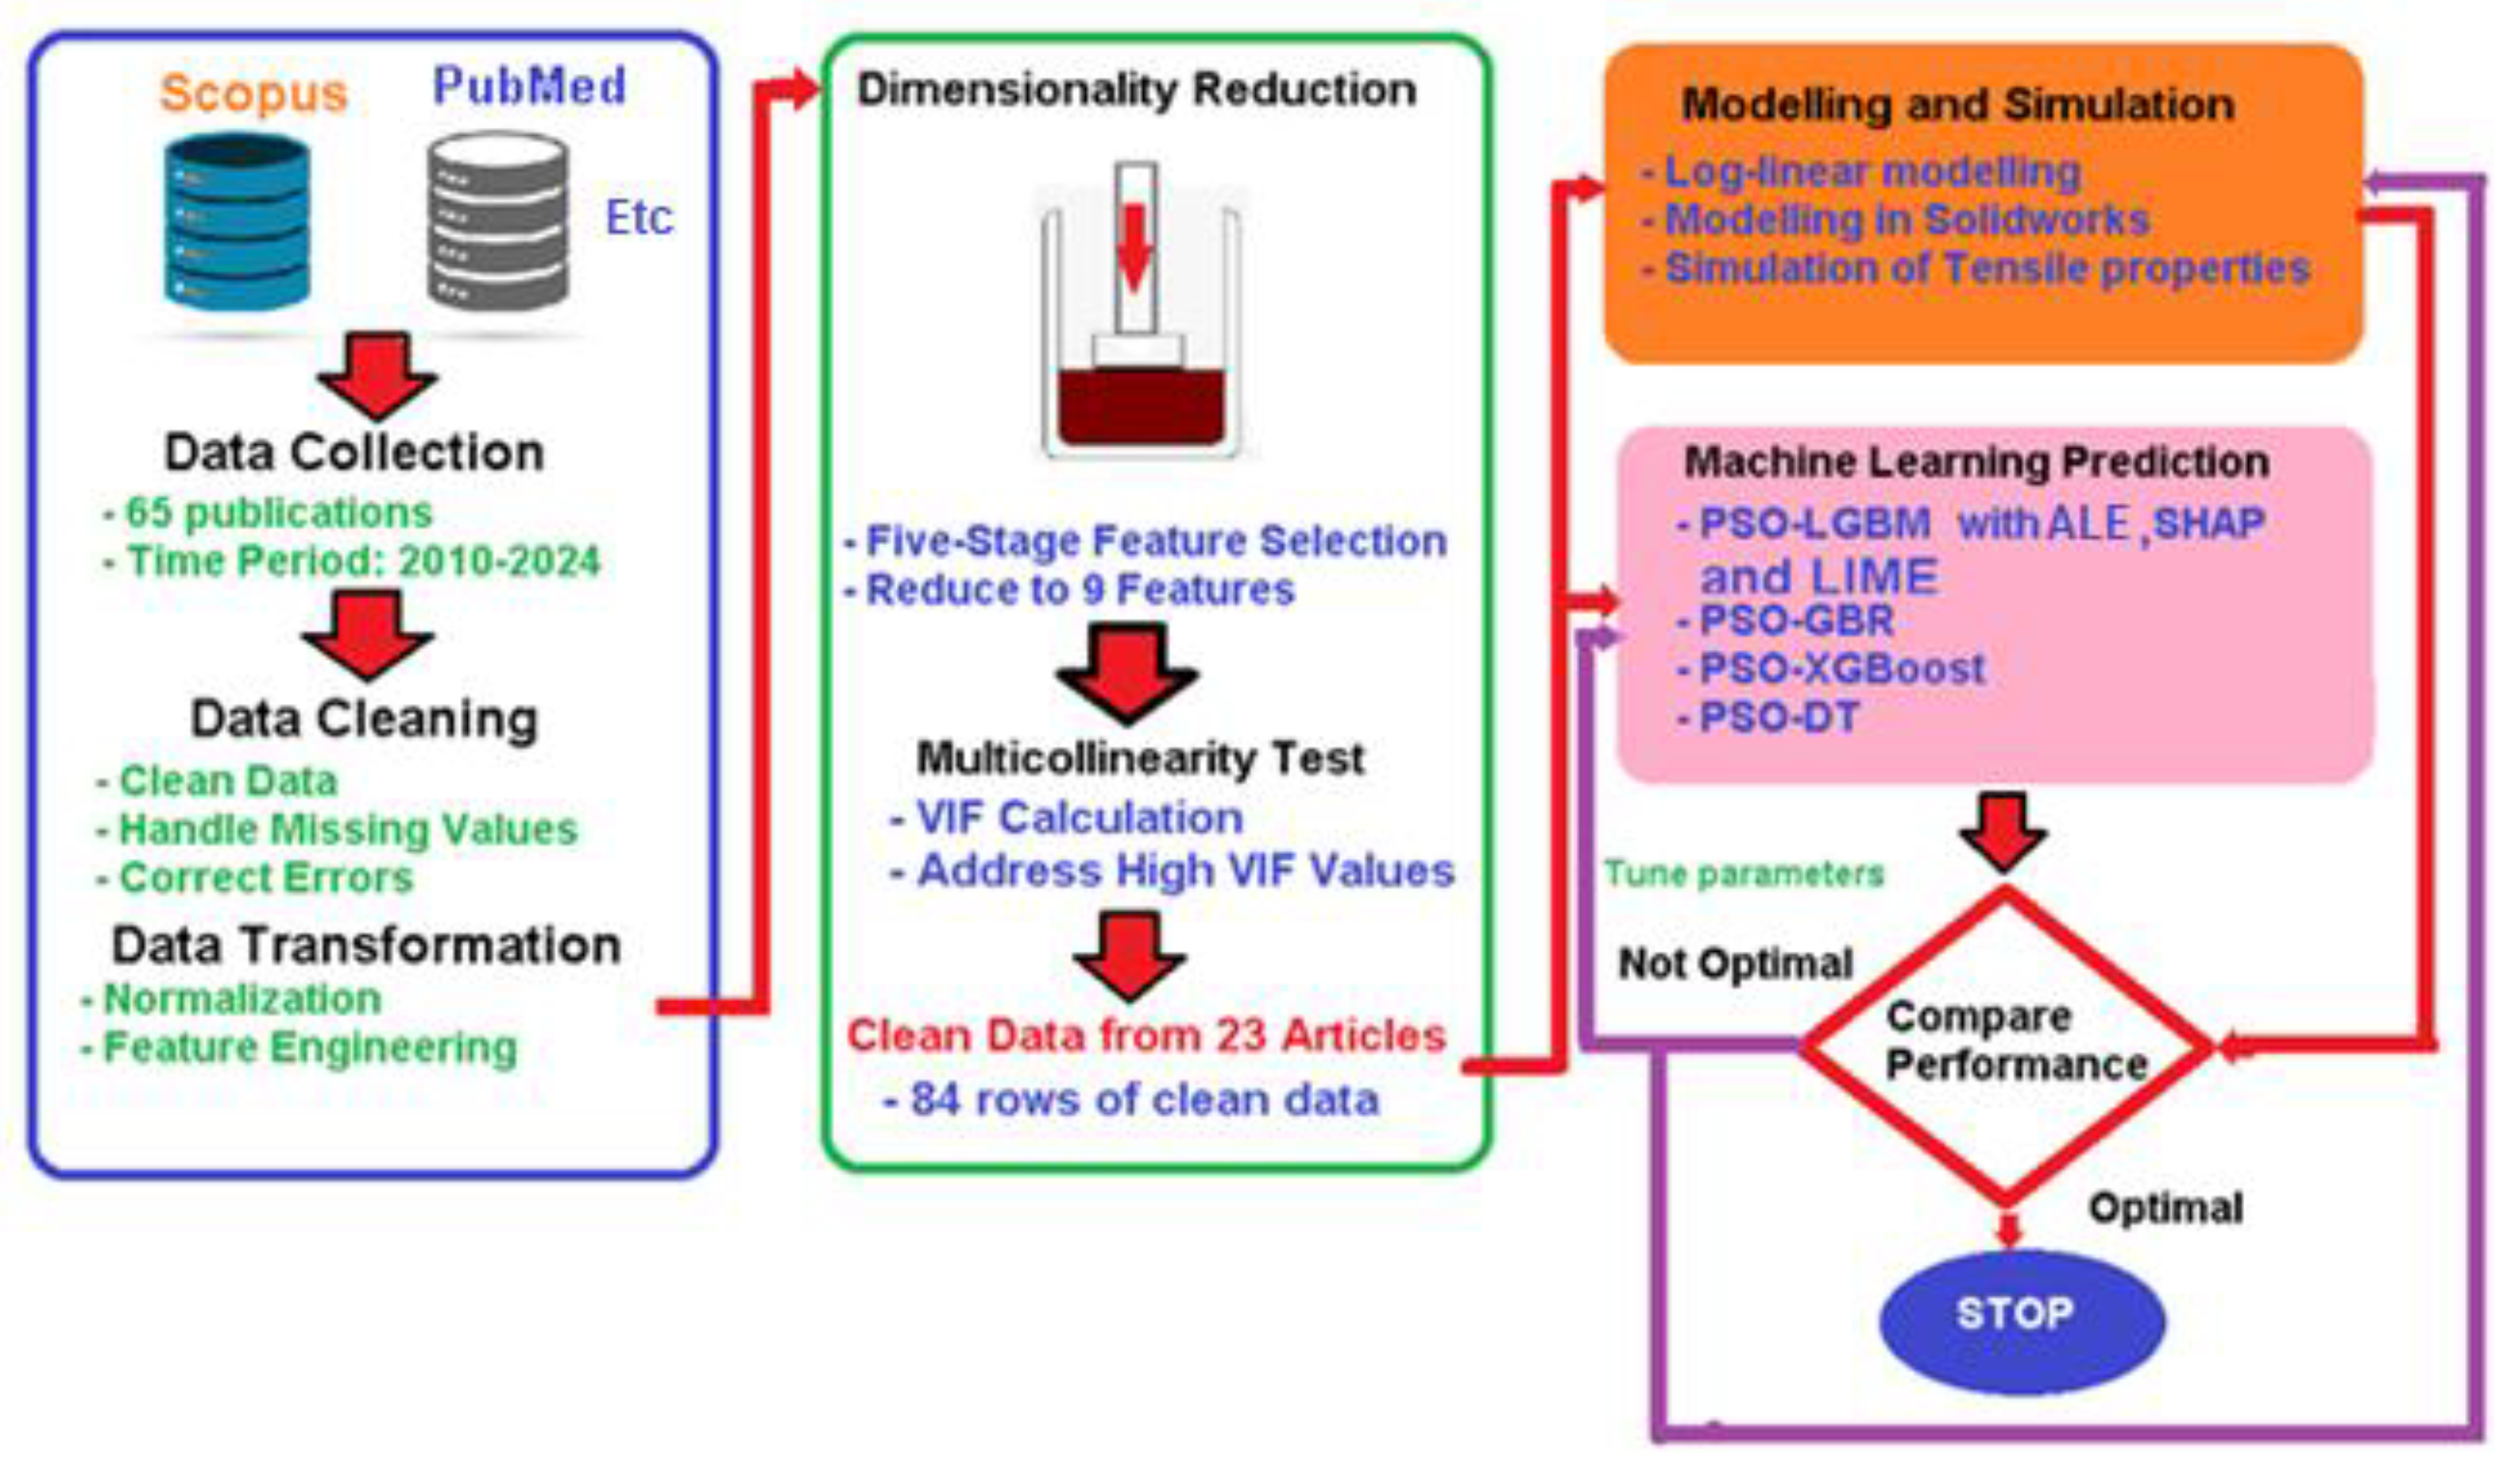
Figure 2.
(a) Scatterplot of LN SiC volume and spec_YS (b) Histogram of LN of specific YS by Label (c) ROC curve of the algorithms.
Figure 2.
(a) Scatterplot of LN SiC volume and spec_YS (b) Histogram of LN of specific YS by Label (c) ROC curve of the algorithms.
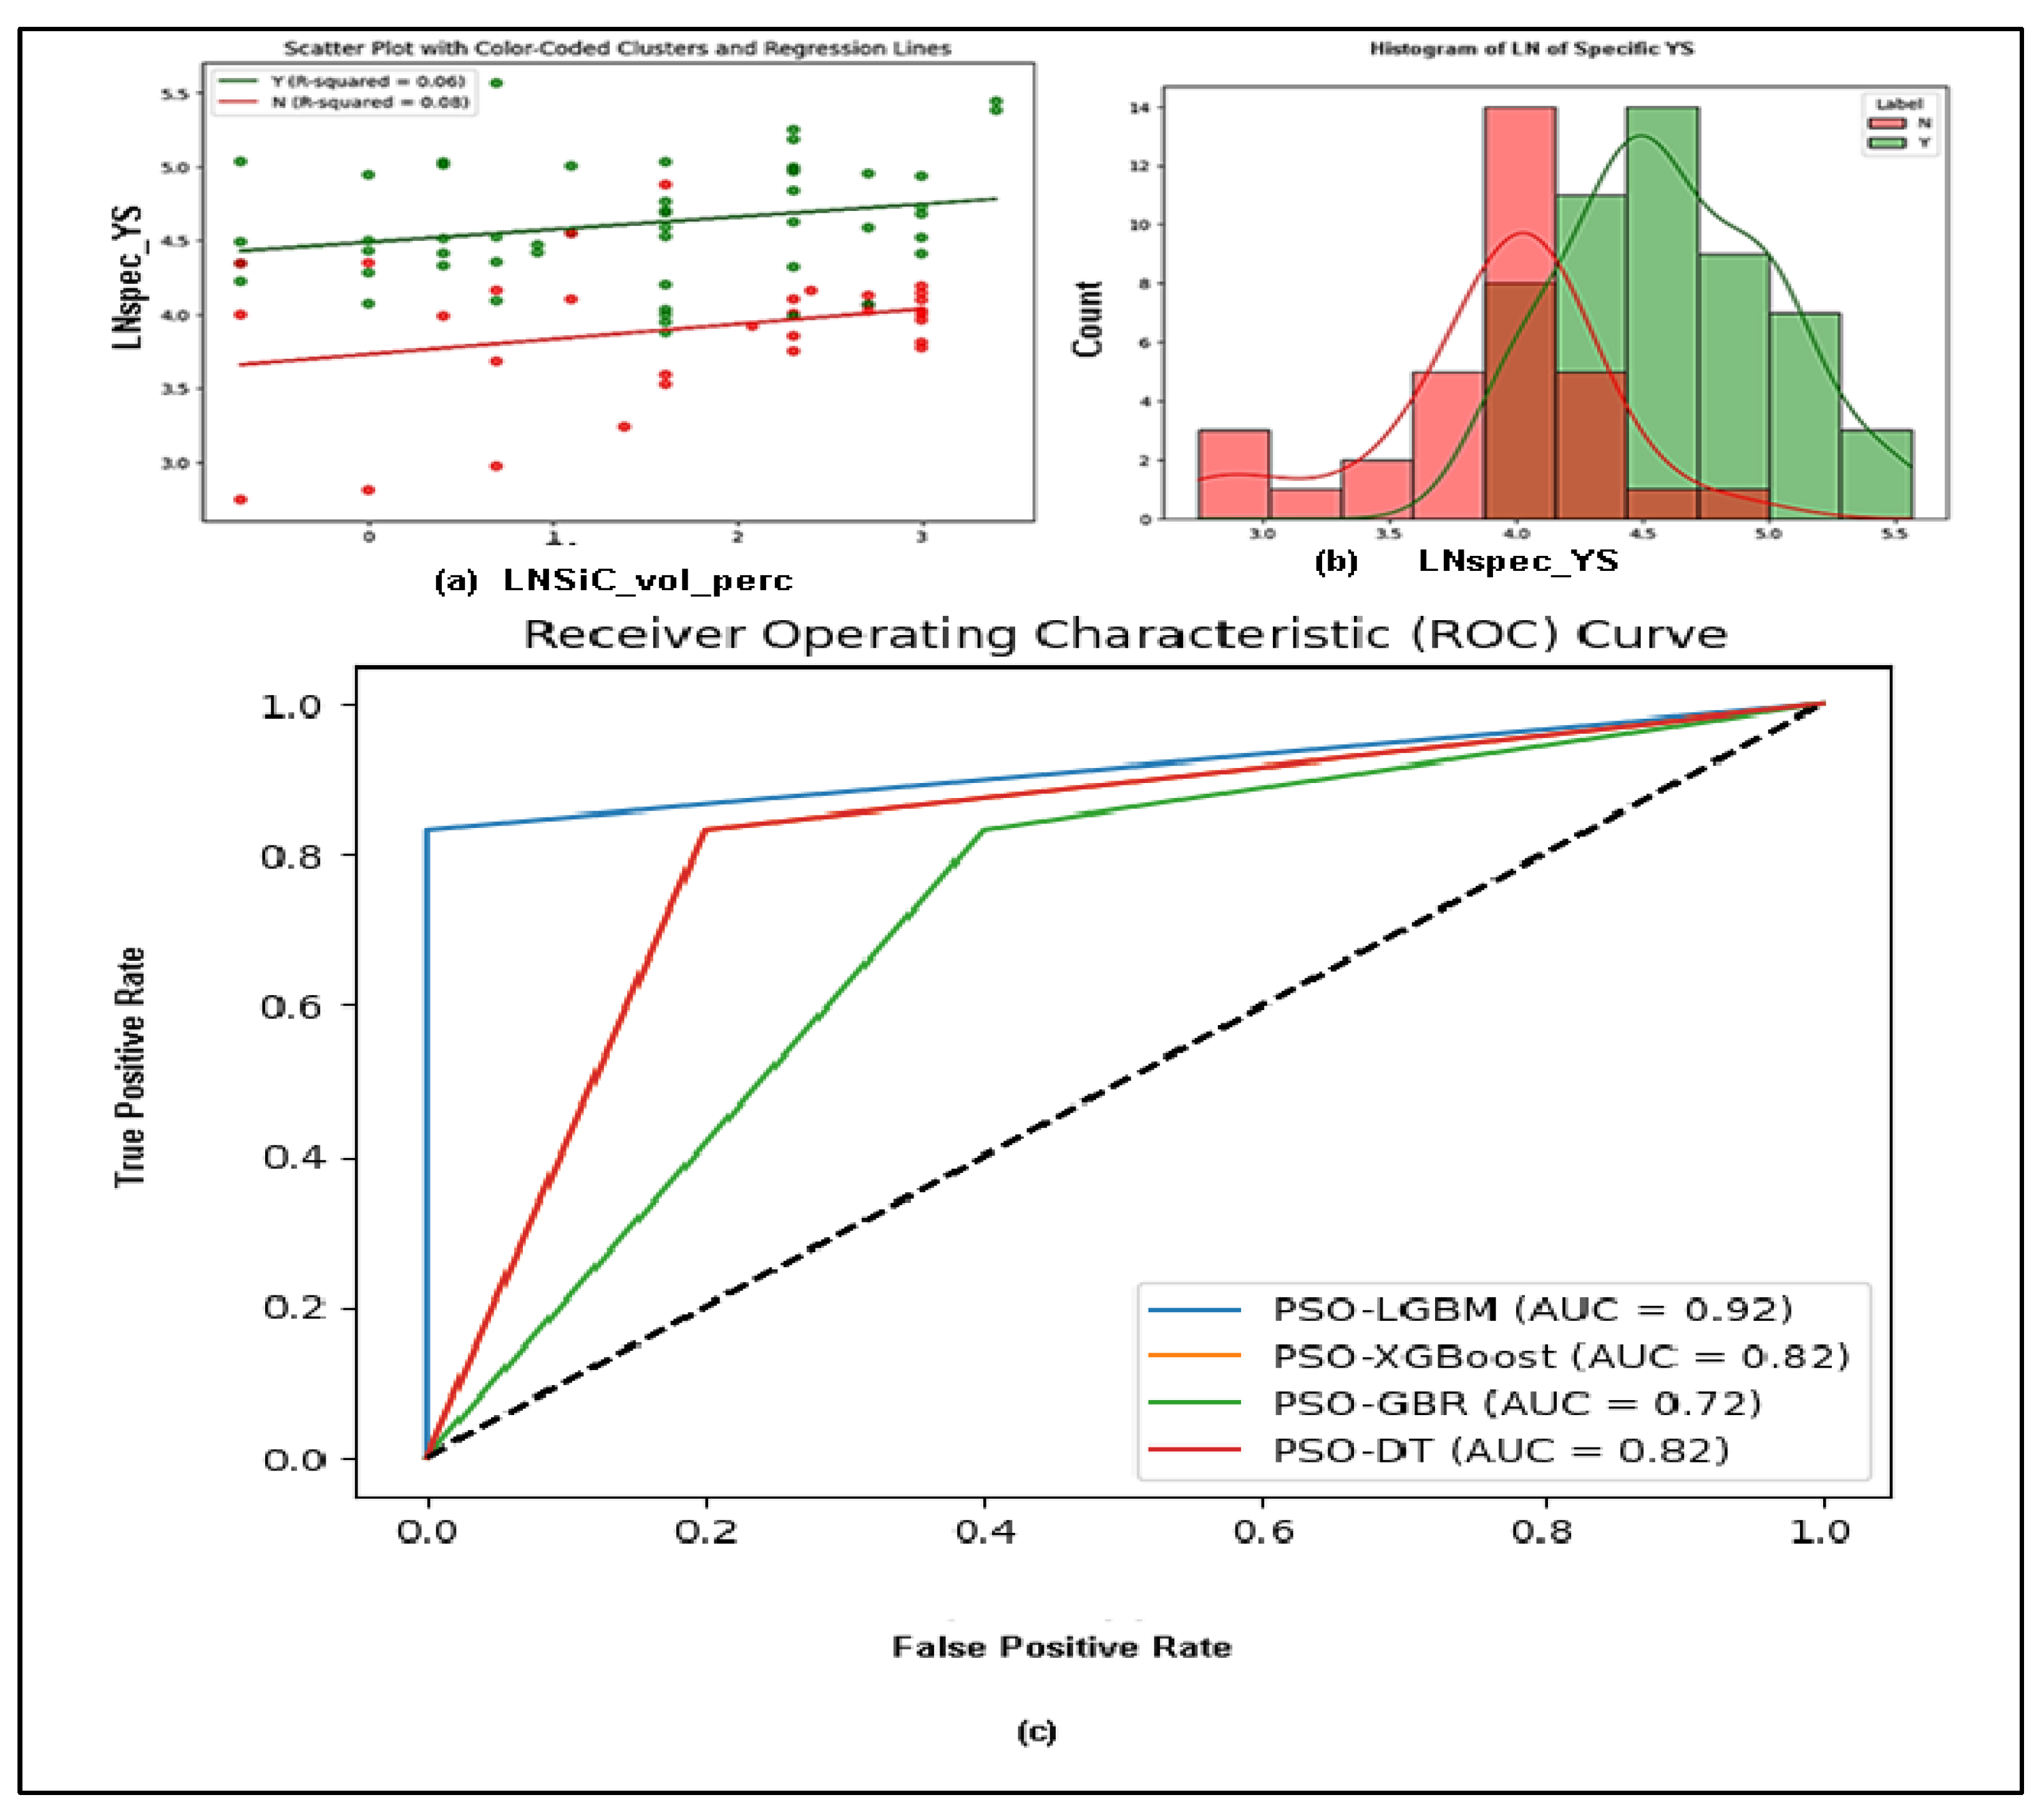
Figure 3.
(a) SHAP plot and (b) ALE plots of effects of variables on PSO-LGBM output.
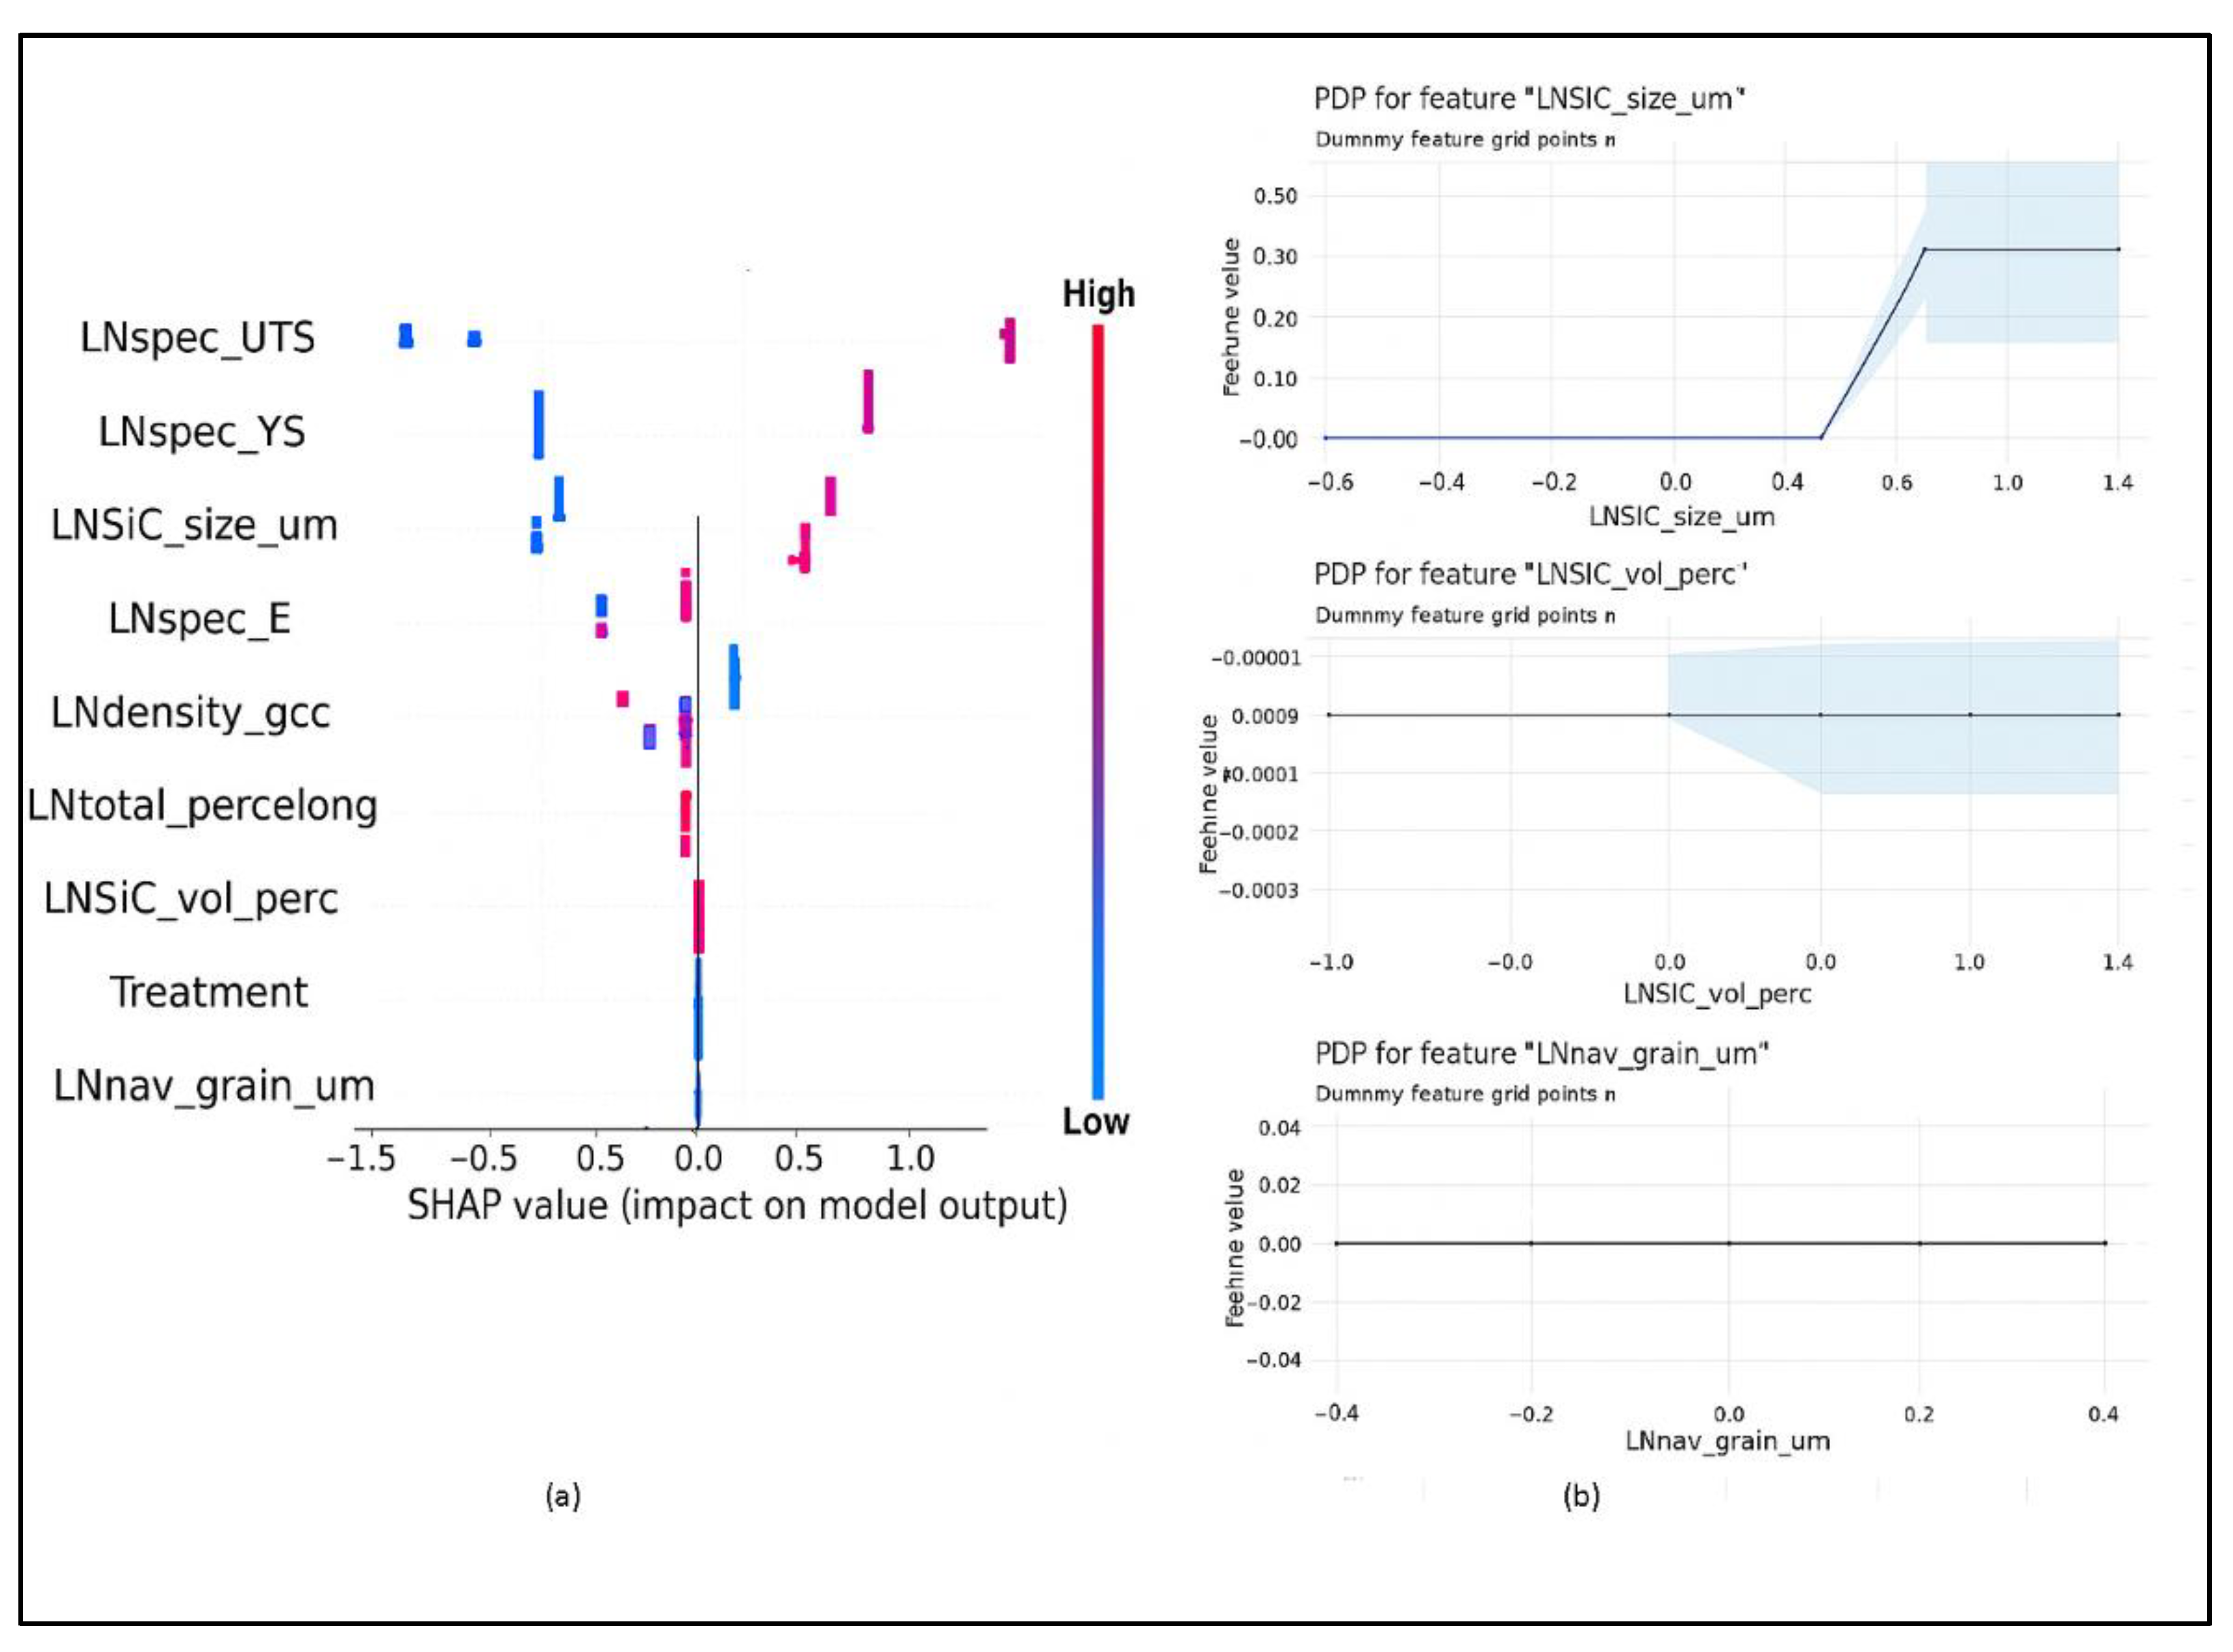
Figure 4.
LIME output with PSO-LGBM model.
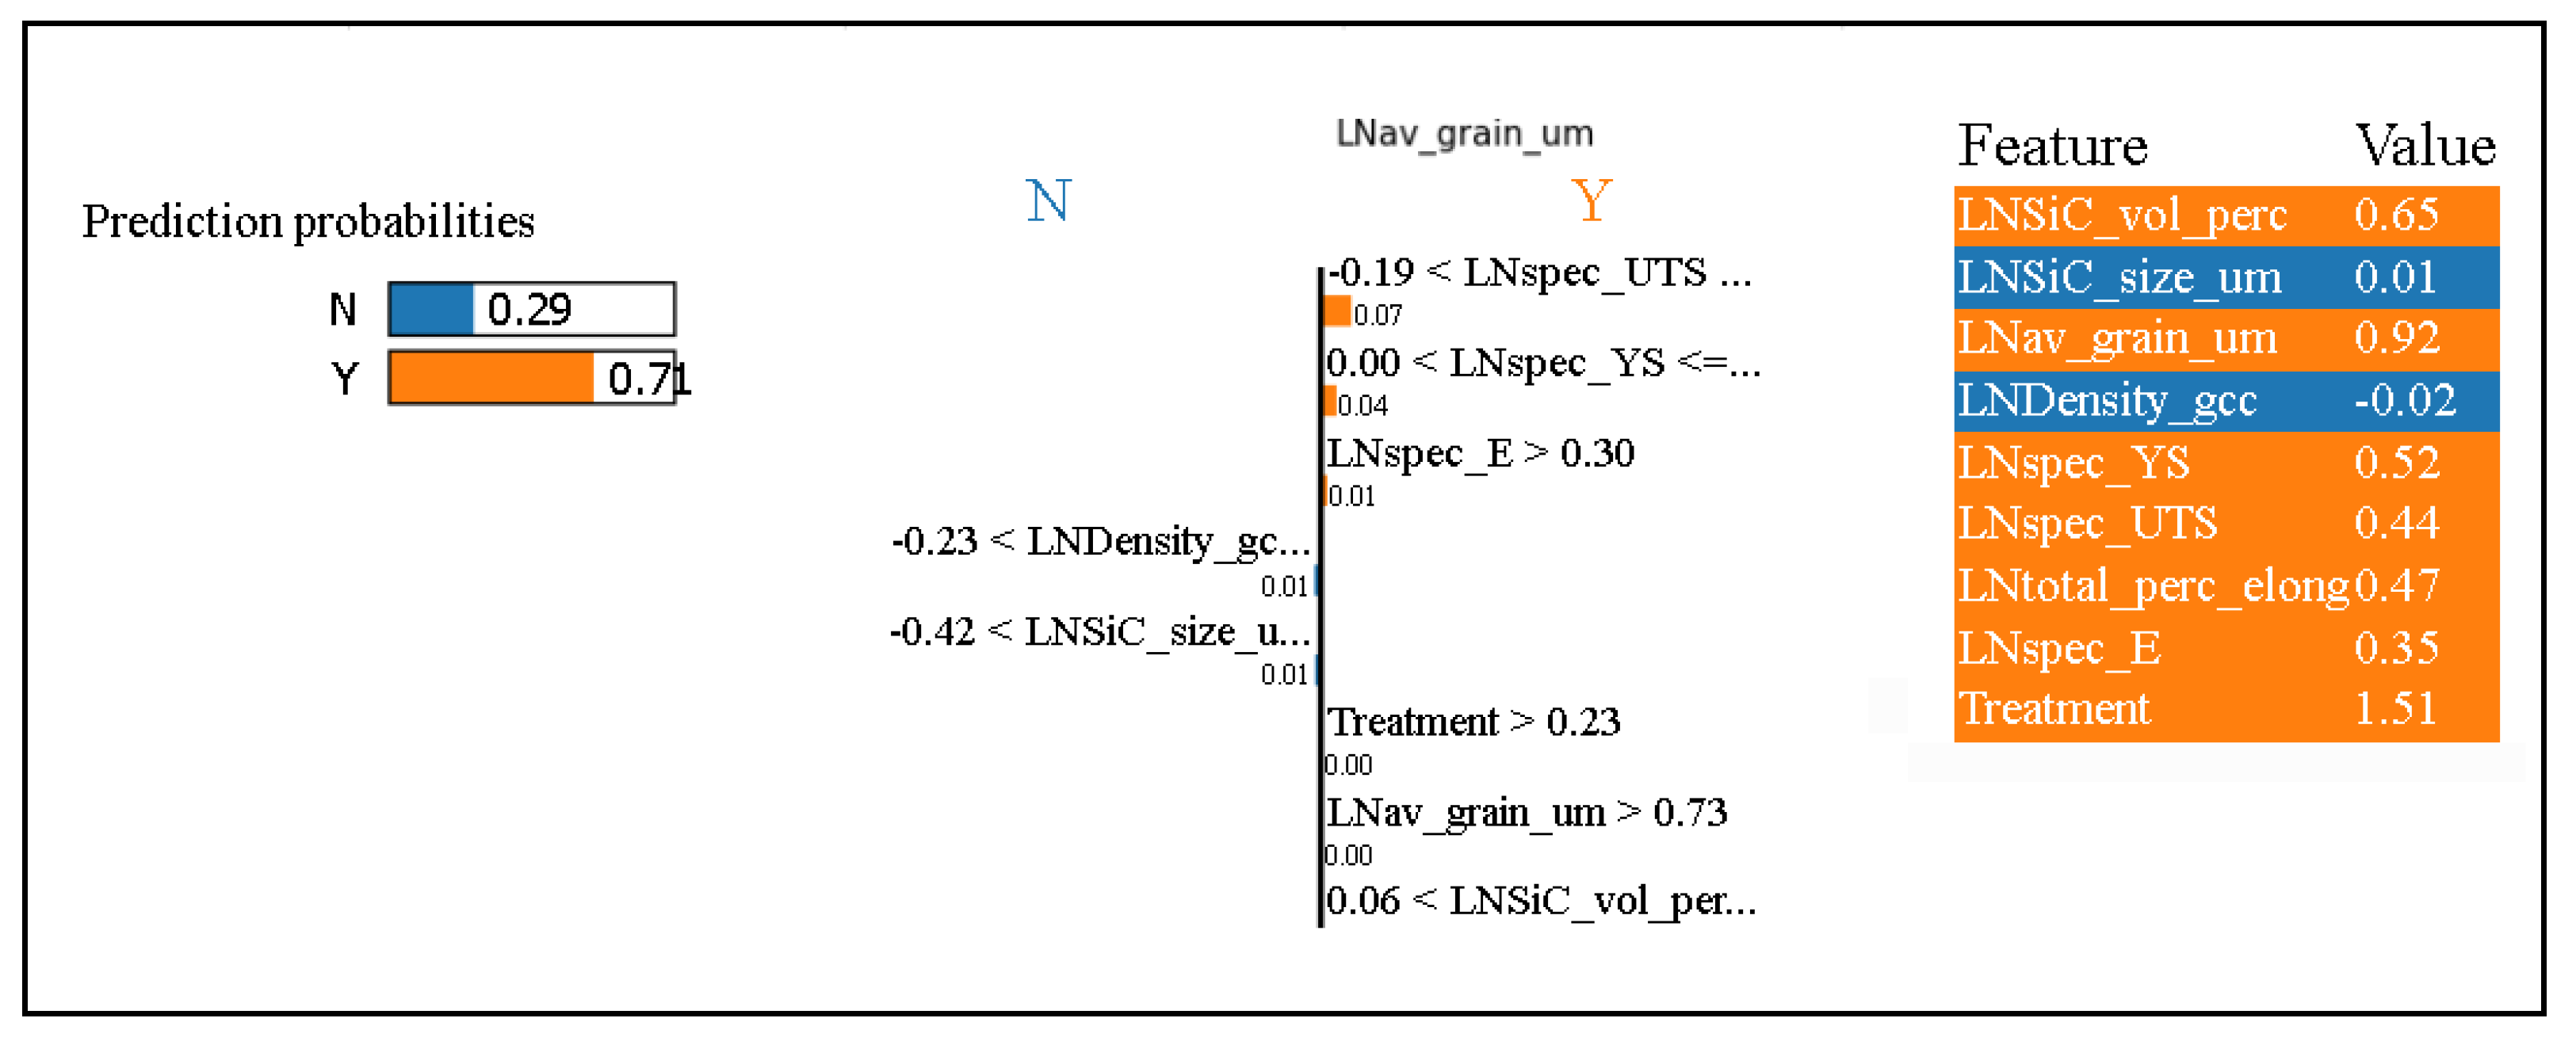
Figure 5.
Stress strain graphs from simulations (a) at constant volume percentage with varying SiC particle size (b) at constant particle size with varying volume percentage.
Figure 5.
Stress strain graphs from simulations (a) at constant volume percentage with varying SiC particle size (b) at constant particle size with varying volume percentage.
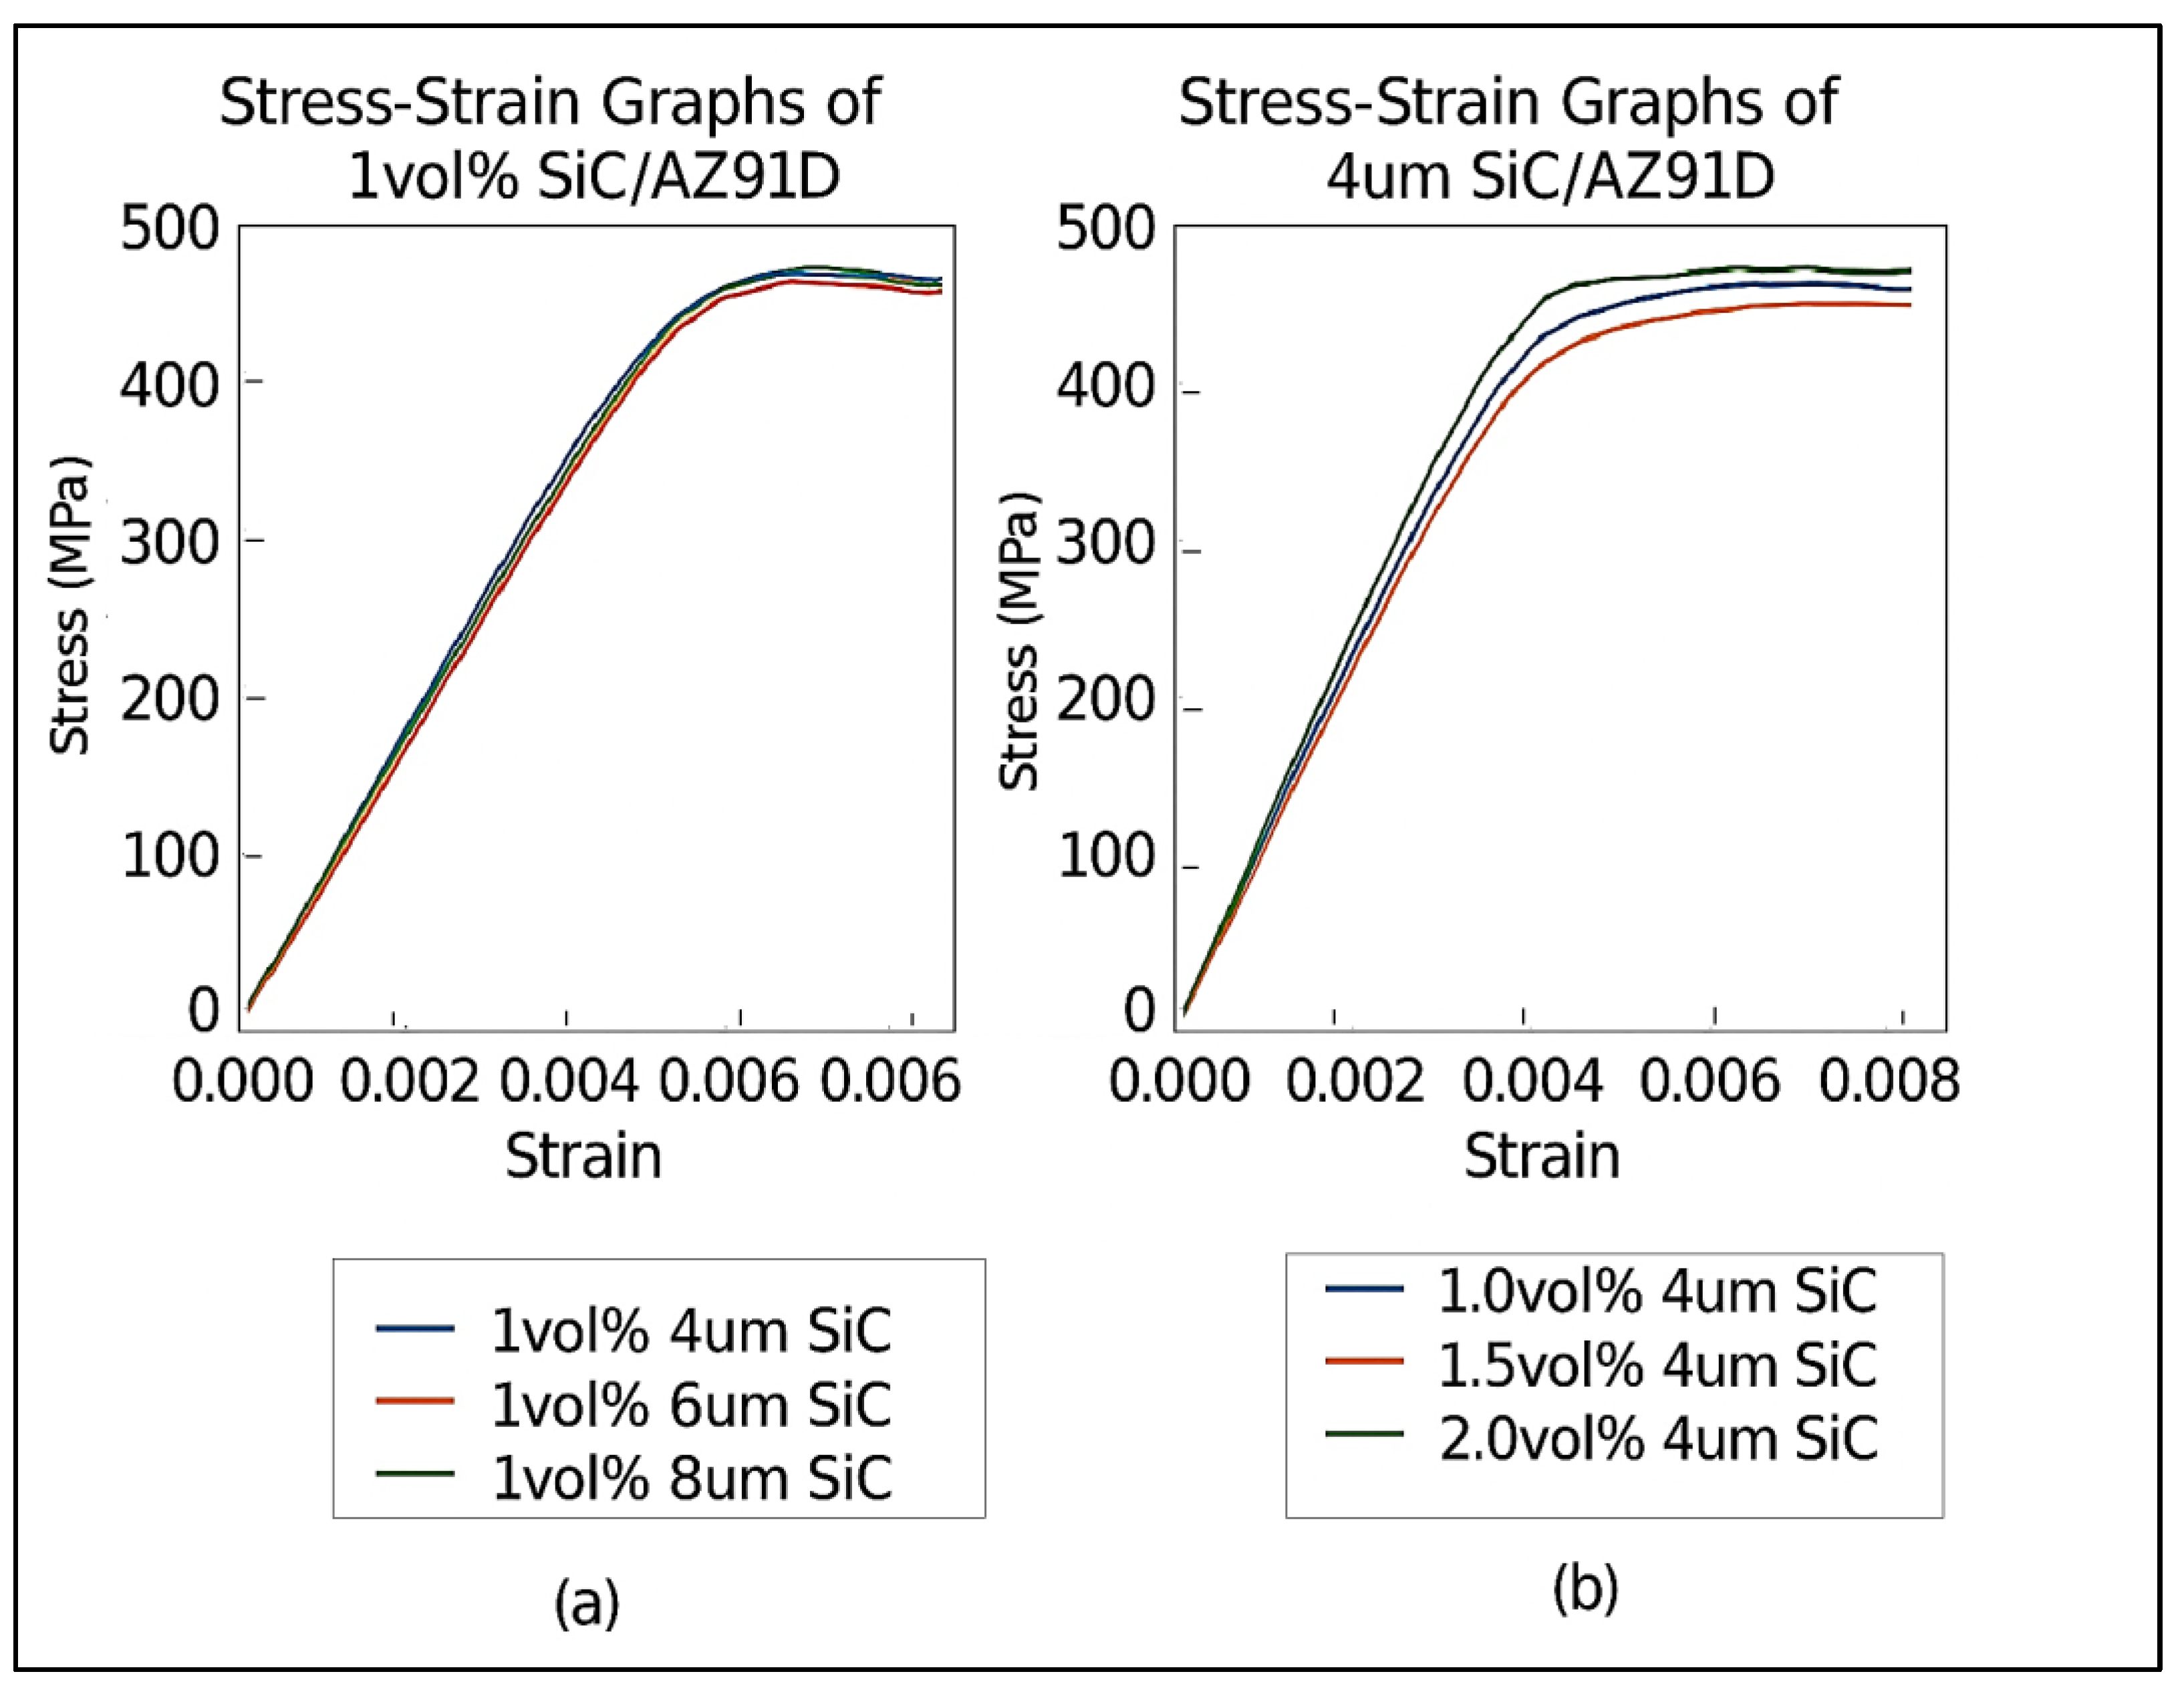
Figure 6.
Stress strain graphs for variation of stress with SiC particle size.
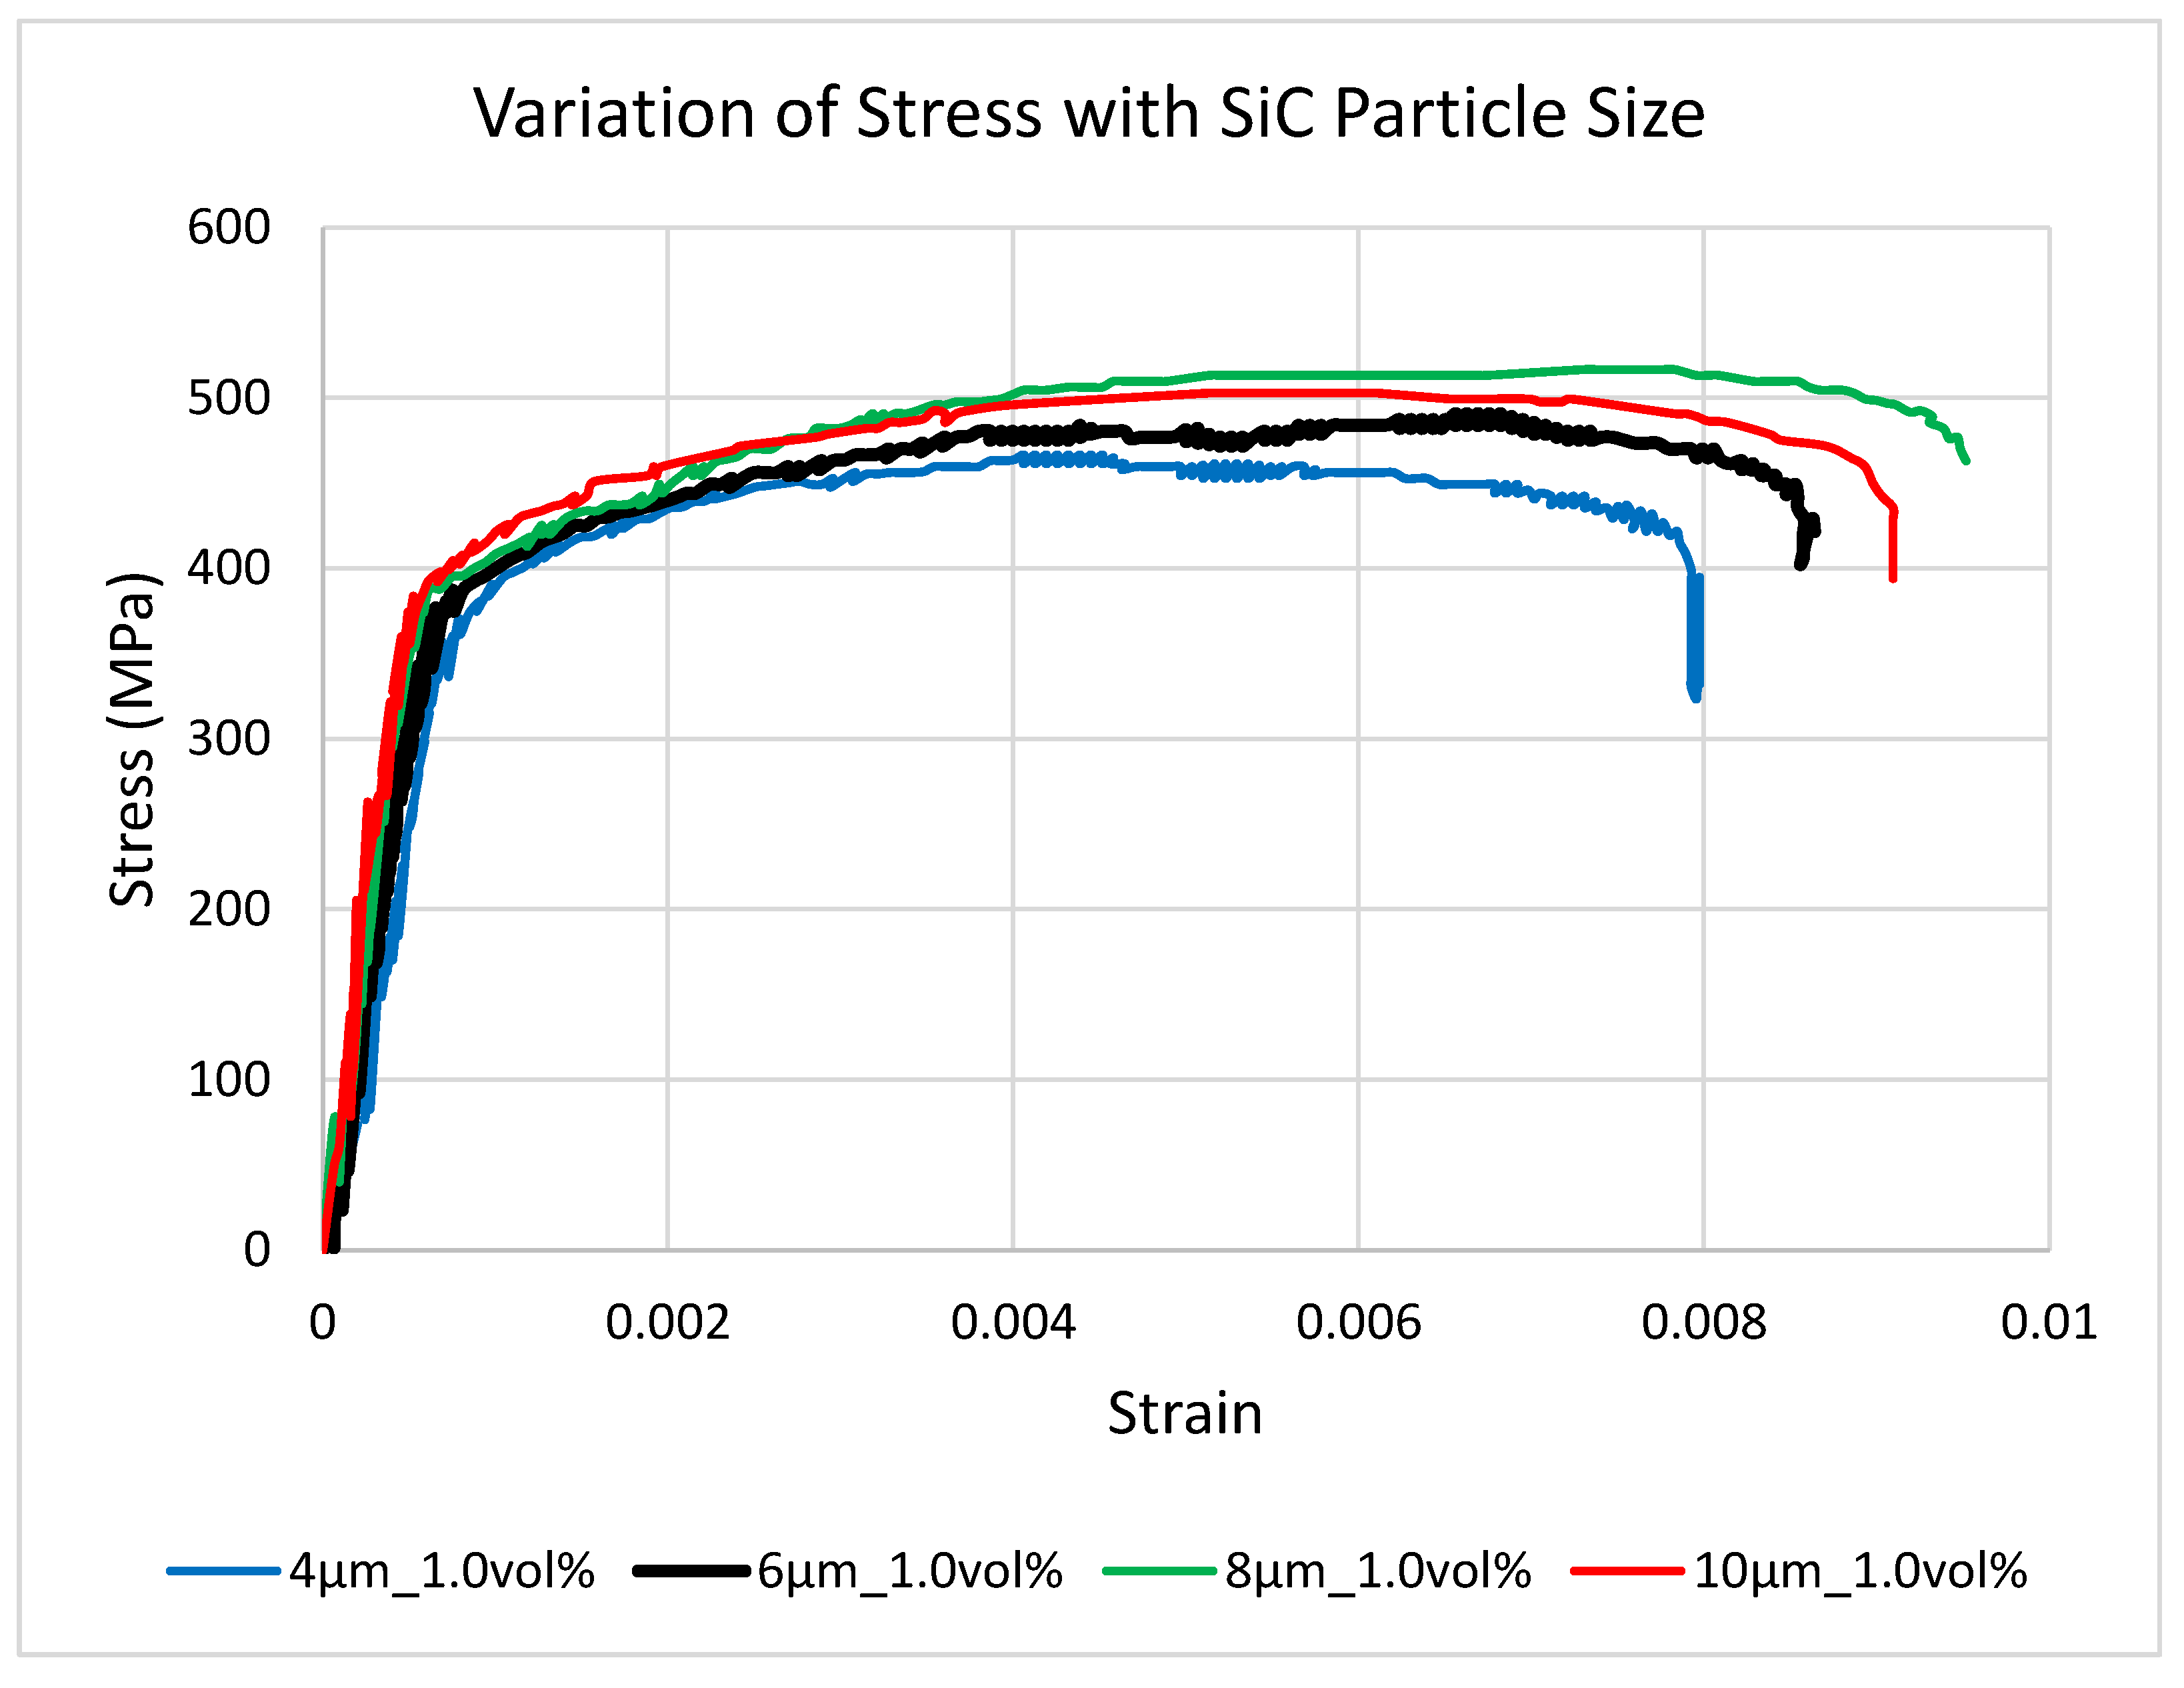
Figure 7.
Stress strain graphs for variation of stress with SiC volume percentage.
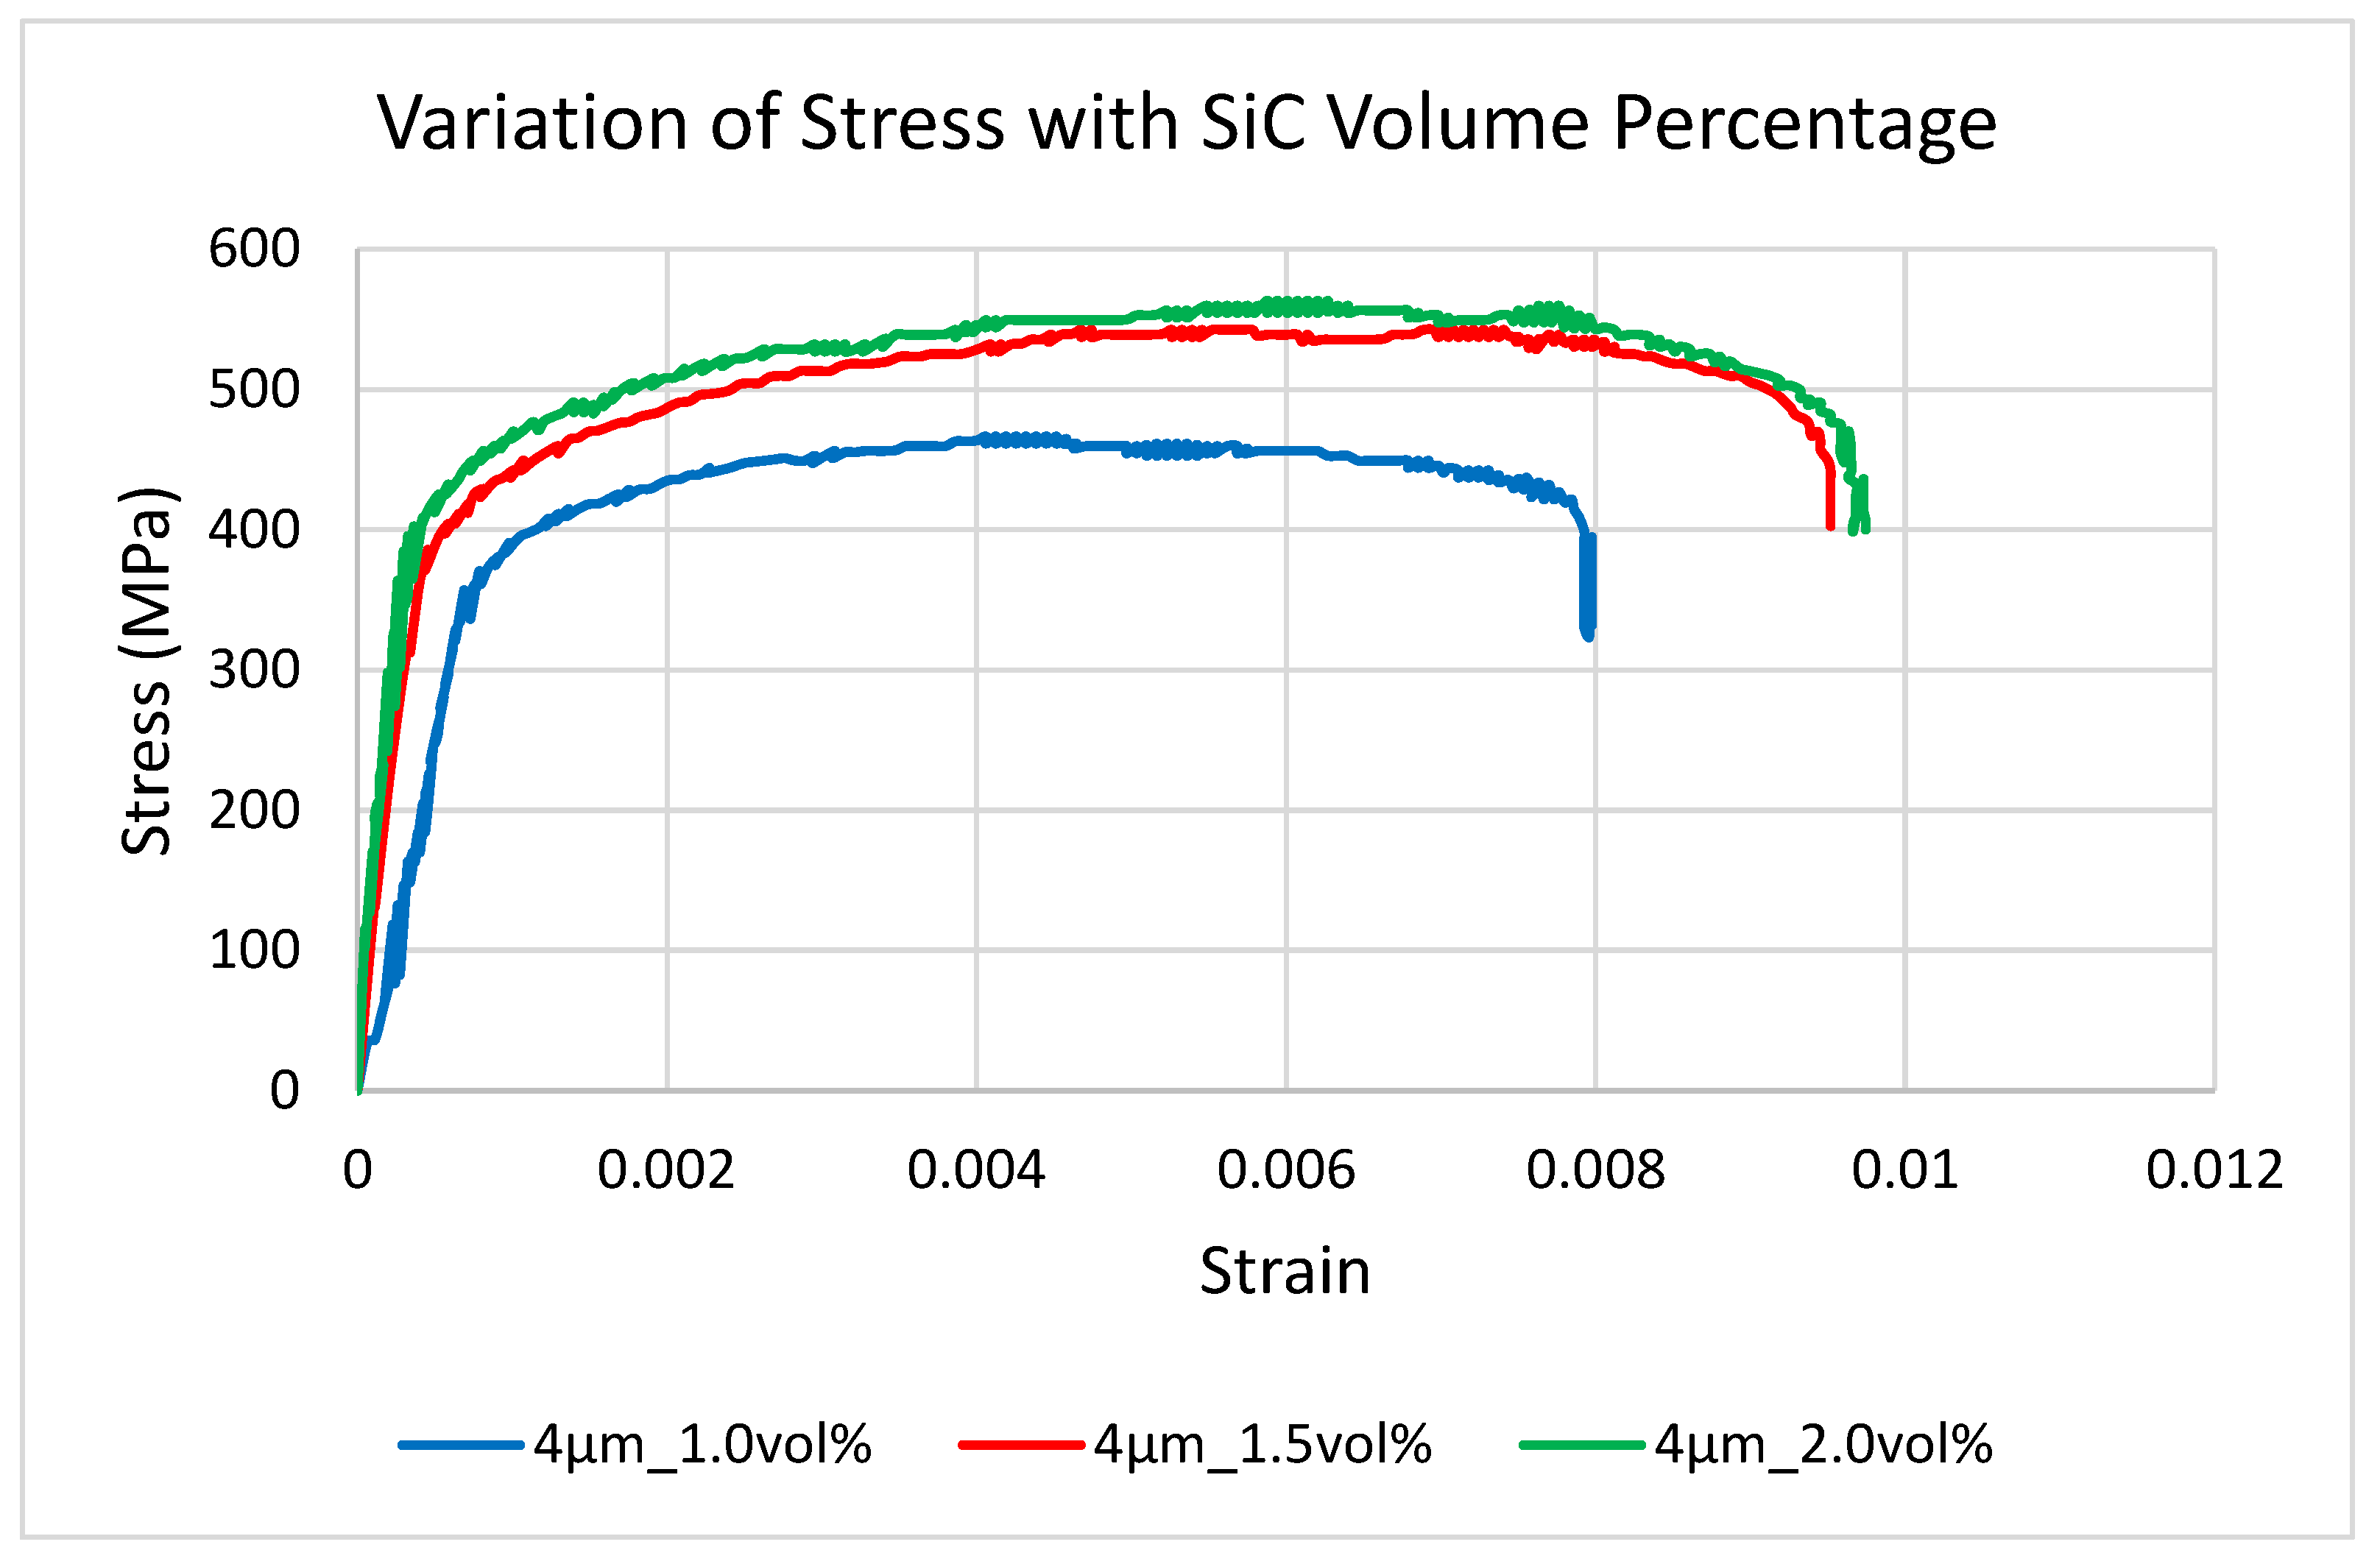
Figure 8.
SEM images of AZ91D and SiC/AZ91D (a) As cast AZ91D (b) 1.0% 4µm SiC/AZ91D composite (c) 1.5% 4µm SiC/AZ91D composite (d) 2.0% 4µm SiC/AZ91D composite (e) 1.0% 8µm SiC/AZ91D composite (f) 1.0% 6µm SiC/AZ91D composite (g) 1.0% 10µm SiC/AZ91D composite.
Figure 8.
SEM images of AZ91D and SiC/AZ91D (a) As cast AZ91D (b) 1.0% 4µm SiC/AZ91D composite (c) 1.5% 4µm SiC/AZ91D composite (d) 2.0% 4µm SiC/AZ91D composite (e) 1.0% 8µm SiC/AZ91D composite (f) 1.0% 6µm SiC/AZ91D composite (g) 1.0% 10µm SiC/AZ91D composite.
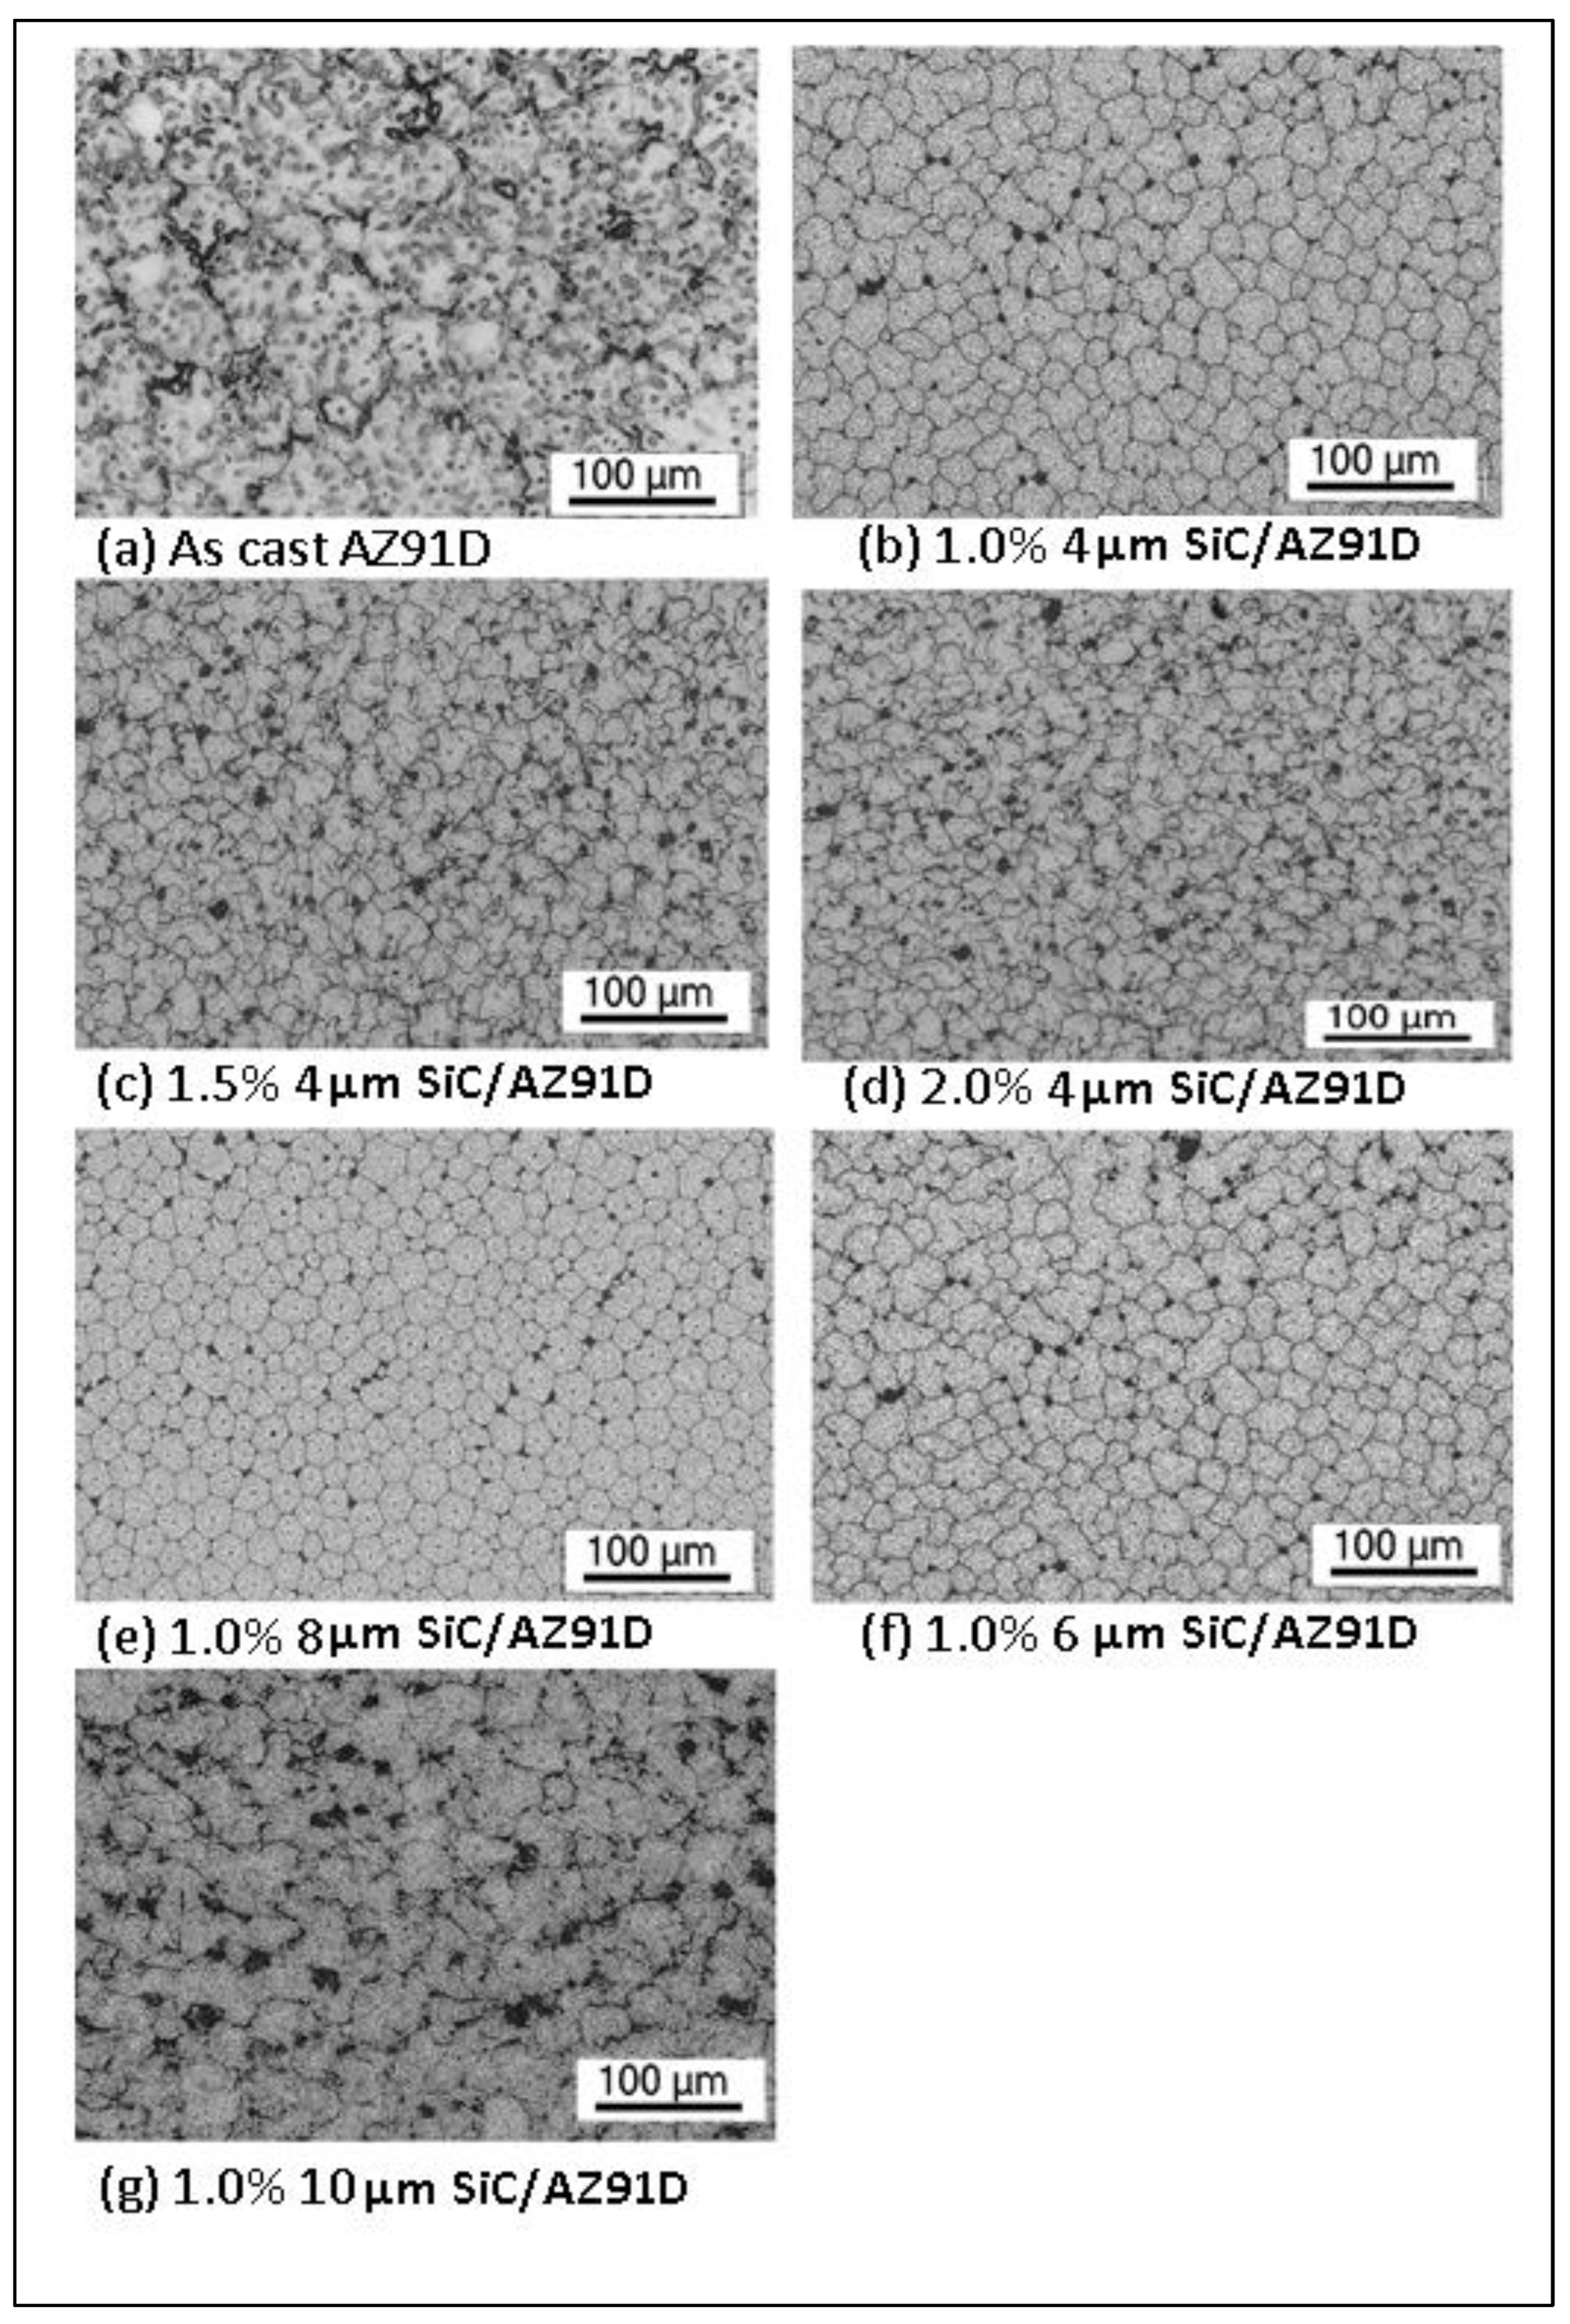

Table 1.
This is a table PCA, VIF and OLS regression results.
| PCA and VIF Results | ||||||||
|---|---|---|---|---|---|---|---|---|
| PCA | LNSiC_vol_perc | LNSiC_size_um | LNav_grain_um | target | ||||
| PC-1 | 0.544899 | 0.564968 | -0.515174 | -0.344227 | ||||
| PC-2 | 0.184861 | 0.355869 | -0.026055 | 0.915699 | ||||
| PC-3 | 0.587333 | 0.080963 | 0.795143 | -0.127410 | ||||
| PC-4 | -0.569167 | 0.740009 | 0.318850 | -0.163615 | ||||
| Explained Variance | 0.475408 | 0.223562 | 0.175407 | 0.125623 | ||||
| VIF | 3.071570 | 3.452955 | 2.001622 | 3.297183 | ||||
| OLS regression of target variable with independent variables | ||||||||
| coef | Std error | t | P>|t| | 95% CI | ||||
| const | 4.2299 | 0.089 | 47.329 | 0.000 | 4.052 | 4.408 | ||
| LNSiC_vol_perc | 0.0967 | 0.033 | 2.907 | 0.005 | 0.031 | 0.163 | ||
| LNSiC_size_um | -0.0851 | 0.025 | -3.398 | 0.001 | -0.135 | -0.035 | ||
| LNav_grain_um | 0.0182 | 0.031 | 0.583 | 0.562 | -0.044 | 0.080 | ||
| Durbin-Watson statistic | 0.662 | Jarque-Bera | 0.491 | |||||
| Omnibus probability | 0.850 | Condition number | 9.52 | |||||
| Omnibus | 0.325 | Skew | -0.107 | |||||
| Jarque-Bera test probability | 0.782 | Kurtosis | 2.692 | |||||
Table 2.
Performance of algorithms.
| Metric | PSO-LGBM | PSO-DT | PSO-XGBoost | PSO-GBR |
|---|---|---|---|---|
| Accuracy (%) | 88.2 | 82.4 | 76.5 | 76.5 |
| Precision (%) | 83.3 | 83.3 | 75 | 83.3 |
| Recall (%) | 100 | 90.9 | 90 | 83.3 |
| F1-Score (%) | 90.9 | 86.95 | 81.8 | 83.3 |
| Execution Time (s) | 41.87 | 12.56 | 25.55 | 406.92 |
Table 3.
Properties from PSO-LGBM model and SolidWorks simulation.
| Properties from SolidWorks simulation | |||||
|---|---|---|---|---|---|
| SiC size (µm) | SiC Volume (%) | Yield strength (MPa) | UTS (MPa) | E (GPa) | Total % Elongation |
| 4 | 1 | 435 | 523.3 | 107.61 | 0. 8843 |
| 6 | 1 | 439 | 530.9 | 108.69 | 0.8879 |
| 8 | 1 | 443 | 522.3 | 108.96 | 0.8806 |
| 10 | 1 | 448 | 535.2 | 110.57 | 0.8390 |
| 4 | 1.5 | 465 | 532.1 | 114.88 | 0.8188 |
| 4 | 2 | 501 | 524.2 | 122.66 | 0.7996 |
| Optimal Properties from PSO-LGBM model | |||||
| SiC size (µm) | SiC Volume (%) | Yield strength (MPa) | UTS (MPa) | E (GPa) | Total % Elongation |
| 4.21 | 1.0865 | 434.97 | 522.56 | 103.85 | 0.8015 |
Disclaimer/Publisher’s Note: The statements, opinions and data contained in all publications are solely those of the individual author(s) and contributor(s) and not of MDPI and/or the editor(s). MDPI and/or the editor(s) disclaim responsibility for any injury to people or property resulting from any ideas, methods, instructions or products referred to in the content. |
© 2025 by the authors. Licensee MDPI, Basel, Switzerland. This article is an open access article distributed under the terms and conditions of the Creative Commons Attribution (CC BY) license (http://creativecommons.org/licenses/by/4.0/).
Copyright: This open access article is published under a Creative Commons CC BY 4.0 license, which permit the free download, distribution, and reuse, provided that the author and preprint are cited in any reuse.


