
Submitted:
04 July 2025
Posted:
04 July 2025
You are already at the latest version
Abstract
Fisheries management in Abu Dhabi has undergone significant transformation over the past two decades, shifting from an open-access system to a more regulated framework aimed at stock recovery and sustainability. This study evaluates the status of 13 commercially important fish species – accounting for 95% of total landings - using two complementary stock assessment methods: CMSY++, a Bayesian catch-based model, and the Length-Converted Catch Curve (LCCC), a length-based mortality estimation approach. Fisheries-dependent and independent data collected from 2001 to 2024 were analysed to assess trends in biomass, exploitation rates, and spawning stock biomass per recruit (SBR). CMSY++ outputs indicate that in 2005, only one out of 13 stocks were sustainable, with biomass (B) above BMSY and fishing mortality (F) below FMSY and five stocks were overexploited. By 2024, seven stocks had recovered to sustainable levels, with biomass at or above BMSY and exploitation rates below FMSY. LCCC results for 2024, further confirm these findings, with most species exhibiting SBR values above the 30% threshold, except for Lethrinus nebulosus, which remains close to overexploitation limits. The observed stock recovery coincides with effective governance and key fisheries management measures, including effort reduction, gear restrictions, and spatial protections. While most stocks are now within sustainable biological reference points, transboundary species such as Scomberomorus commerson require continued regional cooperation for effective management. These findings contribute to ongoing efforts to achieve and sustain fully sustainable fisheries in the Arabian Gulf, while aligning with international conservation frameworks, biodiversity protection goals and climate-resilient fisheries management strategies.
Keywords:
sustainable fisheries management
; stock assessment
; artisanal
; small-scale fisheries
; ecosystem approach
; fish recovery
; Arabian Gulf
1. Introduction
Marine fisheries continue to face intense pressures from overexploitation, habitat degradation, and climate variability, placing food security and coastal livelihoods at risk [7,9]. As global attention shifts from production-driven extraction to ecosystem-based sustainability, fisheries management is increasingly understood as a complex governance process that integrates ecological, economic, and social objectives [14,19,25,44]. Rather than applying uniform regulations, effective management adapts to local conditions, targeting key leverage points in fishing behavior, gear selectivity, and spatial-temporal effort distribution.
Central to contemporary management strategies are regulatory measures designed to moderate fishing mortality and allow stock recovery. These measures include direct controls such as total allowable catches (TACs) or quotas, and indirect controls such as gear restrictions, temporal closures, and spatial protections. In multispecies and small-scale fisheries (SSF), indirect measures, especially those influencing gear type and effort distribution, are widely used due to their practicality and effectiveness in shaping selectivity and reducing juvenile mortality [19,43]. For instance, well-enforced gear bans can significantly alter size composition in catches, increasing the probability of individuals reaching reproductive maturity. Temporal and spatial closures further support recovery by protecting spawning aggregations and nursery habitats [43]. Effective outcomes depend on the design, timing, and enforcement of management measures, as well as their integration within the broader ecological context and social systems. Staged or sequenced interventions, such as introducing licensing, then limiting gear, then reducing overall effort, have been shown to stabilize or even reverse declines in spawning biomass and size-at-catch within relatively short timeframes [14]. Adaptive management approaches are particularly important in SSF, where multiple species and gear types interact within limited data frameworks and where stakeholder buy-in is critical to compliance.
The United Arab Emirates (UAE), and specifically Abu Dhabi, offers a relevant example of such transformation. The country has experienced rapid demographic expansion since the mid-20th century, with the population growing from under 100,000 in the 1960s to nearly 10 million by 2021 [13]. This growth has intensified pressure on marine ecosystems in the Arabian Gulf, a highly dynamic and low-productivity system already challenged by extreme temperatures and salinity [52,54]. The waters of the Arabian Gulf are in fact characterized by some of the most extreme sea temperatures globally. Summer sea surface temperatures regularly exceed 34 °C for extended periods and can surpass 35.5 °C, while winter lows can drop below 20 °C—creating “the largest annual temperature range occurring in marine systems globally” [13]. These extreme conditions are not new: sea temperatures as high as 36.5 °C were already recorded in the region in 1944 [12]. Episodes of fish mortality in the northern Arabian Gulf have been attributed to multiple environmental stressors—including extreme heat, algal blooms, and hypoxia—which are increasingly recognized as critical threats to the region’s marine ecosystems [3]. Despite these constraints, Abu Dhabi waters host diverse marine habitats, coral reefs, seagrasses, oyster beds and mangroves, that support biodiversity and commercially and ecologically important species [2,11,39]. Fisheries in Abu Dhabi waters represent a vital interface between traditional livelihoods and modern resource governance. In 2024, capture fisheries yielded 1,356 t of seafood with a market value of approximately US$ 5.7M, supporting the employment of over 1,900 individuals [19]. Fishing activity is entirely small-scale, with nearly 12,000 trips are now conducted annually only using Tarad boats—small-scale fiberglass vessels with outboard engines—while over 200 Lansh dhows, which previously operated mainly with Gargoor traps, have been retired. Scientific studies have repeatedly highlighted overexploitation in the UAE, with many stocks harvested below size-at-maturity and exhibiting low spawning biomass per recruit [1,19,30]. In response, the Environment Agency – Abu Dhabi (EAD) initiated a suite of regulatory and policy reforms beginning in the early 2000s following an ecosystem approach and aimed at reshaping the fisheries sector, reducing fishing effort and improving the status of fish resources. Management of the sector relies on a broad ecosystem perspective and a blend of spatial and gear-based regulations designed to improve selectivity and reduce pressure on vulnerable stock and the environment. These efforts have culminated in the exclusive use of traditional, static, highly selective, and non-bottom-impact gears, such as handlines (Hadaq) and stationary pound nets (Hadhra), which accounted for 43% and 38% of landings in 2024, respectively. Key reforms included the ban of the two most productive fisheries: the 2018 ban on pelagic Ghazal nets and the 2019 prohibition of wire fish traps known as Gargoor (Figure 1). Both measures represented major policy milestones, as landings dropped by approximately 74% between 2018 and 2020 following their implementation. These gear types had been associated with high levels of juvenile catch, ghost fishing, and broader ecological impacts. This was accompanied by a broader effort reduction strategy, enhanced monitoring, and improved compliance. The reform timeline also included licensing systems, gear limits, and spatial protections, all aimed at reducing fishing mortality and improving catch selectivity [18]. Presently, handlines (Hadaq) and stationary pound nets (Hadra) are the only gear allowed across all fishing grounds, while in designated Buhoor zones, traditional fishing areas of co-management with exclusive access, permit holders may also use traditional encircling nets (Defara) and fixed gillnets on stakes (Sakkar). Such management measures reflect a deliberate transition from passive monitoring to active recovery, aligning with global best practices for rebuilding depleted stocks in multispecies contexts [20,43]. Early acoustic surveys and independent assessments now indicate encouraging signals of recovery for several species, with significant increases in total fish biomass and shifts in size structure reported between 2020 and 2024 [17,18,19].
In the context of Abu Dhabi, both catch-based and length-based methods offer practical alternatives to traditional assessment approaches that rely on comprehensive effort and abundance data. This study evaluates the stock status and recent trajectories using a combination of length frequency, CPUE and landings data for 13 commercial key fish species, accounting for 95% of total landings in 2024 [19], including Flavocaranx bajad, Chanos chanos, Epinephelus coioides, Gerres longirostris, Lethrinus nebulosus, Lutjanus ehrenbergii, Moolgarda seheli, Rhabdosargus sarba, Scomberoides commersonnianus, Scomberomorus commerson, Siganus canaliculatus, and Sphyraena jello in Abu Dhabi waters. Two complementary methods are employed: the CMSY++ model, which reconstructs biomass trends from catch and CPUE data between 2005 and 2024; and the Length-Converted Catch Curve (LCCC) method, applied to high-resolution monthly length-frequency data collected in 2024. These assessments are further supported by SBR analysis between 2005 and 2024 and long-term comparisons of length-frequency with maturity-length thresholds, providing insight into stock recovery and the effectiveness of post-2019 management reforms. Observation of biological responses to changes in fisheries regulations, this study contributes to regional knowledge on fisheries recovery in the Abu Dhabi waters and offers transferable insights for fisheries management globally and particularly in the context of SSF.
2. Materials and Methods
Study Area and Data Sources
This study focused on 13 key fish stocks regularly landed in the artisanal fisheries of Abu Dhabi waters (Figure 2). These include seven demersal reef-associated species and six pelagic or benthopelagic species (Table 1). Together, they span a wide range of ecological roles, trophic strategies, and life-history traits, and constitute the core of the regions small-scale commercial fisheries. The importance of these species has grown over time: in 2005, they accounted for approximately 70% of the total landings in Abu Dhabi waters, rising to 95% by 2024 (Figure 2).
Data were collected through a structured monitoring program initiated in 2001 by the Environment Agency – Abu Dhabi (EAD), which includes landings, effort, and biological sampling components. Landings data were compiled from 2005 to 2024 for all key species. Catch-per-unit-effort (CPUE) records were available across the full time series (2005–2024) for eight species, while the remaining five species had data from 2018 onward (Table 1). Data collection followed a mixed survey design combining census reporting for fishing effort with stratified random sampling for landings data [46,49]. The fishing fleet was stratified by landing port and gear type. Trip-level data - including fishing time, catch weight, species composition, prices, average size, and fishing gear used - were collected through direct field observations by professional staff and from logbooks managed by the National Guard Command.
Length-Frequency Data
Length-frequency (LF) data were obtained from commercial landings sampled at landing sites across Abu Dhabi (Figure 3). LF monthly data were available intermittently between 2000 and 2024 for all species, with temporal resolution varying by species depending on sampling intensity and availability (Table 1). Since 2019, sampling intensity increased. For each species, a minimum of 200 individuals was measured monthly, with samples drawn randomly and in proportion to landings. Fork length (FL) was measured to the nearest cm for all species, except Epinephelus coioides, for which total length (TL) was recorded due to its rounded caudal morphology.
LF data from 2024 were used for estimating growth parameters, mortality rates, length-converted catch curves, and SBR. Historical LF data were also used, where available, to reconstruct SBR estimates and examine long-term trends. To assess the effects of regulatory reforms introduced in 2019, particularly gear bans and effort reduction measures, length distributions were compared across pre-2019 and post-2019 periods. M. seheli was excluded due to the absence of historical length data, while C. chanos was represented only in the post-2019 dataset and parameter estimation of R. sarba was performed in 2023. Specifically, the proportion of catch above and below the species-specific length at maturity (Lm) and mean size at first capture (Lc) were examined to evaluate potential changes in size structure associated with management measures. Lm were compiled from regional literature, previous assessments conducted by EAD, and published sources. Only data verified for consistency and methodological comparability were retained for analysis.
Estimation of Growth Parameters and Natural Mortality
Growth parameters were estimated using the Electronic Length Frequency Analysis with Genetic Algorithm (ELEFAN_GA) routine from the TropFishR package in R [45]. This method fits the von Bertalanffy Growth Function (VBGF) to length-frequency data by optimizing the alignment between observed cohort modes and theoretical growth trajectories. The genetic algorithm explores combinations of L∞ and k to maximize a fit score (Rn), which reflects the consistency of modal progression over time.
Length data from 2024 were binned into 1 cm size intervals across monthly strata (January to December). The fitting procedure was implemented with default parameters: a population size of 50, mutation probability of 0.1, and 100 bootstrap iterations to estimate confidence intervals for growth parameters. To improve convergence and reduce biologically implausible solutions, the search range for L∞ was bounded using initial estimates derived from the Powell-Wetherall method [55] and the observed maximum length Lmax. Seasonal growth oscillations were not included, assuming continuous recruitment throughout the year. However, the anchoring parameter tanchor, which positions the growth curve in relation to the annual cycle, was estimated in all models to ensure proper temporal alignment of cohort progression.
Natural mortality (M) was estimated within the TropFishR framework using the empirical approach of Pauly [45], which integrates the von Bertalanffy growth parameters with ambient water temperature. For each species, the estimates of L∞ and k obtained from the ELEFAN_GA procedure were used as inputs [45]. The empirical equation from Pauly [45]:
Where k and L∞ are derived from the von Bertalanffy growth function and T is the annual mean water temperature. A fixed annual mean sea surface temperature of 28°C was assumed, consistent with long-term environmental observations in Abu Dhabi waters.
Length-Converted Catch Curve (LCCC)
Total mortality (Z) was estimated for each species using the Length-Converted Catch Curve (LCCC) method as implemented in the catchCurve function of the TropFishR package [45]. This approach fits an exponential decline to the right limb of the LF distribution under the assumption of steady-state population dynamics, constant recruitment, and a fixed growth rate. Monthly LF data from 2024 were pooled for each species, and individuals smaller than the length at first full recruitment (Lr) were excluded from the regression analysis to avoid bias from partial selectivity. The regression interval was selected manually based on visual inspection of the catch curve and the corresponding probability of capture curve generated from the length-converted ogive. The slope of the descending limb of the length-frequency distribution, when transformed logarithmically, provided an estimate of Z following the equation:
where NL is the number of fish in length class L and tL is the relative age corresponding to length L, derived from the inverse VBGF. Species-specific growth parameters (L∞, k, and t0) were used to calculate the age-length relationship.
For each species, total mortality was derived from the regression slope and later partitioned into M and fishing mortality (F = Z – M). Selectivity was determined using backward extrapolation of the length-converted catch curve to estimate the probability of capture [48]. Selectivity curves were fitted using a logistic function applied to capture probabilities by size class. The mean age at first capture (tc) was obtained by converting the mean size at first capture using the inverse von Bertalanffy growth function.
The exploitation rate (E) was estimated as the proportion of fishing mortality relative to total mortality:
Stock status was assessed using the Beverton and Holt (1957) model to estimate the SBR. SBR was expressed as a proportion of the unexploited level:
where Nt is the number of fish surviving to age t, Wt is the mean weight at age t and Gt is the fraction of mature fish at age t and set to 0 if t < tm and 1 if t ≥ tm where tm is the mean age at first sexual maturity.
SBR was evaluated against biological reference points, with threshold values of 40% (target level) and 30% (limit level) of the unexploited biomass (Mace, 1994). Stocks with SBR < 30% were classified as overexploited, while stocks with SBR > 30% were considered sustainably exploited.
CMSY++
The CMSY++ method is an advanced Bayesian state-space approach for stock assessment in data-limited fisheries. It builds upon the original CMSY model [23,25,26] and incorporates improvements in statistical modelling, computational efficiency, and parameter estimation [23]. CMSY++ applies a modified Schaefer surplus production model to estimate key fisheries reference points, including Maximum Sustainable Yield (MSY), fishing mortality at MSY (FMSY), stock biomass at MSY (BMSY), relative biomass (B/BMSY), and the ratio of current fishing mortality to FMSY (F/FMSY). The model requires historical catch data as its primary input and integrates prior knowledge on stock productivity (r) and carrying capacity (k) to estimate biomass trajectories and exploitation status over time. When available, fisheries-independent abundance indices or catch-per-unit-effort (CPUE), or biomass can be incorporated into the analysis, improving the precision of biomass and fishing mortality estimates. The model employs a fully Bayesian Markov Chain Monte Carlo (MCMC) framework within a single JAGS model, and recently assisted by An Artificial Neural Network (ANN) in selecting objective priors for allowing more robust parameter estimation [23]. It introduces multivariate normal priors for r and k in logarithmic space, which enhances the selection of optimal r-k pairs and improves model convergence. A key feature of CMSY++ is its ability to handle fragmented or short time series of abundance data, making it particularly suitable for data-limited fisheries where conventional age-structured assessments are impractical [24]. The model also accounts for declining productivity at low biomass levels by applying a linear reduction in surplus production when biomass falls below one-fourth of the estimated carrying capacity [26]. The outputs of CMSY++ include numerical estimates of stock status along with visual representations, such as Kobe plots, which illustrate the historical trajectory of stock exploitation and biomass relative to MSY. Retrospective analysis is also possible, enabling the assessment of model consistency over time. Given its flexibility and ability to function with minimal data, CMSY++ is widely applicable for evaluating fishery sustainability, particularly in regions where traditional stock assessment methods are not feasible [23].
3. Results
This section may be divided by subheadings. It should provide a concise and precise description of the experimental results, their interpretation, as well as the experimental conclusions that can be drawn.
3.1. Length-Based Assessment
The growth coefficient k ranged from 0.10 yr-1 (S. commerson and S. commersonnianus) to 1.00 yr-1 (S. canaliculatus). while L ranged from 24.2 cm (Lutjanus ehrenbergii) to 145 cm (Sphyraena jello). M estimates ranged from 0.19 yr -1 (E. coioides) to 0.70 yr -1 (M. seheli), while Z estimates ranged from 0.41 yr -1 (L. nebulosus) to 1.21 yr -1 (S. canaliculatus) (Table 2). The lowest F was estimated for G. longirostris (0.09 yr-1), while the highest was for C. chanos (0.58 yr -1). Mean length at first capture Lc ranged from 19.1 cm (L. ehrenbergii) to 88.8 cm for (S. jello), and the corresponding mean age at first capture tc ranged from 1.1 years (L. ehrenbergii and R. sarba) to 3.3 years (L. ehrenbergii).
Spawning biomass per recruit (SBR2024) and exploitation rates (E2024) exhibited considerable variation across the assessed stocks (Figure 5D). Of the 13 species, 12 of them had SBR2024 estimates exceeding the 30% threshold, while only L. nebulosus had lower 26.3%. In addition, E. coioides and L. nebulosus showed the only high rates with E2024 at 0.54 and 0.51 respectively (Table 2; Figure 5D).
Length-frequency distributions before and after 2019 were compared for 12 out of the 13 assessed species (Figure 4). A general shift toward larger modal lengths was observed in several species in post-2019 period. Furthermore, according to 2024 parameter estimations, Lcatch was higher than Lmaturity for ten species except for F. bajad and E. coioides (Figure 4).
3.2. Catch-Based Assessment
In 2005, five stocks including L. ehrenbergii, L. nebulosus, S. commerson, E. coioides, and G. speciosus were in overexploited status, with higher fishing pressure and lower biomass than the threshold (F2005/FMSY > 1 and B2005/BMSY < 1 respectively; Figure 5A; Table 2). S. canaliculatus was with both high F2005/FMSY and B2005/BMSY while both indicators were below threshold for seven stocks as C. chanos, F. bajad, S. commersonnianus, M. seheli, S. jello, R. sarba, and G. speciosus. G. longirostris was the only stock with B2005/BMSY > 1 and F2005/FMSY < 1.
In 2015, six stocks including G. speciosus, L. nebulosus, E. coioides, R. sarba, S. commerson, and S. commersonnianus remained overexploited (Figure 5B, Table 2). S. canaliculatus, F. bajad, and S. jello were with B2015/BMSY close to or slightly above 1.
In 2024, ten stocks were below the F2024/Fmsy threshold. Among these, F. bajad, C. chanos, S. jello, M. seheli, L. ehrenbergii, R. sarba, and G. longirostris were with high biomass (B2024/BMSY > 1) (Figure 5C, Table 2).
According to Table 2, landings in 2024 were below MSY for all stocks except L. ehrenbergii and C. chanos, with Landings 2024/MSY values ranging from 0.05 (L. nebulosus) to 1.19 (L. ehrenbergii). F2024 ranged from 0.02 (S. commersonnianus) to 0.36 (L. ehrenbergii), while F2024/FMSY varied below threshold (<1.0) between 0.19 and 0.87. B2024/BMSY over sustainability threshold (>1.0) for eight stocks, with the highest value recorded for G. longirostris (1.49) and the lowest for L. nebulosus (0.21).
4. Discussion
In this study, the recovery trajectory of small-scale multispecies fisheries in Abu Dhabi reflects a broader transition from intense exploitation to gradual rebuilding driven by an ecosystem approach and regulatory reforms. Such transitions, often driven by cumulative impacts of open-access pressure, data-poor governance, and increasing market demand, are well documented across tropical and subtropical fisheries [7,53]. While many coastal fisheries continue to experience depletion, the post-2019 recovery observed here highlights the role of effective governance and targeted management interventions in reversing stock declines. Consistent with findings from other regions undergoing staged management transitions [37,50,51], the Abu Dhabi case demonstrates that effective, science-based governance - combined with indirect controls such as effort reduction, gear bans, spatial restrictions, and regulated access - can be effective even in complex, multispecies fisheries and under extreme climate conditions. In this context, the combined use of CMSY++ and LCCC methods offered complementary perspectives on the status and recovery of 13 marine fish stocks, highlighting both the promise and the challenge of data-limited assessment tools [6,25,42].
The improvements in stock status were observed in both length-based and catch-based assessments. CMSY++ results indicate that by 2024, seven out of thirteen assessed stocks under sustainably exploited status which they had stock indicator values within thresholds (B2024/BMSY > 1.0, and F2024/FMSY < 1.0), while six of them in recovery status. LCCC results indicate that by 2024, twelve stocks had SBR values above 30%, and eleven of them also had E values below 0.5. Although the two approaches broadly agree on overall trends, they occasionally diverge at the species level. For example, L. nebulosus is classified as overexploited based on LCCC-derived SBR (26.4%) but considered in a recovery phase under CMSY++ (B2024/BMSY = 0.58, F2024/FMSY = 0.38). Our results also illustrate both the potential and the limitations of data-limited assessment methods in multispecies fisheries. CMSY++, a catch-based surplus production model, captures long-term exploitation dynamics and allows broad inferences about stock status under limited data availability [6,25]. In contrast, LCCC offers year-specific snapshots of stock structure derived from length composition and current mortality rates [42]. Hence, slight inconsistencies reflect methodological differences rather than contradictions: LCCC assesses instantaneous size-based structure, while CMSY++ reconstructs long-term biomass trajectories using catch and CPUE data. Notably, CPUE in this study was used as a proxy for relative abundance, which ensured that recent declines in total landings - from an average of about 5,000 tonnes between 2005 and 2018 to approximately 1,200 tonnes after 2020 [18] - did not distort the reliability of the proxy. These patterns highlight the importance of integrating fishing effort data into future assessments to improve model sensitivity and temporal resolution. In such mixed fisheries, method triangulation enhances diagnostic reliability by accommodating uncertainty in data quality, parameter assumptions, and temporal scope ([6,28,42].
A closer examination of LF patterns before and after the 2019 regulatory changes reveals how management interventions shaped observed biological improvements. Pre-2019 distributions for several key species, particularly F. bajad, E. coioides, and G. longirostris, were heavily skewed toward smaller individuals, with a significant portion of catches falling below estimated length at maturity. Post-2019 data show modal lengths shifting upward, often aligning more closely with or exceeding maturity thresholds. This was especially evident in S. commersonnianus, where the proportion of immature individuals declined markedly, suggesting improved size selectivity. Species like G. speciosus and L. ehrenbergii exhibited relatively stable size structures across years which indicates species-specific responses to management. Because the shifts in size distribution correspond to major regulatory changes, most notably the ban on wire fish traps (Gargoor) and pelagic nets (Ghazal) and the restriction of handlines (Hadaq) as the main gear in many zones, which effectively improved selectivity, eliminated by-catch and ghost fishing and limited juvenile retention. Gear-based catch data corroborate these patterns: prior to the reforms, traps accounted for 65% of landings and captured a broad size spectrum of demersal species, while nets and handlines (Hadaq) produced more selective but lower-yield harvests [17,18,19]. High CPUE values for L. ehrenbergi and L. nebulosus in trap fisheries (9.32 and 6.87 kg/day, respectively) highlight the intensity of past exploitation pressure, particularly on slow-growing, high-value species. These observations echo earlier studies from the region [30,31,32,33,34,35,36], and are consistent with wider trends observed in Bangladesh and Indonesia, where enforceable legal transitions and co-management arrangements led to improved selectivity and stock recovery [9,40].
While the overall trend is positive, recovery has been uneven across taxa and has been further shaped by species-specific biological and ecological traits. Comparisons across life-history parameters suggest that faster-growing stocks, both pelagic and demersal, responded more rapidly to reduced exploitation. L. nebulosus, a key demersal species with low growth rate (k = 0.1), remain below biological reference points in both SBR% and B/BMSY estimates. However, it continues to show consistent signs of recovery, with improvements in key parameters suggesting a likely exit from overexploitation in the near future. Its ecological importance and high exploitation levels are underscored by recent catch surveys, where both ranked among the top three species by biomass in 2022 [16,17]. This is further corroborated by its low SBR2024 values (26.4%). The persistence of unsustainable biomass, despite management measures, highlights the compounding effects of historical depletion, gear overlap, and selective pressure. In contrast, demersal species like G. longirostris (k = 0.3) and R. sarba (k = 0.6), and pelagic species such as S. jello and M. seheli (k = 0.4 and 0.3, respectively), exhibited stronger signs of recovery. LCCC results for these stocks similarly reflect SBR2024 values exceeding 40%, in line with improved reproductive potential under reduced fishing pressure. These outcomes are consistent with theoretical expectations and are in line with multispecies recovery patterns documented in the Azores and Yellow Sea [22,47]. Beyond stock-level trends, ecological and policy implications are significant. Rising biomass in reef-associated and coastal species could enhance trophic structure and habitat function, contributing to system-wide resilience. From a governance perspective, these results validate the UAE National Framework Statement for Sustainable Fisheries (2019–2030) as an effective example of adaptive, stage-based regulation under uncertainty. Its integration of limit and target reference points for spawning biomass (as 30% for SBR) aligns with international best practices [14,56].
Our study on Abu Dhabi fisheries, contributes to global understanding of recovery dynamics in multispecies, SSF and the role of sustainable management based on traditional and low-impact gear types. It demonstrates that meaningful biomass recovery is achievable within a decade when effective governance is in place and an ecosystem approach to fisheries is implemented, with reduced fishing pressure, improved selectivity, and compliance is consistent. It also reinforces the need for species-level assessment, given the ecological divergence across target groups. Finally, Notably, the recovery was achieved without reliance on extensive real-time data or quota systems, highlighting that science-based, implemented, and biologically informed regulations can yield meaningful conservation outcomes, even in complex fisheries and under extreme climate conditions [9; 53; 21]. The Gulf, in this context, serves as a natural laboratory for studying fisheries management under the influence of extreme sea temperatures [29].
Corroborating the above findings, results from a comprehensive fisheries-independent acoustic survey conducted in 2023–2024 - when compared with a similar survey from 2016 - showed a marked increase in pelagic biomass indices. Despite variability and limitations in direct comparability between the datasets, this substantial increase may indicate a real rise in pelagic biomass in the UAE’s Arabian Gulf waters [41].
Yet further progress will depend on addressing several challenges. First, continued data collection, particularly on fishing effort, gear selectivity, and biological reference points, is essential to reduce uncertainty in model outputs. Second, regional cooperation is crucial for migratory species such as S. commerson, whose stock spans jurisdictions and may remain exposed to exploitation elsewhere [4, 5, 38, 31). Third, climate variability and habitat change may alter growth, recruitment, and distribution patterns, requiring dynamic and adaptive management approaches.
Author Contributions
Conceptualization, Dario Pinello, Ahmed Esmaeil Alsayed Alhashmi, Mohamed Hasan Ali Al Marzooqi, Mohamed Abdulla Ahmed Almusallami, Franklin Francis, Shaikha Salem Al Dhaheri; methodology, Dario Pinello, Mohamed Abdulla Ahmed Almusallami, Ahmed Esmaeil Alsayed Alhashmi, Franklin Francis, Ahmed Tarish Al Shamsi; validation, Dario Pinello, Franklin Francis, Ahmed Tarish Al Shamsi, Ahmed Esmaeil Alsayed Alhashmi, Mohamed Hasan Ali Al Marzooqi, Mohamed Abdulla Ahmed Almusallami; formal analysis, Dario Pinello, Franklin Francis, Ahmed Tarish Al Shamsi, and Mohamed Abdulla Ahmed Almusallami; investigation, Dario Pinello, Ahmed Tarish Al Shamsi, Franklin Francis, Mohamed Hasan Ali Al Marzooqi; resources, Ahmed Esmaeil Alsayed Alhashmi, Mohamed Abdulla Ahmed Almusallami, Mohamed Hasan Ali Al Marzooqi; data curation, Dario Pinello, Franklin Francis, Ahmed Tarish Al Shamsi; writing—original draft preparation, Dario Pinello, Ahmed Esmaeil Alsayed Alhashmi, Mohamed Hasan Ali Al Marzooqi, Mohamed Abdulla Ahmed Almusallami, Franklin Francis, Ahmed Tarish Al Shamsi; writing—review and editing, Dario Pinello, Ahmed Esmaeil Alsayed Alhashmi, Shaikha Salem Al Dhaheri, Mohamed Hasan Ali Al Marzooqi, Mohamed Abdulla Ahmed Almusallami; visualization, Dario Pinello, Franklin Francis; supervision, Shaikha Salem Al Dhaheri, Ahmed Esmaeil Alsayed Alhashmi, Mohamed Hasan Ali Al Marzooqi; project administration, Dario Pinello, Ahmed Esmaeil Alsayed Alhashmi, Mohamed Hasan Ali Al Marzooqi, Mohamed Abdulla Ahmed Almusallami. All authors have read and agreed to the published version of the manuscript.
Funding
This research received no external funding.
Institutional Review Board Statement
Not applicable. This study did not involve human participants or live animals. The research was based solely on the analysis of data and did not involve any interaction with or impact on live specimens.
Acknowledgments
The authors are grateful to Dr. Nazli Demirel for her help during the stock assessment analysis; to Giuseppe Scarcella for his training and valuable insights on the CMSY++ model; to Giuseppe Scarcella for his training and valuable insights on the CMSY++ model; to Shamsa Al Hameli for her input on sharks, elasmobranchs, their habitats, and protection measures; to Duncan Leabitter for his thoughtful comments on the interactions between fisheries and the ecosystem; and to Nicola Ferri for his valuable contributions on governance aspects. During the preparation of this manuscript, the authors used R and associated packages to conduct statistical analyses, implement the CMSY++ and Length-Converted Catch Curve (LCCC) methods, and prepare all graphs and visual outputs. The LCCC method was applied using the catchCurve function from the TropFishR package. The authors have reviewed and edited the output and take full responsibility for the content of this publication.
Conflicts of Interest
The authors declare no conflicts of interest.
References
- Al Abdessalaam, T.Z. Length-frequency data for five commercially important species from Abu Dhabi (June 2000–June 2001). In Beech, M., Ed. The Fish Fauna of Abu Dhabi Emirate; Environmental Agency–Abu Dhabi: Abu Dhabi, United Arab Emirates, 2002; pp. 166–167. [Google Scholar]
- Al Hameli, S.; Al Dhaheri, H.; Al Zaabi, S.; Al Mazrouei, A.; Al Shehhi, M.; Al Suwaidi, K. Assessing threats to marine biodiversity in Abu Dhabi. Endanger. Species Res. 2024, 53, 89–95. [Google Scholar] [CrossRef]
- Al Ansi, M.A.; Abdel Moati, M.A.R.; Al Ansari, I.S. Causes of fish mortality along the Qatari waters (Arabian Gulf). Int. J. Environ. Stud. 2002, 59(1), 59–71. [Google Scholar] [CrossRef]
- AlMusallami, M.; Dimech, M.; Francis, F.; Hamza, W.; Henderson, A.C.; Muzaffar, S.B.; Scarcella, G.; Alhashmi, A.E.A.; Al Marzooqi, M.H.A.; Pinello, D. Updated life history traits of narrow-barred Spanish mackerel, Scomberomorus commerson (Lacépède, 1800) of UAE waters in the southeastern Arabian Peninsula. Aquaculture, Fish and Fisheries. 2025, 10, 59. [Google Scholar] [CrossRef]
- AlMusallami, M.; Dimech, M.; Francis, F.; Hamza, W.; Henderson, A.C.; Muzaffar, S.B.; Scarcella, G.; Demirel, N.; Pinello, D. The stock status of narrow-barred Spanish mackerel, Scomberomorus commerson (Lacépède, 1800) by length-based assessment in the southern Arabian Gulf. Front. Mar. Sci. 2025, 11, 1492238. [Google Scholar] [CrossRef]
- Andrade, H.A.; Mesnildrey, L.; Fernandes, C.C.M.; Moura, D. Data-limited stock assessment methods in tropical multispecies fisheries: Challenges and opportunities. Front. Mar. Sci. 2021, 8, 661002. [Google Scholar] [CrossRef]
- Andriamalala, G.; Gardner, C.J. Laying the foundations for an effective co-management system: The role of community social capital; Blue Ventures Conservation Report: Antananarivo, Madagascar, 2010. [Google Scholar]
- Bahri, T.; Vasconcellos, M.; Welch, D.J.; Johnson, J.; Perry, R.I.; Ma, X.; Sharma, R. (Eds.) Adaptive Management of Fisheries in Response to Climate Change; FAO Fisheries and Aquaculture Technical Paper No. 667; FAO: Rome, Italy, 2021. [Google Scholar] [CrossRef]
- Bailey, M.; Mulyasari, F.; Viswanathan, K.K. Law, practice, and fisheries performance: Exploring relationships in the Indonesian context. Mar. Policy 2022, 143, 105111. [Google Scholar] [CrossRef]
- Barange, M.; Bahri, T.; Beveridge, M.C.M.; Cochrane, K.L.; Funge-Smith, S.; Poulain, F. (Eds.) Impacts of Climate Change on Fisheries and Aquaculture: Synthesis of Current Knowledge, Adaptation and Mitigation Options; FAO Fisheries and Aquaculture Technical Paper No. 627; FAO: Rome, Italy, 2018. [Google Scholar]
- Bento, R.; Burt, J.A.; González, J.; Feary, D.A.; Priest, M.A.; Bauman, A.G. Oyster beds in the United Arab Emirates: Important fishing grounds in need of protection. Mar. Pollut. Bull. 2022, 182, 113992. [Google Scholar] [CrossRef]
- Blegvad, H. 1944. Fishes of the Iranian Gulf. Einar Munksgaard: Copenhagen.Burt, J.A. The environmental costs of coastal urbanization in the Arabian Gulf. City 2014, 18, 760–770. [Google Scholar] [CrossRef]
- Burt, J.A.; Paparella, F. The marine environment of the Emirates. In A Natural History of the Emirates; Khan, M., Mallon, D.P., Eds.; Springer Nature: Cham, Switzerland, 2023; pp. 95–117. [Google Scholar] [CrossRef]
- Cochrane, K.L. A Fishery Manager’s Guidebook: Management Measures and Their Application; FAO: Rome, Italy, 2002. [Google Scholar]
- Dankel, D.J.; Skagen, D.W.; Ulltang, Ø. Fisheries management in practice: A review of 13 commercially important fish stocks. Reviews in Fish Biology and Fisheries 2008, 18(2), 201–233. [Google Scholar] [CrossRef]
- EAD. Abu Dhabi Fisheries & Aquaculture Bulletin: Fisheries and Aquaculture Production in the Emirate of Abu Dhabi – 2019; Environment Agency – Abu Dhabi: Abu Dhabi, UAE, 2020. [Google Scholar]
- EAD. Abu Dhabi Fisheries & Aquaculture Bulletin: Fisheries and Aquaculture Production in the Emirate of Abu Dhabi – 2022; Environment Agency – Abu Dhabi: Abu Dhabi, UAE, 2022. [Google Scholar]
- EAD. The State of Abu Dhabi Fisheries and Aquaculture 2023 – Balancing Science, Conservation, and Impactful Decisions; Environment Agency – Abu Dhabi: Abu Dhabi, UAE, 2023. [Google Scholar]
- EAD. The State of Abu Dhabi Fisheries and Aquaculture 2024 – Balancing Science, Conservation, and Impactful Decisions; Environment Agency – Abu Dhabi: Abu Dhabi, UAE, 2024. [Google Scholar]
- Food and Agriculture Organization (FAO). The ecosystem approach to fisheries; FAO Fisheries Technical Paper No. 4; FAO: Rome, Italy, 2003. [Google Scholar]
- Fathelrahman, E.; Siddig, K.; Al Qaydi, S.; Muhammad, S.; Tasbih Ullah, R.U. Options for maintaining fishery production in the United Arab Emirates due to climate change adaptation strategies. Emirates Journal of Food and Agriculture 2018, 30, 17–28. [Google Scholar] [CrossRef]
- Ferreira, C.; Amorim, P.; Afonso, P.; Menezes, G.M. Assessing data-poor stocks with length-based indicators: The Azores case. Fisheries Research 2021, 239, 105915. [Google Scholar] [CrossRef]
- Froese, R.; Winker, H.; Coro, G.; Palomares, M.L.; Tsikliras, A.C.; Dimarchopoulou, D.; Touloumis, K.; Demirel, N.; Vianna, G.; Scarcella, G. New developments in the analysis of catch time series as the basis for fish stock assessments: The CMSY++ method. Acta Ichthyologica et Piscatoria 2023, 53, 173–189. [Google Scholar] [CrossRef]
- Froese, R.; Demirel, N.; Coro, G.; Winker, H. User Guide for CMSY++; GEOMAR: Kiel, Germany, 2021; p. 17. [Google Scholar]
- Froese, R.; Demirel, N.; Coro, G.; Kleisner, K.M.; Winker, H. Estimating stock status from relative abundance and resilience. ICES Journal of Marine Science 2019, 76, 944–956. [Google Scholar] [CrossRef]
- Froese, R.; Demirel, N.; Coro, G.; Zeller, D.; Kleisner, K.; Winker, H. Estimating fisheries reference points from catch and resilience. Fish and Fisheries 2017, 18, 506–526. [Google Scholar] [CrossRef]
- Garcia, S.M.; Ye, Y.; Rice, J.; Charles, A. (Eds.) Rebuilding of Marine Fisheries. Part 1: Global Review; FAO Fisheries and Aquaculture Technical Paper No. 630/1; Food and Agriculture Organization of the United Nations: Rome, Italy, 2018. [Google Scholar] [CrossRef]
- Gilman, E.; Koehn, J.Z.; Dunn, D.C.; Essington, T. Advancing ecosystem-based fisheries management with data-limited stocks. Fish Fish. 2023, 24(2), 233–251. [Google Scholar] [CrossRef]
- Gower, H.; Hadj-Hammou, J.; Burt, J.A. The evolution of coral reef monitoring in eastern Arabia: Trends, gaps, and opportunities for the ROPME Sea Area. Front. Mar. Sci. 2025, 12, 1578377. [Google Scholar] [CrossRef]
- Grandcourt, E.M.; Al Abdessalaam, T.Z.; Hartmann, S.A.; Francis, F.; Al Shamsi, A.T. Evaluation of the Management Effectiveness of a Stock Rebuilding Strategy for Key Target Species in the Trap Fishery of Abu Dhabi; Environment Agency – Abu Dhabi: Abu Dhabi, UAE, 2009; Technical Report; 31p. [Google Scholar]
- Grandcourt, E.M.; Al Abdessalaam, T.Z.; Francis, F. Population biology and assessment of Scomberomorus commerson in the southern Arabian Gulf. Fish. Res. 2005, 73(1–2), 65–76. [Google Scholar]
- Grandcourt, E.M.; Al Abdessalaam, T.Z.; Francis, F.; Al Shamsi, A.T. Biology and stock assessment of the sparid Rhabdosargus sarba in the United Arab Emirates. J. Appl. Ichthyol. 2004, 20(1), 66–71. [Google Scholar]
- Grandcourt, E.M.; Al Abdessalaam, T.Z.; Francis, F.; Al Shamsi, A.T. Preliminary assessment of the biology and fishery for the narrow-barred Spanish mackerel, Scomberomorus commerson (Lacépède, 1800), in the Southern Arabian Gulf. Fish. Res. 2005, 76, 277–290. [Google Scholar] [CrossRef]
- Grandcourt, E.M.; Al Abdessalaam, T.Z.; Francis, F.; Al Shamsi, A.T. Population biology and assessment of the orange-spotted grouper, Epinephelus coioides (Hamilton, 1822), in the Southern Arabian Gulf. Fish. Res. 2005, 74, 55–68. [Google Scholar] [CrossRef]
- Grandcourt, E.M.; Al Abdessalaam, T.Z.; Francis, F.; Al Shamsi, A.T. Population biology and assessment of the white-spotted spinefoot, Siganus canaliculatus (Park, 1797), in the Southern Arabian Gulf. J. Appl. Ichthyol. 2007, 23, 53–59. [Google Scholar] [CrossRef]
- Grandcourt, E.M.; Al Abdessalaam, T.Z.; Francis, F. Population biology and assessment of representatives of the family Carangidae: Carangoides bajad and Gnathanodon speciosus (Forsskål, 1775), in the Southern Arabian Gulf. Fish. Res. 2004, 69, 331–341. [Google Scholar]
- Greboval, D. Report and Documentation of the International Workshop on Factors Contributing to Unsustainability and Overexploitation in Fisheries; FAO Fisheries Report, No. 672; FAO: Rome, Italy, 2002. [Google Scholar]
- Hoolihan, J.P.; Anandh, P.; van Herwerden, L. Mitochondrial DNA analyses of narrow-barred Spanish mackerel (Scomberomorus commerson) suggest a single genetic stock in the ROPME Sea area (Arabian Gulf, Gulf of Oman, and Arabian Sea). ICES J. Mar. Sci. 2006, 63(6), 1066–1074. [Google Scholar] [CrossRef]
- Jabado, R.W.; Spaet, J.L.Y. Elasmobranch fisheries in the Arabian Seas Region: Characteristics, trade, and management. Fish Fish. 2017, 18, 1096–1118. [Google Scholar] [CrossRef]
- Khatun, M.A.; Islam, M.M.; Viswanathan, K.K. Legal recognition and fisheries performance in small-scale coastal fisheries of Bangladesh. Marine Policy 2022, 141, 105079. [Google Scholar] [CrossRef]
- Lyon, W.; Tilney, R.; Kennedy. Fisheries Resources Assessment Survey of the United Arab Emirates Waters of the Arabian Gulf and Gulf of Oman 2023; Final Report; OFNZ for Environment Agency – Abu Dhabi: Abu Dhabi, UAE, 2024. [Google Scholar]
- Mesnildrey, L.; Okemwa, E.N.; Maina, G.W.; Dutoit, L. Performance and sensitivity of length-based indicators to gear selectivity: A case study of a tropical shrimp fishery. Frontiers in Marine Science 2023, 10, 1143836. [Google Scholar] [CrossRef]
- McClanahan, T.R.; Mangi, S. Gear restrictions create conservation and fisheries trade-offs: A multi-species, length-based modelling study. Fish and Fisheries 2021, 22, 1624–1638. [Google Scholar] [CrossRef]
- OECD. Rebuilding Fisheries: The Way Forward; OECD Publishing: Paris, France, 2012. [Google Scholar] [CrossRef]
- Pauly, D. On the interrelationships between natural mortality, growth parameters, and mean environmental temperature in 175 fish stocks. Journal du Conseil International pour l’Exploration de la Mer 1980, 39(2), 175–192. [Google Scholar] [CrossRef]
- Pinello, D.; Gee, J.; Dimech, M. Handbook for Fisheries Socio-Economic Sample Survey: Principles and Practice; FAO Fisheries and Aquaculture Technical Paper No. 613; FAO: Rome, Italy, 2017. [Google Scholar] [CrossRef]
- Shin, Y.-J.; Kim, D.-N.; Zhang, C.-I. Rebuilding overfished stocks in data-limited situations: A Yellow Sea case study. Fisheries Research 2023, 262, 106625. [Google Scholar] [CrossRef]
- Sparre, P.; Venema, S.C. Introduction to Tropical Fish Stock Assessment. Part 1: Manual, 2nd rev. ed.; FAO Fisheries Technical Paper No. 306/1, Rev. 2; FAO: Rome, Italy, 1998. [Google Scholar]
- Stamatopoulos, C. Sample-Based Fishery Surveys: A Technical Handbook; FAO Fisheries Technical Paper No. 425; Food and Agriculture Organization of the United Nations: Rome, Italy, 2002; 132p. [Google Scholar]
- Swan, J.; Greboval, D. Report and Documentation of the International Workshop on the Implementation of International Fisheries Instruments and Factors of Unsustainability and Overexploitation in Fisheries; FAO Fisheries Report, No. 700; FAO: Rome, Italy, 2003. [Google Scholar]
- Swan, J.; Greboval, D. Overcoming Factors of Unsustainability and Overexploitation in Fisheries: Selected Papers on Issues and Approaches; FAO Fisheries Report No. 782; FAO: Rome, Italy, 2005. [Google Scholar]
- Venema, S.C. Fishery resources in the North Arabian Sea and adjacent waters. Deep Sea Research Part A: Oceanographic Research Papers 1984, 31(6–8), 1001–1018. [Google Scholar] [CrossRef]
- Viswanathan, K.K.; Zakaria, Z.; Nurhakim, S.; Bailey, M. Adaptive co-management and legal pluralism in Indonesian small-scale fisheries. Marine Policy 2020, 118, 104001. [Google Scholar] [CrossRef]
- Wabnitz, C.C.C.; Lam, V.W.Y.; Reygondeau, G.; Teh, L.C.L.; Al-Abdulrazzak, D.; Khalfallah, M.; et al. Climate change impacts on marine biodiversity, fisheries and society in the Arabian Gulf. PLoS ONE 2018, 13(5), e0194537. [Google Scholar] [CrossRef] [PubMed]
- Wetherall, J. A. ; Polovina, J. J.; Ralston, S. Estimating growth and mortality in steady-state fish stocks from length-frequency data. ICLARM Conf. Proc. 1987, 13, 53–74. [Google Scholar]
- Zhou, S.; Punt, A.E.; Smith, A.D.M.; Richardson, A.J.; Haddon, M.; Dichmont, C.M.; Fulton, E.A. Identifying spawner biomass per-recruit reference points from life-history parameters. Fish and Fisheries 2020, 21(4), 760–773. [Google Scholar] [CrossRef]
Figure 1.
Total landings according to main fishing methods and corresponding major fisheries regulations in Abu Dhabi waters (Source: EAD, 2024).
Figure 1.
Total landings according to main fishing methods and corresponding major fisheries regulations in Abu Dhabi waters (Source: EAD, 2024).
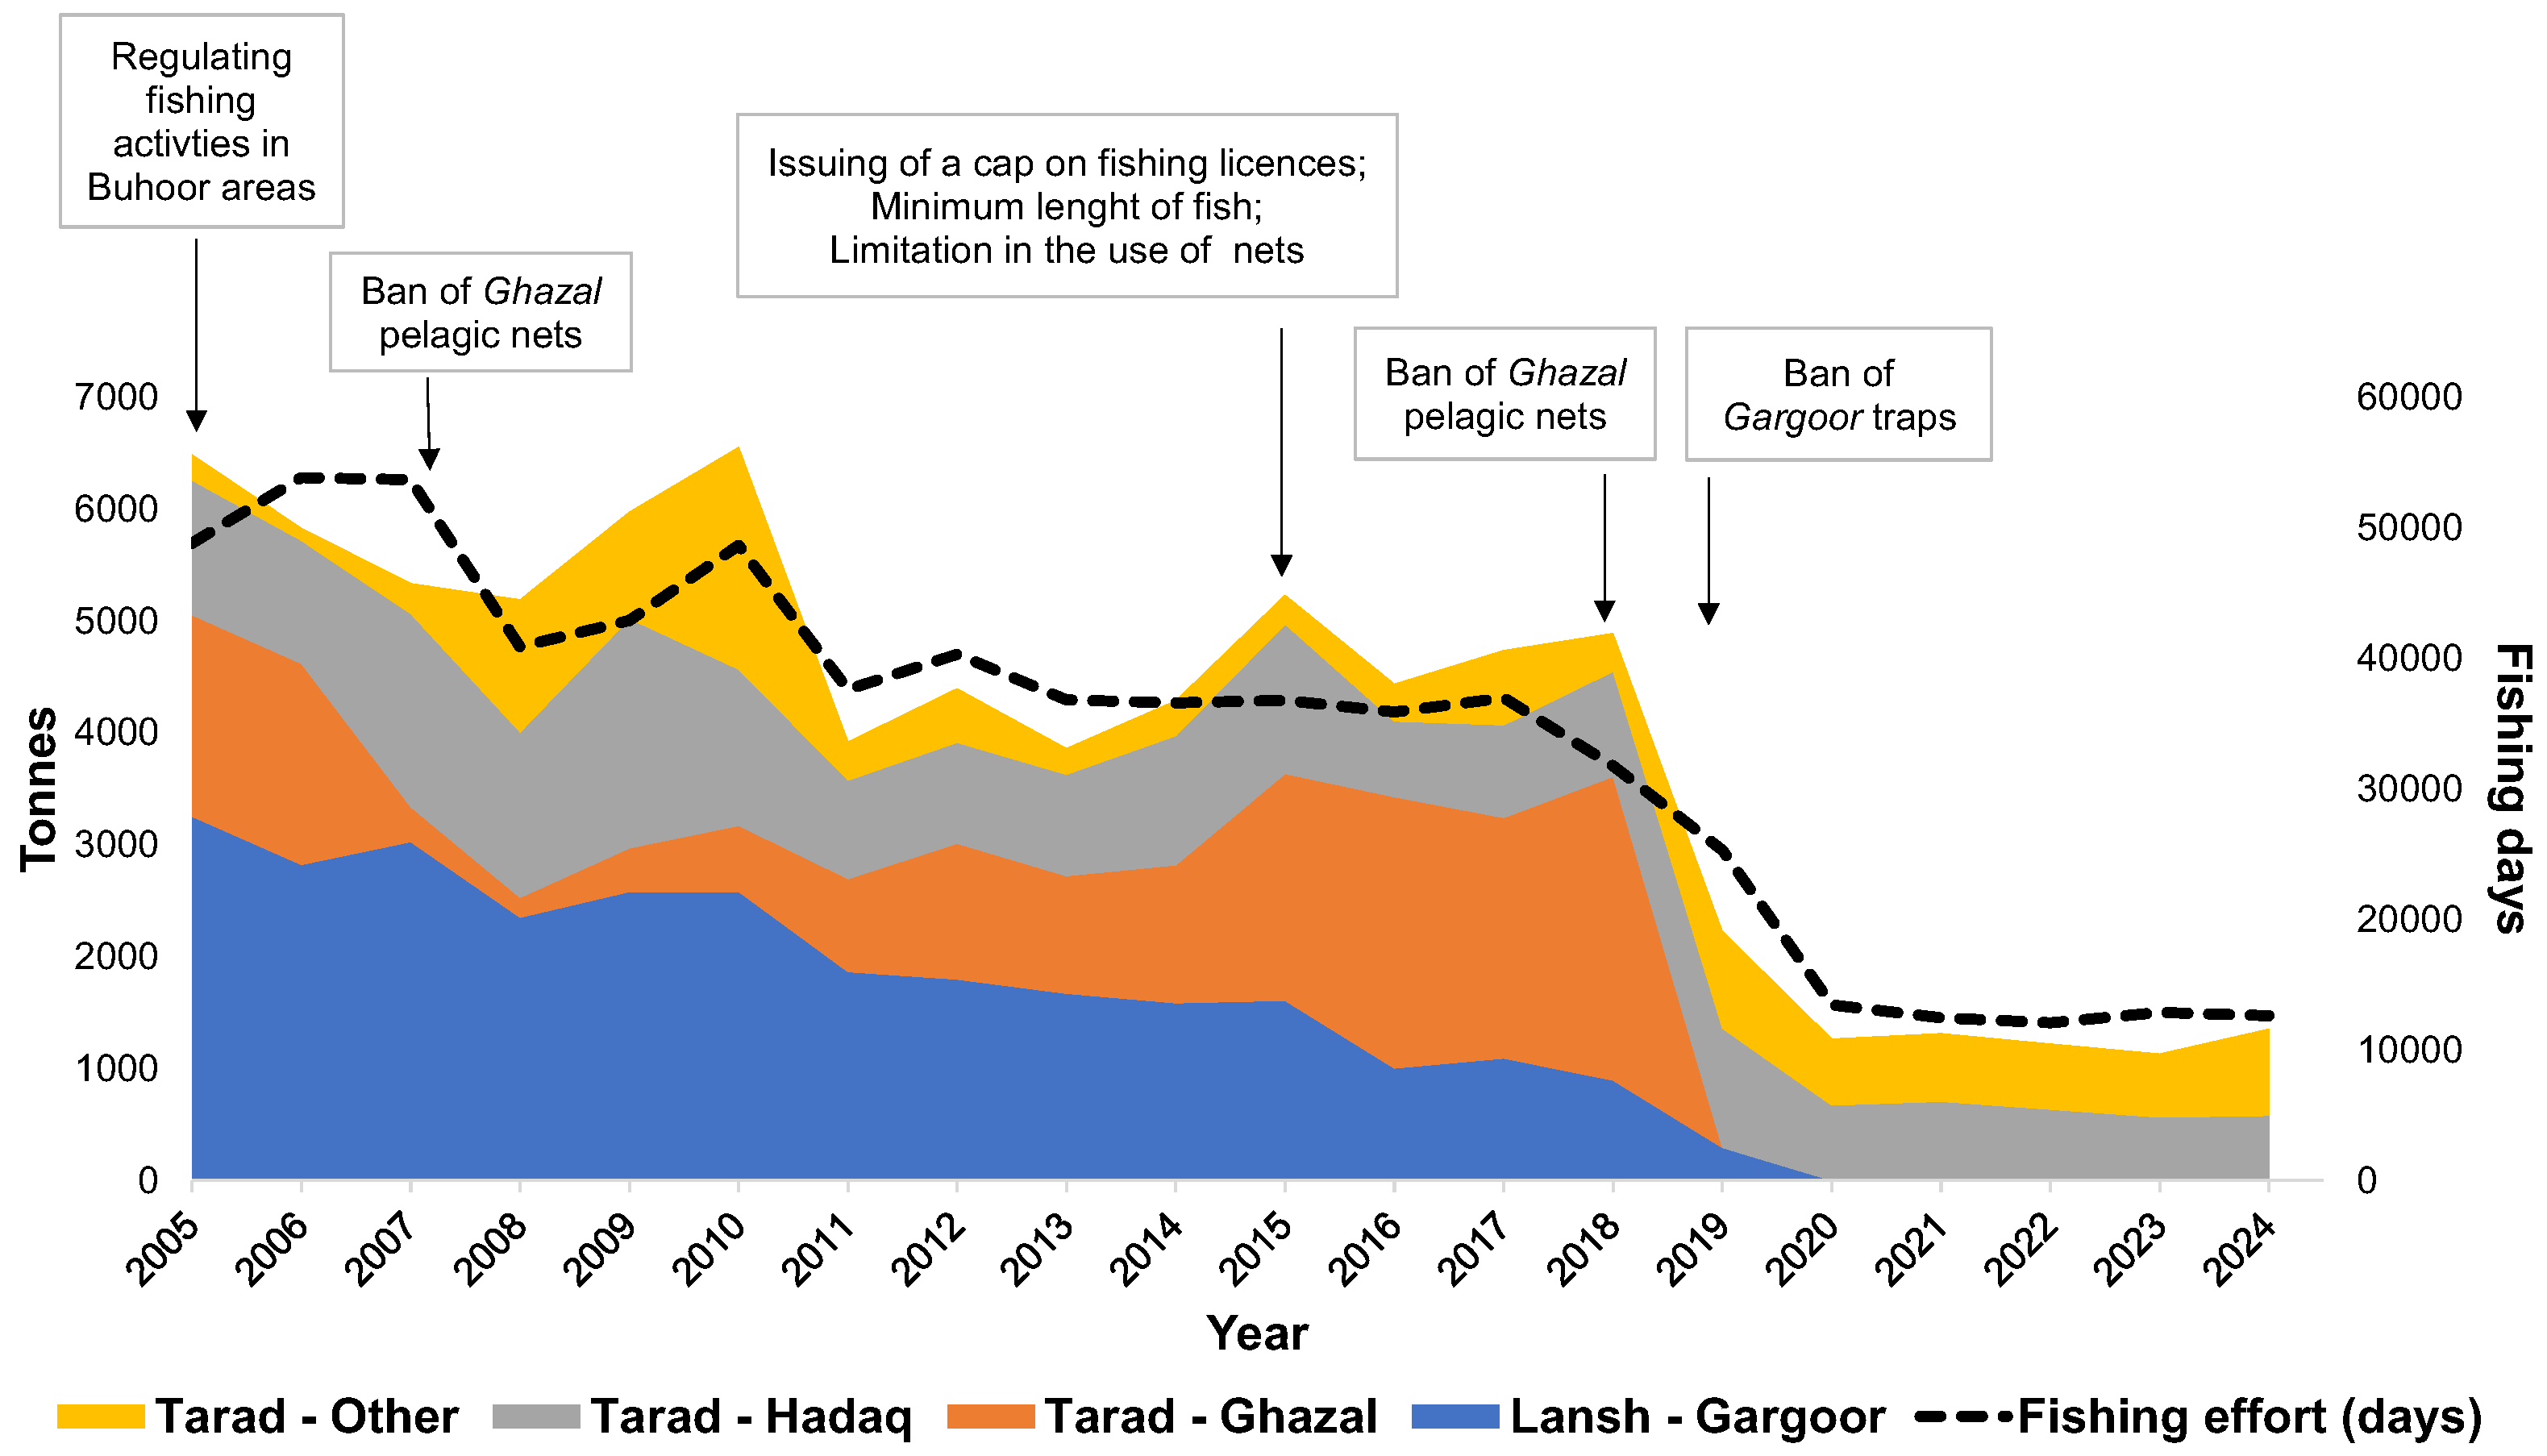
Figure 2.
(a) Map of the study area and (b) official landings (t) of 13 key pelagic, and demersal fish species in the Abu Dhabi waters for the 2005–2024 period.
Figure 2.
(a) Map of the study area and (b) official landings (t) of 13 key pelagic, and demersal fish species in the Abu Dhabi waters for the 2005–2024 period.
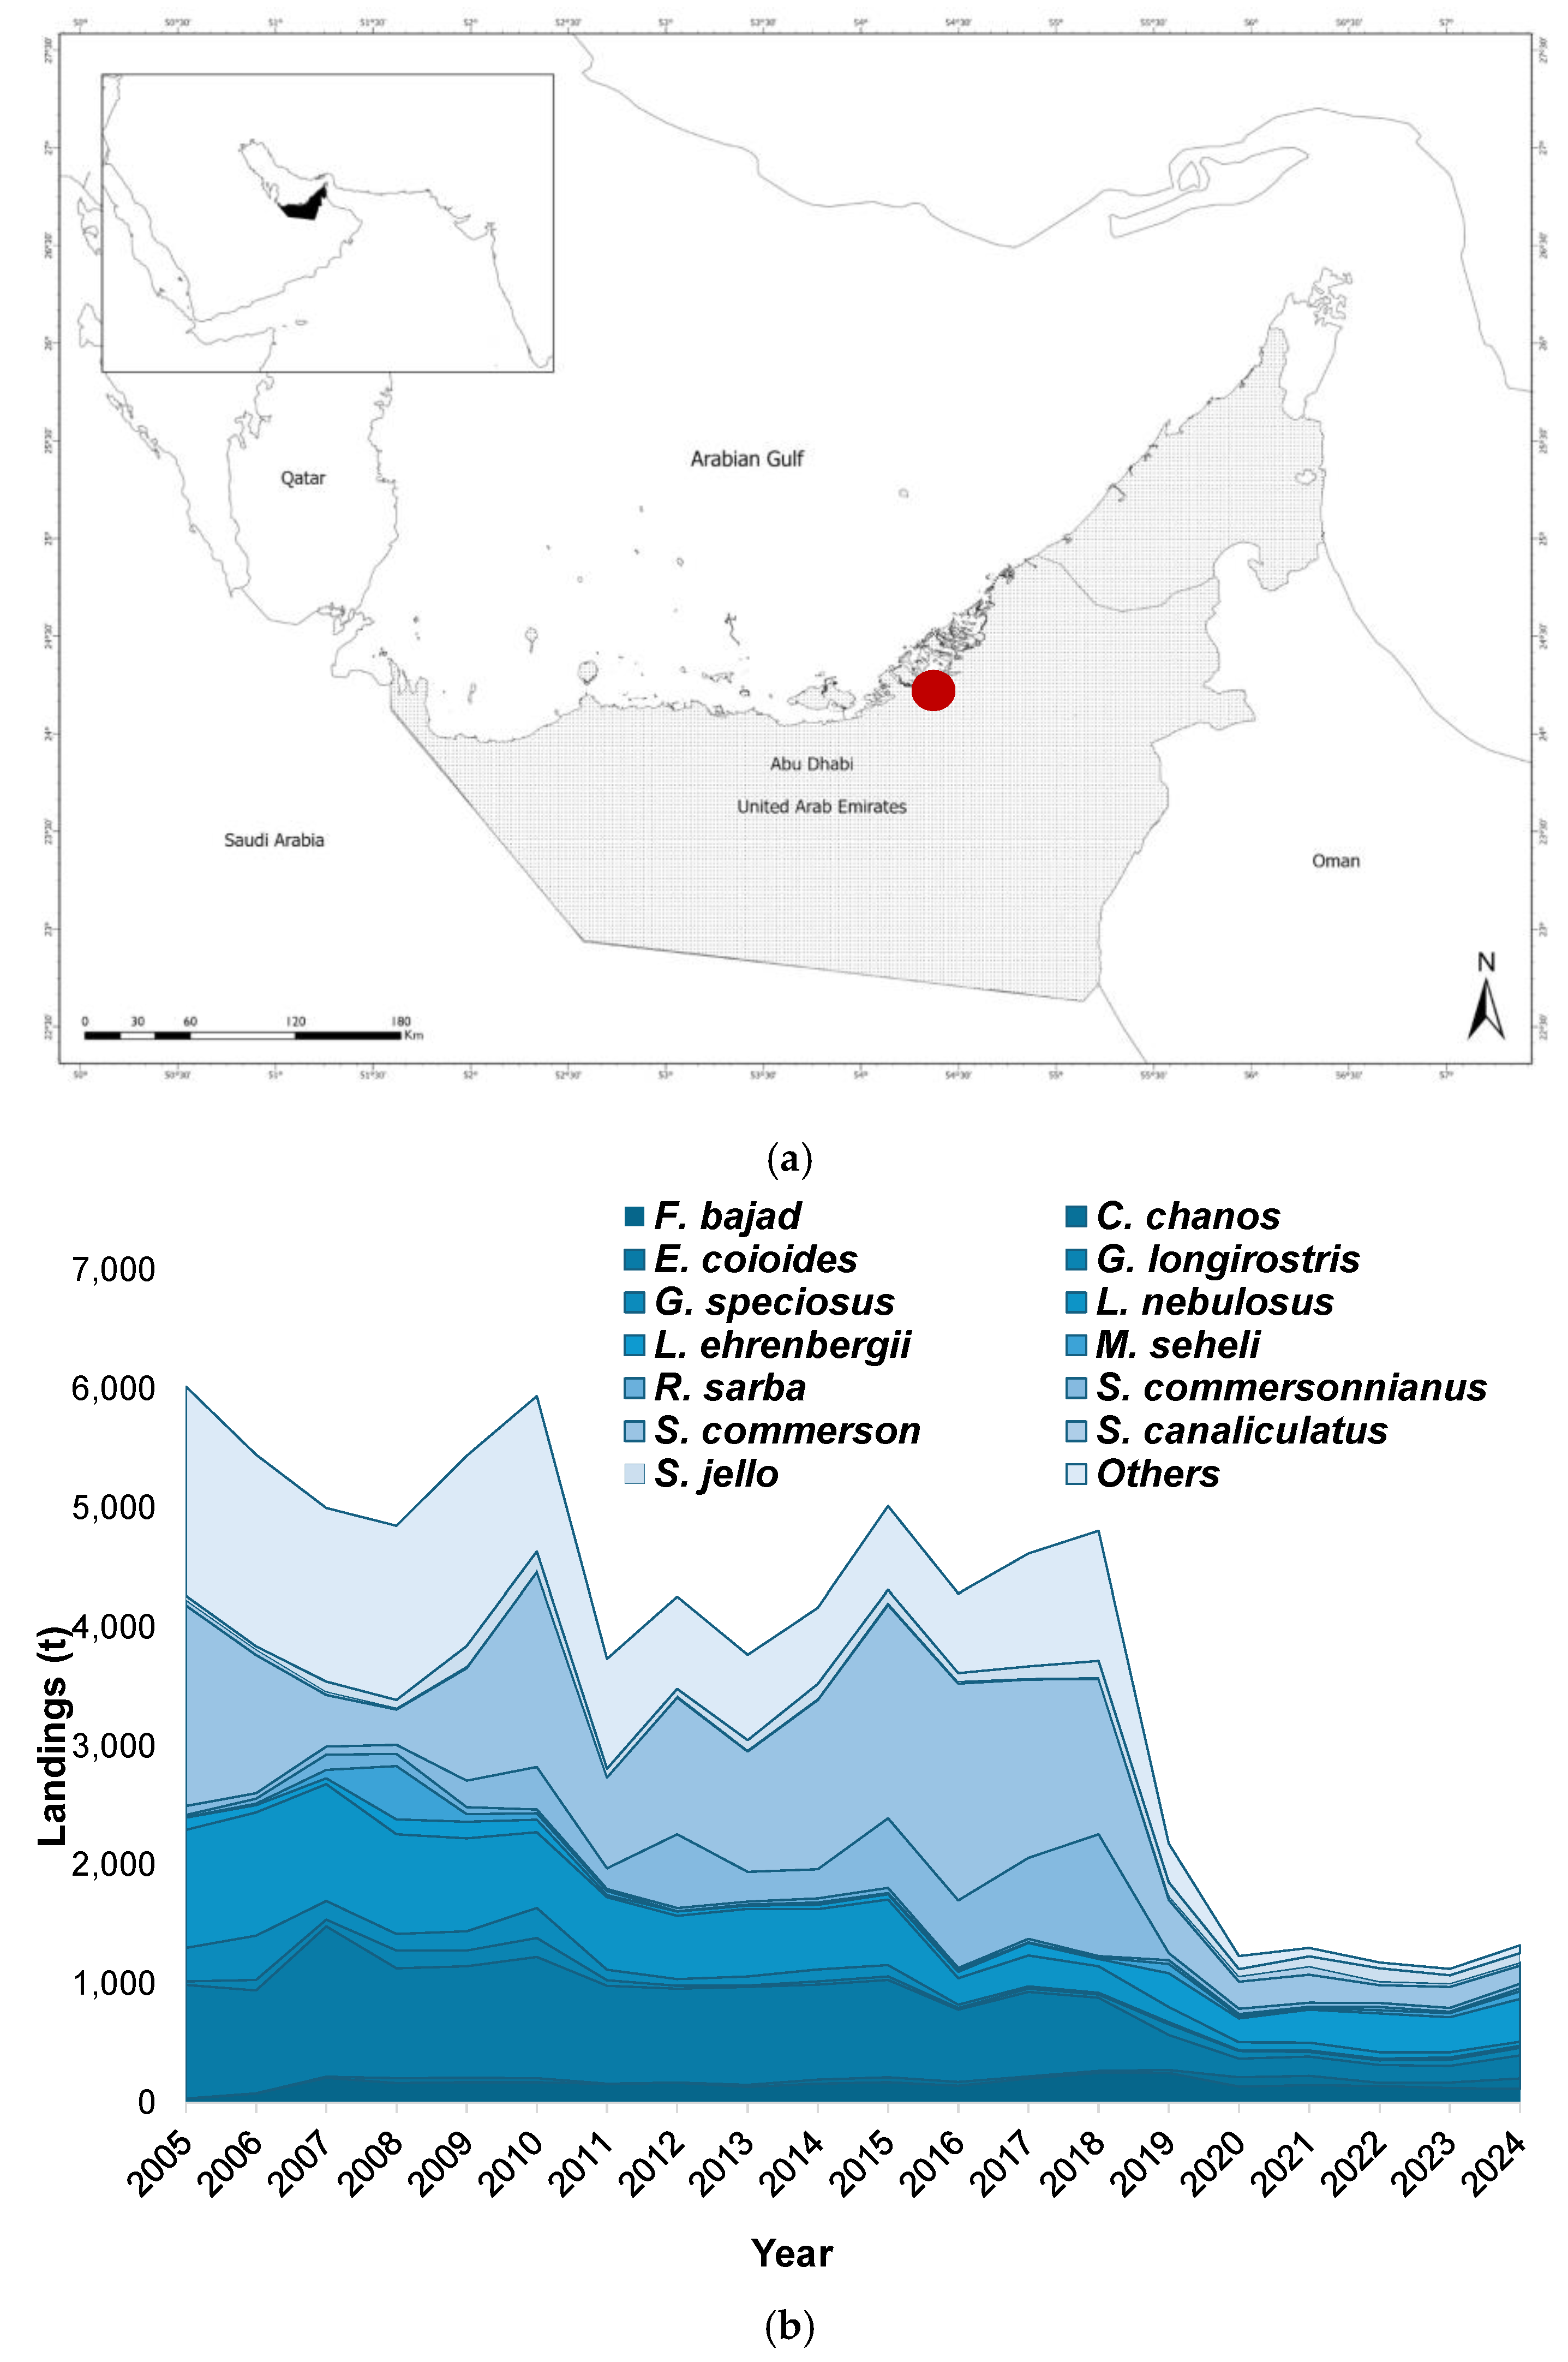
Figure 4.
Length frequency distributions of commercial catch for 12 key species during pre- and post-2019 period, and their reference points including Lcatch (solid green vertical line), Linfinity (dashed purple vertical line), and Lmax (dashed black vertical line) estimated in 2024. Maturity size (Lmaturity, red dashed vertical lines) is from literature search. (M. seheli was excluded due to the absence of historical length data, while C. chanos was represented only in the post-2019).
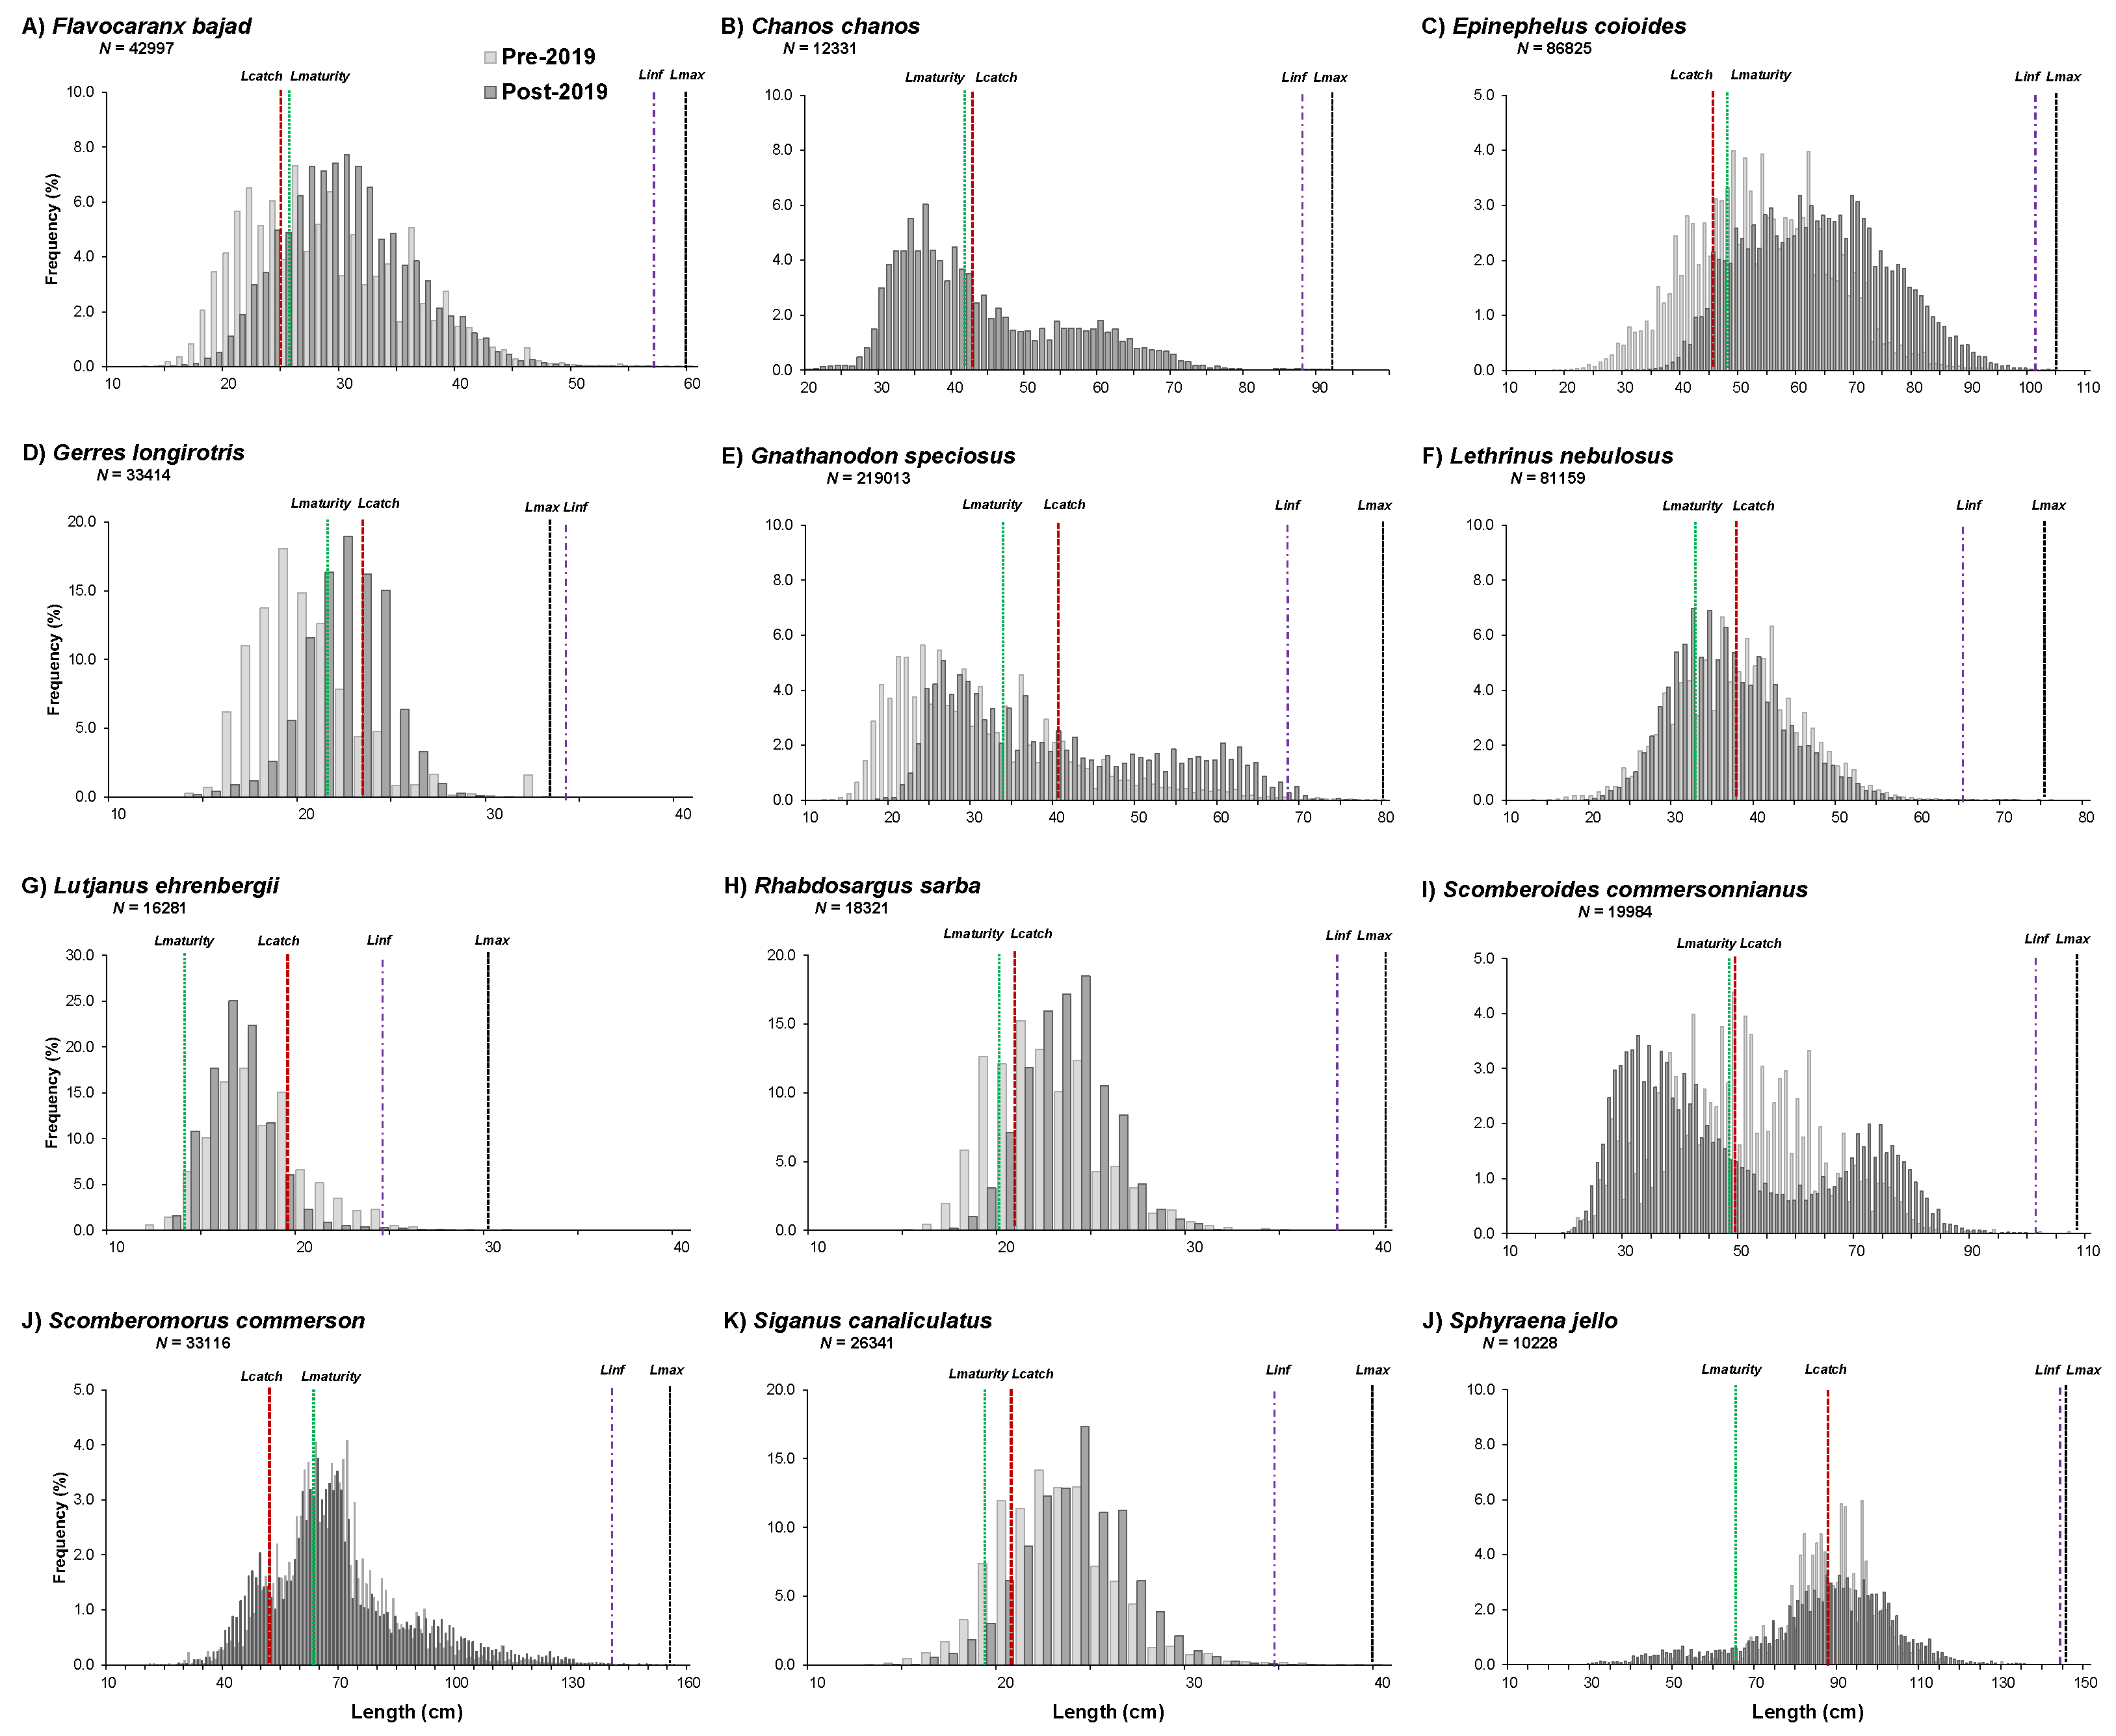
Figure 5.
Kobe plots with CMSY++ and LCCC outputs for status indicators of 13 stocks in different years of the time series including pre-2019 period of initial year as 2005 (A), and the year some regulations set in 2015 (B) and post-2019 period of final year as 2024 (C, D). FAO codes of species are given in Table 1.
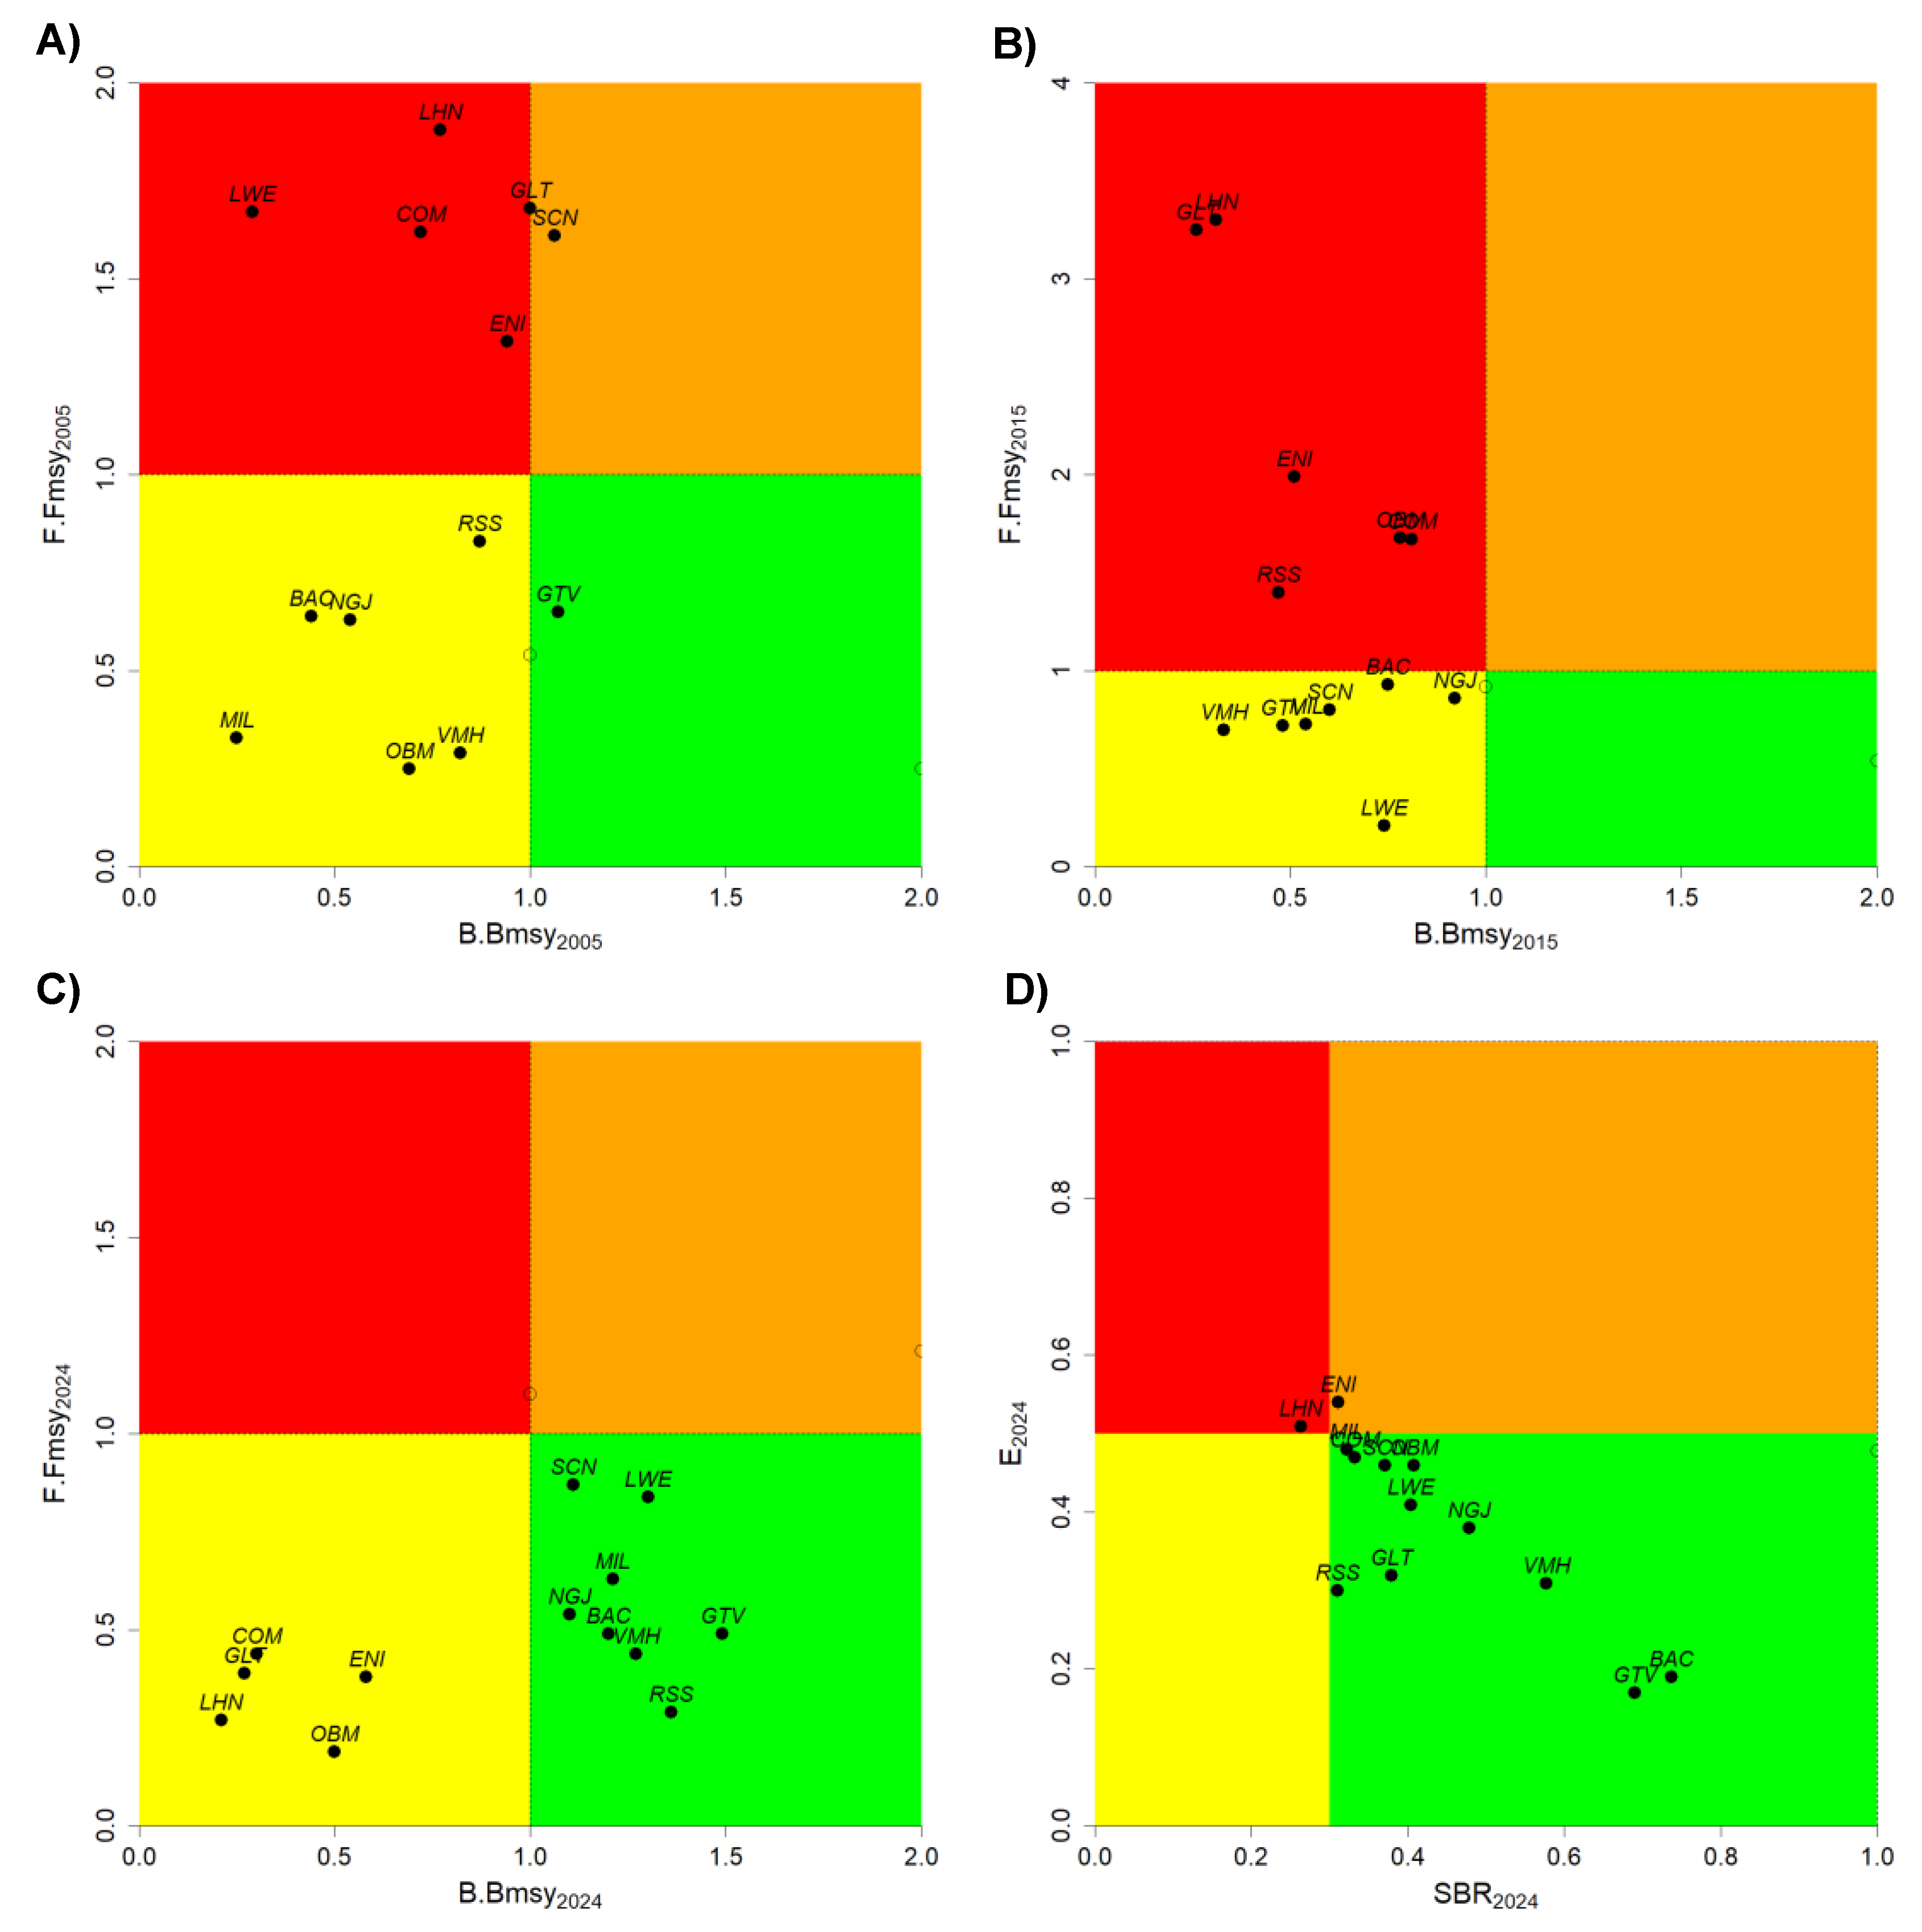

Table 1.
Reference list of thirteen key stocks, their fishing types before and after 2019 regulations, assess-ment methods and data sets in the Abu Dhabi waters. Groups are P: Pelagic, D: Demersal; Fishing types (FT) are G: Gargour, H: Hadaq, Hl: Halaq, Hd: Hadhra, D: Defara.
Table 1.
Reference list of thirteen key stocks, their fishing types before and after 2019 regulations, assess-ment methods and data sets in the Abu Dhabi waters. Groups are P: Pelagic, D: Demersal; Fishing types (FT) are G: Gargour, H: Hadaq, Hl: Halaq, Hd: Hadhra, D: Defara.
| Scientific Name | English name | FAO Code | Group | CPUE | Length Frequency | FT < 2019 | FT > 2019 | Definition |
|---|---|---|---|---|---|---|---|---|
| Flavocaranx bajad | Orangespotted trevally | NGJ | P | 2005-2024 | 2001-204; 2011-2015; 2020; 2022-2024 | G & H | H & D | Handline |
| Chanos chanos | Milkfish | MIL | P | 2005-2024 | 2021; 2023-2024 | D | Surrounding net | |
| Epinephelus coioides | Orange-spotted grouper | ENI | D | 2018-2024 | 2001-2024 | G & H | H | Handline |
| Gerres longirostris | Strongspine silver-biddy | GTV | D | 2005-2024 | 2003-2005; 2011; 2013-2015; 2021; 2023-2024 | Hd & D | Hd & D | Surrounding net |
| Gnathanodon speciosus | Golden trevally | GLT | P | 2005-2024 | 2001-2003; 2011; 2013-2014; 2023-2024 | G & H | H | Stationary pound net |
| Lethrinus nebulosus | Spangled emperor | LHN | D | 2018-2024 | 2000-2018; 2020; 2022-2024 | G & H | H | Handline |
| Lutjanus ehrenbergii | Blackspot snapper | LWE | D | 2018-2024 | 2008-2009; 2011-2014; 2017-2018; 2021-2024 | Hd | Hd | Stationary pound net |
| Moolgarda seheli | Bluespot mullet | VMH | D | 2005-2024 | 2024 | D | Surrounding net | |
| Rhabdosargus sarba | Goldlined seabream | RSS | D | 2005-2024 | 2008-2009; 2011; 2018; 2021; 2023 | G & D | D | Stationary pound net |
| Scomberoides commersonnianus | Talang queenfish | OBM | P | 2018-2024 | 2011-2013; 2020; 2022-2024 | H & Hl | H | Handline |
| Scomberomorus commerson | Narrow-barred Spanish mackerel | COM | P | 2018-2024 | 2003-2005; 2011; 2013-2014; 2016-2020; 2022-2024 | H & H | H | Handline |
| Siganus canaliculatus | White-spotted spinefoot | SCN | D | 2005-2024 | 2003-2005; 2011-2014; 2018-2019; 2022-2024 | G & D | D | Surrounding net |
| Sphyraena jello | Pickhandle barracuda | BAC | P | 2005-2024 | 2011; 2020; 2023-2024 | H & Hl | H | Handline |
Table 2.
Growth, mortalities, selectivity and stock indicators of 13 key species from Abu Dhabi waters in 2024. Parameter estimation of R. sarba was performed in 2023.
Table 2.
Growth, mortalities, selectivity and stock indicators of 13 key species from Abu Dhabi waters in 2024. Parameter estimation of R. sarba was performed in 2023.
| Species | Mortality | Growth | Selectivity | Stock indicator | |||||||
|---|---|---|---|---|---|---|---|---|---|---|---|
| Z | M | F | L∞ | K | to | Lc | tc | SBR% | E | Status | |
| F. bajad | 0.70 | 0.43 | 0.27 | 57.0 | 0.17 | -0.84 | 25.0 | 2.1 | 47.8 | 0.38 | Sustainably exploited |
| C. chanos | 1.21 | 0.63 | 0.58 | 109.2 | .35 | -0.55 | 42.5 | 3.0 | 32.2 | 0.48 | Sustainably exploited |
| E. coioides | 0.42 | 0.19 | 0.23 | 97.9 | 0.14 | -1.50 | 45.2 | 2.6 | 31.1 | 0.54 | Sustainably exploited |
| G. longirostris | 0.51 | 0.42 | 0.09 | 34.1 | 0.30 | -0.89 | 23.2 | 1.5 | 69.0 | 0.17 | Sustainably exploited |
| G. speciosus | 0.89 | 0.60 | 0.29 | 84.5 | 0.28 | -0.45 | 41.4 | 2.0 | 37.9 | 0.32 | Sustainably exploited |
| L. nebulosus | 0.41 | 0.20 | 0.21 | 66.2 | 0.11 | -1.26 | 38.0 | 1.6 | 26.3 | 0.51 | Over-exploited |
| L. ehrenbergii | 0.60 | 0.35 | 0.25 | 24.2 | 0.99 | -0.05 | 19.1 | 1.0 | 40.4 | 0.41 | Sustainably exploited |
| M. seheli | 1.02 | 0.70 | 0.32 | 57.7 | 0.32 | -0.72 | 42.0 | 3.3 | 57.7 | 0.31 | Sustainably exploited |
| R. sarba | 0.70 | 0.30 | 0.30 | 37.8 | 0.60 | -0.30 | 21.7 | 1.1 | 31.0 | 0.46 | Sustainably exploited |
| S. commersonnianus | 0.47 | 0.25 | 0.22 | 142.2 | 0.10 | -1.13 | 46.8 | 2.84 | 40.8 | 0.46 | Sustainably exploited |
| S. commerson | 0.53 | 0.28 | 0.25 | 140.4 | 0.10 | -1.90 | 52.4 | 1.9 | 33.2 | 0.47 | Sustainably exploited |
| S. canaliculatus | 1.00 | 0.54 | 0.46 | 24.8 | 1.00 | -0.10 | 21.0 | 1.7 | 37.1 | 0.46 | Sustainably exploited |
| S. jello | 0.43 | 0.35 | 0.08 | 145.0 | 0.44 | -0.40 | 88.8 | 1.75 | 73.7 | 0.19 | Sustainably exploited |
Table 2.
Outputs of CMSY++ for the year 2024. L: Landings.
| Taxon | Max L (t) | L2024 (t) | MSY | L2024/MSY | F2024 | FMSY | F2024/FMSY | B2024 (t) | BMSY (t) | B2024/BMSY |
|---|---|---|---|---|---|---|---|---|---|---|
| F. bajad | 249 | 116 | 203 | 0.57 | 0.10 | 0.19 | 0.54 | 1182 | 1076 | 1.10 |
| C. chanos | 97 | 87 | 86 | 1.00 | 0.10 | 0.17 | 0.63 | 624 | 523 | 1.21 |
| E. coioides | 1264 | 193 | 764 | 0.25 | 0.05 | 0.12 | 0.38 | 3579 | 6189 | 0.58 |
| G. longirostris | 159 | 65 | 79 | 0.82 | 0.16 | 0.32 | 0.49 | 364 | 248 | 1.49 |
| G. speciosus | 373 | 17 | 177 | 0.10 | 0.09 | 0.25 | 0.39 | 192 | 714 | 0.27 |
| L. nebulosus | 1037 | 34 | 693 | 0.05 | 0.03 | 0.11 | 0.27 | 1303 | 6143 | 0.21 |
| L. ehrenbergii | 361 | 362 | 304 | 1.19 | 0.36 | 0.43 | 0.84 | 912 | 706 | 1.30 |
| M. seheli | 449 | 63 | 86 | 0.73 | 0.09 | 0.21 | 0.44 | 522 | 414 | 1.27 |
| R. sarba | 127 | 25 | 54 | 0.47 | 0.07 | 0.23 | 0.29 | 314 | 235 | 1.36 |
| S. commersonnianus | 1023 | 40 | 374 | 0.11 | 0.02 | 0.11 | 0.19 | 1746 | 3448 | 0.50 |
| S. commerson | 1825 | 152 | 1207 | 0.13 | 0.13 | 0.29 | 0.44 | 1269 | 4191 | 0.30 |
| S. canaliculatus | 72 | 28 | 28 | 0.98 | 0.35 | 0.27 | 0.87 | 89 | 105 | 1.11 |
| S. jello | 165 | 78 | 133 | 0.58 | 0.07 | 0.13 | 0.49 | 1197 | 1018 | 1.20 |
Disclaimer/Publisher’s Note: The statements, opinions and data contained in all publications are solely those of the individual author(s) and contributor(s) and not of MDPI and/or the editor(s). MDPI and/or the editor(s) disclaim responsibility for any injury to people or property resulting from any ideas, methods, instructions or products referred to in the content. |
© 2025 by the authors. Licensee MDPI, Basel, Switzerland. This article is an open access article distributed under the terms and conditions of the Creative Commons Attribution (CC BY) license (https://creativecommons.org/licenses/by/4.0/).
Copyright: This open access article is published under a Creative Commons CC BY 4.0 license, which permit the free download, distribution, and reuse, provided that the author and preprint are cited in any reuse.


