
Submitted:
13 April 2025
Posted:
14 April 2025
You are already at the latest version
Abstract
The fluctuations in fish biomass within Marine Protected Areas (MPAs) are critical to the conservation efforts and the management of fisheries in the Philippines. Observational data was used to estimate the fish biomass doubling time in specific MPAs of the Philippines. Starting biomass, MPA area, duration of strict protection, and governance quality were some of the factors included in the analysis. The recovery and spillover effects of MPAs on surrounding fishing areas were assessed using exponential and logistic growth models. Incorporating these factors affects the doubling time of biomass, but not drastically. With regard to the logistic growth model, which includes the MPA area, duration of strict protection, and governance level, we found the average biomass doubling time to decrease compared to the exponential growth model. The average biomass doubling time for each MPA ranged from four to twenty years. This study used the historical concept of doubling time to merge modern approaches to MPAs with the aim of increasing fish biomass and biodiversity within the protective zones.
Keywords:
fish biomass
; Marine Protected Areas
; doubling time
; fisheries conservation
; Philippine MPA
; MPA management
; logistic growth model
1. Introduction
The idea of recovery within marine protected areas (MPAs) and its spillover effects into adjacent fishing areas is perhaps best explained with a concept known as doubling time. Numerous research studies have estimated fish biomass on reefs within locally-managed marine protected areas [1–3], but in the Philippines, not many studies estimate biomass doubling times. In the effort to address this gap, we set out to calculate doubling times using empirical data available from non-restricted MPAs across the country. The analysis accounts starting biomass, area of the MPA, duration in years of strict protection, and governance score from the MPA Effectiveness Assessment Tool (MEAT) (MPA Support Network (MSN). 2010).
Following the historical context of the Rule of 70 (2.2.03-Population Growth and Regulation, 2003) first put forward by Raymond Pearl in 1925, we intend to weave this with our doctrinal models of the doubling time. With the assessment of these variables, we help understand the flow of benefits from MPAs to the adjacent region and the fishers who depend on them to sustaining their livelihood.
[4] argued that the main goal of the MPAs is to attend the issues related to biodiversity and natural resource conservation. Taking into account that MPAs are well established around the world and serve the purpose of conservation, increasing marine biodiversity, and aiding in sustainable fisheries [5], and in light of the fact that marine fisheries constitute a significant source of food and employment across the globe [6], then it follows that MPAs can greatly benefit the fisheries [7,8]. Through this, MPAs help sustain the world’s human population by increasing biomass in and around the MPA (IUCN WCPA 2018; [9].
MPAs have become crucial for stopping the loss of species and improving biomass [10]. In integrating a precautionary approach to fishery management, MPAs are being employed as a fishery management tool [11]. There is an extensive body of literature on the estimation of fish biomass within the confines of locally managed MPAs [1–3]. In this paper, we analyze the rate of recovery by looking at the doubling time which is an important variable. This assists the design of management strategies for fisheries that are vulnerable and require development [6].
[12] analyzed the issue of achieving social equity and economic sustainability versus conservation within MPAs while attempting to double fish biomass. They highlighted the need for more integrated forms of MPA management that include a variety of stakeholders and take other facets of the environment into consideration. Among the types of MPAs, no take marine reserves are considered the most effective because of the ecological and economic returns they produce [5]. They serve as an established tool for conservation, aiding in the promotion of marine biodiversity and sustainable fisheries. In this regard, [13] undertook an exhaustive global assessment of the biological effects of no-take marine reserves. These findings were supportive of the purpose of establishing no-take reserves in attempts to double fish biomass and enrich marine biodiversity, as such measures are expected to produce enhanced biomass in areas designated as reserves or no take zones [14]. Coastal resources management is advocated for broadly with the use of no take marine reserves being one of the options [15], pointing out the importance of setting baseline requirements, efficiently managing, and monitoring ecosystem recovery [16]. These studies shed light on the possibility of increasing fish biomass in MPAs through appropriate management interventions.
Given that MPAs are intended to change how people engage with the surrounding ecosystem [17], these examinations on integrating fish biomass within MPAs highlight the obstacles and prospects and issues of MPA management MPAs: Protected zone management.
The effects of MPAs can be seen after a considerable length of time, as the figures from Sumilon and Apo reserves in the Philippines show between 1983 and 2000 [8]. In Russ and Alcala’s study, it was shown that large predatory reef fishes increased in biomass after nine years and 18 years of protection. Afterwards, during the following nine years (2001–2009) the rate of biomass recovery plateaued at some point, which was quite possibly due to the region reaching its local limit of supporting the population [18].
MPAs are vital in the effort to conserve and restore ocean ecosystems, as well as ocean biodiversity. The increase in biomass within MPAs is credited to improved fisheries that support the global human population [19]. [20] stress the point that the rate of biomass recovery does not lessen with years of protection while [21] argue that increases in enforcement leads to greater recovery of biomass. As noted by [22] and [23], there is great protection of coral reef associated fishes by enforced MPAs. In contrast, unprotected regions suffer the consequences of fishery overexploitation resulting in decline of biomass and species diversity [24]. [25] suggested that, since fish biomass is the main driving force for the services provided by coral reefs, baseline knowledge, carrying capacity, biomass recovery rates, and other ecological parameters should be integrated to point out and rank the protection priorities.
[1] have not found substantial connection between the age or size of MPAs and their fish biomass. However, they highlighted local management of coral reef fisheries within MPAs as an area that is particularly lacking in attention. On the contrary, there is a range of literature that highlights age and size as crucial determinants of MPAs in their contribution to the biodiversity and fisheries in the region. MPAs are increasingly being recognized for their role in increasing fish biomass in terms of both value and quantity has been shown by [26] and [13]. Whilst [26] did not find a relationship between the years under strict protection and the size of the no take zone or buffer zone, he did acknowledge that increasing the no take zone whilst reducing the buffer zone did yield positive results toward the stock of commercial fishes.
In the case of developing countries, community-based management is the best strategy for avoiding overexploitation of marine resources [27]. Although regional planning is important, it is at the local level where people effectively manage resources [28]. Evidence suggests that effective management of coastal resources and fisheries occurs mainly in community-based managed regions epitomized by strong supportive communities, leadership and political will [11], [29], [30]. Improving governance will enhance these systems ecologically and biologically, which will, in turn, positively impact the population that depends on these resources directly [31].
2. Materials and Methods
2.1. Study Area
Selected local MPAs from Luzon and Visayas were the focus of this study (Figure 1). Site locations were chosen purposively based on the MPA’s size and the availability of more data points. Empirical data on biomass collected from these locally managed MPAs in the Philippines are utilized. The data used in this study came from previous fish visual census surveys based on the fish survey technique proposed by [32]. Because the sites chosen for the study have different levels of socioeconomic development and fishery dependency, visits were conducted to the sites opportunistically.
2.2. Data Collection
The study primarily used visual fish census data from the Coastal Resources and Environmental Sustainability in the Tropics (CREST) laboratory, formerly the Community Ecology (COMECO) laboratory, to investigate reef-associated fish. The collected data relate to the period from 2011 to 2022 at selected reef sites. The baseline of biomass and the years under strict protection were from the database when RARE monitoring and enforcement measures were implemented. The size of the MPA was measured in hectares, and the level of governance, which was arbitrarily presented as a percentage, was determined using data and scores from the Marine Protected Area Management Effectiveness Assessment Tool (MEAT) (Table 1).
2.3. Data Analysis
Two mathematical models were employed to calculate biomass doubling time and develop a forecasting tool for resource managers. These models aid in predicting fish biomass increases based on various factors, such as the starting point of biomass, MPA sizes, years under strict protection, and governance levels. The investigators analyzed the data obtained from locally managed MPAs focused on reef-associated fish. The datasets include a variety of parameters to identify which factors influence the doubling time of fish biomass. Mathematical modeling techniques were employed to calculate the doubling time of reef-associated fish biomass and the functions of various parameters. This analysis is important, as it provides valuable insights into the factors that contribute to the growth and development of fish biomass in MPAs.
The exponential model and the logistic growth model for calculating the biomass doubling time e were considered. For the exponential and the logistic growth models, we made the following assumptions: Time t is measured in years, there is no migration in and out of the MPA, the environmental conditions, such as temperature and nutrient availability, are constant over time, the individual species have similar characteristics (growth rate, reproduction rate, and mortality rate), all parameters are generally nonnegative, the resources are unlimited, and there is no predation or intraspecific–interspecific competition among the species. We also assume that in the exponential growth model, the biomass grows without bounds, while in the logistic growth model, the biomass growth slows as it approaches carrying capacity. We determined an exponential growth model for finding biomass doubling time:
where t is the length of time, is the starting point of biomass for and is the biomass for time
The logistic growth model is expressed as follows:
where t is the length of time, is the starting point of biomass for is the biomass for is the intrinsic potential of the ecosystem or the baseline carrying capacity, S is the size of the MPA (in hectares), Y is the number of years that the MPA has been under strict protection, and G is the governance level .
2.3.1. Derivation of the Models
Two models for calculating the biomass doubling time are considered: one using the exponential model and the other using the logistic growth model.
The exponential growth model is given by
where is the biomass at time is the starting point of the biomass, and r is the growth rate.
Meanwhile, the logistic growth model is given by
where is the biomass at time is the starting point of the biomass, r is the growth rate, and K is the carrying capacity.
The formula for calculating the doubling time :
Therefore, applying the growth rate gives:
The formula applied to determine the biomass doubling time using the exponential model is:
This equation is not undefined since Also, we did not consider primarily because there is no biomass doubling time for that specified time. Hence, we are assured that for all as what the data indicates. This is important because we do not want the denominator to be
Thus, the exponential growth model is given by:
For the exponential growth model, we made the following assumptions: The biomass grows without bounds; time t is measured in years; there is no migration in and out of the MPA; environmental conditions such as temperature and nutrient availability are constant over time; individual species have similar characteristics (growth rate, reproduction rate, and mortality rate); all parameters are generally nonnegative; resources are unlimited; and there is no predation or intraspecific–interspecific competition among the species.
For the logistic growth model, we used:
Note that this equation will be undefined when
We let since it is the capacity of the MPA to hold biomass. (If it were then the MPA would not exist.) This is important to allow dividing the equation above by K on both sides, giving However, the data indicate that this is not the case, so the model will still be applied for all
In considering the logistic growth model, we incorporated the parameters on governance level, size of the MPA, and fishing activities outside the MPA to the carrying capacity We define carrying capacity as:
is the intrinsic potential of the ecosystem or the baseline carrying capacity. We arbitrarily decided on the value of this parameter so that our model fits the data and the future trend will agree on what we want to happen. S is the size of the MPA, while G is the governance level, which can be expressed as a percentage, where
Therefore, the proposed logistic growth model for biomass doubling time is:
For the logistic growth model, we made the following assumptions: biomass growth slows as it approaches the carrying capacity; time t is measured in years; there is no migration in and out of the MPA; environmental conditions such as temperature and nutrient availability are constant over time; individual species have similar characteristics (growth rate, reproduction rate, and mortality rate); all parameters are generally nonnegative; and there is no predation or intraspecific–interspecific competition among the species.
3. Results
3.1. Starting Point of Biomass
Table 2 below lists the starting point of biomass in each MPA. Where values were missing for some years, the mean value of the available biomass data for that MPA is given in italics.
The corresponding charts for each MPA are as follows:
Figure 2.
Starting points of biomass from Agay-Ayan Marine Sanctuary (2011–2022).

Figure 3.
Starting points of biomass from Caloco Marine Sanctuary (2011–2022).
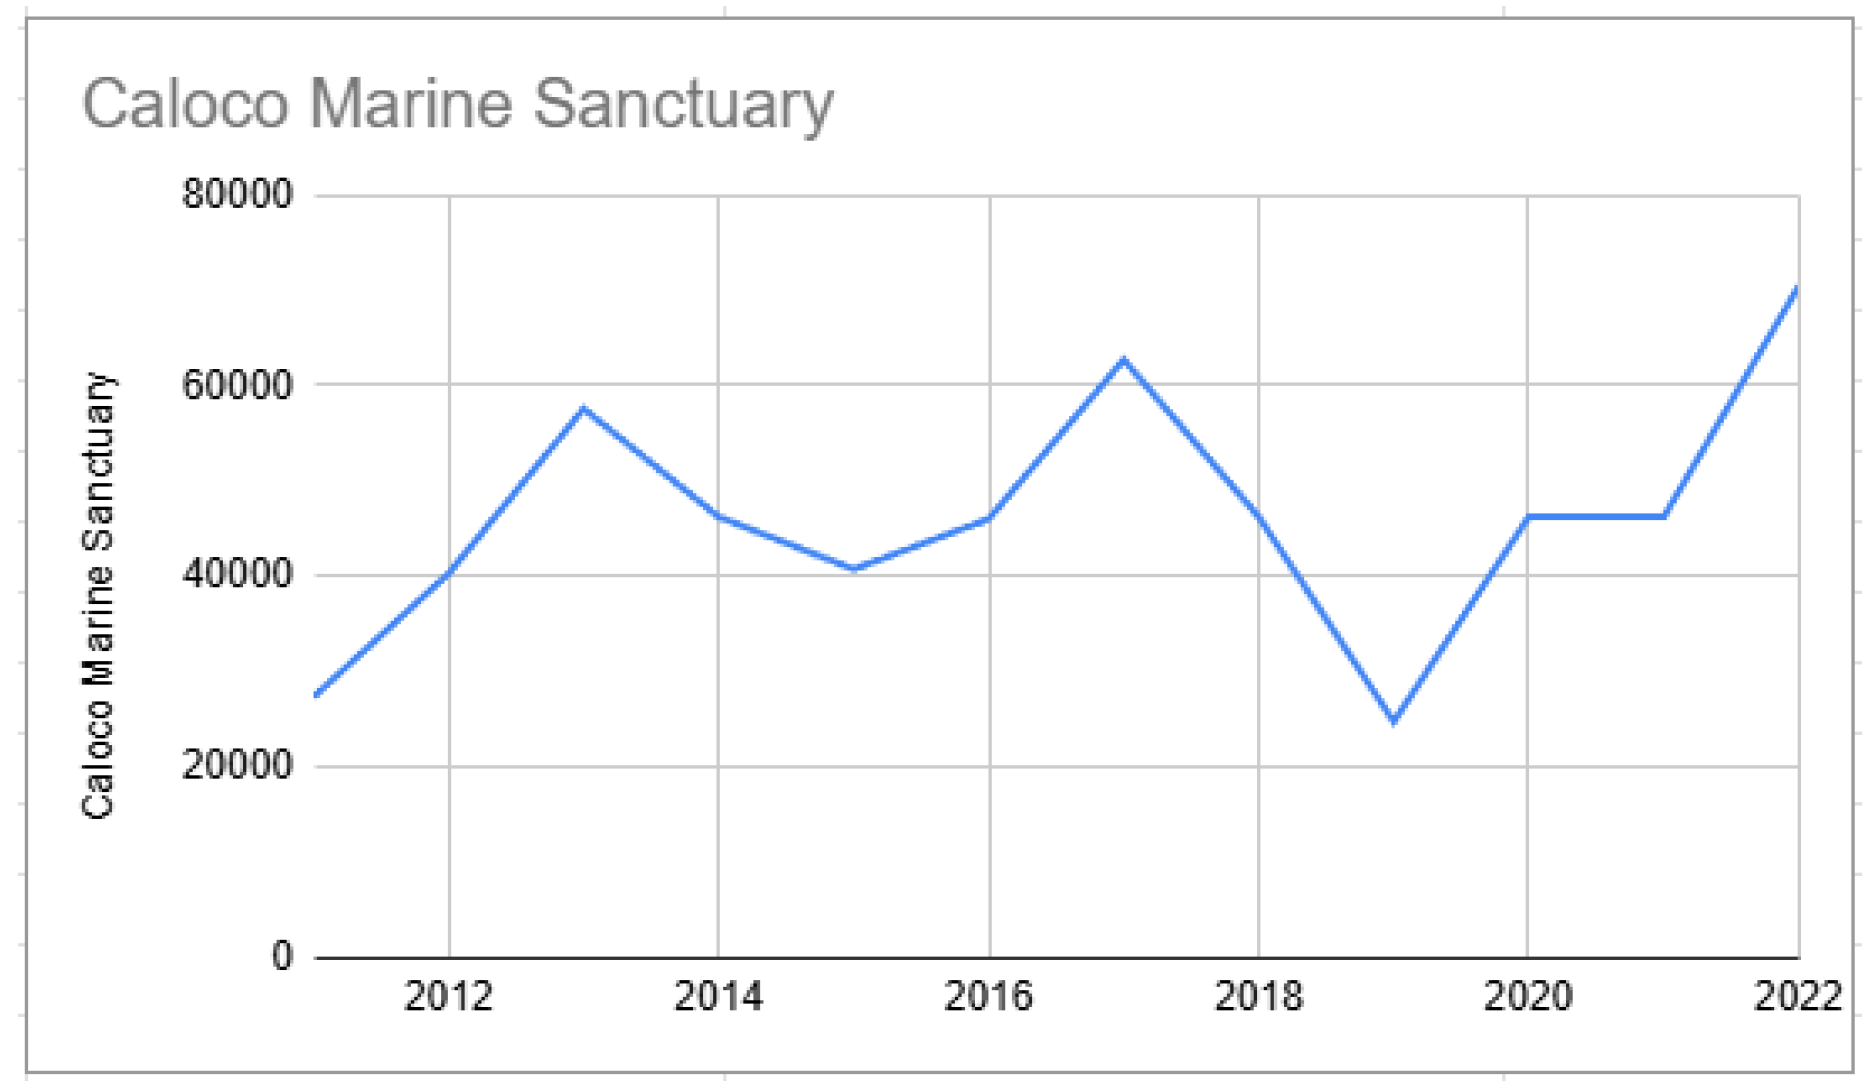
Figure 4.
Starting points of biomass from Ermita MPA (2015–2022).
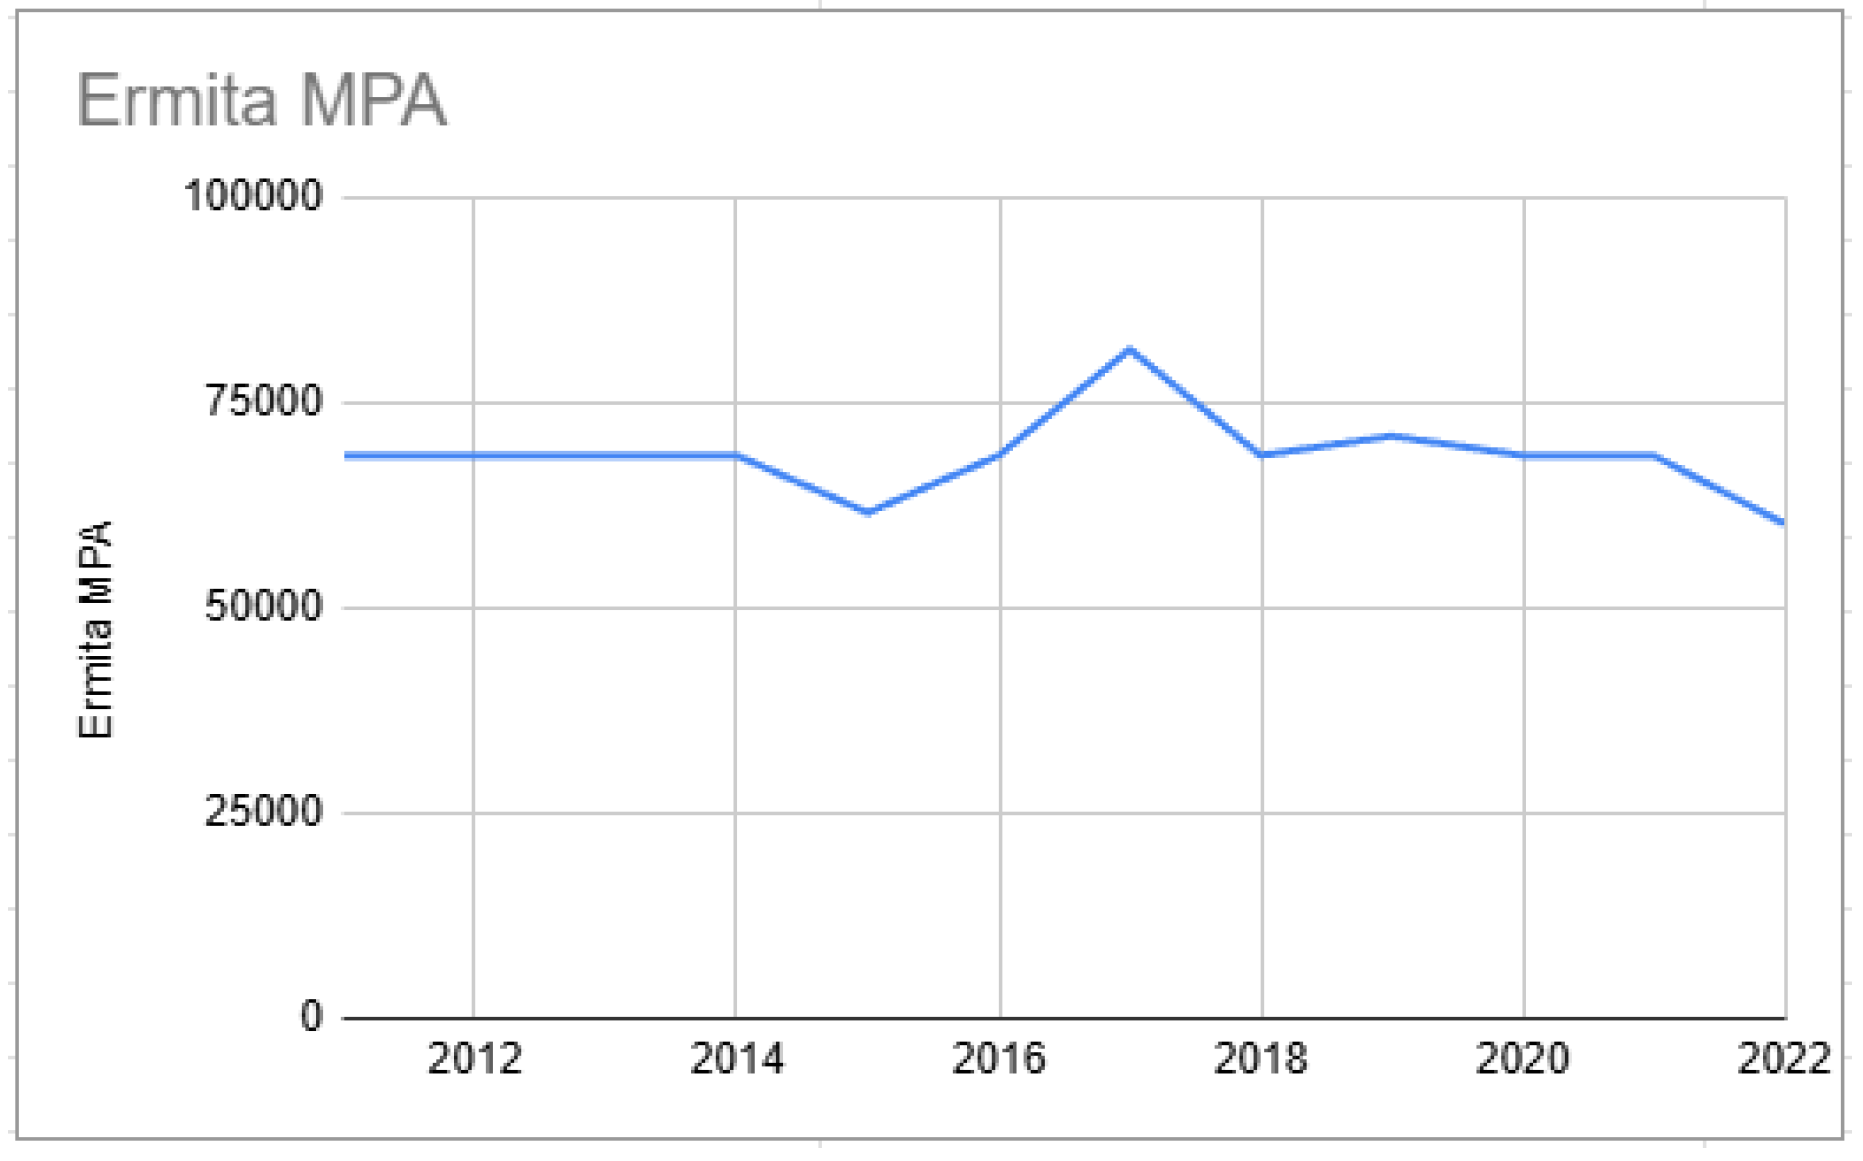
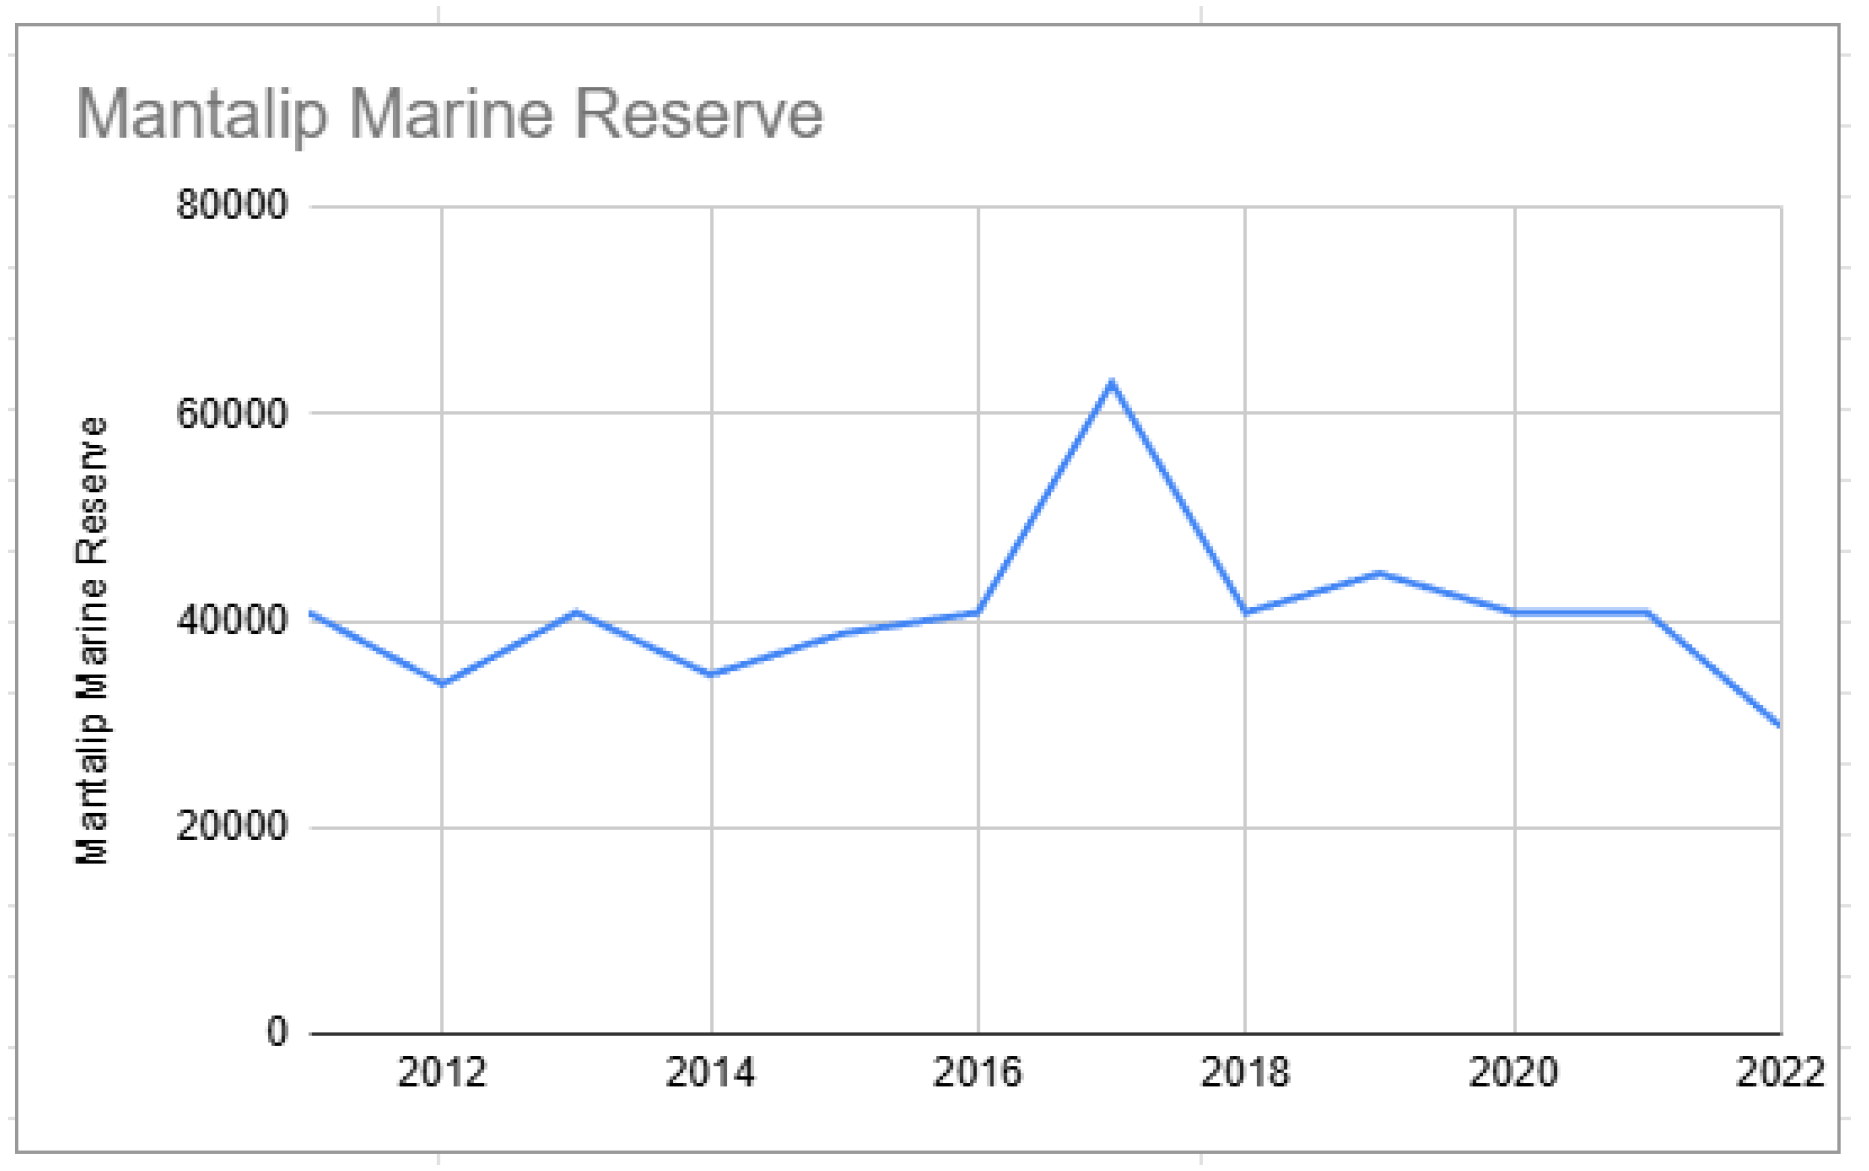
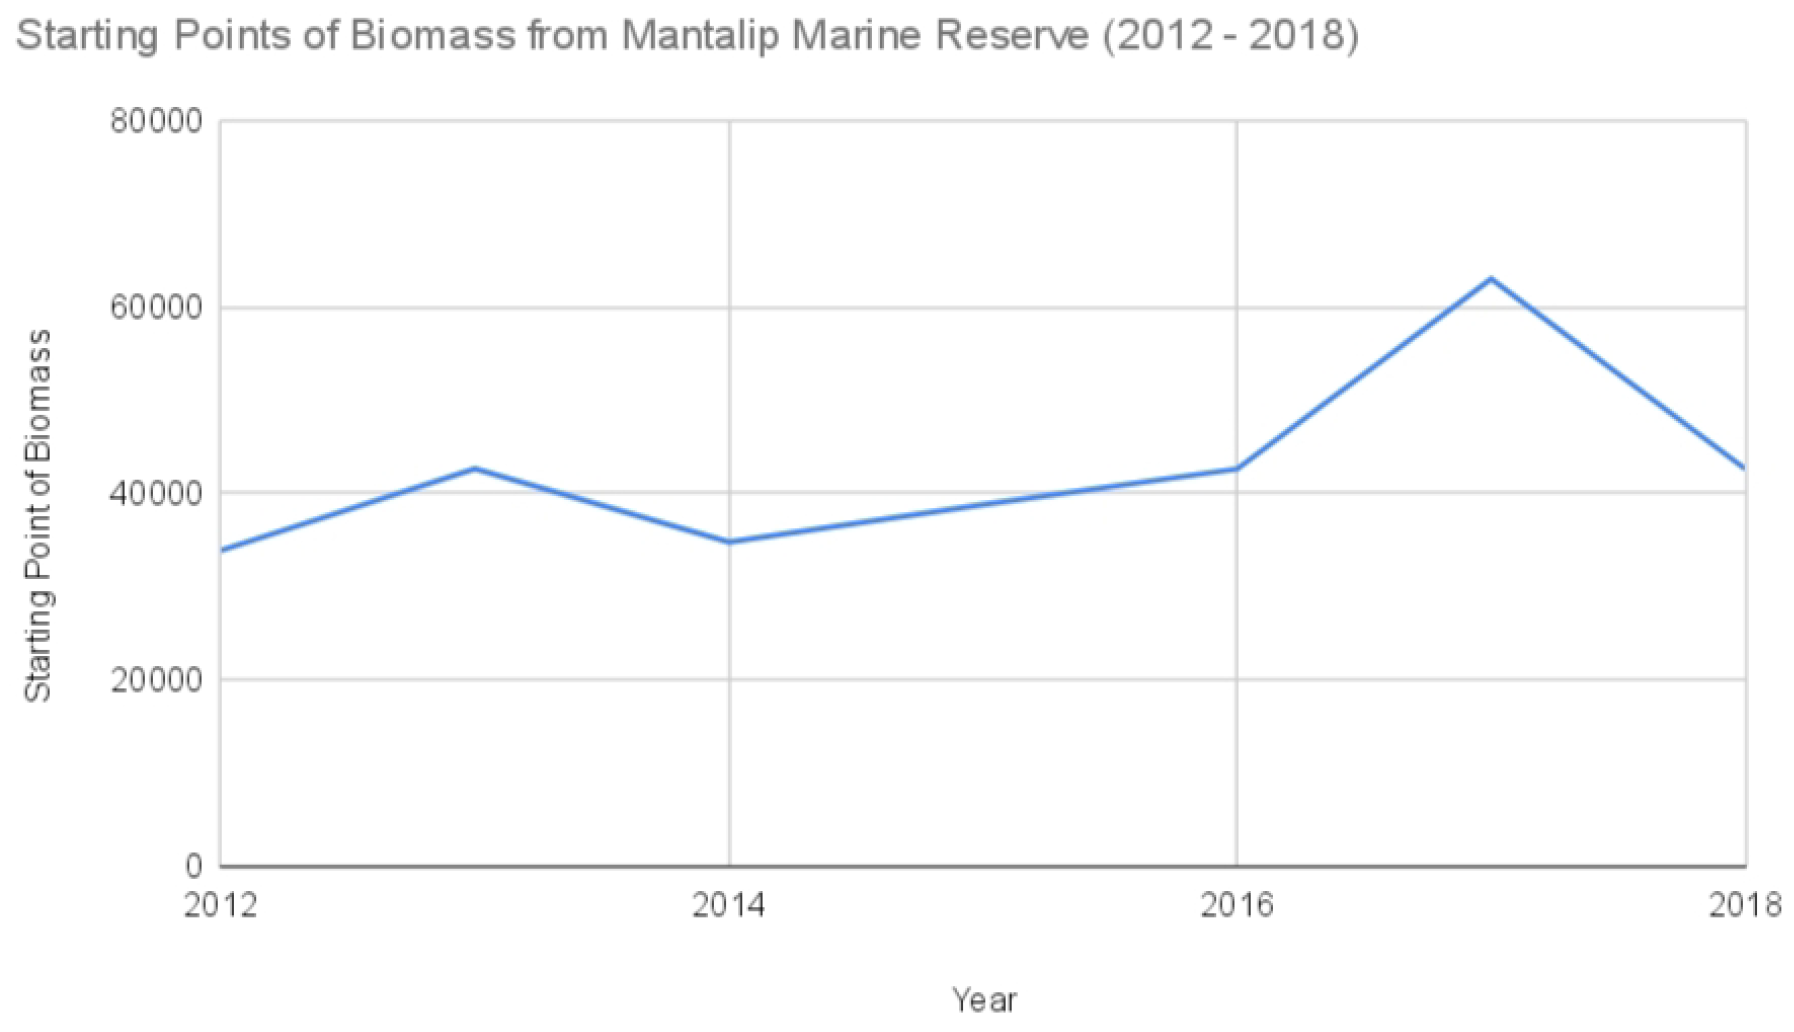
Figure 5.
Starting points of biomass from Mantalip Marine Reserve (2012–2022).
Trend fluctuations for each MPA presented a challenge for computing biomass doubling time. We tried applying 3- and 5-year moving averages with the following results:
Figure 6.
Agay-Ayan Marine Sanctuary biomass data with 3-year and 5-year moving averages.

Figure 7.
Caloco Marine Sanctuary biomass data with 3-year and 5-year moving averages.
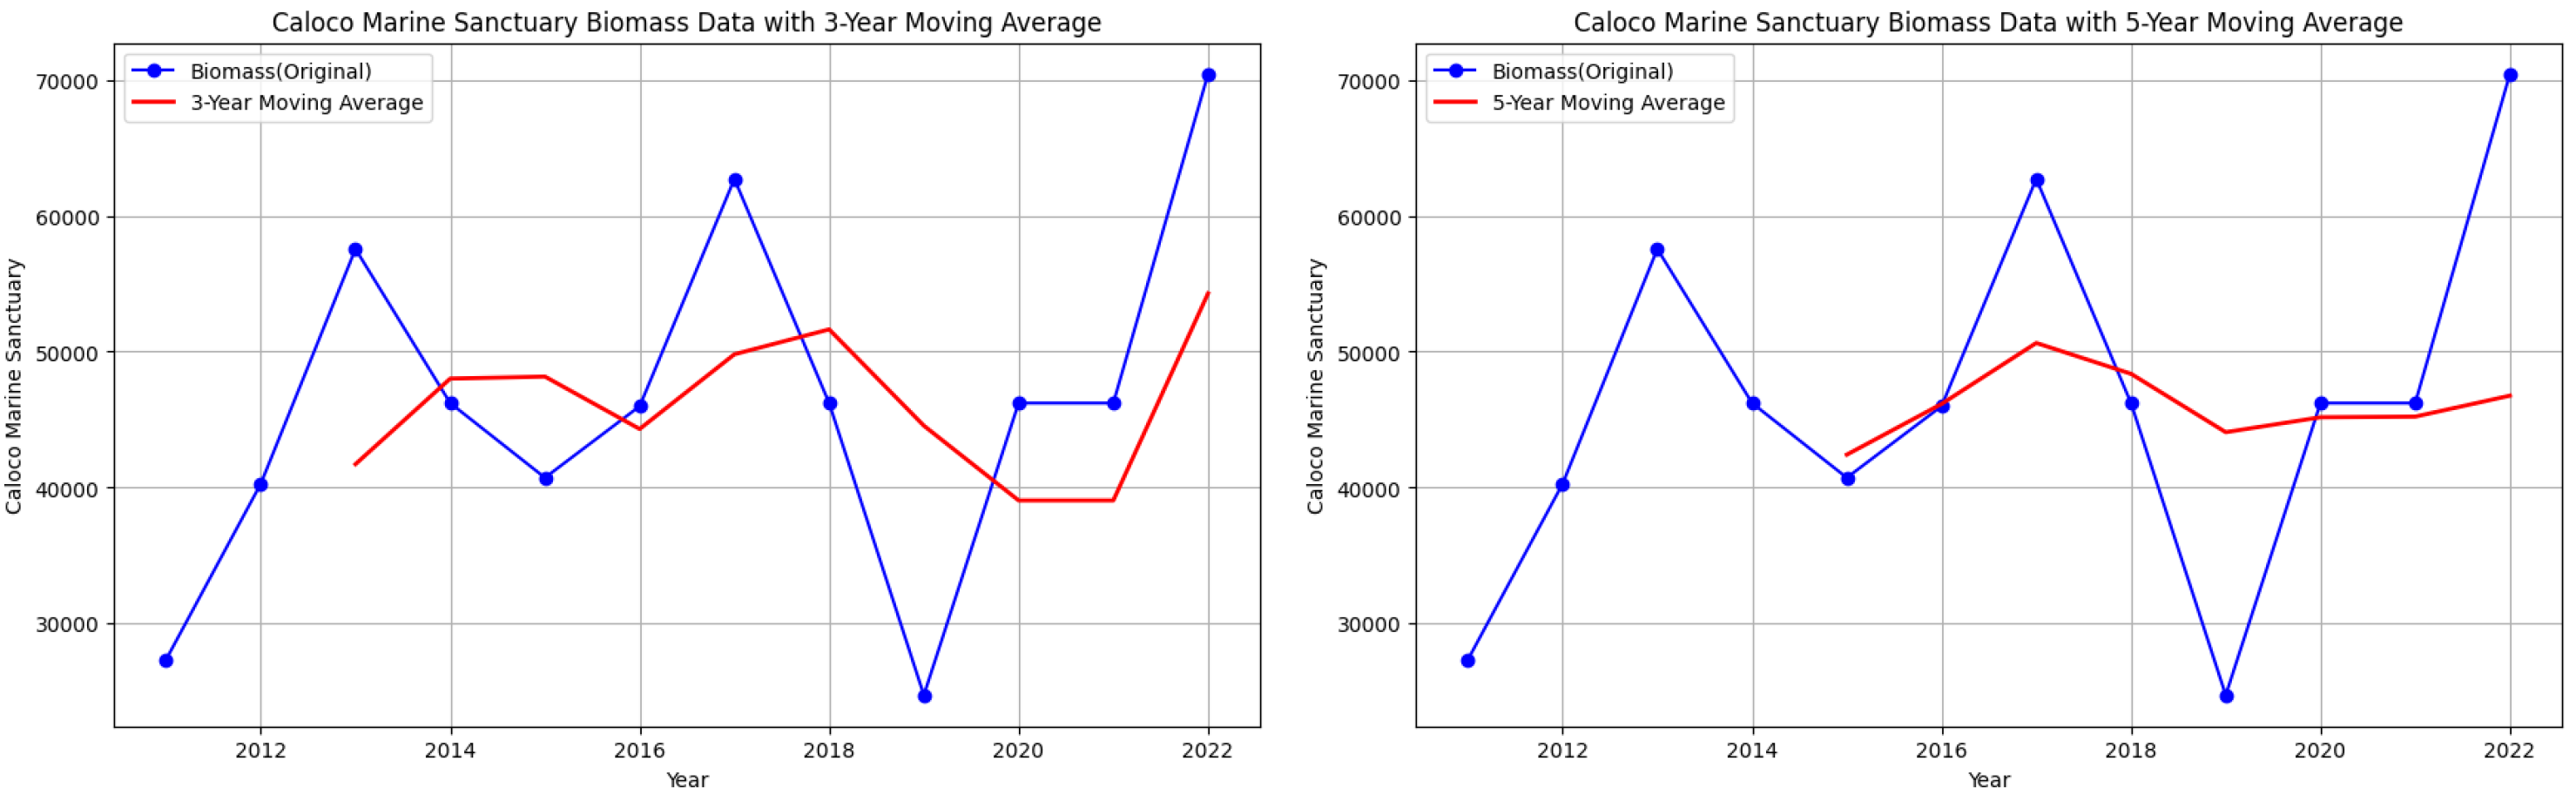
Figure 8.
Ermita MPA biomass data with 3-year and 5-year moving averages.
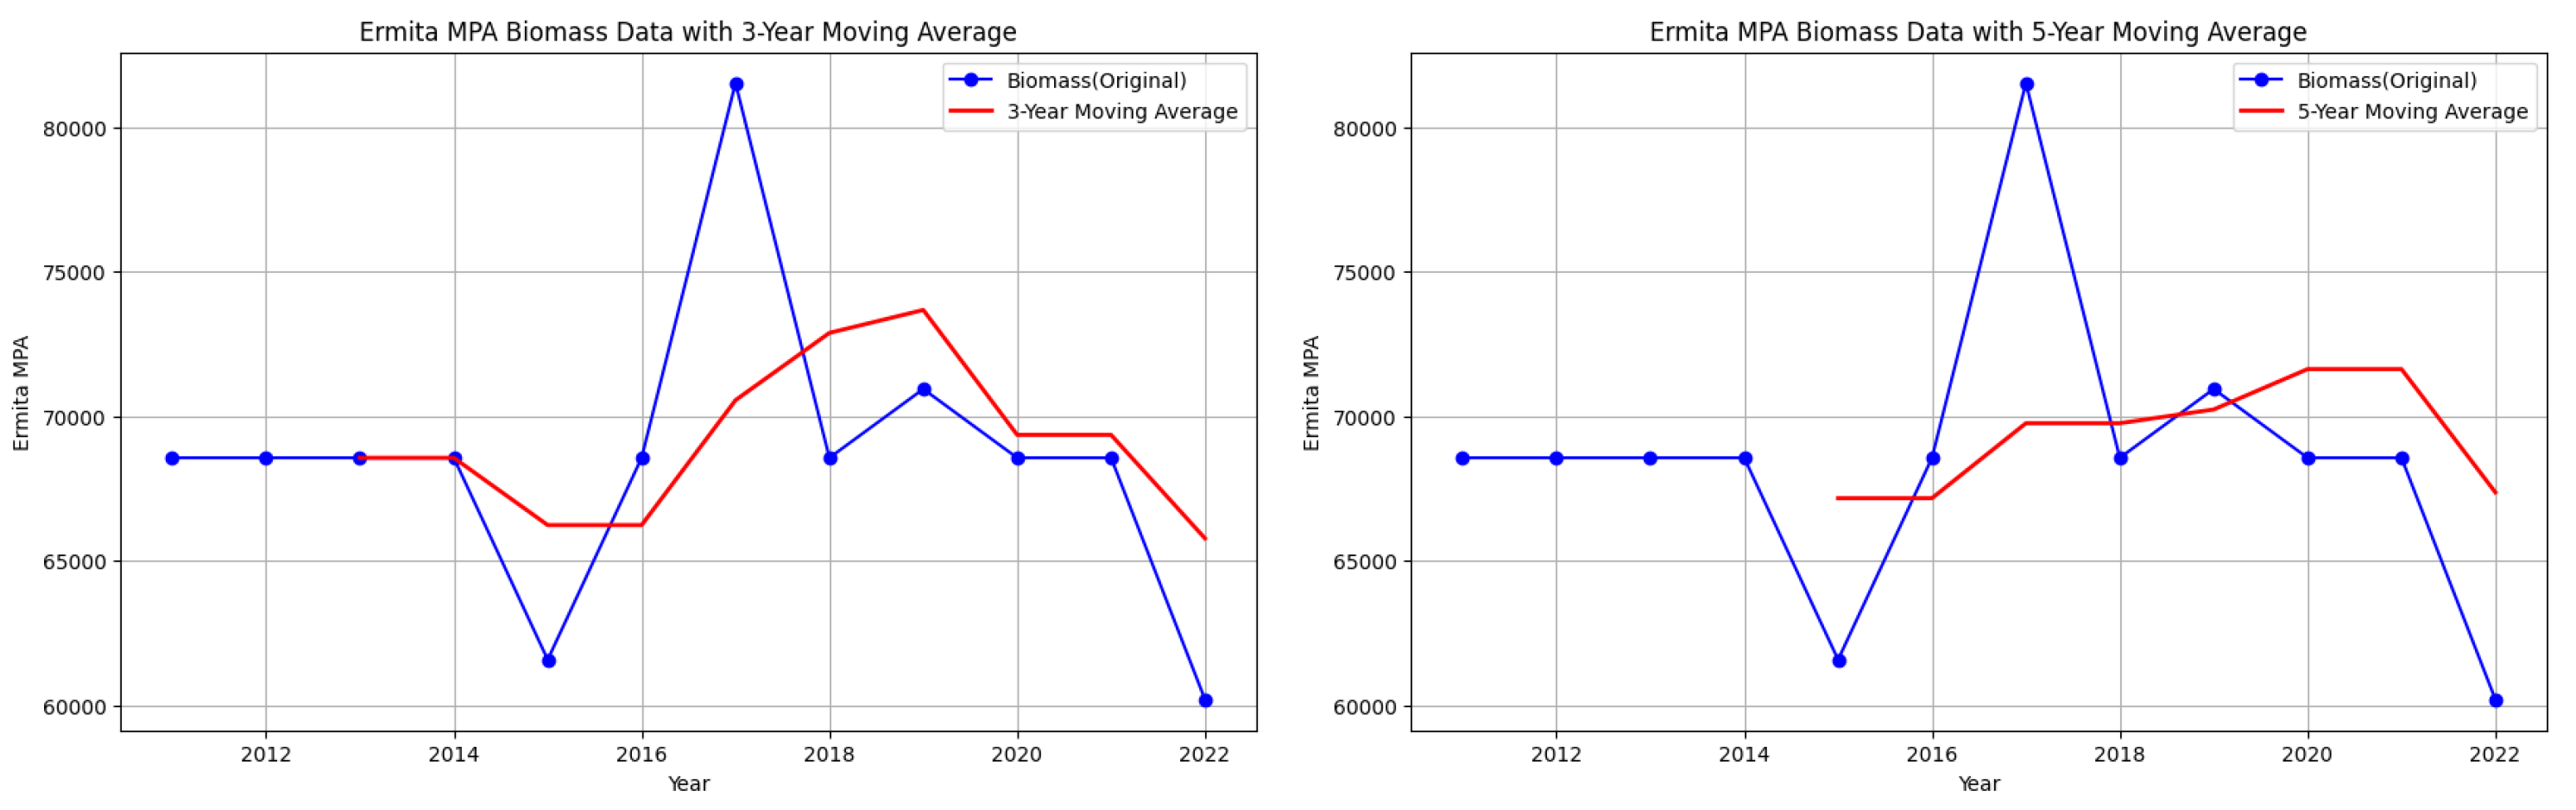
Figure 9.
Mantalip MPA biomass data with 3-year and 5-year moving averages.
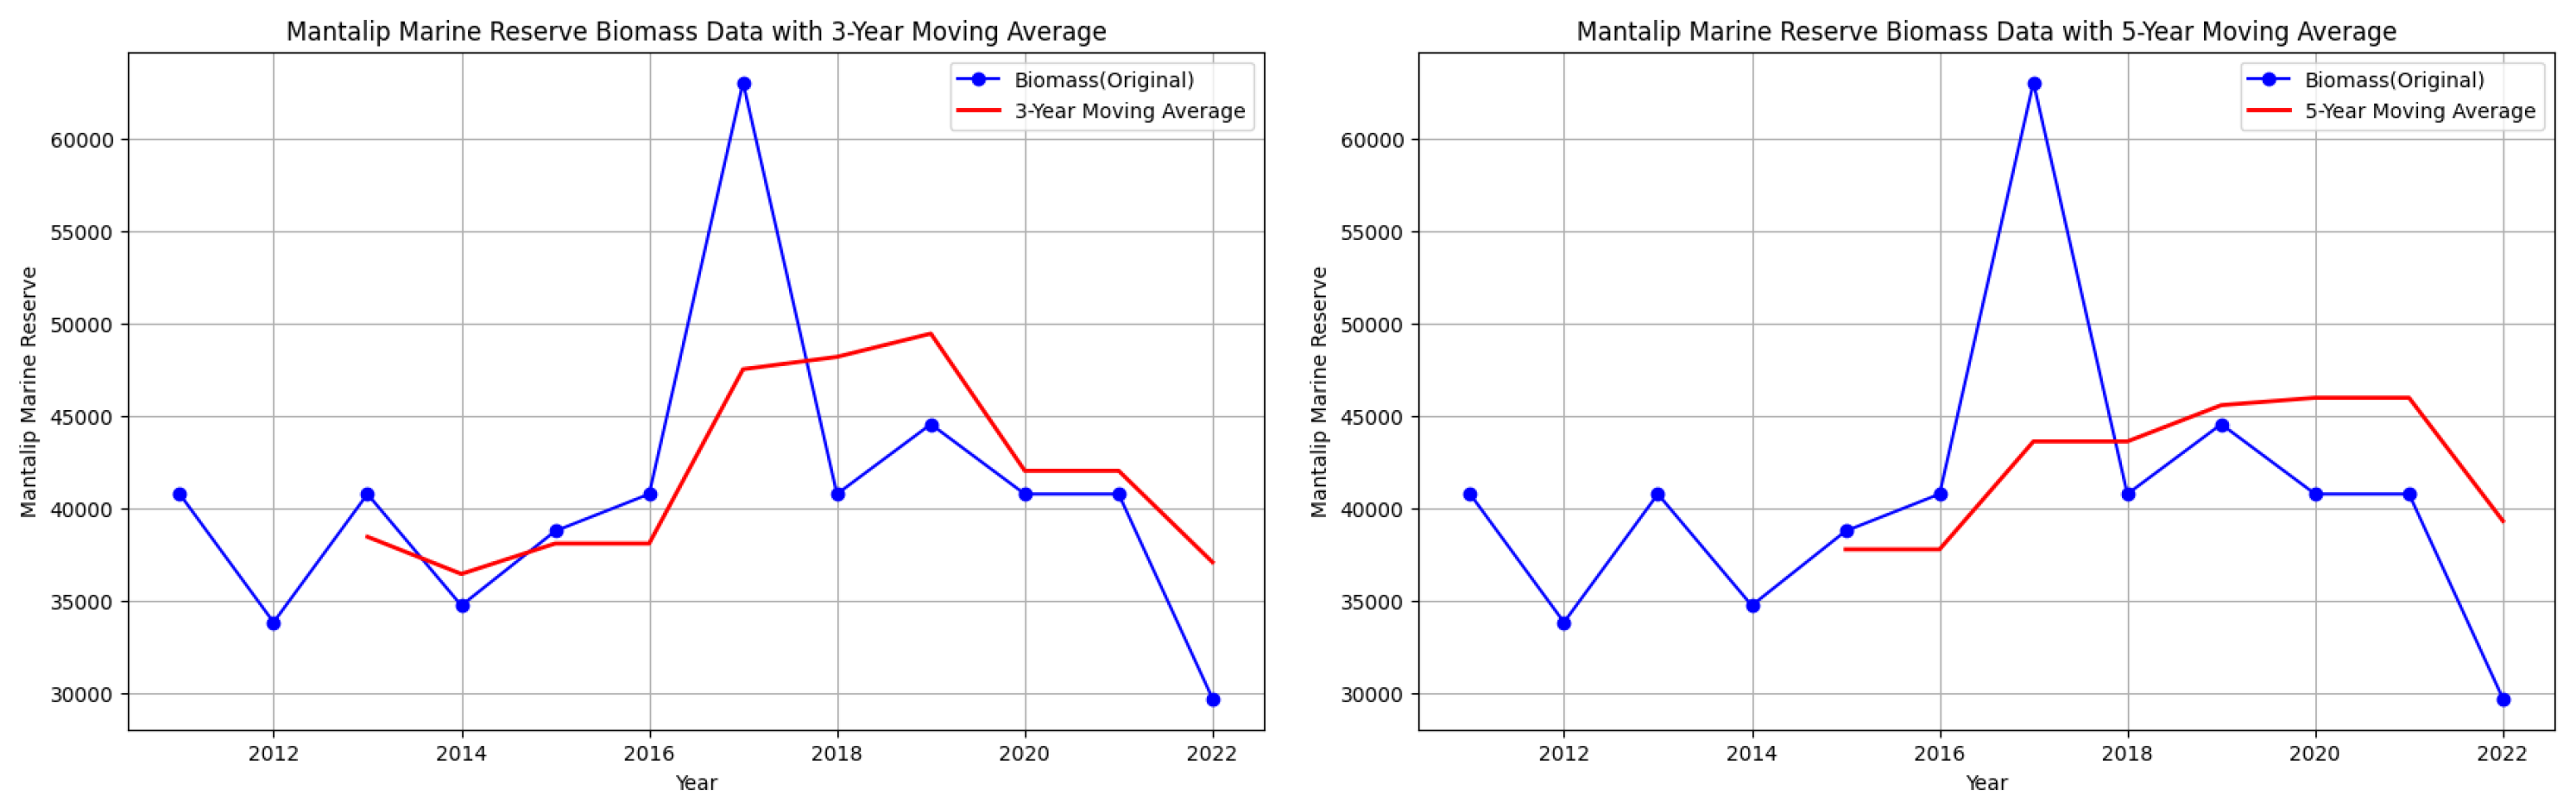
However, note that despite attempts to smooth out the fluctuations, there are still downward trends in some parts of the graphs of starting biomass data per year for each MPA.
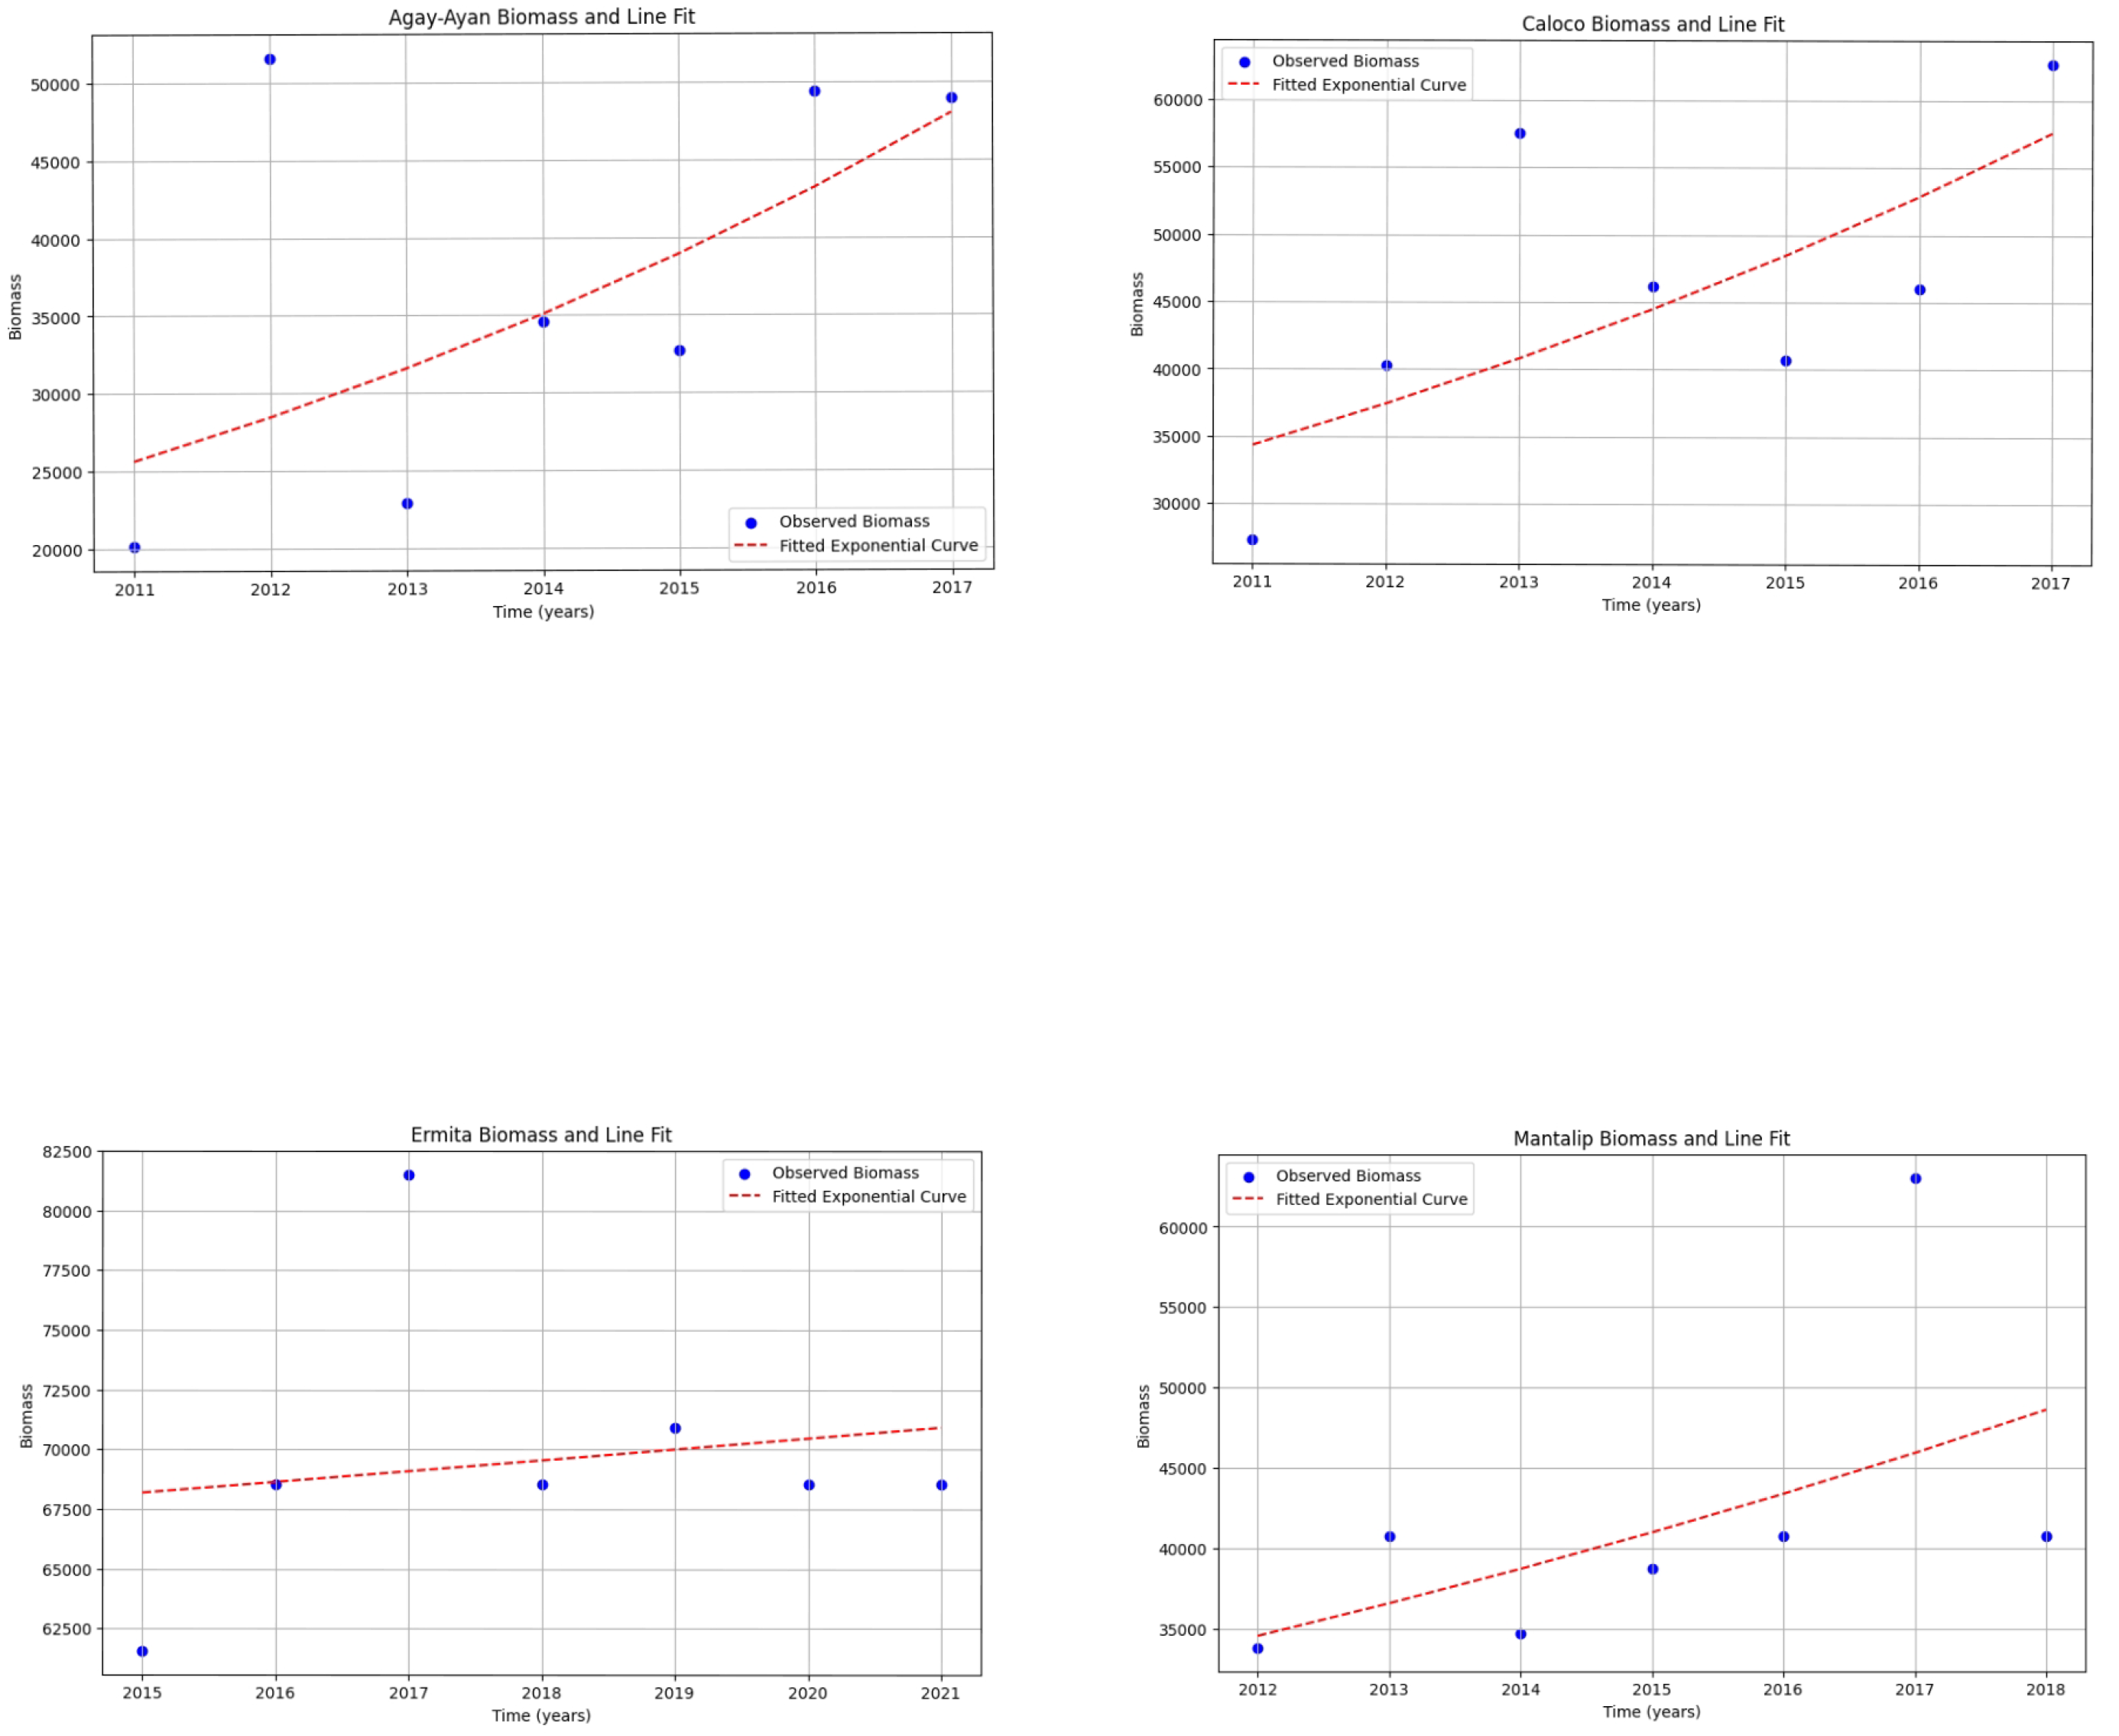
For the first seven years under strict protection, we created charts for the biomass data for each MPA. The missing values for some years were accounted for by finding the mean of the available biomass data. The modified tables for biomass for each MPA are shown below, where italicized values are the means of the available data for each MPA.

Table 3.
Starting points of biomass from Agay-Ayan Marine Sanctuary (.
| Year | Agay-Ayan Marine Sanctuary |
|---|---|
| 2011 | 20,152 |
| 2012 | 51,602 |
| 2013 | 22,901 |
| 2014 | 34,601 |
| 2015 | 32,740 |
| 2016 | 49,435 |
| 2017 | 48,927 |
Table 4.
Starting points of biomass from Caloco Marine Sanctuary ().
| Year | Caloco Marine Sanctuary |
|---|---|
| 2011 | 27,347 |
| 2012 | 40,280 |
| 2013 | 57,554 |
| 2014 | 46,222.125 |
| 2015 | 40,732 |
| 2016 | 45,991 |
| 2017 | 62,708 |
Table 5.
Starting points of biomass from Ermita MPA ().
| Year | Ermita Marine Protected Area |
|---|---|
| 2015 | 61,578 |
| 2016 | 68,556.5 |
| 2017 | 81,511 |
| 2018 | 68,556.5 |
| 2019 | 70,934 |
| 2020 | 68,556.5 |
| 2021 | 68,556.5 |
Table 6.
Starting points of biomass from Mantalip Marine Reserve (.
| Year | Mantalip Marine Reserve |
|---|---|
| 2012 | 33,853 |
| 2013 | 40,788 |
| 2014 | 34,762 |
| 2015 | 38,788 |
| 2016 | 40,788 |
| 2017 | 63,035 |
| 2018 | 40,788 |
The corresponding charts for each MPA are depicted in the following graphs:
Figure 10.
Starting points of biomass from Agay-Ayan Marine Sanctuary (.
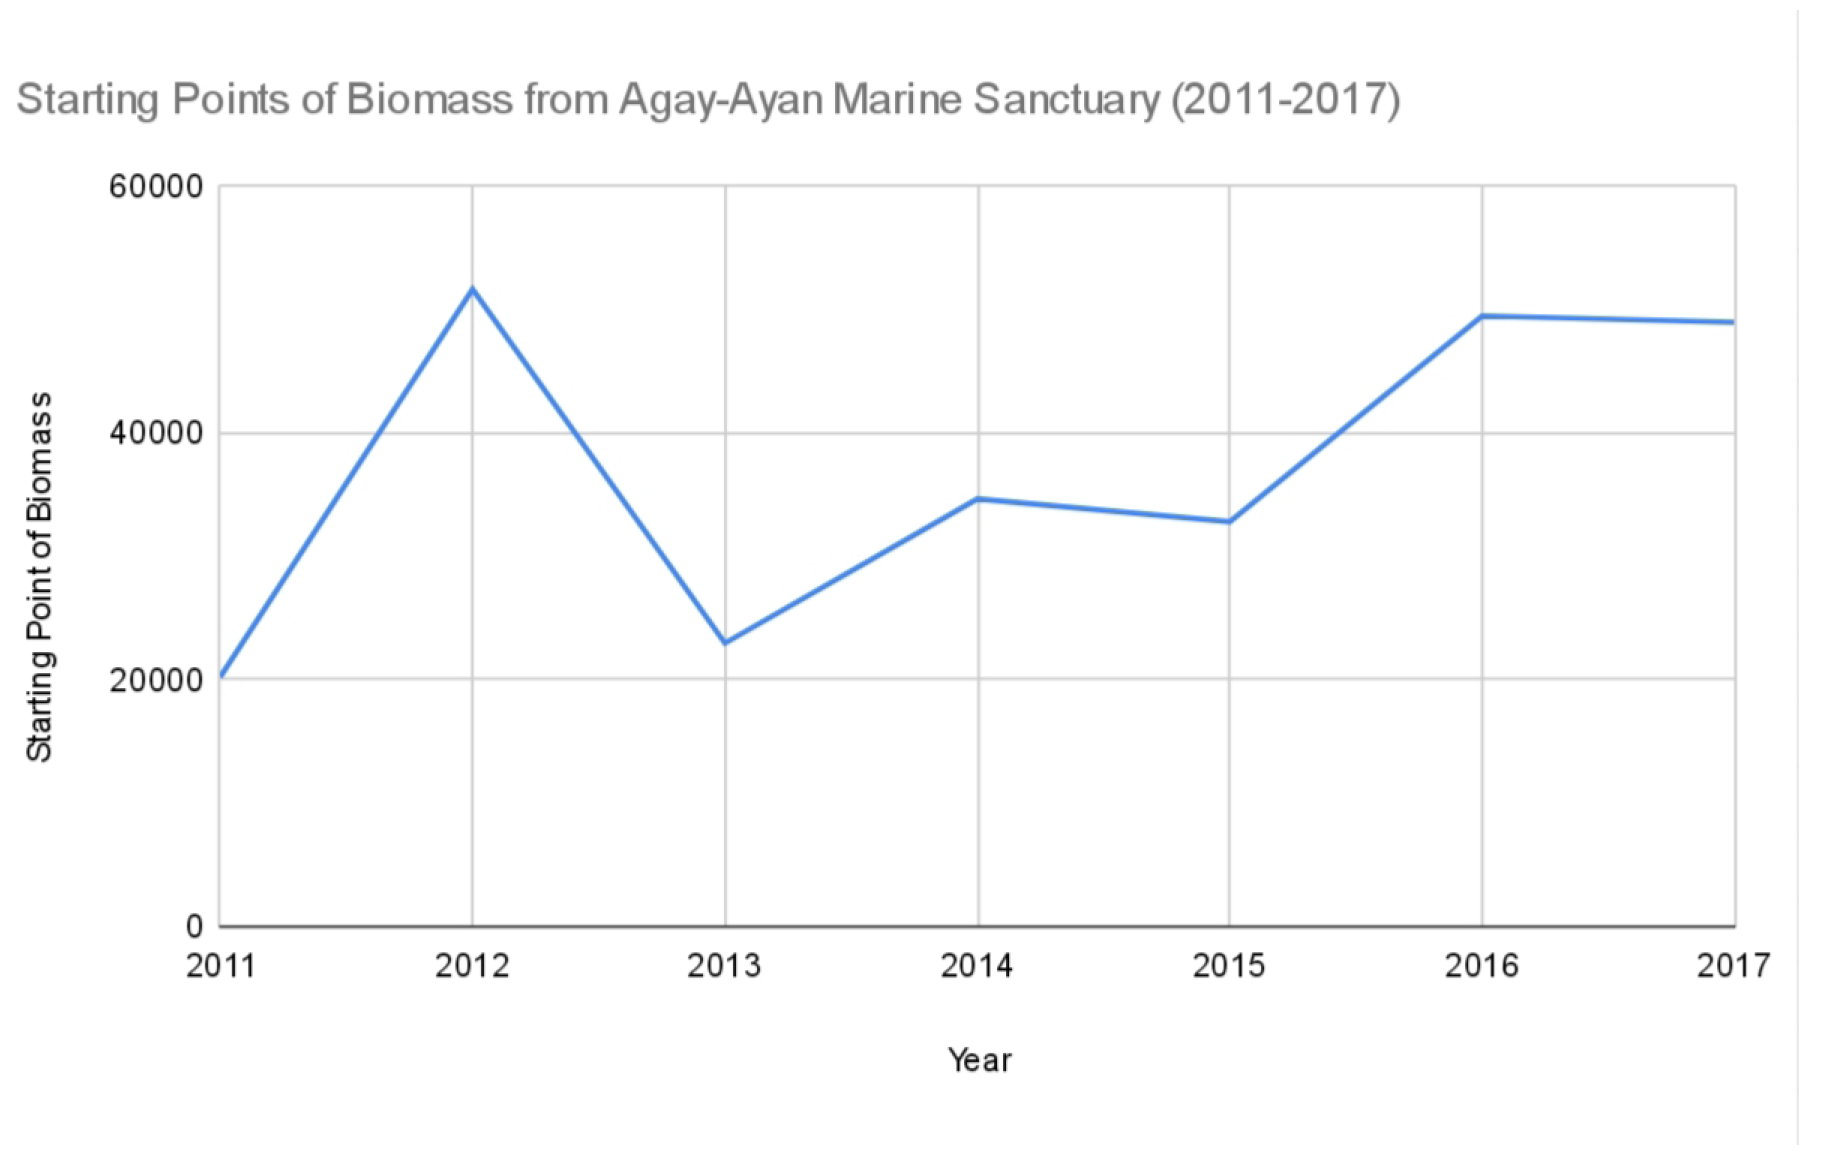
Figure 11.
Starting points of biomass from Caloco Marine Sanctuary ().
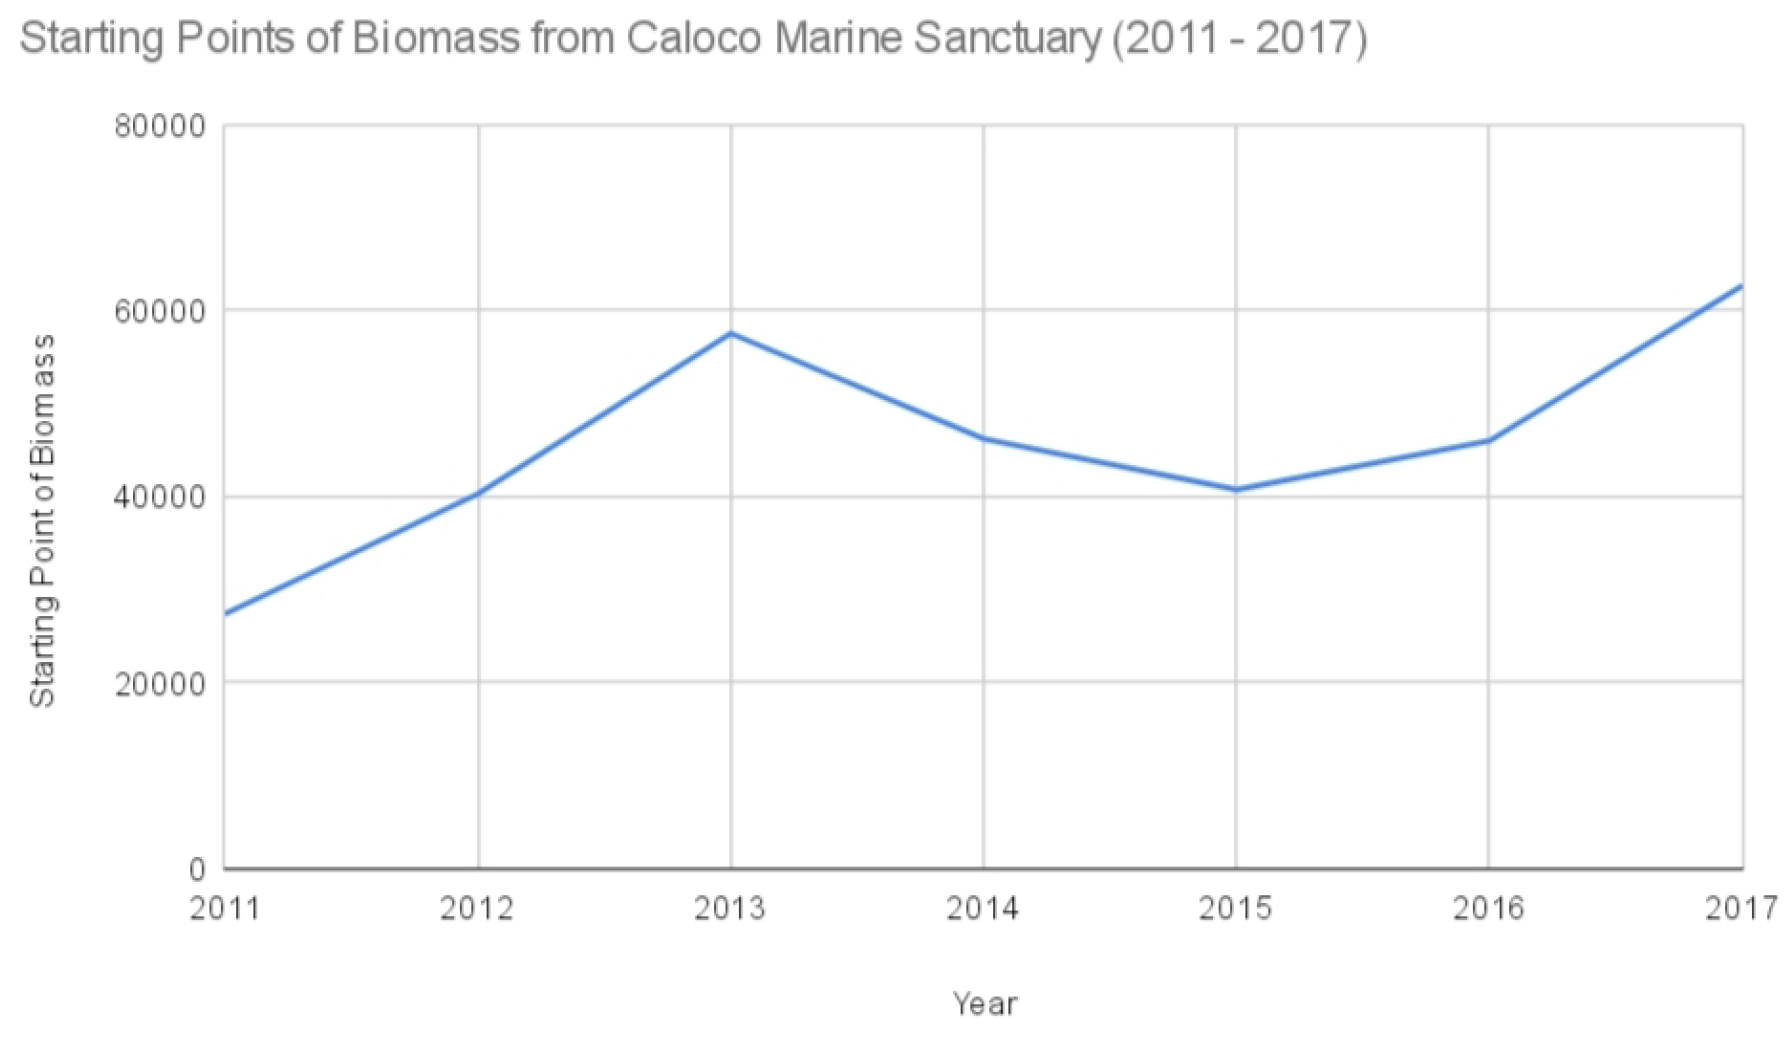
Figure 12.
Starting points of biomass from Ermita MPA ()
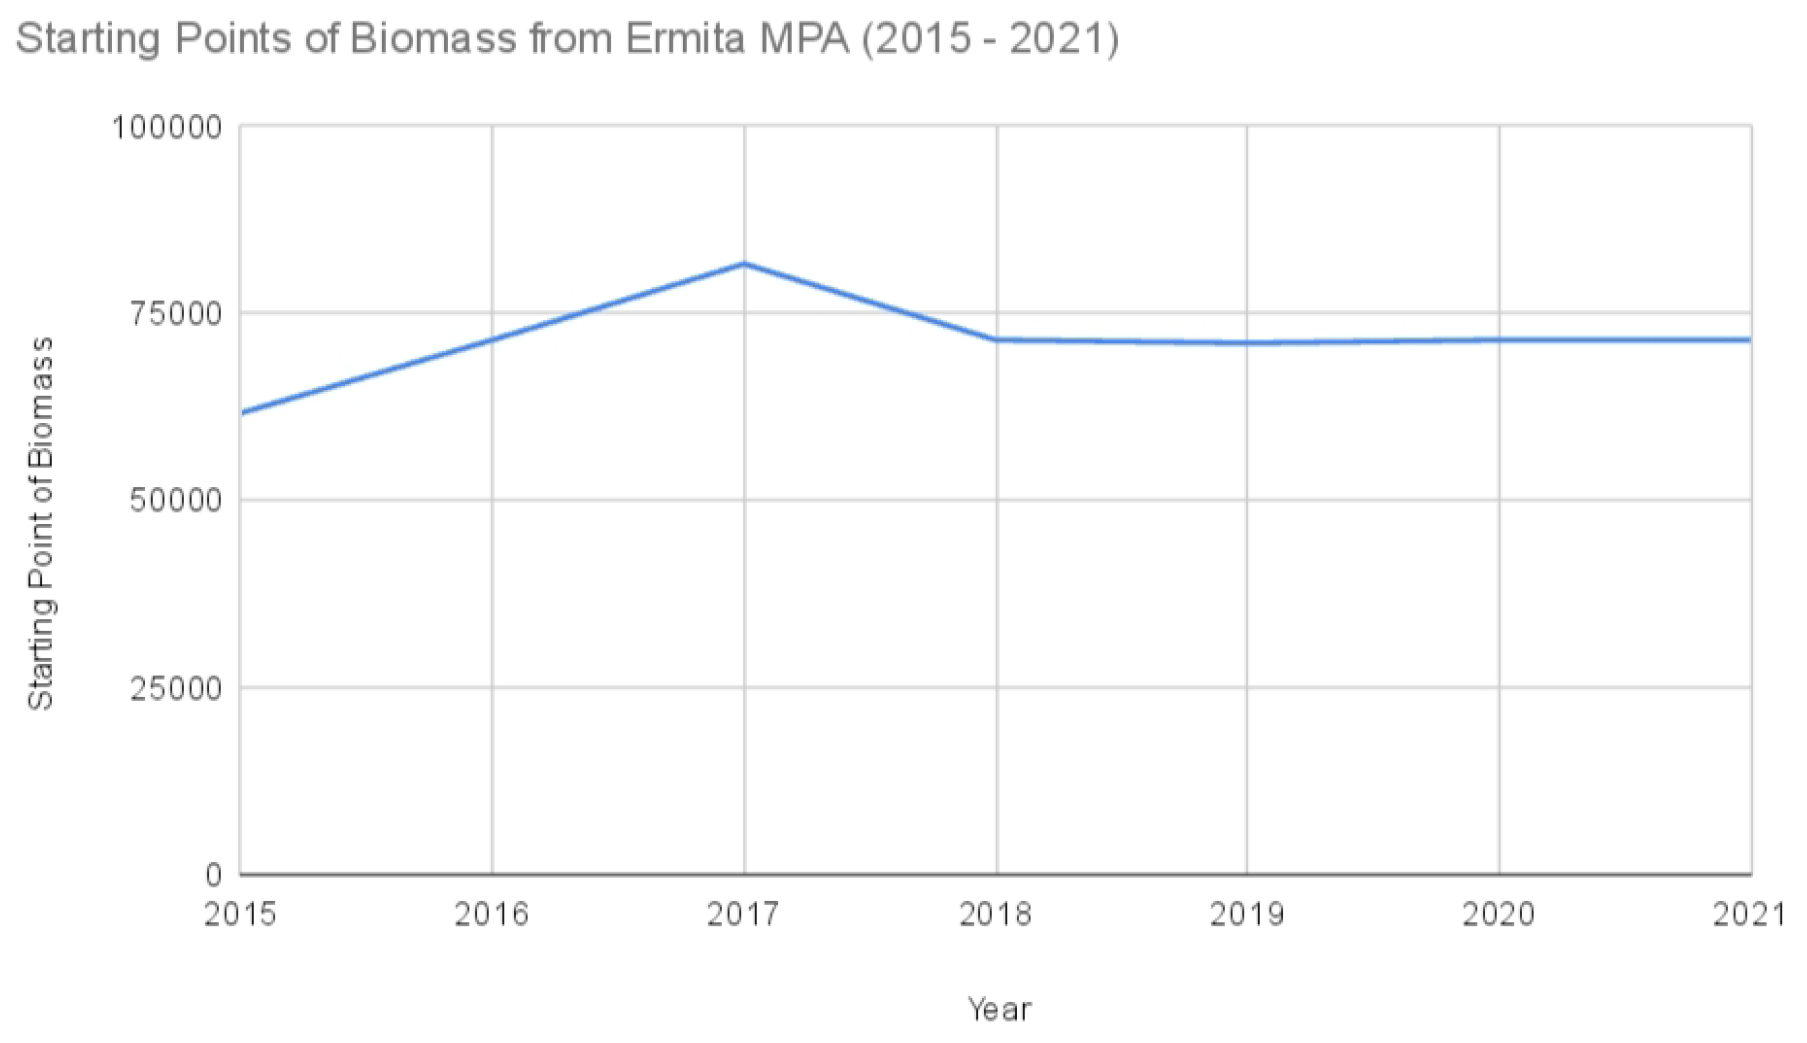
Figure 13.
Starting points of biomass from Mantalip Marine Reserve (.
We used linear regression to analyze the biomass data for each MPA and to determine its growth rate and biomass doubling time. Applying the Rule of 70 yielded the data in Table 3.6.
Table 7.
Approximated values of growth rate, biomass doubling time, and biomass doubling time according to the Rule of 70.
Table 7.
Approximated values of growth rate, biomass doubling time, and biomass doubling time according to the Rule of 70.
| MPA | Growth rate r | Biomass Doubling Time (in years) |
Biomass Doubling Time (in years) employing Rule of 70 |
|---|---|---|---|
| Agay-Ayan | 0.1047 | 6.6179 | 6.6833 |
| Caloco | 0.086 | 8.0561 | 8.1358 |
| Ermita | 0.0065 | 106.0006 | 107.0486 |
| Mantalip | 0.0568 | 12.2098 | 12.3305 |
The graphs below depict the results of the linear regression analyses:
Figure 14.
Results of linear regression applied to biomass data for each MPA, corresponding growth rate, and biomass doubling times.
Figure 14.
Results of linear regression applied to biomass data for each MPA, corresponding growth rate, and biomass doubling times.
3.2. Impact of MPA Size, Years Under Strict Protection, and Governance Level
As described in Section 2.3.1, to investigate the possible effects of MPA size, years under strict protection, and governance level on biomass doubling times, expressions were derived for the exponential and the logistic growth models,
and
respectively.
Using these mathematical models, we first calculated each MPA’s corresponding doubling times for each year.
Table 8.
Yearly biomass doubling times in Agay-Ayan MPA.
| Year | Biomass Doubling Time (using Exponential Model) |
Biomass Doubling Time (using Logistic Model) |
|---|---|---|
| 2012 | 0.7372 | 0.7365 |
| 2013 | 10.8408 | 10.8342 |
| 2014 | 3.8467 | 3.8438 |
| 2015 | 5.7132 | 5.7090 |
| 2016 | 3.8622 | 3.8586 |
| 2017 | 4.6886 | 4.6842 |
Table 9.
Yearly biomass doubling times in Caloco MPA.
| Year | Biomass Doubling Time (using Exponential Model) |
Biomass Doubling Time (using Logistic Model) |
|---|---|---|
| 2012 | 1.7900 | 1.7876 |
| 2013 | 1.8630 | 1.8603 |
| 2014 | 3.9620 | 3.9568 |
| 2015 | 6.9592 | 6.9507 |
| 2016 | 6.6670 | 6.6582 |
| 2017 | 5.0114 | 5.0036 |
Table 10.
Yearly biomass doubling times in Ermita MPA.
| Year | Biomass Doubling Time (using Exponential Model) |
Biomass Doubling Time (using Logistic Model) |
|---|---|---|
| 2016 | 6.4567 | 6.4523 |
| 2017 | 4.9434 | 4.9397 |
| 2018 | 19.3700 | 19.3569 |
| 2019 | 19.6019 | 19.5884 |
| 2020 | 32.2839 | 32.2615 |
| 2021 | 38.7401 | 38.7138 |
Table 11.
Yearly biomass doubling times in Mantalip MPA.
| Year | Biomass Doubling Time (using Exponential Model) |
Biomass Doubling Time (using Logistic Model) |
|---|---|---|
| 2013 | 3.7194 | 3.7171 |
| 2014 | 52.3185 | 52.2885 |
| 2015 | 15.2807 | 15.2714 |
| 2016 | 14.8776 | 14.8683 |
| 2017 | 5.5749 | 5.5706 |
| 2018 | 22.3164 | 22.3025 |
To compare these data visually, the results of each growth model are superimposed in Figure 15 and Figure 16 below.
To examine the possible impact of imposing strict protective measures on biomass doubling times, our data analyses returned the results in Table 12.
Note that the average biomass doubling time using the two mathematical models is different from the biomass doubling time that we calculated using linear regression since for the former, we determined the growth rate first to find the biomass doubling time, while for the latter, we calculated the biomass doubling time for each year and then determined the average to find the growth rate. We will consider the biomass doubling time that we computed using linear regression as the ”true” biomass doubling time and then calculate the error or absolute value of the difference between the former and the latter (Table 13 and Table 14).
Figure 17 below compares these data visually.
The following tables depict the growth rates.
Table 15.
Growth rates using linear regression and average doubling time using the exponential growth model.
Table 15.
Growth rates using linear regression and average doubling time using the exponential growth model.
| MPA | Growth rate (using linear regression) |
Growth rate (using average biomass doubling time) |
Error |
|---|---|---|---|
| Agay-Ayan | 0.1047 | 0.1401 | 0.0353 |
| Caloco | 0.0860 | 0.1584 | 0.0724 |
| Ermita | 0.0065 | 0.03426 | 0.02772 |
| Mantalip | 0.0568 | 0.03645 | 0.02032 |
Table 16.
Growth rates using linear regression and average doubling time using the logistic growth model.
Table 16.
Growth rates using linear regression and average doubling time using the logistic growth model.
| MPA | Growth rate (using linear regression) |
Growth rate (using average biomass doubling time) |
Error |
|---|---|---|---|
| Agay-Ayan | 0.1047 | 0.1402 | 0.0355 |
| Caloco | 0.0860 | 0.1586 | 0.0726 |
| Ermita | 0.0065 | 0.03428 | 0.02774 |
| Mantalip | 0.0568 | 0.03648 | 0.02029 |
Figure 18 below presents the growth rate data visually.
Figure 18.
Comparison of growth rates using exponential and logistics growth models versus growth rate using linear regression.
Figure 18.
Comparison of growth rates using exponential and logistics growth models versus growth rate using linear regression.
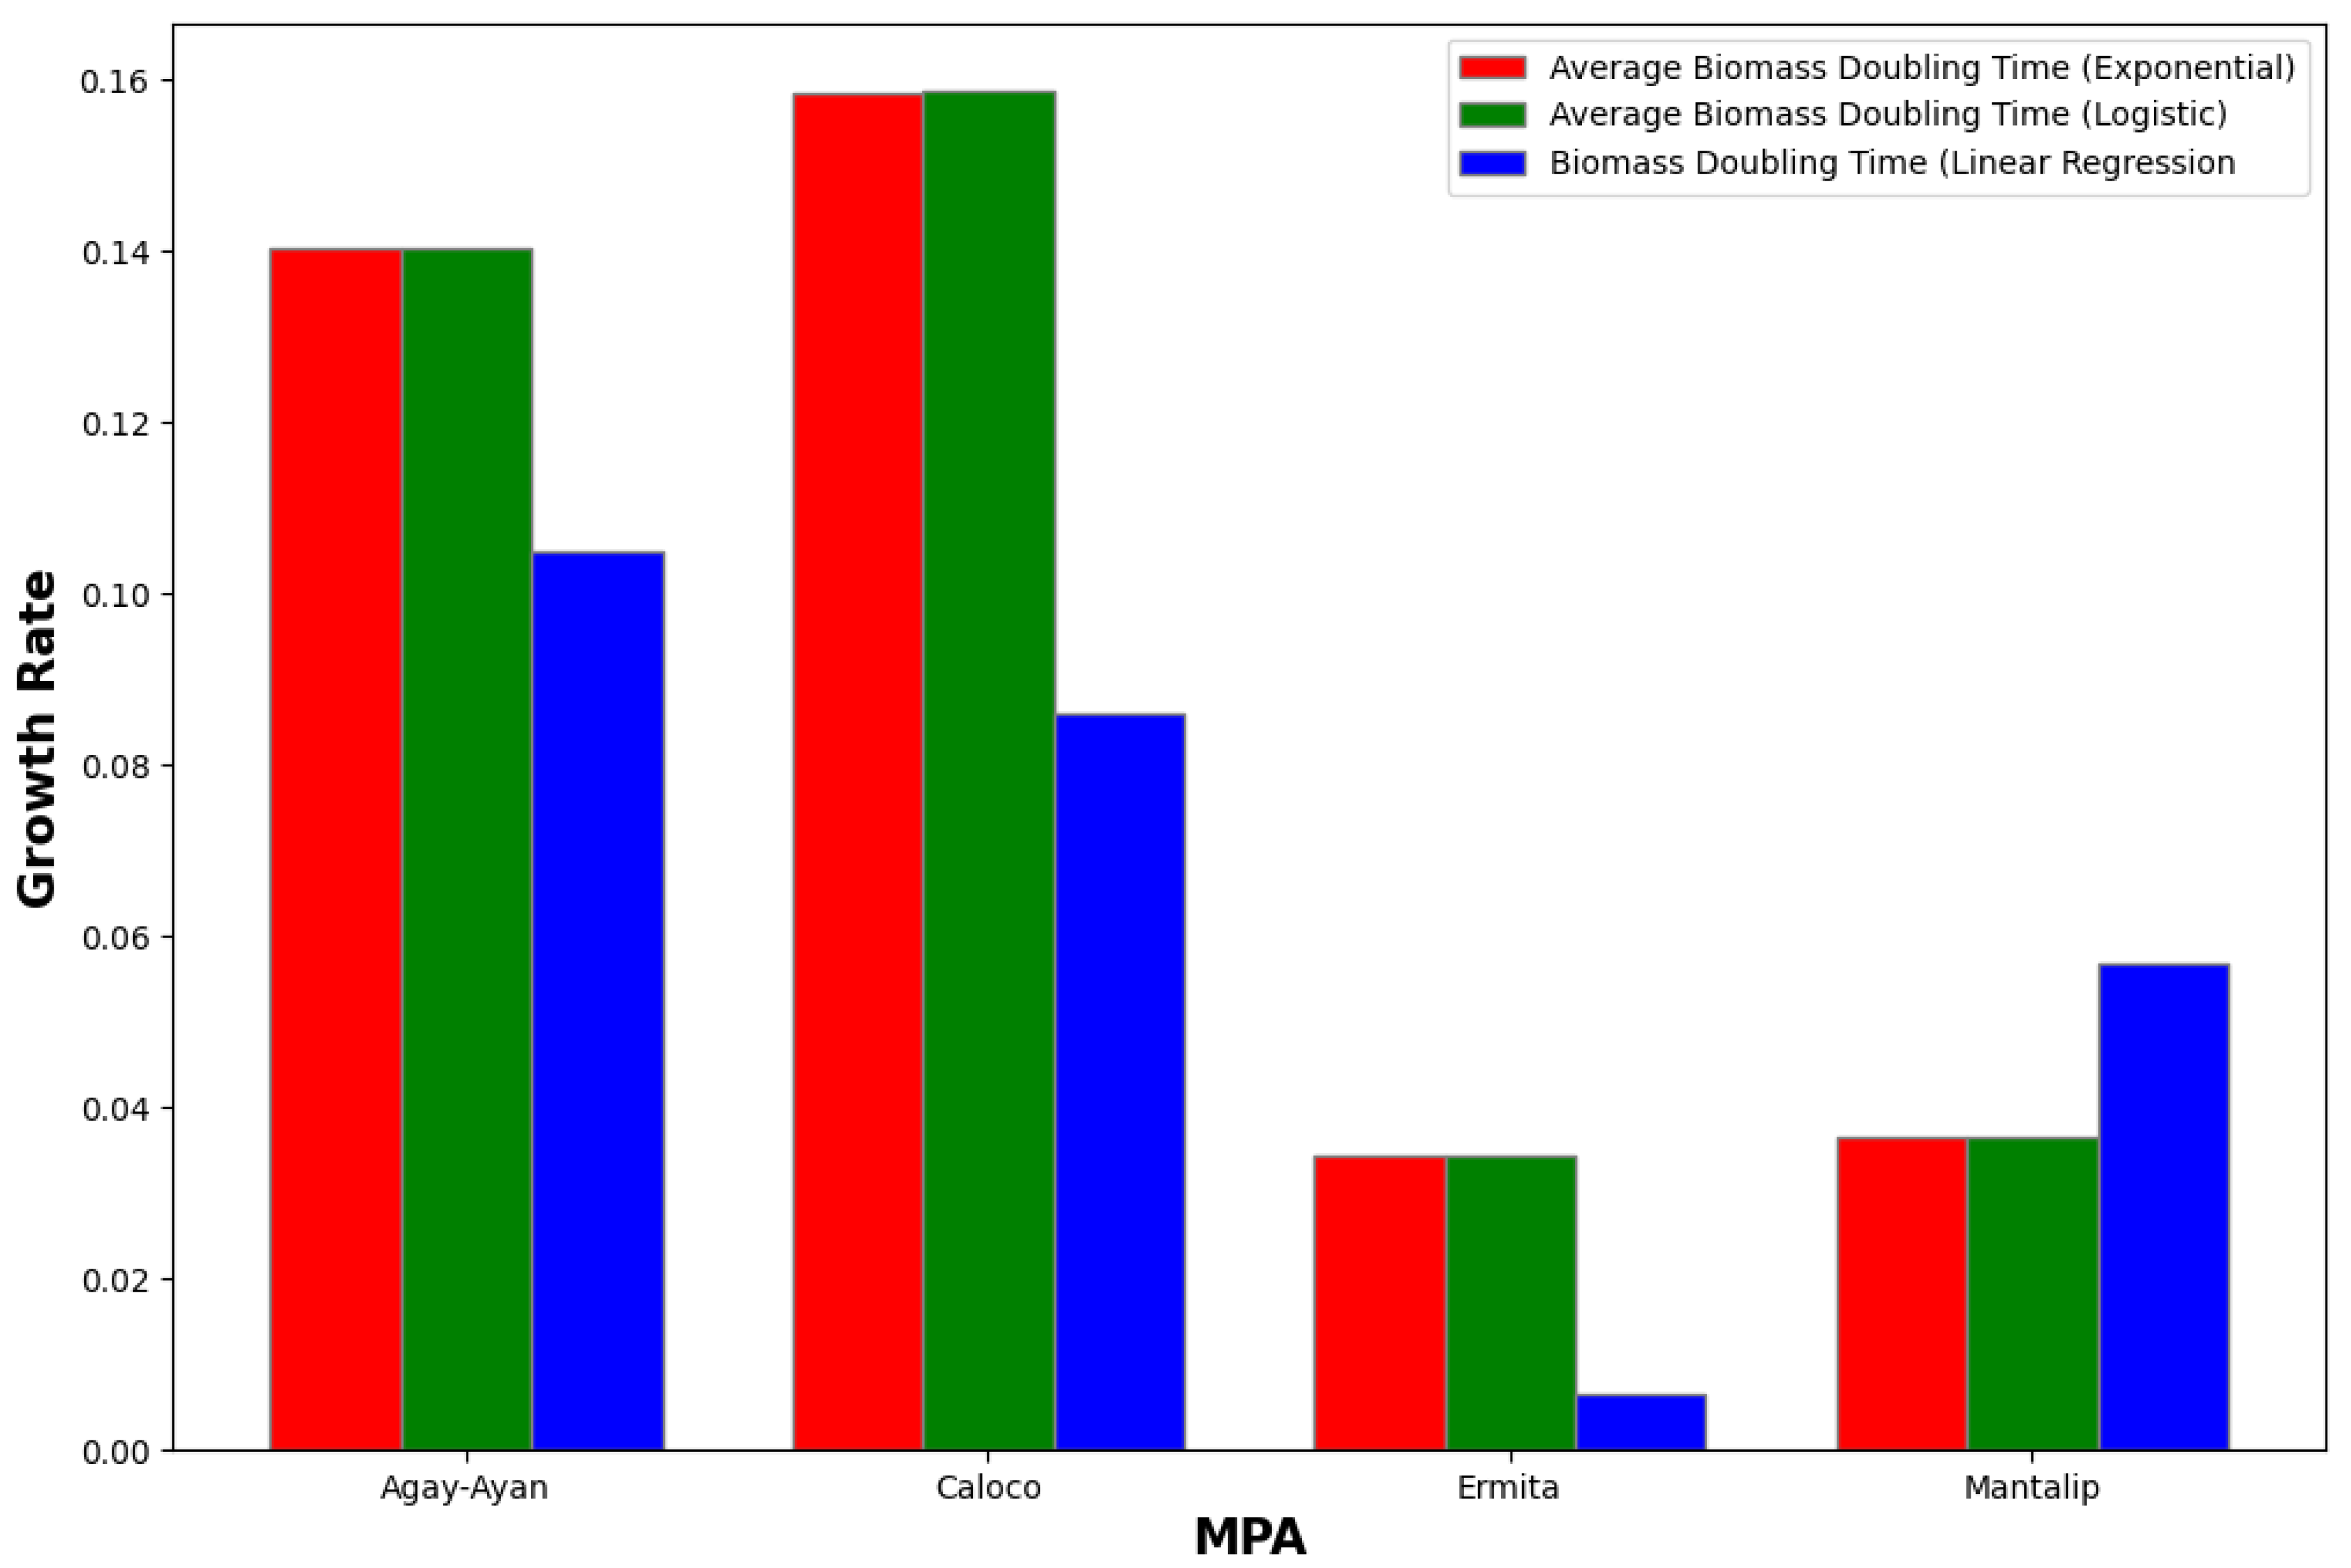
Figure 19.
The sum of weight in each MPA from its first year under strict protection to 2022.
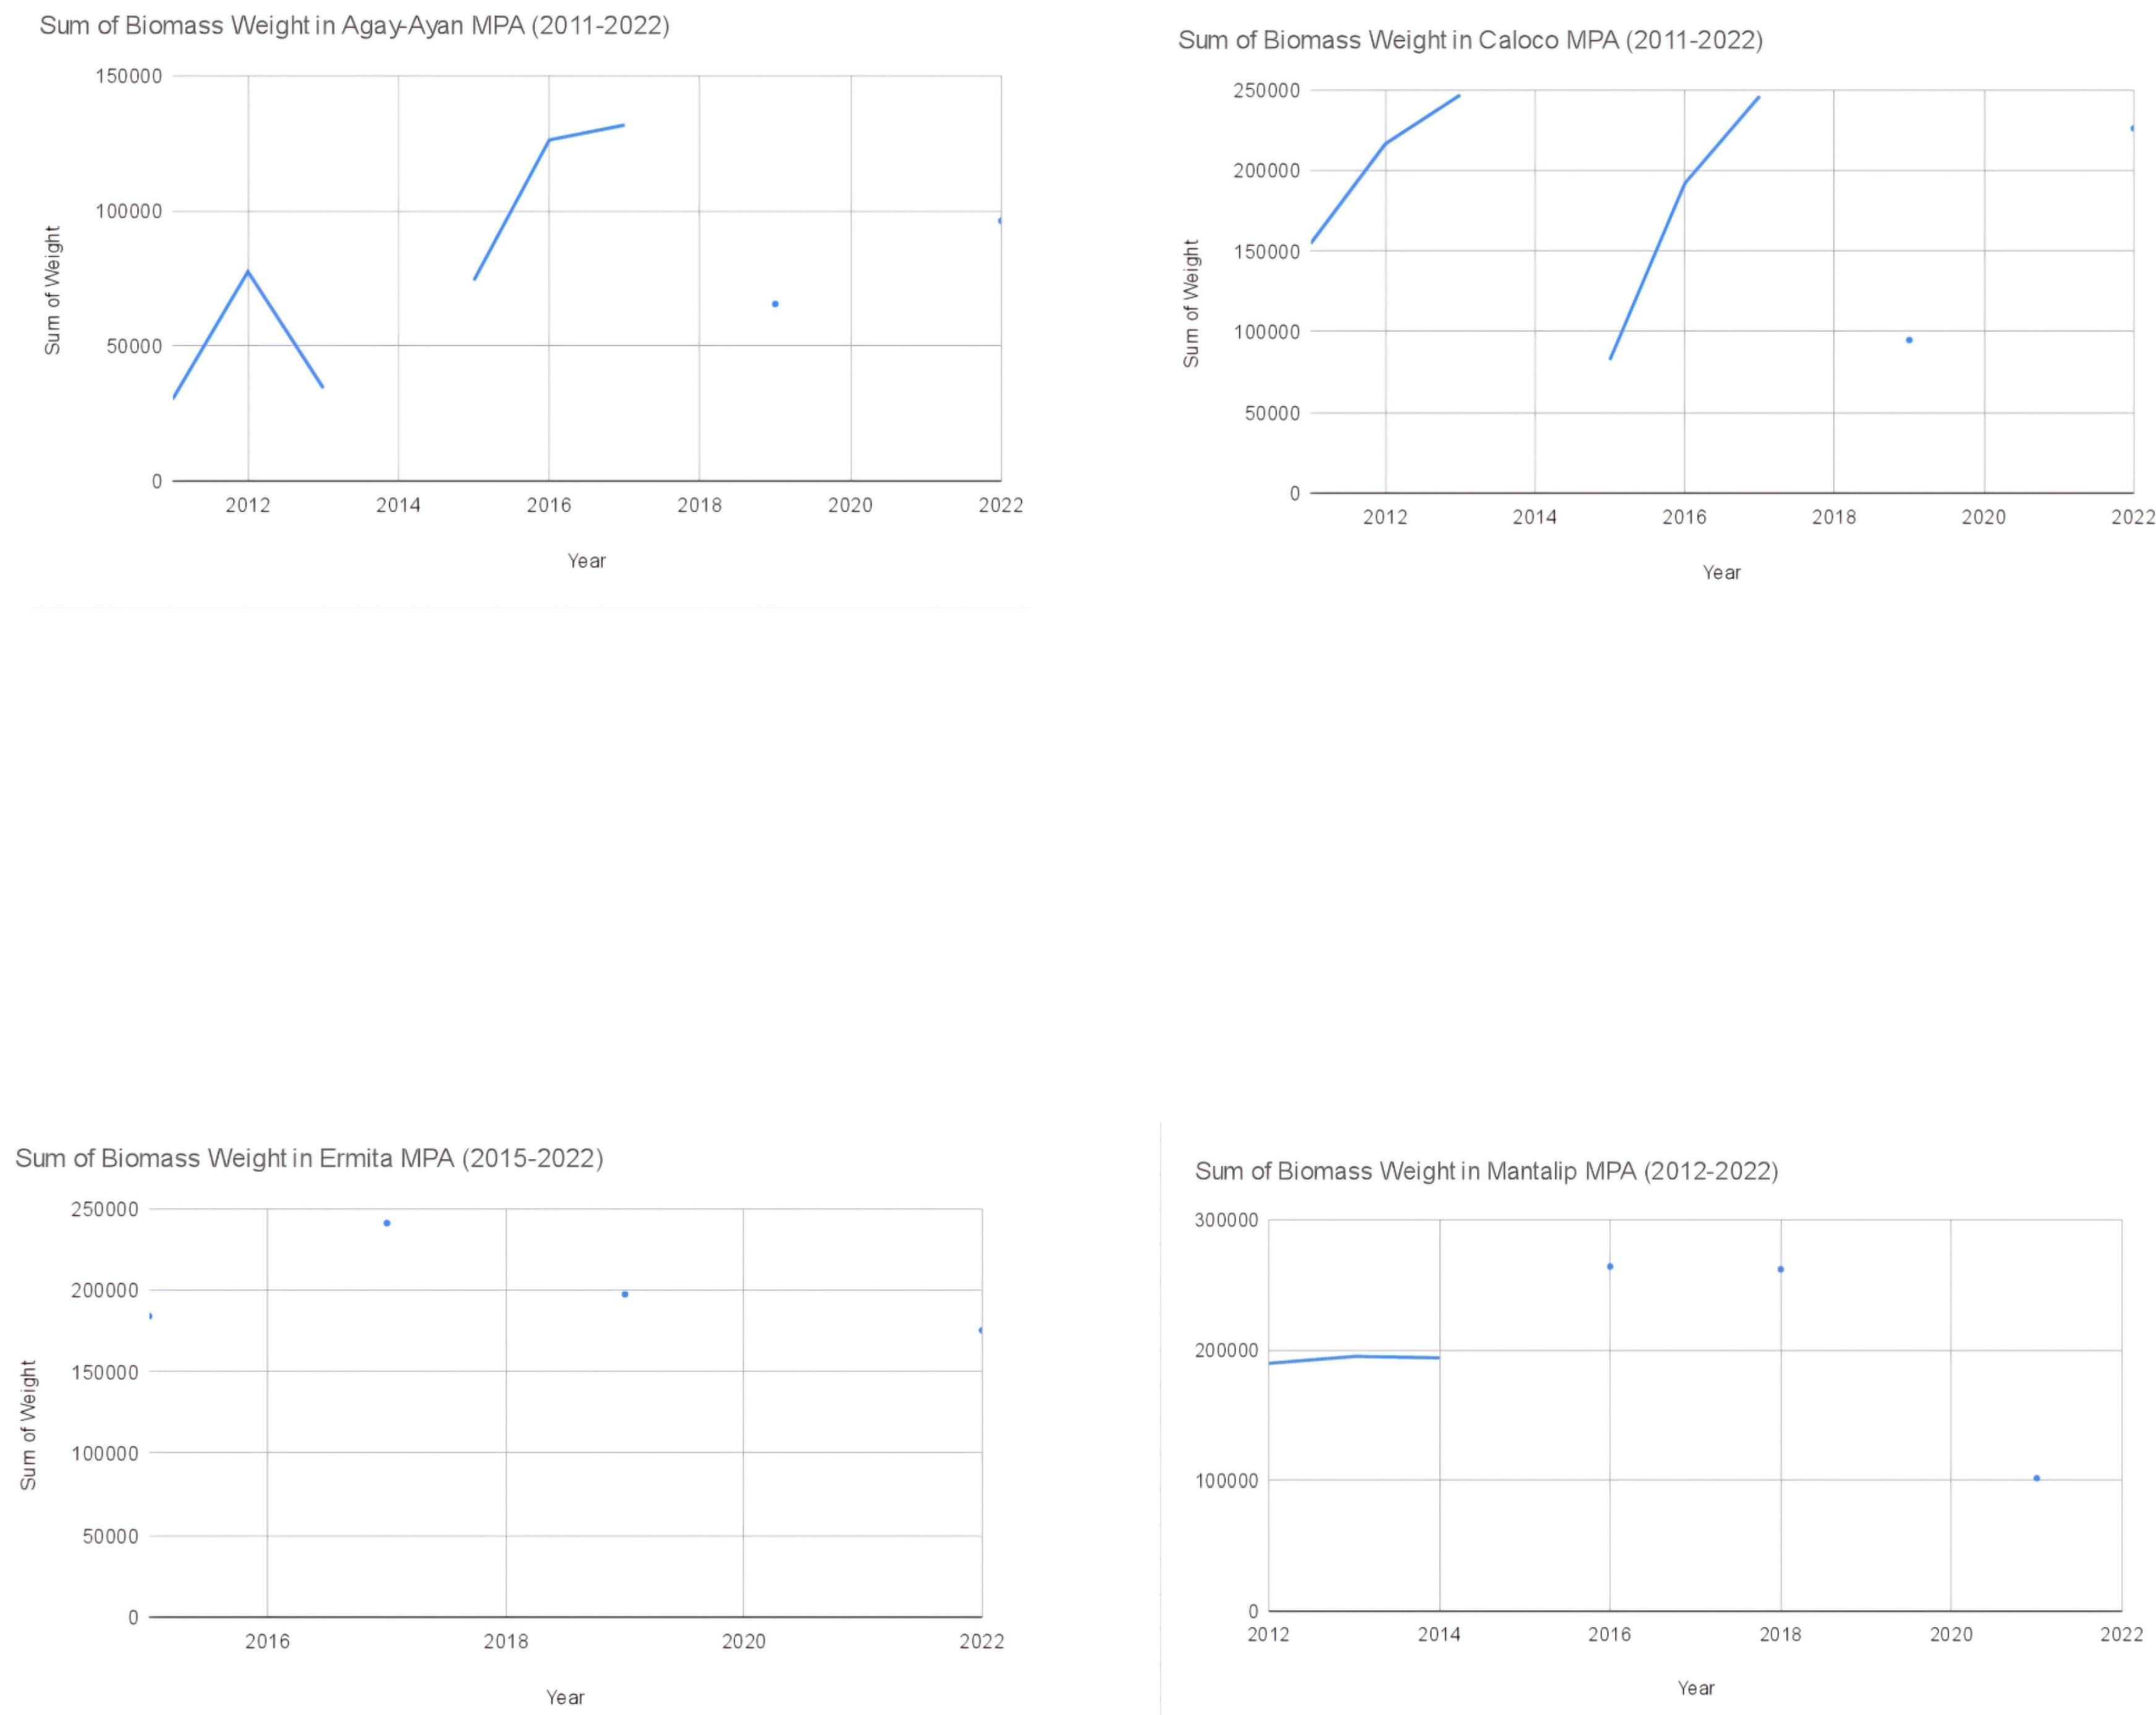
Figure 20.
Biomass weight in each MPA from its first year under strict protection to 2022.
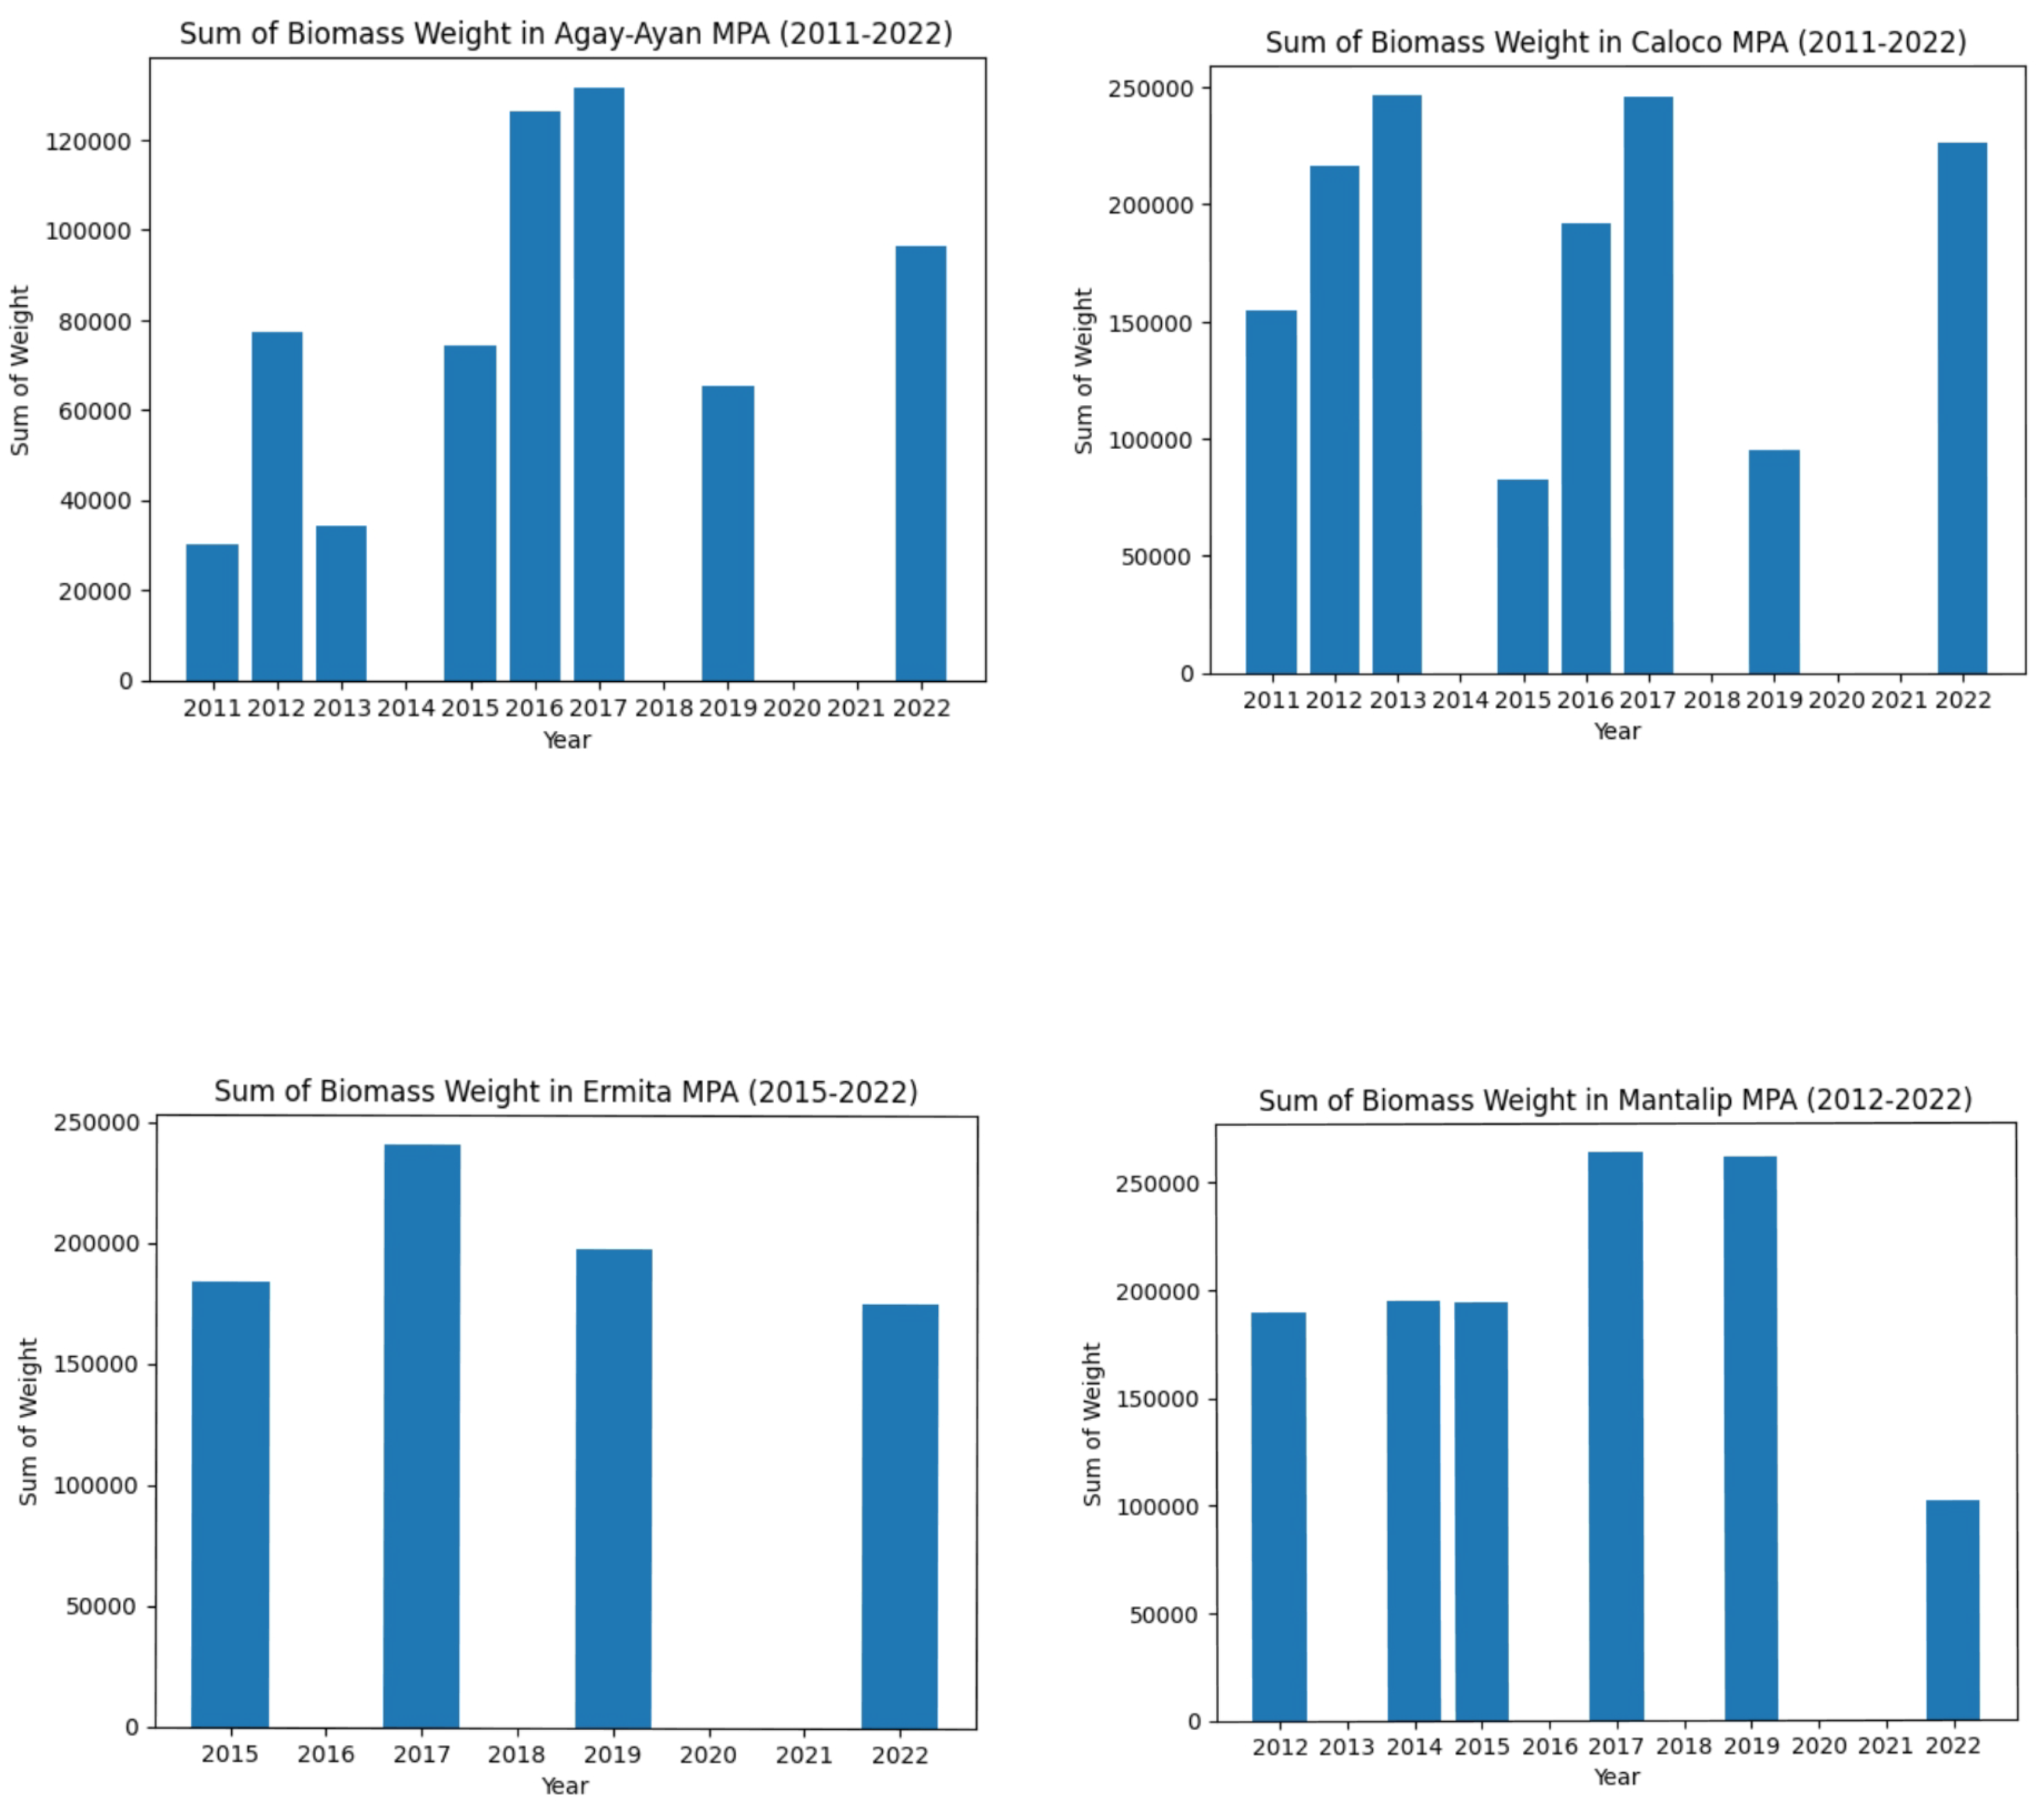
Table 17.
Table showing the sum of weight in each MPA from its first year under strict protection until the year 2022 (Years with no data are those without RARE monitoring).
Table 17.
Table showing the sum of weight in each MPA from its first year under strict protection until the year 2022 (Years with no data are those without RARE monitoring).
| Year | Agay-Ayan | Caloco | Ermita | Mantalip |
|---|---|---|---|---|
| 2011 | 30228.053 | 154540.02 | ||
| 2012 | 77403.406 | 216511.42 | 189547.96 | |
| 2013 | 34351.589 | 246815.16 | ||
| 2014 | 194911.65 | |||
| 2015 | 74192.551 | 82541.771 | 184092.987 | 193794.56 |
| 2016 | 126145.62 | 191982.62 | ||
| 2017 | 131650.18 | 246010.41 | 241129.06 | 263901.71 |
| 2019 | 65457.051 | 94838.075 | 197527.95 | 261751.46 |
| 2022 | 96216.706 | 226134.49 | 175393.73 | 101454.7 |
Incorporating MPA’s size, years under strict protection, and governance level affected biomass doubling time, but not too significantly. On a positive note, we can observe that the average biomass doubling time under the logistic growth model (with parameters on MPA size, years under strict protection, and governance level) declined up to a few decimal places compared to the average biomass doubling time under the exponential growth model.
4. Discussion
This study on the fish biomass doubling time in some of the marine protected areas in the Philippines contributes to the understanding of the interplay between conservation and sustainable fisheries management. This supports other studies confirming that MPAs have been shown to enhance fish biomass [33], and that there is evidence MPAs have been implemented successfully to increase fish abundance and biomass [34]. Taking into consideration the starting point of biomass, MPA area, years of protection, and governance level estimated through the MEAT results [9], this study sought to improve the understanding of the sociobiological model that seeks the optimum fish biomass and biodiversity conservation in MPAs.
The idea of doubling time dates back to classic exponential and logistic growth models [35,36], and it is important in calculating the recovery within MPAs and the resulting spillover impacts to the fishing local communities having MPA that augment the production in fishery through the spillover [37]. The application of these models towards modern approaches to MPA management ought to increase the benefits received by the regions surrounding the MPAs. We corroborate the conclusions of [2], which state that fishery models facilitate the sustainable exploitation of coral reef resources.
Research on MPAs indicates that well maintained reserves also enhance fish biomass and biodiversity, supporting the health of the marine ecosystem and the well-being of human populations [38]. Several authors have pointed out the necessity of comprehensive management, community participation, as well as effective governance in achieving conservation objectives. Also, there is literature on the role of various kinds of MPAs, including no-take marine reserves, in the astounding increases in fish biomass and marine biodiversity [24], [39], [40]. In order to sustain reef growth, [41] pointed out the need for the responsible management of coral reef ecosystems by removing human-induced stress factors.
The discussion of the exponential and logistic growth models for determining biomass doubling time provides a methodological framework for analyzing the dynamics of fish biomass in MPAs. The exponential model depends solely on the starting biomass per year and the number of years, so we can expect that there will be negative values for the doubling time at some point. Ideally, the doubling time should not be negative, since it is the number of years in which the biomass population will double. However, since there was a decline in the biomass population at some point, there was no doubling time for that period. For the doubling time to be positive, the biomass population for any time t > 0 should not be less than the initial biomass population. Also, note that the graphs using exponential and logistic growth models are the same for each MPA since the graphs depend solely on B(t) and B0. We deduced some interpretations from the superimposed line graphs and the results that we obtained so far (Figs. 15 and 16): 1) The biomass doubling time varies for each year depending on the starting biomass population for that year relative to the starting biomass population at time 0 in each MPA, and 2) the average doubling time for each MPA ranges from four to 20 years, with Agay-Ayan and Caloco exhibiting four to five years biomass doubling time and Ermita and Mantalip exhibiting 19–20 years biomass doubling time (Table 12).
[18] show that 20-40 years of protection is needed to reach new steady states which is in concordance with our study. Other papers showed that after three years of protection fish density and species richness is captured. [42] and [43] suggested decades may be needed for biomass to improve. Their study highlighted that effective no-take protection is needed for local carrying capacity to be rebuilt. Partially fished and no-take MPAs have been shown to have different spillover benefit tradeoffs [44].
Despite attempts to estimate the exact amount of time it would take to double the biomass, the trends associated with each MPA proved challenging. With this, biomass growth projections and the models that predict such trends require deeper analysis.
Integrating other starting variables such as the starting biomass, MPA area, years of protection, and governance scores provided a clearer picture as to how these variables interrelate with fish biomass. MPAs can mitigate food insecurity, reinforce ecosystems resilience to climate change, and aid in the protection of reef-associated fishes by maintaining reef fish biomass above fishery targets while ensuring crucial ecological functions of coral reefs. This supports [45] in saying that MPA studies require multidisciplinary approaches in order to formulate proper management decisions. [24] and [7] argued that strong enforcement and compliance with MPA management plans is necessary because MPAs will remain a necessity under the prevailing conditions that humanity continues to inflict negative impacts on marine biodiversity and resources [4].
While the size of an MPA, the number of years it has been under strict governance, and the governance level influence the biomass doubling phenomenon, the impact is not too significant. [46] volunteered that the Philippines should create at least 10 hectares of no-fishing zone MPAs and begin enforcing regulations on fishing activities. According to [47], 98% of MPAs are small to medium medium-sized, falling between 1.8 to 880 hectares. [48] and [49] suggest that small MPAs are likely to suffer from overfishing and that protecting commercially exploited coral reef fish is not practical. [50], however, argues that larger MPAs are not more effective than smaller ones because even small MPAs, if properly designed and managed, can protect biodiversity. Fish density and diversity will increase in response to the establishment of a marine reserve, no matter the size, as shown by [26]. There are reports of effective marine protected areas that have sanctuaries as small as 10 hectares [51], unlike [15] who argued for a minimum size of 300 hectares if one wishes to maintain diversity of coral species.
Whether large or small, [52] noted that marine reserves “double density, nearly triple biomass, and increase size and diversity by 20–30%.” On a related note, even smaller MPAs do conserve fish biomass [53]. Still, [54] explained further that, in order to safeguard fragile and valuable ecosystems and species, MPAs are essential for conservation.
[1] in a study discovered that the age or the size of the MPA does not significantly correlate with fish biomass, asserting again that while MPAs are not effective enough, they are better than having no marine protection at all. This is consistent with [38] whose findings suggest that without the protective measures in place, coral reefs would be expected to have 10% less fish biomass. More generally, [55], hypothesized that large MPAs are being created to hedge against bad management and anticipated alterations in human activity. We are left with the only hope to protect fisheries and control the ecosystems against further depletion and collapse. [56] and as [57] suggest, we need to be more proactive in the efforts towards long-term monitoring programs.
Based on the findings of our study, while the size of an MPA, years of strict protection, and level of governance have some influence on the biomass doubling time they do so, not in a very pronounced manner. To this effect, more work is needed, particularly in Philippine MPAs, on the optimal size of MPAs, the most appropriate fisheries management instruments that would reduce species depletion and augment biomass, while keeping in mind the findings of [57]. [58] case study based approach argued that the best criteria for a protection strategy are the area of the habitat and its quality, whereas, [21] argued that in order to effectively conserve biotic diversity in protected areas, community support coupled with enforcement is essential. This prevents many MPAs in the country from being unmanaged because of lack of enforcement [59]. Nevertheless, well-enforced MPAs can indeed safeguard a portion of the coral reef associated fish [20] and mitigate the degradation of ecosystem service supply. The reality is, however, that the more resources required to sustain, oversee, and enforce the system, the greater the MPA must be [17] (Sa. [31] reiterated that good governance requires the capability of effecting social and economic change. Likewise, as [60] marine conservation management effectiveness has positive outcomes implies that there is a need to use governance systems and processes that foster community engagement and compliance with regulations, because, as [61] noted, the effectiveness of MPAs greatly relies on robust governance structures. In the same manner, [17] found that effective marine management does need strong community support.
5. Conclusions
This study provides practical knowledge on the conservation and management of marine resources in the Philippines, highlighting the need for appropriate fishery practices within MPAs. The model outcomes can be utilized through planning and designing MPAs aimed at protecting the systems by concentrating on the protection of system functions and habitats, leading to faster recovery in the protected area where the fish biomass is less than the desired level. MPAs size, number of years they have been under strict protection, and level of governance, have an effect on the biomass doubling time. These findings can aid in developing effective conservation strategies for biodiversity, climate change mitigation, management, and fostering resiliency in marine ecosystems. Moreover, this study demonstrated that maintaining the fish biomass level at MPAs will enable the fish to continue providing economic services while protecting the marine resources. Therefore, this study adds to the efforts of managing and conserving reef fish resources while taking into account the socio-economic advantages of enhanced fish biomass in MPAs. The in-depth analyses of biomass doubling time by using exponential and logistic growth models provide valuable insights for enhancing MPA management and conservation, but further research on this topic could shed light on the specific dynamics and interplay between the parameters that we introduced in this paper.
Author Contributions
All authors have contributed to this research paper. Conceptualization, Michelle B. Ballesteros and Dr. Michael P. Atrigenio.; methodology, Michelle B. Ballesteros, Danilo Jr., C. Olalo and Dr. Michael P. Atrigenio; validation, Michelle B. Ballesteros; formal analysis, Michelle B. Ballesteros, Danilo Jr., C. Olalo; resources, Dr. Michael P. Atrigenio; data curation, Michelle B. Ballesteros and Danilo Jr., C. Olalo; writing—original draft preparation, Michelle B. Ballesteros; writing—review and editing, Danilo Jr., C. Olalo and Dr. Michael P. Atrigenio; visualization, Michelle B. Ballesteros; supervision, Dr. Michael P. Atrigenio.; project administration, Dr. Michael P. Atrigenio. All authors have read and agreed to the published version of the manuscript.
Funding
The collection of data utilized for this paper was supported by RARE-Philippines, a not-for-profit funding institution.
Data Availability Statement
Data is available upon request, with permission for the purposes of peer review.
Acknowledgments
We thank the RARE-Philippines, Coastal Resources and Environmental Sustainability in the Tropics (CREST) Laboratory, previously Community Ecology Laboratory (COMECO), for the data and logistical help. For the field assistance of professional divers, Melchor Deocadez, Renmar Martinez, Denmark Recamara, and Mae Angelie Paradela as Fish observers, with Fleur Panga, Ethel Wagas, Ed Vince Ruiz, and Eznaida Jeung Narida as Coral observers. Diana Rose Bugay for the assistance in the QGIS map.
Conflicts of Interest
The authors declare to have no conflicts of interest.
References
- R. N. Muallil et al., “Effectiveness of small locally-managed marine protected areas for coral reef fisheries management in the Philippines,” Ocean Coast Manag, vol. 179, 2019. [CrossRef]
- C. Jr. Nañola et al., “Status report on coral reefs of the Philippines 2004,” in Proceedings 1oth International Coral Reef Symposium, 2006.
- J. A. Anticamara et al., “National Patterns of Philippine Reef Fish Diversity and Its Implications on the Current Municipal-Level Management,” vol. 27, pp. 1–47.
- J. Claudet, “Six conditions under which MPAs might not appear effective (when they are),” ICES Journal of Marine Science, vol. 75, no. 3, pp. 1172–1174, May 2018. [CrossRef]
- K. Grorud-Colvert et al., “The MPA guide: A framework to achieve global goals for the ocean,” Sep. 10, 2021, American Association for the Advancement of Science. [CrossRef]
- M. Belharet et al., “Extending full protection inside existing marine protected areas, or reducing fishing effort outside, can reconcile conservation and fisheries goals,” Journal of Applied Ecology, vol. 57, no. 10, pp. 1948–1957, Oct. 2020. [CrossRef]
- A. Di Franco et al., “Five key attributes can increase marine protected areas performance for small-scale fisheries management,” Sci Rep, vol. 6, 2016. [CrossRef]
- G. R. Russ and A. C. Alcala, “Marine reserves: Long-term protection is required for full recovery of predatory fish populations,” Oecologia, vol. 138, no. 4, 2004. [CrossRef]
- R. B. Cabral et al., “The Philippine MPA Database The Philippine Marine Protected Area (MPA) Database Marine Protected Area Support Network (MSN),” 2014. [Online]. Available: http://www.reefbase.org/global_database/default.aspx?
- R. Hernández-Andreu, F. C. Félix-Hackradt, A. Schiavetti, J. L. S. Texeira, and C. W. Hackradt, “Marine protected areas are a useful tool to protect coral reef fishes but not representative to conserve their functional role,” J Environ Manage, vol. 351, p. 119656, Feb. 2024. [CrossRef]
- H. O. Arceo, B. Cazalet, P. M. Aliño, L. Mangialajo, and P. Francour, “Moving beyond a top-down fisheries management approach in the northwestern Mediterranean: Some lessons from the Philippines,” Mar Policy, vol. 39, no. 1, 2013. [CrossRef]
- B. S. Halpern et al., “Achieving the triple bottom line in the face of inherent trade-offs among social equity, economic return, and conservation,” Proceedings of the National Academy of Sciences, vol. 110, no. 15, pp. 6229–6234, Apr. 2013. [CrossRef]
- S. E. Lester et al., “Biological effects within no-take marine reserves: A global synthesis,” Mar Ecol Prog Ser, vol. 384, 2009. [CrossRef]
- G. R. Russ, “Yet Another Review of Marine Reserves as Reef Fishery Management Tools,” 2002.
- R. V. Salm and J. R. Clark, Marine and Coastal Protected Areas: A Guide for Planners and Managers. 2000. [CrossRef]
- S. R. Schill, G. T. Raber, J. J. Roberts, E. A. Treml, J. Brenner, and P. N. Halpin, “No reef is an island: Integrating coral reef connectivity data into the design of regional-scale marine protected area networks,” PLoS One, vol. 10, no. 12, Dec. 2015. [CrossRef]
- J. M. Savage, M. D. Hudson, and P. E. Osborne, “The challenges of establishing marine protected areas in South East Asia,” in Marine Protected Areas: Science, Policy and Management, Elsevier, 2019, pp. 343–359. [CrossRef]
- G. R. Russ and A. C. Alcala, “Decadal-scale rebuilding of predator biomass in Philippine marine reserves,” Oecologia, vol. 163, no. 4, 2010. [CrossRef]
- S. Stolton, P. Shadie, and N. Dudley, “Edited by Nigel Dudley Including IUCN WCPA Best Practice Guidance on Recognising Protected Areas and Assigning Management Categories and Governance Types Guidelines for Applying Protected Area Management Categories.” [Online]. Available: www.iucn.org/pa_guidelines.
- G. R. Russ and A. C. Alcala, “Marine reserves: Rates and patterns of recovery and decline of predatory fish, 1983-2000,” Ecological Applications, vol. 13, no. 6, 2003. [CrossRef]
- C. J. Brown, B. Parker, G. N. Ahmadia, R. Ardiwijaya, Purwanto, and E. T. Game, “The cost of enforcing a marine protected area to achieve ecological targets for the recovery of fish biomass,” Biol Conserv, vol. 227, pp. 259–265, Nov. 2018. [CrossRef]
- G. R. Russ and A. C. Alcala, “MARINE RESERVES: RATES AND PATTERNS OF RECOVERY AND DECLINE OF PREDATORY FISH, 1983-2000,” 2003.
- B. Stockwell, C. R. L. Jadloc, R. A. Abesamis, A. C. Alcala, and G. R. Russ, “Trophic and benthic responses to no-take marine reserve protection in the Philippines,” Mar Ecol Prog Ser, vol. 389, 2009. [CrossRef]
- G. J. Edgar et al., “Global conservation outcomes depend on marine protected areas with five key features,” Nature, vol. 506, no. 7487, 2014. [CrossRef]
- T. R. McClanahan, J. M. Maina, N. A. J. Graham, and K. R. Jones, “Modeling reef fish biomass, recovery potential, and management priorities in the western Indian Ocean,” PLoS One, vol. 11, no. 5, May 2016. [CrossRef]
- J. Claudet et al., “Marine reserves: size and age do matter,” Ecol Lett, vol. 11, no. 5, pp. 481–489, May 2008. [CrossRef]
- G. R. Russ and A. C. Alcala, “Management histories of Sumilon and Apo Marine Reserves, Philippines, and their influence on national marine resource policy,” Coral Reefs, vol. 18, no. 4, 1999. [CrossRef]
- T. Agardy, G. N. di Sciara, and P. Christie, “Mind the gap: Addressing the shortcomings of marine protected areas through large scale marine spatial planning,” Mar Policy, vol. 35, no. 2, pp. 226–232, Mar. 2011. [CrossRef]
- N. L. Gutiérrez, R. Hilborn, and O. Defeo, “Leadership, social capital and incentives promote successful fisheries,” Nature, vol. 470, no. 7334, 2011. [CrossRef]
- J. Pretty, “Social Capital and the Collective Management of Resources,” 2003. [CrossRef]
- R. Cabral et al., “Crisis sentinel indicators: Averting a potential meltdown in the Coral Triangle,” Mar Policy, vol. 39, no. 1, 2013. [CrossRef]
- S. English, C. Wilkinson, and V. Baker, “Survey Manual for Tropical Marine Resources, 2nd ed. ASEAN-Australia Marine Science Project: Living Coastal Resources,” 1997.
- F. M. Panga, J. A. Anticamara, M. C. C. Quibilan, M. P. Atrigenio, and P. M. Aliño, “Through the Boundaries: Environmental Factors Affecting Reef Benthic Cover in Marine Protected Areas in the Philippines,” Front Mar Sci, vol. 8, 2021. [CrossRef]
- A. C. Alcala, “Community-based coastal resource management in the Philippines: A case study,” Ocean Coast Manag, vol. 38, no. 2, 1998. [CrossRef]
- P. L. Irwin, L.-H. T. Nguyen, G. C. Paoli, and C.-Y. Chen, “Evidence for a bimodal distribution of Escherichia coli doubling times below a threshold initial cell concentration,” 2010. [Online]. Available: http://www.biomedcentral.com/1471-2180/10/207.
- R. M. May, “Simple mathematical models with very complicated dynamics,” Nature, vol. 261, no. 5560, pp. 459–467, Jun. 1976. [CrossRef]
- R. A. Abesamis and G. R. Russ, “DENSITY-DEPENDENT SPILLOVER FROM A MARINE RESERVE: LONG-TERM EVIDENCE,” 2005.
- I. R. Caldwell et al., “Protection efforts have resulted in 10% of existing fish biomass on coral reefs,” Proc Natl Acad Sci U S A, vol. 121, no. 42, Oct. 2024. [CrossRef]
- B. S. Halpern et al., “A Global Map of Human Impact on Marine Ecosystems,” Science (1979), vol. 319, no. 5865, pp. 948–952, Feb. 2008. [CrossRef]
- B. Worm et al., “Impacts of Biodiversity Loss on Ocean Ecosystem Services,” Science (1979), vol. 314, no. 5800, pp. 787–790, Nov. 2006. [CrossRef]
- C. Villanoy et al., “Coral reef ecosystems protect shore from high-energy waves under climate change scenarios,” Clim Change, vol. 112, no. 2, 2012. [CrossRef]
- F. Micheli, B. S. Halpern, L. W. Botsford, and R. R. Warner, “Trajectories and correlates of community change in no-take marine reserves,” Ecological Applications, vol. 14, no. 6, 2004. [CrossRef]
- G. R. Russ, B. Stockwell, and A. C. Alcala, “Inferring versus measuring rates of recovery in no-take marine reserves,” Mar Ecol Prog Ser, vol. 292, 2005. [CrossRef]
- D. Varkey, C. H. Ainsworth, and T. J. Pitcher, “Modelling Reef Fish Population Responses to Fisheries Restrictions in Marine Protected Areas in the Coral Triangle,” J Mar Biol, vol. 2012, pp. 1–18, 2012. [CrossRef]
- L. N. Espectato, R. P. Napata, and C. C. Baylon, “Will small MPAs work?: The case of small-sized MPAs in Southern Iloilo, Philippines,” Ocean Coast Manag, vol. 139, pp. 24–32, Apr. 2017. [CrossRef]
- R. N. Muallil, M. R. Deocadez, R. J. S. Martinez, F. M. Panga, M. P. Atrigenio, and P. M. Aliño, “Negative trophic relationship between parrotfish biomass and algal cover on Philippine coral reefs,” Reg Stud Mar Sci, vol. 39, Sep. 2020. [CrossRef]
- A. P. Maypa et al., “Marine Protected Area Management Effectiveness: Progress and Lessons in the Philippines,” Coastal Management, vol. 40, no. 5, pp. 510–524, Sep. 2012. [CrossRef]
- A. L. Green et al., “Designing Marine Reserves for Fisheries Management, Biodiversity Conservation, and Climate Change Adaptation,” Coastal Management, vol. 42, no. 2, 2014. [CrossRef]
- A. L. Green et al., “Designing Marine Reserves for Fisheries Management, Biodiversity Conservation, and Climate Change Adaptation,” Coastal Management, vol. 42, no. 2, 2014. [CrossRef]
- M. B. Mascia and D. Ph, “Designing Effective Coral Reef Marine Protected Areas A Synthesis Report Based on Presentations at the 9 th International Coral Reef Symposium Bali , Indonesia October 2000,” 2001.
- C. M. Roberts and J. E. Hawkins, “How small can a marine reserve be and still be effective?,” 1997. [CrossRef]
- B. S. Halpern, “The impact of marine reserves: Do reserves work and does reserve size matter?,” Ecological Applications, vol. 13, no. 1 SUPPL., 2003. [CrossRef]
- D. T. I. Bayley, A. Purvis, A. C. Nellas, M. Arias, and H. J. Koldewey, “Measuring the long-term success of small-scale marine protected areas in a Philippine reef fishery,” Coral Reefs, vol. 39, no. 6, 2020. [CrossRef]
- D. Russi, “The Torre Guaceto marine protected area - what can we learn from this success story?,” in Marine Protected Areas: Science, Policy and Management, Elsevier, 2019, pp. 329–342. [CrossRef]
- J. Lubchenco and K. Grorud-Colvert, “Making waves: The science and politics of ocean protection,” 2015. [CrossRef]
- B. Worm et al., “Rebuilding Global Fisheries,” Science (1979), vol. 325, no. 5940, 2009. [CrossRef]
- A. B. Anderson, J. C. Joyeux, and S. R. Floeter, “Spatiotemporal variations in density and biomass of rocky reef fish in a biogeographic climatic transition zone: trends over 9 years, inside and outside the only nearshore no-take marine-protected area on the southern Brazilian coast,” J Fish Biol, vol. 97, no. 3, pp. 845–859, Sep. 2020. [CrossRef]
- R. B. Cabral et al., “Siting marine protected areas based on habitat quality and extent provides the greatest benefit to spatially structured metapopulations,” Ecosphere, vol. 7, no. 11, 2016. [CrossRef]
- V. V Hilomeni, C. L. Naiiola, and A. L. Dantis3, “Status of Philippine reef fish communities.”.
- R. A. Turner, C. Fitzsimmons, J. Forster, R. Mahon, A. Peterson, and S. M. Stead, “Measuring good governance for complex ecosystems: Perceptions of coral reef-dependent communities in the Caribbean,” Global Environmental Change, vol. 29, 2014. [CrossRef]
- P. J. S. Jones, Governing marine protected areas: Resilience through diversity. 2014. IUCN WCPA, 2018. Applying IUCN’s Global Conservation Standards to Marine Protected Areas (MPA). Delivering effective conservation action through MPAs, to secure ocean health & sustainable development. Version 1.0. Gland, Switzerland. 4pp. MPA Support Network (MSN), 2010. Marine Protected Area Management Effectiveness Assessment Tool (MPA MEAT). Coral Triangle Support Partnership of USAID, Department of Environment and Natural Resources, and the MPA Support Network, Philippines, Quezon City, 15p. https://www.coraltriangleinitiative.org/library/toolkit-marine-protected-area-management-effectiveness-assessment-tool-february-2011. Accessed on 27 March 2025. Pearl, R. (1925) The Biology of Population Growth. Alfred A. Knopf. New York. 354 pp. 2.2.03-_Population_Growth_and_Regulation. (2003). [CrossRef]
Figure 1.
Map of the Luzon and Visayas study sites. Map lines delineate study areas and do not necessarily correspond with national boundaries.
Figure 1.
Map of the Luzon and Visayas study sites. Map lines delineate study areas and do not necessarily correspond with national boundaries.
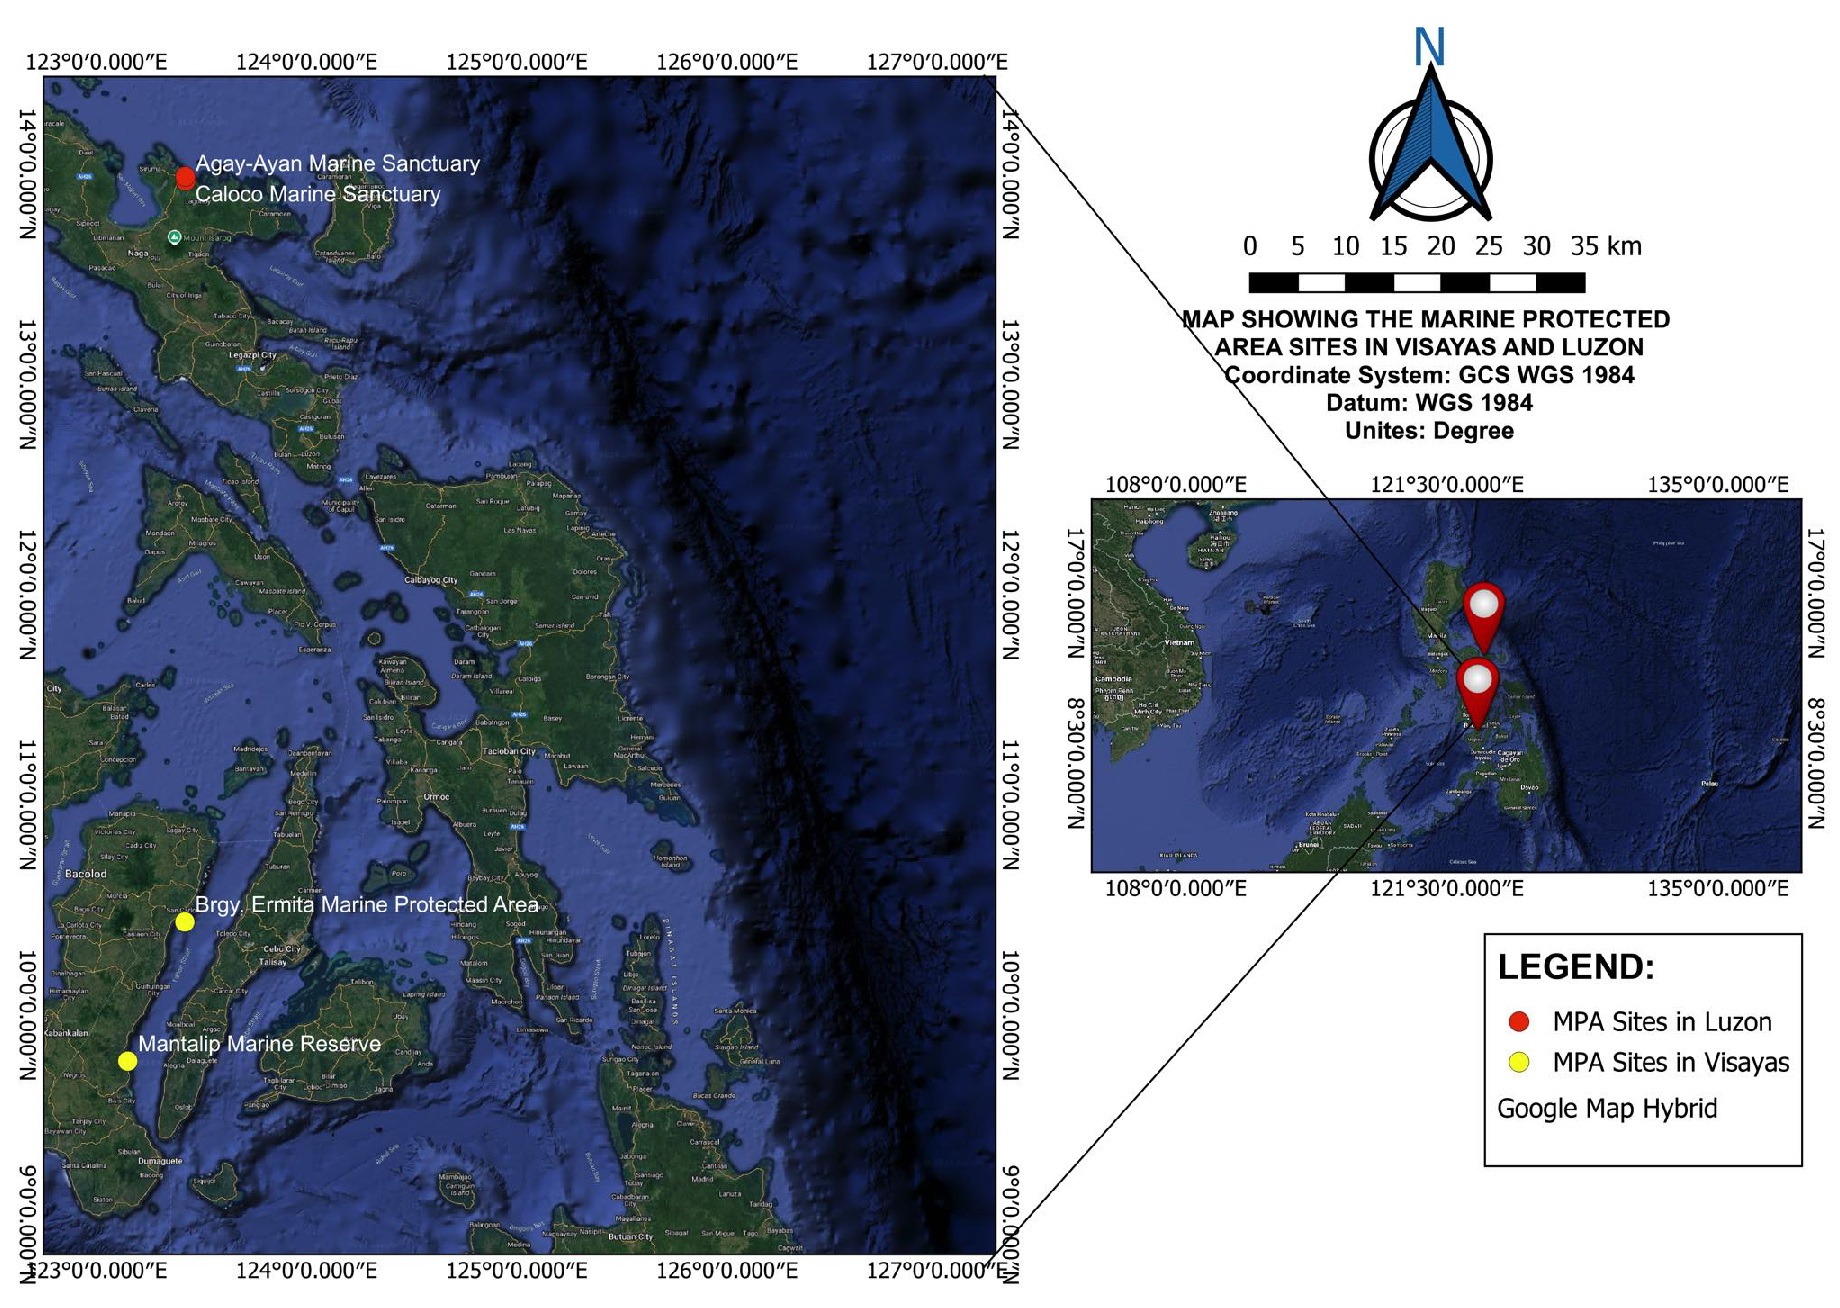
Figure 15.
Superimposed graph showing the annual biomass doubling time for each MPA using the exponential growth model.
Figure 15.
Superimposed graph showing the annual biomass doubling time for each MPA using the exponential growth model.
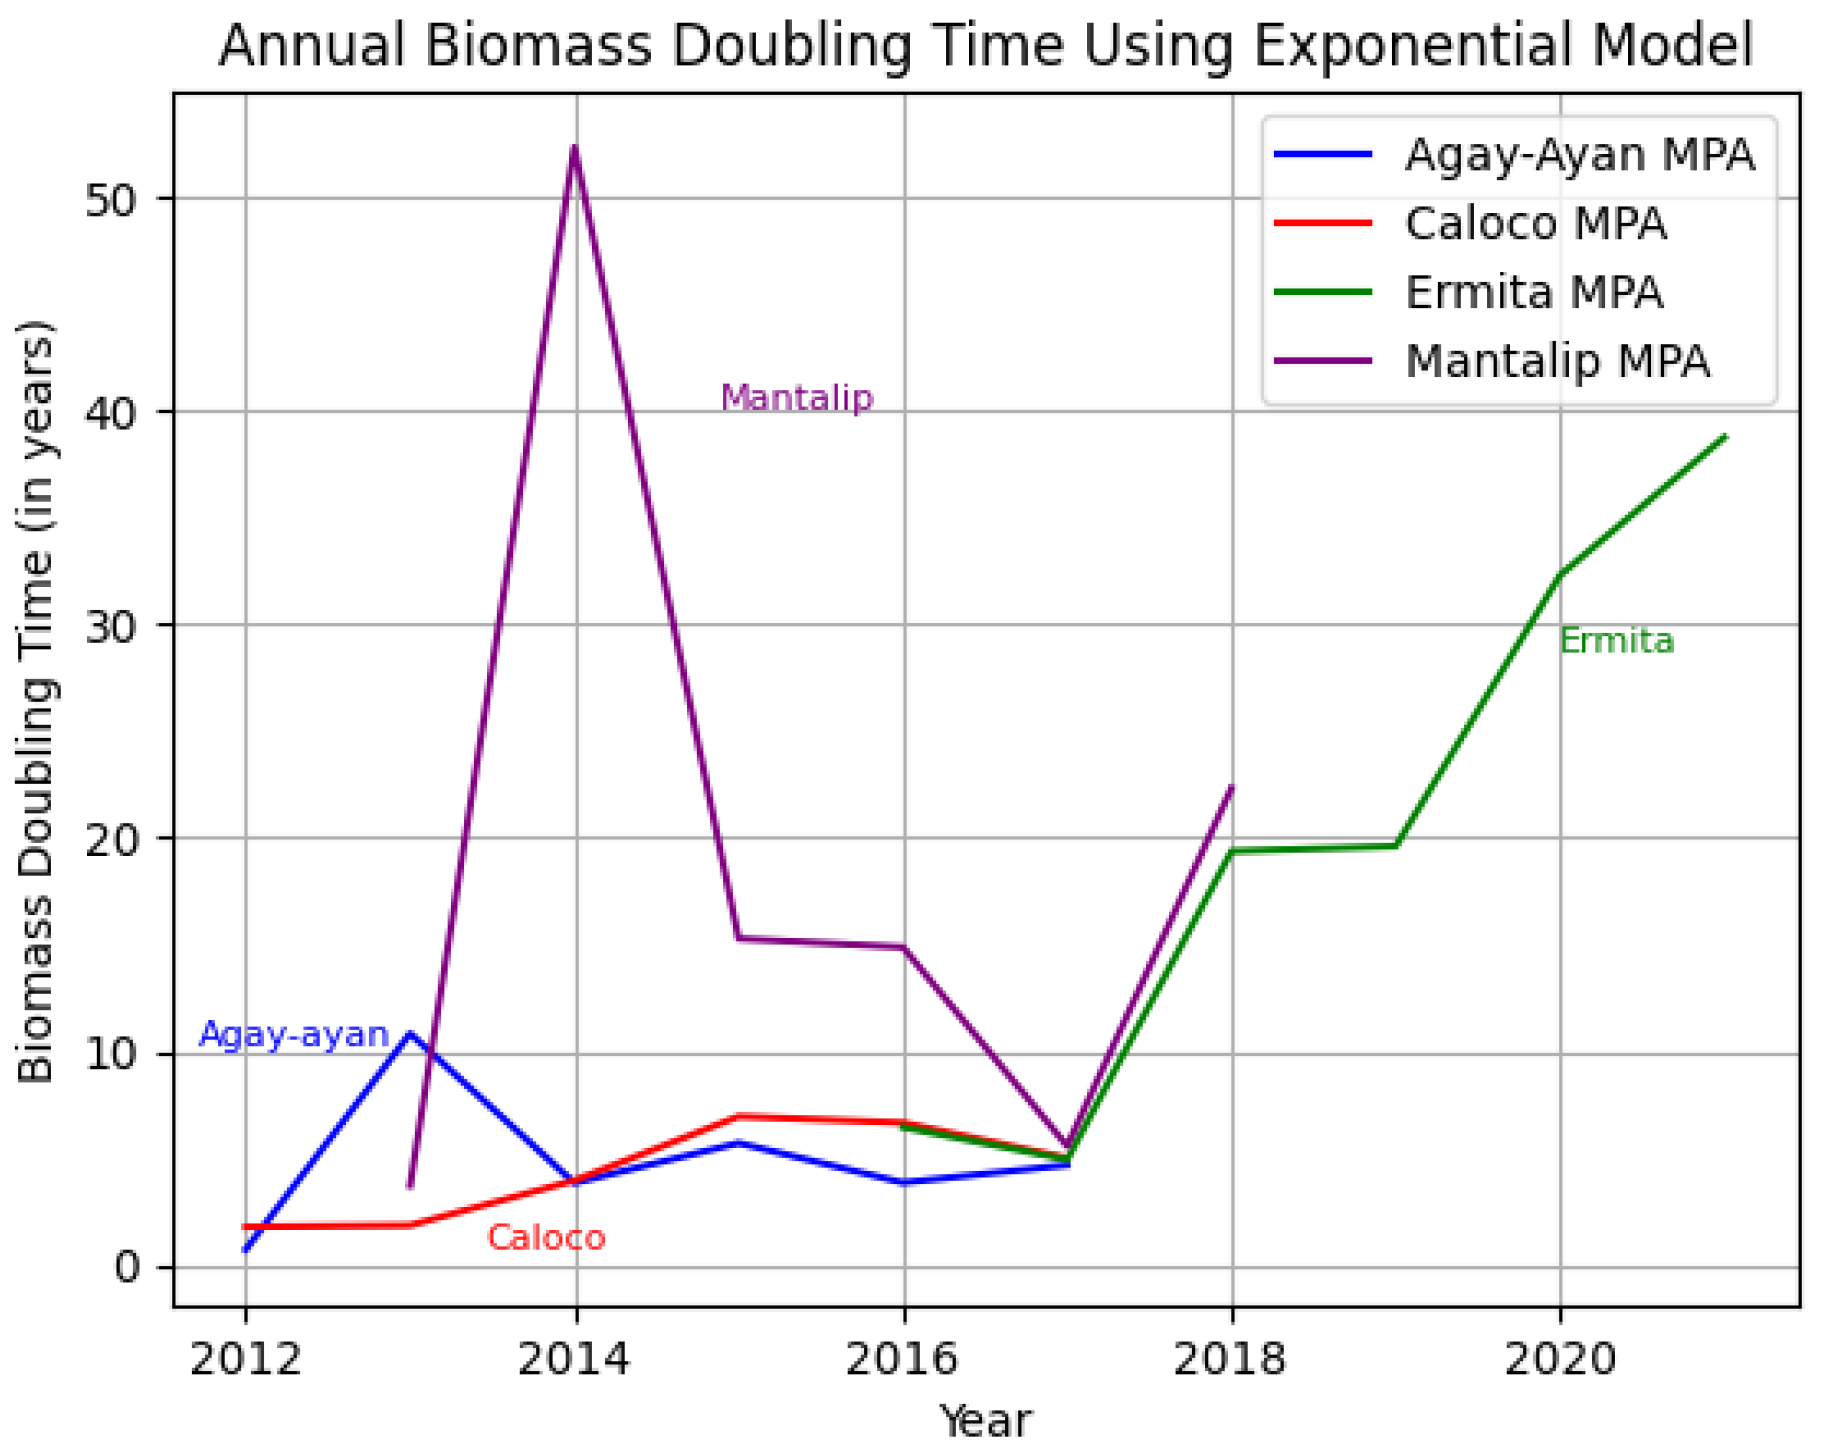
Figure 16.
Superimposed graph showing the annual biomass doubling time for each MPA using the logistic growth model.
Figure 16.
Superimposed graph showing the annual biomass doubling time for each MPA using the logistic growth model.
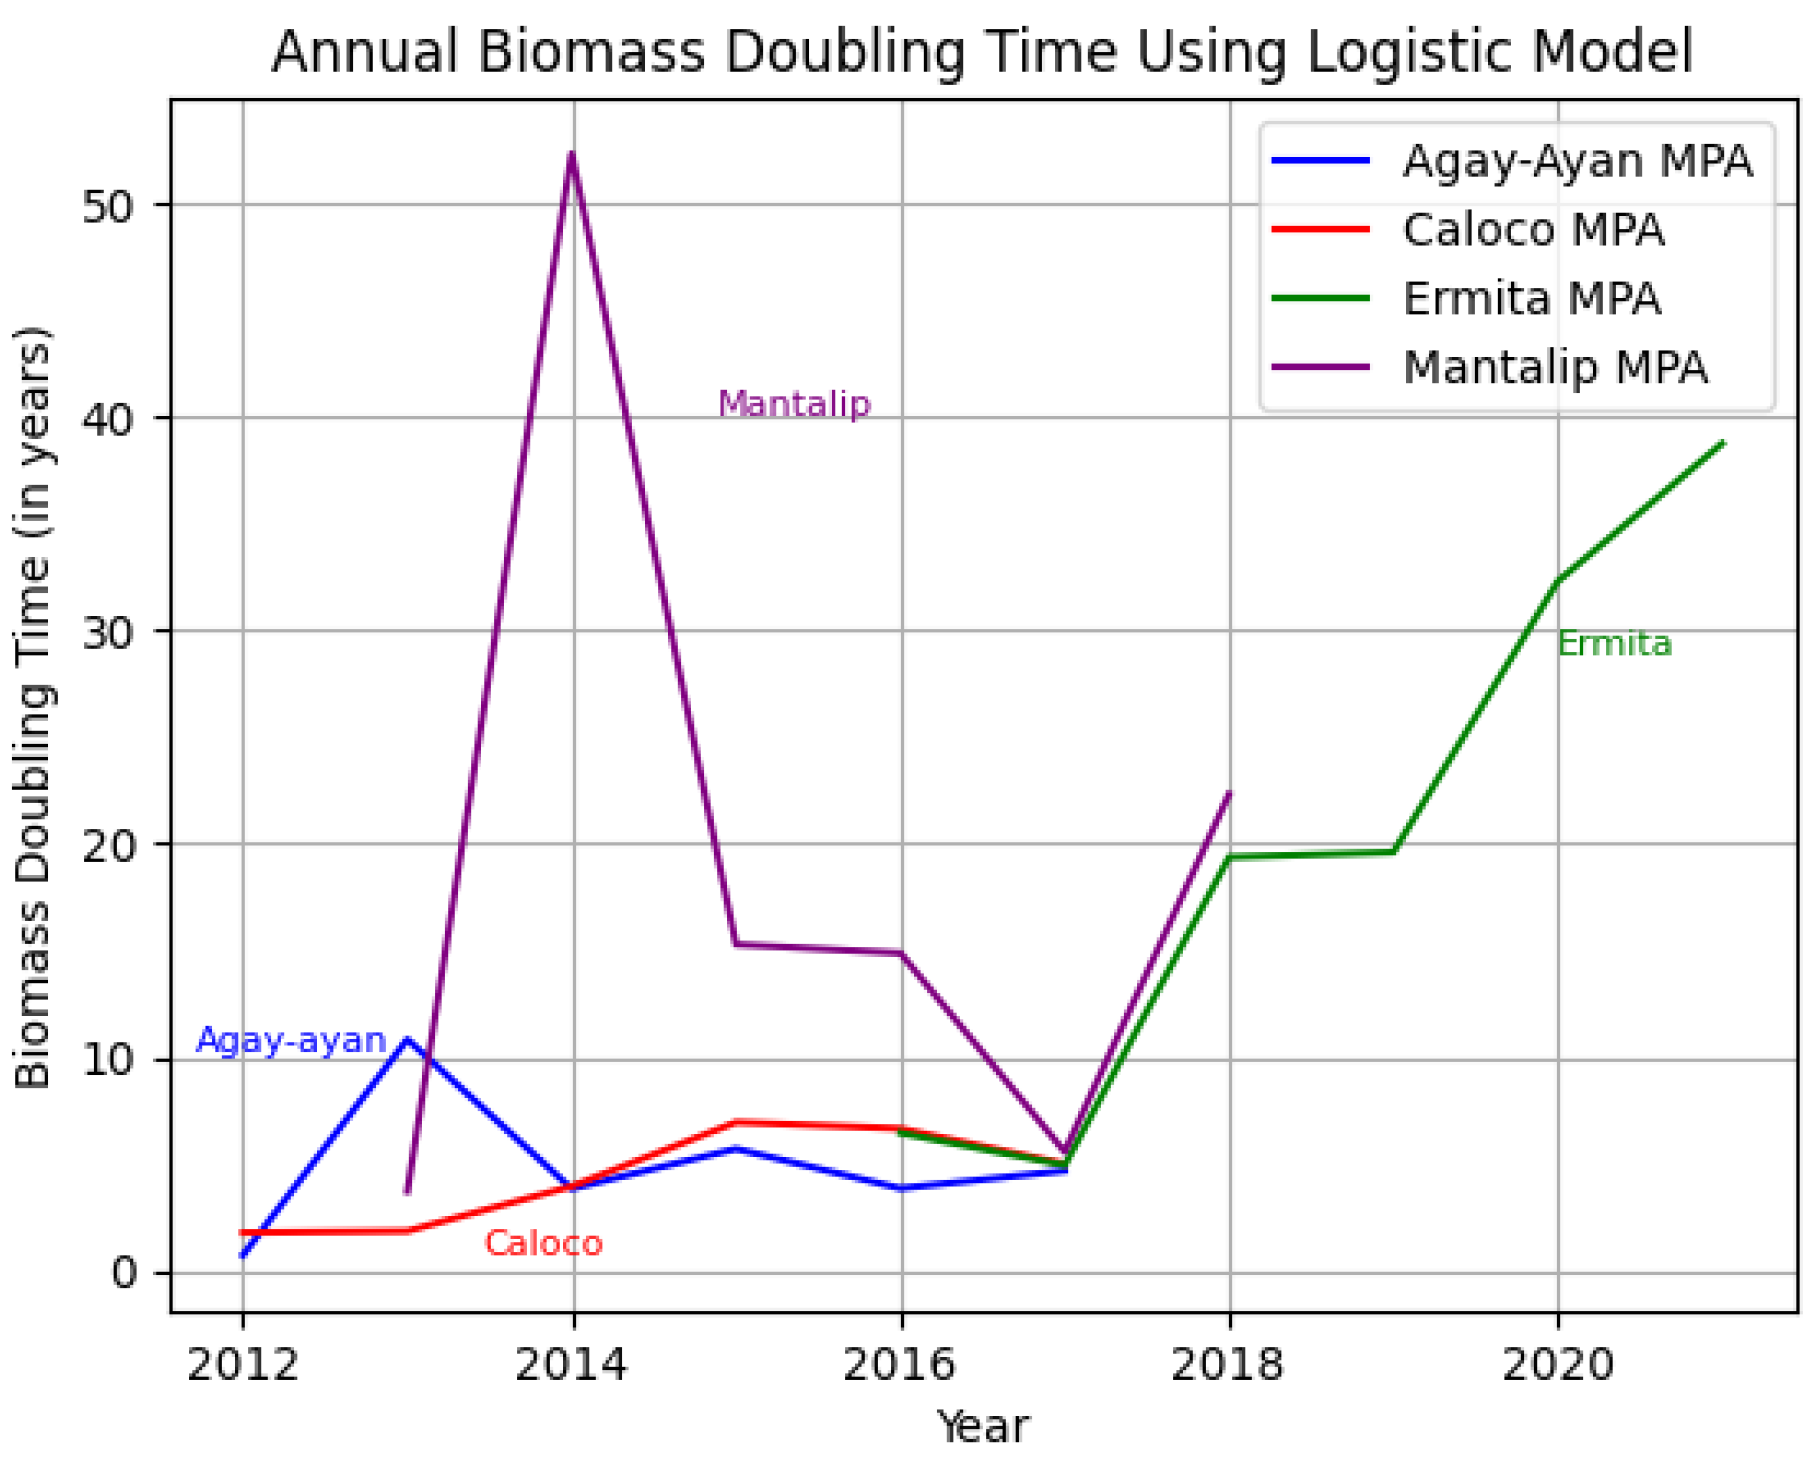
Figure 17.
Comparison of average biomass times for both growth models and using linear regression.
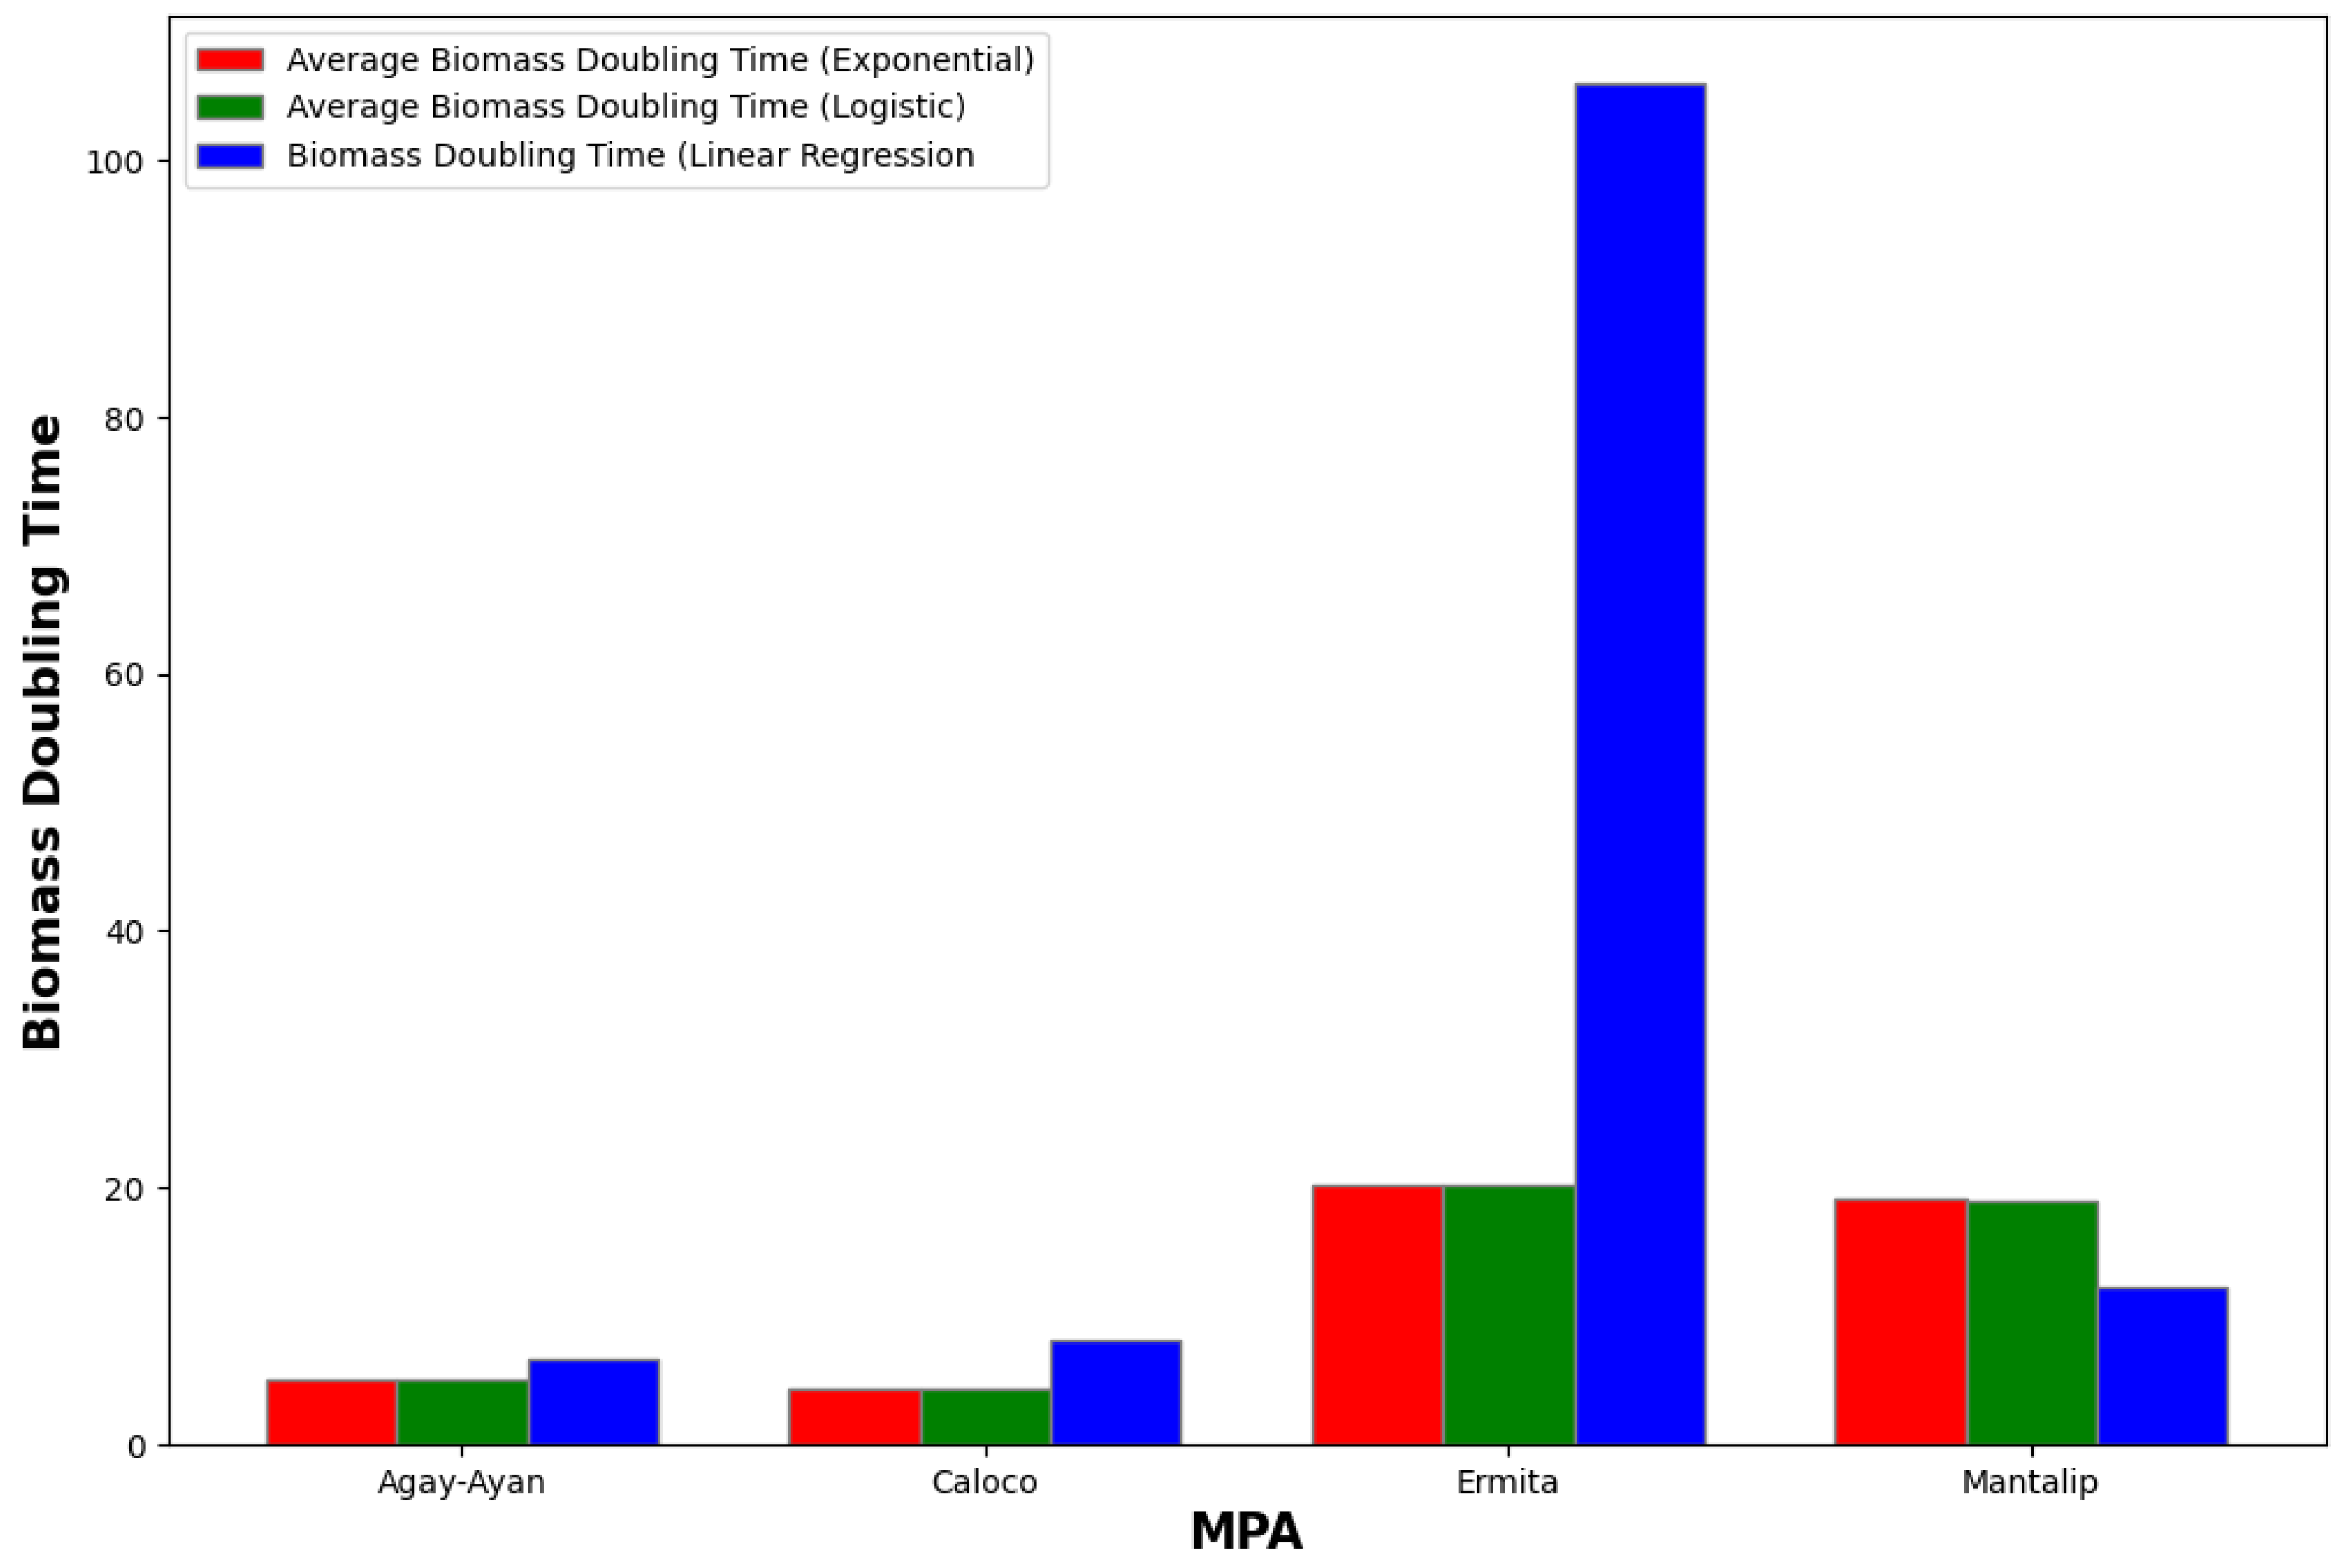
Table 1.
Selected Philippine MPAs, size of the core area (in hectares), years under strict protection, and governance score.
Table 1.
Selected Philippine MPAs, size of the core area (in hectares), years under strict protection, and governance score.
| MPAs | MPA Size Core Area (Ha) |
Years under strict protection |
Governance score (%) |
|---|---|---|---|
| Luzon: | |||
| 1. Agay-Ayan Marine Sanctuaries, Tinambac, Camarines Sur |
25 | 14 | 100 |
| 2. Caloco Marine Sanctuaries, Tinambac, Camarines Sur |
25 | 11 | 100 |
| Visayas: | |||
| 3. Brgy. Ermita MPA, San Carlos City, Negros Occidental |
96 | 10 | 100 |
| 4. Mantalip Marine Reserve Bindoy, Negros Occidental |
46 | 3 | 100 |
Table 2.
The starting points of biomass from selected MPAs in Luzon.
| Year | Agay-Ayan MPA | Caloco MPA | Ermita MPA | Mantalip MPA |
|---|---|---|---|---|
| 2011 | 20152 | 27347 | ||
| 2012 | 51602 | 40280 | 33853 | |
| 2013 | 22901 | 57554 | 40788 | |
| 2014 | 34601 | 46222.125 | 34762 | |
| 2015 | 32740 | 40732 | 61578 | 38788 |
| 2016 | 49435 | 45991 | 68556.5 | 40788 |
| 2017 | 48927 | 62708 | 81511 | 63035 |
| 2018 | 34601 | 46222.125 | 68556.5 | 40788 |
| 2019 | 14334 | 24738 | 70934 | 44565 |
| 2020 | 34601 | 46222.125 | 68556.5 | 40788 |
| 2021 | 34601 | 46222.125 | 68556.5 | 40788 |
| 2022 | 36717 | 70427 | 60203 | 29725 |
Table 12.
Average biomass doubling time (in years) for each MPA during the first seven years under strict protection.
Table 12.
Average biomass doubling time (in years) for each MPA during the first seven years under strict protection.
| MPA | Average Biomass Doubling Time (using Exponential Growth Model) |
Average Biomass Doubling Time (using Logistic Growth Model) |
|---|---|---|
| Agay-Ayan | 4.9481 | 4.9444 |
| Caloco | 4.3754 | 4.3700 |
| Ermita | 20.2326 | 20.2188 |
| Mantalip | 19.0146 | 19.0030 |
Table 13.
Biomass doubling time using linear regression and average doubling time using the exponential growth model.
Table 13.
Biomass doubling time using linear regression and average doubling time using the exponential growth model.
| MPA | Biomass Doubling Time (using linear regression) |
Average Biomass Doubling Time (Exponential) |
Error (Exponential) |
|---|---|---|---|
| Agay-Ayan | 6.6179 | 4.9481 | 1.6697 |
| Caloco | 8.0561 | 4.3754 | 3.6807 |
| Ermita | 106.0006 | 20.2326 | 85.7680 |
| Mantalip | 12.2098 | 19.0146 | 6.8047 |
Table 14.
Biomass doubling time using linear regression and average doubling time using the logistic growth model.
Table 14.
Biomass doubling time using linear regression and average doubling time using the logistic growth model.
| MPA | Biomass Doubling Time (using linear regression) |
Average Biomass Doubling Time (Logistic) |
Error (Logistic) |
|---|---|---|---|
| Agay-Ayan | 6.6179 | 4.9444 | 1.6735 |
| Caloco | 8.0561 | 4.3700 | 3.6865 |
| Ermita | 106.0006 | 20.2188 | 85.7818 |
| Mantalip | 12.2098 | 19.0030 | 6.7932 |
Disclaimer/Publisher’s Note: The statements, opinions and data contained in all publications are solely those of the individual author(s) and contributor(s) and not of MDPI and/or the editor(s). MDPI and/or the editor(s) disclaim responsibility for any injury to people or property resulting from any ideas, methods, instructions or products referred to in the content. |
© 2025 by the authors. Licensee MDPI, Basel, Switzerland. This article is an open access article distributed under the terms and conditions of the Creative Commons Attribution (CC BY) license (http://creativecommons.org/licenses/by/4.0/).
Copyright: This open access article is published under a Creative Commons CC BY 4.0 license, which permit the free download, distribution, and reuse, provided that the author and preprint are cited in any reuse.


