
Submitted:
19 March 2025
Posted:
20 March 2025
You are already at the latest version
Abstract
To ensure sustainability, the Ecosystem Approach to Fisheries (EAF) requires the evaluation of the impacts of fisheries beyond the main targeted species, to include those on bycaught, endangered threatened and protected populations and keystone species. However, traditional stock assessments require extensive datasets that are often unavailable for data-limited fisheries, particularly in small-scale settings or the Global South. This study evaluates the robustness of length-based approaches for fish stock assessment by comparing simple indicators and quantitative methods using an age-structured Operating Model. Simulations were conducted for a range of scenarios, for a range of life-history types and recruitment and natural mortality dynamics. Results reveal that while length-based approaches can effectively track trends in fishing mortality, performance varies significantly depending on species-specific life histories and assumptions about key parameters. Simple indicators often matched or outperformed complex methods, particularly when assumptions about equilibrium conditions or natural mortality were violated. The study highlights the limitations of length-based methods for classifying stock status relative to reference points, but demonstrates their utility when used with historical reference periods or as part of empirical harvest control rules. The findings provide practical guidance for applying length-based approaches in data-limited fisheries management, ensuring sustainability in data and capacity situations.
Keywords:
Classification Skill
; Data-Limited Fisheries
; Fish Stock Assessment
; Harvest Control Rules (HCR)
; Length-Based Methods
; Length-Based Indicators
; Life-History Traits
; Natural Mortality
; Operating Model
1. Introduction
The prevention of overfishing and the recovery of overfished stocks is crucial to ensure sustainability requires assessments of fishery impacts not only on the primary commercially exploited stocks for which analytical stock assessments are provided but also secondary stocks which are retained for market. To maintain the balance of marine ecosystems, and mitigate negative impacts on non-target species the Ecosystem Approach to Fisheries (EAF) requires an assessment of impacts on the broader ecosystem, including by caught and discarded species, endangered, threatened, or protected populations, and keystone or hub species [1,2]. However, traditional stock assessments require extensive datasets that are often unavailable for small-scale fisheries, fisheries in the Global South, or for discarded species [3]. These limitations have driven significant efforts over the past two decades to develop data-limited approaches, such as biomass-based catch-only methods [4].Catch-only methods were originaly developed to provide an global assessment of stock status [5,6]. The provision of fisheries management advice also requires the assessment of stock status relative to reference points, the prediction of the response of a stock to management, checking that predictions are consistent with reality and updating advice based on feedback about the state of the stock [7,8,9]. Catch-only methods have been shown to exhibit notable biases, which limit their utility in fisheries management [10].
Effective fisheries management also requires more than biomass-based assessments. Setting size limits and monitoring the size structure of fish stocks are critical to preventing growth and recruitment overfishing [11,12]. Growth overfishing occurs when juveniles are harvested before reaching their optimal size, reducing yield. Recruitment overfishing occurs when insufficient mature individuals remain to reproduce and replenish the population. Length-based methods and indicators offer a potential solution to these challenges [13]. They can be used to assess historical and current exploitation levels using short time series of data and provide advice as part of harvest control rules (HCRs) [14].
Model-based estimates are attractive because they provide estimates of unobservable state variables such as stock biomass and fishing mortality, along with analytical reference points by incorporating assumptions about stock productivity. However, empirical indicators—such as mean size or relative abundance—are easier for managers and stakeholders to understand. Also model-based estimators do not necessarily ensure more robust management, since they require assumptions that if incorrectly specified introduce bias.
The aims of this study are to facilitate comparisons and integration of results from different assessment approaches, identify the impact of uncertainties in stock assessments and management advice, promote transparency in the scientific advice process, and ensure that management decisions are based on the best available science.
2. Materials and Methods
To monitor trends in fishing and the health of populations [15] requires the establishment of reference levels. These can be targets, limits, thresholds, or baselines[16]. Targets are to be achieved on average and limits to be avoided with high probability, while thresholds trigger management action. Targets, limits and thresholds are normally based on model-based quantities. Baselines, model estimates or empirical quantities, based on historical periods where a stock was considered healthy can also be used to monitor rebuilding or long-term plans [17,18].
Size data are potentially available from many fisheries and can provide long-term trends and snapshots. If time series are unavailable, data from a single year, e.g. recovered from archives or from one-off sampling programmes, can be used to assess fisheries. Length data can also be used to develop community indicators and priors for stock assessment methods.
Various length-based approaches have been developed [13,19] from simple length-based indicators to sophisticated models that incorporate Bayesian Markov chain Monte Carlo, mixed effects and maximum likelihood techniques [20,21]. The more complex methods are capable of integrating biological and fisheries information and estimating fishing mortality and reference points. However, the basic assumptions are the same, that the size distributions, i.e. the proportion of older and larger fish, is determined by the rate at which individuals grow and the level of mortality that determines how fast they disappear from the population [22]. This requires knowledge of species and stock specific life histories.
2.1. Verification, Validation and Calibration
In data and capacity-limited situations, with limited knowledge about key processes such as natural mortality, recruitment, and fishery exploitation patterns, reliance is often placed on generic solutions.
Therefore verification is essential to ensure that methods are implemented correctly and produce outputs consistent with their intended purpose. Validation is critical to ensure that scientific advice is robust and credible [23]. Validation requires evaluating whether it is plausible that a system equivalent to the model could have generated the observed data [24]. This is essential since methodological differences can introduce bias, particularly if fixed parameters or priors are uncertain or misspecified. Calibration is necessary therefore to align model estimates or empirical indicator with observed data, to correctly classify fish stocks as being overfished or subject to overfishing.
Validation techniques, such as cross-validation—which involve partitioning data into testing and training subsets is problematic in data-limited situations with few observations. Therefore, we conduct simulation using an Operating Model to represent the ’true’ system. The Operating Model is conditioned on species with a range of life histories, and then used to generate pseudo-data to test candidate length-based approaches.
The primary research questions are: i) How do simple indicators compare to complex methods in tracking exploitation trends? ii) Which assumptions have the greatest impact on method performance? iii) How reliable are proxy reference points compared to historical reference periods? iv) What are the implications for implementing length-based methods in data-limited fisheries?
2.2. Operating Model
To evaluate robustness, a range of hypothetical but plausible Operating Model scenarios were conditioned which are likely to have major impacts on the performance of the methods [25].
To provide a theoretical basis for developing hypotheses about population dynamics, an age-structured Operating Model was implemented using life history theory conditioned on scenarios related to hypotheses about resource dynamics. The Observation Error Model then generates pseudo-data, allowing a sensitivity analysis to identify the robustness of the different approaches to methods assumptions and resource dynamics.
The Operating Models are summarised in Figure 2, showing fishing mortality, recruitment, spawning stock biomass, and yield relative to MSY reference points.
2.2.1. Life Histories
Case study species were chosen to allow comparison across a range of contrasting life histories, chosen because they are familiar to the authors and are not intended to represent specific stocks. Species were sprat (Prattus sprattus sprattus), turbot (Posetta maxima), pollack (Pollachius pollachius), bigeye tuna (Thunnus obesus), and thornback ray (Raja clavata)
Life history parameters were extracted from FishBase (www.fishbase.org), and Figure 1 summarises , k, and b; species ordered by k; the bottom right panel shows the number of observations. There are clear relationships, both between and within species, as is inversely correlated with k and . Sprat has a large variation in condition, i.e. b the relationship between length and weight. There are only a few observations for pollack, which implies high uncertainty since data in FishBase are often based on small sample sizes, have limited coverage, and life history parameters (e.g. maturity and growth) may come from different studies.
Natural mortality at age was modelled as a function of length [26]. Spawning stock biomass (SSB) was used as a proxy for the reproductive potential of the stock [27], assuming that fertilisation is proportional to the weight of the sexually mature portion of the population irrespective of the demographic composition of adults [28] and that processes such as sexual maturity are simple functions of age and independent of sex [29].
2.2.2. Fishery Dynamics
Selectivity was modelled as a double normal, which allows both asymptotic and dome-shaped selectivity to be simulated. The logistic selectivity in the Base Case was based on the maturity ogive so that MSY reference points are comparable across case studies.
The intensity of fishing is initially low before increasing to twice , management then reduces fishing to 70% of ; ribbons indicate the 95th percentile range along with the median and example Monte Carlo realisations.
2.2.3. Scenarios
The base case and the scenarios representing the main sources of uncertainty developed are shown in Table 2. The scenarios include the steepness of the stock-recruitment relationship, recruitment variability, natural mortality, selection pattern, and the level of sampling error. The parameters from the Base Case were used for the assumptions of the length-based approaches in all scenarios. This is because if the "known values" from the Operating Model were used by the length-based approaches in each scenario, then their robustness would not have been tested.
2.2.4. Observation Error Model
Data are generated using the Observation Error Model and Monte Carlo simulation to allow for evaluation of issues related to biased and the level of sampling. To simulate size data an inverse age-length key was applied to the catch-at-age of the Operating Model, and variation in length at age included by applying a normal distribution to the expected length at age with a CV of 10%. The sampling was proportional to the frequency of an age class for a given sample size.
A single realisation of the base case is shown in Figure 3 by species. The length frequencies are pooled by lustrum (5 years); the black vertical line is and the blue vertical line . The lowest value of is in year 100, when exploitation by the fishing was highest, . There are differences in the length frequency distributions before overfishing and after recovery; in the former (year 60) the right-hand limbs contain larger individuals than in the latter (year 120), demonstrating the importance of considering demography.
2.3. Length-Based Approaches
Length-based data is often more readily available than age or biomass data in data and capacity-limited situations, and can provide valuable insights into stock status and inform management decisions. They can assess growth and recruitment overfishing, where the size distribution of fish in a population reveals whether juvenile or mature individuals are being disproportionately harvested. Length-based methods range from simple empirical indicators, such as mean length, to more complex models that incorporate biological and fisheries information to estimate fishing mortality and reference points.
2.3.1. Indicators
The length-based indicator considered was , the mean length of the individuals greater than the length at 50% of the modal abundance (). The key parameters are the length at which the fish are first vulnerable to capture by the fishing gear, and . The population is assumed to be in equilibrium, which means that the recruitment, growth, and mortality rates are constant over time. can be used to evaluate exploitation relative to a proxy for , such as the length at which fishing mortality is equal to natural mortality ().
2.3.2. Beverton and Holt Estimator
The Beverton and Holt Z estimator estimates the total instantaneous mortality rate (Z) based on the relationship between the length of fish that have been recruited to the fishery and mortality and assumes that growth follows the von Bertalanffy growth function.
where Z is the total instantaneous mortality rate, is the mean length of the fish in the catch above the length at which the fish are fully recruited into the fishing. Again it is assumed that the population is in equilibrium, selection to the fishery is knife-edged, and mortality is constant for all fully recruited fish.
2.3.3. Length-Converted Catch Curve (LCC)
The instantaneous total mortality (Z) for each species was estimated using length-converted catch curve analysis (LCC, [30]). This compensates for the fact that fish growth slows as individuals get older, resulting in larger size classes containing more age classes than smaller size classes, known as the ’stack-up’ effect, so that larger size classes contain a wider range of ages than a smaller size class.
2.3.4. Length-Based SPR (LBSPR)
LBSPR is an equilibrium-based method which assumes asymptotic selectivity, von Bertalanffy growth, length-at-age is normally distributed, natural mortality is constant across adult age classes, recruitment is constant over time, and growth rates remain constant across the cohorts. LBSPR maximises the likelihood by estimating the selectivity parameters and [21]. LBSPR actually estimates fishing mortality (F) as M is fixed. SPR is the spawning potential ratio, the proportion of unfished reproductive potential per recruit for a given F of the length composition of the catch and biological information.
Selectivity is assumed to be logistic, defined by and the sizes at which 50% and 95% of a population are retained by the fishing gear. The maturity ogive is specified by and . Therefore, the inputs are the selectivity, maturity ogive and life history ratios and ; where k is the von Bertalanffy growth coefficient, is the asymptotic size and is the size at maturity [31].
2.3.5. Length-Based Integrated Mixed Effects (LIME)
LIME, like LBSPR, also provides estimates of F and SPR from length data and biological information, but does not assume equilibrium conditions. LIME estimates changes in recruitment and fishing mortality over time, using automatic differentiation and Laplace approximations to calculate the marginal likelihood of mixed effects [20]. LIME estimates a single selectivity curve for the entire time series, while LBSPR estimates a selectivity curve for each year, since each time-step in LBSPR is independent of each other.
Other assumptions are the same as for LBSPR and the inputs to LIME are , steepness (h) and the parameters of the length-weight relationship (a and b). In the simulations, we estimate F and for 3-year blocks, to reduce the computation time.
2.3.6. Proxy Reference Points
In data-limited cases, natural mortality (M) is commonly used as a proxy for , the fishing mortality that will achieve the maximum sustainable yield [32]. Alternatively the length at which a cohort achieves its maximum biomass, approximated by , can be used as a proxy for [33]. An advantage of using length is that it is an observable quantity, while M is difficult to estimate even in data-rich assessments [34].
2.3.7. Baselines
An alternative to proxy reference points based on assumptions about M is to use a historical reference period. Therefore, the classification skill was evaluated for a reference period, corresponding to the years when fishing mortality was at . Species were at on two occasions, when F was increasing or decreasing.
2.4. Sensitivity Analysis
To evaluate robustness, the Operating Model was conditioned on a range of hypotheses that are likely to have significant impacts on the performance of the length-based approaches [25]. Therefore a base case was defined and then scenarios representing the main sources of uncertainty developed.
Length-based approaches may be biased and have poor precision due to uncertainty about life history parameters, lags between exploitation levels, changes in fishery selection patterns, variability in year-class strength, and biased sampling. Therefore, an Observation Error Model was used to generate pseudo-data then to derive length-based indicators, which were compared to known values from the Operating Model.
The analysis was conducted using R statistical software using FLR [35].
2.5. Performance Evaluation
The indicators and estimates of the exploitation of the length-based methods were validated by comparison with Operating Model values using receiver operating characteristics (ROCs). The ability to correctly classify a resource is based on comparing a length-based estimates or indicators with the Operating Model, using the proportion of true positives (TP), false positives (FP), true negatives (TN), and false negatives (FN). The sensitivity () and specificity () measure the ability to identify positive and negative cases respectively. The ROC curve plots the TPR against the false positive rate (). A perfect indicator would correctly classify all cases (TPR and ). The area under the curve (AUC) quantifies classification skill since a perfect classifier would have an AUC of 1 and a random classifier 0.5.
A ROC curve can also be used for calibration to correct bias in reference levels, since the best discriminant threshold is the point with the shortest Euclidean distance to , and so the True Skill Score allows the performance of the reference levels to be evaluated [36,37]. A TSS value of 0.8 to 1 indicates excellent classification. Values from 0.6 to 0.8 high skill with minor errors. A range of 0.4 to 0.6 moderate skill. Values from 0.2 to 0.4 suggest limited discrimination and require caution. A value near or below 0 indicates performance worse than chance.
3. Results
This section may be divided by subheadings. It should provide a concise and precise description of the experimental results, their interpretation as well as the experimental conclusions that can be drawn.
3.1. Subsection
3.1.1. Subsubsection
Bulleted lists look like this:
- First bullet;
- Second bullet;
- Third bullet.
Numbered lists can be added as follows:
- First item;
- Second item;
- Third item.
The text continues here.
3.2. Figures, Tables and Schemes
Figure 1.
This figure presents life history parameters for selected species, illustrating variations in growth rates (as indicated by the von Bertalanffy growth coefficient k). The lower right panel quantifies the data volume underpinning each species’ analysis, ordered from left to right by k: sprat, turbot, pollack, bigeye tuna, and ray.
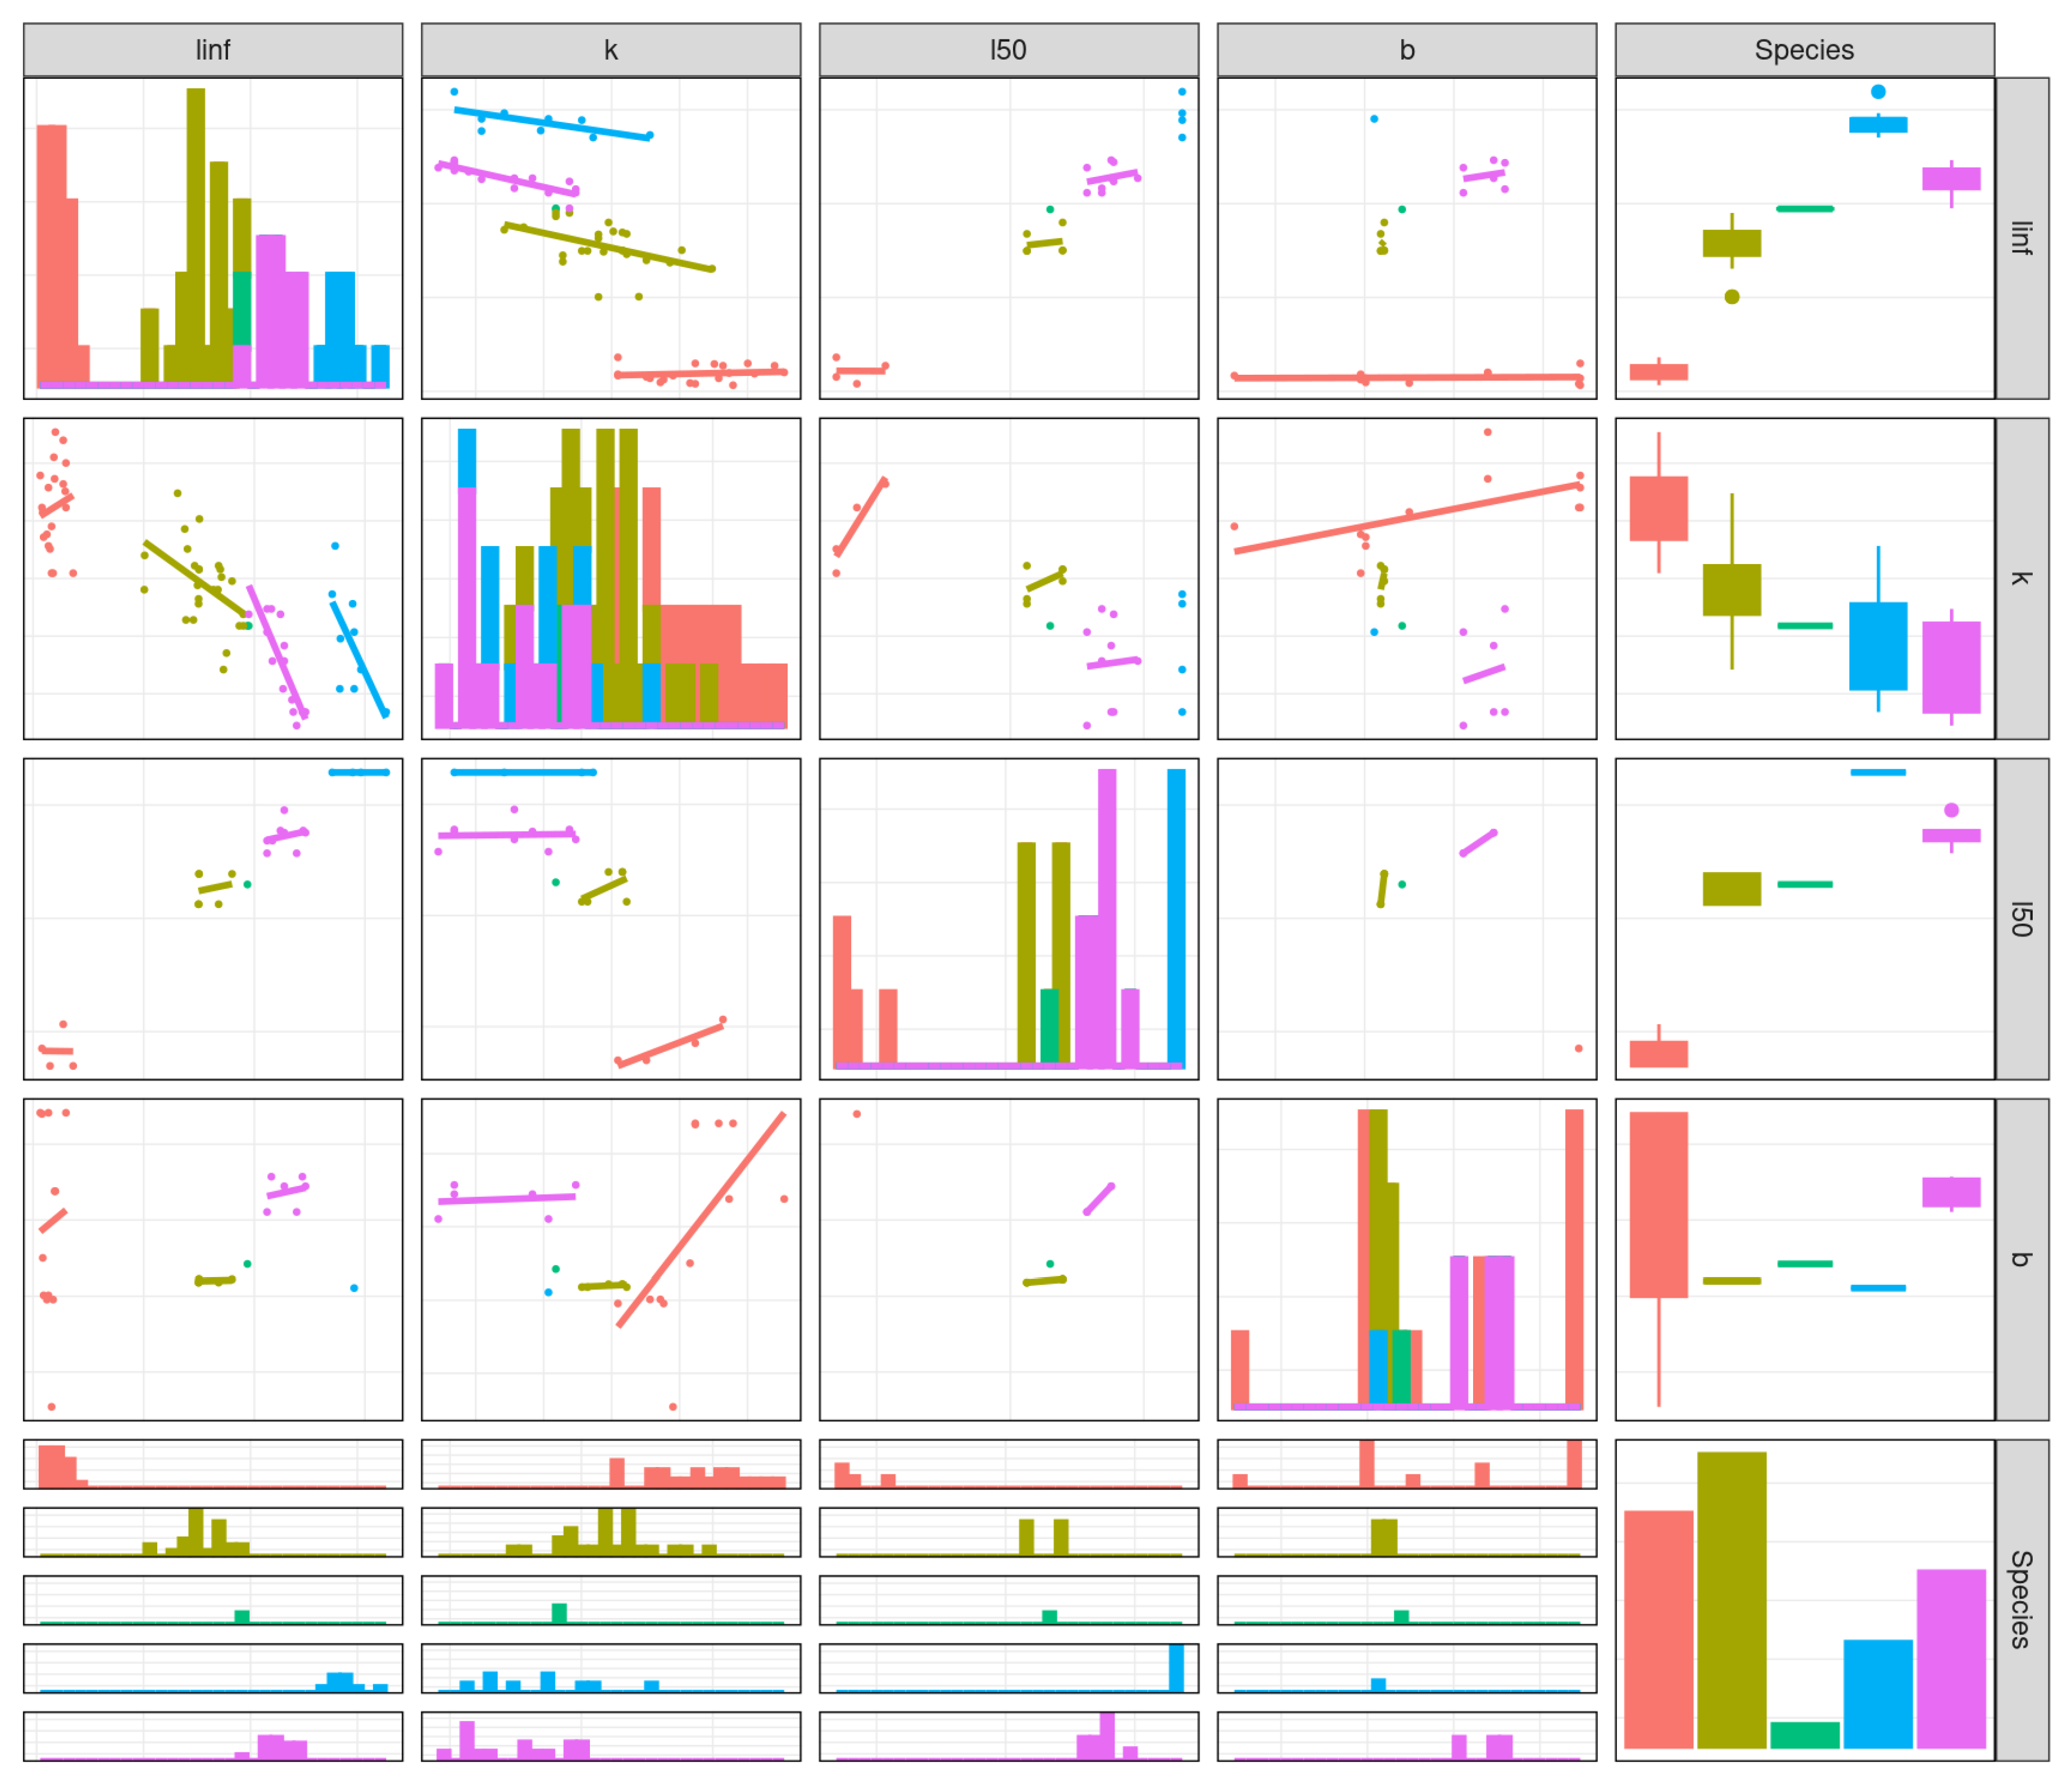
Figure 2.
Operating model outcomes depicts fishing mortality, recruitment, spawning stock biomass, and yield relative to MSY reference points. Fishing intensity is initially low then increases to twice , before a management intervention reduces fishing to 70% of . The ordering of stocks is by the individual growth coefficient k, and ribbons indicate the 95th percentile range along with median and example Monte Carlo realisations.
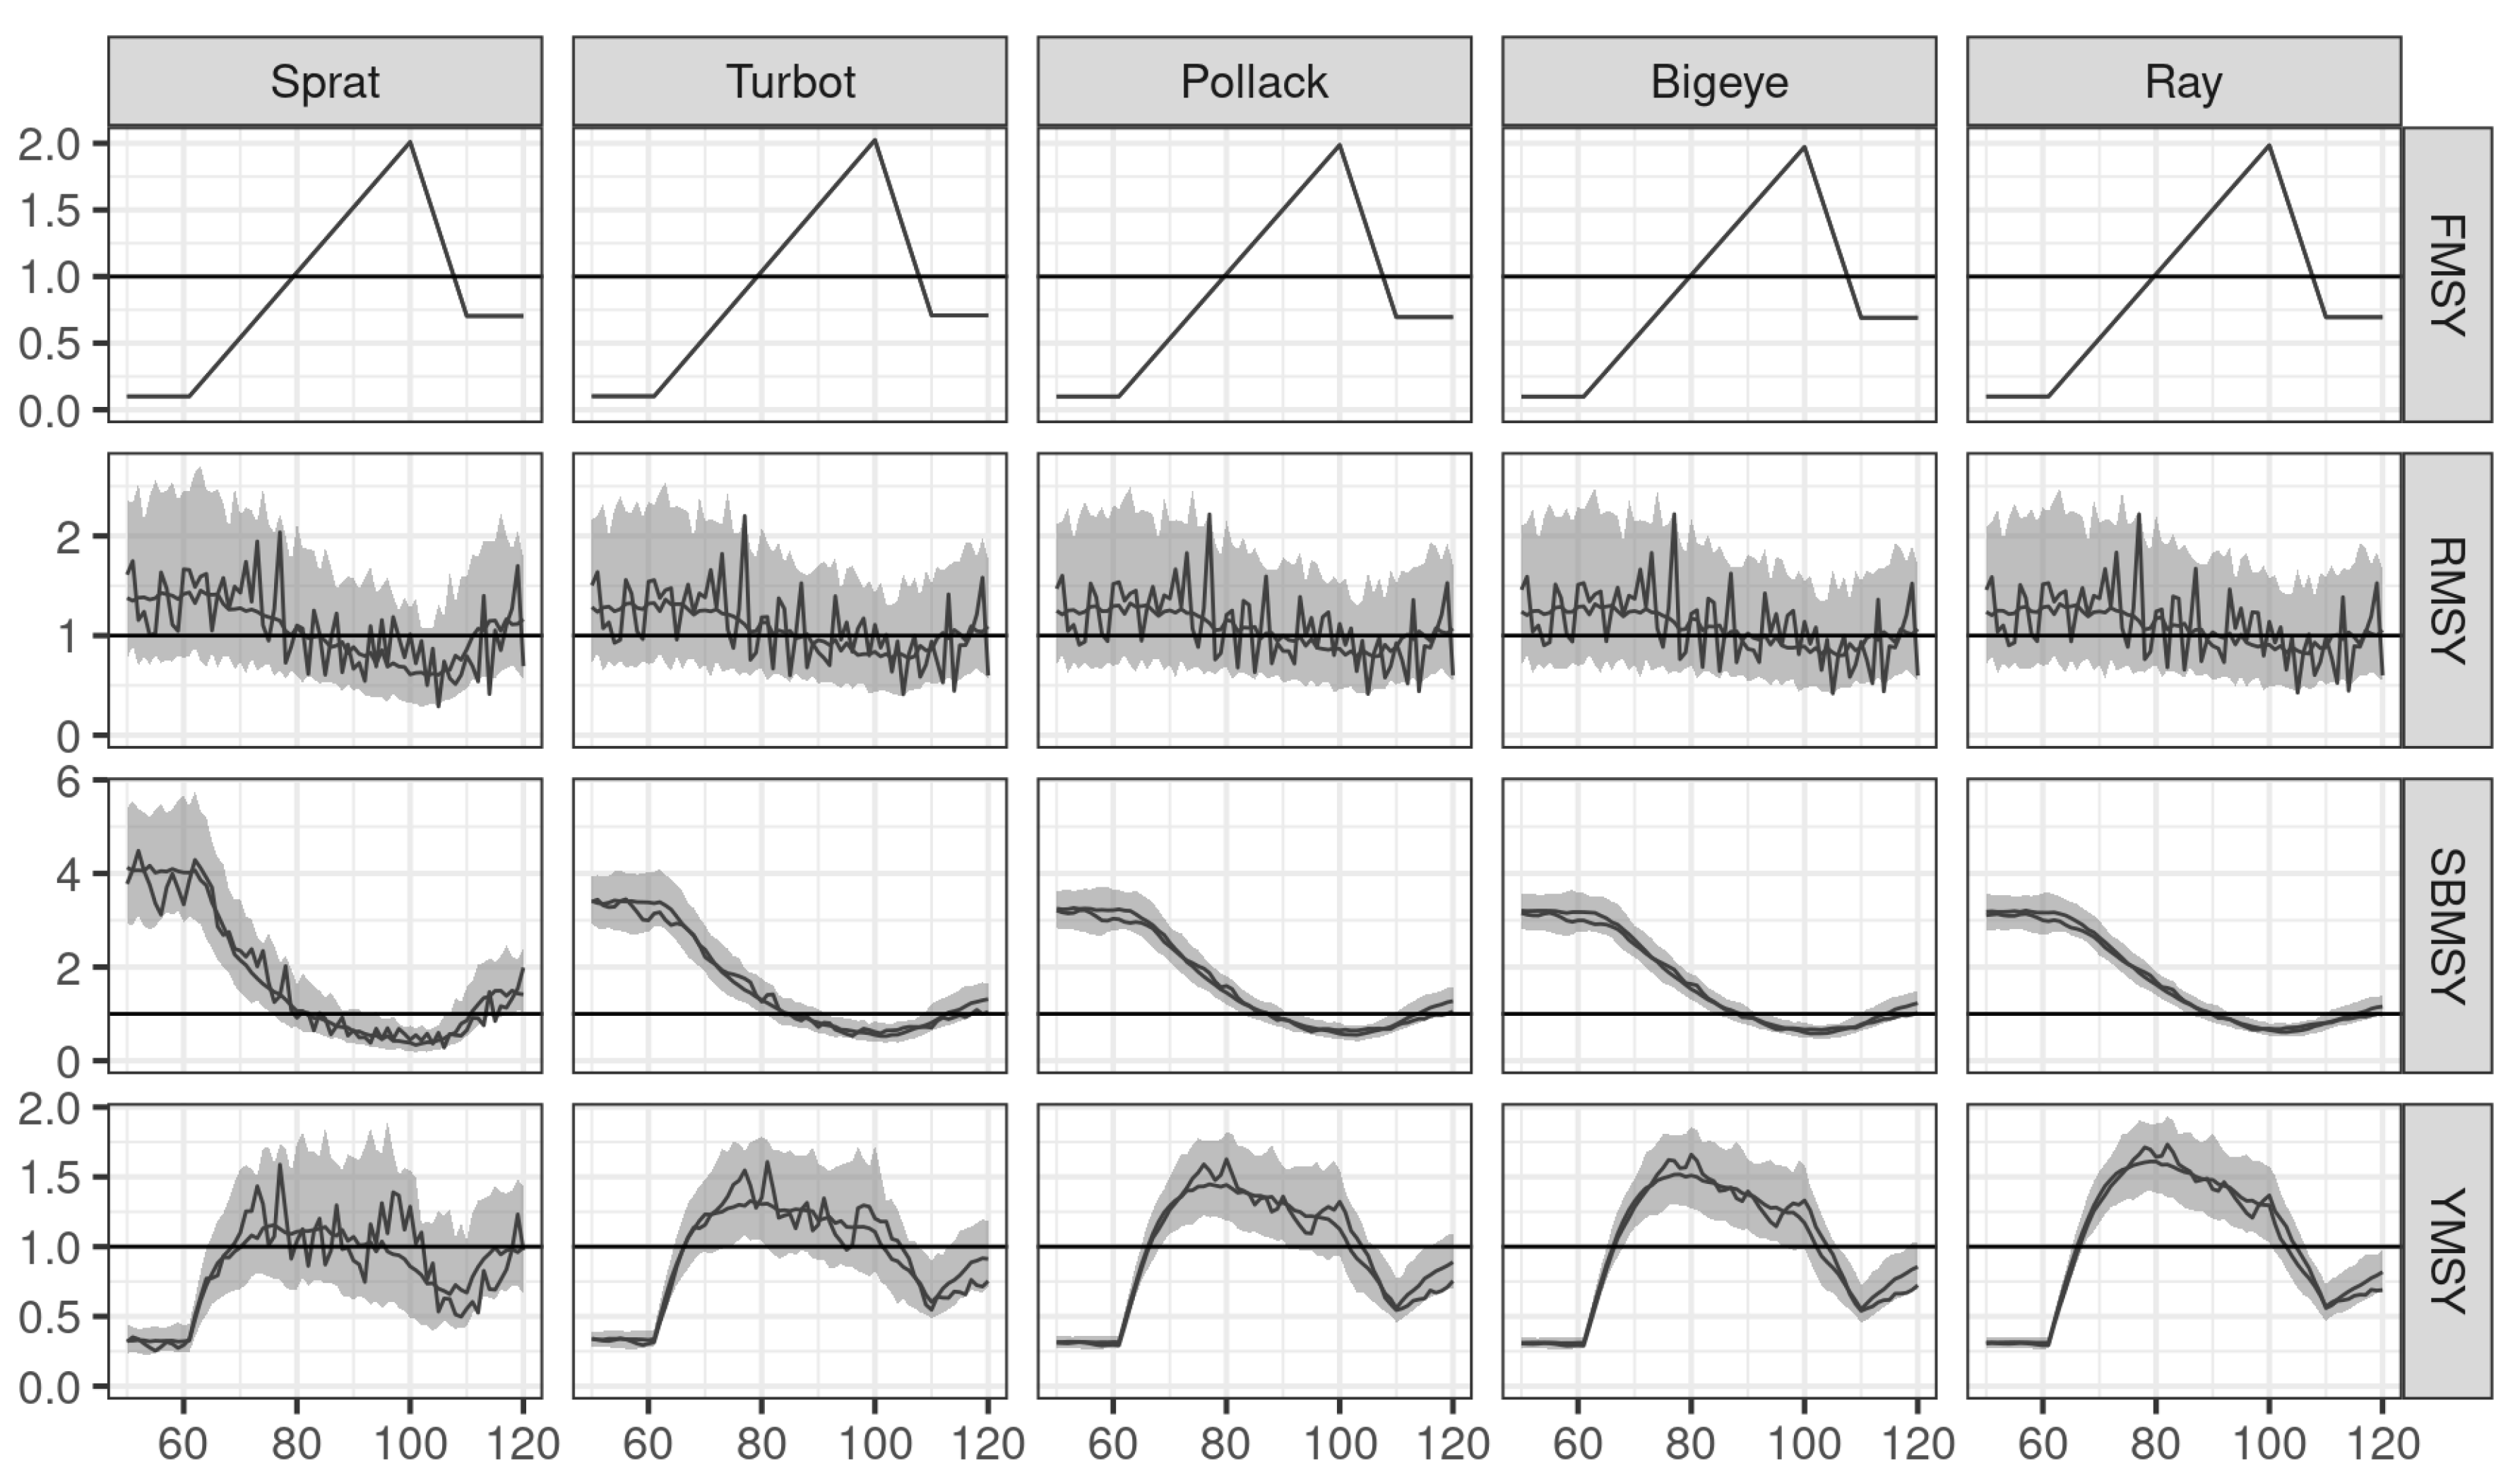
Figure 3.
Length frequency distributions from a representative Monte Carlo simulation for base case operating models. The delineation by (vertical black line) and average length (, blue line) underscores size-selective fishing impacts.
Figure 3.
Length frequency distributions from a representative Monte Carlo simulation for base case operating models. The delineation by (vertical black line) and average length (, blue line) underscores size-selective fishing impacts.
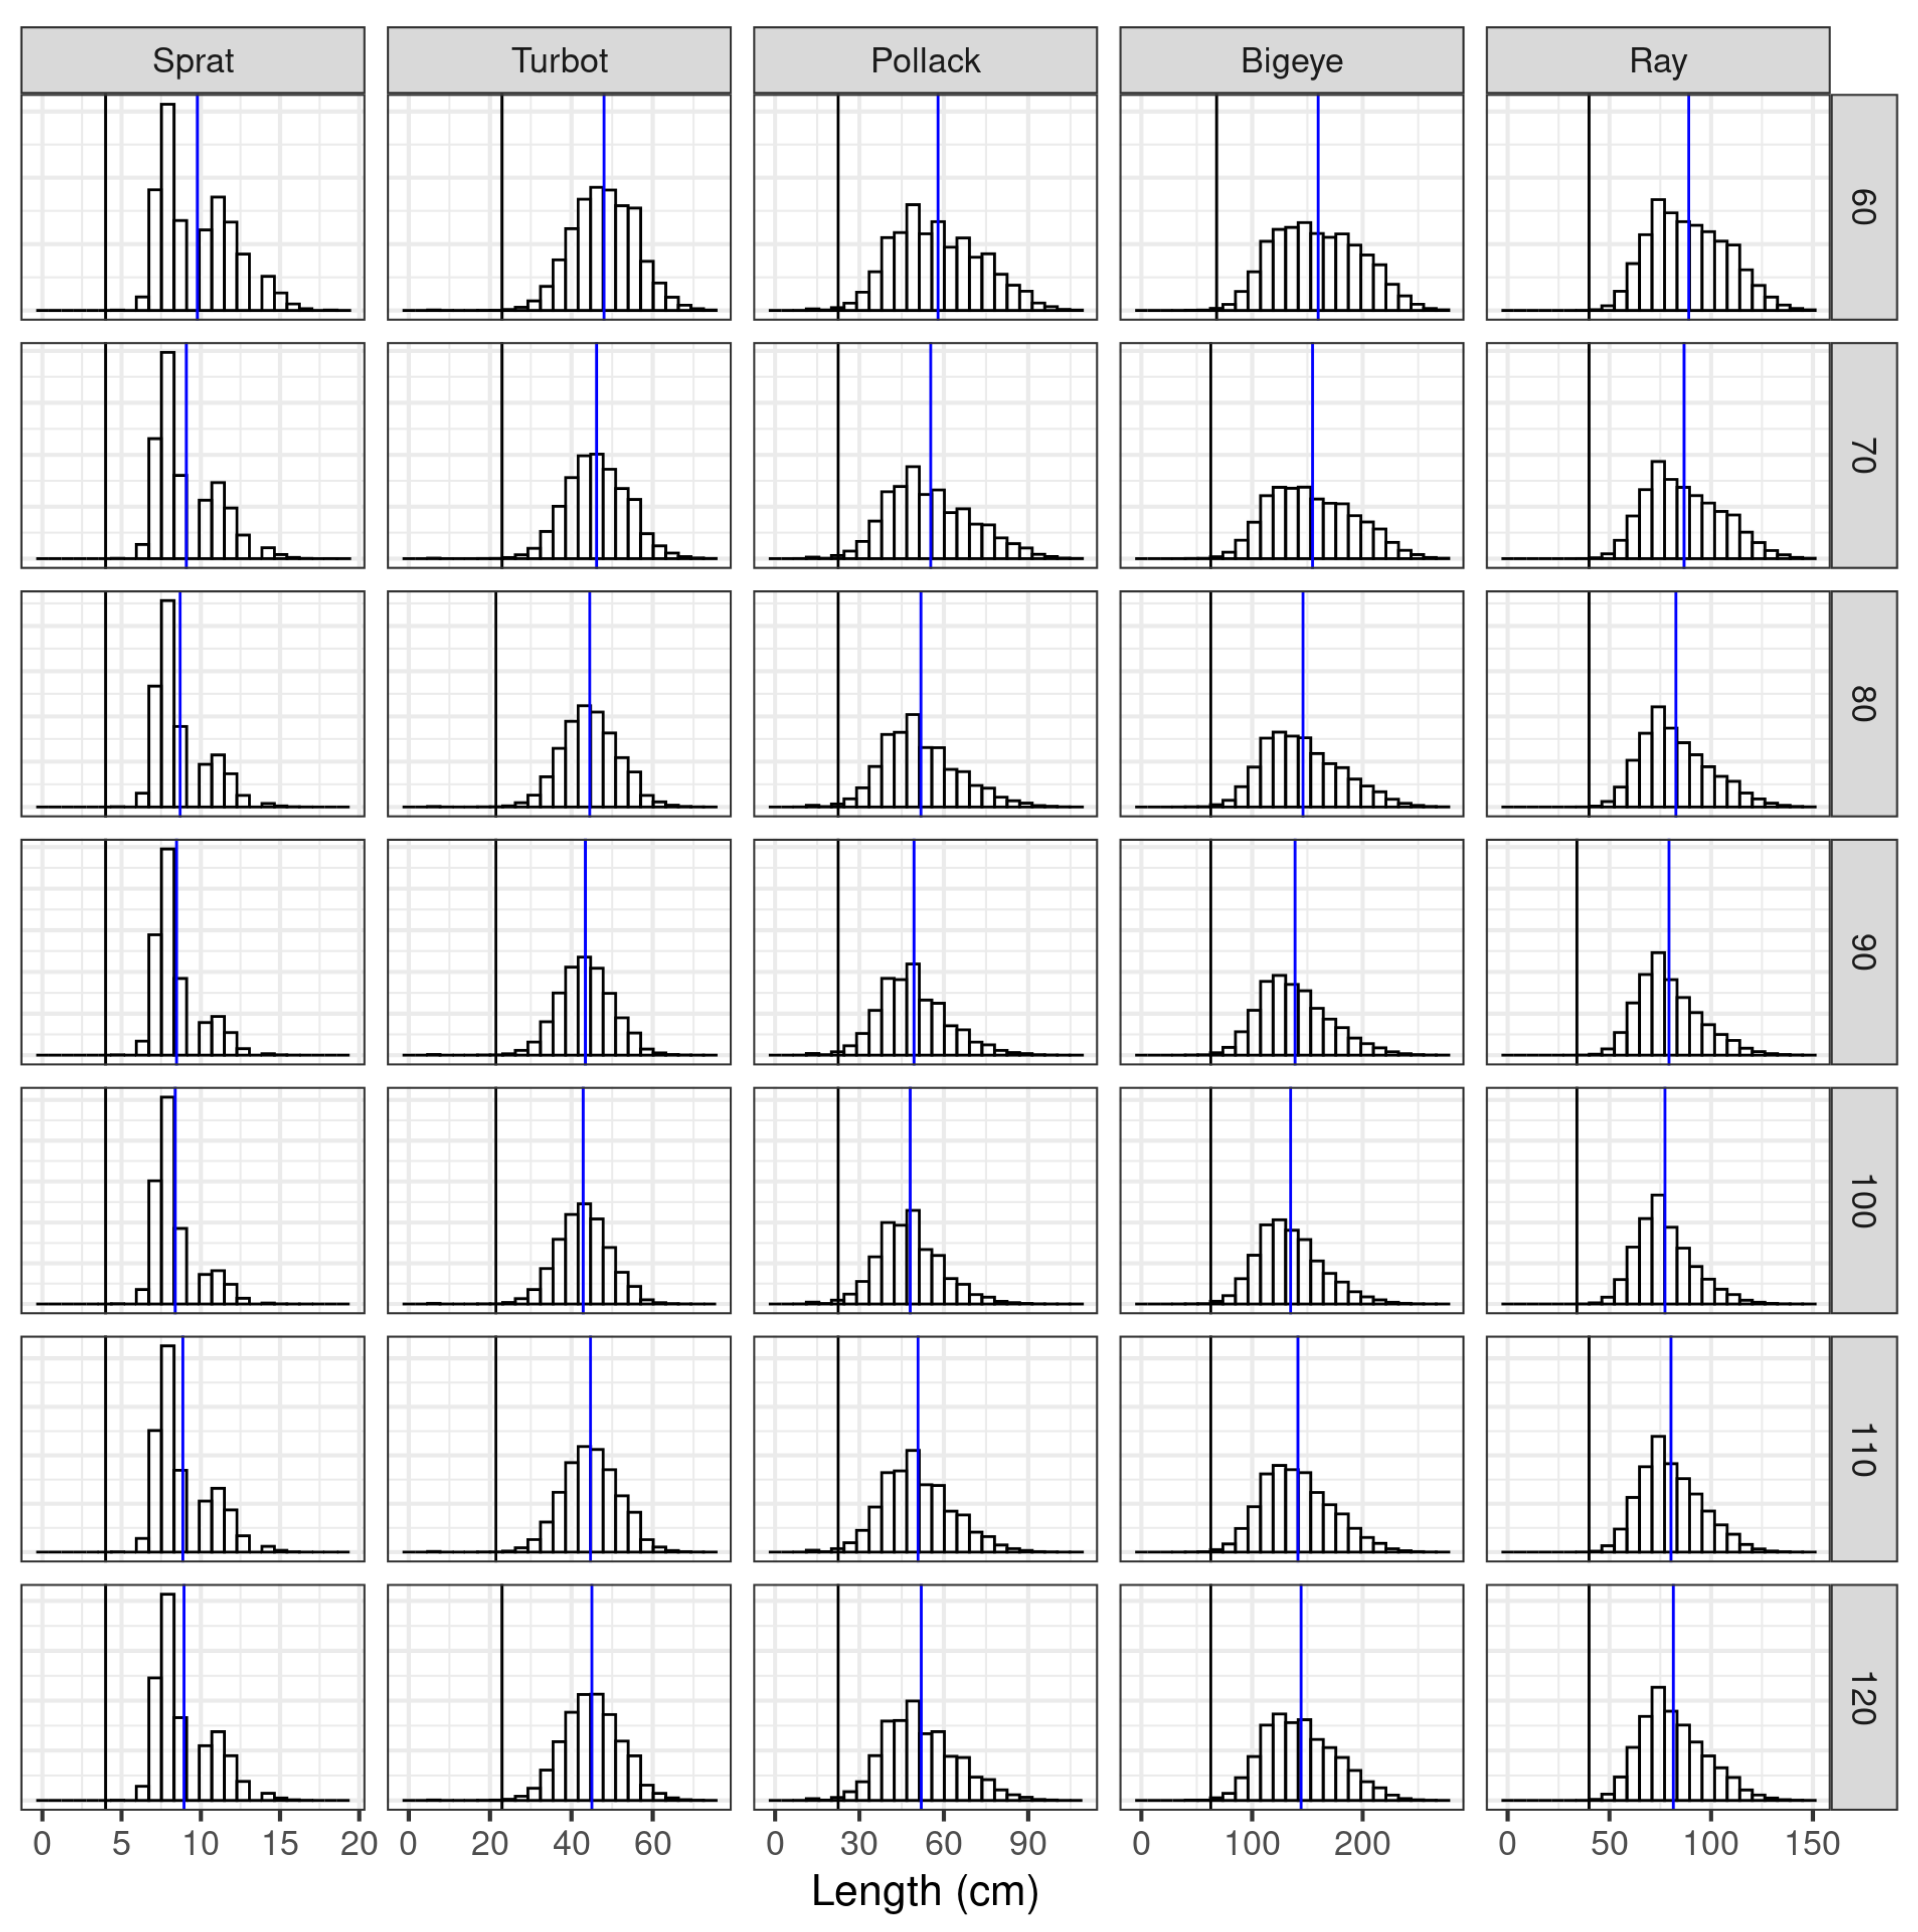
Figure 4.
Species-specific length-based indicators juxtaposed with benchmarks, highlighting the differential responses to fishing pressure as evidenced by the dashed line representing operating model estimates of .
Figure 4.
Species-specific length-based indicators juxtaposed with benchmarks, highlighting the differential responses to fishing pressure as evidenced by the dashed line representing operating model estimates of .
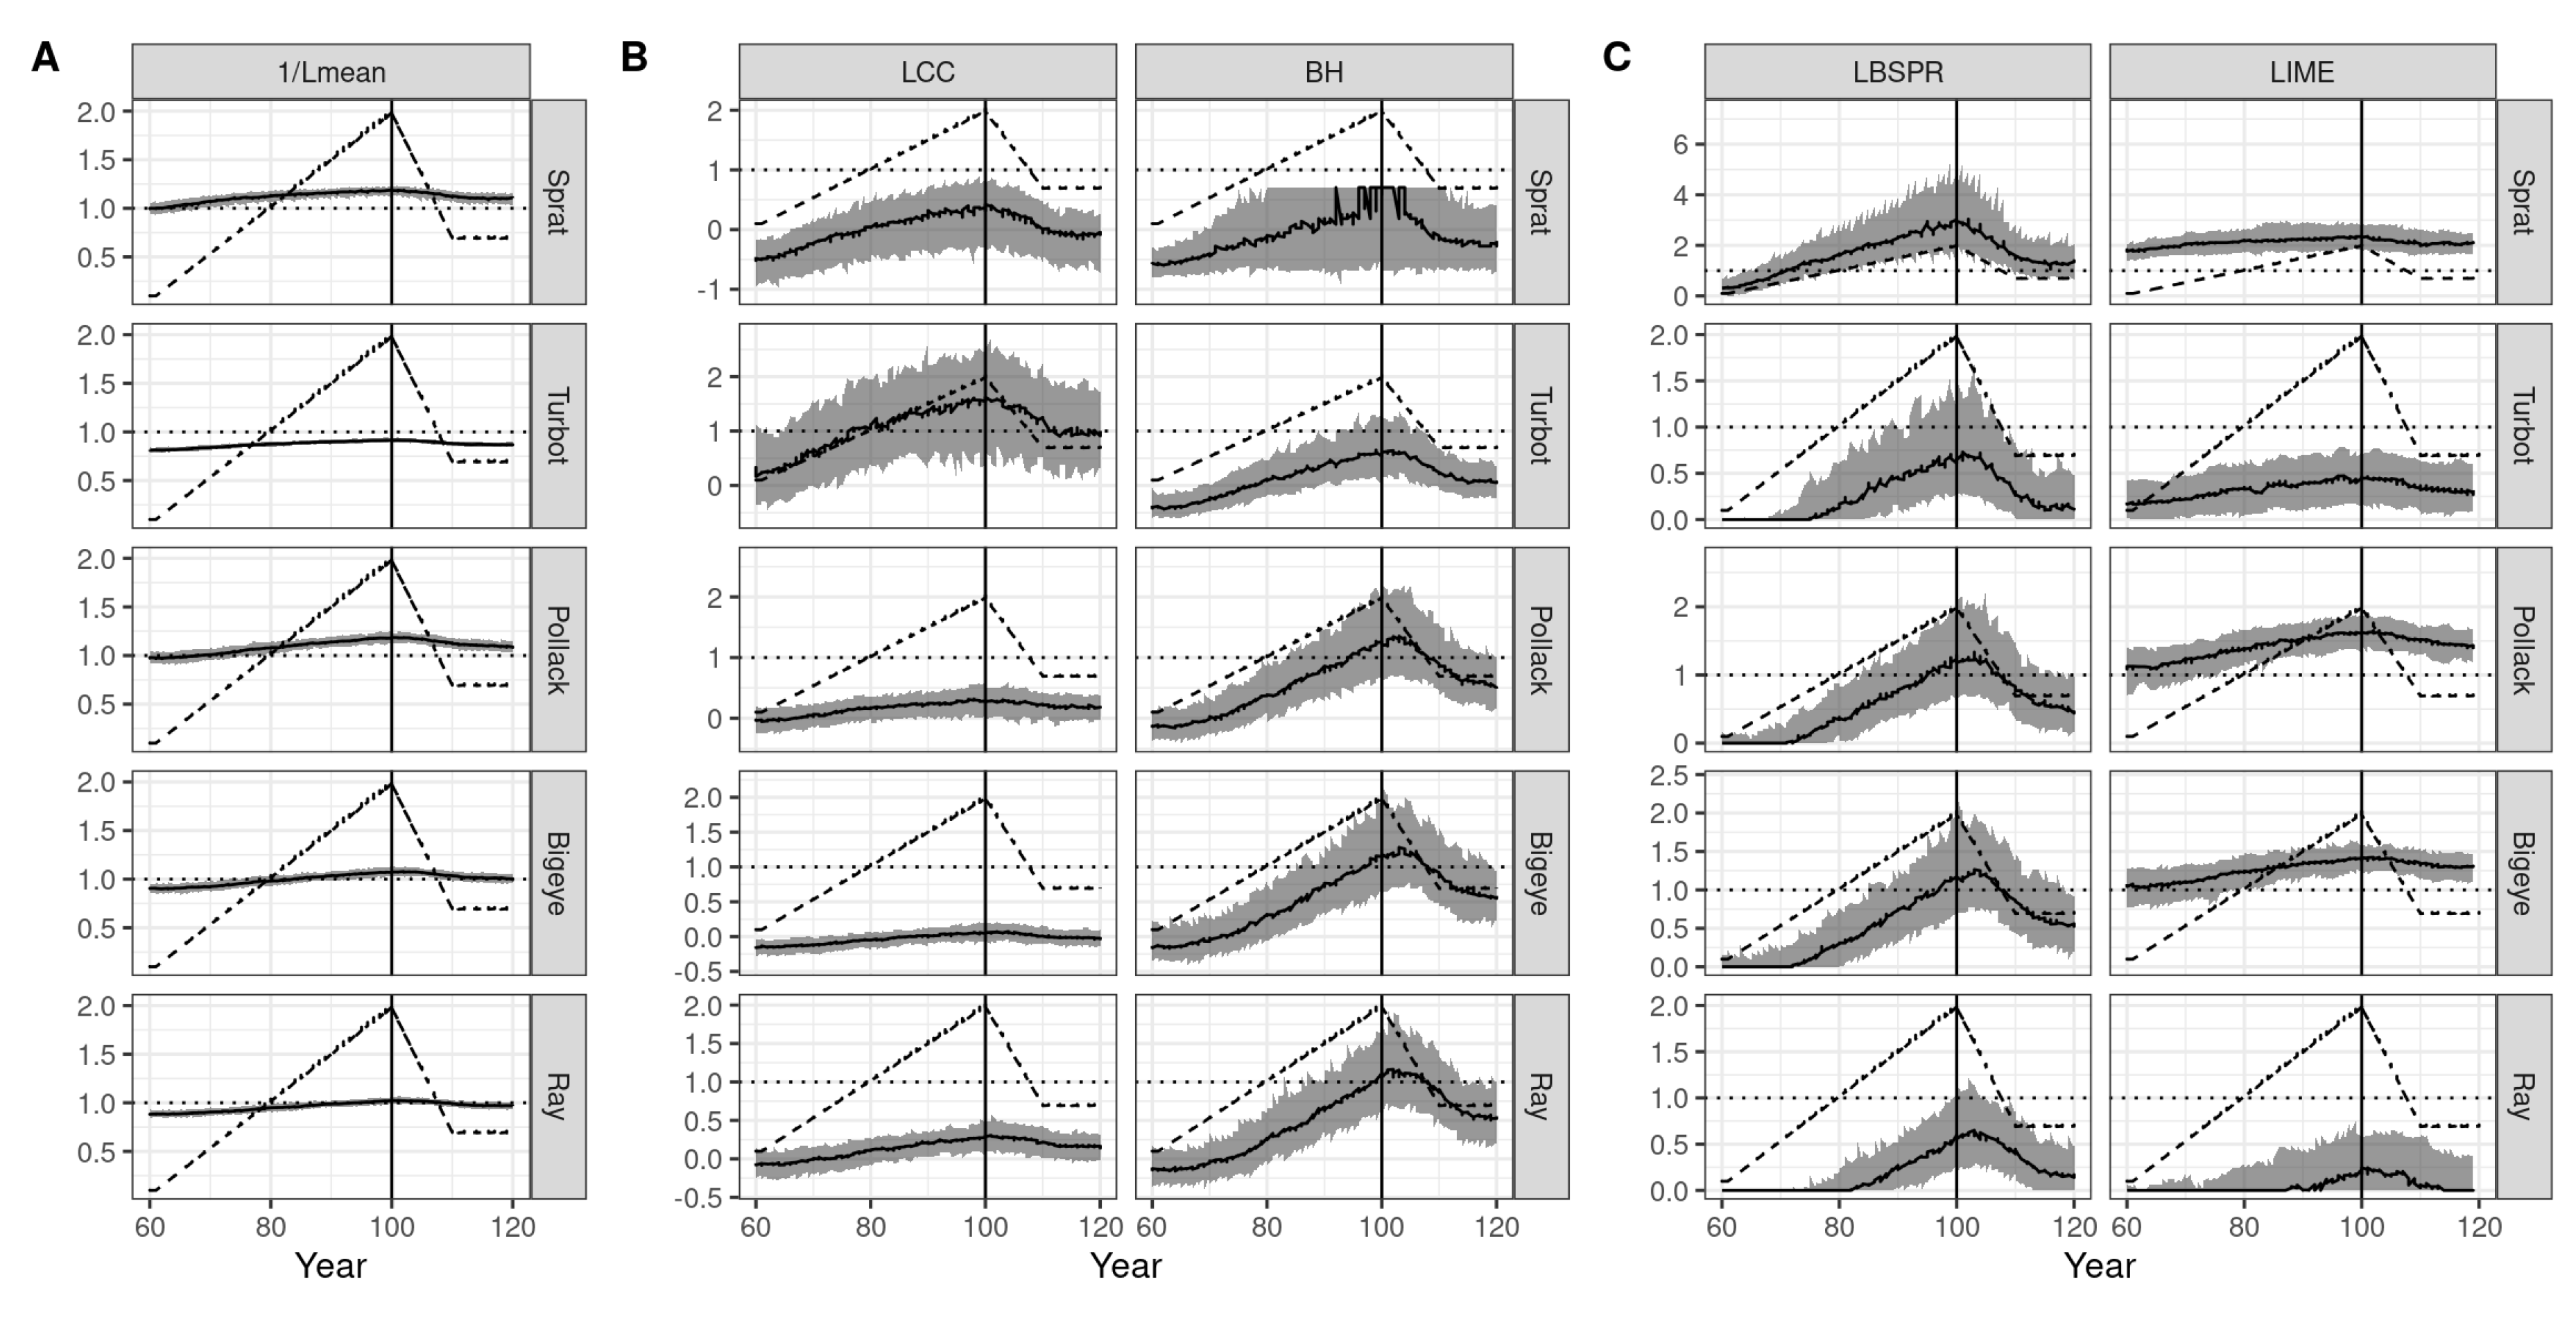
Figure 5.
Exploration of length-based indicators against across multiple scenarios for pollack, indicating scenario-specific vulnerabilities and resilience. The operating model’s ratio is delineated for contextual understanding.
Figure 5.
Exploration of length-based indicators against across multiple scenarios for pollack, indicating scenario-specific vulnerabilities and resilience. The operating model’s ratio is delineated for contextual understanding.
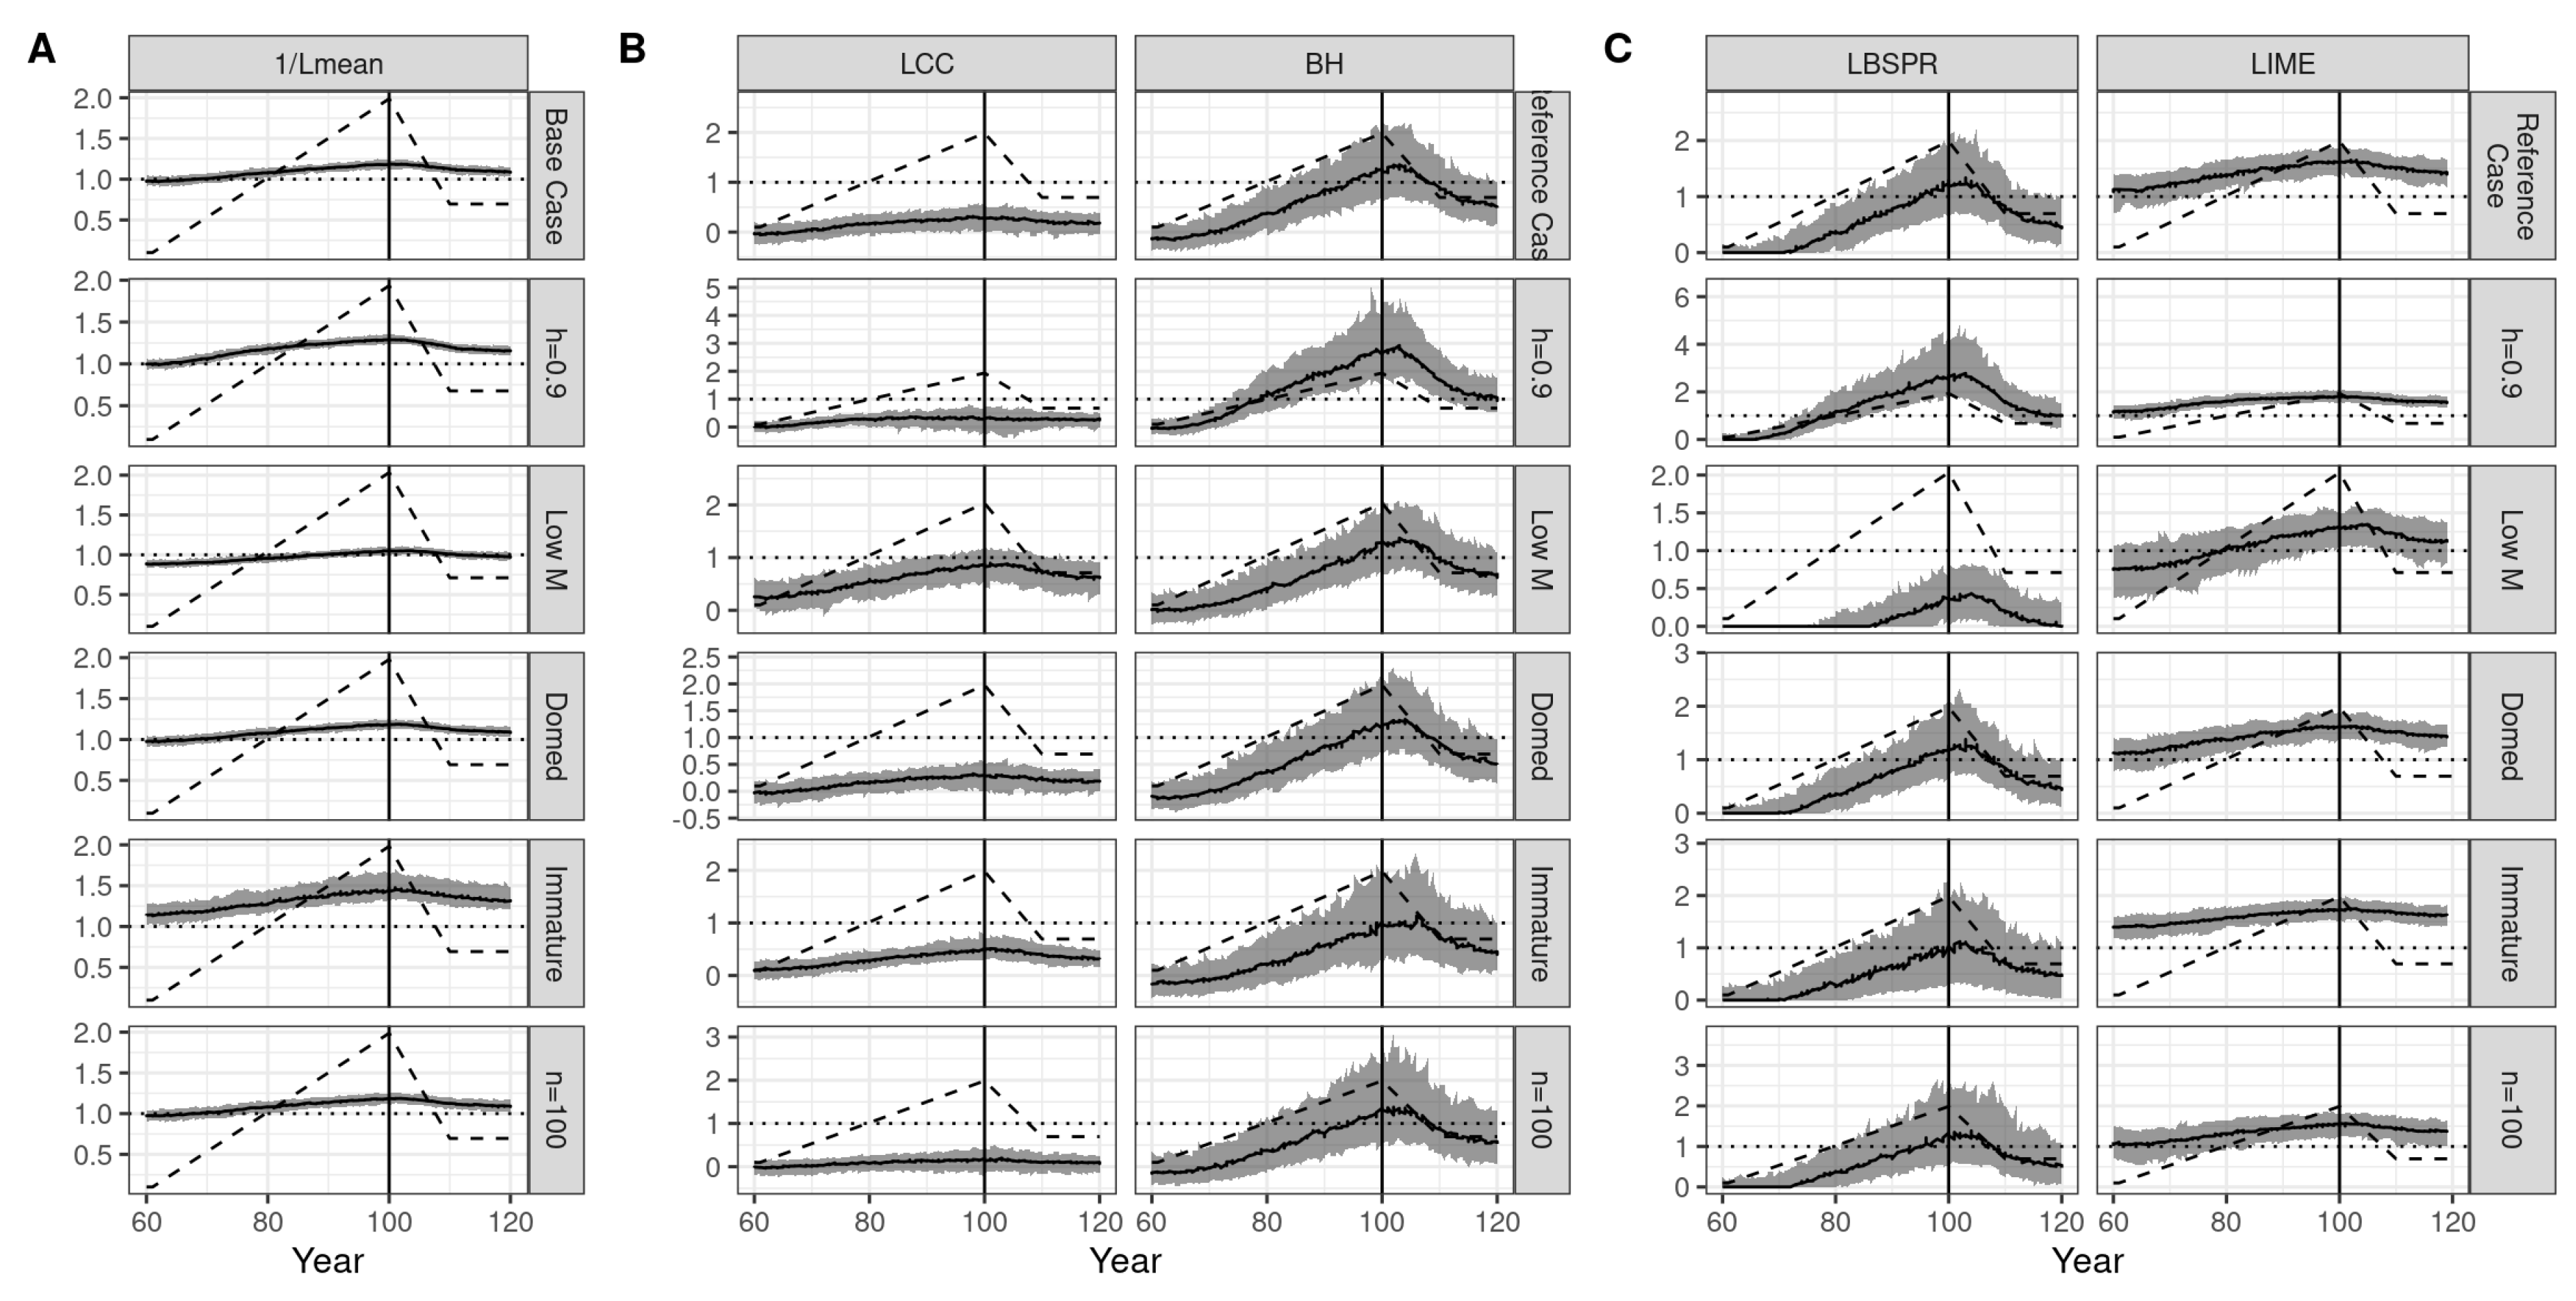
Figure 6.
ROC curves evaluating the predictive accuracy of management strategies over the recovery period. Each line represents a distinct scenario, with focal points highlighting the reference level. The base case is marked in black, providing a benchmark against which alternative scenarios are evaluated.
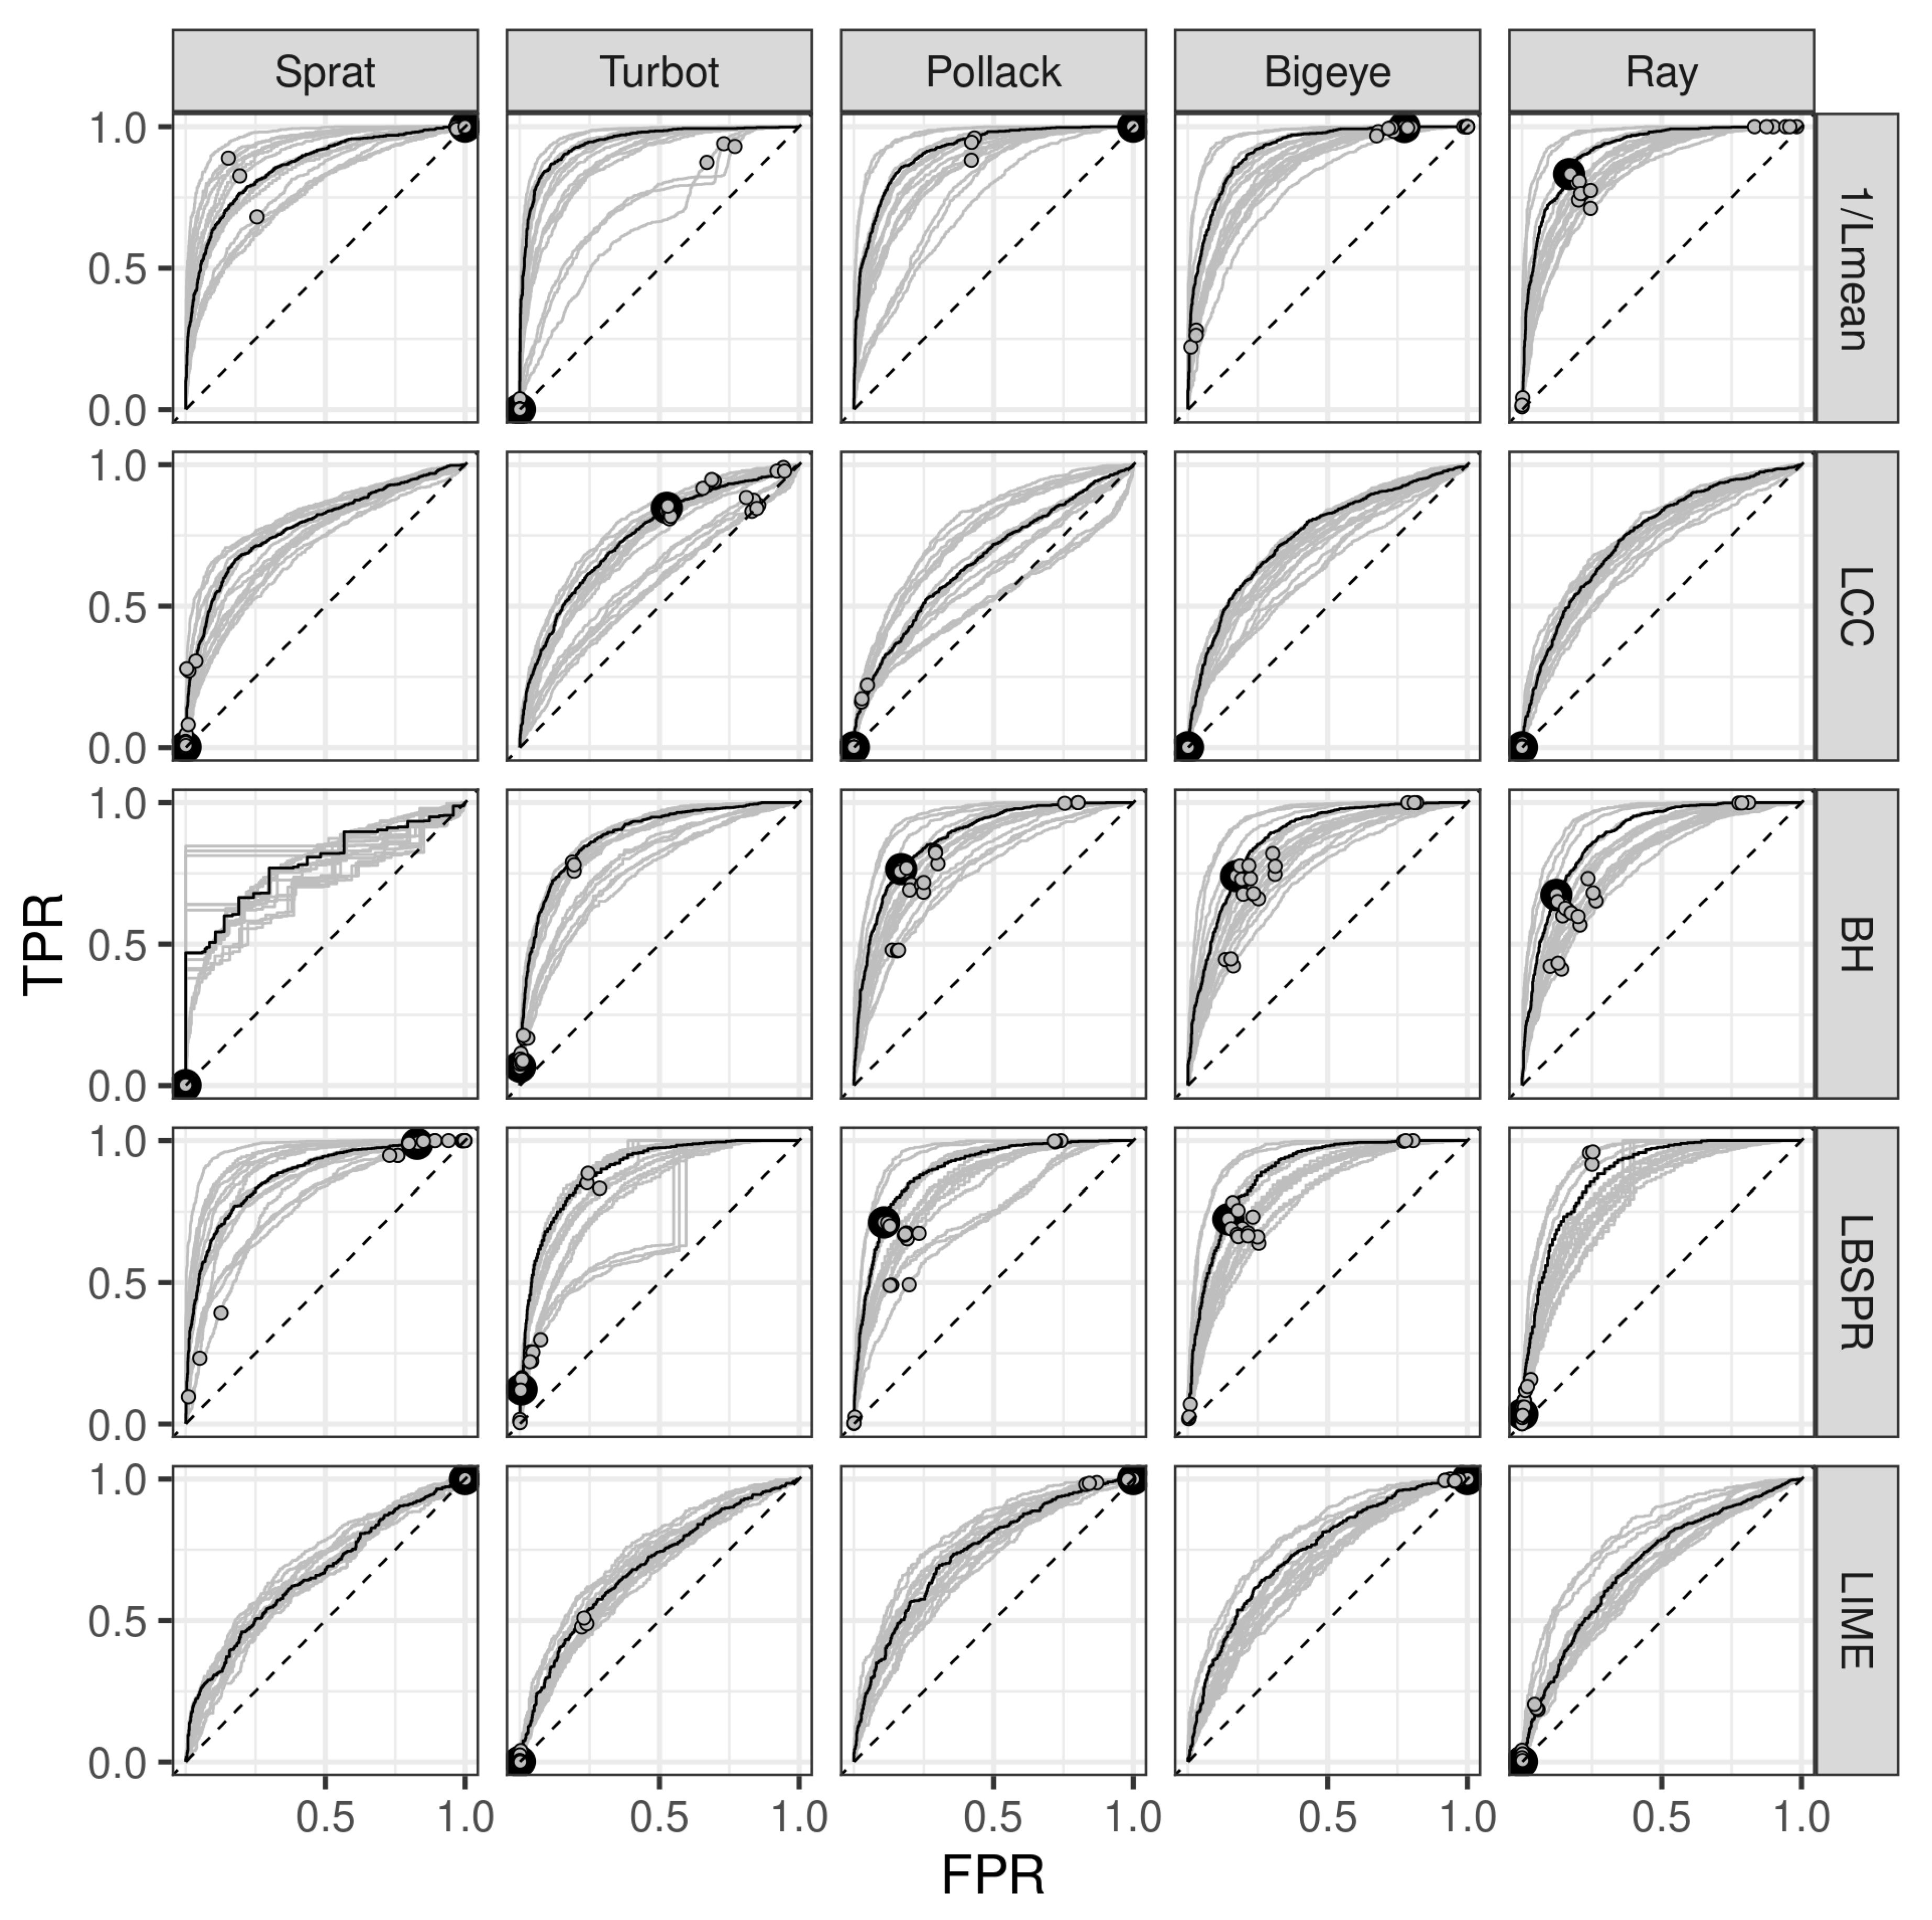
Figure 7.
Area under the ROC curve by species and management scenario.
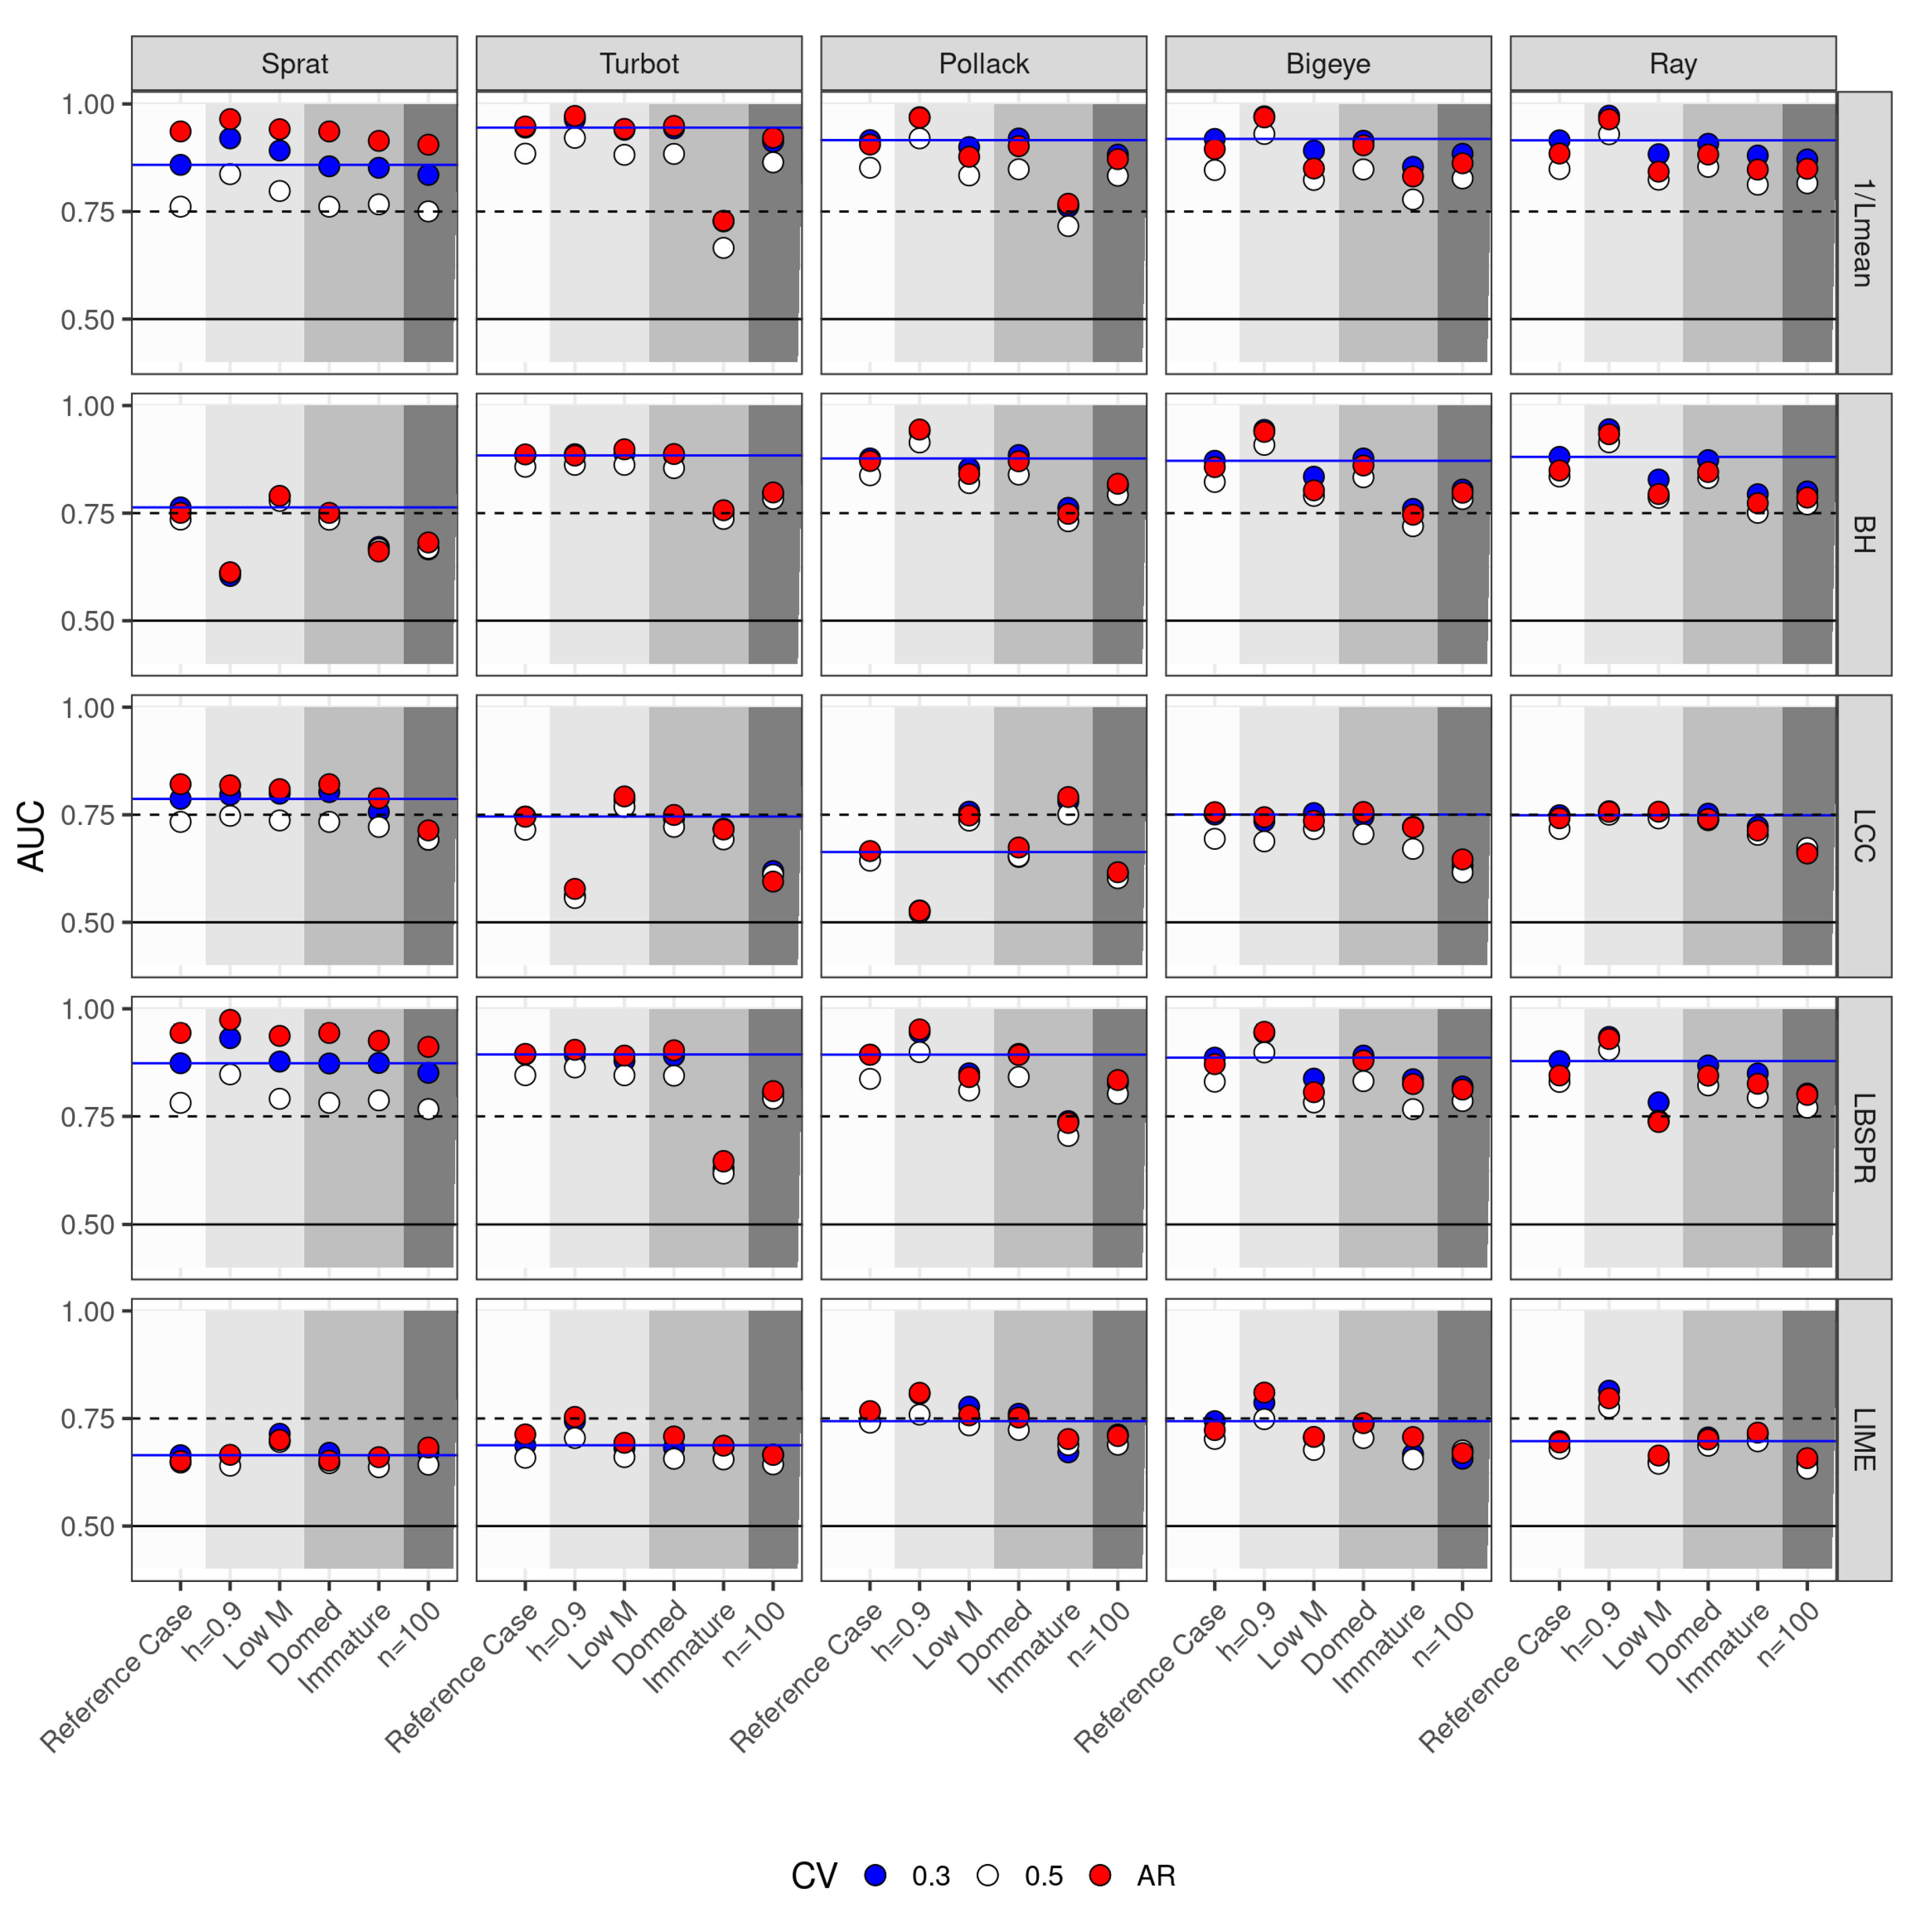
Figure 8.
True skill score analysis for across species and scenarios.
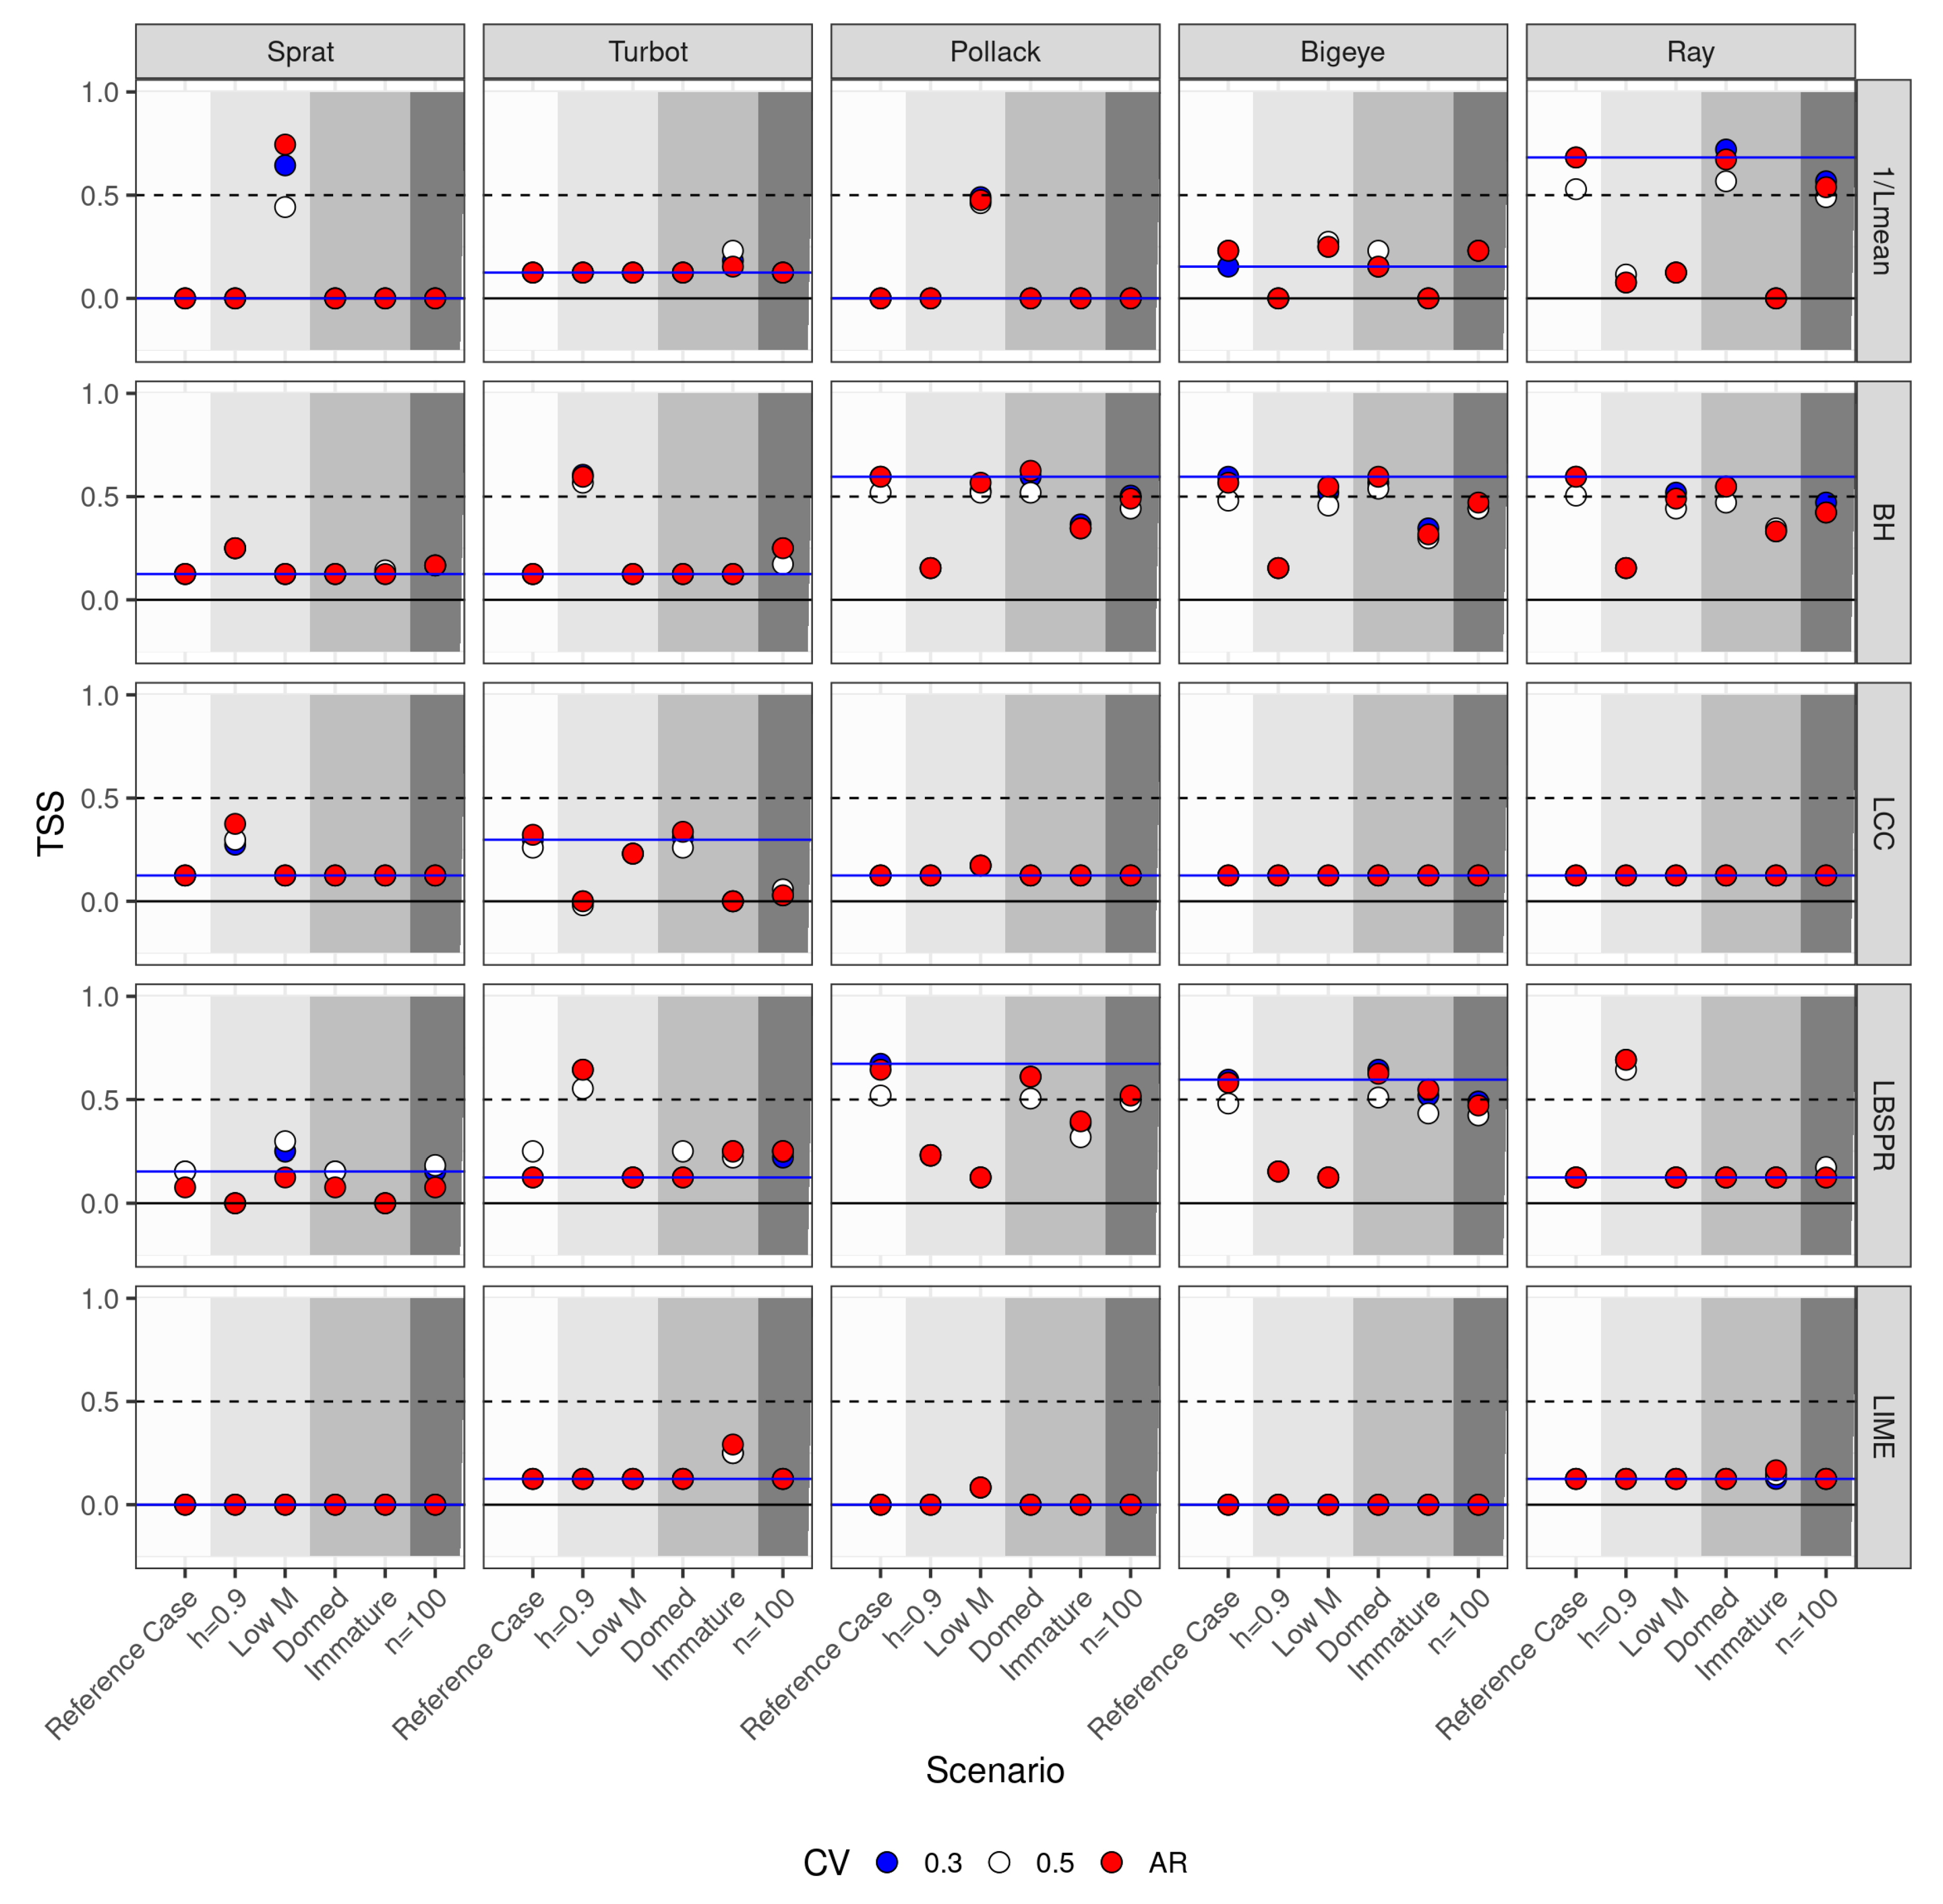
Figure 9.
True skill score for Base Case reference level based on year 80 when exploitation level was at and increasing, by species, Operating Model Scenario, and indicator.
Figure 9.
True skill score for Base Case reference level based on year 80 when exploitation level was at and increasing, by species, Operating Model Scenario, and indicator.
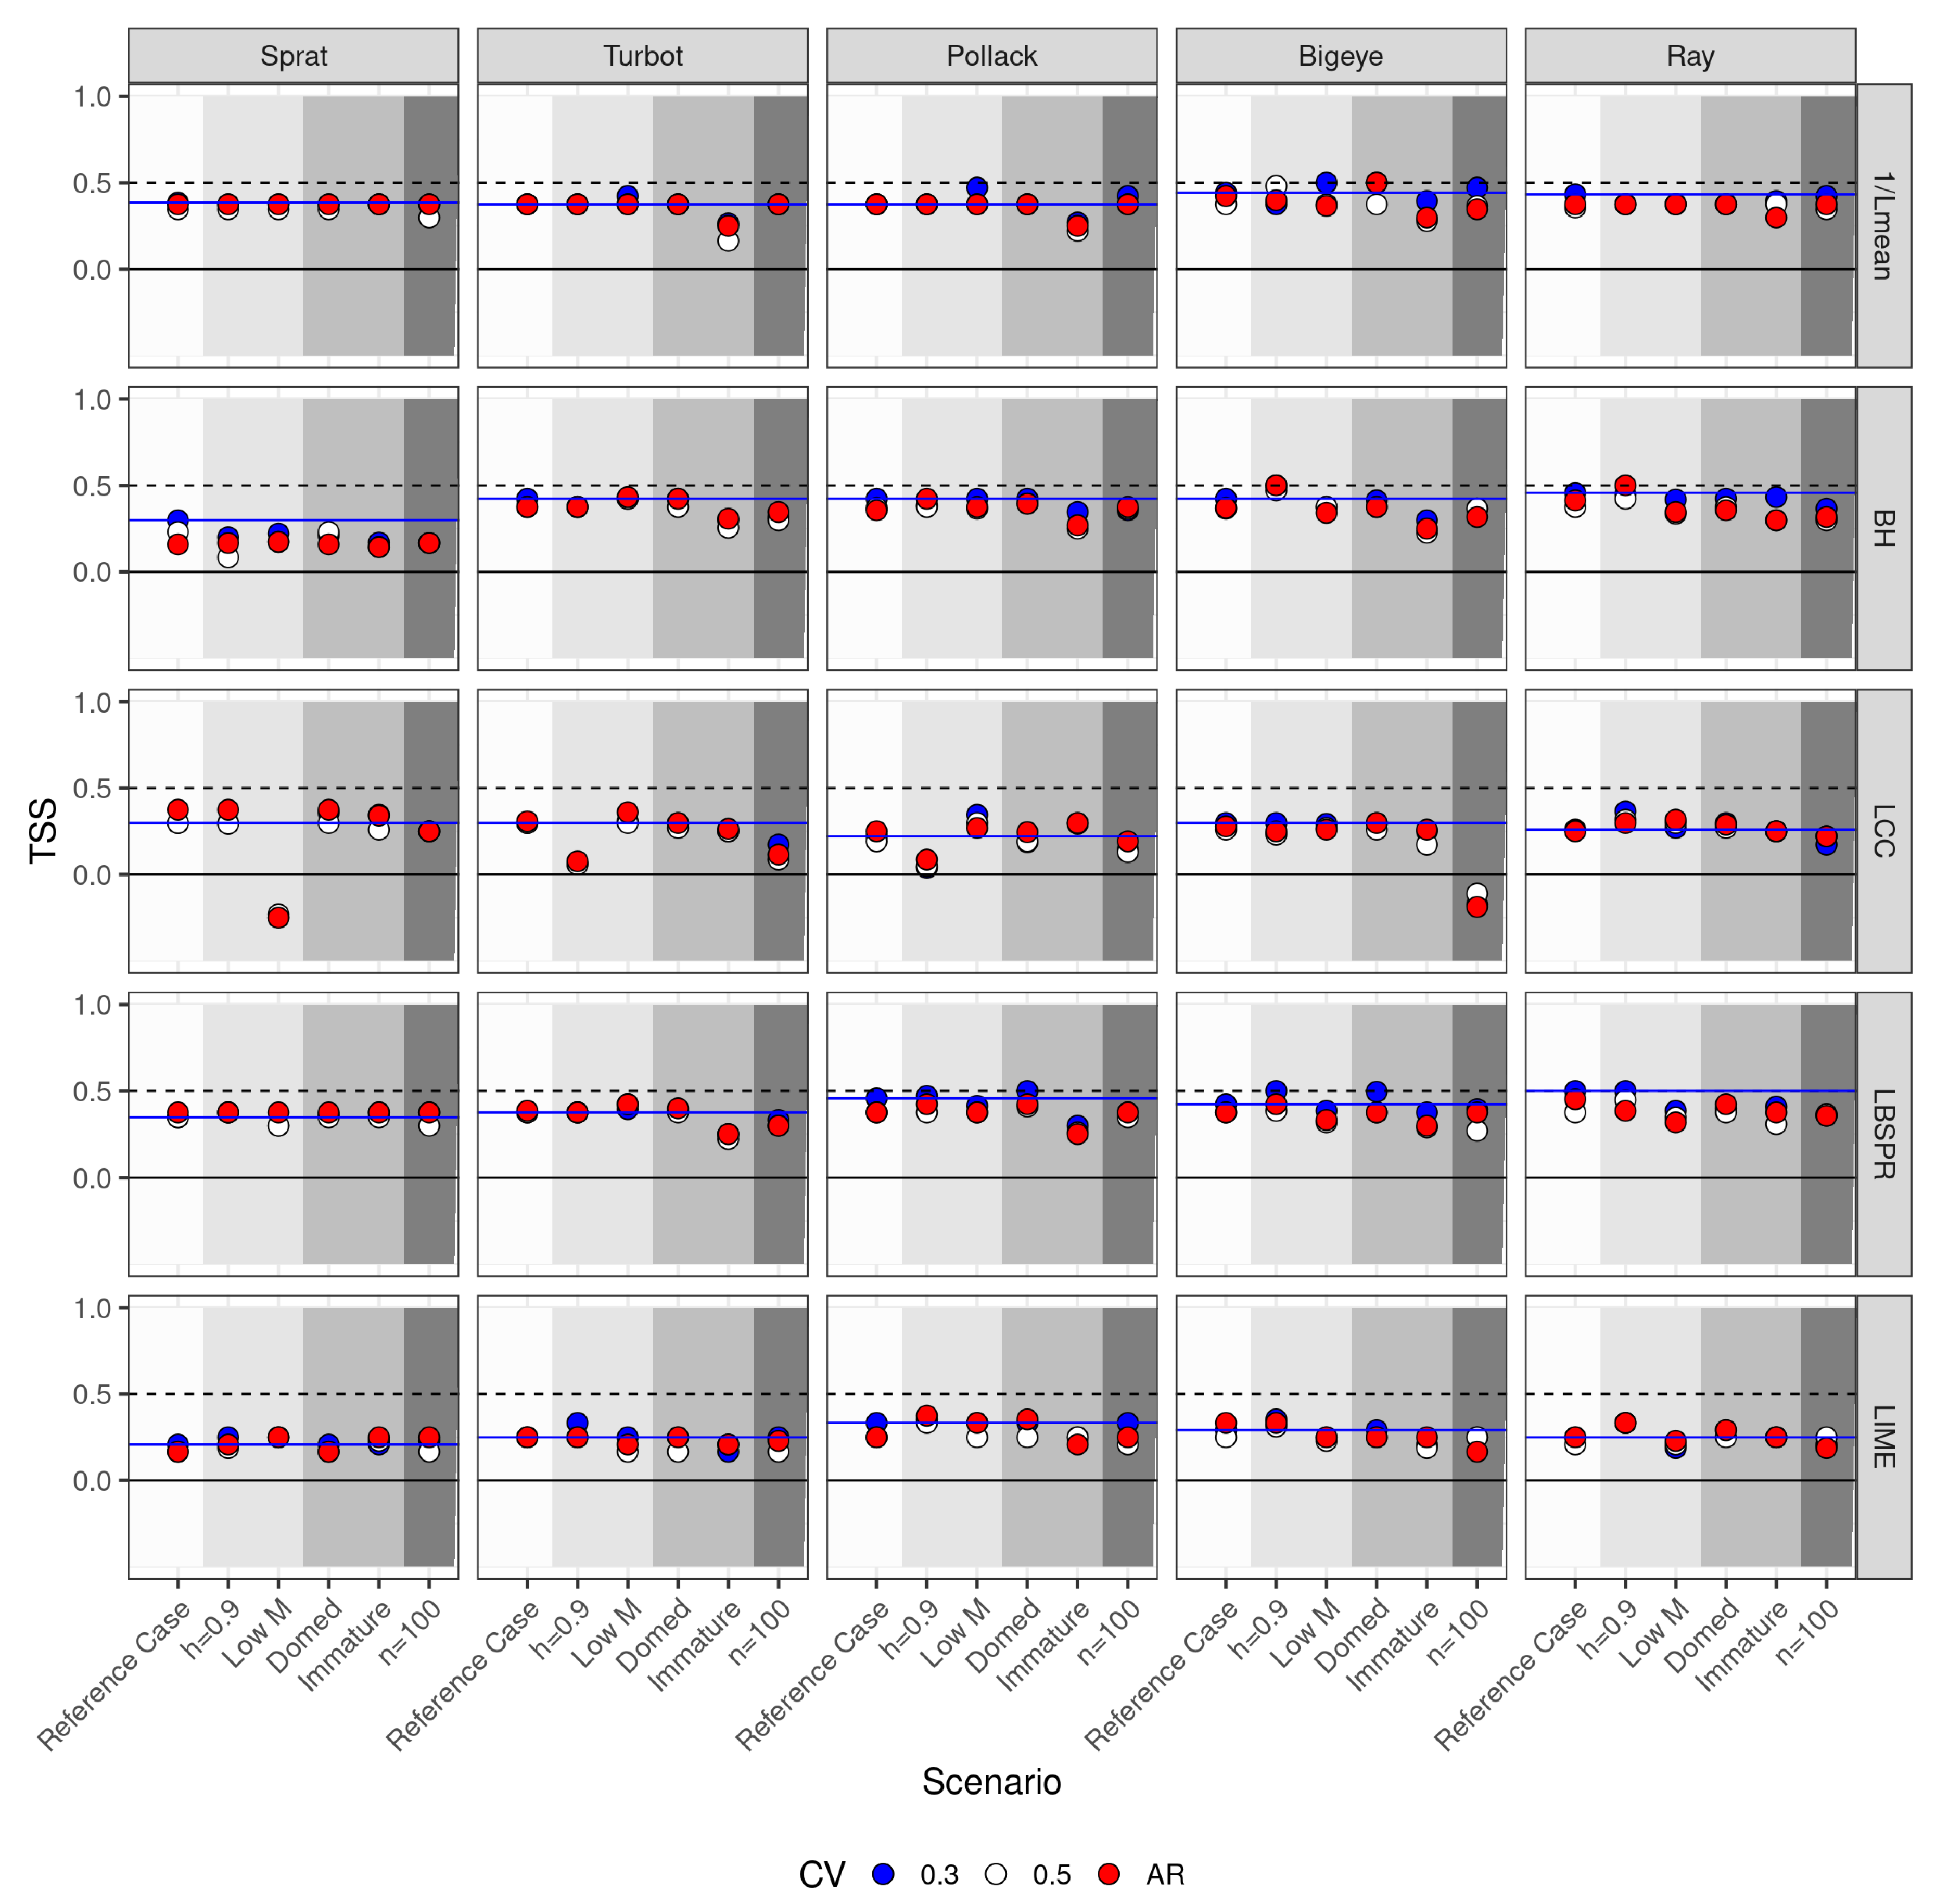
Figure 10.
True skill score for Base Case reference level based on year 100 when exploitation level was at and decreasing, by species, Operating Model Scenario, and indicator.
Figure 10.
True skill score for Base Case reference level based on year 100 when exploitation level was at and decreasing, by species, Operating Model Scenario, and indicator.
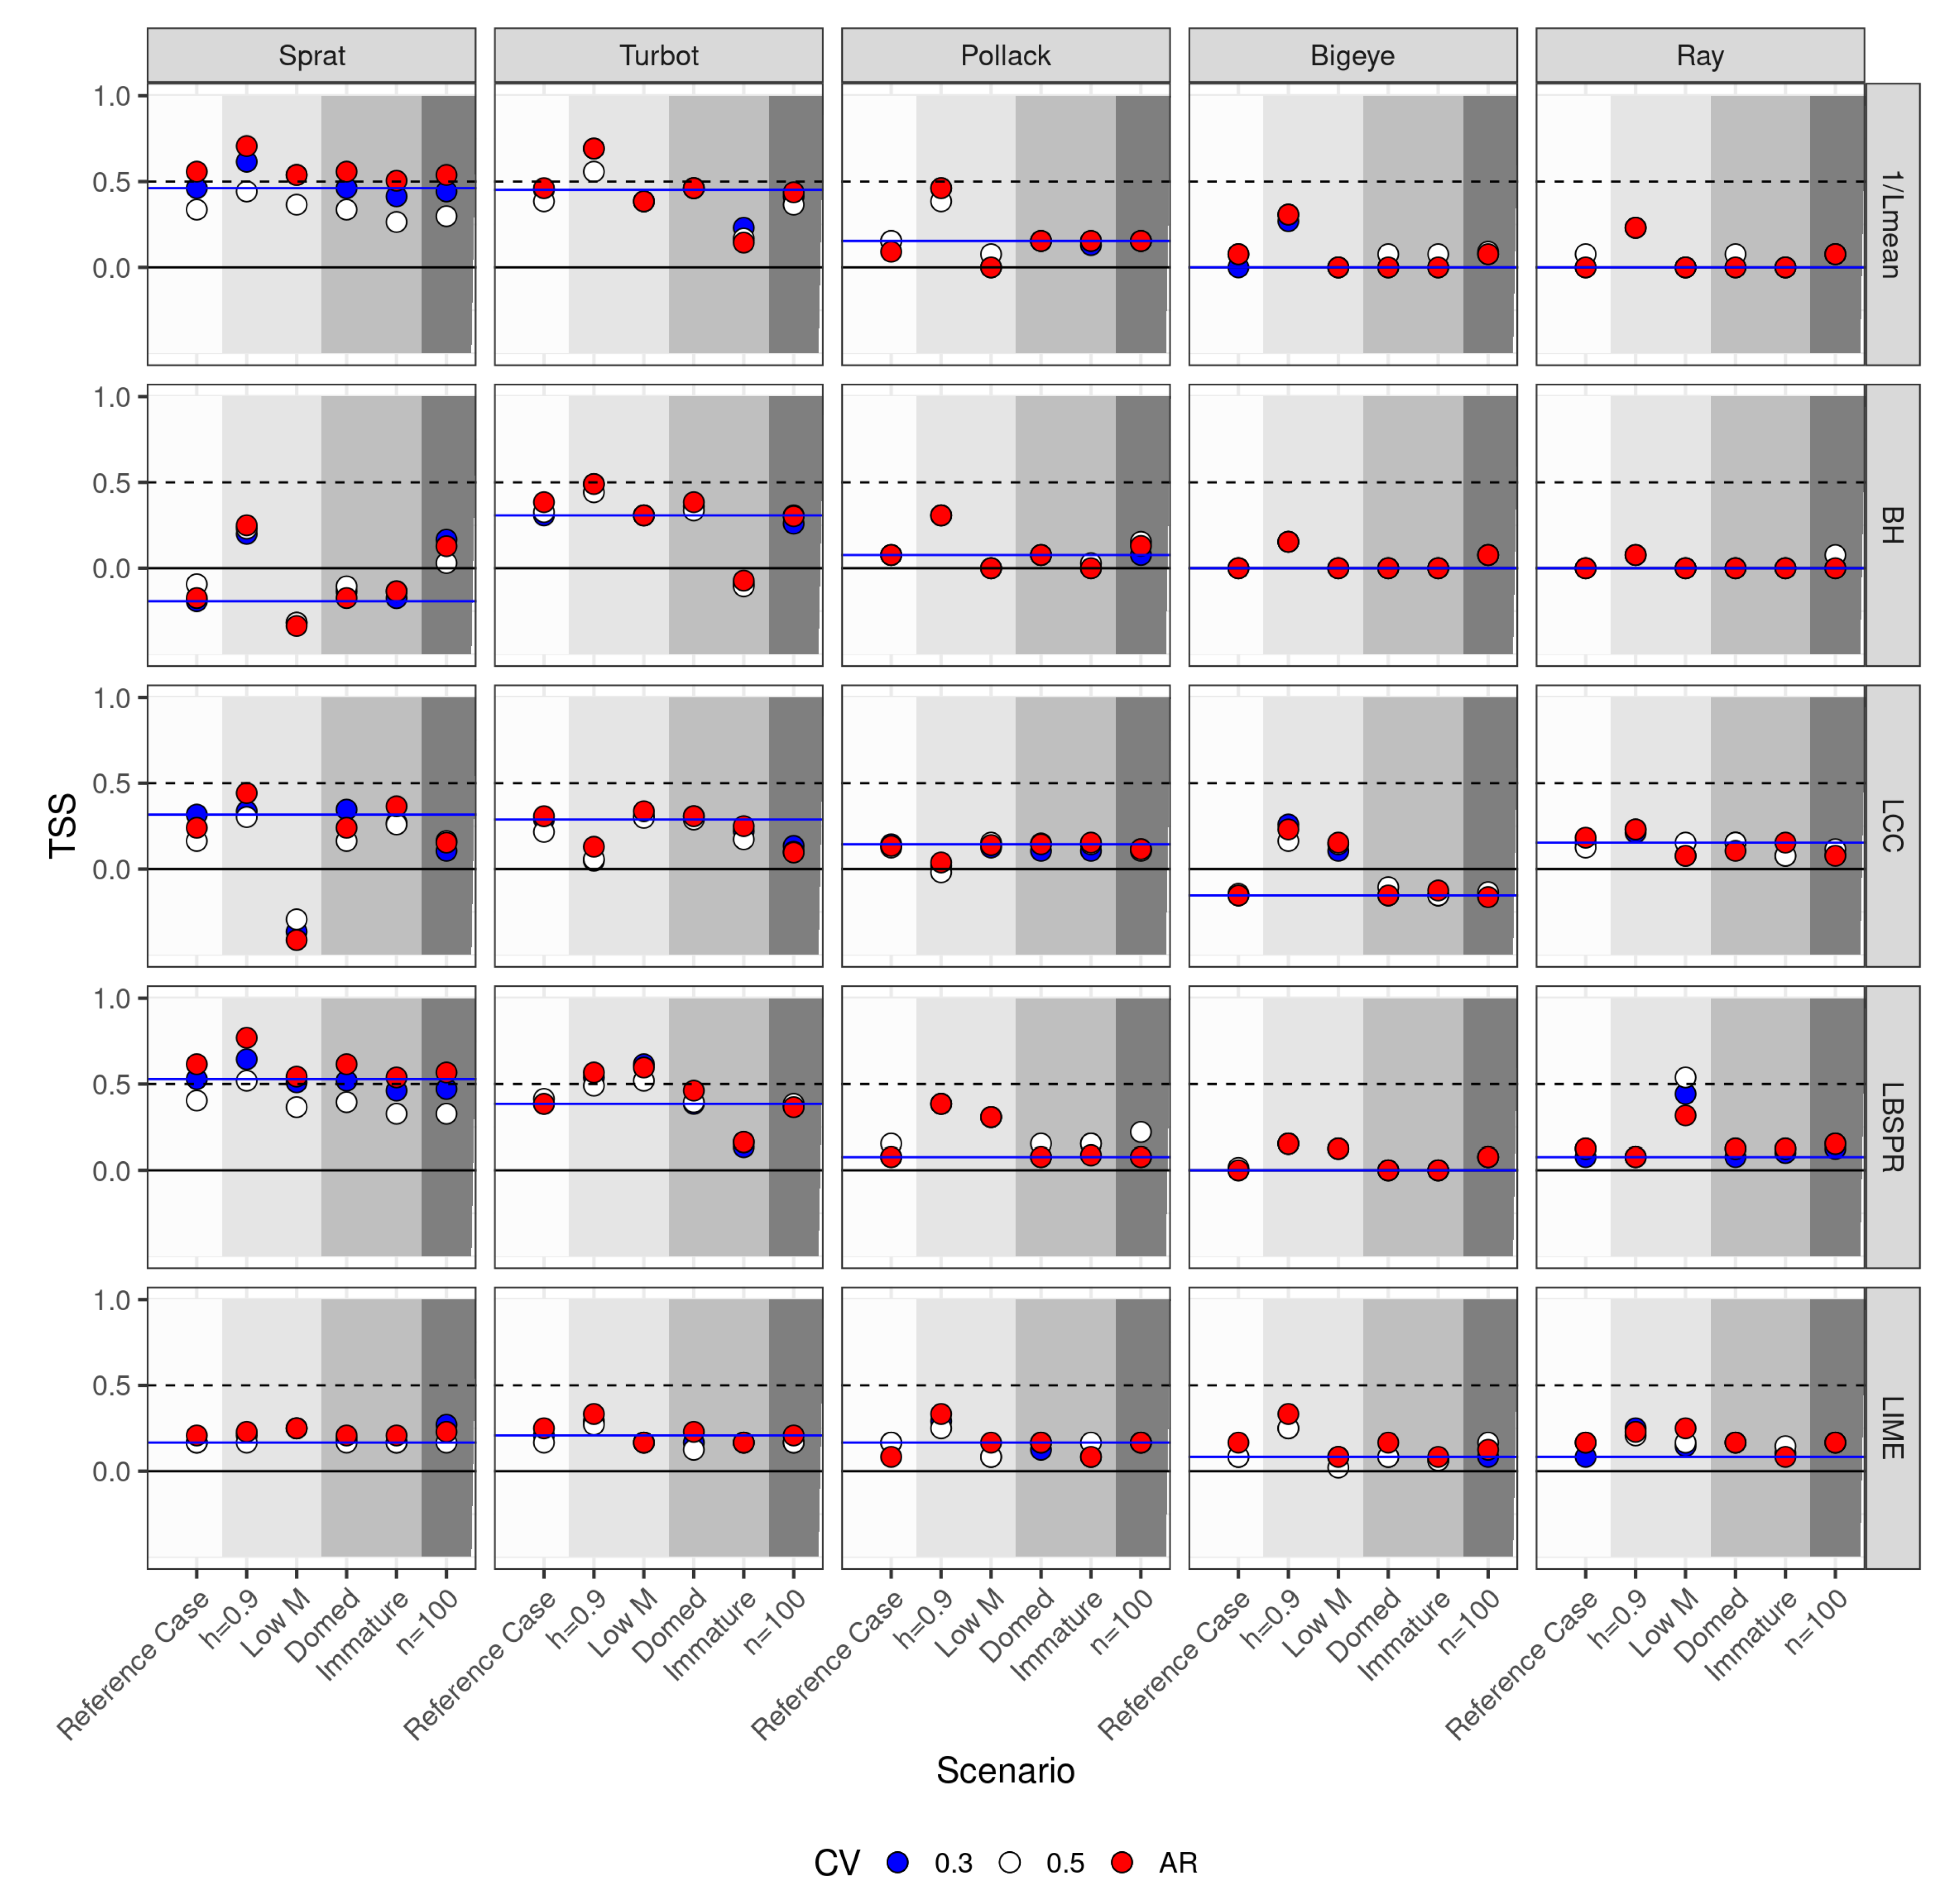

Table 1.
Parameters used in the Operating Model and their impact on key stock assessment metrics. This table demonstrates how changes in growth, maturity, and mortality parameters affect the assessment outputs.
Table 1.
Parameters used in the Operating Model and their impact on key stock assessment metrics. This table demonstrates how changes in growth, maturity, and mortality parameters affect the assessment outputs.
| Category | Parameter | BH | LCC | LBSPR | LIME | |||
|---|---|---|---|---|---|---|---|---|
| Growth | 🗸 | - | 🗸 | 🗸 | 🗸 | 🗸 | ||
| k | - | - | 🗸 | 🗸 | 🗸 | 🗸 | ||
| - | - | - | - | - | 🗸 | |||
| - | - | - | - | 🗸 | - | |||
| - | - | - | - | - | 🗸 | |||
| Mortality (M) | Mean | - | - | - | - | 🗸 | 🗸 | |
| Exponent | - | - | - | - | 🗸 | - | ||
| Maturity | - | - | - | - | - | 🗸 | ||
| Selectivity | - | - | - | - | 🗸 | 🗸 | ||
| - | - | - | - | 🗸 | 🗸 | |||
| Shape | - | - | - | - | Logistic | 🗸 |
Table 2.
Summary of Operating Model Scenarios with base case values highlighted. This table outlines the key parameters and assumptions used in the operating model to simulate different fishery management scenarios.
Table 2.
Summary of Operating Model Scenarios with base case values highlighted. This table outlines the key parameters and assumptions used in the operating model to simulate different fishery management scenarios.
| Parameter | Values |
|---|---|
| Steepness (H) | 0.7 (Base Case), 0.8, 0.9 |
| Recruitment Variability | Low, Medium, High |
| Natural Mortality (M) | 0.2, 0.25, 0.3 |
| Selectivity | Shifted, Logistic, Domed |
| Sample Size | 50, 100, 150 |
This table summarizes the key findings of the study, covering the performance of different methods, factors affecting their performance, insights about reference points, implications for fisheries management, and recommendations based on the study results.
Table 3.
Summary of Key Findings
| Aspect | Key Findings |
|---|---|
| Performance of Methods |
|
| Factors Affecting Performance |
|
| Reference Points |
|
| Implications for Management |
|
| Recommendations |
|
4. Discussion
Recent critiques of stock assessment methodologies have highlighted biases stemming from overly complex models that rely on poorly constrained parameters or arbitrary assumptions [38]. While simpler empirical models have been proposed as alternatives [39], their performance must be validated against independent observations rather than model outputs alone [8]. Therefore this study used a simulation framework to validate length-based approaches using pseudo-data generated by an Operating Model.
Length-based approaches are increasingly being used for assessing and managing data- and capacity-limited fisheries. Methods span a spectrum of complexity, from simple indicators based on mean length () to legacy estimators derived from Beverton and Holt to computational techniques such as Length-Based Spawning Potential Ratio (LBSPR) and Length-based Integrated Mixed Effects (LIME). In this study, and LBSPR demonstrated the best performance in tracking trends in exploitation. However, none of the methods provided robust estimates of in all cases evaluated. Classification skill was highest when evaluated against a baseline reference period where stock health was known. Notably, LIME, despite its advantage of not assuming equilibrium conditions, exhibited the least reliable performance. These findings show that increased model complexity does not necessarily translate into improved reliability or accuracy.
Guidelines for length-based methods often emphasise the importance of ensuring that older fish are vulnerable to capture. However, length frequency distributions are influenced by multiple factors beyond selection patterns, including whether a population is declining or recovering and the steepness of the stock-recruitment relationship. Depleted populations where recruitment potential is reduced (i.e. for low steepness) the absence of recruits (i.e. smaller fish) can be misinterpreted as reduced exploitation. Even when selection pattern assumptions are violated (is dome-shaped) trends can still be detected relative to a baseline. A critical challenge lies in accounting for shifts in spatial or temporal distribution that alter vulnerability to capture. Standardising length frequency data to mitigate potential biases introduced by such changes is essential for robust assessments.
It is crucial to distinguish between reference points used for performance evaluation (e.g., proxies) and control points that define management actions (e.g. as part of a HCR). Proxy reference points based on assumed natural mortality (M) may introduce bias if M is poorly estimated. Instead, using historical reference periods—when stocks were at desirable levels—can provide more reliable benchmarks for management [40]. Empirical HCRs based on observable trends (e.g., mean size or relative abundance) are often easier for managers and stakeholders to understand compared to model-based rules. However, both approaches should be rigorously tested within a Management Procedure (MP) framework using Management Strategy Evaluation (MSE) to ensure robustness under uncertainty.
Dynamic reference points that account for changes in stock productivity offer a promising alternative to static benchmarks. Such approaches are particularly relevant in contexts where environmental drivers or trends in natural mortality (M) significantly influence population dynamics. However, implementing dynamic reference points poses challenges related to institutional inertia, operational complexity, and uncertainty about whether observed productivity changes are transient or persistent. Using historical reference periods as benchmarks may provide a practical solution when productivity fluctuations are evident but difficult to quantify reliably. Additionally, adaptive management strategies that incorporate environmental variables into HCRs have been proposed as a way to enhance responsiveness to changing conditions [41].
5. Conclusions
Length-based approaches are valuable tools for managing data-limited fisheries, offering simplicity and practicality, particularly through methods like and LBSPR. These approaches effectively track exploitation trends but face challenges in providing robust estimates of . Importantly, increased model complexity does not guarantee better performance, emphasizing the need for careful method selection based on fishery-specific characteristics.
To enhance the reliability of length-based approaches: 1. **Reference Periods Over Proxies**: Historical reference periods reflecting desirable stock conditions are more reliable than proxies based on uncertain parameters like natural mortality (M). 2. **Data Standardization**: Length frequency data should be standardized to account for spatial or temporal shifts in species distribution that may bias assessments. 3. **Validation Through Simulation**: Simulations using operating models should test these methods under diverse scenarios to ensure their robustness before real-world application.
Integrating length-based approaches with complementary methods, such as catch-only models, could improve assessments by leveraging diverse data sources. Additionally, adopting dynamic reference points or adaptive harvest control rules (HCRs) could enhance responsiveness to environmental changes and shifting stock productivity.
The success of length-based methods depends on aligning their application with fishery-specific needs while maintaining transparency and simplicity in scientific advice. By addressing these considerations, length-based approaches can play a critical role in achieving sustainable fisheries management in data-limited contexts.
References
- Garcia, S.M. The ecosystem approach to fisheries: issues, terminology, principles, institutional foundations, implementation and outlook; Food & Agriculture Org., 2003; Vol. 443. [Google Scholar]
- Fulton, B.; Sainsbury, K. Foodweb Structure, the Hub Index and Identifying Species of Ecological Significance. SSRN 2024. [Google Scholar]
- Cirtwill, A.R.; Dalla Riva, G.V.; Gaiarsa, M.P.; Bimler, M.D.; Cagua, E.F.; Coux, C.; Dehling, D.M. A review of species role concepts in food webs. Food Webs 2018, 16, e00093. [Google Scholar] [CrossRef]
- Roa-Ureta, R.H.; Amorim, P.; Segurado, S. Probability ogives for trends in stock biomass and fishing mortality from landings time series. Fish and Fisheries 2024. [Google Scholar] [CrossRef]
- Sharma, R.; Winker, H.; Levontin, P.; Kell, L.; Ovando, D.; Palomares, M.L.; Pinto, C.; Ye, Y. Assessing the potential of catch-only models to inform on the state of global fisheries and the UN’s SDGs. Sustainability 2021, 13, 6101. [Google Scholar] [CrossRef]
- Ovando, D.; Free, C.M.; Jensen, O.P.; Hilborn, R. A history and evaluation of catch-only stock assessment models. Fish and Fisheries 2022, 23, 616–630. [Google Scholar] [CrossRef]
- Kell, L.T.; Kimoto, A.; Kitakado, T. Evaluation of the prediction skill of stock assessment using hindcasting. Fisheries research 2016, 183, 119–127. [Google Scholar] [CrossRef]
- Kell, L.T.; Sharma, R.; Kitakado, T.; Winker, H.; Mosqueira, I.; Cardinale, M.; Fu, D. Validation of stock assessment methods: is it me or my model talking? ICES Journal of Marine Science 2021, 78, 2244–2255. [Google Scholar] [CrossRef]
- Fischer, S.H.; De Oliveira, J.A.; Kell, L.T. Linking the performance of a data-limited empirical catch rule to life-history traits. ICES Journal of Marine Science 2020, 77, 1914–1926. [Google Scholar] [CrossRef]
- Kell, L.T.; Sharma, R.K.; Winker, H. Artefact and Artifice: Evaluation of the Skill of Catch-Only Methods for Classifying Stock Status. Frontiers in Marine Science 2022. [Google Scholar] [CrossRef]
- Vasilakopoulos, P.; O’Neill, F.G.; Marshall, C.T. The unfulfilled potential of fisheries selectivity to promote sustainability. Fish and Fisheries 2016, 17, 399–416. [Google Scholar] [CrossRef]
- Griffiths, C.A.; Winker, H.; Bartolino, V.; Wennhage, H.; Orio, A.; Cardinale, M. Including older fish in fisheries management: A new age-based indicator and reference point for exploited fish stocks. Fish and Fisheries 2024, 25, 18–37. [Google Scholar] [CrossRef]
- Kell, L.T.; Minto, C.; Gerritsen, H.D. Evaluation of the skill of length-based indicators to identify stock status and trends. ICES Journal of Marine Science 2022, 79, 1202–1216. [Google Scholar] [CrossRef]
- Fischer, S.H.; De Oliveira, J.A.; Mumford, J.D.; Kell, L.T. Risk equivalence in data-limited and data-rich fisheries management: An example based on the ICES advice framework. Fish and Fisheries 2023, 24, 231–247. [Google Scholar] [CrossRef]
- Miethe, T.; Reecht, Y.; Dobby, H. Reference points for the length-based indicator Lmax5 for use in the assessment of data-limited stocks. ICES Journal of Marine Science 2019, 76, 2125–2139. [Google Scholar] [CrossRef]
- Accounting, S.E.E. System of Environmental-Economic Accounting 2012, 2012.
- Roberts, L.; Stone, R.; Sugden, A. The rise of restoration ecology, 2009.
- Humphries, F.; Harden-Davies, H. Practical policy solutions for the final stage of BBNJ treaty negotiations. Marine policy 2020, 122, 104214. [Google Scholar] [CrossRef]
- Pons, M.; Cope, J.; Kell, L.T. Performance of catch-based and length-based methods in data-limited fisheries. Submitted, 2018; 1–17. [Google Scholar]
- Rudd, M.B.; Thorson, J.T. Accounting for variable recruitment and fishing mortality in length-based stock assessments for data-limited fisheries. Canadian Journal of Fisheries and Aquatic Sciences 2017, 1–17. [Google Scholar] [CrossRef]
- Hordyk, A.R.; Loneragan, N.R.; Prince, J.D. An evaluation of an iterative harvest strategy for data-poor fisheries using the length-based spawning potential ratio assessment methodology. Fisheries research 2015, 171, 20–32. [Google Scholar] [CrossRef]
- Beverton, R.; Holt, S. review of method for estimating mortality rates in exploited fish populations, with special reference to sources of bias in catch sampling. Rapports et Proces-Verbaux. 1956, 140, 67–83. [Google Scholar]
- Saltelli, A.; Bammer, G.; Bruno, I.; Charters, E.; Di Fiore, M.; Didier, E.; Nelson Espeland, W.; Kay, J.; Lo Piano, S.; Mayo, D.; et al. Five ways to ensure that models serve society: a manifesto, 2020.
- Hodges, J.S.; Dewar, J.A.; Center, A. Is it you or your model talking?: A framework for model validation; Santa Monica, CA: Rand, 1992. [Google Scholar]
- Rademeyer, R.A.; Plagányi, É.E.; Butterworth, D.S. Tips and tricks in designing management procedures. ICES J. Mar. Sci. 2007, 64, 618–625. [Google Scholar] [CrossRef]
- Gislason, H.; Daan, N.; Rice, J.; Pope, J. Does natural mortality depend on individual size. ICES 2008. [Google Scholar]
- Trippel, E. Estimation of stock reproductive potential: history and challenges for Canadian Atlantic gadoid stock assessments. Journal of Northwest Atlantic Fishery Science 1999, 25, 61–82. [Google Scholar] [CrossRef]
- Murawski, S.; Rago, P.; Trippel, E. Impacts of demographic variation in spawning characteristics on reference points for fishery management. ICES J. Mar. Sci. 2001, 58, 1002–1014. [Google Scholar] [CrossRef]
- Matsuda, H.; Fukase, K.; Kotaki, K.; Asano, K. Inconsistency between the per capita fecundity and estimate of the yearly egg production of the chub mackerel Scomber japonicus in Japan. FISHERIES SCIENCE-TOKYO- 1996, 62, 178–183. [Google Scholar] [CrossRef]
- Pauly, D. Fish population dynamics in tropical waters: A manual for use with programmable calculators; International Center for Living Aquatic Resources Management (ICLARM): Makati, Manila, Philippines, 1984; p. 325. [Google Scholar]
- Hordyk, A.; Ono, K.; Valencia, S.; Loneragan, N.; Prince, J. A novel length-based empirical estimation method of spawning potential ratio (SPR), and tests of its performance, for small-scale, data-poor fisheries. ICES Journal of Marine Science 2014, 72, 217–231. [Google Scholar] [CrossRef]
- Haddon, M.; Dichmont, C.; Klaer, N.; Pascoe, S.; Penney, A.; Smith, A.; Ward, P. Technical Reviews of Formal Harvest Strategies. Report, Australian Fisheries Management Authority, Canberra, Australia, 2012.
- Froese, R. Keep it simple: three indicators to deal with overfishing. Fish and fisheries 2004, 5, 86–91. [Google Scholar] [CrossRef]
- Lee, H.H.; Maunder, M.N.; Piner, K.R.; Methot, R.D. Estimating natural mortality within a fisheries stock assessment model: an evaluation using simulation analysis based on twelve stock assessments. Fish. Res. 2011, 109, 89–94. [Google Scholar] [CrossRef]
- Kell, L.; Mosqueira, I.; Grosjean, P.; Fromentin, J.; Garcia, D.; Hillary, R.; Jardim, E.; Mardle, S.; Pastoors, M.; Poos, J.; et al. FLR: an open-source framework for the evaluation and development of management strategies. ICES J. Mar. Sci. 2007, 64, 640. [Google Scholar] [CrossRef]
- McGranaghan, R.M.; Mannucci, A.J.; Wilson, B.; Mattmann, C.A.; Chadwick, R. New capabilities for prediction of high-latitude ionospheric scintillation: A novel approach with machine learning. Space Weather 2018, 16, 1817–1846. [Google Scholar] [CrossRef]
- Bloomfield, D.S.; Higgins, P.A.; McAteer, R.J.; Gallagher, P.T. Toward reliable benchmarking of solar flare forecasting methods. The Astrophysical Journal Letters 2012, 747, L41. [Google Scholar] [CrossRef]
- Froese, R.; Pauly, D. Taking stock of global fisheries. Science 2024, 385, 824–825. [Google Scholar] [CrossRef]
- Froese, R.; Winker, H.; Coro, G.; Palomares, M.L.; Tsikliras, A.C.; Dimarchopoulou, D.; Touloumis, K.; Demirel, N.; Vianna, G.; Scarcella, G.; et al. New developments in the analysis of catch time series as the basis for fish stock assessments: The CMSY++ method. Acta Ichthyologica et Piscatoria 2023, 53, 173–189. [Google Scholar] [CrossRef]
- Fischer, S.H.; De Oliveira, J.A.A.; Mumford, J.D.; Kell, L.T. Exploring a relative harvest rate strategy for moderately data-limited fisheries management. ICES Journal of Marine Science 2022, 79, 1730–1741. [Google Scholar] [CrossRef]
- Bentley, J.W.; Lundy, M.G.; Howell, D.; Beggs, S.E.; Bundy, A.; De Castro, F.; Fox, C.J.; Heymans, J.J.; Lynam, C.P.; Pedreschi, D.; et al. Refining fisheries advice with stock-specific ecosystem information. Frontiers in Marine Science 2021, 8, 602072. [Google Scholar] [CrossRef]
Disclaimer/Publisher’s Note: The statements, opinions and data contained in all publications are solely those of the individual author(s) and contributor(s) and not of MDPI and/or the editor(s). MDPI and/or the editor(s) disclaim responsibility for any injury to people or property resulting from any ideas, methods, instructions or products referred to in the content. |
© 2025 by the authors. Licensee MDPI, Basel, Switzerland. This article is an open access article distributed under the terms and conditions of the Creative Commons Attribution (CC BY) license (http://creativecommons.org/licenses/by/4.0/).
Copyright: This open access article is published under a Creative Commons CC BY 4.0 license, which permit the free download, distribution, and reuse, provided that the author and preprint are cited in any reuse.


