1. Introduction
The sustainability of marine fisheries has become a global concern due to increased fishing pressure and arbitrary exploitation, which can lead to negative consequences for ecosystems and societies (Mora et al., 2009). This situation is particularly the case in developing countries where appropriate management tools are still lacking. The West Africa region including the Mauritania-Senegalese zone, is one of these hotspot regions where fisheries management must be a priority (Meissa, Gascuel and Rivot, 2013). The ideal stock assessment would be able to estimate all of the key parameters related to population processes within a framework that assigns appropriate weight to the data, fits the data adequately, and captures all sources of uncertainty related to estimation, including model uncertainty, process uncertainty, and observation uncertainty (Punt, 2023).
The white grouper (Epinephelus aeneus) is one of the emblematic species of West Africa; it is one of the most coveted demersal fish species. In Mauritania and Senegal, the white grouper (or thiof in Senegalese local language) is intensively exploited by small scale fisheries, coastal and offshore to a lesser extent (Meissa, Gascuel and Rivot, 2013; Bâ et al., 2018). The Senegalese and Mauritanian fisheries exploit the same white grouper species but have relatively different exploitation histories. In Senegal, the white grouper fishery is very old (since the 1970s), while it is relatively recent in Mauritania (since the 1980s). However, in terms of catches, small scale fishery represents more than 70% of the catches of white grouper in the sub-region. Moreover, this fishery uses more selective gears such as lines and longlines which capture larger individuals. On the other hand, the nets used by the artisanal fishery and industrial fishery trawls tend to capture smaller individuals.
Champagnat and Domain (1978) assume that adults of this species migrate from Cap Blanc on the northern border of Mauritania to Cape Roxo in southern Senegal. Nevertheless, mainly for practical reasons (i.e., the difficulty of merging data from these two countries), all attempts to assess the status of the stock have, until recently, been conducted at national scale i.e., in Mauritania by Meissa, Gascuel and Rivot, 2013 and in Senegal by Laurans (2005) and Bâ et al., (2018). However, the FAO CECAF North working group regularly assesses white grouper as a single stock between Mauritania, Senegal and The Gambia.
All assessments performed will help us to better analyze changes in the abundance of the White grouper stock in the North-West Africa. In our study, we aim to: (1) quantify the impact of fishing on this resource by applying recent and appropriate stock assessment tools, (2) establish the diagnosis of the status of White grouper stock, and (3) propose the most appropriated measures that should be considered as a priority for ecosystem approach to fisheries management. This work is so based on a large compilation of the data available in the databases of the two countries in addition to the collection of new data within the framework of the European Demerstem/PESCAO project.
The challenge of this paper was to carry out an assessment on the scale of the North-West African sub-region. This assessment performed by aggregating data from three countries (Mauritania, Senegal and The Gambia). It gave us a global diagnostic of the exploitation level of the White grouper stock. It also showed the specific nature of the fisheries in Mauritania and Senegal. The results could contribute to a concerted management of the white grouper fishery on a sub-regional scale. Thus, two stock-assessment models are used: (i) the surplus production model fitted in a Bayesian statistical framework called JABBA (Just Another Bayesian Biomass Assessment; Winker et al., 2018) and (ii) the Length-based Bayesian Biomass (LBB) were used. The JABBA model used updated catches and CPUE time series standardized from 1980 to 2021 and series of abundance indices from scientific campaigns standardized by the Delta-GLM model over the period 1980-2019. And the Length-based Bayesian Biomass (LBB) approach is used to analyze length frequency data from exploited fish or invertebrate populations in which all relevant parameters are estimated synchronously using Bayesian Monte Carlo Markov Chain (MCMC) approach (Froese et al., 2018, 2020). The LBB model is used to enrich the results and makes it possible to address the appropriate management measures based on the size limits and the impact of the gear used in each country. These models were fitted to data, revealing the impact of fishing on stock abundance and changes induced by fishing in the demersal community. Results are discussed from a fisheries management perspective.
2. Data and Methods
2.1. Data Used
Several data sources were used for this study from both countries: Catch and length frequencies data from scientific survey and commercial fishery.
Table 1 presents a summary of all data and their availability along the different periods.
2.1.1. Catch Data
In Mauritania, scientific surveys consider all of the demersal surveys undertaken along the Mauritanian continental shelf between 1982 and 2019, totaling 89 surveys and 7496 trawls. Two vessels were used during this period, N’Diago (1982- 1996) and Al-Awam (1997-2019) and recent years weren’t sampled for vessel availability issues. Each observation corresponds to one trawl with an average horizontal opening of 17 m dragged at a trawl speed of 3.2 knots, for a standard duration of 30 min. The fishing gear was modified in 1989 and hence the correction coefficients estimated by Gascuel et al. (2007), using data from inter-calibration surveys reported by Girardin et al. (1990), were applied to data gathered prior to that date.
Since 1970, scientific surveys have been conducted on the Senegalese continental shelf. While the oldest ones mainly focused on the study of fish biology, L. Amaro (1970-1974), since the 1980s these surveys aim to provide a fishery-independent measure of fish distribution and abundance of all the species that can be sampled by bottom trawl (Laurans 2005). Twenty-four surveys covering the whole continental shelf, from 10 to 200 m deep, and using the same sampling protocol were considered in the current analyses (sampling design of the surveys are described in Laurans et al. (2003). They cover a 23 years period of time, from 1986 to 2016 (with missing years,
Table 1), and gather 2675 hauls. Catches per trawl haul (30 min) were used to estimate survey abundance indices.
The Mauritanian and Senegalese artisanal fisheries data are respectively collected by IMROP (2006–2018) and CRODT (1974–2018). They are aggregated by year, month, landing site, and fishing gear over the period.
Given the multitude and diversity of artisanal fishing gears, only those targeting thiof (high landings of thiof) have been retained and grouped into homogeneous and coherent sets to estimate the CPUE:
In Senegal:
- -
Lines : The pirogue glacier line (LPG); the octopus’s line (LPO); the single line of motorized pirogues (LSM); the single line of non-motorized pirogues (LSNM) and the longline (PAL);
- -
Nets: The bottom set net (FD), the bottom drift gillnet FMDF and the trammel net (TM).
In Mauritania:
- -
Handline targeting demersal fish
- -
Jig to target the Octopus vulgaris and demersal fish
2.1.2. Length Frequencies Data
In both countries, several scientific survey sampling length frequencies were conducted between 1987 and 2019. However, there is a lack of data for the earlier years.
In Senegal, the data provided are landings from small scale fisheries targeting thiof for the period 1974–2018. The gear with the most consistency and availability were the lines. Samples were selected upon the regions with the highest sampling coverage (Cayar, Saint Louis and Saloum) and extrapolated with the annual catch. Data were aggregated by 4-years to produce homogeneous groups with the same data size. In addition, for both countries, a biological sampling was conducted during the DEMERSTEM project (2019-2020), and data collected were added to the analysis.
2.2. Abundance Indices
In this study, the spatio-temporal dynamics of the stock abundance are analyzed using linear modeling of the Delta-GLM type. The Delta-GLM model is used to calculate annual abundance indices and determine a spatio-seasonal distribution pattern for thiof. Then, these abundance index are used within the surplus production model JABBA (Winker et al., 2018) in order to produce a stock assessment.
Abundance indices are generally estimated from observation data from scientific surveys or from fishing statistics from commercial fleets. In both cases, estimating indices of abundance remains a relatively complex task, particularly in view of the often highly unbalanced sampling design. It is therefore clear that the methods used are often not statistically optimal, which can lead to biased estimates and/or very high uncertainties (Meissa, Rivot and Gascuel, 2008; Meissa, Gascuel and Rivot, 2013). In addition, data with high prevalence of zeroes and skewed distributions can be problematic for fitting typical distributions and modeling the effects of factors (Stefansson 1996; Le Pape et al., 2003). One solution to this problem is to apply a Delta-GLM model (Stefansson, 1996; Le Pape et al., 2003). This model is obtained by combining two sub-models: i) one to model the absence and presence of the species in the trawl hauls; ii) the other to model positive values of CPUE (Laurans, 2005; Meissa, Gascuel and Rivot, 2013). Hence, the delta model is the product of a binomial GLM sub-model, which estimates the presence/absence probability of each taxon/species during a sea-trip or trawl haul and a Gaussian GLM sub-model on log-transformed non-null values of raw CPUE or densities per trawls corrected with Laurent (1963) formula in order to obtain unbiased values of the expected abundance index (for more details, see Meissa, Gascuel and Rivot, 2013).
For standardization issues among countries, abundance indices were analyzed and produced separately. Hence, for each country, two series of annual abundance indices were estimated using a Delta-GLM; one is based on CPUE from commercial artisanal fisheries data, the other from scientific surveys.
Variables and their modality used in the calculation of abundance indices using the Delta-GLM model are presented in the
Table 2. For each model, the variables with significant deviances were retained in the estimation of abundance indices and the model with the lowest AIC was considered.
Pap. ICCAT 75, 2129–2168.
In addition to the abundance series, maps were produced by extracting abundances indices by strata and region from the scientific models to examine spatio-temporal distribution patterns over a 10 and 4-years period.
2.3. Stock Assessment Methods
2.3.1. Just Another Bayesian Biomass Assessment (JABBA)
JABBA is a documented open-source R package (
www.github.com/JABBAmodel) that has been applied recently on several ICCAT stocks like swordfish, Atlantic shortfin mako swordfish albacore, blue marlin Atlantic white marlin, yellowfin tuna, Atlantic bigeye tuna (Winker et al., 2018; Winker et al., 2019).
The stock assessment is performed in a Bayesian framework using the JABBA package (Winker et al., 2018) which allows an analysis based on the Pella Tomlinson model with the following equation:
With r the intrinsic growth rate, K the biotic capacity of the environment and m a shape parameter determining for which ratio B/K the maximum surplus production is reached.
Based on the work of Meyer and Millar (1999), the process equation is rewritten in a stochastic model with variables expressed as biomass depletion formulated as the proportion of the stock biomass at time t to its biomass in the pristine state (
=
). The initial biomass depletion estimated by introducing the parameter. The latent space equation is then:
where
is the process error, such as
,
is the catch of the year
. The observational model connects the latent space to the abundance index
assuming it is proportional to biomass. The observation equation is then:
With the catchability coefficient and the observation error such as with the variance of the observation error in year for the AI serie . The full latent space Bayesian model requires a joint probability distribution over all unobservable hyper-parameters Θ and the process errors related to the vector of latent states related to all observational data in the form of relative abundance indices ,.
As suggested by Winker et al. (2018), most priors are stock-specified. Informative priors were considered for
and
, whereas other parameters were a priori distributed following weakly informative distributions.
Table 3 describes the priors specified for each parameter. For
, this distribution corresponds to the value calculated in FishBase (
http://www.fishbase.org) with FishLife package. Concerning
, it was established from previous analysis in pseudo-equilibrium.
was implemented considering results from Meissa et al. (2013) and Bâ et al. (2018), which both described a value around 25 000 tons for the
in their country. In the current study we considered a value of 30,000 with a lognormal distribution of strong right asymmetry for a consideration of values above the average. All catchability parameters were formulated as uninformative uniform priors.
In addition to a total catch time series from Gambia, Mauritania and Senegal, four abundances indexes were made available from the Delta-GLM analysis (
Figure 1) on the 1974–2018 period. Based on the empirical equation described by Palomares and Pauly (2019), abundance indices from commercial CPUE are corrected by assuming a yearly increase of mean fishing power
.
where and are the first and last year of the data series, and is the annual rate of increase in the artisanal fishery fishing power. Creep in fishing power allows to include an intensification of fishing effort through improvements in techniques (e.g., experience of fishermen, organization of work, etc.) and/or technologies (e.g., evolution of gear, improvement of equipment such as GPS, motorisation,) leading to an increase in the efficiency of the nominal unit of fishing effort (Thiao et al., 2012).
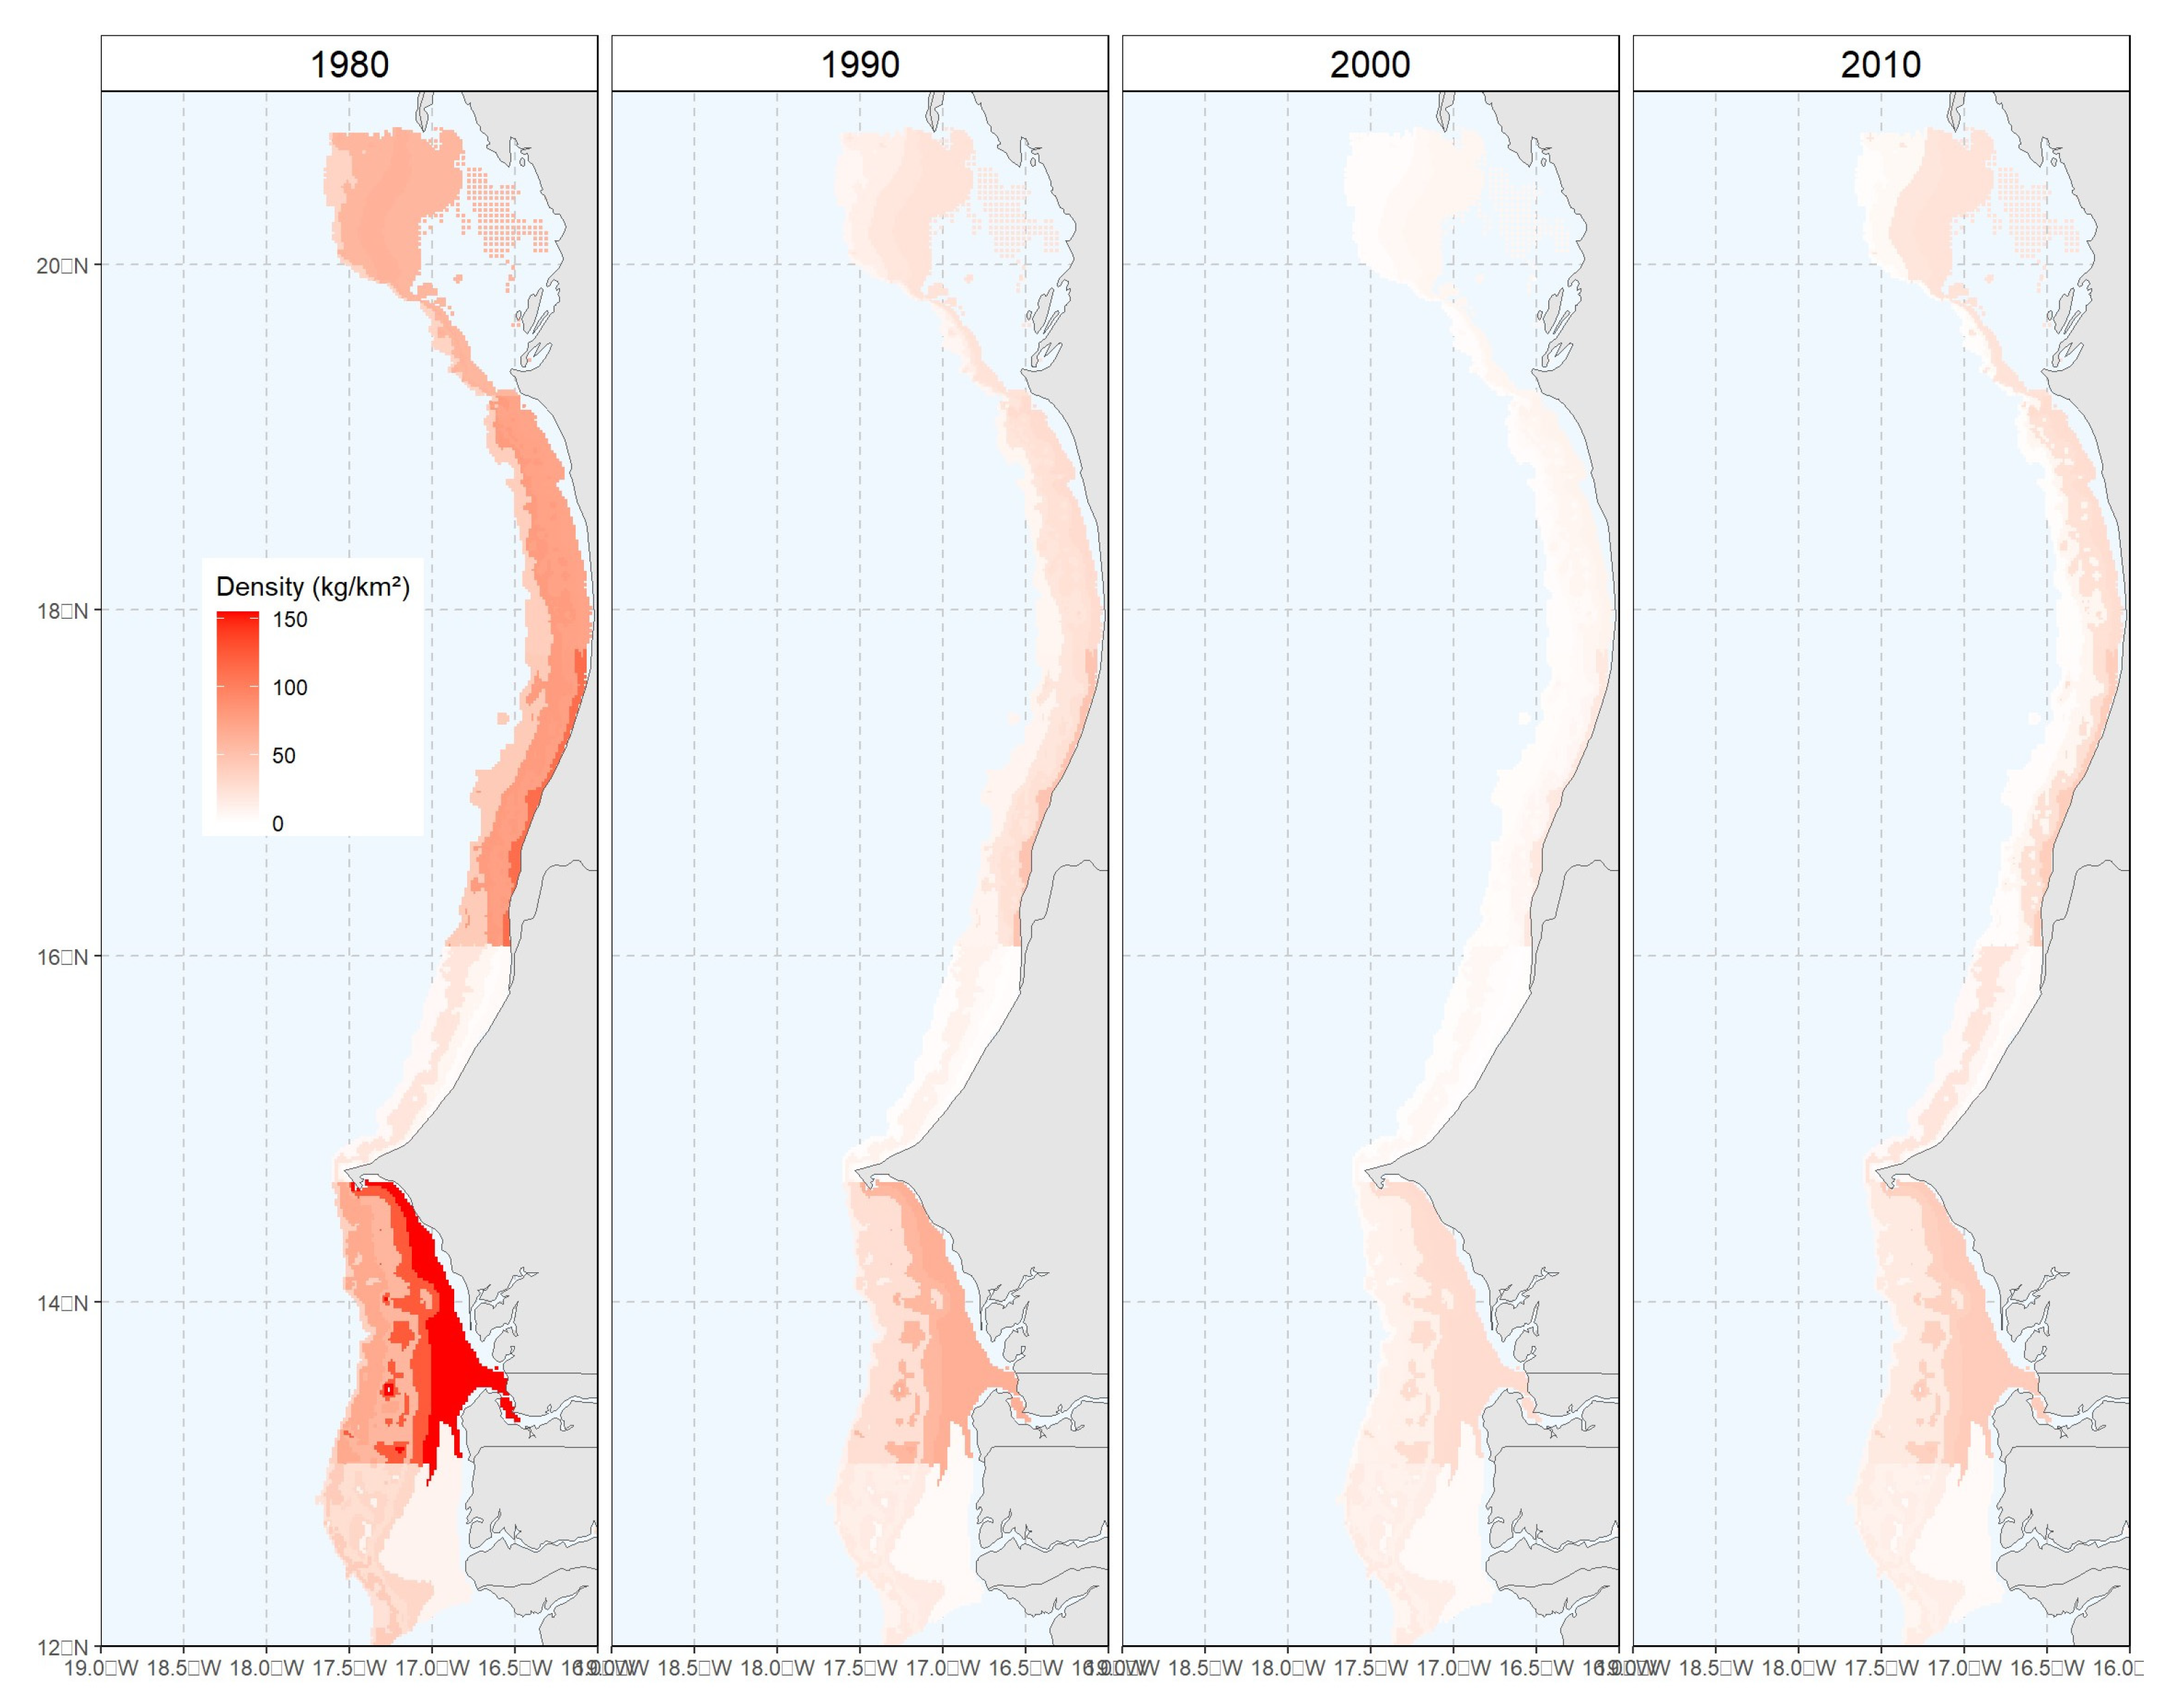
Figure 1.
White grouper density distribution predicted from Delta-GLM model.
Figure 1.
White grouper density distribution predicted from Delta-GLM model.
Considering the Equation (4) given an increase of average creeping of vessels fishing power, two scenarios are computed to assess the sensitivity of the results depending on the value of : 1% for optimistic case, and for pessimistic case, leading to 3% for Artisanal_SEN and 7% for Artisanal_MRT.
In both countries, the change of vessel, that occurred respectively in 1996 and 2000 in Mauritania and Senegal, did not result in an inter-calibration campaign (Gascuel et al., 2007). Hence, by defining 2-time blocks (early and late) for each survey, the model will estimate a different catchability. In addition, by observing the strong variations in the Mauritanian survey abundance index, a bigger fixed CV is implemented for the
‘early’ period, as well as for the year 2004 and 2005, and the commercial CPUE (
Table 4). A fixed observation error of 0.1 is added for each abundance indices.
To evaluate CPUE fits, the model predicted CPUE indices were compared to the observed CPUE. JABBA residual plots were also examined, and the randomness of model residuals was evaluated by means of the Root Mean-Squared-Error (RMSE; Carvalho al., 2017).
Finally, to verify systematic bias in the estimation of B or F, a retrospective analysis was conducted for the last 8 years of the assessment to evaluate whether there were any strong changes in model results based on data availability. The selected period for the retrospective was intended to cover the most recent trend identified in Figure S1 (2010-2018). In addition, hindcasting analysis was also done over the same period to assess the model predictive skills by computing the MASE score (Hyndman and Koehler, 2006).
With, Yt is the one-step-ahead forecast of the expected value for the observation at time t based on the model conditioned with data up to time t-1.
A MASE score > 1 indicates that the average model forecasts are worse than a random walk. Conversely, a MASE score of 0.5 indicates that the model forecasts twice as accurately as a naïve baseline prediction; thus, the model has prediction skill (Carvalho et al. 2021).
2.3.2. Length-Based Bayesian Biomass
LBB is a new Bayesian size-based approach (Froese et al., 2018) for estimating stock status in data-constrained situations. LBB requires no input data in addition to size frequency data, but offers the user the possibility to specify a priori distributions for the asymptotic estimable parameter size (), length at first capture () and relative natural mortality (). In addition, relative fishing mortality () is estimated as the average of the age range represented in the size frequency sample. Using these parameters as inputs, standard fishing equations can be used to estimate depletion or the currently exploited biomass relative to the unexploited biomass (). In addition, these parameters can be used to estimate the length at first catch that will maximize catch and biomass for a given fishing effort () and to estimate an approximation of the relative biomass capable of producing maximum balanced catches ().
The following equation describes the framework for estimating stock status from
and
(Froese et al., 2016; Meissa et al., 2021). First, given the estimates of
and
,
, i.e., the size at which the cohort biomass is at its maximum, can be obtained from Equation (6):
Based on Equation (7) and a given fishing pressure (
), the average length at first catch, which maximises catch and biomass (
), can be obtained from:
Then, estimates are used to calculate an approximation of the relative biomass that can produce MSY (Froese et al., 2018).
A sensitivity analysis was performed on the Linf values. The values used are respectively 106 cm, 94 cm and a value calculated by LBB by default. The first value comes from the results of growth analysis by the Shepherd method applied to the size frequency data collected by the DEMERSTEM project between 2019 and 2020 in Mauritania and the second value comes from the application of the shepherd’s method on data from Senegal.
3. Results
3.1. Delta-GLM Model and Abundance Indices
The Delta-GLM fitted to commercial CPUEs and to scientific surveys data indicate the existence of significant interannual change (
Table 4) and provide consistent trends among countries and between data sources, excepted in the recent years where dissimilarities are denoted. In fact, AI are reducing from 1975 to 2005, when minimal values are observed, followed by an increase until 2014 (Figure S1). Then signals are quite different, with 2 years time-lapse between Senegal when comparing Mauritanian scientific survey with Senegalese artisanal CPUEs, which is in advance on Mauritania and where artisanal CPUE indicates a constant increase.
Maps of mean density and biomass over 10-years period denote the same signals (
Figure 1), with higher values in Mauritania in the early period, before depleting during 20 years and finally rising in the recent years. It also appears density and biomass are higher in the deeper strata in Senegal, excepted in the North, where the pattern is a mix between Senegal and Mauritania with highest density in the first layer, that is increasing again around 60 to 100 m depth, hence highlighting a transition zone in the predicted spatial distribution between the 2 countries.
3.2. Evaluation
3.2.1. JABBA
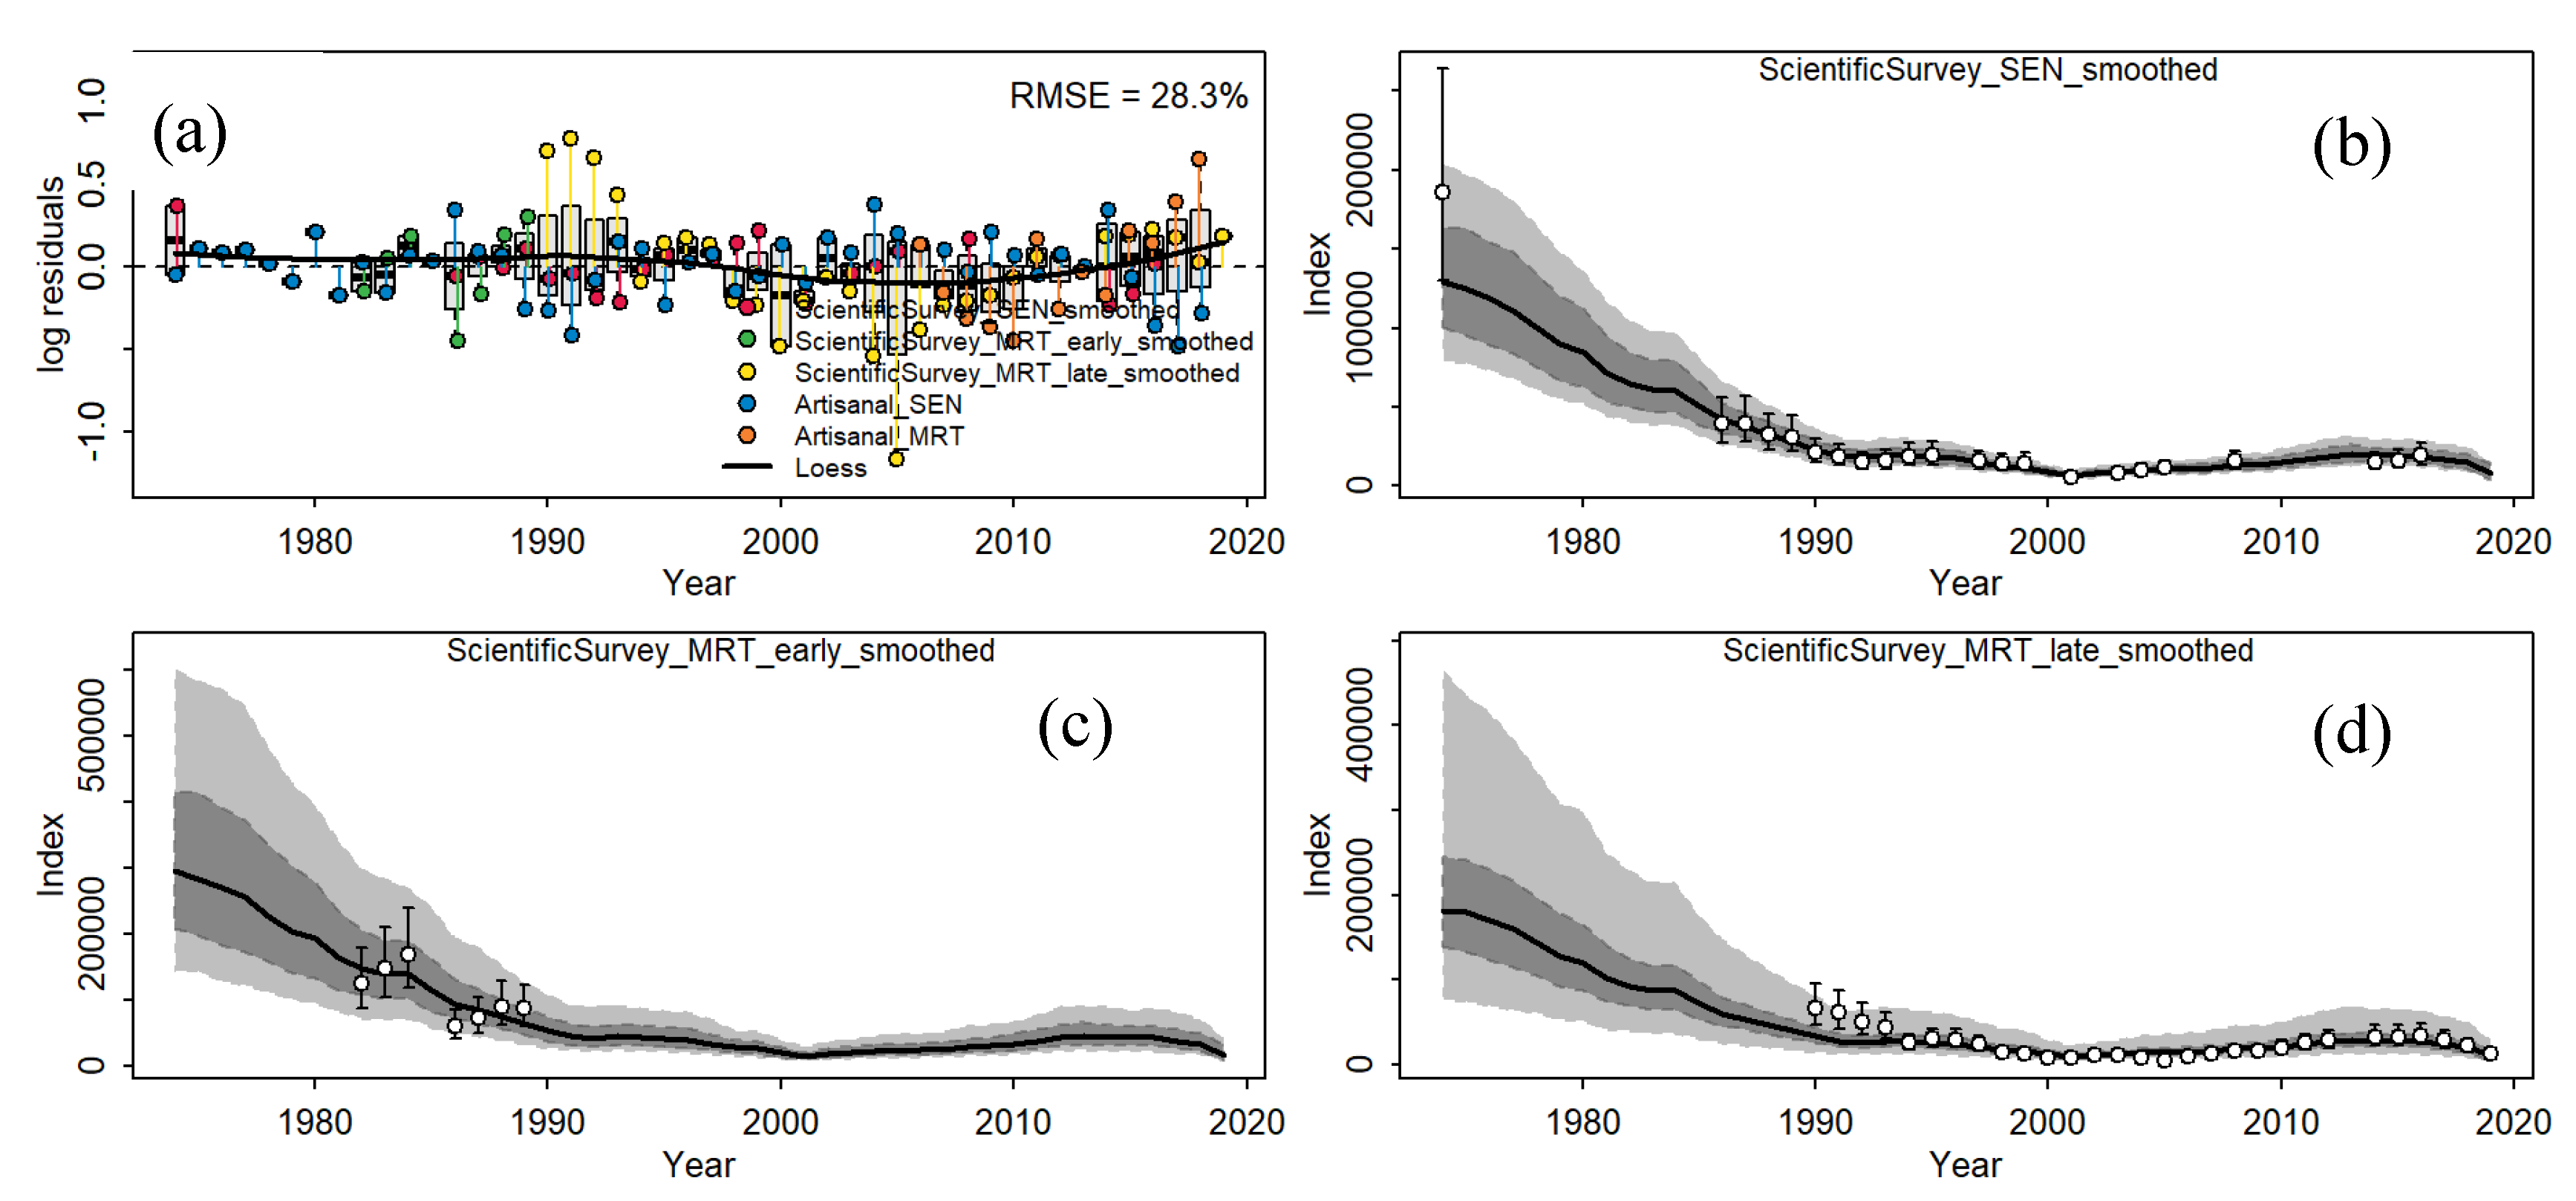
The JABBA model selected as the base case for the thiof in MRT-SEN was established by including all CPUE indices available and splitting the Mauritanian and Senegalese surveys into 2 CPUEs, resulting in an improved RMSE and the model showed a significant difference in catchability between the defined time blocks in Mauritania and a slight one in Senegal (
Figure 2). Both models passed convergence and run test diagnostics (Figure S2 and Figure S3). Still, fitting presents some misspecifications (
Figure 2).
For both scenarios (pessimistic and optimistic), models were able to converge adequately as judged by the Geweke (1992) and Heileldelberger and Welch (1983) diagnostic tests implemented in JABBA (Winker et al., 2018). Moreover, the visual inspection of trace plots of the key model parameters showed good mixing of the three chains (i.e., moving around the parameter space), also indicative of convergence of the MCMC chains and that the posterior distribution of the model parameters was adequately sampled with the MCMC simulations.
RMSE value indicated a relatively low precise model (28.3%,
Figure 2). The boxes indicated huge discrepancies between abundances indexes mainly when the Mauritanian survey took place, denoting conflicting information. Loess-smoother highlight slightly auto-correlated residual patterns in the beginning, and the residuals run tests implemented in JABBA (Carvalho et al., 2021) showed there was no evidence (p > 0.05) to reject the hypothesis of randomly distributed residuals for all CPUE times series fit in both scenario models, with a very few points exceeding the 3-sigma rule indicating outliers (Figure S3).
The fits of the abundance indices were varied but generally within restricted 95% confidence intervals (CI). Overall, trends in observed and predicted CPUE were notably consistent for most indices (Figure S4), with the exception of the late period (2010-2018) during which abundance trends are currently shifting and, as stated previously, revealing conflicting information between countries and data sources (CPUE and survey). The routine JABBA output plot, showing the posteriors and the assumed prior distribution for the key parameters provided no evidence of severe prior misspecification (Figure S2)
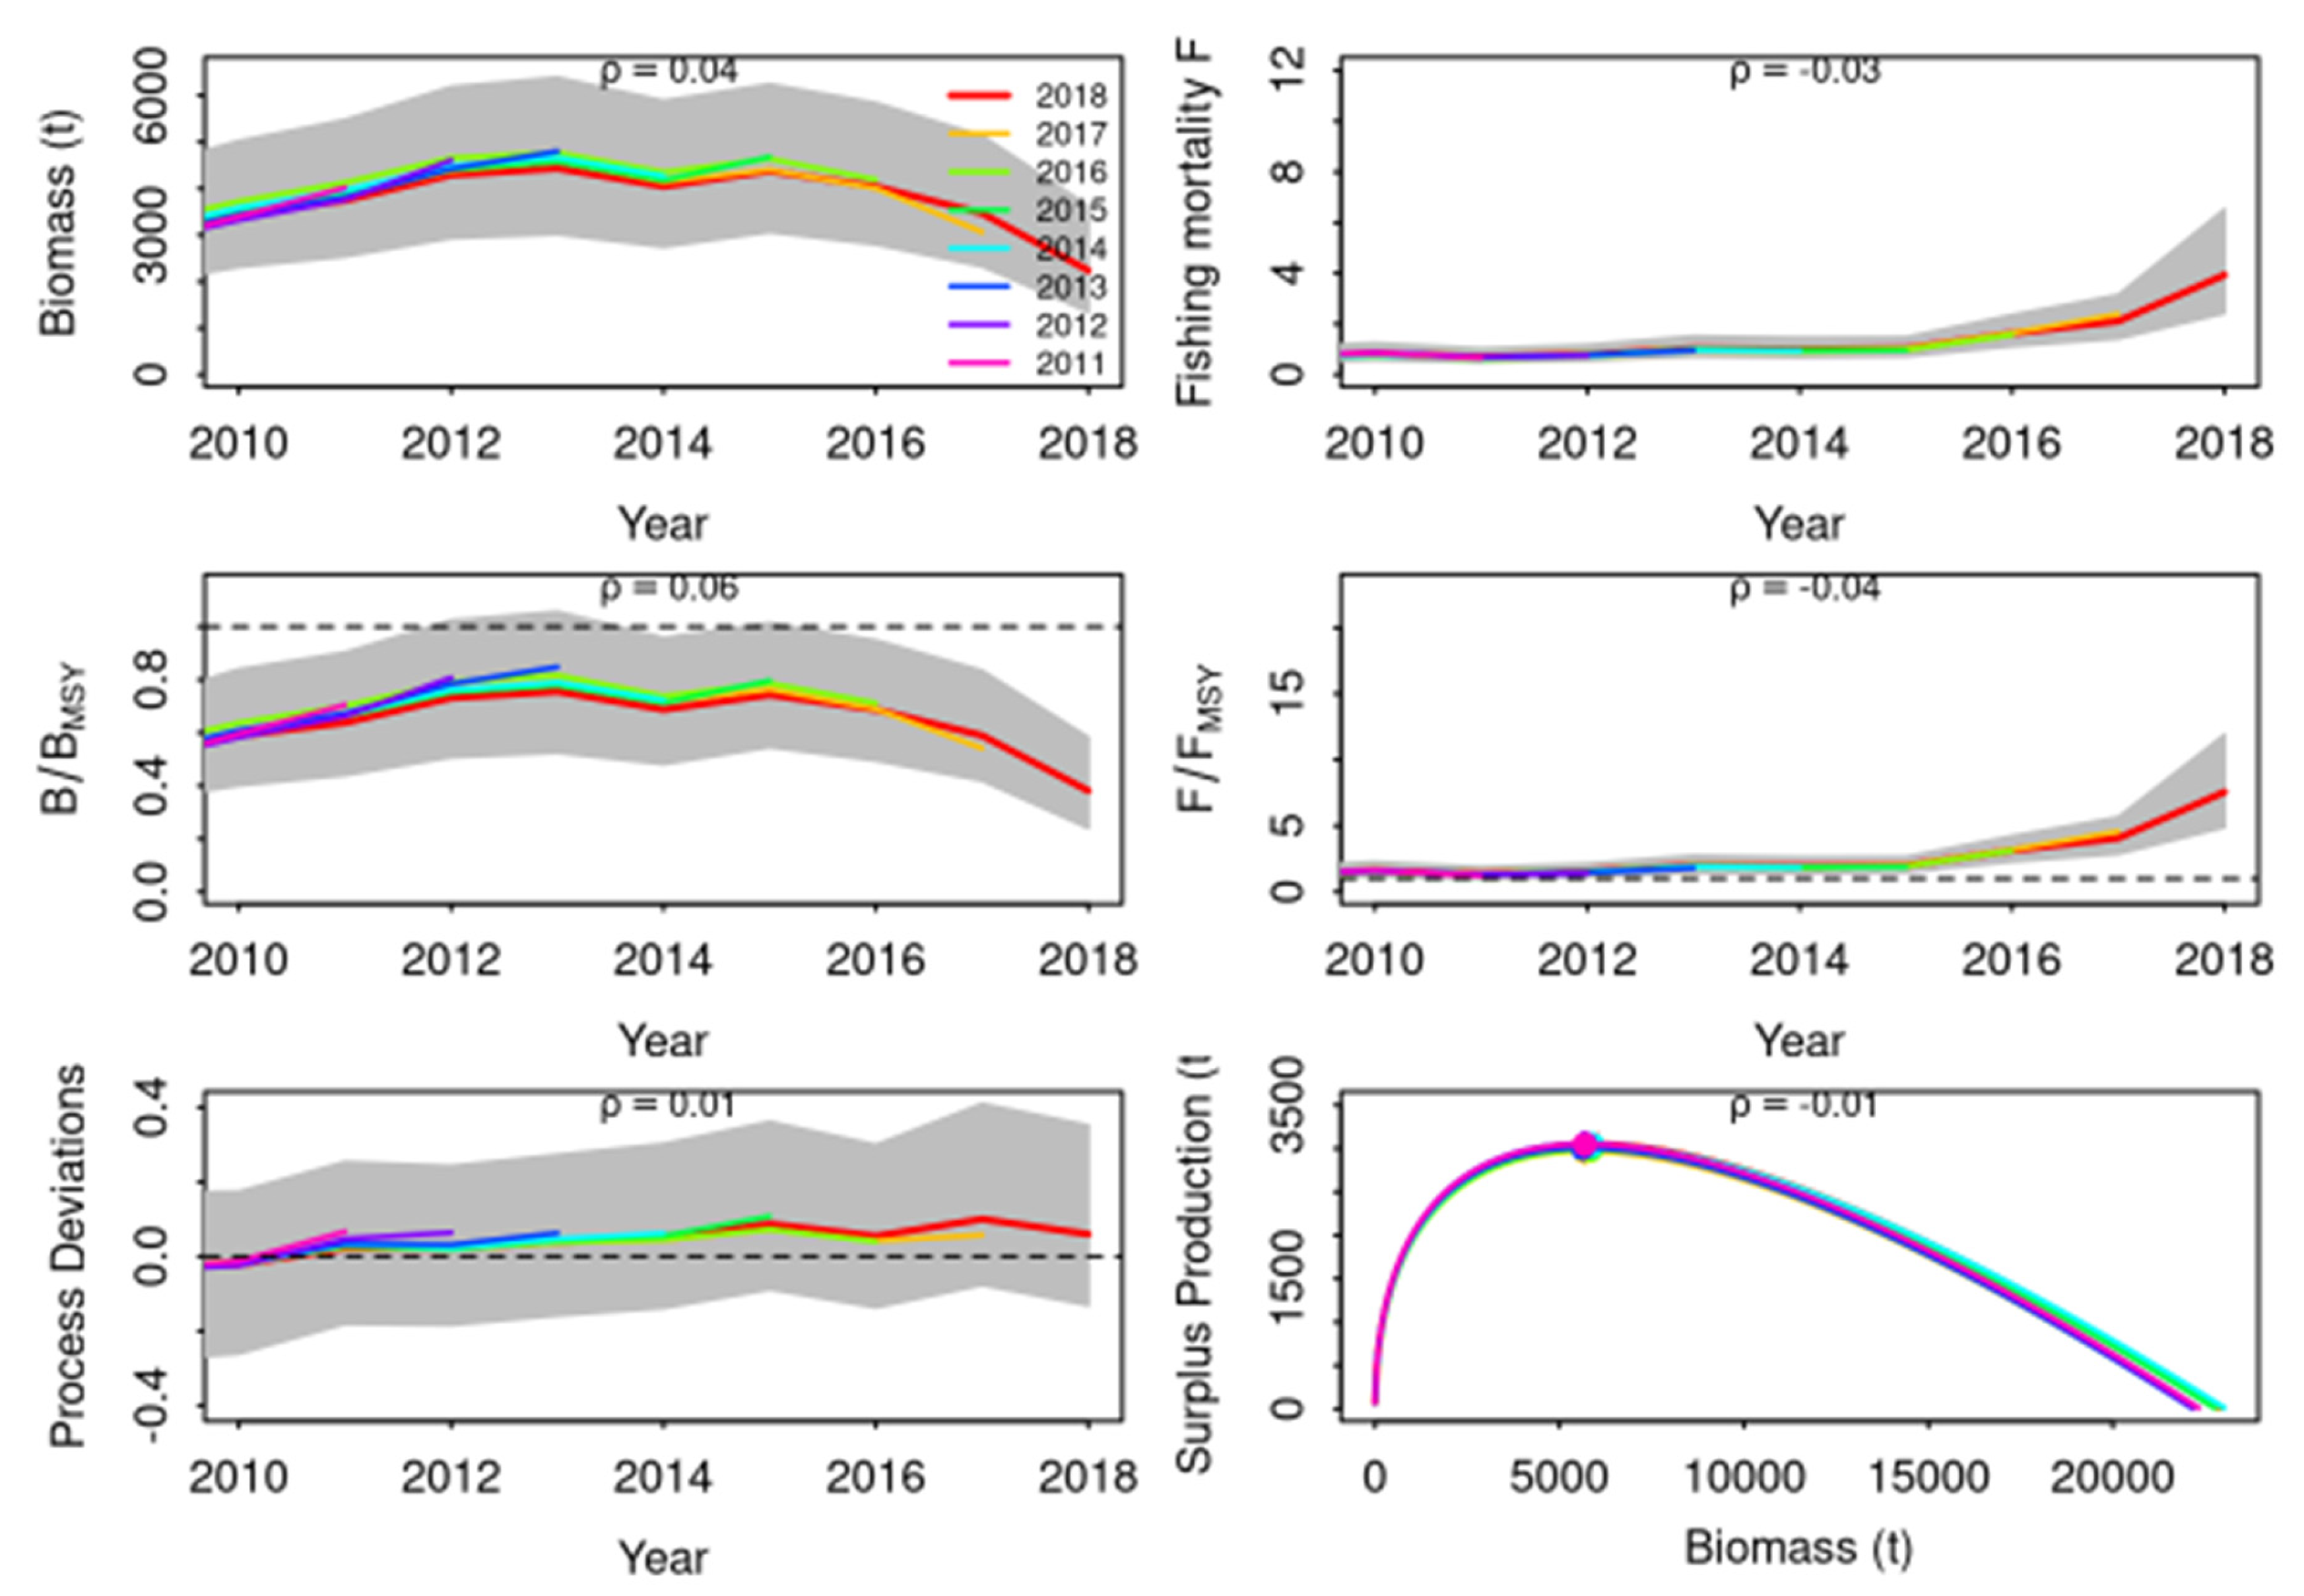
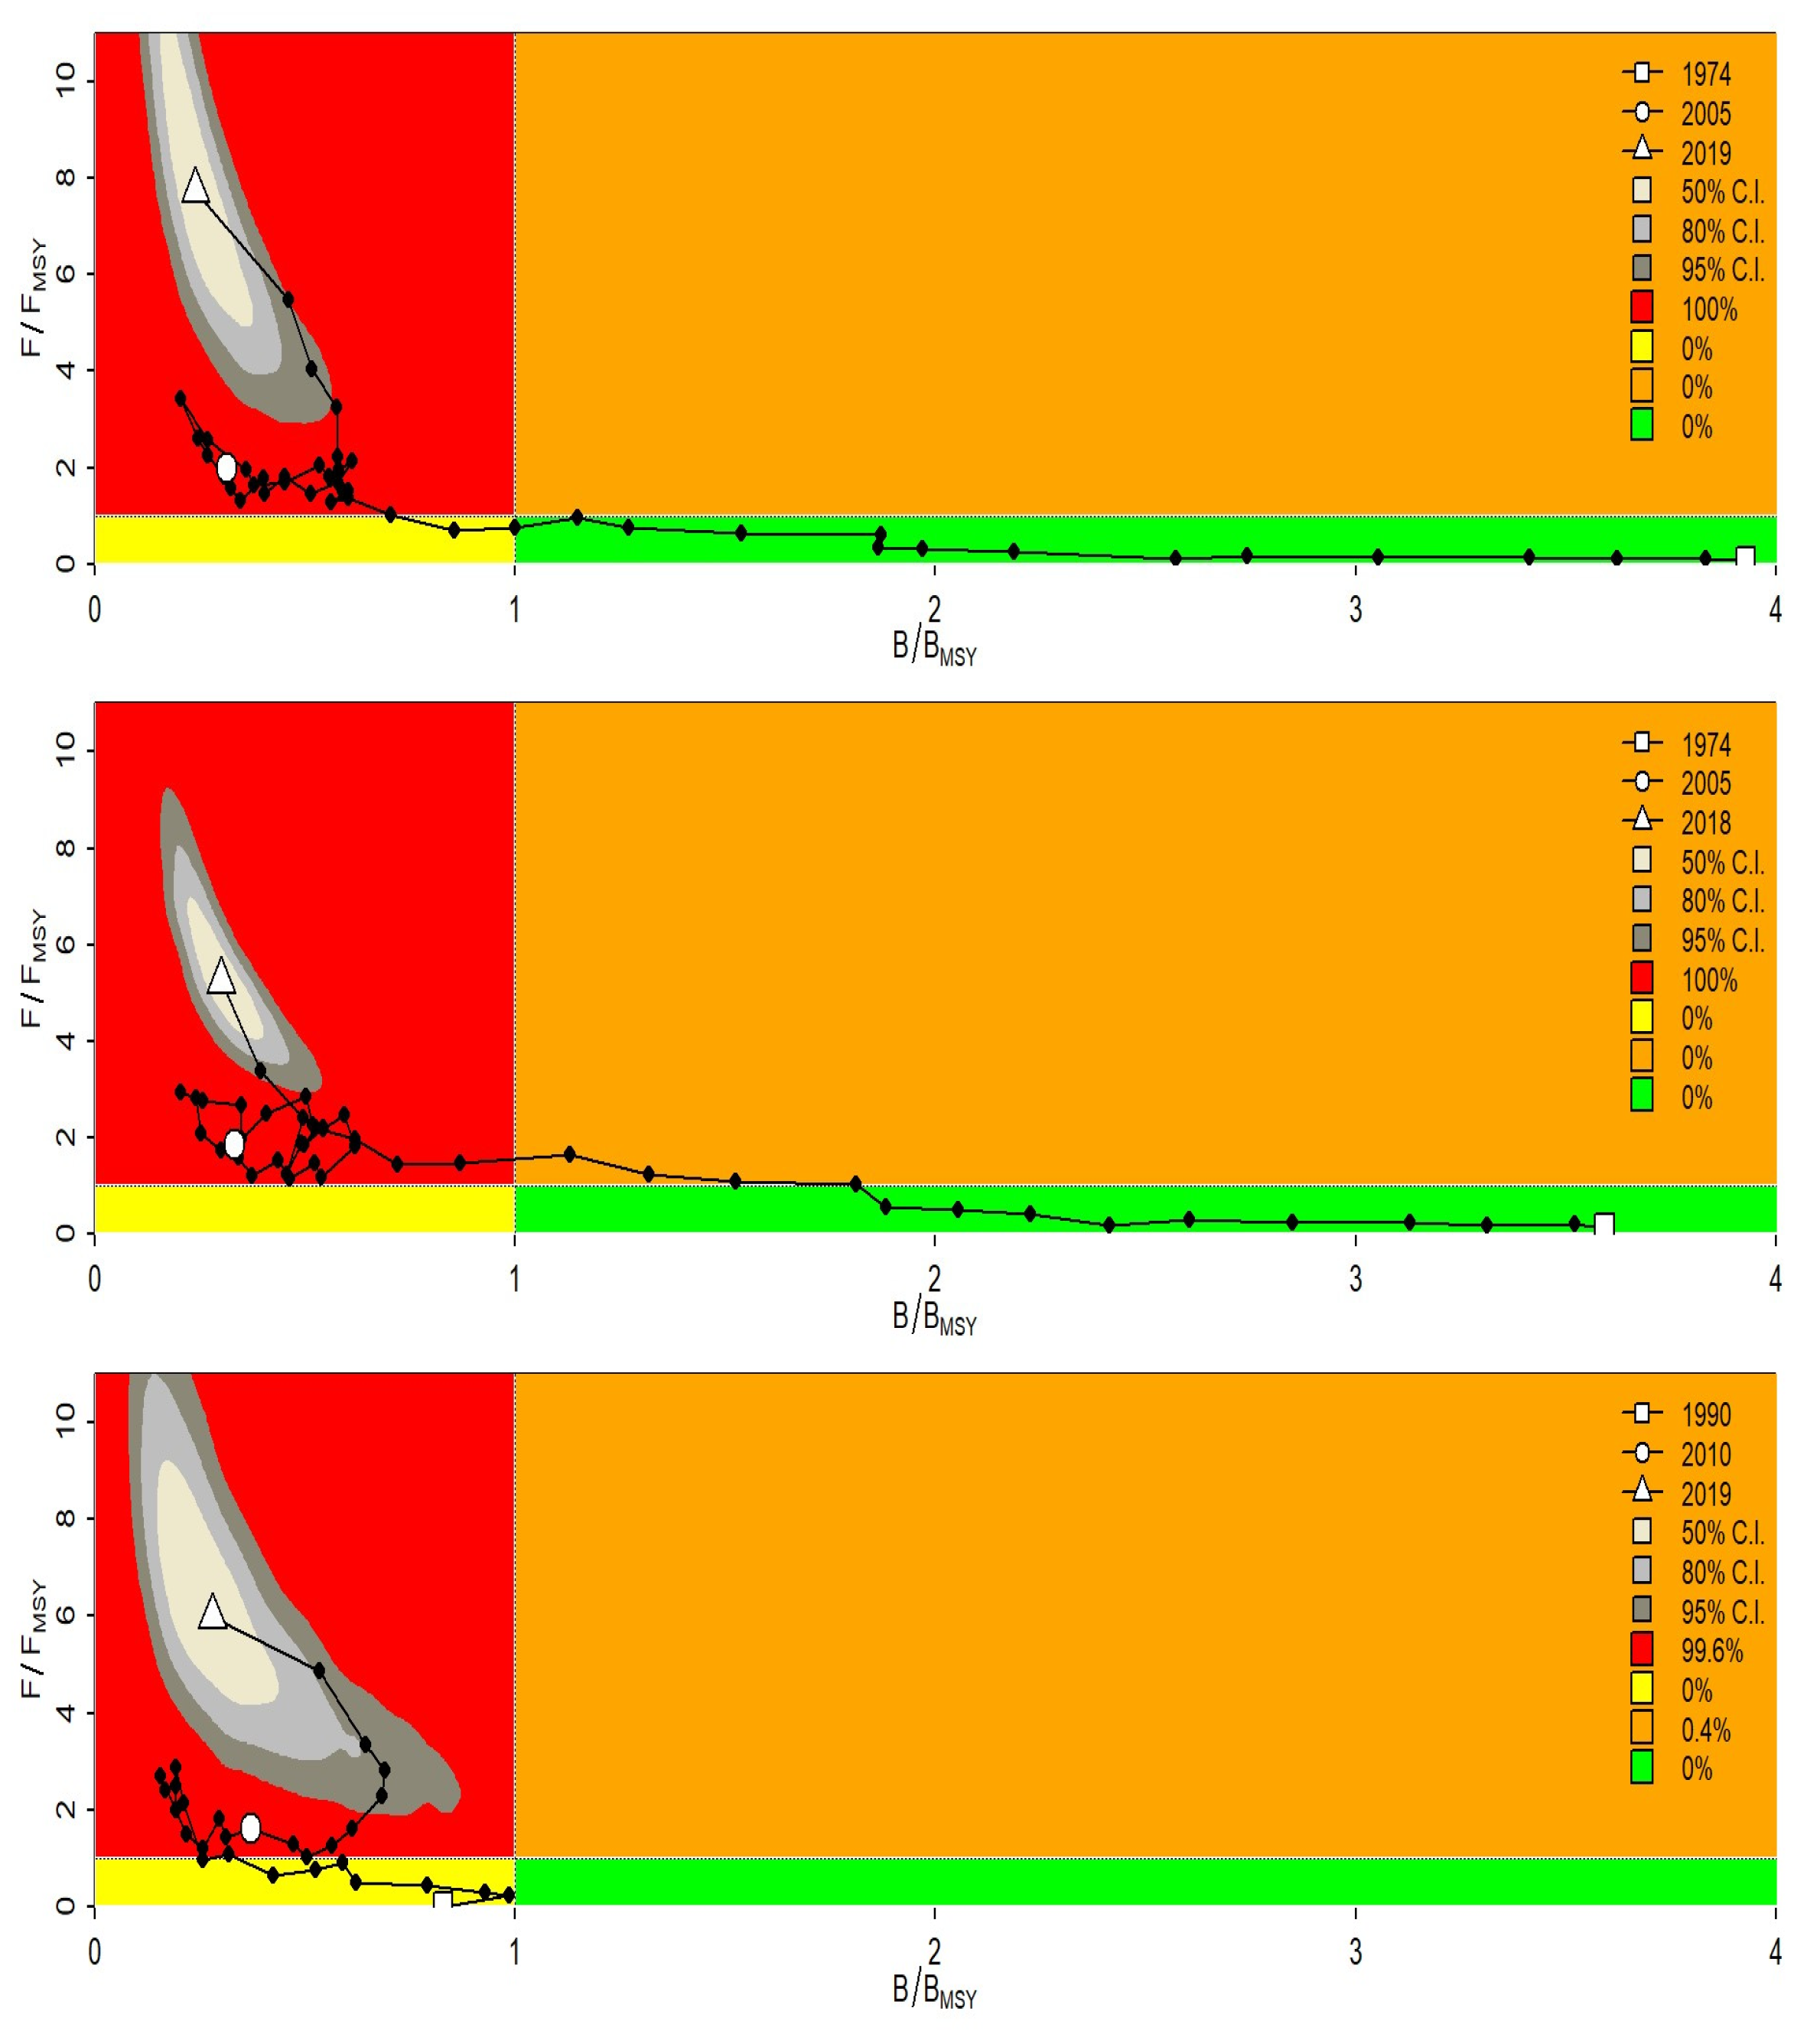
The management plot illustrated a stock severely over-exploited in both scenarios with a high fishing mortality in 2018 (with CI takes values in a threshold between three to eight-fold the
,
Figure 3) and which has been constantly increasing since 2013. This has to be reviewed in conjunction with the biomass decreasing during the same period 2013-2018. Reference points are presented in
Table 6.
The retrospective analysis of predicted biomass
showed a consistently positive but small retrospective bias (
Figure 5) with rho ρm = 0.04, which is within the acceptable thresholds for long lived species (Carvalho et al., 2021). In addition, the retrospective peels fall within the estimated 95 % CI limits from the reference run, which confirms that the errors in biomass and fishing mortality estimates resulting from additional years of data being removed are consistent with estimate uncertainty. However, concerning predictive skills, in agreement with the issues raised previously, the model does not present predictive skills with lack of consistency between CPUEs while abundance trends are shifting (
Figure 2).
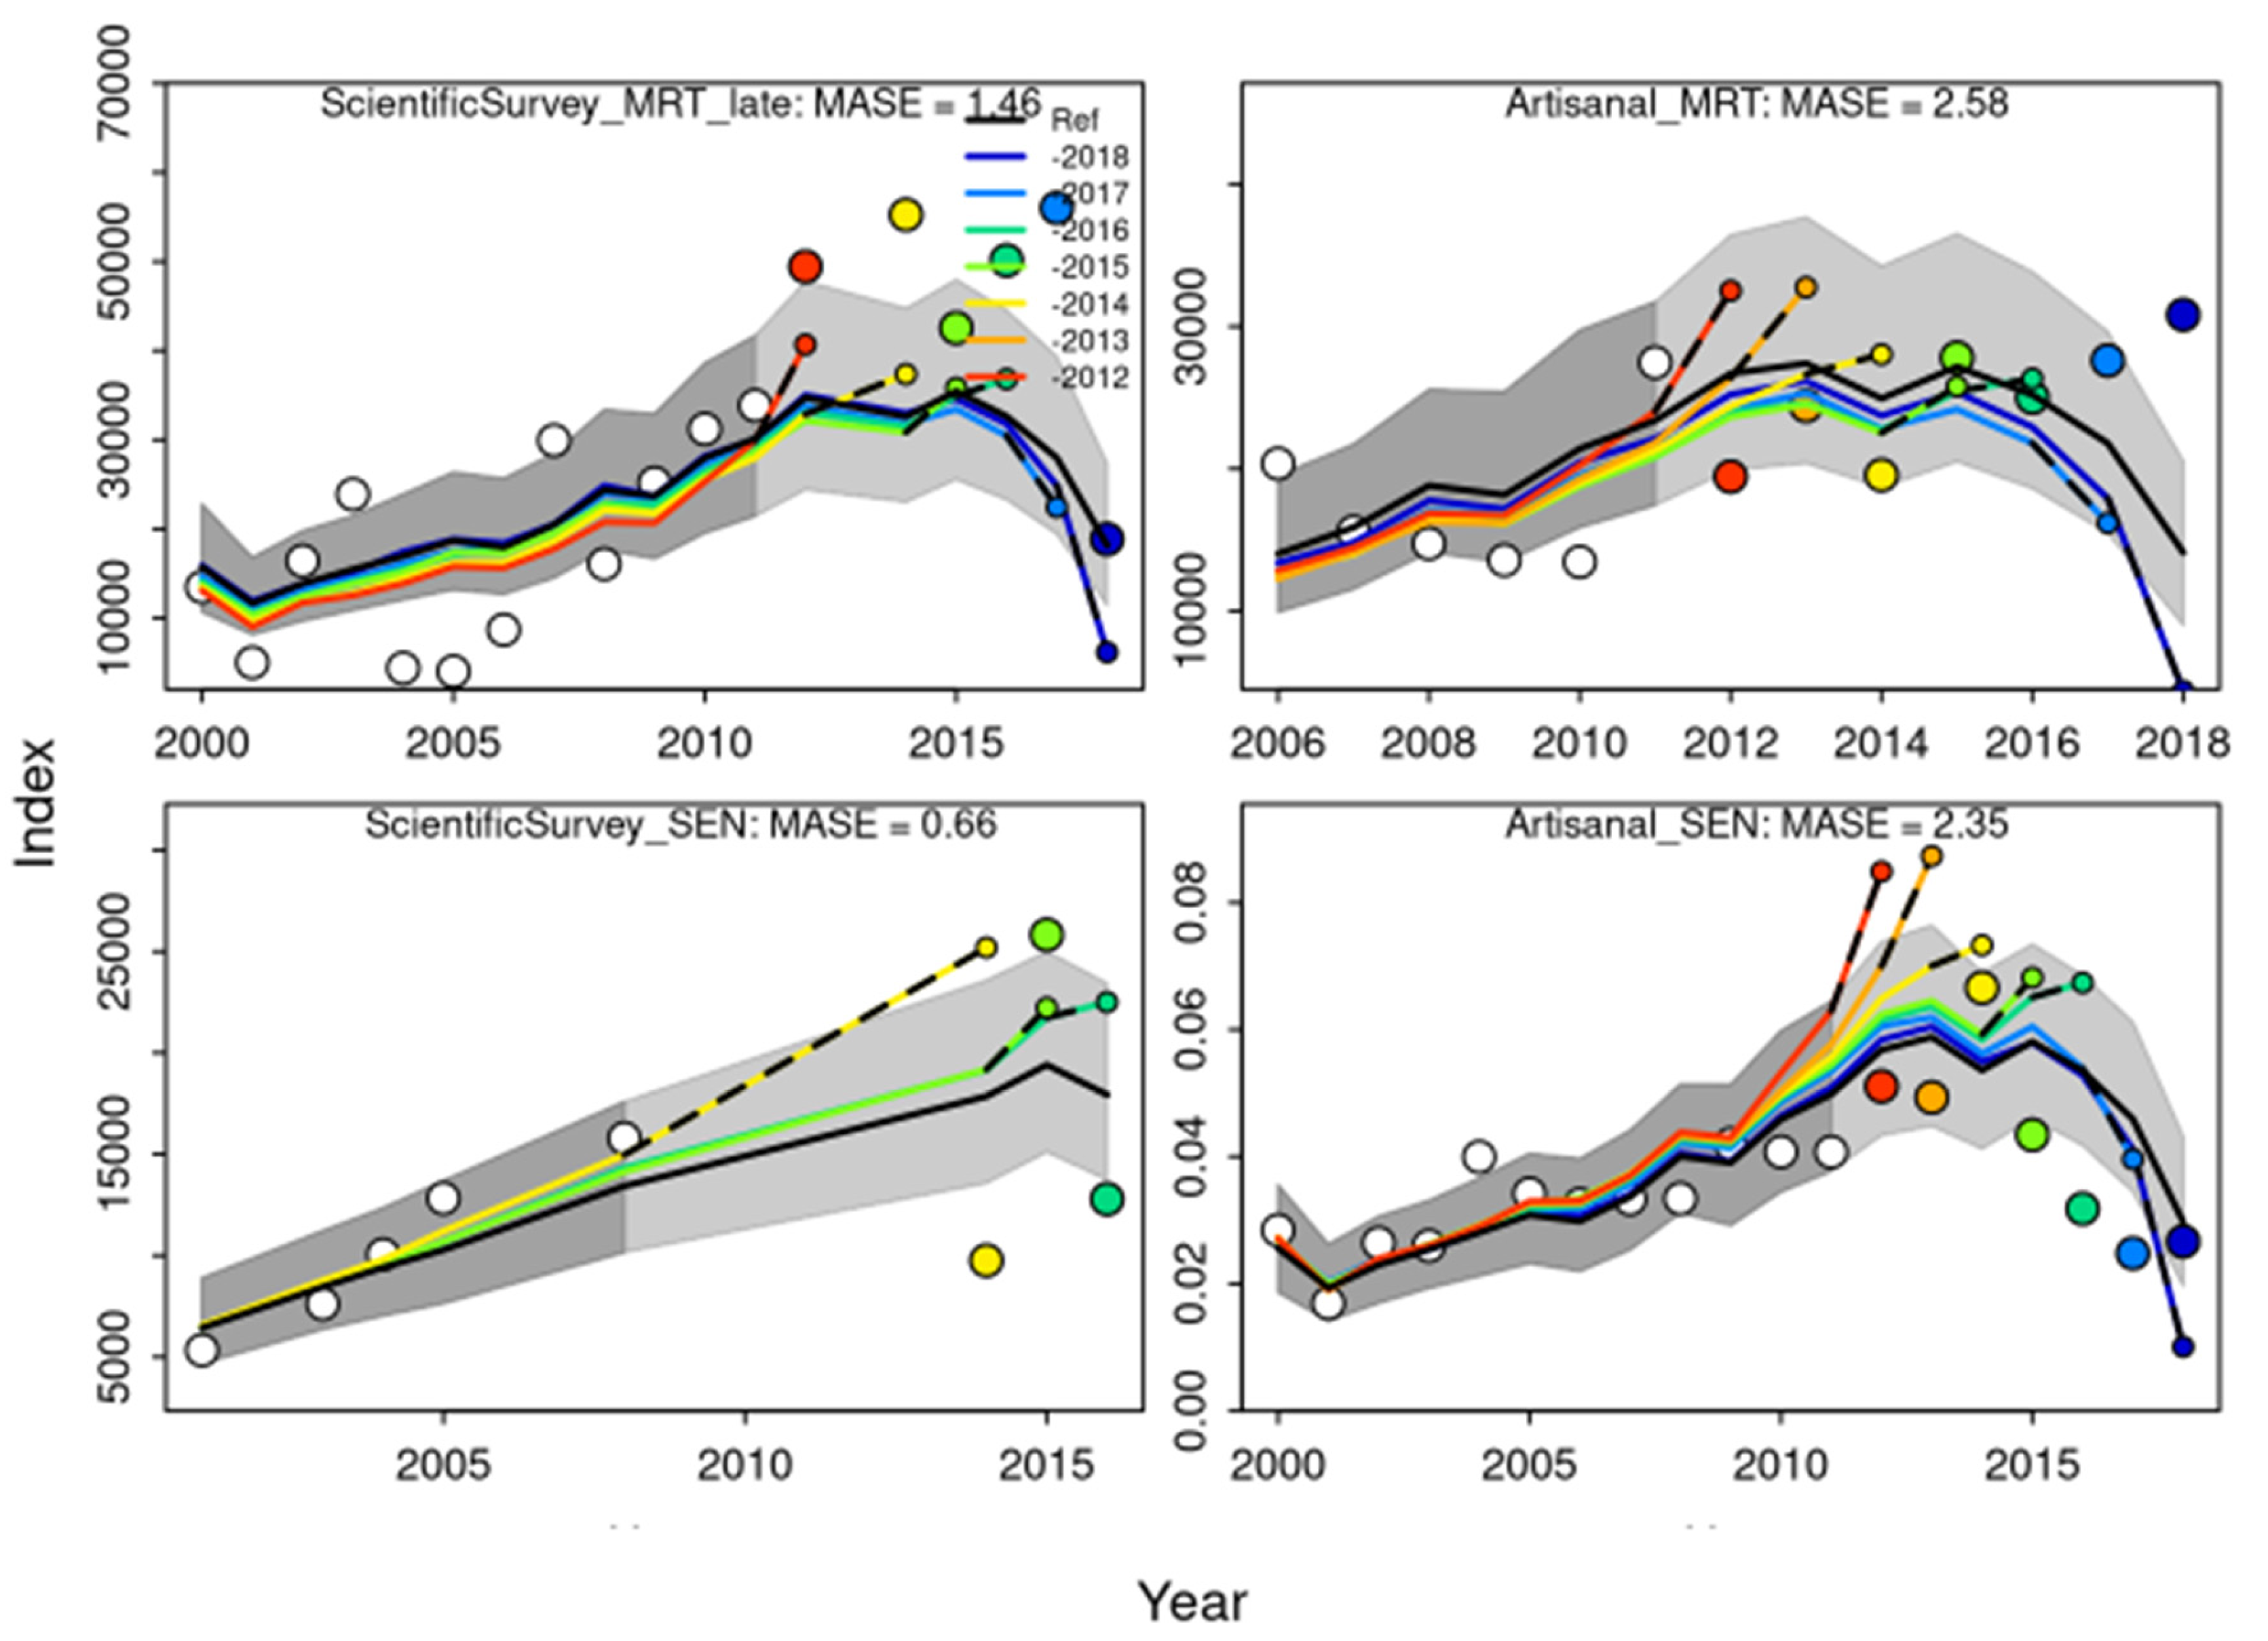
Hindcasting cross
-validating (HCxval) was performed using one reference model and seven hindcast models runs (solid lines) relative to the expected catch-per-unit-effort (CPUE). The observations used for cross-validation are highlighted as color-coded solid circles with associated 95 % CI (light gray shading). The model reference year refers to the endpoints of each one-year-ahead forecast and the corresponding observation (i.e., year of peel +1). The mean absolute scaled error (MASE) score associated with each CPUE and size composition time series is denoted in each panel (
Figure 6).
3.2.2. LBB
A analysis is done on length frequencies of the commercial data. Considering the analysis done on the commercial data in Senegal (2004–2021), the estimate of
confirms that the stock has been overexploited in the recent year, while the estimate of
indicates that the current biomass is extremely low since 2014 (
Table 7). Besides, the
and
ratios were less than unity, suggesting a truncated length structure and fishing of undersized individuals. The analysis in 2020 in Mauritania also indicates a similar signal in a less pronounced way (
Table 7).
In addition, LBB outputs indicate great differences in mean length between countries, with bigger thiof in Mauritania (
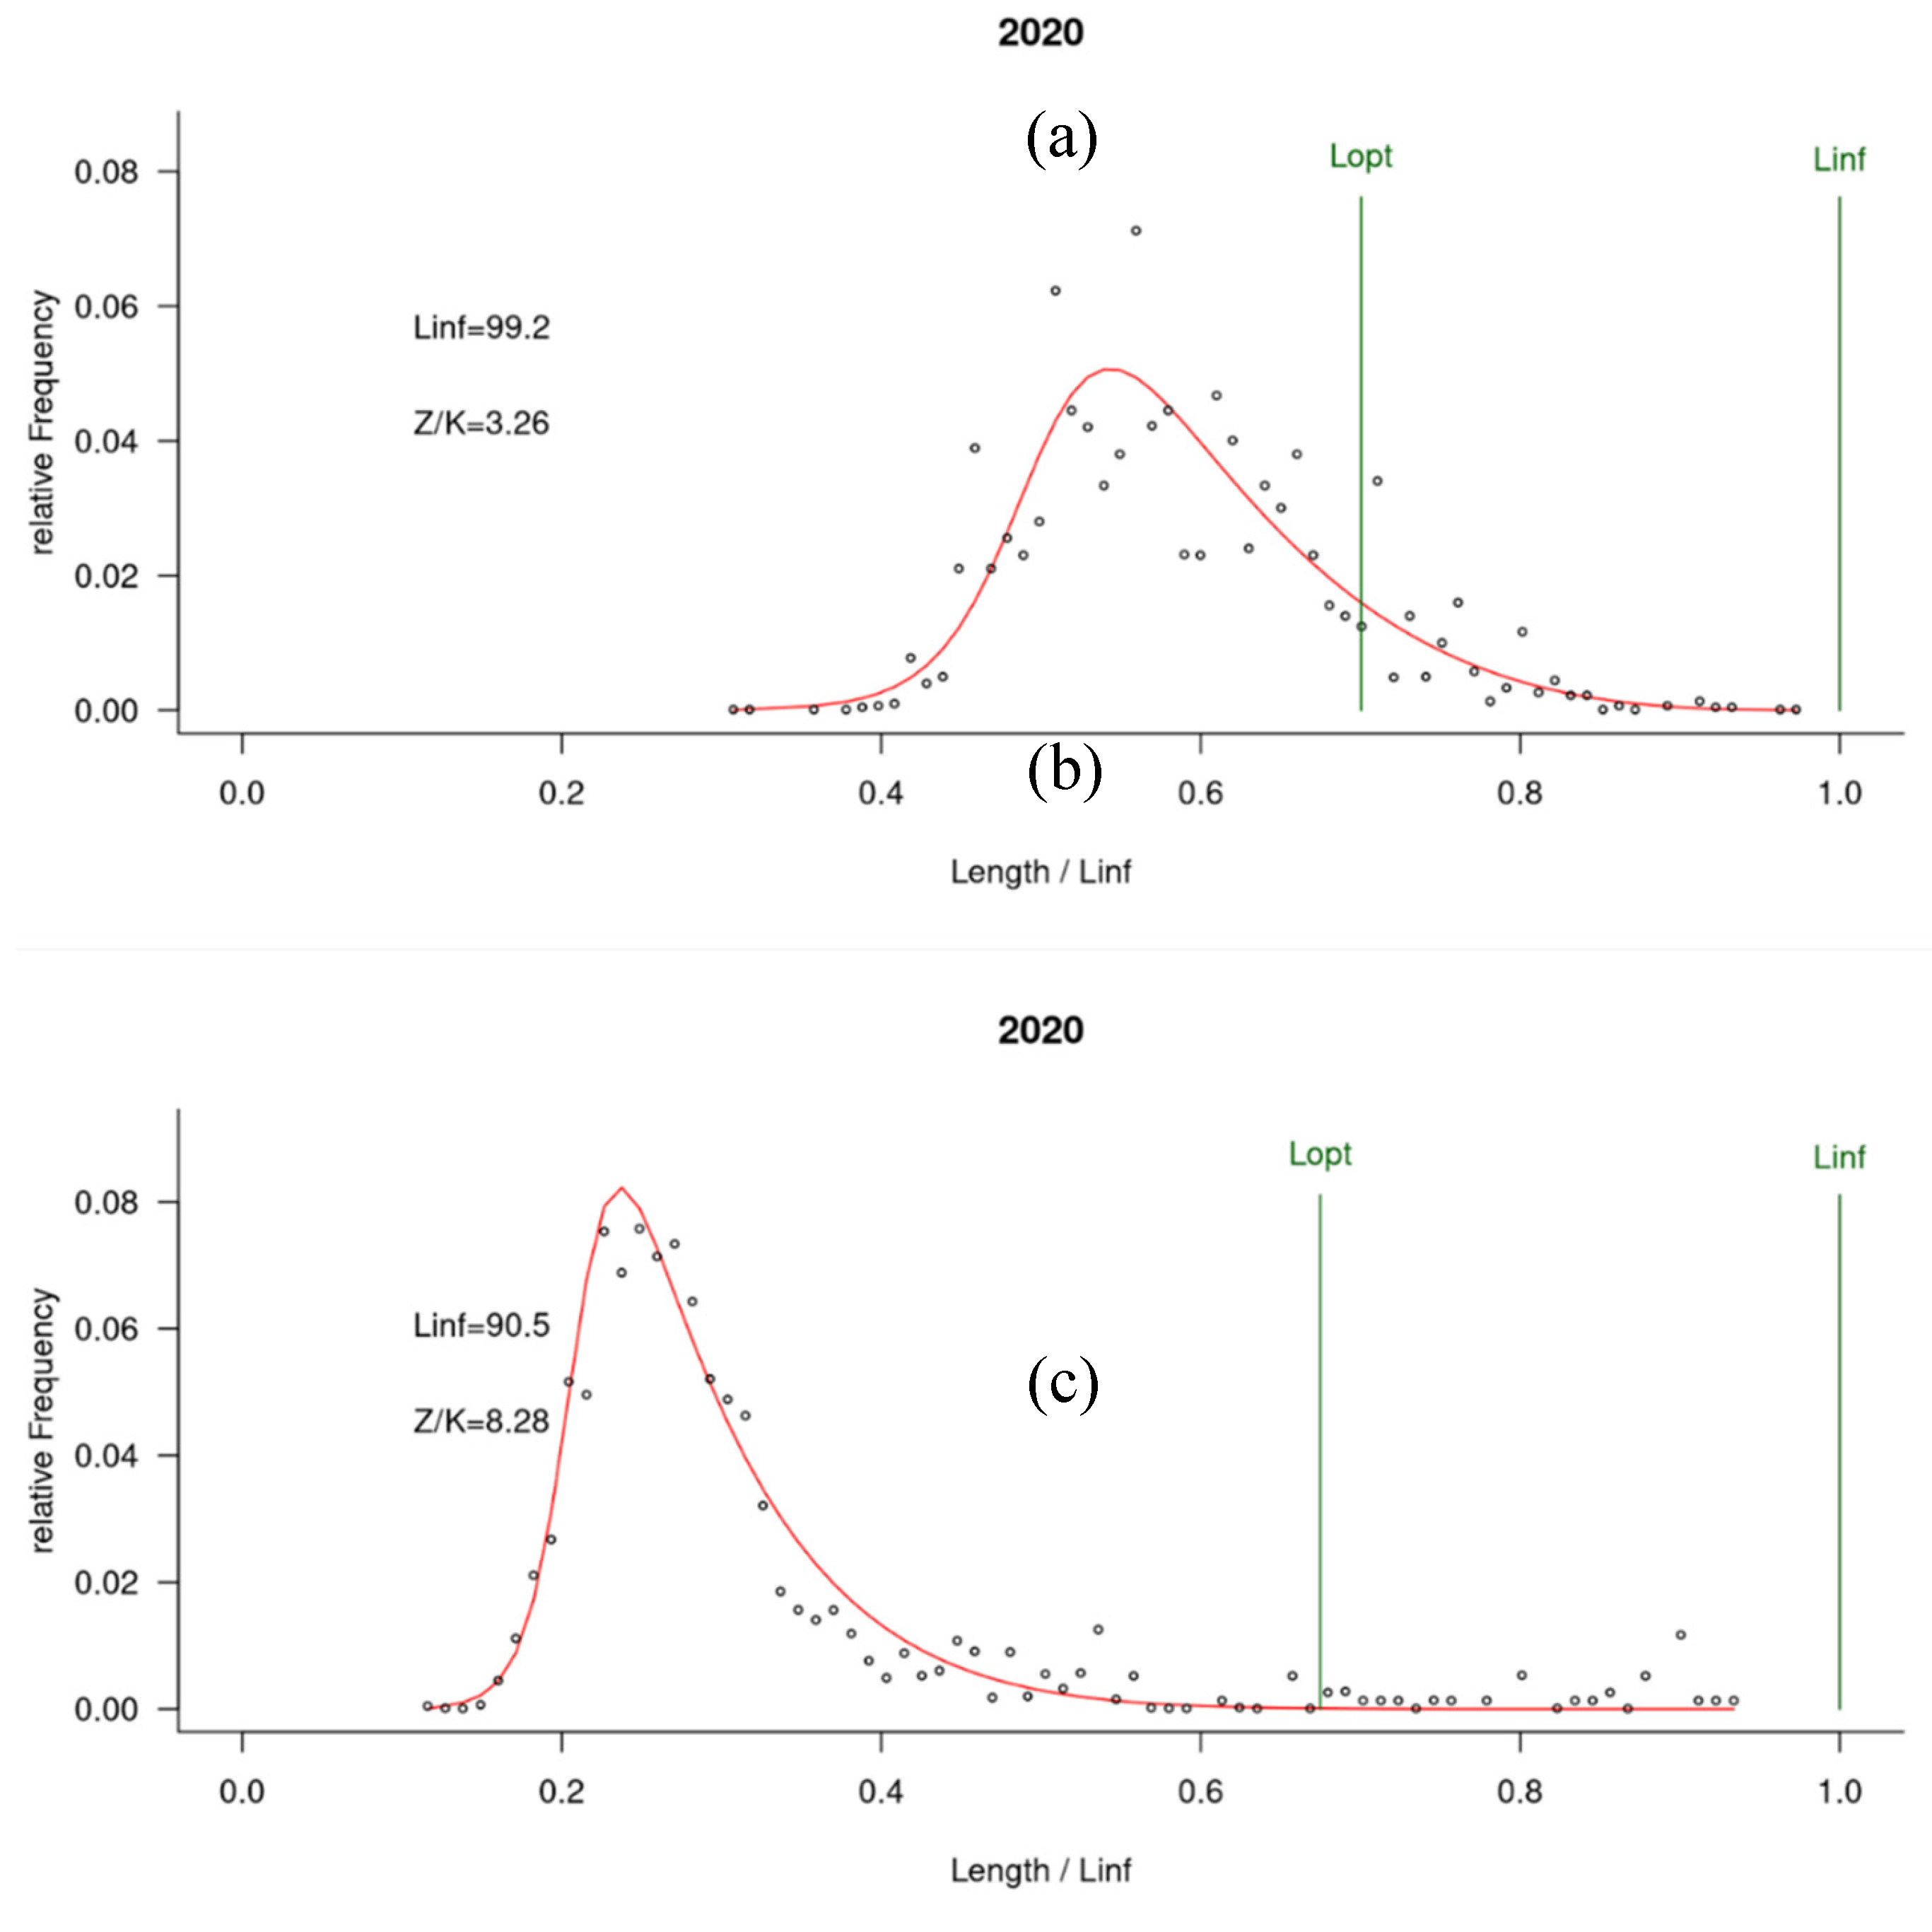
Figure 4). In Senegal, both scientific survey and artisanal landings show a degrading mean length, in particular since 2014, reducing from 50 cm in early 2000 to 33 cm in 2020. On the contrary, mean length in Mauritania seems to keep a high value according to scientific survey, which is higher in exploited sampling from artisanal fishery and will reach 60 cm in 2020. In fact, according to the LBB outputs using Demerstem data in 2020, Lc in Mauritania is about 50 cm while it only attains 30 cm in Senegal. The results of LBB indicate a marked overexploitation of sizes in Senegal with a population dominated by average sizes twice lower than the optimal size (Lmean/Lopt= 0.46) unlike in the Mauritanian zone where Lmean/Lopt= 0.87 (therefore an average size close to the optimal size; Figure S5).
Figure 4.
LBB fit only with data from Demerstem project (upper : Mauritania, lower : Senegal).
Figure 4.
LBB fit only with data from Demerstem project (upper : Mauritania, lower : Senegal).
Figure 5.
Retrospective analysis of fishing mortality and stock biomass conducted by re-fitting the reference model (last year) after removing eight years of observations, one year at a time sequentially. Grey shaded areas are 95 % CI from the reference model.
Figure 5.
Retrospective analysis of fishing mortality and stock biomass conducted by re-fitting the reference model (last year) after removing eight years of observations, one year at a time sequentially. Grey shaded areas are 95 % CI from the reference model.
Figure 6.
Hindcasting cross-validating (HCxval) results showing observed (large points connected with dashed line), fitted (solid lines) and one-year-ahead forecast values (small terminal points).
Figure 6.
Hindcasting cross-validating (HCxval) results showing observed (large points connected with dashed line), fitted (solid lines) and one-year-ahead forecast values (small terminal points).
The use of similar main gears in both countries excludes a difference in selectivity and highlights strong variations in the size structure between the Senegalese and the Mauritanian populations, which is consistent with the differences between F/M values, which are three-folds higher in Senegal.
4. Discussion
Epinephelus aeneus is found along the entire Mauritanian coast, and is characterized by seasonal latitudinal migrations, specifically among adults (Domain 1980, Bruslé 1985). These migrations can vary interannually depending on the intensity of upwelling, which triggers migration towards Mauritanian waters, beginning in April–July (Cury and Worms 1982). For the assessment and management of the white grouper stock we assume a single stock in the two countries (as in the CECAF working groups) while keeping the stock separate (as in the national assessments). Champagnat and Domain (1978) assume that adults of this species migrate from Cap Blanc on the northern border of Mauritania to Cape Roxo in southern Senegal.
Our results might indicate management measures should differ between countries. In fact, Delta-GLM models and associated maps allow to identify differences in spatial repartition between Senegal and Mauritania. In addition, exploitation stock status and indicators are different between countries with a growth over-exploitation more important in Senegal (Vally et al. 2023), where the mean length has recently dropped while still stable in Mauritania. This difference in exploitation patterns could have several origins such as fishing pressure in the different countries or population structure (spawning areas). Bâ et al. (2016) also report migration pattern with larger fish in Senegal, with greater swimming efficiency, being concentrated along the northern coast where the southward and offshore currents are stronger. Such size segregation in the migration process has been suggested by biophysical modeling in West Africa (Brochier et al., 2014).
Size-based approaches prove to be very complementary tools to catch-based methods. Indeed, the LBB model estimates optimal sizes at first capture (Lc_opt) of the order of 60 cm in Mauritania and 58 cm in Senegal and an optimal size (L_opt) of 69 cm in Mauritania and 61 cm in Senegal. These reference points seem to be high compared to the average size exploited in Senegal unlike in Mauritania where the average size exploited is equal to the Lc_opt estimated by the LBB. The minimum size authorized in Mauritania for the thiof is 40 cm in total length in Senegal the regulatory length is 30 cm.
Results from the dynamic model regardless of the scenario were consistent with length frequency analysis, both methods indicating a severe over-exploitation since 2014. In addition, current F described using JABBA are similar to the one observed in Senegal with LBB. Even though this is mainly a consequence of important catches in Mauritania in recent years cumulated with decreasing abundances indices. These results are particularly coherent with trends identified in the Artisanal CPUE in Senegal, specifying a drop in abundances around the same years hence denoting a change in the functioning of the fishery. In addition, abundance indexes report a delay in the trends between countries with Senegal 2-3 years in advance.
This analysis is consistent with the previous COPACE report (2020) denoting a similar stock status and depletion of abundance indices and indicates a degrading situation since last stock assessment, in Senegal where Bâ et al. (2018) showed a recovering status with a dataset ending in 2013 as well as in Mauritania (Meissa et al., 2013). In addition, MSY estimated in this current study approximately corresponds to the sum of estimated MSY when the stock is studied separately in Mauritania and Senegal.
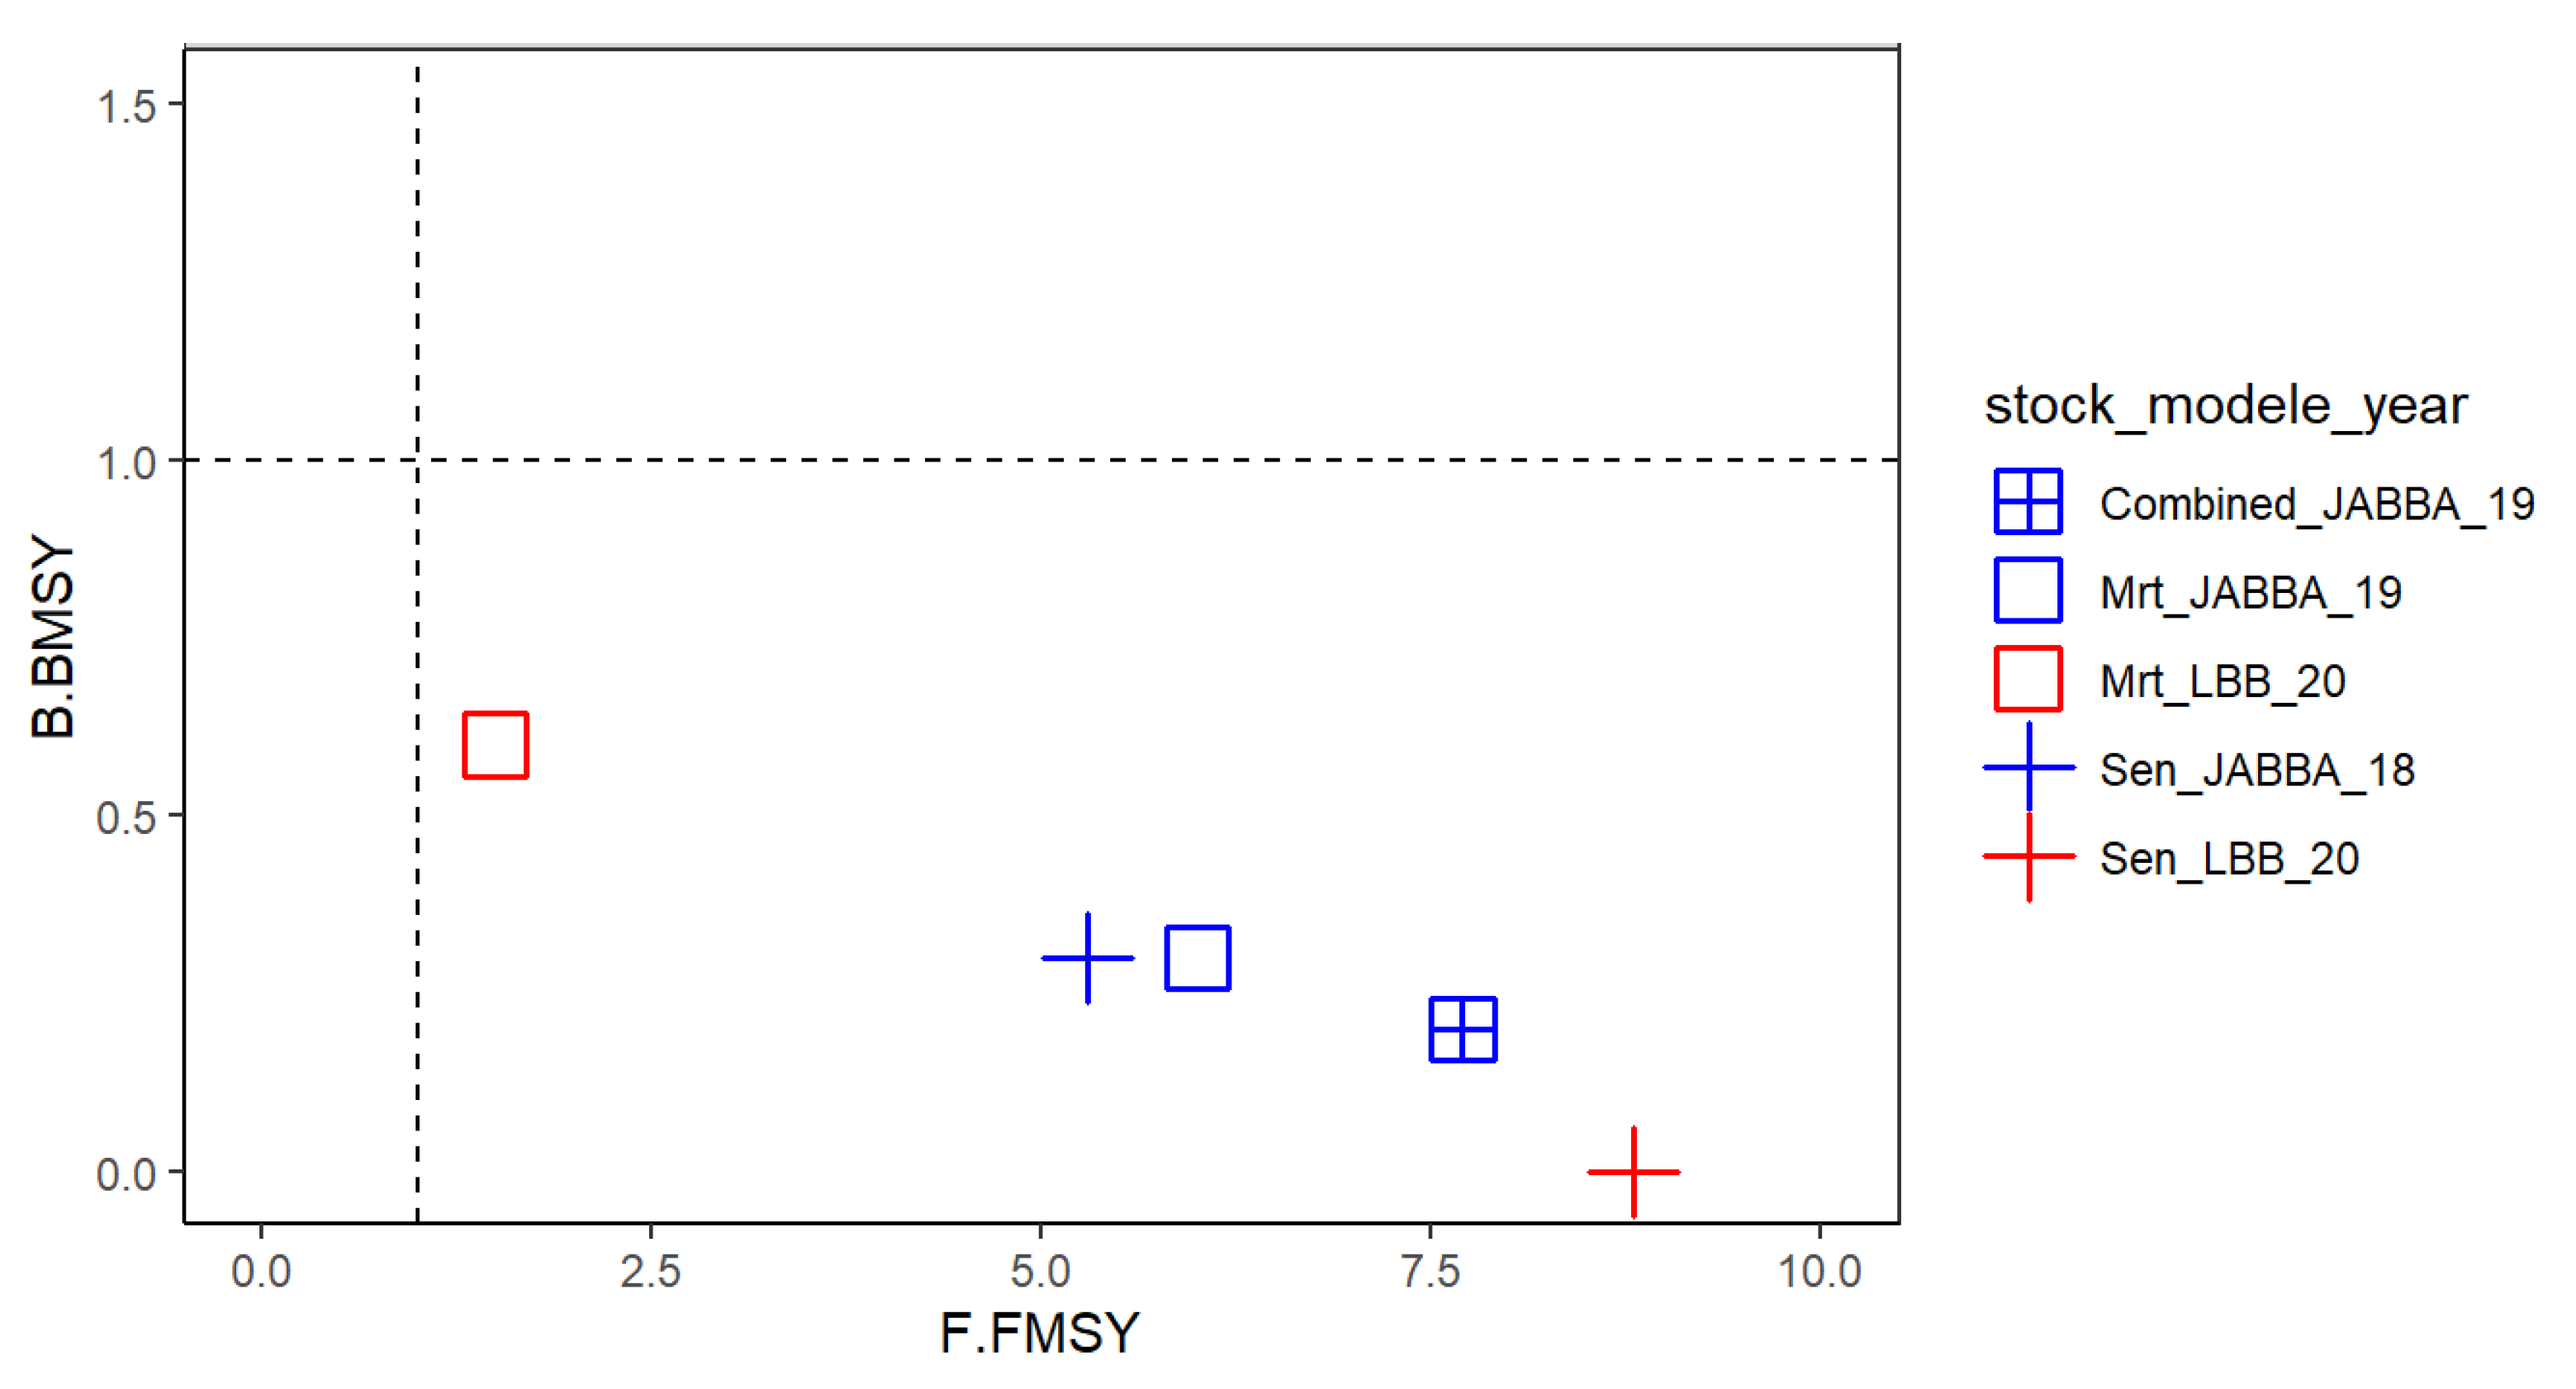
One of the main benefits of the approach presented here is to show how analysis of various data sources and the combination of several methods can reinforce a stock assessment analysis, even in the context of poor data availability (
Figure 7). This multi-pronged approach allows the use of various independent sources of data and the use of size-structured models in the present study reinforced the results obtained with the surplus production model JABBA, while providing further information on the disparity in exploited sizes in the two countries.
In fact, as stated by Dowling et al. (2019), in a review of data-limited methods obtaining better data is as important as using care in acknowledging and interpreting uncertainties or developing harvest strategies (including control rules). For many small-scale fisheries, obtaining reliable time series on historical total catch is difficult, whereas sampling lengths from the catch is easier and for fisheries where the time series of catch are unavailable or catches are not consistently monitored and managed, using length-composition data can provide good approximations of the status of the stock, in particular for medium-lived species. Furthermore, many data-limited approaches have been developed to meet an increasing demand for science-based fisheries management of unassessed fisheries where data and resources are limited (Wetzel and Punt 2011; Costello et al. 2012; Dowling et al. 2015, 2016; Chrysafi and Kuparinen 2016; Rosenberg et al. 2018; Thiao et al. 2019) and contribute further to advanced hindsight in the use of length-based assessment and catch-based models by comparing the performance in determining stock status (Wetzel and Punt 2015; Rosenberg et al. 2018; Chong et al. 2020). For LBB in particular, as reported by Hordyck et al. (2019), relying on the assumption that the ratio of natural mortality (M) to the von Bertalanffy growth parameter (K; M/K) is typically around 1.5 while they argue there is strong evidence to support the claim that M/K is outside the narrow bounds of 1.2–1.8 for many exploited species is an important issue of this method. In addition, with the estimations of L∞ can be misled due to the approximation using maximum observed length Lmax when individuals that are bigger than L+∞, so LBB estimated higher values for this parameter than the true values (Hordyck et al., 2019; Pons et al., 2021). However, in our case, the sensitivity analysis of the model to the asymptotic size (L+∞) did not reveal major changes in the results of the LBB model.
Nevertheless, another important issue in the use of LBB is the case when recruitment variability is an important consideration.
Finally, when both catch and length data are available, models that integrate both data types should be considered. LIME, although primarily length-based, allows for the inclusion of catch data as well as an index of abundance if one is available. Moreover, integrated assessment models (that use catch as well as length information) like Stock Synthesis could also be considered (Methot and Wetzel 2013) and this as noted by Dowling et al. (2019) constitute one the main danger in data limited methods is the indiscriminate use of generic methods (i.e., not rigorously considered for appropriateness given data and assumptions).
5. Conclusions
In this article, the JABBA and the LBB were used to carry out assessments on the white grouper stock in the Mauritania-Senegalese zone and based on several types of data. The state and the reference points of the fishing of this fish stock were estimated and diagnostics of the models were carried out to prove the reliability of the results obtained and the characteristics of prediction of these models particularly in the case of the JABBA model.
The results of the LBB model based on length frequency data with Lmean/Lopt =0.46 in Senegal and 0.87 in Mauritania suggested that the thiof stock has largely truncated length structures in Senegal. This ratio indicated values of 0.7 in Senegal over the period before 2012, therefore a significant deterioration in the size structure exploited with smaller fish in recent years. However, the biomass indicators reveal overexploitation with a B/Bmsy=0.64 and F/M (proxy of F/Fmsy) = 1.54, this diagnosis is even more severe in the case of Senegal where B/Bmsy varies between 0.2 and 0.03 on the recent period, so a situation of severe overexploitation is at least established in this case with a fishing pressure F/M that can vary between 2.4 and 8.8 over the recent period (after 2013). Management measures are needed, particularly in Senegal, to help replenish the large sizes of thiof.
The results obtained with the JABBA model indicate a strong fishing pressure with a fishing mortality 6 to 8 times higher than Fmsy while the current biomass represents 24% of the biomass corresponding to MSY (Bmsy) and only 8% of the virgin biomass. These results show that the state of thiof has further deteriorated compared to the assessments conducted between 2005 and 2013 by Meissa et al. (2013) who estimated an excess effort between 40% and 80% compared to the effort in 2010 in Mauritania. This was also consistent with previous estimates for this species in Senegal, where the excess was estimated by Laurans (2005) to vary from 35% to 55%.
However, at the scale of the two countries, a severe overexploitation of biomass is revealed by the Bayesian biomass production surplus model (JABBA). Stock status indicators show a state of overfishing with high fishing mortality (B/Bmsy=0.24 and F/Fmsy=7.7). Overall, the trajectory of the state of the stock illustrated by the Kobe figure indicates an overexploitation of the biomass of the white grouper stock since the 90s except that the fishing pressure has never been as high as its level over the recent period 2016-2018. This period coincides with an increase in overall fishing effort in the Mauritanian zone since the implementation of the new management policy based on individual TACs and quotas for offshore and coastal fishing. Artisanal fishing remains for the moment within the framework of management by a global quota to fish for cephalopods. In Senegal, the fishing effort remains globally high, with a higher pressure from small scale fishing than from industrial fishing. This species is particularly targeted by the different artisanal gears, i.e., lines, longlines, and passive nets. More than 80% of the landings are provided by the small-scale fishery. Unfortunately, apart from the measures edited in the fishing code (first catch size of 30 cm TL), there is no management of this resource by TACs or quotas and the fishing effort is slowly monitored. However, given its market value, thiof is increasingly sought after, which explains the unprecedented level of fishing mortality during the last decade.
However, both evaluation methods (JABBA and LBB) have their limitations. The JABBA model uses annual landings data, aggregated at national level. Specific landings by size or age class are therefore unknown. What’s more, these data often don’t represent real catches, as they are essentially declared landing statistics. As for the LBB model, it uses size frequency data collected at certain landing sites. This raises the question of the representativeness of the data in relation to real catches.
Therefore, given the different histories of exploitation of white grouper between Senegal (lines, nets and trawls) and Mauritania (lines and trawls), it is likely that the exploited populations do not present the same situation.
References
- Ba K, Thiaw M, Fall M, Thiam N, Meissa B, Jouffre D, et al. Long-term fishing impact on the Senegalese coastal demersal resources: diagnosing from stock assessment models. Aquatic Living Resources. 2018; 31: 8.
- Ba K, Thiaw M, Lazar N, Sarr A, Brochier T, Ndiaye I, et al. (2016) Resilience of Key Biological Parameters of the Senegalese Flat Sardinella to Overfishing and Climate Change. PLoS ONE 11(6): e0156143. [CrossRef]
- Brochier T, Auger PA, Thiaw M, Pecquerie L, Machu E, Mbaye BC et al. Investigating Sardinella aurita seasonal migratory pattern off North-West Africa with a biophysical model. Book of abstract IV Congress of Marine Sciences (ISBN—10: 84-697-0471-0), pp 458–458, June 11th to 13th 2014, Las Palmas de Gran Canaria, Spain. 2014.
- Bruslé J. 1985. Exposé synoptique des données biologiques sur les mérous Epinephelus aeneus (Geoffroy Saint Hilaire, 1809) et Epinephelus guaza (Linnaeus, 1758) de l’Océan Atlantique et de la Méditerranée. FAO Synopsis sur les pêches 129. Rome: Food and Agriculture Organization.
- Carvalho, F., Punt, A.E., Chang, Y.J., Maunder, M.N., Piner, K.R., 2017. Can diagnostic tests help identify model misspecification in integrated stock assessments? Fish. Res. 192, 28–40. [CrossRef]
- Carvalho F., Winker H., Courtney D., Kapur M., Kell L., Cardinale M, Schirripa M., Kitakado T., Yemane D., Piner K.R., Maunder M.N., Taylor I., Wetzel C.R., Doering K., Johnson K.F., Methot R.D. 2021. A cookbook for using model diagnostics in integrated stock assessments, Fisheries Research,Volume 240,2021,105959,ISSN 0165-7836. [CrossRef]
- Champagnat C, Domain F. 1978. Migrations des poissons démersaux le long des côtes Ouest-Africaines de10 à 24° de latitude Nord. Cahier de l’ORSTOM, série Océanographique 16: 239–261.
- Chong, L., Mildenberger, T. K., Rudd, M. B., Marc, H., Taylor, M. H., Cope, J. M., et al. (2020). Performance evaluation of data-limited, length-based stock assessment methods. ICES J. Mar. Sci. 77, 97–108. [CrossRef]
- Chrysafi, A., and Kuparinen, A. 2016. Assessing abundance of populations with limited data: lessons learned from data-poor fisheries stock assessment. Environmental Reviews, 24:25–38.
- Costello, C., Ovando, D., Hilborn, R., Gaines, S. D., Deschenes, O., and Lester, S. E. 2012. Status and solutions for the world’s unassessed fisheries. Science, 338:517–520.
- Cury P, Worms J. 1982. Pêche biologie et dynamique du thiof (Epinephelus aeneus, E. Geoff St Hill, 1817) sur les côtes sénégalaises. Documents Scientifiques du Centre de Recherches. Océanographiques et de Pêches de Dakar-Thiaroye 82.
- Domain F. 1980. Contribution à la connaissance de l’écologie des poissons démersaux du plateau continental sénégalo-mauritanien. Les ressources démersales dans le contexte général du golfe de Guinée. Thèse doct. d’Etat Université de Paris VI (Vol. 1), France.
- Dowling, N. A., Dichmont, C. M., Haddon, M., Smith, D. C., Smith, A. D. M., and Sainsbury, K. 2015. Empirical harvest strategies for data-poor fisheries : a review of the literature. Fisheries Research, 171:141–153.
- Dowling, N. A., Smith, A. D. M., Smith, D. C., Parma, A. M., Dichmont, C. M., Sainsbury, K., Wilson, J. R. et al. 2019. Generic solutions for data-limited fishery assessments are not so simple. Fish and Fisheries, 20:174–188.
- Dowling, N. A., Wilson, J. R., Rudd, M. B., Babcock, E. A., Caillaux, M., Cope, J., Dougherty, D. et al. 2016. FishPath: A Decision Support System for Assessing and Managing Data-and Capacity Limited Fisheries. In Assessing and Managing Data-Limited Fish Stocks. Alaska Sea Grant, University of Alaska Fairbanks.
- FAO, 2020. Rapport du Groupe de travail FAO/COPACE sur l’évaluation des ressources démersales—Sous-groupe Nord Nouakchott, Mauritanie, 2-10 décembre 2019, 598p.
- Froese, R., Winker, H., Coro, G., Demirel, N., Tsikliras, A. C., Dimarchopoulou, D., Scarcella, G., Palomares, M. L. D., Dureuil, M., and Pauly,D. (2020). Estimating stock status from relative abundance and resilience.—ICES Journal of Marine Science, 77: 527–538.
- Froese, R., Winker, H., Coro, G., Demirel, N., Tsikliras, A. C., Dimarchopoulou, D., et al. (2018). A new approach for estimating stock status from length frequency data. ICES J. Mar. Sci. 76, 350–351. [CrossRef]
- Froese, R., Winker, H., Gascuel, D., Sumalia, U.R. and Pauly, D. 2016. Minimizing the impact of fishing. Fish and Fisheries 17, 785–802.
- Gascuel D, Labrosse P, Meissa B, Taleb Sidi MO, Guénette S. 2007. Decline of demersal resources in North-West Africa: an analysis of Mauritanian trawl survey data over the last 25 years. African Journal of Marine Science 29: 331–345.
- Geweke, J., 1992. Evaluating the accuracy of sampling-based approaches to the calculation of posterior moments., in: Berger, J.O., Bernardo, J.M., Dawid, A.P., Smith,A.F.M. (Eds.), Bayesian Statistics 4: Proceedings of the Fourth Valencia International Meeting. Clarendon Press, Oxford, pp. 169–193.
- Girardin M, Dia M, Inejih CA. 1990. Comparaison de l’efficacité du chalut du N’Diago avant et après 1989, suite au changement des panneaux. Archives du Centre National de Recherches Océanographiques et des Pêches.
- Hyndman and Koehler, 2006. Another look at measures of forecast accuracy. International Journal of Forecasting 22(4), 679-688.
- Hordyck, A. R., Prince, J., D. Carruthers, T., R., Walters, C. J. (2019), Comment on “A new approach for estimating stock status from length frequency data” by Froese et al. ICES Journal of Marine Science, Volume 76, Issue 2, March-April 2019, Pages 457–460. [CrossRef]
- Palomares, M. L. D., and Pauly, D. 2019b. On the creeping increaseof vessels’ fishing power. Ecology and Society, 24: 31.
- Pons, M., Cope, J. M., and Kell, L. T. (2020). Comparing performance of catchbased and length-based stock assessment methods in data-limited fisheries. Can. J. Fish. Aquat. Sci. 77, 1026–1037. [CrossRef]
- Laurans M. 2005. Ressources et exploitations “démersales” en Afrique de l’ouest: evaluation des stocks, dynamique des populations et approche écosystémique, Doctorat de l’École nationale supérieure agronomique de Rennes, 311 p.
- Laurans M, Gascuel D, Barry M. 2003. Revue des connaissances sur la biologie du thiof (Epinephelus aeneus) et diagnostic de l’état du stock au Sénégal. In: Gascuel D, Barry M, Laurans M, Sidibé A (eds), Evaluations des stocks démersaux en Afrique du Nord-Ouest. Travaux du groupe « Analyses monospécifiques» du projet SIAP. COPACE/PACE Séries 03/65. Rome: Food and Agriculture Organization. pp 59-73.
- Laurent A.G. 1963. Lognormal distribution and the translation method: description and estimation problems. J. Americ. Statist. Assoc., 58, 231-235.
- Le Pape O, Chauvet F, Mahévas S, Lazure P, Guérault D, Désaunay Y. 2003. Quantitative description of habitat suitability for the juvenile common sole (Soleasolea, L.) in the Bay of Biscay (France) and the contribution of different habitats to the adult population. Journal of Sea Research 50: 139–149.
- Meissa B., Dia M., Baye B.C., Bouzouma M., Beibou E. and Roa-Ureta R.H. (2021). A Comparison of Three Data-Poor Stock Assessment Methods for the Pink Spiny Lobster Fishery in Mauritania. Front. Mar. Sci. 8:714250. [CrossRef]
- Meissa B, Gascuel D, Rivot E. 2013. Assessing stocks in data-poor African fisheries: a case study on the white grouper Epinephelus aeneus of Mauritania. African Journal of Marine Science 35: 253–267.
- Meissa B, Rivot E, Gascuel D. 2008. Analysis of CPUE data series through generalized linear models and delta method to derive annual series of abundance indices. Application to the Mauritanian demersal fishery. Scientific report European project ISTAM, Deliverable D.3.2, Agrocampus Ouest, Rennes.
- Methot R. D., and Wetzel C. R. 2013. Stock synthesis: a biological and statistical framework for fish stock assessment and fishery management. Fisheries Research, 142: 86–99.
- Meyer, R. and Millar, R.B. (1999) BUGS in Bayesian stock assessment. Canadian Journal of Fisheries and Aquatic Sciences 56, 1078–1086.
- Mora C, Myers RA, Coll M, Libralato S, Pitcher TJ, et al. (2009) Management Effectiveness of the World’s Marine Fisheries. PLoS Biol 7(6): e1000131. [CrossRef]
- Punt AE. 2023. Those who fail to learn from history are condemned to repeat it: A perspective current stock assessment good practices and the consequences of not following them, Fisheries Research, Volume 261, 2023, 106642, ISSN 0165-7836. [CrossRef]
- Rosenberg, A. A., Kleisner, K. M., Afflerbach, J., Anderson, S.C., Dickey Collas, M., Cooper, A. B., Fogarty, M. J. et al. 2018. Applying a new ensemble approach to estimating stock status of marine fisheries around the world. Conservation Letters,11: e12363.
- Stefansson G. 1996. Analysis of groundfish survey abundance data: combining the GLM and delta approaches. ICES Journal of Marine Science 53: 577–588.
- Thiao D., Westlund L., Sambe B., Diadhiou H.D., Dème M., Mbenga A., Diop M. 2019. A perception-based participatory monitoring and evaluation approach to foster effective co-management of the marine protected areas in Northwest Africa Ocean and Coastal Management 175 (2019) 1–16. [CrossRef]
- Vally Y.E., Quenum C.L., M. Thiaw M., Guitton J., Meissa B., Le Pape O. 2023. Quantitative mapping of effective habitats for the White grouper Epinephelus aeneus (Geoffroy Saint-Hilaire, 1817) in North West Africa. Regional Studies in Marine Science 65 (2023) 103067. [CrossRef]
- Wetzel C. R., and Punt A. E. 2011. Performance of a fisheries catch-at-age model (Stock Synthesis) in data-limited situations. Marine Freshwater Research, 62: 927 –936.
- Wetzel, C.R., and Punt, A.E. 2015. Evaluating the performance of data-moderate and catch-only assessment methods for U.S. west coast groundfish. Fish. Res. 171: 170–187. Elsevier B.V. [CrossRef]
- Winker, H., Carvalho, F., Kapur, M., 2018. JABBA: Just Another Bayesian Biomass Assessment. Fish. Res. 204, 275–288. [CrossRef]
- Winker, H., Carvalho, F., Kerwath, S., 2019. Age-structured biomass dynamics of north Atlantic shortfin mako with implications for the interpretation of surplus production models. ICCAT-SCRS 098, 1–19 Wetzel, C. R., and Punt, A. E. 2011. Model performance for the determination of appropriate harvest levels in the case of data-poor stocks.Fisheries Research,110:342–355.
- Winker, H., Kerwath, S.E., Merino, G., Ortiz, M., 2019. Bayesian State-Space Surplus Production Model JABBA of Atlantic bigeye tuna (Thunnus obesus) stock. Col. Vol. Sci.
|
Disclaimer/Publisher’s Note: The statements, opinions and data contained in all publications are solely those of the individual author(s) and contributor(s) and not of MDPI and/or the editor(s). MDPI and/or the editor(s) disclaim responsibility for any injury to people or property resulting from any ideas, methods, instructions or products referred to in the content. |
© 2024 by the authors. Licensee MDPI, Basel, Switzerland. This article is an open access article distributed under the terms and conditions of the Creative Commons Attribution (CC BY) license (http://creativecommons.org/licenses/by/4.0/).