Submitted:
03 July 2025
Posted:
04 July 2025
You are already at the latest version
Abstract
Autism Spectrum Disorder (ASD) is a complex syndrome with a plethora of clinical manifestations. Although such variability may be attributable to diverse genetic and epigenetic factors, mesolimbic dopaminergic reward pathways are consistently implicated in the illness’ course and neuropathobiology pointing to a need in an updated perspective on such a potential overlap area. To that end, we introduce a structured framework dissecting ASD's pathophysiology into stages while emphasizing the involvement of the classical reward structures. Through data mining of Genome-Wide Association Studies (GWAS) and in silico analyses, we uncovered genetic and epigenetic markers pointing to Reward Deficiency Syn-drome (RDS) component of ASD. We employ innovative approaches, including protein-protein interactions, gene regulatory networks, and systems biology analyses, to identify pathways and ASD gene ontologies. The multi-omics analysis integrates findings across genomics, proteomics, metabolomics, and phenomics, reinforcing the concept of ASD as an endophenotype of RDS. This comprehensive approach offers new insights into the genetic architecture and molecular mechanisms of ASD, paving the way for personalized medicine strategies thus yielding novel therapeutic interventions.
Keywords:
Autism Spectrum Disorder
; Genome-Wide Association Studies
; Pharmacogenomics
; Reward Deficiency Syndrome
; Genetic Addiction Risk Severity
Introduction
Autism spectrum disorder (ASD) is a relatively common neurodevelopmental condition afflicting approximately 2% of children in the US [1]. Lifetime societal costs are estimated to be $7 trillion owing to healthcare, special education and support services expenditures along with lost productivity, caregiving responsibilities, and long-term care needs; these costs are estimated to double by 2029 [2]. The fact that the ASD prevalence is rising over the past few decades, albeit partially due to refinement of psychodiagnostic tools, increased awareness, and expanded eligibility for services [3], calls for novel neurobiological insights that may inform improved prevention, diagnosis, and treatment [4].
As the “spectrum” term implies, ASD is a complex syndrome encompassing a wide range of symptoms and severity levels manifested in various life areas challenges [5]. Nonetheless, the diagnostic shift by the American Psychiatric Association from diagnostic categories to a unified spectrum [5] reflects advances in research demonstrating the overlap in seeming heterogeneity of symptoms among individuals previously diagnosed with different autism-related disorders (28213805). Although ASD’s central features are commonly understood to include social communication challenges, repetitive behaviors, and sensory sensitivities [5] it may be also postulated to involve alterations in reward processing [6,7].
Clinically, in addition to heightened prevalence of addictive disorders [8,9], ASD patients frequently exhibit hyper- or hypo-responsivity to sensory input [10,11,12], potentially affecting perception of pleasurable stimuli and their hedonic processing [13]. Moreover, a core feature of ASD, repetitive behaviors, may be a form of reinforcement [14,15] responding to altered sensory experiences [16,17] or problematic social interactions [18,19]. These behaviors could function as alternative sources of reward [20,21]. Repeated artificial dopamine enhancement in the neurophysiologic reward system by such repetitive behaviors [22] may lead, akin to stress [23] or addictive substances [24], to a dysfunctional hypodopaminergic circuitry [24,25] that renders it less responsive to social interactions and other natural reinforcers [20,26,27], that is to say, reward deficiency syndrome (RDS) [6,28].
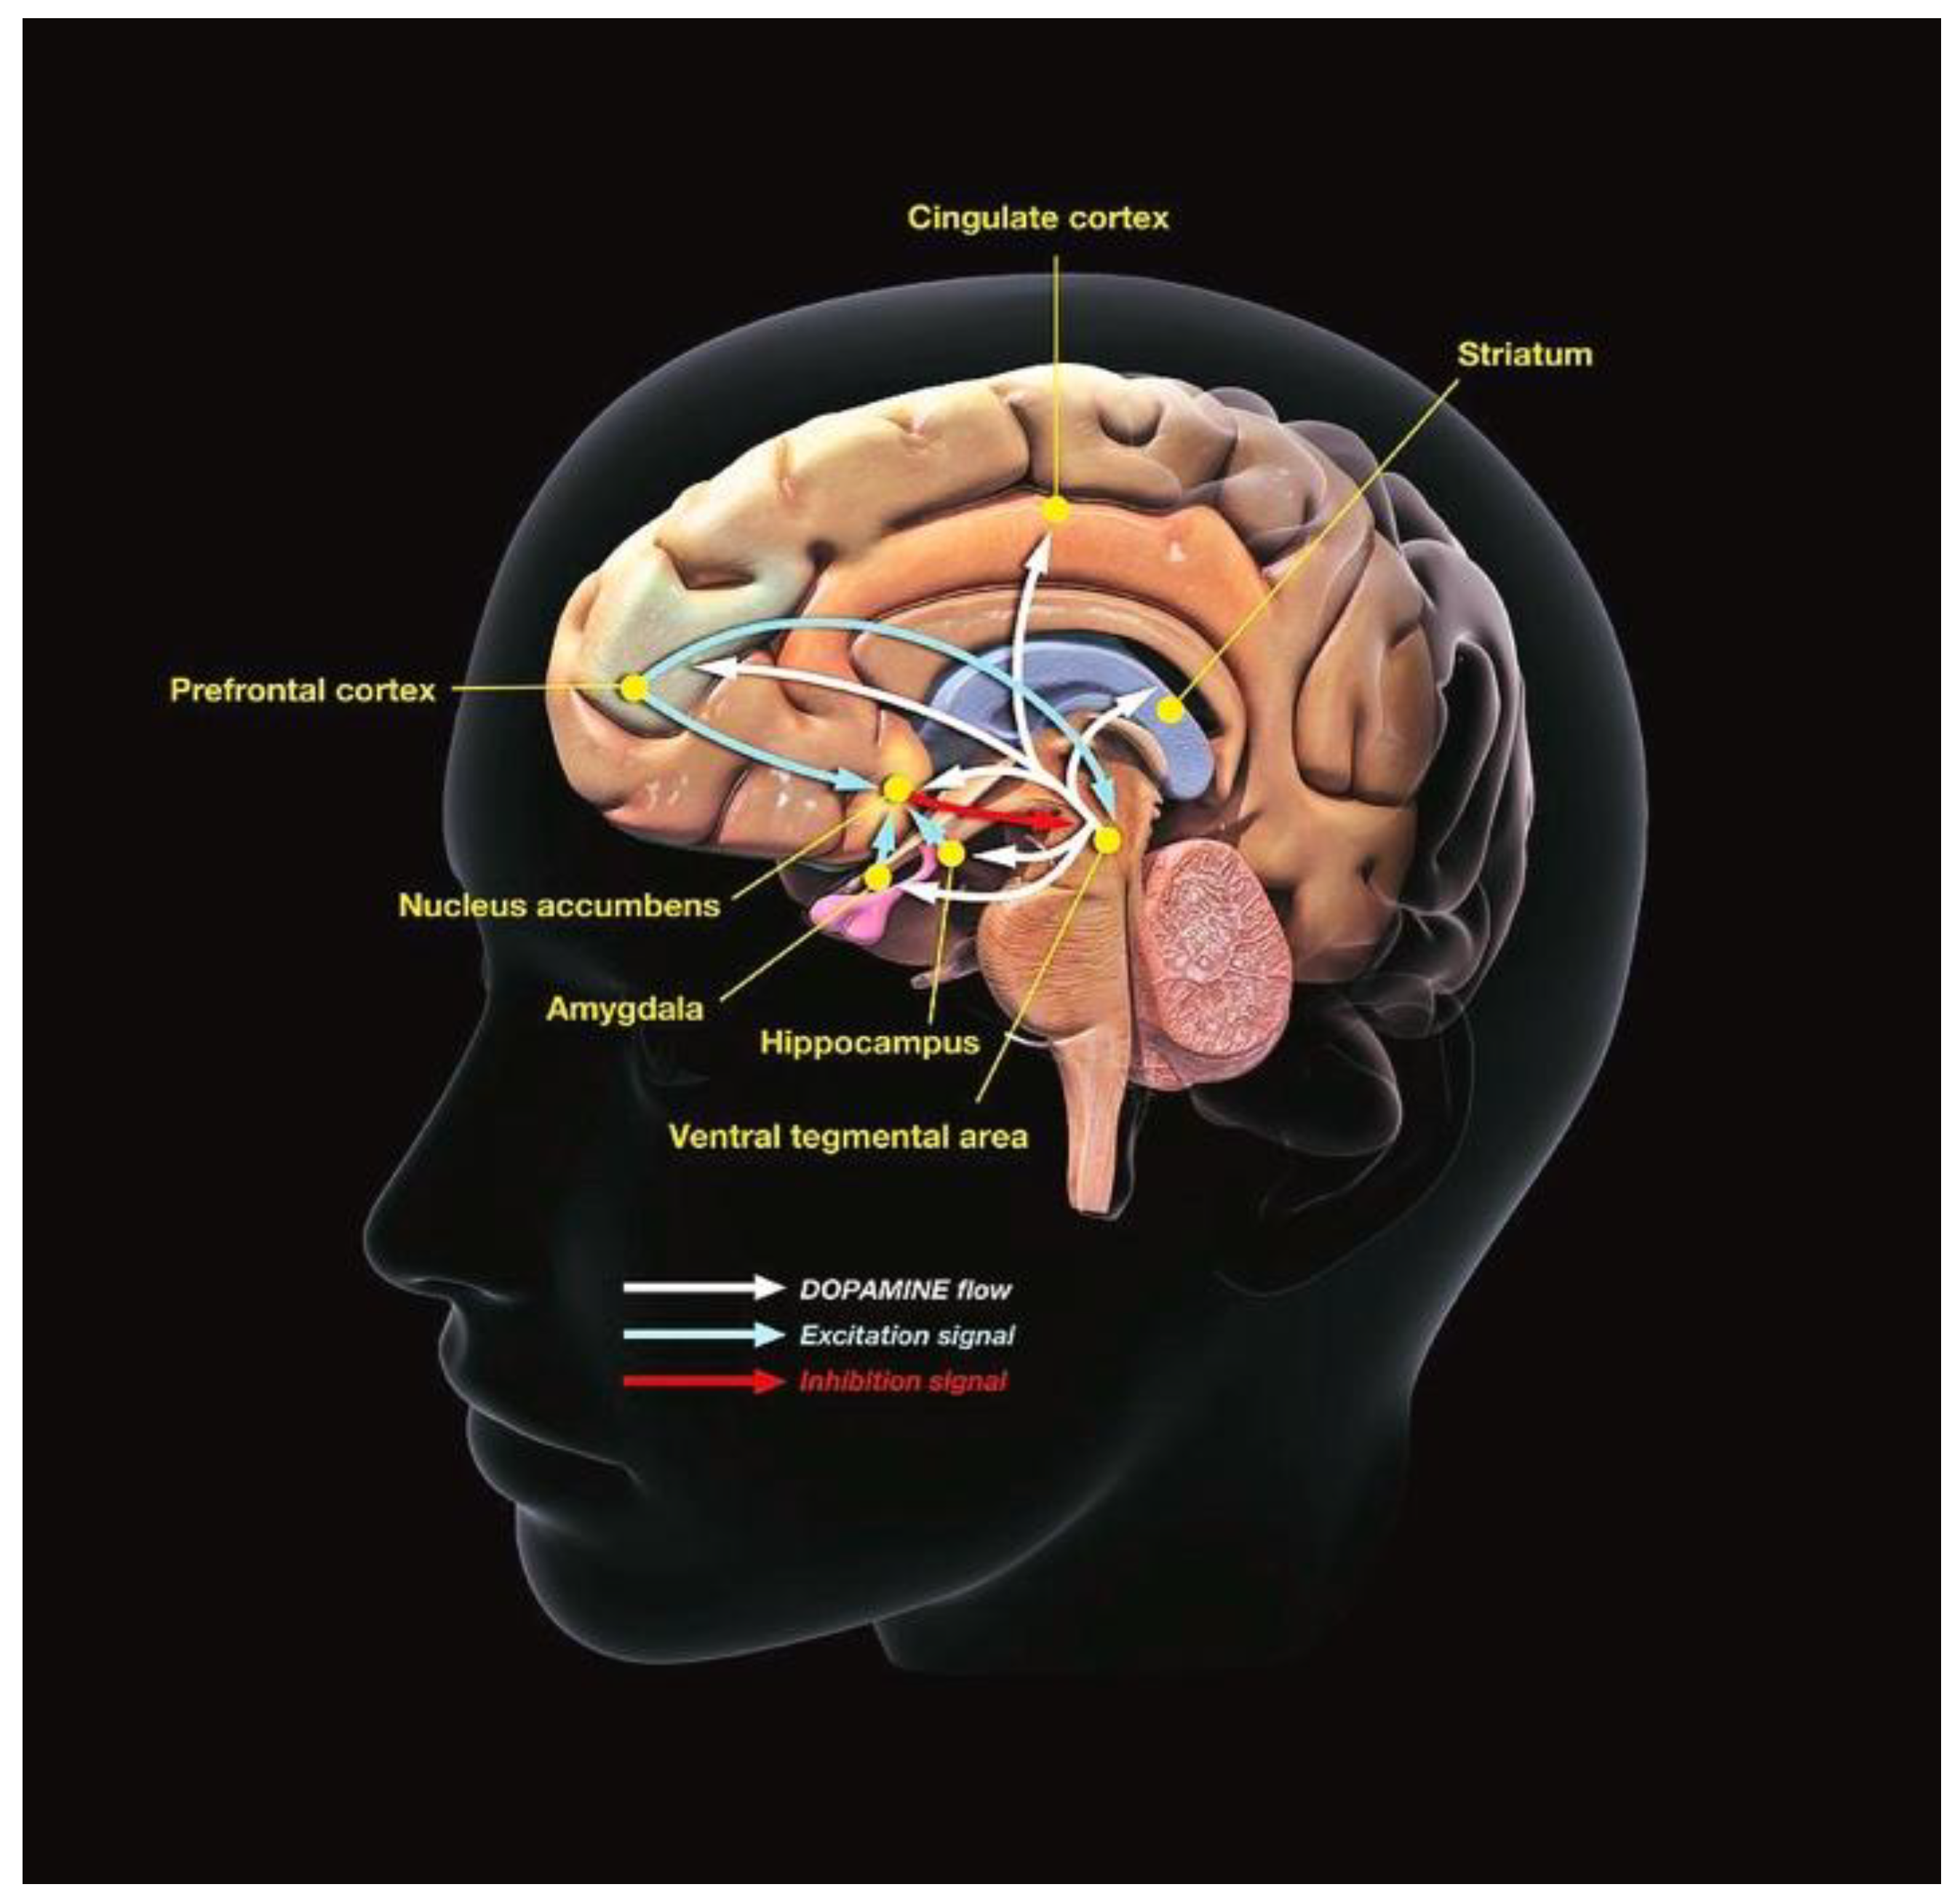
At the neurochemical level, dysregulation in neurotransmitter systems playing key roles in modulating reward function, motivation, and social behavior including dopamine, glutamate, serotonin, and oxytocin [29,30], have been observed in patients with ASD [31,32]. From a neuroanatomical perspective, structural and functional abnormalities in brain reward regions [33], such as the nucleus accumbens, prefrontal cortex, and amygdala [34,35] have been reported to be abnormal in ASD [36,37,38,39].
Genetic variations and environmental factors have likewise been implicated in the ASD etiology and pathophysiology [40,41]. Some of these factors may influence the development and functioning of brain circuits involved in reward processing, predisposing individuals with ASD to dysregulation in this domain. With regard to the genetic makeup, mutations of the dopamine transporter alter dopaminergic signaling which leads to ASD manifestations [42,43,44] as dysregulated nigrostriatal dopaminergic neurotransmission promotes stereotyped movements and habitual behaviors [13,45]. Besides, large number of single gene abnormalities are associated with ASD, and a substantial proportion of these encode synaptic molecules [46] including mTOR dependent increases in neuronal spine density and excess synapses in Tsc2 haplo insufficient mice linked with cortico-striatal hyperconnectivity and resultant stereotypies [47]. ASD patients similarly display such hyperconnectivity [48,49] in conjunction with the dysregulated genes engaging with mTOR [50,51,52,53].
Figure 1.
Simplified schematic of mesolimbic reward pathways. Dopaminergic neurons projecting from the ventral tegmental area (VTA) innervate the prefrontal cortex and the nucleus accumbens which is a central mesolimbic reward structure. The VTA is populated by dopaminergic projecting neurons, and it also receives and sends GABAergic projections, receives glutaminergic projections, and it includes cholinergic (Ach) interneurons. The VTA accepts inputs from many brain loci. Interneurons play crucial roles in transducing and modulating VTA inputs and outputs. Free internet use.
In sum, dysregulated reward system could be an overlapping area underlying diverse aspects of ASD’s symptomatology. Understanding the role of reward and its interface with neurobiological, environmental, and genetic factors could open novel vistas for the development of ASD therapeutic interventions. Here we report on data mining via Genome-Wide Association Studies (GWAS) and deep in silico pharmacogenomic analyses to uncover and validate specific ASD associated neurogenetic and epigenetic signatures. We hypothesized that ASD shares common underlying mechanisms with RDS, suggesting the former as a subset of the latter. Additionally, we strived to investigate whether ASD presets with gene loci associated with genetic addiction risk severity (GARS), serving as a marker for dysregulated reward function [53].
Methods
In summary, according to our previous published papers [54,55,56,57,58,59,60], the strategy of analysis for this investigation was built based on including all phenotypes of GWAS reports related to ASD [obtained from GWAS atlas], then filtering these annotations according to some cutoffs, prioritizing them, and finally use them to find potential interactions in a Multi-Omics perspective (Genomics, Proteomics, Transcriptomics, Metabolomics, and Phenomics) and also systems biology investigations for a deeper and more reliable predictions. Clearly, we theorized that the variants interplay in a sub-genomic level and as such make a larger impact on the phenotypes by Genes, Proteins, miRNAs, TFs, and other signaling pathways playing undiscovered and unknown roles. What we have accomplished relies on mining related to big data (from many GWAS reports) and refining subsequent outcomes based on the best p-values. It also involves the most impacting variant functionalities (Structural and Regulatory vs. non-coding and synonymous), and reliable strong associations among the genes and their proteins based on curated clues from literature. Lastly, our unique strategy also explored a system biological approach to help frame the important instructiveness between the refined genes and ASD manifestations and pathogenesis. In the following, we described the main steps and their details for more clarifications.
SNP-Trait Associations Through Data Mining of GWAS
Our data mining procedure we performed for assessing the ASD phenotype was designed on the basis of the GWAS catalog database (https://www.ebi.ac.uk/gwas/home) [61]. Utilizing this database was employed to help identify all related loci thought various Catalog IDs (CIDs). It is noteworthy to mention that every CID consists of both single and multiple GWA studies. Following extracting the mapped genes from each CID, these genes were combined together. A massive database was then built containing duplications, RNA genes, Pseudogenes, and Protein-coding Genes. Discarding the duplications and deleting the RNA genes and Pseudogenes, the remaining protein-coding genes was a refinement of the resultant data. Importantly following this refinement procedure, they remained. Thus, all further analyses were carried out on this final refined file.
Primary and Deep In Silico Databases
The PGx potential of the GARS panel (DRD1, DRD2, DRD3, DRD4, MAOA, COMT, DAT1, SLC6A4, OPRM1, and GABRA3) in ASD was assessed using our previously published strategy [56,57,58,59,60]. Primary analyses included Protein-Protein Interactions (PPIs); Gene Regulatory Networks (GRNs); Disease, drugs and chemicals (DDCs); and Gene Coexpression Networks (GCNs). PPIs performed by STRING-MODEL and Signaling checked by Cytoscape. GRN is done by Gene-miR Interactions (GMIs) (miRTarBase), and DDC applied Protein-Drug Interactions (PDI) through DrugBank, and Protein-Chemical Interactions (PCI) via Comparative Toxicogenomics Database (CTD). Deep in silico analyses performed in a systems biology analysis by Enrichr for pathway, gene ontology (GO), and Disease-Drugs Associations, and also a Meta-analysis by Metascape. GWAS catalog (https://www.ebi.ac.uk/gwas/home) [61] searched for ASD and all of its related Phenotypes. Each Phenotypes with a unique catalog ID (CID) was obtained separately and after multiple cut-offs including removing the duplicated studies and studies with missing main information, the outputs were then combined together. All details and references are summarized in Table 1 [54,55,61,62,63,64,65,66,67,68,69,70].
Clustering Enriched Ontology (CEO) and Meta-Analyses
Zhou et al employed the accumulative hypergeometric test (or Fisher's exact test) to calculate the p-values and enrichment factors for each ontology category. According to the Metascape research, [70] "ontology terms found in GO form a hierarchical structure of increasing granularity, making the terms inherently redundant." Terms from several ontology sources, like GO, KEGG, and MSigDB, might be closely connected as well. As a result, functional enrichment analysis might reveal duplicated or related phrases, making it difficult to select non-redundant and representative processes for reporting in the analysis output." A flowchart represented in Figure 2 elucidates step-by-step our strategy pipeline with a brief description of each step. This figure illustrates the input, prioritized, and output data for this in deep silica PGx and GWAS investigation.
Statistical Evaluations
In the STRING-MODEL, the expected number of edges represents how many connections would be predicted if nodes (proteins) were selected randomly. A very small PPI enrichment p-value suggests that the actual number of observed edges is much higher than expected by chance, indicating that the proteins are biologically connected rather than randomly distributed. NetworkAnalyst provides two key centrality metrics—degree and betweenness. Nodes with a high degree (i.e., many connections) are considered hubs of the network. Betweenness, on the other hand, reflects how often a node lies on the shortest path between other nodes. Interestingly, a node can have a low degree but still have high betweenness if it connects densely interconnected clusters, serving as a bridge within the network. During module detection, NetworkAnalyst incorporates gene expression values as edge weights. For the enrichment analysis, Enrichr provides several statistical outputs: p-value, q-value, Z-score (rank), and combined score. In this study, we focused on the p-value, q-value, and odds ratio (OR), which are commonly reported in biological research, and did not include the combined score. The p-values were calculated using standard methods such as the hypergeometric test or Fisher’s exact test. These tests assume a binomial distribution and independence in the probability of any gene being part of a specific set. The q-value represents a multiple testing-corrected p-value, adjusted using the Benjamini-Hochberg method to control for false discovery.
Results
GWAS-Based Deep In Silico PGx Investigations
Following a SNP-Trait Association Analysis by GWAS raw data, a primary and a deep in silico PGx analyses successfully carried out on ASD and GARS genes. A pioneering strategy designed starting from raw data of massive GWAS information and followed by a logical pipeline to find novel insights into uncovered mechanisms of actions playing roles in ASD. Statistically, the p-value threshold was <1.E-06 and the input data are summarized in Table 2.
Totally, 17,184 associations and 881 studies included. Following combining the CID, replicated genes were refined (2,980 genes remained). Duplicated genes were removed (990 genes remained) and in the next, based on separated search for each mapped gene in GeneCArds (http://www.genecards.org/), RNA genes and Pseudogenes removed (667 remained). To find the most important curated genes, a PPIs performed by STRING-MODEL and the top 20 genes based on the degree of betweenness (connections) selected for further steps. The top 20 genes extracted from 881 GWAS which were filtered, refined, and prioritized in this study are as follows: CTNNB1, ESR1, RHOA, CDC42, FOXO3, MAP3K7, PRKCD, ERBB4, UBE2D3, MAPT, CTNND1, HDAC4, BRAF, ESR2, PPP2R5C, ERBB3, TLR4, HTT, SRC, and GRIN2B. Next, these 20 GWAS-mined genes were combined with 10 GARS genes in a final list to find any potential relationships. This candidate genes list was tested by another STRING-MODEL (Figure 3).
Signaling
Cytoscape [71] identified dopaminergic synapse through Signor (https://signor.uniroma2.it/) as the most significant curated pathway among the genes listed in this study. DRD1, DRD2, DRD3, DRD4, and GRIN2B with a similarity score of 0.19 and a p-value of 8.68E-6 involved in dopaminergic synapse (Figure 4).
GMIs
A Linear Bi/Tripartite model visualized by NetworkAnalyst revealed multiple Gene-miRNA associations, among them, hsa-miR-16-5p found most-interacted with a linking degree of 7 with COMT, OPRM1, MAP3K7, PPP2R5C, PRKCD, HTT, and SLC6A4 genes (Figure 5).
PDIs
Through a Fruchterman-Rheingold model of PDIs, Networkanalyst outputs displayed that there are connections among the FDA-Approved drugs from Drugbank [72] and genes of interest. There are important axes which demonstrate the associations of ASD with RDS; the important axes might be as follows: 1) COMT> [Nialamide]>MAOA>[Minaprine]>DRD2>[Amoxapine]>GABRA3. 2) PRKCD>[Tamoxifen]>ESR2>[Dehydroepiandrosterone]>GABRA3>[Amoxapine]>DRD4. 3) PRKCD>[Tamoxifen]>ESR2>[Dehydroepiandrosterone]>GRIN2B>[Haloperidol]>DRD1. Results indicate that Amoxapine has a central role with strong connections (DRD1, DRD2, DRD4, SLC6A4. SLC6A3, and GABRA3). Interestingly, Dehydroepiandrosterone correlates with three important genes ESR2, GRIN2B (both genes are in ASD group), and GABRA3 (GARS genes); and also, Haloperidol links with DRD1, DRD2 (both GARS genes), and GRIN2B (ASD gene) (Figure 6).
PCIs
Enrichr Analysis (EA) Results
Following primary in silico analyses (STRING-MODEL, Signaling, GMIs, PDIs, and PCIs), EA, Multi-Omics, and Meta-analysis performed for the candidate gene list mined and prioritized form GWA studies which described earlier.
1. Pathways
Reactome 2022, KEGG 2021, and Panther 2016 were employed to find the potential pathways related to the candidate gene list. By combining and categorizing all three databases’ results, Table 3 was generated showing Dopaminergic synapse with a q-value of 3.6E-11 as the most significant pathway predicted by KEGG. Noteworthy, the top-scored pathway of PANTHER is Dopamine receptor mediated signaling pathway Homo sapiens (P05912). In addition, following Signal Transduction R-HAS-162582, Reactome also predicted Dopamine Receptors R-HAS-390651.
Metabolomics Predictions
As an episodic analysis, Metabolomics Workbench Metabolites 2022 indicated that the most impacted metabolite playing a key role among ASD and RDS was Dopamine (q-value=3.25x10⁻⁴), followed by Pyruvaldehyde, N4-Acetylaminobutanal, 3,4-Dihydroxyphenylglycol, Indoleacetaldehyde, and Serotonin.

Metabolomics Workbench Metabolites 2022
| Index | Name | P-value | Adjusted p-value | Odds Ratio |
|---|---|---|---|---|
| 1 | Dopamine | 0.00003250 | 0.0003250 | 356.54 |
| 2 | Pyruvaldehyde | 0.008967 | 0.01492 | 137.69 |
| 3 | N4-Acetylaminobutanal | 0.008967 | 0.01492 | 137.69 |
| 4 | 3,4-Dihydroxyphenylglycol | 0.008967 | 0.01492 | 137.69 |
| 5 | Indoleacetaldehyde | 0.01045 | 0.01492 | 114.74 |
| 6 | Serotonin | 0.01045 | 0.01492 | 114.74 |
| 7 | 5-Hydroxyindoleacetaldehyde | 0.01045 | 0.01492 | 114.74 |
| 8 | 3,4-Dihydroxymandelaldehyde | 0.01194 | 0.01492 | 98.34 |
| 9 | S-Adenosylhomocysteine | 0.06679 | 0.07239 | 15.27 |
| 10 | S-Adenosylmethionine | 0.07239 | 0.07239 | 14.02 |
2. Gene Ontologies (GO)
Integral GO analyses were conducted including Biological Process, Cellular Component, and Molecular Function indexes. The results of each process were then merged and summarized in Table 4. Table 4 clearly shows that the most significant GO process is Dopamine Metabolic Process (GO: 0042417) with a q-value of 1.72x10⁻¹⁰. Furthermore, the top-scored processes in Cellular Component and Molecular Function were Neuron Projection (GO: 0043005) and Kinase Binding (GO: 0019900), respectively.
3. Diseases Drugs Associations
To reach a confidential clinical prediction, the list containing 20 GWAS-mined and 10 GARS genes were checked through three clinical disease/disorder databases (i.e. DisGeNET, GeDiPNet 2023, and Jensen DISEASES). Table 5 shows the output of combining and categorizing all three databases based on the best q-value. According to this table, the most significant phenotype related to the candidate gene list which was predicted by DisGeNET is Obsessive-Compulsive Disorder (q-value=1.49x10⁻¹⁶). Additionally, substance abuse disorder (q-value= 6.38x10⁻¹⁵) and Mental depression (q-value= 1.06x10⁻¹⁴) were the best-scored diseases assessed by Jensen DISEASES and GeDiPNet, respectively.
Multi-Omics Analysis by Enrichr-KG
Using Enrichr-KG [74], we selected 5 libraries to set a Multi-Omics analysis including GWAS catalog (Genomics), KEGG (Proteomics), Gene Ontology (Metabolomics), TRRUST (Transcriptomics), and DisGeNET (Phenomics). Multi-Omics results supported the role of ASD as endophenotype and RDS as true phenotype (Table 6 and Figure 8).
Meta-Analysis by Metascape
Pathway and Process Enrichment Analysis
For each gene list, pathway and process enrichment analyses were performed using the following ontology sources: KEGG Pathway, GO Biological Processes, Reactome Gene Sets, Canonical Pathways, CORUM, and WikiPathways. Terms having a p-value < 0.01, a minimum count of 3, and an enrichment factor > 1.5 (the ratio between observed and predicted counts) are sorted into clusters based on membership similarities. More specifically, p-values were determined using the cumulative hypergeometric distribution [75], whereas q-values are derived using the Benjamini-Hochberg process to account for multiple testing . When doing hierarchical clustering on enriched phrases, Kappa scores [76] are used as the similarity measure, and sub-trees with a similarity greater than 0.3 are deemed clusters. The most statistically significant phrase inside a cluster is selected to represent the cluster (Table 7).
To further capture the relationships between the terms, a subset of enriched terms was selected and rendered with the best p-values from each of the 20 clusters, with the constraint that there are no more than 15 terms per cluster and no more than 250 terms in total. The network is envisaged by Cytoscape, where each node characterizes an enriched term and is colored first by its cluster ID and then by its p-value (Figure 9).
PPI Enrichment Analysis
For the given gene list, PPI enrichment analysis was performed with the following databases: STRING, BioGrid [77], and OmniPath [78]. In WebIM. Only physical interactions in STRING (physical score > 0.132) and BioGrid were utilized. The resultant network consists of the subset of proteins form physical interactions with at least one other member in the list [79]. The MCODE networks [80] detected for the gene list have been collected and are shown in Figure 8. Pathway and process enrichment analysis used to each MCODE component independently, and the three best-scoring terms by p-value retained as the functional description of the corresponding components, described in the legend of Figure 10.
PGx Variant Annotation Assessment (PGx-VAA)
PGx-VAA was conducted to find the strength and gaps of the gene towards the development of a novel personalized medicine treatment for patients undergoing ASD and to detect the risk alleles of ASD by an updated GARS test. To reach this goal, a wide screening was conducted on all 30 genes of interest and 1,419 annotations found. Among these annotations 571 were significant and reliable to follow for drug prescribing and risk allele genotyping. Notably, no significant PGx annotations were found for these genes: CDC42, FOXO3, MAP3K7, PRKCD, ERBB4, UBE2D3, HDAC4, PPP2R5C, BRAF, HTT, GABRA3, and SRC. According to the findings of the present investigation, there are major PGx suggestions which might signify these evidence-based in silico results and reveal the clinical gaps between ASD and RDS. These gaps can strongly be the PGx variations need to be tested in the future studies. For example, PPP2R5C indicated a powerful Clustered PPI contact with DRD2 and HDAC4 is link MAOA to ESR1 and CTNNB1. Concordantly with GWAS mining results, CTNNB1 was the top-scored gene of ASD. Regarding Figure 8, there are two axes which should be considered between ASD and RDS; The first axis is DRD1>DRD3>DRD2>PPP2R5C>CTNNB1>>>other genes and the second axis is DRD3>COMT>MAOA>HDAC4>[MAP3K7]-[ESR1]-[CTNNB1]>>other genes. Both of these axes are important and are highly recommended to be investigated in future studies; but the second axis contains interesting genes with epigenetic impacts such as COMT (a methyl transferase) and HDAC4 (a Histone deacetylase influences on Histone modifications).
Discussion
Our research elucidated the genetic architecture of Autism Spectrum Disorder (ASD) by leveraging GWAS. Utilizing the GWAS catalog, our goal was to comprehensively identify entries linked to ASD. This initial step involved aggregating genes listed under each relevant catalog ID (CID), resulting in a collection that included various gene types. Through a process of elimination that removed duplicates and non-protein-coding genes, we arrived at a curated list of protein-coding genes for deeper analysis. This method mirrors previously established approaches to explore pharmacogenomics potentials within the ASD context, particularly regarding the GARS panel [54,55,56,57,58,59,60]. The core of our analysis encompassed evaluating Protein-Protein Interactions (PPIs), Gene Regulatory Networks (GRNs), and interactions between genes, diseases, drugs, and chemicals. We utilized STRING-MODEL for PPIs and Cytoscape for examining signaling pathways. The analysis of GRNs was facilitated by miRTarBase, while interactions with drugs and chemicals were explored using DrugBank and the Comparative Toxicogenomics Database (CTD), respectively.
Our comprehensive review included 17,184 associations across 881 studies. After synthesizing this data, we refined our gene list down to 990 unique entries. Further validation through GeneCards (http://www.genecards.org/) led to a distilled list of 667 genes after the removal of RNA genes and pseudogenes. The most significant genes were identified using STRING-MODEL based on their network centrality, with the top 20 genes being CTNNB1, ESR1, RHOA, CDC42, FOXO3, MAP3K7, PRKCD, ERBB4, UBE2D3, MAPT, CTNND1, HDAC4, BRAF, ESR2, PPP2R5C, ERBB3, TLR4, HTT, SRC, and GRIN2B. These, along with 10 genes from the GARS panel, formed the basis of our subsequent analyses.
We observed notable interactions, particularly highlighting extensive engagement of hsa-miR-16-5p with several genes. The examination of protein-drug and protein-chemical interactions unearthed significant links, notably between ESR1 and various chemicals, with Aflatoxin B1 standing out due to its importance. Further in silico analyses integrating results from Reactome 2022, KEGG 2021, and Panther 2016, revealed the dopaminergic synapse pathway as highly significant. Metabolomics Workbench Metabolites 2022 data pinpointed dopamine as a critical metabolite in ASD and related disorders. Gene Ontology (GO) analyses highlighted the dopamine metabolic process as notably significant. Clinical databases such as DisGeNET and others underscored Obsessive-Compulsive Disorder as a highly associated phenotype. Our multi-omics analysis, utilizing five different libraries, solidified the conceptualization of ASD as an endophenotype. A meta-analysis via Metascape, employing several databases, further refined our understanding, identifying the dopamine metabolic process as crucially involved in ASD. This research, by integrating comprehensive genetic data and multiple analytical frameworks, enhances our understanding of ASD's genetic basis and its potential implications for therapeutic strategies.
Clinical Relevance
The Pharmacogenomics Variant Annotation Assessment (PGx-VAA) aimed to explore the potential and limitations of a gene set proposed in our study for pioneering personalized treatment approaches for ASD patients, alongside identifying ASD risk alleles using a refined GARS test. This comprehensive analysis covered 30 genes, yielding 1,419 annotations, of which 571 were deemed significant and potentially useful for therapeutic targeting and precision in medication dosing based on risk allele genotyping.
Significantly, no pharmacogenomics annotations were identified for a subset of genes including CDC42, FOXO3, MAP3K7, PRKCD, ERBB4, UBE2D3, HDAC4, PPP2R5C, BRAF, HTT, GABRA3, and SRC. These findings point to critical pharmacogenomics gaps in ASD and related disorders that future research must address. For instance, PPP2R5C shows a strong interaction with DRD2 in Clustered Protein-Protein Interactions (PPIs), and HDAC4 links MAOA with ESR1 and CTNNB1, the latter being highly implicated in ASD as noted in our GWAS analysis. Two key interaction pathways emerged from our study: one involving DRD1, DRD3, DRD2, PPP2R5C, CTNNB1, and other genes, and a second pathway connecting DRD3, COMT, MAOA, HDAC4, MAP3K7, ESR1, and CTNNB1 with other genes. These pathways, particularly the second with its epigenetic significance involving COMT and HDAC4, highlight areas for future investigation. The interactions suggest a complex network of pharmacogenomic influences warranting further exploration.
The complexity of therapeutic strategies in ASD patients is on an equal footing with the intricate nature of the ASD syndrome per se, environmental impacts, patients’ personalities, and their neurobiological characteristics with predispositions. Personalized medicine is the fitting setting for matching the innovative therapeutic strategies to eligible candidates [23]. For instance, our team's previous success with Personalized Transcranial Magnetic Stimulation (PrTMS) in treating another disorder from the RDS continuum [81,82] namely post-traumatic stress disorder) supports the PrTMS potential utility in addressing RDS in ASD guided by the pharmacogenomic framework anchored in our findings.
A harm reduction approach employed in opioid addicted patients is an illicit opioid’ substitution with an opioid drug with the with lesser addiction potential e.g., buprenorphine [83]. It is notable that buprenorphine, which has been shown to stabilize reward function [84,85] has also been successfully tried in an ASD patient [86]. It would be of interest to explore whether genetic testing may identify ASD patients who are eligible for the opioid medication assisted therapy. While the reasoning behind administering an addictive substance to individuals prone to addiction may appear counterintuitive, this method could be beneficial for patients experiencing significant RDS symptoms. In that regard, there are reports on a subgroup of depressed patients who failed the treatment with conventional antidepressants but had a beneficial response to buprenorphine [87].
There are non-addictive alternatives to opioids that may restore pathological states of reward deficiency [24,88] including antidepressants [89]. anticonvulsants and neuroleptics [88] as well as dietary supplement, Acetyl-L-carnitine [90], a neurotrophic, neuroprotective and antidepressant agent and a nutraceutical combination of DA precursors with inhibitors of the DA degrading enzyme Catechol-O- methyl transferase [91]. Antagonism of the N-Methyl-D- aspartate glutamate receptors is another strategy specifically effective for reward deficiency [92]. Reward deficiency can be also targeted by behavioral techniques e.g., Positive Affect Treatment purported to improve anticipatory, consummatory and learning reward components [93] as well as by the Positive Affect Stimulation and Sustainment therapy providing the tools for enhancing the salience and learning how to sustain positive affects [94].
To enhance readership comprehension, we hereby provide Table 8 demonstrating known clinical relevance for each gene we found in our study.
Limitations
One potential issue with the utilization of large databank retrieval data may induce some concern but is currently unavoidable lies in the robustness of the GWAS location collected from the database. While computational and meta-analyses have been a mainstream analytical acceptable tool, we must point out that these loci may not always reflect consistently reliable across studies, given the inherent bias introduced by heterogeneous sample recruitment and ascertainment criteria. Certainly, these could involve variability in population demographics, diagnostic definitions, and phenotypic measurements across studies and might impact the reproducibility of GWAS findings. While Genetic liability and clinical heterogeneity in ASD are heavily influenced by sex, in the current study we did not explore in any detail the possibility of gender differences [95,96]. While we provided the various genes showing significant load onto the ASD phenotype, and of course the data in these utilized data banks report many annotations and risk polymorphisms, with known ASD risk genes or exhibit consistent cell-type-specific expression patterns relevant to ASD, the actual identification of all these risk polymorphisms per se was not the focus of the current study but will be addressed in future analyses. It is noteworthy that several postmortem studies, utilizing both bulk and single-cell RNA sequencing from fetal to adult stages, have demonstrated a functional convergence of ASD risk genes in pathways related to early neurogenesis, particularly during mid-fetal development [97,98].
Conclusions
Through data mining of GWAS and in silico analyses, this study uncovers genetic and epigenetic markers related to ASD, proposing the disorder as an endophenotype of RDS. Innovative methodologies, including protein-protein interactions, gene regulatory networks, and systems biology analyses, are employed to identify significant pathways and gene ontologies associated with ASD. The multi-omics analysis integrates findings across genomics, proteomics, metabolomics, and phenomics, reinforcing the concept of ASD as an endophenotype of RDS. This comprehensive approach offers new insights into the genetic architecture and molecular mechanisms of ASD, paving the way for personalized medicine strategies and novel therapeutic interventions.
Funding
KB, NIH recipient of R41 MD012318/ MD/NIMHD NIH HHS/United States. R.D.B. is the recipient of NIH R01NS073884.
Author Contribution
AS, KB, KM, KUL, AP, IE MSG, MPK, KT developed the initial manuscript, and all co-authors commented and edited the manuscript and approved.
Acknowledgements
The authors appreciate the expert edits by Margaret A. Madigan
Conflicts of Interest
Prof. Kenneth Blum holds patents both domestic and foreign related to pro-dopamine regulation complexes and genetic testing for addiction risk. Through his company Synaptamine inc., licensed patents on KB220Z to Victory nutrition international, LLC. There are no other conflicts to report.
References
- Knopf, A. Autism prevalence increases from 1 in 60 to 1 in 54: CDC. The Brown University Child and Adolescent Behavior Letter 2020, 36, 4–4. [Google Scholar]
- Cakir, J.; Frye, R.E.; Walker, S.J. The lifetime social cost of autism: 1990–2029. Research in Autism Spectrum Disorders 2020, 72, 101502. [Google Scholar]
- Neggers, Y.H. Increasing Prevalence, Changes in Diagnostic Criteria, and Nutritional Risk Factors for Autism Spectrum Disorders. ISRN Nutr. 2014, 2014, 1–14. [Google Scholar] [CrossRef]
- Lordan, R. Storni, and C.A. De Benedictis, Autism spectrum disorders: diagnosis and treatment. 2021.
- Harm, M., M. Hope, and A. Household, American Psychiatric Association, 2013, Diagnostic and Statistical Manual of Mental Disorders, 5th edn, Washington, DC: American Psychiatric Association Anderson, J, Sapey, B, Spandler, H (eds), 2012, Distress or Disability?, Lancaster: Centre for Disability Research, www. lancaster. ac. uk. Arya. 347: p. 64.
- Mohapatra, A.N.; Wagner, S. The role of the prefrontal cortex in social interactions of animal models and the implications for autism spectrum disorder. Front. Psychiatry 2023, 14, 1205199. [Google Scholar] [CrossRef]
- Matyjek, M.; Bayer, M.; Dziobek, I. Reward responsiveness in autism and autistic traits–Evidence from neuronal, autonomic, and behavioural levels. NeuroImage: Clinical 2023, 38, 103442. [Google Scholar]
- Weir, E.; Allison, C.; Baron-Cohen, S. Understanding the substance use of autistic adolescents and adults: a mixed-methods approach. Lancet Psychiatry 2021, 8, 673–685. [Google Scholar] [CrossRef]
- Butwicka, A.; Långström, N.; Larsson, H.; Lundström, S.; Serlachius, E.; Almqvist, C.; Frisén, L.; Lichtenstein, P. Increased Risk for Substance Use-Related Problems in Autism Spectrum Disorders: A Population-Based Cohort Study. J. Autism Dev. Disord. 2016, 47, 80–89. [Google Scholar] [CrossRef]
- Grapel, J.N.; Cicchetti, D.V.; Volkmar, F.R. Sensory features as diagnostic criteria for autism: sensory features in autism. The Yale journal of biology and medicine 2015, 88, 69–71. [Google Scholar]
- Ben-Sasson, A.; Gal, E.; Fluss, R.; Katz-Zetler, N.; Cermak, S.A. Update of a Meta-analysis of Sensory Symptoms in ASD: A New Decade of Research. J. Autism Dev. Disord. 2019, 49, 4974–4996. [Google Scholar] [CrossRef]
- Feldman, J.I.; Cassidy, M.; Liu, Y.; Kirby, A.V.; Wallace, M.T.; Woynaroski, T.G. Relations between Sensory Responsiveness and Features of Autism in Children. Brain Sci. 2020, 10, 775. [Google Scholar] [CrossRef]
- Pavăl, D. A Dopamine Hypothesis of Autism Spectrum Disorder. Dev. Neurosci. 2017, 39, 355–360. [Google Scholar] [CrossRef]
- Lovaas, I.; Newsom, C.; Hickman, C. SELF-STIMULATORY BEHAVIOR AND PERCEPTUAL REINFORCEMENT. J. Appl. Behav. Anal. 1987, 20, 45–68. [Google Scholar] [CrossRef]
- Boyd, B.A.; McDonough, S.G.; Bodfish, J.W. Evidence-Based Behavioral Interventions for Repetitive Behaviors in Autism. J. Autism Dev. Disord. 2011, 42, 1236–1248. [Google Scholar] [CrossRef]
- Foss-Feig, J.H.; Heacock, J.L.; Cascio, C.J. Tactile responsiveness patterns and their association with core features in autism spectrum disorders. Res. Autism Spectr. Disord. 2012, 6, 337–344. [Google Scholar] [CrossRef]
- Balasco, L.; Provenzano, G.; Bozzi, Y. Sensory Abnormalities in Autism Spectrum Disorders: A Focus on the Tactile Domain, From Genetic Mouse Models to the Clinic. Front. Psychiatry 2020, 10, 1016. [Google Scholar] [CrossRef]
- Yin, H.H.; Knowlton, B.J. The role of the basal ganglia in habit formation. Nat. Rev. Neurosci. 2006, 7, 464–476. [Google Scholar] [CrossRef]
- Alvares, G.A.; Balleine, B.W.; Whittle, L.; Guastella, A.J. Reduced goal-directed action control in autism spectrum disorder. Autism Res. 2016, 9, 1285–1293. [Google Scholar] [CrossRef]
- Dichter, G.S.; A Damiano, C.; A Allen, J. Reward circuitry dysfunction in psychiatric and neurodevelopmental disorders and genetic syndromes: animal models and clinical findings. J. Neurodev. Disord. 2012, 4, 19–19. [Google Scholar] [CrossRef]
- Clements, C.C. Evaluation of the social motivation hypothesis of autism: a systematic review and meta-analysis. JAMA psychiatry 2018, 75, 797–808. [Google Scholar]
- Tian, J.; Gao, X.; Yang, L. Repetitive Restricted Behaviors in Autism Spectrum Disorder: From Mechanism to Development of Therapeutics. Front. Neurosci. 2022, 16, 780407. [Google Scholar] [CrossRef]
- Hendry, E.; McCallister, B.; Elman, D.J.; Freeman, R.; Borsook, D.; Elman, I. Validity of mental and physical stress models. Neurosci. Biobehav. Rev. 2024, 158, 105566–105566. [Google Scholar] [CrossRef]
- Elman, I.; Borsook, D. Common Brain Mechanisms of Chronic Pain and Addiction. Neuron 2016, 89, 11–36. [Google Scholar] [CrossRef]
- Elman, I.; Borsook, D.; Volkow, N.D. Pain and suicidality: Insights from reward and addiction neuroscience. Prog. Neurobiol. 2013, 109, 1–27. [Google Scholar] [CrossRef]
- Chevallier, C.; Kohls, G.; Troiani, V.; Brodkin, E.S.; Schultz, R.T. The social motivation theory of autism. Trends Cogn. Sci. 2012, 16, 231–239. [Google Scholar] [CrossRef]
- Bowirrat, A.; Elman, I.; A Dennen, C.; Gondré-Lewis, M.C.; Cadet, J.L.; Khalsa, J.; Baron, D.; Soni, D.; Gold, M.S.; McLaughlin, T.J.; et al. Neurogenetics and Epigenetics of Loneliness. Psychol. Res. Behav. Manag. 2023, ume 16, 4839–4857. [Google Scholar] [CrossRef]
- Blum, K.; Ashford, J.W.; Kateb, B.; Sipple, D.; Braverman, E.; Dennen, C.A.; Baron, D.; Badgaiyan, R.; Elman, I.; Cadet, J.L.; et al. Dopaminergic dysfunction: Role for genetic & epigenetic testing in the new psychiatry. J. Neurol. Sci. 2023, 453, 120809. [Google Scholar] [CrossRef]
- Love, T.M. Oxytocin, motivation and the role of dopamine. Pharmacology Biochemistry and Behavior 2014, 119, 49–60. [Google Scholar]
- Sato, M. Social circuits and their dysfunction in autism spectrum disorder. Molecular Psychiatry 2023, 28, 3194–3206. [Google Scholar]
- Marotta, R.; Risoleo, M.C.; Messina, G.; Parisi, L.; Carotenuto, M.; Vetri, L.; Roccella, M. The Neurochemistry of Autism. Brain Sci. 2020, 10, 163. [Google Scholar] [CrossRef]
- Zhao, F.; Zhang, H.; Wang, P.; Cui, W.; Xu, K.; Chen, D.; Hu, M.; Li, Z.; Geng, X.; Wei, S. Oxytocin and serotonin in the modulation of neural function: Neurobiological underpinnings of autism-related behavior. Front. Neurosci. 2022, 16, 919890. [Google Scholar] [CrossRef]
- Rothwell, P.E. Autism Spectrum Disorders and Drug Addiction: Common Pathways, Common Molecules, Distinct Disorders? Front. Neurosci. 2016, 10, 20. [Google Scholar] [CrossRef]
- Kohls, G.; Schulte-Rüther, M.; Nehrkorn, B.; Müller, K.; Fink, G.R.; Kamp-Becker, I.; Herpertz-Dahlmann, B.; Schultz, R.T.; Konrad, K. Reward system dysfunction in autism spectrum disorders. Soc. Cogn. Affect. Neurosci. 2012, 8, 565–572. [Google Scholar] [CrossRef]
- Kohls, G. Social ‘wanting’dysfunction in autism: neurobiological underpinnings and treatment implications. Journal of Neurodevelopmental Disorders 2012, 4, 1–20. [Google Scholar]
- Janouschek, H.; Chase, H.W.; Sharkey, R.J.; Peterson, Z.J.; Camilleri, J.A.; Abel, T.; Eickhoff, S.B.; Nickl-Jockschat, T. The functional neural architecture of dysfunctional reward processing in autism. NeuroImage: Clin. 2021, 31, 102700. [Google Scholar] [CrossRef]
- Clements, C.C.; Ascunce, K.; Nelson, C.A. Ascunce, and C.A. Nelson, In context: A developmental model of reward processing, with implications for autism and sensitive periods. Journal of the American Academy of Child & Adolescent Psychiatry 2023, 62, 1200–1216. [Google Scholar]
- Dichter, G.S.; Felder, J.N.; Green, S.R.; Rittenberg, A.M.; Sasson, N.J.; Bodfish, J.W. Reward circuitry function in autism spectrum disorders. Soc. Cogn. Affect. Neurosci. 2010, 7, 160–172. [Google Scholar] [CrossRef]
- Bottini, S. Social reward processing in individuals with autism spectrum disorder: A systematic review of the social motivation hypothesis. Res. Autism Spectr. Disord. 2018, 45, 9–26. [Google Scholar] [CrossRef]
- Almandil, N.B.; Alkuroud, D.N.; AbdulAzeez, S.; AlSulaiman, A.; Elaissari, A.; Borgio, J.F. Environmental and Genetic Factors in Autism Spectrum Disorders: Special Emphasis on Data from Arabian Studies. Int. J. Environ. Res. Public Heal. 2019, 16, 658. [Google Scholar] [CrossRef]
- Yoon, S.H.; Choi, J.; Lee, W.J.; Do, J.T. Genetic and Epigenetic Etiology Underlying Autism Spectrum Disorder. J. Clin. Med. 2020, 9, 966. [Google Scholar] [CrossRef]
- Mandic-Maravic, V. Dopamine in autism spectrum disorders—focus on D2/D3 partial agonists and their possible use in treatment. Frontiers in psychiatry 2022, 12, 787097. [Google Scholar]
- Herborg, F.; Andreassen, T.F.; Berlin, F.; Loland, C.J.; Gether, U. Neuropsychiatric disease–associated genetic variants of the dopamine transporter display heterogeneous molecular phenotypes. J. Biol. Chem. 2018, 293, 7250–7262. [Google Scholar] [CrossRef]
- DiCarlo, G.E.; Aguilar, J.I.; Matthies, H.J.; Harrison, F.E.; Bundschuh, K.E.; West, A.; Hashemi, P.; Herborg, F.; Rickhag, M.; Chen, H.; et al. Autism-linked dopamine transporter mutation alters striatal dopamine neurotransmission and dopamine-dependent behaviors. J. Clin. Investig. 2019, 129, 3407–3419. [Google Scholar] [CrossRef]
- Kosillo, P.; Bateup, H.S. Dopaminergic Dysregulation in Syndromic Autism Spectrum Disorders: Insights From Genetic Mouse Models. Front. Neural Circuits 2021, 15. [Google Scholar] [CrossRef]
- Kim, S.; Sato, Y.; Mohan, P.S.; Peterhoff, C.; Pensalfini, A.; Rigoglioso, A.; Jiang, Y.; A Nixon, R. Evidence that the rab5 effector APPL1 mediates APP-βCTF-induced dysfunction of endosomes in Down syndrome and Alzheimer’s disease. Mol. Psychiatry 2015, 21, 707–716. [Google Scholar] [CrossRef]
- Hochberg, Y.; Benjamini, Y. More powerful procedures for multiple significance testing. Stat. Med. 1990, 9, 811–818. [Google Scholar]
- Shepherd, G.M.G. Corticostriatal connectivity and its role in disease. Nat. Rev. Neurosci. 2013, 14, 278–291. [Google Scholar] [CrossRef]
- Masuda, F.; Nakajima, S.; Miyazaki, T.; Yoshida, K.; Tsugawa, S.; Wada, M.; Ogyu, K.; Croarkin, P.E.; Blumberger, D.M.; Daskalakis, Z.J.; et al. Motor cortex excitability and inhibitory imbalance in autism spectrum disorder assessed with transcranial magnetic stimulation: a systematic review. Transl. Psychiatry 2019, 9, 1–9. [Google Scholar] [CrossRef]
- Pagani, M.; Barsotti, N.; Bertero, A.; Trakoshis, S.; Ulysse, L.; Locarno, A.; Miseviciute, I.; De Felice, A.; Canella, C.; Supekar, K.; et al. mTOR-related synaptic pathology causes autism spectrum disorder-associated functional hyperconnectivity. Nat. Commun. 2021, 12, 1–15. [Google Scholar] [CrossRef]
- Ganesan, H. mTOR signalling pathway-A root cause for idiopathic autism? BMB reports 2019, 52, 424. [Google Scholar]
- Wang, B.; Qin, Y.; Wu, Q.; Li, X.; Xie, D.; Zhao, Z.; Duan, S. mTOR Signaling Pathway Regulates the Release of Proinflammatory Molecule CCL5 Implicated in the Pathogenesis of Autism Spectrum Disorder. Front. Immunol. 2022, 13, 818518. [Google Scholar] [CrossRef]
- Blum, K.; Brodie, M.S.; Pandey, S.C.; Cadet, J.L.; Gupta, A.; Elman, I.; Thanos, P.K.; Gondre-Lewis, M.C.; Baron, D.; Kazmi, S.; et al. Researching Mitigation of Alcohol Binge Drinking in Polydrug Abuse: KCNK13 and RASGRF2 Gene(s) Risk Polymorphisms Coupled with Genetic Addiction Risk Severity (GARS) Guiding Precision Pro-Dopamine Regulation. J. Pers. Med. 2022, 12, 1009. [Google Scholar] [CrossRef]
- Raad, M.; López, W.O.C.; Sharafshah, A.; Assefi, M.; Lewandrowski, K.-U. Personalized Medicine in Cancer Pain Management. J. Pers. Med. 2023, 13, 1201. [Google Scholar] [CrossRef]
- Assefi, M.; Lewandrowski, K.-U.; Lorio, M.; Fiorelli, R.K.A.; Landgraeber, S.; Sharafshah, A. Network-Based In Silico Analysis of New Combinations of Modern Drug Targets with Methotrexate for Response-Based Treatment of Rheumatoid Arthritis. J. Pers. Med. 2023, 13, 1550. [Google Scholar] [CrossRef]
- Lewandrowski, K.-U.; Sharafshah, A.; Elfar, J.; Schmidt, S.L.; Blum, K.; Wetzel, F.T. A Pharmacogenomics-Based In Silico Investigation of Opioid Prescribing in Post-operative Spine Pain Management and Personalized Therapy. Cell. Mol. Neurobiol. 2024, 44, 1–23. [Google Scholar] [CrossRef]
- Sharafshah, A.; Motovali-Bashi, M.; Keshavarz, P.; Blum, K. Synergistic Epistasis and Systems Biology Approaches to Uncover a Pharmacogenomic Map Linked to Pain, Anti-Inflammatory and Immunomodulating Agents (PAIma) in a Healthy Cohort. Cell. Mol. Neurobiol. 2024, 44, 1–20. [Google Scholar] [CrossRef]
- Sharafshah, A.; Motovali-Bashi, M.; Keshavarz, P. Pharmacogenomics-Based Detection of Variants Involved in Pain, Anti-inflammatory and Immunomodulating Agents Pathways by Whole Exome Sequencing and Deep in Silico Investigations Revealed Novel Chemical Carcinogenesis and Cancer Risks. 50. [CrossRef]
- Sharafshah, A.; Lewandrowski, K.-U.; Gold, M.S.; Fuehrlein, B.; Ashford, J.W.; Thanos, P.K.; Wang, G.J.; Hanna, C.; Cadet, J.L.; Gardner, E.L.; et al. In Silico Pharmacogenomic Assessment of Glucagon-like Peptide-1 (GLP1) Agonists and the Genetic Addiction Risk Score (GARS) Related Pathways: Implications for Suicidal Ideation and Substance Use Disorder. Curr. Neuropharmacol. 2025, 23, 974–995. [Google Scholar] [CrossRef]
- Lewandrowski, K.-U.; Blum, K.; Sharafshah, A.; Thanos, K.Z.; Thanos, P.K.; Zirath, R.; Pinhasov, A.; Bowirrat, A.; Jafari, N.; Zeine, F.; et al. Genetic and Regulatory Mechanisms of Comorbidity of Anxiety, Depression and ADHD: A GWAS Meta-Meta-Analysis Through the Lens of a System Biological and Pharmacogenomic Perspective in 18.5 M Subjects. J. Pers. Med. 2025, 15, 103. [Google Scholar] [CrossRef]
- Sollis, E.; Mosaku, A.; Abid, A.; Buniello, A.; Cerezo, M.; Gil, L.; Groza, T.; Güneş, O.; Hall, P.; Hayhurst, J.; et al. The NHGRI-EBI GWAS Catalog: knowledgebase and deposition resource. Nucleic Acids Res. 2022, 51, D977–D985. [Google Scholar] [CrossRef]
- Sabaie, H.; Rouz, S.K.; Kouchakali, G.; Heydarzadeh, S.; Asadi, M.R.; Sharifi-Bonab, M.; Hussen, B.M.; Taheri, M.; Ayatollahi, S.A.; Rezazadeh, M. Identification of potential regulatory long non-coding RNA-associated competing endogenous RNA axes in periplaque regions in multiple sclerosis. Front. Genet. 2022, 13, 1011350. [Google Scholar] [CrossRef]
- Noroozi, R. Identification of miRNA-mRNA network in autism spectrum disorder using a bioinformatics method. Journal of Molecular Neuroscience 2021, 71, 761–766. [Google Scholar]
- Atreya, R.V.; Sun, J.; Zhao, Z. Exploring drug-target interaction networks of illicit drugs. BMC Genom. 2013, 14, 1–12. [Google Scholar] [CrossRef]
- Wang, X.; Shi, Z.; Zhao, Z.; Chen, H.; Lang, Y.; Kong, L.; Lin, X.; Du, Q.; Wang, J.; Zhou, H. The causal relationship between neuromyelitis optica spectrum disorder and other autoimmune diseases. Front. Immunol. 2022, 13, 959469. [Google Scholar] [CrossRef]
- Marballi, K.K.; Alganem, K.; Brunwasser, S.J.; Barkatullah, A.; Meyers, K.T.; Campbell, J.M.; Ozols, A.B.; Mccullumsmith, R.E.; Gallitano, A.L. Identification of activity-induced Egr3-dependent genes reveals genes associated with DNA damage response and schizophrenia. Transl. Psychiatry 2022, 12, 1–17. [Google Scholar] [CrossRef]
- Fan, X.; Chen, H.; Jiang, F.; Xu, C.; Wang, Y.; Wang, H.; Li, M.; Wei, W.; Song, J.; Zhong, D.; et al. Comprehensive analysis of cuproptosis-related genes in immune infiltration in ischemic stroke. Front. Neurol. 2023, 13, 1077178. [Google Scholar] [CrossRef]
- Elasbali, A.M.; Abu Al-Soud, W.; Elayyan, A.E.M.; Al-Oanzi, Z.H.; Alhassan, H.H.; Mohamed, B.M.; Alanazi, H.H.; Ashraf, M.S.; Moiz, S.; Patel, M.; et al. Integrating network pharmacology approaches for the investigation of multi-target pharmacological mechanism of 6-shogaol against cervical cancer. J. Biomol. Struct. Dyn. 2023, 41, 14135–14151. [Google Scholar] [CrossRef]
- Das, A.; Ariyakumar, G.; Gupta, N.; Kamdar, S.; Barugahare, A.; Deveson-Lucas, D.; Gee, S.; Costeloe, K.; Davey, M.S.; Fleming, P.; et al. Identifying immune signatures of sepsis to increase diagnostic accuracy in very preterm babies. Nat. Commun. 2024, 15, 1–15. [Google Scholar] [CrossRef]
- Zhou, Y.; Zhou, B.; Pache, L.; Chang, M.; Khodabakhshi, A.H.; Tanaseichuk, O.; Benner, C.; Chanda, S.K. Metascape provides a biologist-oriented resource for the analysis of systems-level datasets. Nat. Commun. 2019, 10, 1523. [Google Scholar] [CrossRef]
- Piñero, J.; Saüch, J.; Sanz, F.; Furlong, L.I. The DisGeNET cytoscape app: Exploring and visualizing disease genomics data. Comput. Struct. Biotechnol. J. 2021, 19, 2960–2967. [Google Scholar] [CrossRef]
- Knox, C. DrugBank 6.0: the DrugBank knowledgebase for 2024. Nucleic acids research 2024, 52, D1265–D1275. [Google Scholar]
- Davis, A.P.; Grondin, C.J.; Johnson, R.J.; Sciaky, D.; Wiegers, J.; Wiegers, T.C.; Mattingly, C.J. Comparative Toxicogenomics Database (CTD): update 2021. Nucleic Acids Res. 2020, 49, D1138–D1143. [Google Scholar] [CrossRef] [PubMed] [PubMed Central]
- Evangelista, J.E.; Xie, Z.; Marino, G.B.; Nguyen, N.; Clarke, D.J.B.; Ma’aYan, A. Enrichr-KG: bridging enrichment analysis across multiple libraries. Nucleic Acids Res. 2023, 51, W168–W179. [Google Scholar] [CrossRef]
- Kim, B. How to Reveal Magnitude of Gene Signals: Hierarchical Hypergeometric Complementary Cumulative Distribution Function. Evol. Bioinform. 2018, 14. [Google Scholar] [CrossRef]
- Cohen, J. A Coefficient of Agreement for Nominal Scales. Educ. Psychol. Meas. 1960, 20, 37–46. [Google Scholar] [CrossRef]
- Stark, C.; Breitkreutz, B.J.; Reguly, T.; Boucher, L.; Breitkreutz, A.; Tyers, M. BioGRID: a general repository for interaction datasets. Nucleic Acids Res. 2006, 34, D535–D539. [Google Scholar] [CrossRef]
- Türei, D.; Korcsmáros, T.; Saez-Rodriguez, J. OmniPath: guidelines and gateway for literature-curated signaling pathway resources. Nat. Methods 2016, 13, 966–967. [Google Scholar] [CrossRef]
- Li, T.; Wernersson, R.; Hansen, R.B.; Horn, H.; Mercer, J.; Slodkowicz, G.; Workman, C.T.; Rigina, O.; Rapacki, K.; Stærfeldt, H.H.; et al. A scored human protein–protein interaction network to catalyze genomic interpretation. Nat. Methods 2016, 14, 61–64. [Google Scholar] [CrossRef]
- Bader, G.D.; Hogue, C.W.V. An automated method for finding molecular complexes in large protein interaction networks. BMC Bioinform. 2003, 4, 2–27. [Google Scholar] [CrossRef] [PubMed] [PubMed Central]
- Elman, I.; Lowen, S.; Frederick, B.B.; Chi, W.; Becerra, L.; Pitman, R.K. Functional Neuroimaging of Reward Circuitry Responsivity to Monetary Gains and Losses in Posttraumatic Stress Disorder. Biol. Psychiatry 2009, 66, 1083–1090. [Google Scholar] [CrossRef]
- Elman, I.; Ariely, D.; Mazar, N.; Aharon, I.; Lasko, N.B.; Macklin, M.L.; Orr, S.P.; Lukas, S.E.; Pitman, R.K. Probing reward function in post-traumatic stress disorder with beautiful facial images. Psychiatry Res. 2005, 135, 179–183. [Google Scholar] [CrossRef]
- Elman, I.; Borsook, D. The failing cascade: Comorbid post traumatic stress- and opioid use disorders. Neurosci. Biobehav. Rev. 2019, 103, 374–383. [Google Scholar] [CrossRef]
- O’bRien, C.P. Anticraving Medications for Relapse Prevention: A Possible New Class of Psychoactive Medications. Am. J. Psychiatry 2005, 162, 1423–1431. [Google Scholar] [CrossRef]
- Robinson, S.A.; Hill-Smith, T.E.; Lucki, I. Buprenorphine prevents stress-induced blunting of nucleus accumbens dopamine response and approach behavior to food reward in mice. Neurobiol. Stress 2019, 11, 100182. [Google Scholar] [CrossRef]
- Skoglund, C.; Leknes, S.; Heilig, M. The partial µ-opioid agonist buprenorphine in autism spectrum disorder: a case report. J. Med Case Rep. 2022, 16, 1–6. [Google Scholar] [CrossRef]
- Bodkin, J.A.; Zornberg, G.L.; Lukas, S.E.; Cole, J.O. Buprenorphine Treatment of Refractory Depression. J. Clin. Psychopharmacol. 1995, 15, 49–57. [Google Scholar] [CrossRef]
- Elman, I.; Zubieta, J.-K.; Borsook, D. The missing p in psychiatric training: why it is important to teach pain to psychiatrists. Archives of general psychiatry 2011, 68, 12–20. [Google Scholar]
- Walsh, A.E.L.; Browning, M.; Drevets, W.C.; Furey, M.; Harmer, C.J. Dissociable temporal effects of bupropion on behavioural measures of emotional and reward processing in depression. Philos. Trans. R. Soc. B: Biol. Sci. 2018, 373, 20170030. [Google Scholar] [CrossRef]
- Hoefer, M.E.; Voskanian, S.J.; Koob, G.F.; Pulvirenti, L. Effects of terguride, ropinirole, and acetyl-l-carnitine on methamphetamine withdrawal in the rat. Pharmacol. Biochem. Behav. 2006, 83, 403–409. [Google Scholar] [CrossRef]
- Blum, K.; Chen, T.J.; Meshkin, B.; Waite, R.L.; Downs, B.W.; Blum, S.H.; Mengucci, J.F.; Arcuri, V.; Braverman, E.R.; Palomo, T. Manipulation of catechol-O-methyl-transferase (COMT) activity to influence the attenuation of substance seeking behavior, a subtype of Reward Deficiency Syndrome (RDS), is dependent upon gene polymorphisms: A hypothesis. Med Hypotheses 2007, 69, 1054–1060. [Google Scholar] [CrossRef]
- Kotoula, V.; Stringaris, A.; Mackes, N.; Mazibuko, N.; Hawkins, P.C.; Furey, M.; Curran, H.V.; Mehta, M.A. Ketamine Modulates the Neural Correlates of Reward Processing in Unmedicated Patients in Remission From Depression. Biol. Psychiatry: Cogn. Neurosci. Neuroimaging 2022, 7, 285–292. [Google Scholar] [CrossRef]
- Craske, M.G.; Meuret, A.E.; Ritz, T.; Treanor, M.; Dour, H.J. Treatment for Anhedonia: A Neuroscience Driven Approach. Depression Anxiety 2016, 33, 927–938. [Google Scholar] [CrossRef]
- McMakin, D.L.; Siegle, G.J.; Shirk, S.R. Positive Affect Stimulation and Sustainment (PASS) Module for Depressed Mood: A Preliminary Investigation of Treatment-Related Effects. Cogn. Ther. Res. 2010, 35, 217–226. [Google Scholar] [CrossRef]
- Dougherty, J.D. Can the “female protective effect” liability threshold model explain sex differences in autism spectrum disorder? Neuron 2022, 110, 3243–3262. [Google Scholar]
- Kim, S.-W. Whole genome sequencing analysis identifies sex differences of familial pattern contributing to phenotypic diversity in autism. Genome Medicine 2024, 16, 114. [Google Scholar]
- Samaco, R.C.; Nagarajan, R.P.; Braunschweig, D.; LaSalle, J.M. Multiple pathways regulate MeCP2 expression in normal brain development and exhibit defects in autism-spectrum disorders. Hum. Mol. Genet. 2004, 13, 629–639. [Google Scholar] [CrossRef]
- Fetit, R.; Hillary, R.F.; Price, D.J.; Lawrie, S.M. The neuropathology of autism: A systematic review of post-mortem studies of autism and related disorders. Neurosci. Biobehav. Rev. 2021, 129, 35–62. [Google Scholar] [CrossRef]
Figure 2.
Flowchart scheme of strategy used in the current study from Databank selection to Final findings through 8 specific steps. GWAS: Gnome-Wide Association Studies; ASD: Autism Spectrum Disorder; PPIs: Protein-Protein Interactions; GMIs: Gene-miRNA Interactions; PDIs: Protein-Drug Interactions; PCIs: Protein-Chemical Interactions; and PGx: Pharmacogenomics’.
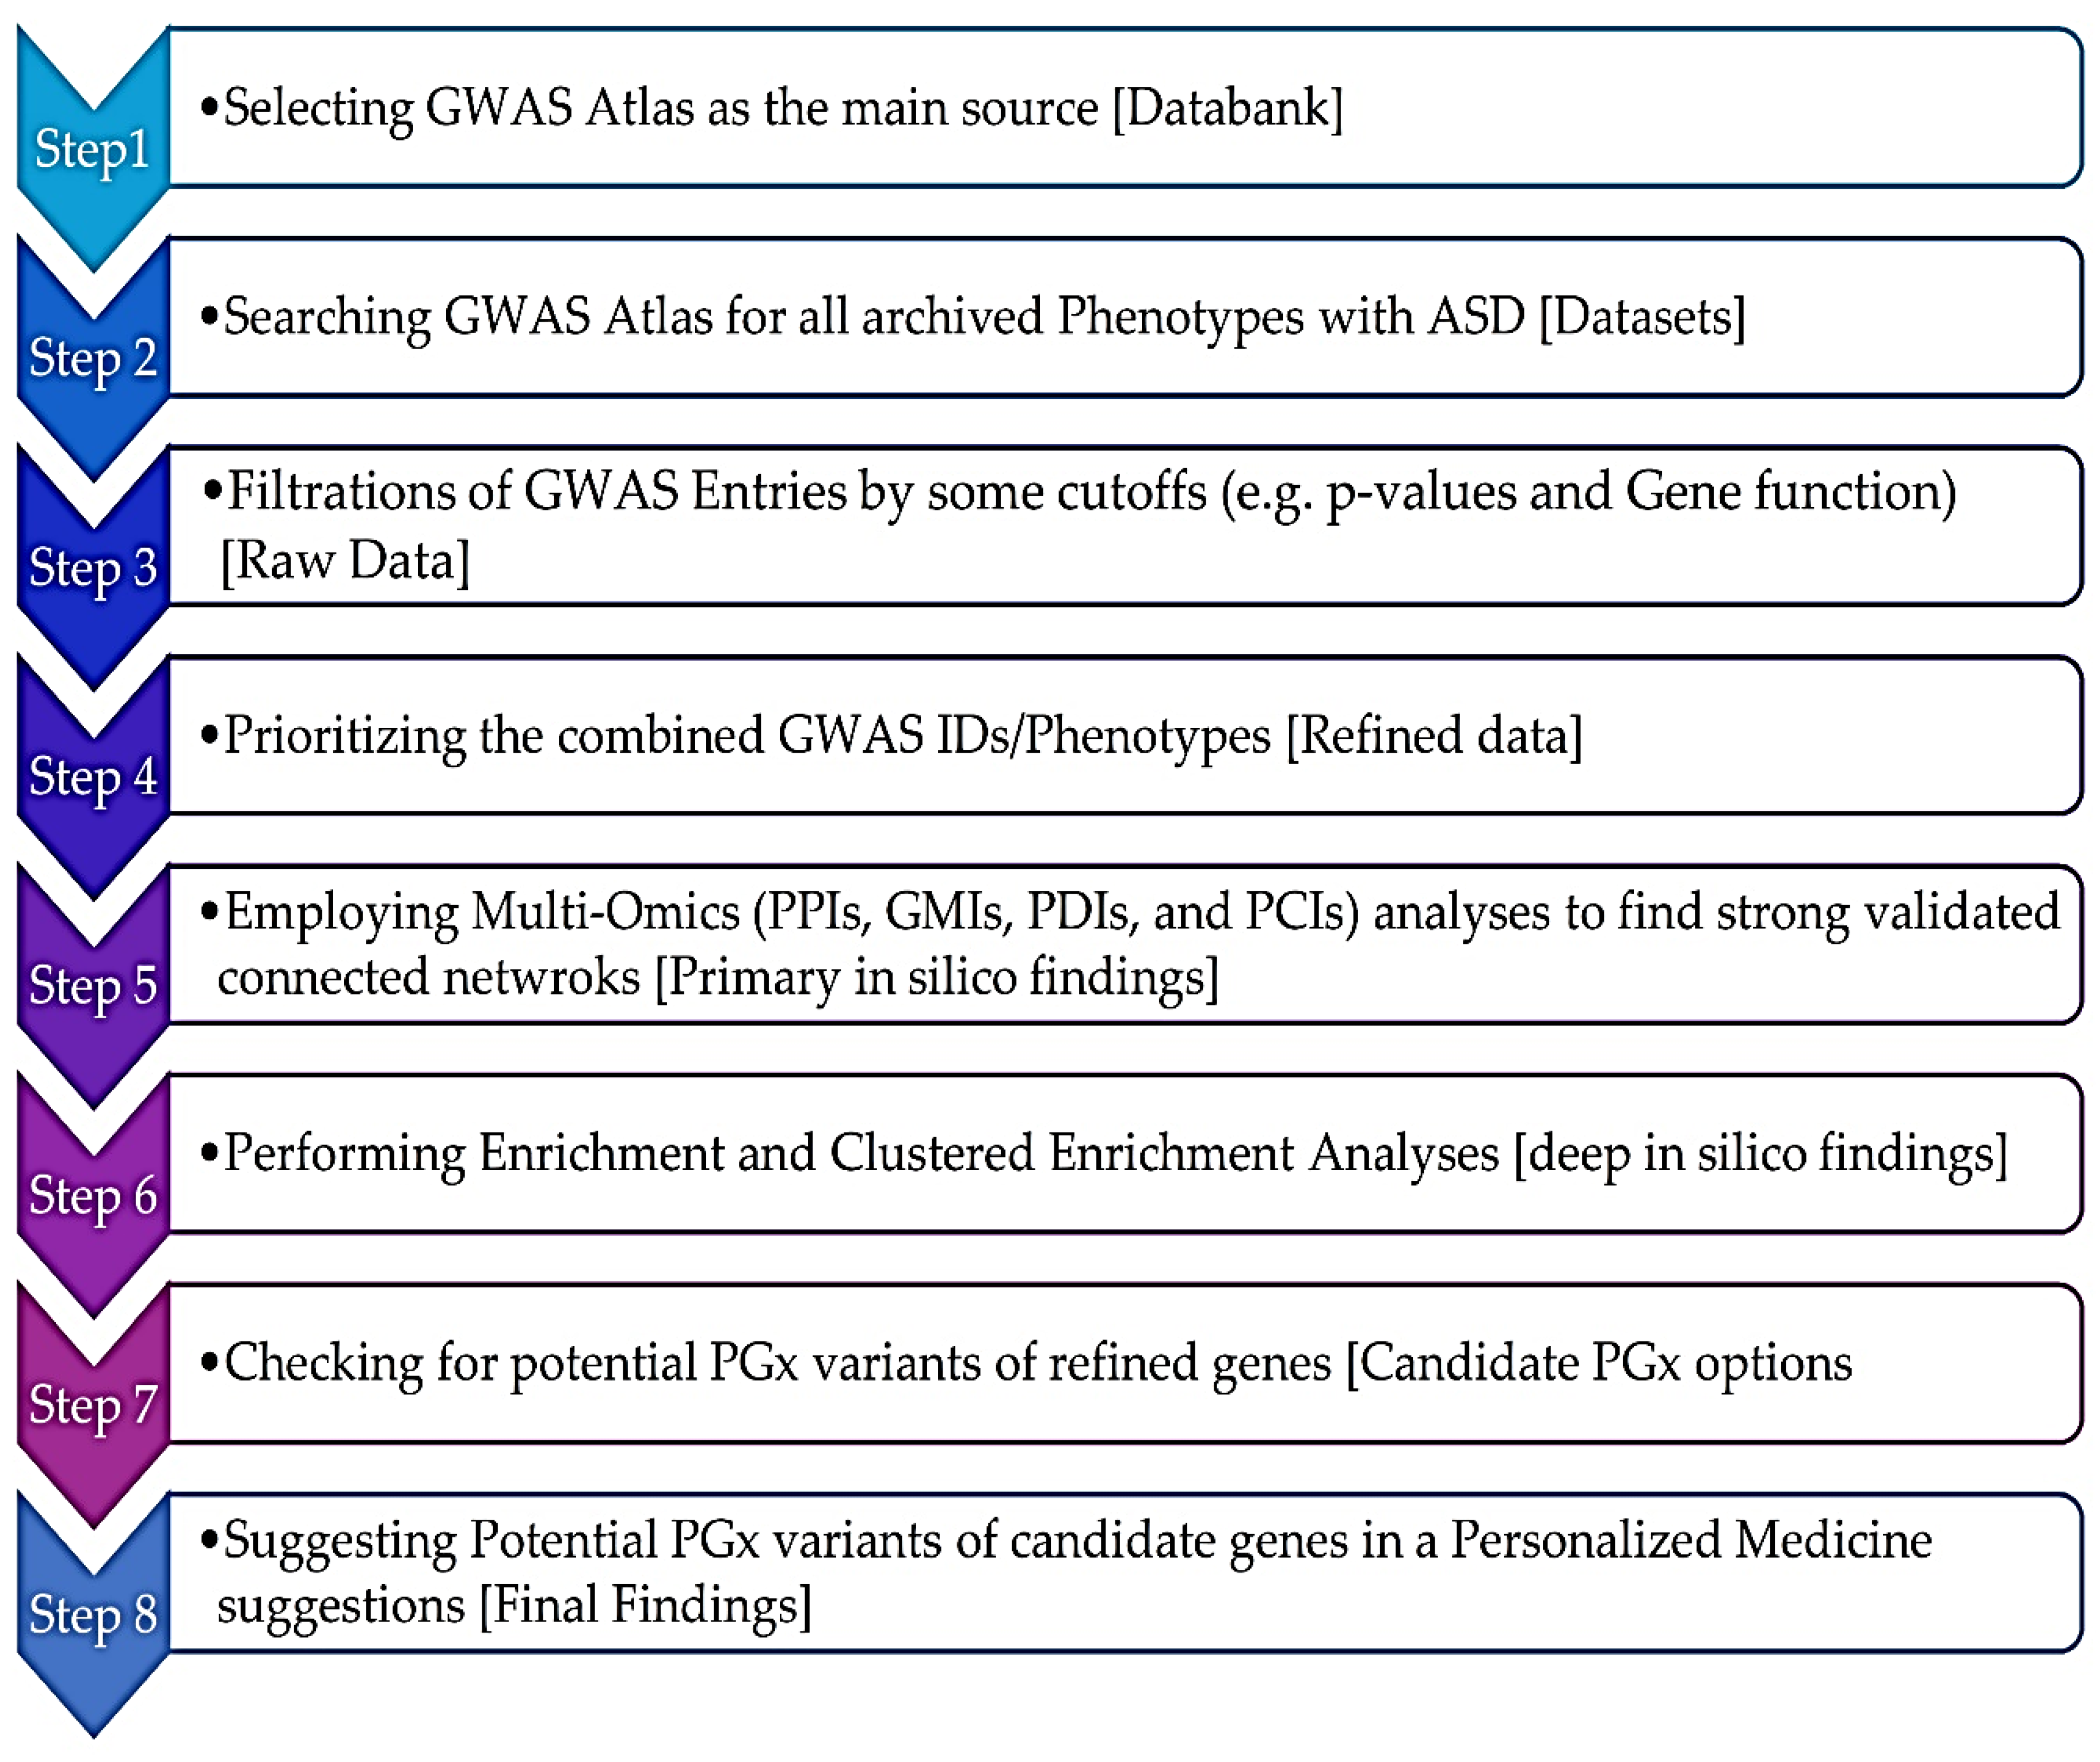
Figure 3.
STRING-MODEL included 20 genes mined from 881 GWA studies and 10 GARS genes. Each protein contains various colored lines which refer to a specific interaction including blue as obtained from curated databases; pink as experimentally determined; green as gene neighborhood; red as gene fusions; dark blue as gene co-occurrence; light green as textmining; black as co-expression; and pale purple as protein homology.
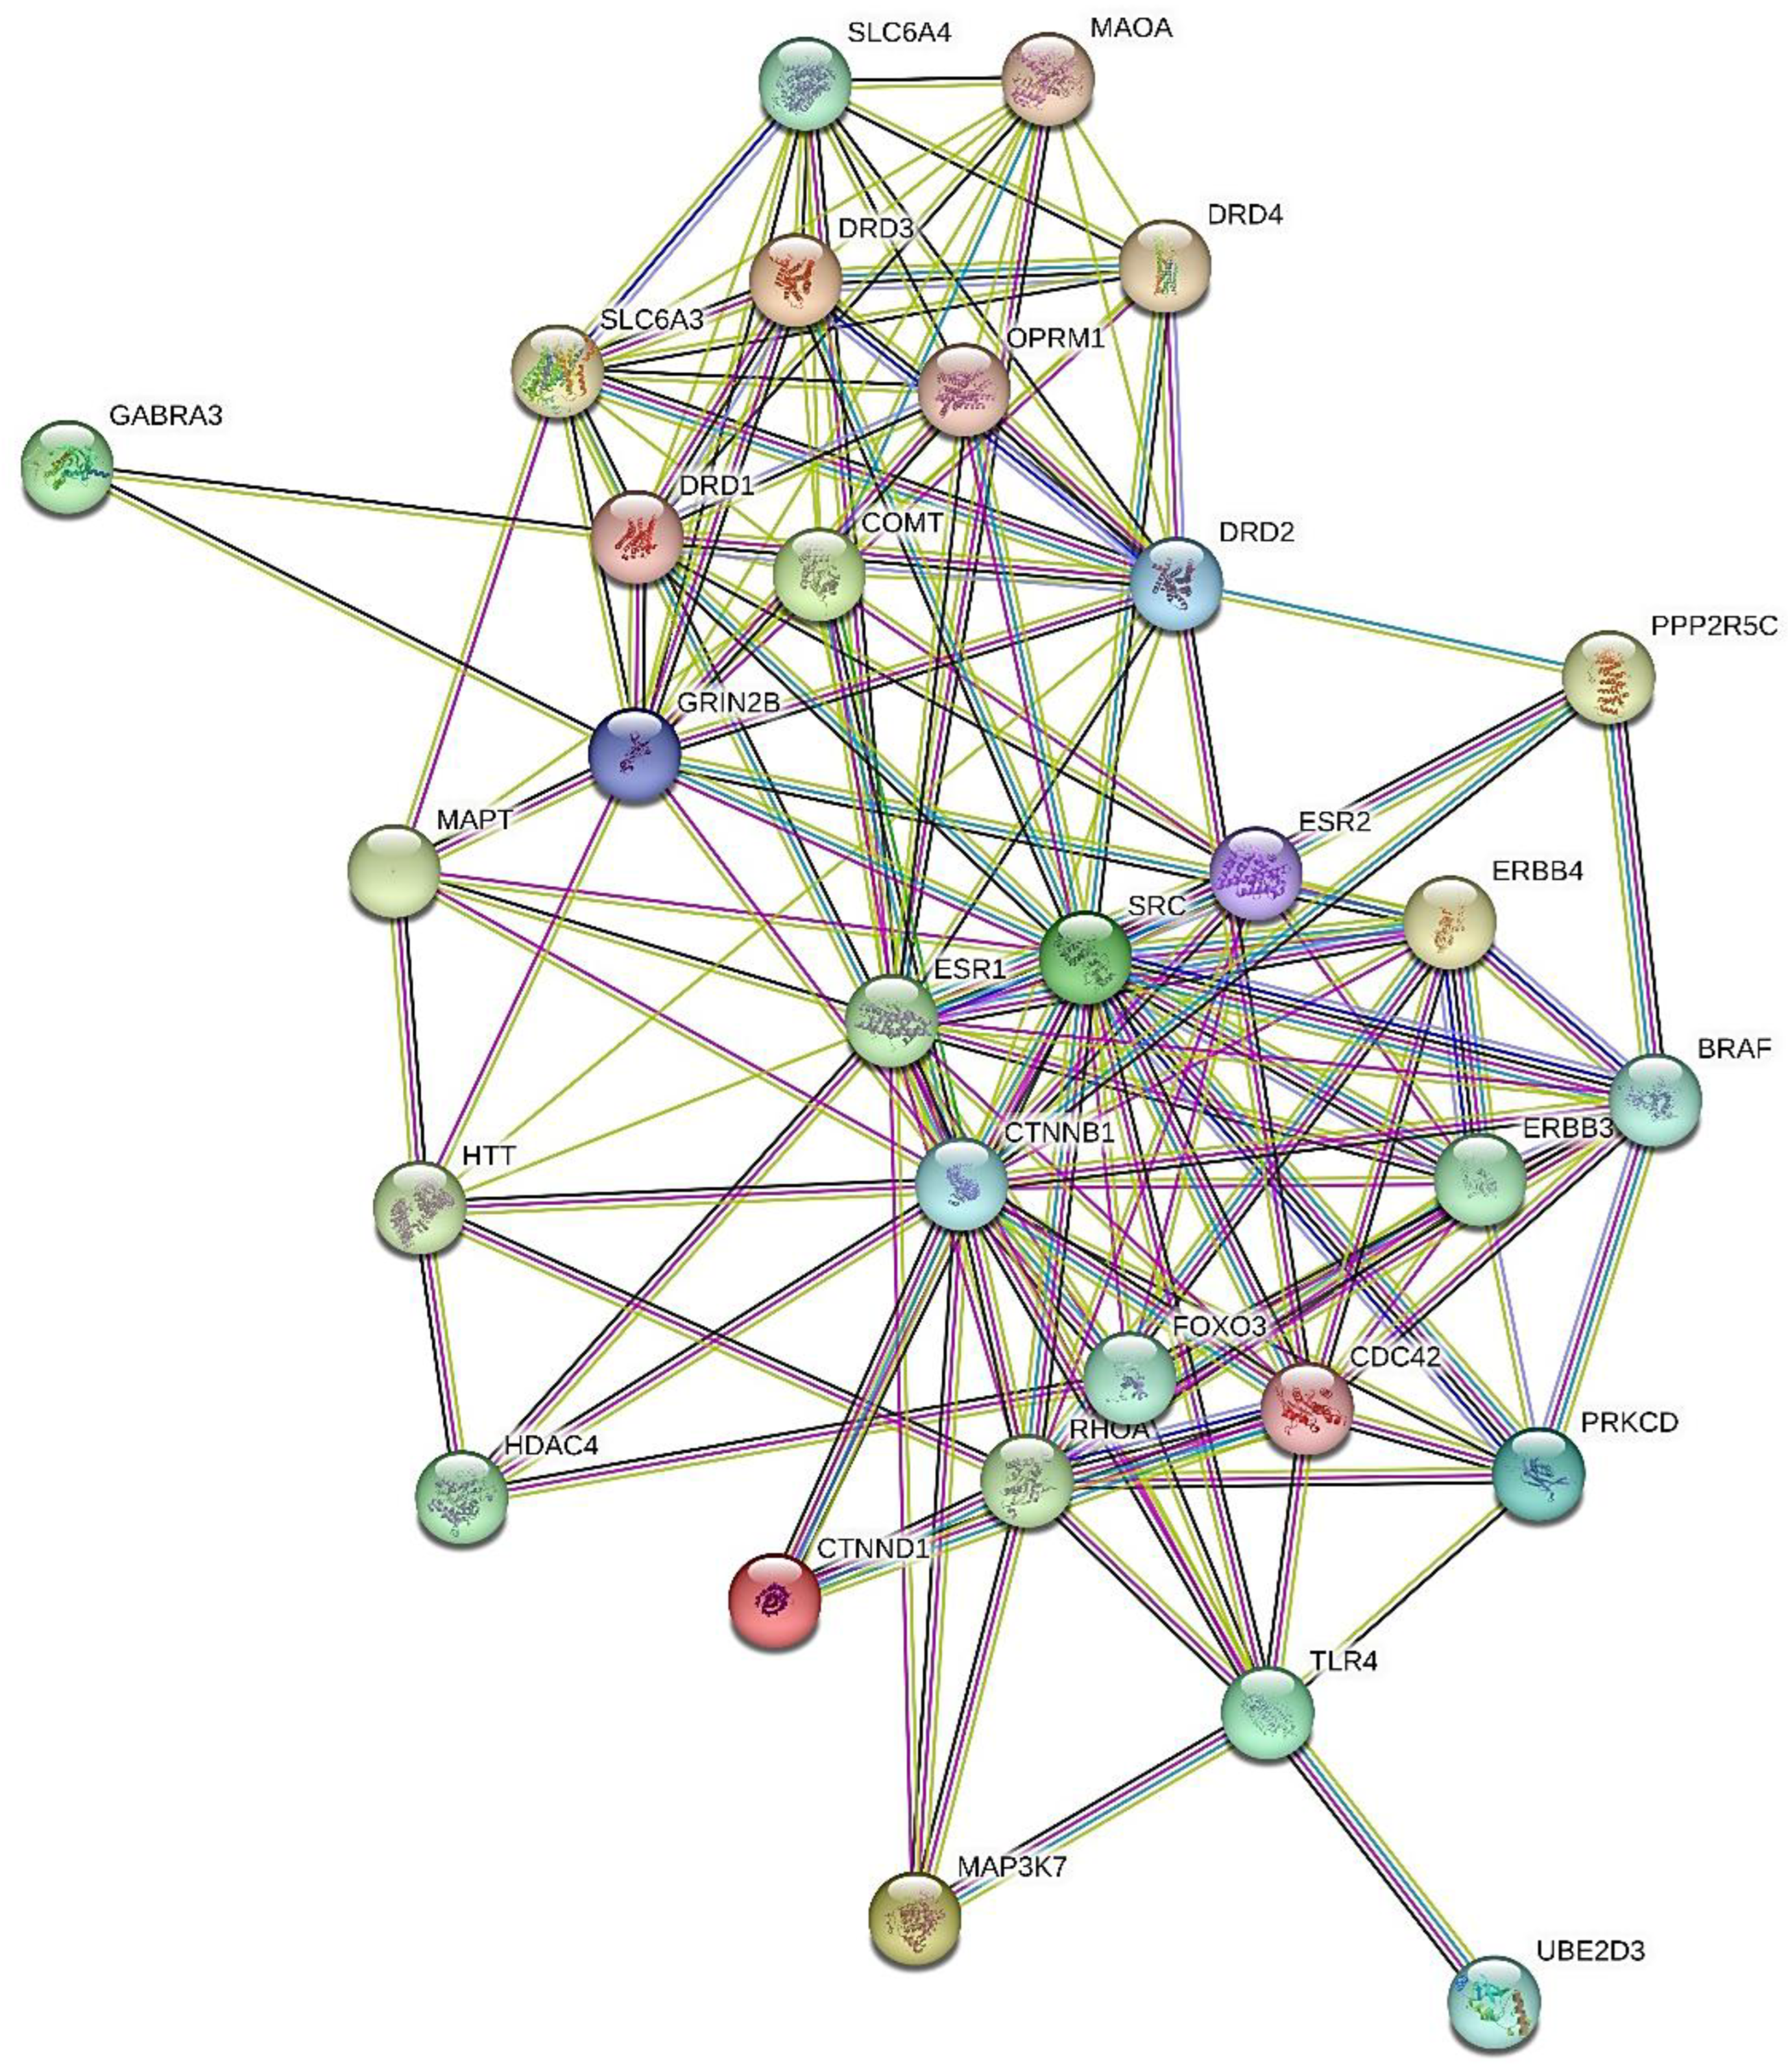
Figure 4.
Dopaminergic synapse signaling network found by Cytoscape highlighting on Dopamine receptor family genes and GRIN2B triggering by Dopamine leading to Synaptic plasticity and excitatory synaptic transmission.
Figure 4.
Dopaminergic synapse signaling network found by Cytoscape highlighting on Dopamine receptor family genes and GRIN2B triggering by Dopamine leading to Synaptic plasticity and excitatory synaptic transmission.
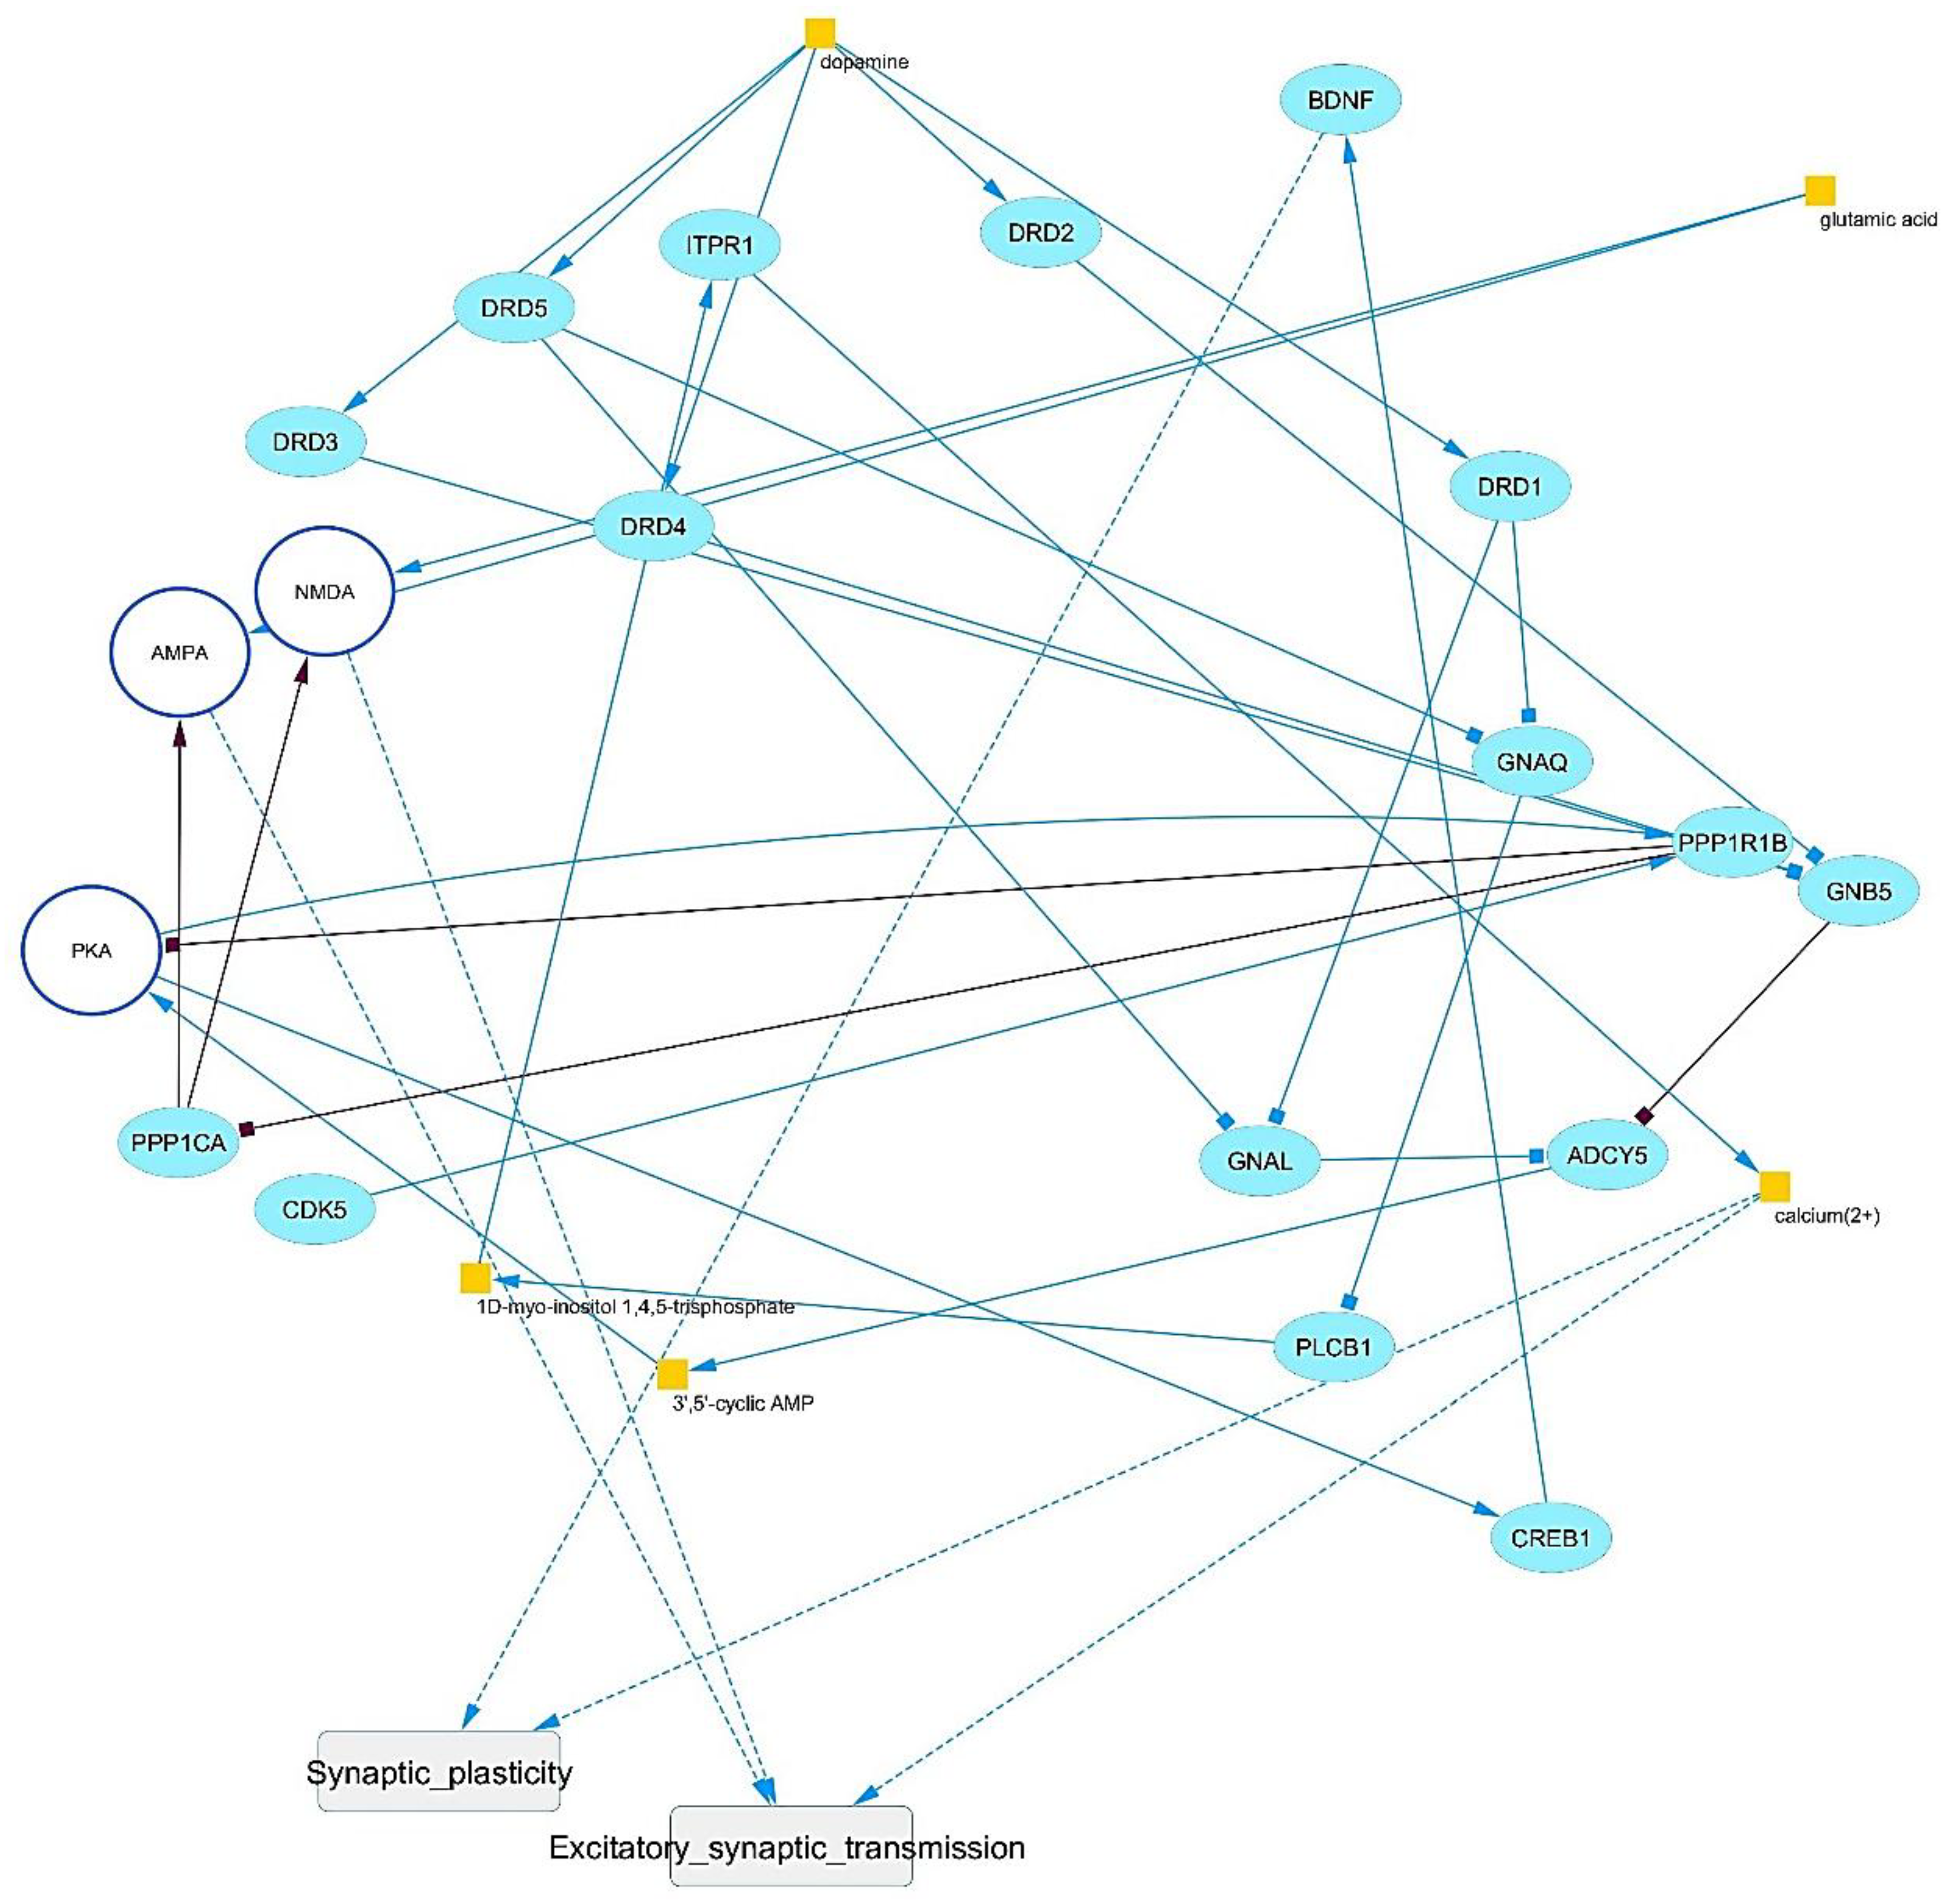
Figure 5.
Linear Bi/Tripartite model of GMIs highlights hsa-miR-16-5p as the most interacted miRNA with candidate gene list emphasizing on hsa-miR-16-5p interacting with COMT, OPRM1, MAP3K7, PPP2R5C, PRKCD, HTT, and SLC6A4 genes.
Figure 5.
Linear Bi/Tripartite model of GMIs highlights hsa-miR-16-5p as the most interacted miRNA with candidate gene list emphasizing on hsa-miR-16-5p interacting with COMT, OPRM1, MAP3K7, PPP2R5C, PRKCD, HTT, and SLC6A4 genes.
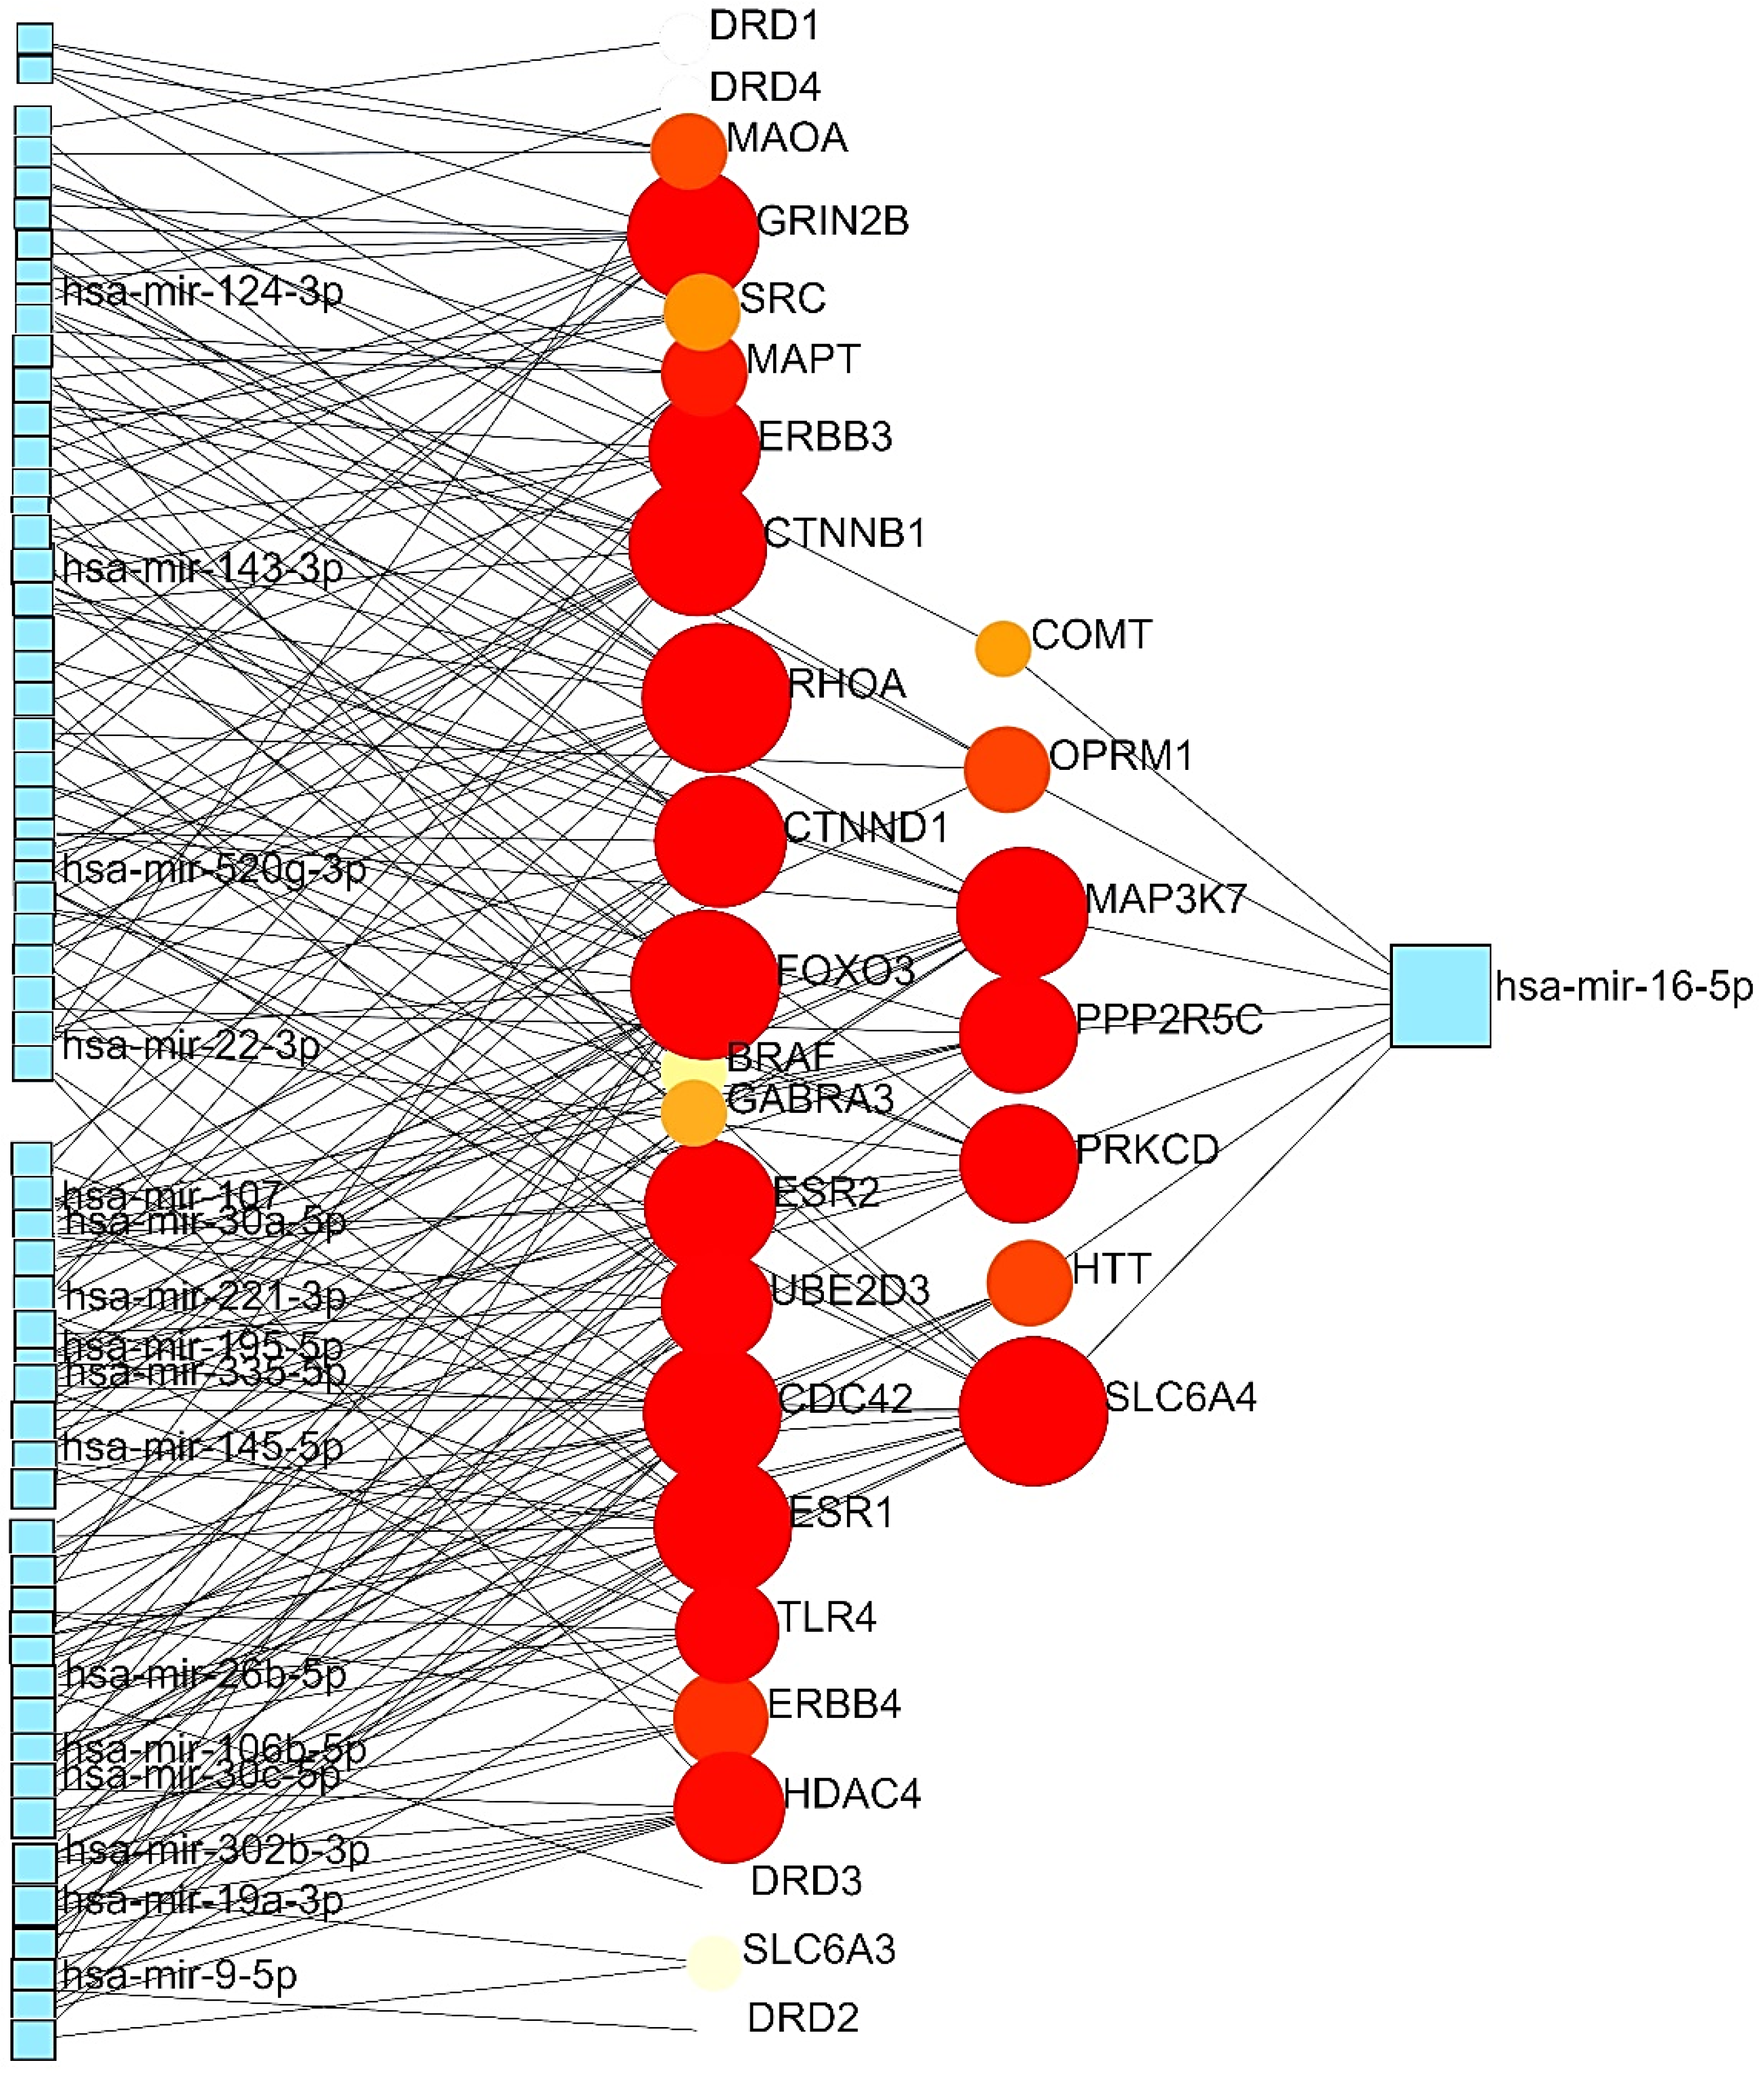
Figure 6.
Fruchterman-Rhengold model of PDIs showing important relationships among FDA-approved drugs with genes of both ASD and GARS groups. Interestingly, DRD2 has 8 interactions with both genes and drugs of this network.
Figure 6.
Fruchterman-Rhengold model of PDIs showing important relationships among FDA-approved drugs with genes of both ASD and GARS groups. Interestingly, DRD2 has 8 interactions with both genes and drugs of this network.
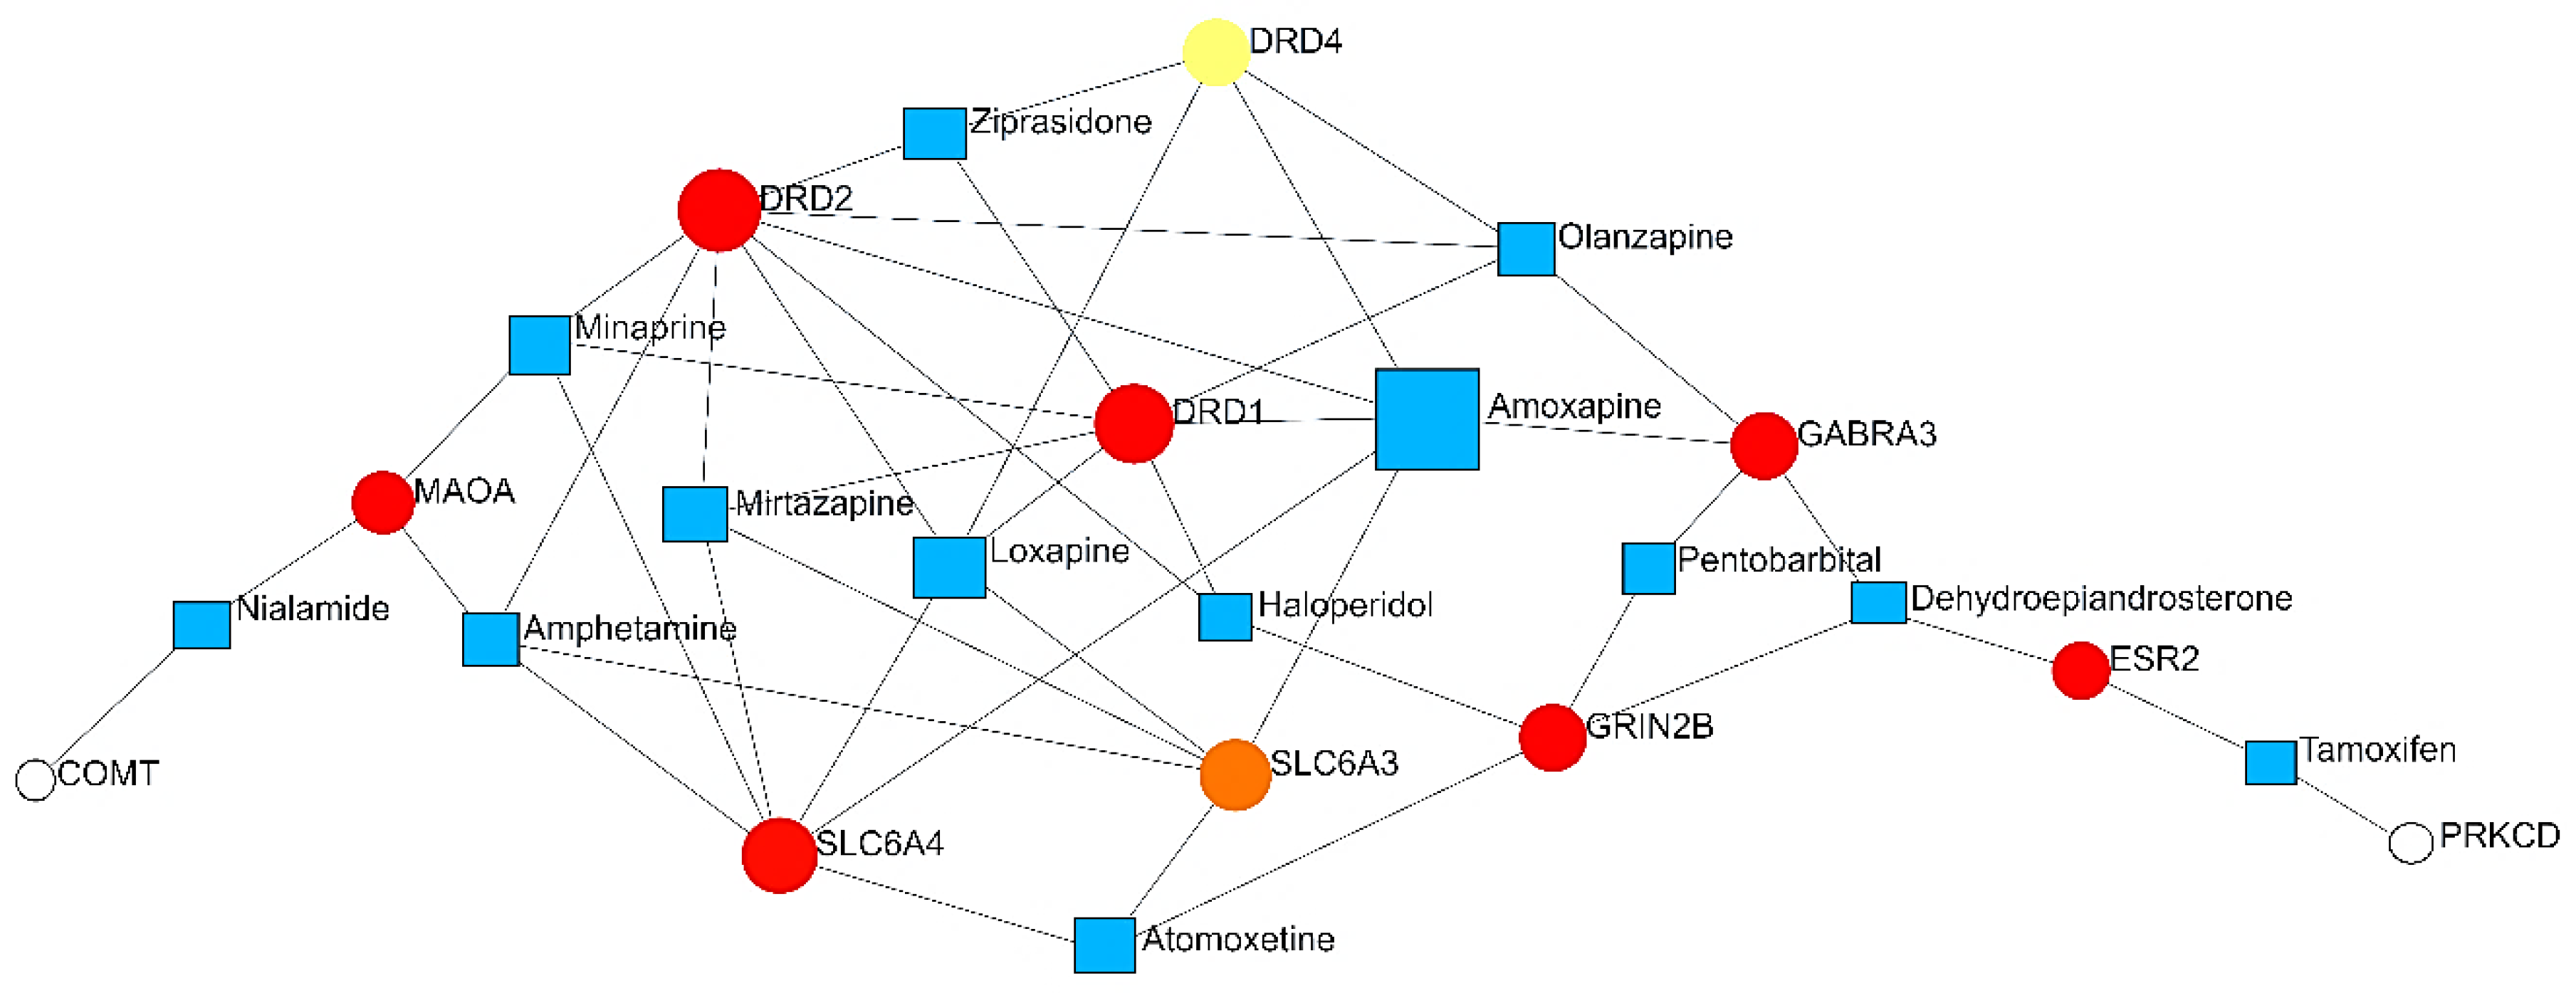
Figure 7.
Sugiyama model of PCIs confirming the tight interactions of selected proteins with known chemicals, as the most interacted chemical is Aflatoxin B1 in this figure which has interactions with 17 proteins. Importantly, ESR1 is the major protein predicted in this network with the highest interactions.
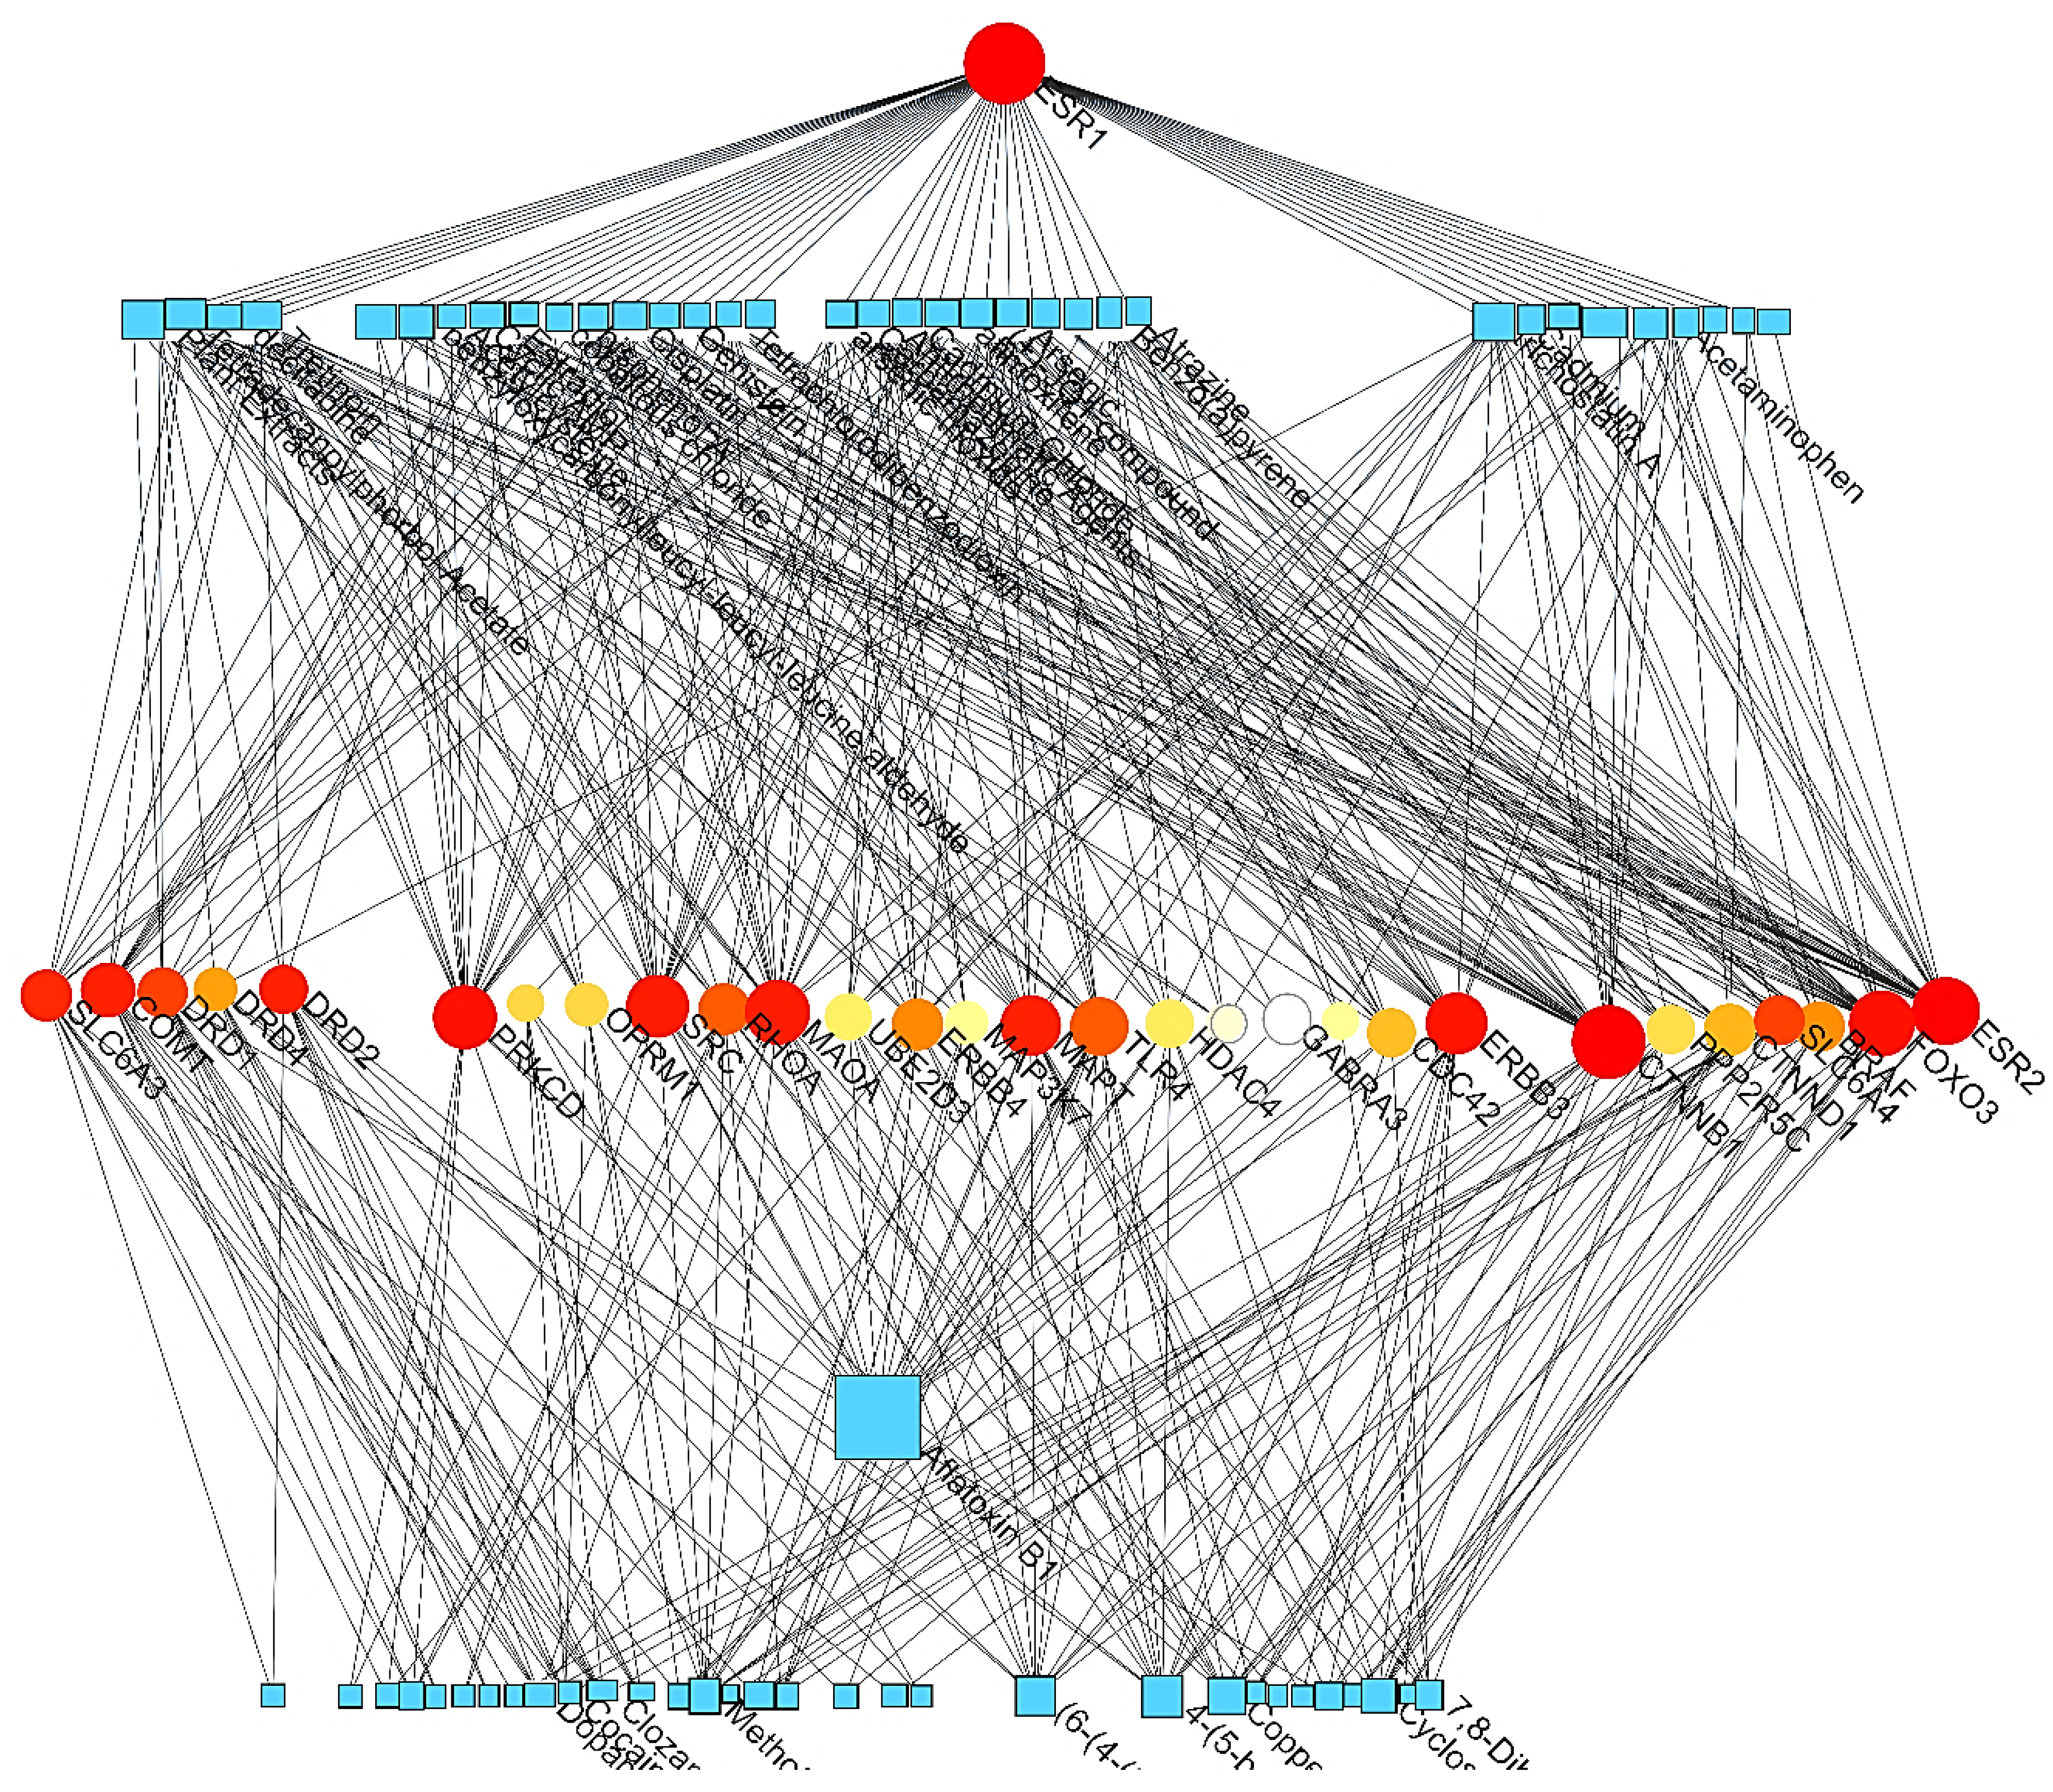
Figure 8.
Multi-Omics results of 5 databases visualized by Enrichr-KG highlighting on Dopaminergic synapse processes, Mental Depression, Addictive behavior, Obsessive-Compulsive Disorder, dopamine receptor gene family, and GRIN2B gene as the high-scored connection zone.
Figure 8.
Multi-Omics results of 5 databases visualized by Enrichr-KG highlighting on Dopaminergic synapse processes, Mental Depression, Addictive behavior, Obsessive-Compulsive Disorder, dopamine receptor gene family, and GRIN2B gene as the high-scored connection zone.
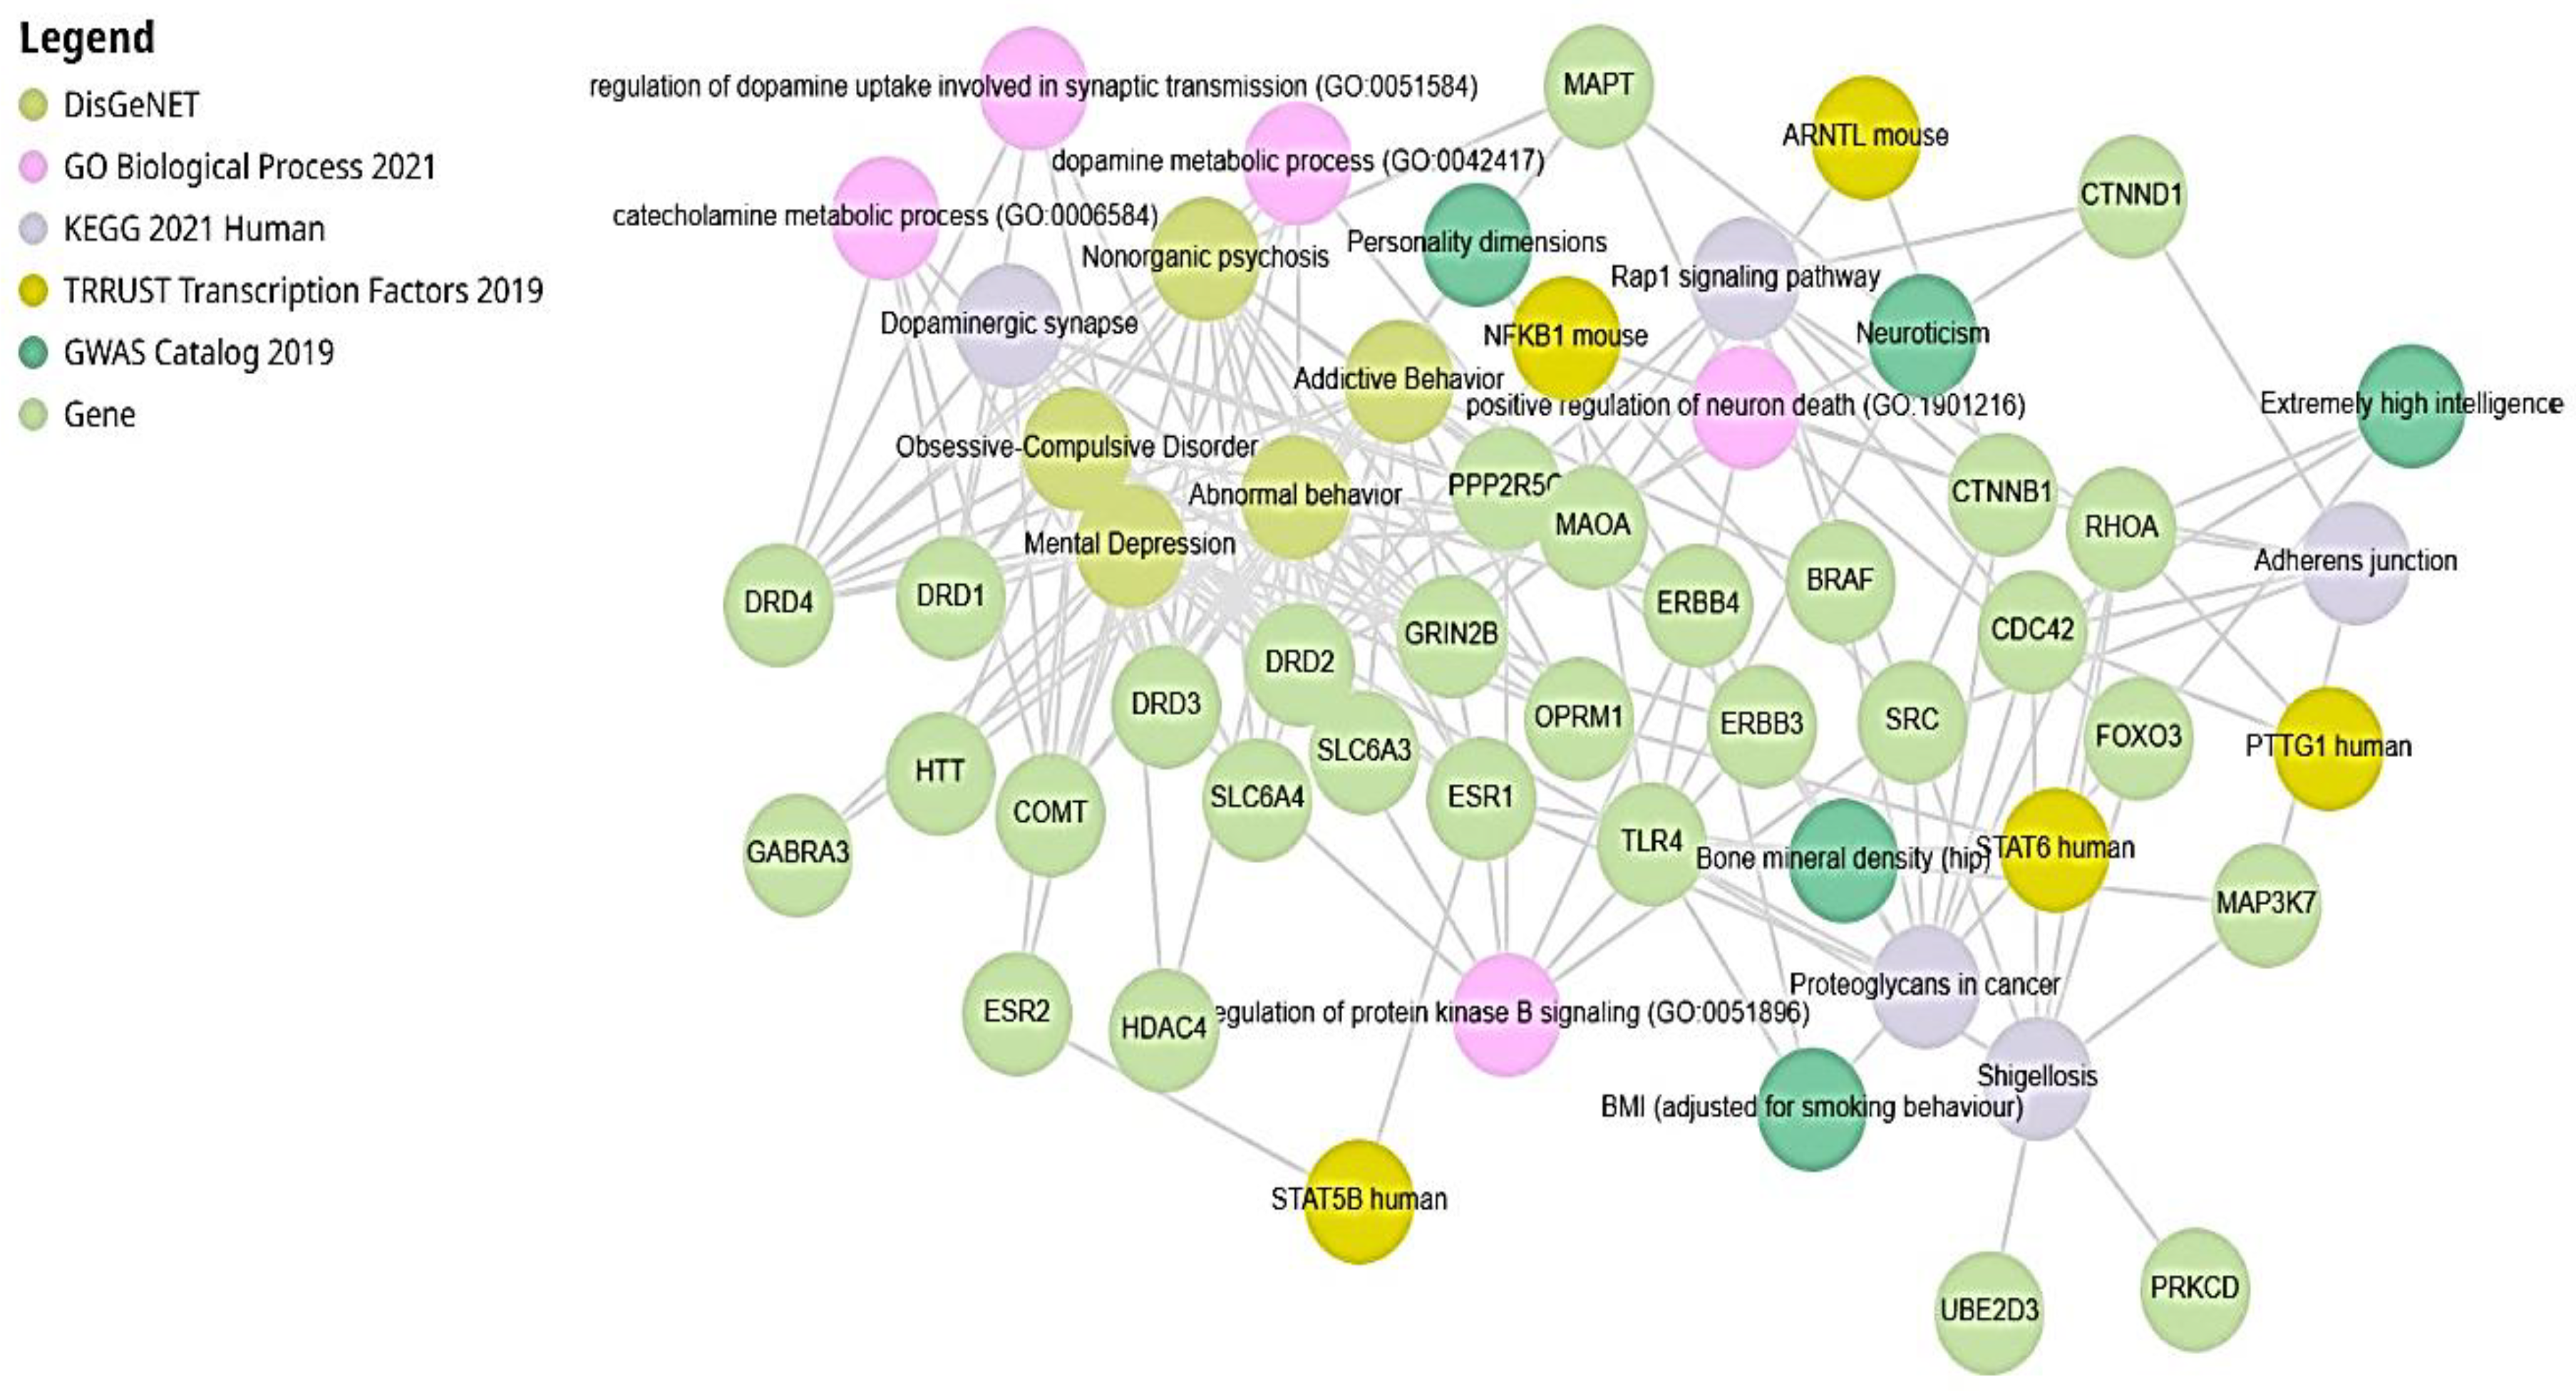
Figure 9.
Network of enriched terms: (a) colored by cluster ID, where nodes that share the same cluster ID are typically close to each other; (b) colored by p-value, where terms containing more genes tend to have a more significant p-value.
Figure 9.
Network of enriched terms: (a) colored by cluster ID, where nodes that share the same cluster ID are typically close to each other; (b) colored by p-value, where terms containing more genes tend to have a more significant p-value.
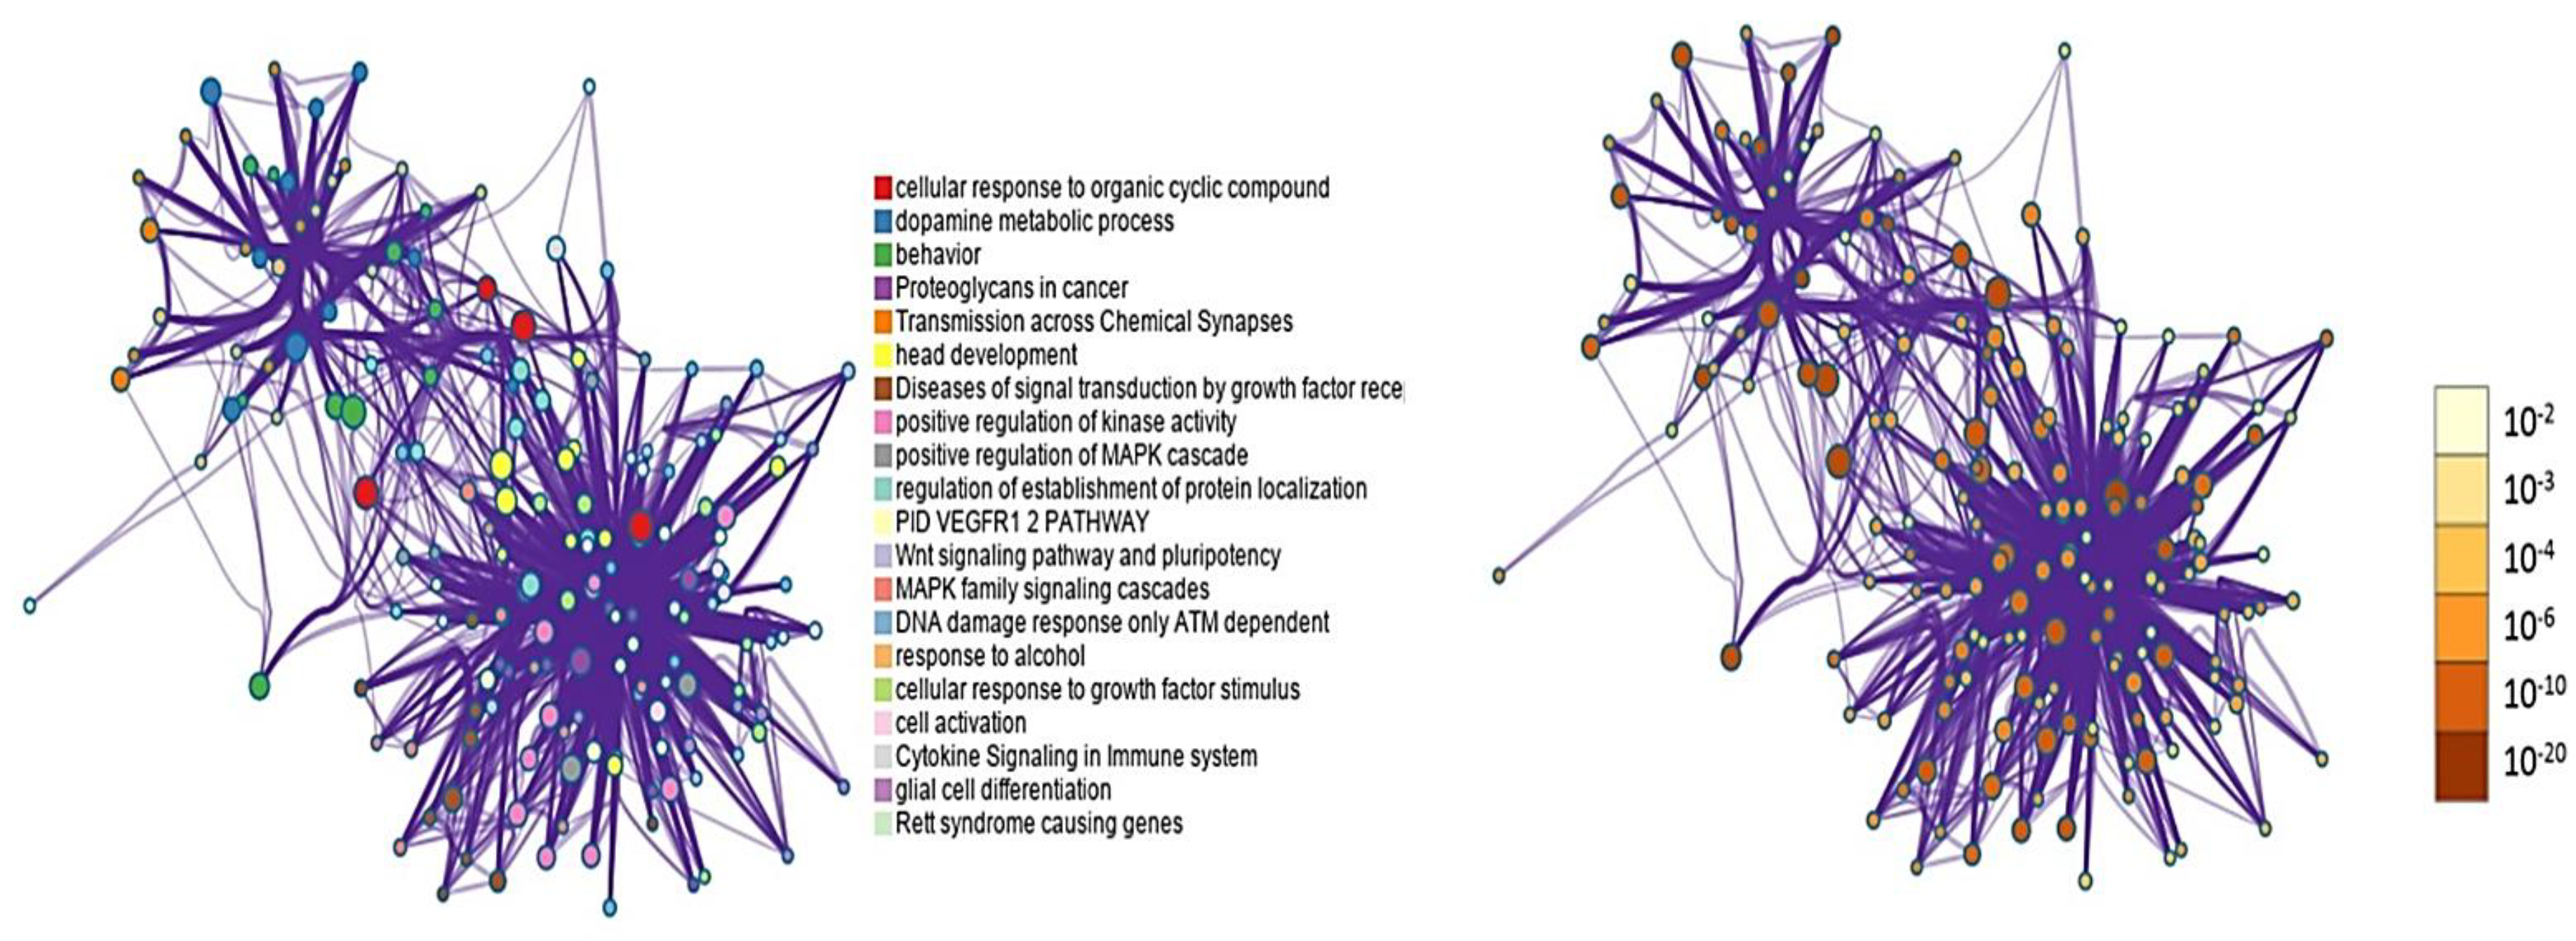
Figure 10.
PPI network and MCODE components identified in the candidate genes list. The red circles represent MCODE_1 gene which stand for synaptic signaling [Log(P)= -11.2], Behavior [Log(P)= -10.3], and Dopaminergic synapse [Log(P)= -9.7]. The blue circles represent MCODE_2 genes which refer to Signaling by Receptor Tyrosine Kinases [Log(P)= -10.6], Signaling by ERBB2 [Log(P)= -10.0], and VEGFA-VEGFR2 Pathway [Log(P)= -8.8]. The right model resulted from the combination of MCODE_1 and MCODE_2 are as follows: cellular response to organic cyclic compound (GO:0071407) with a Log10(P) of -15.9, dopamine metabolic process (GO:0042417) with a Log10(P) of -15.1, and cellular response to organonitrogen compound (GO:0071417) with a Log10(P) of -14.5. .
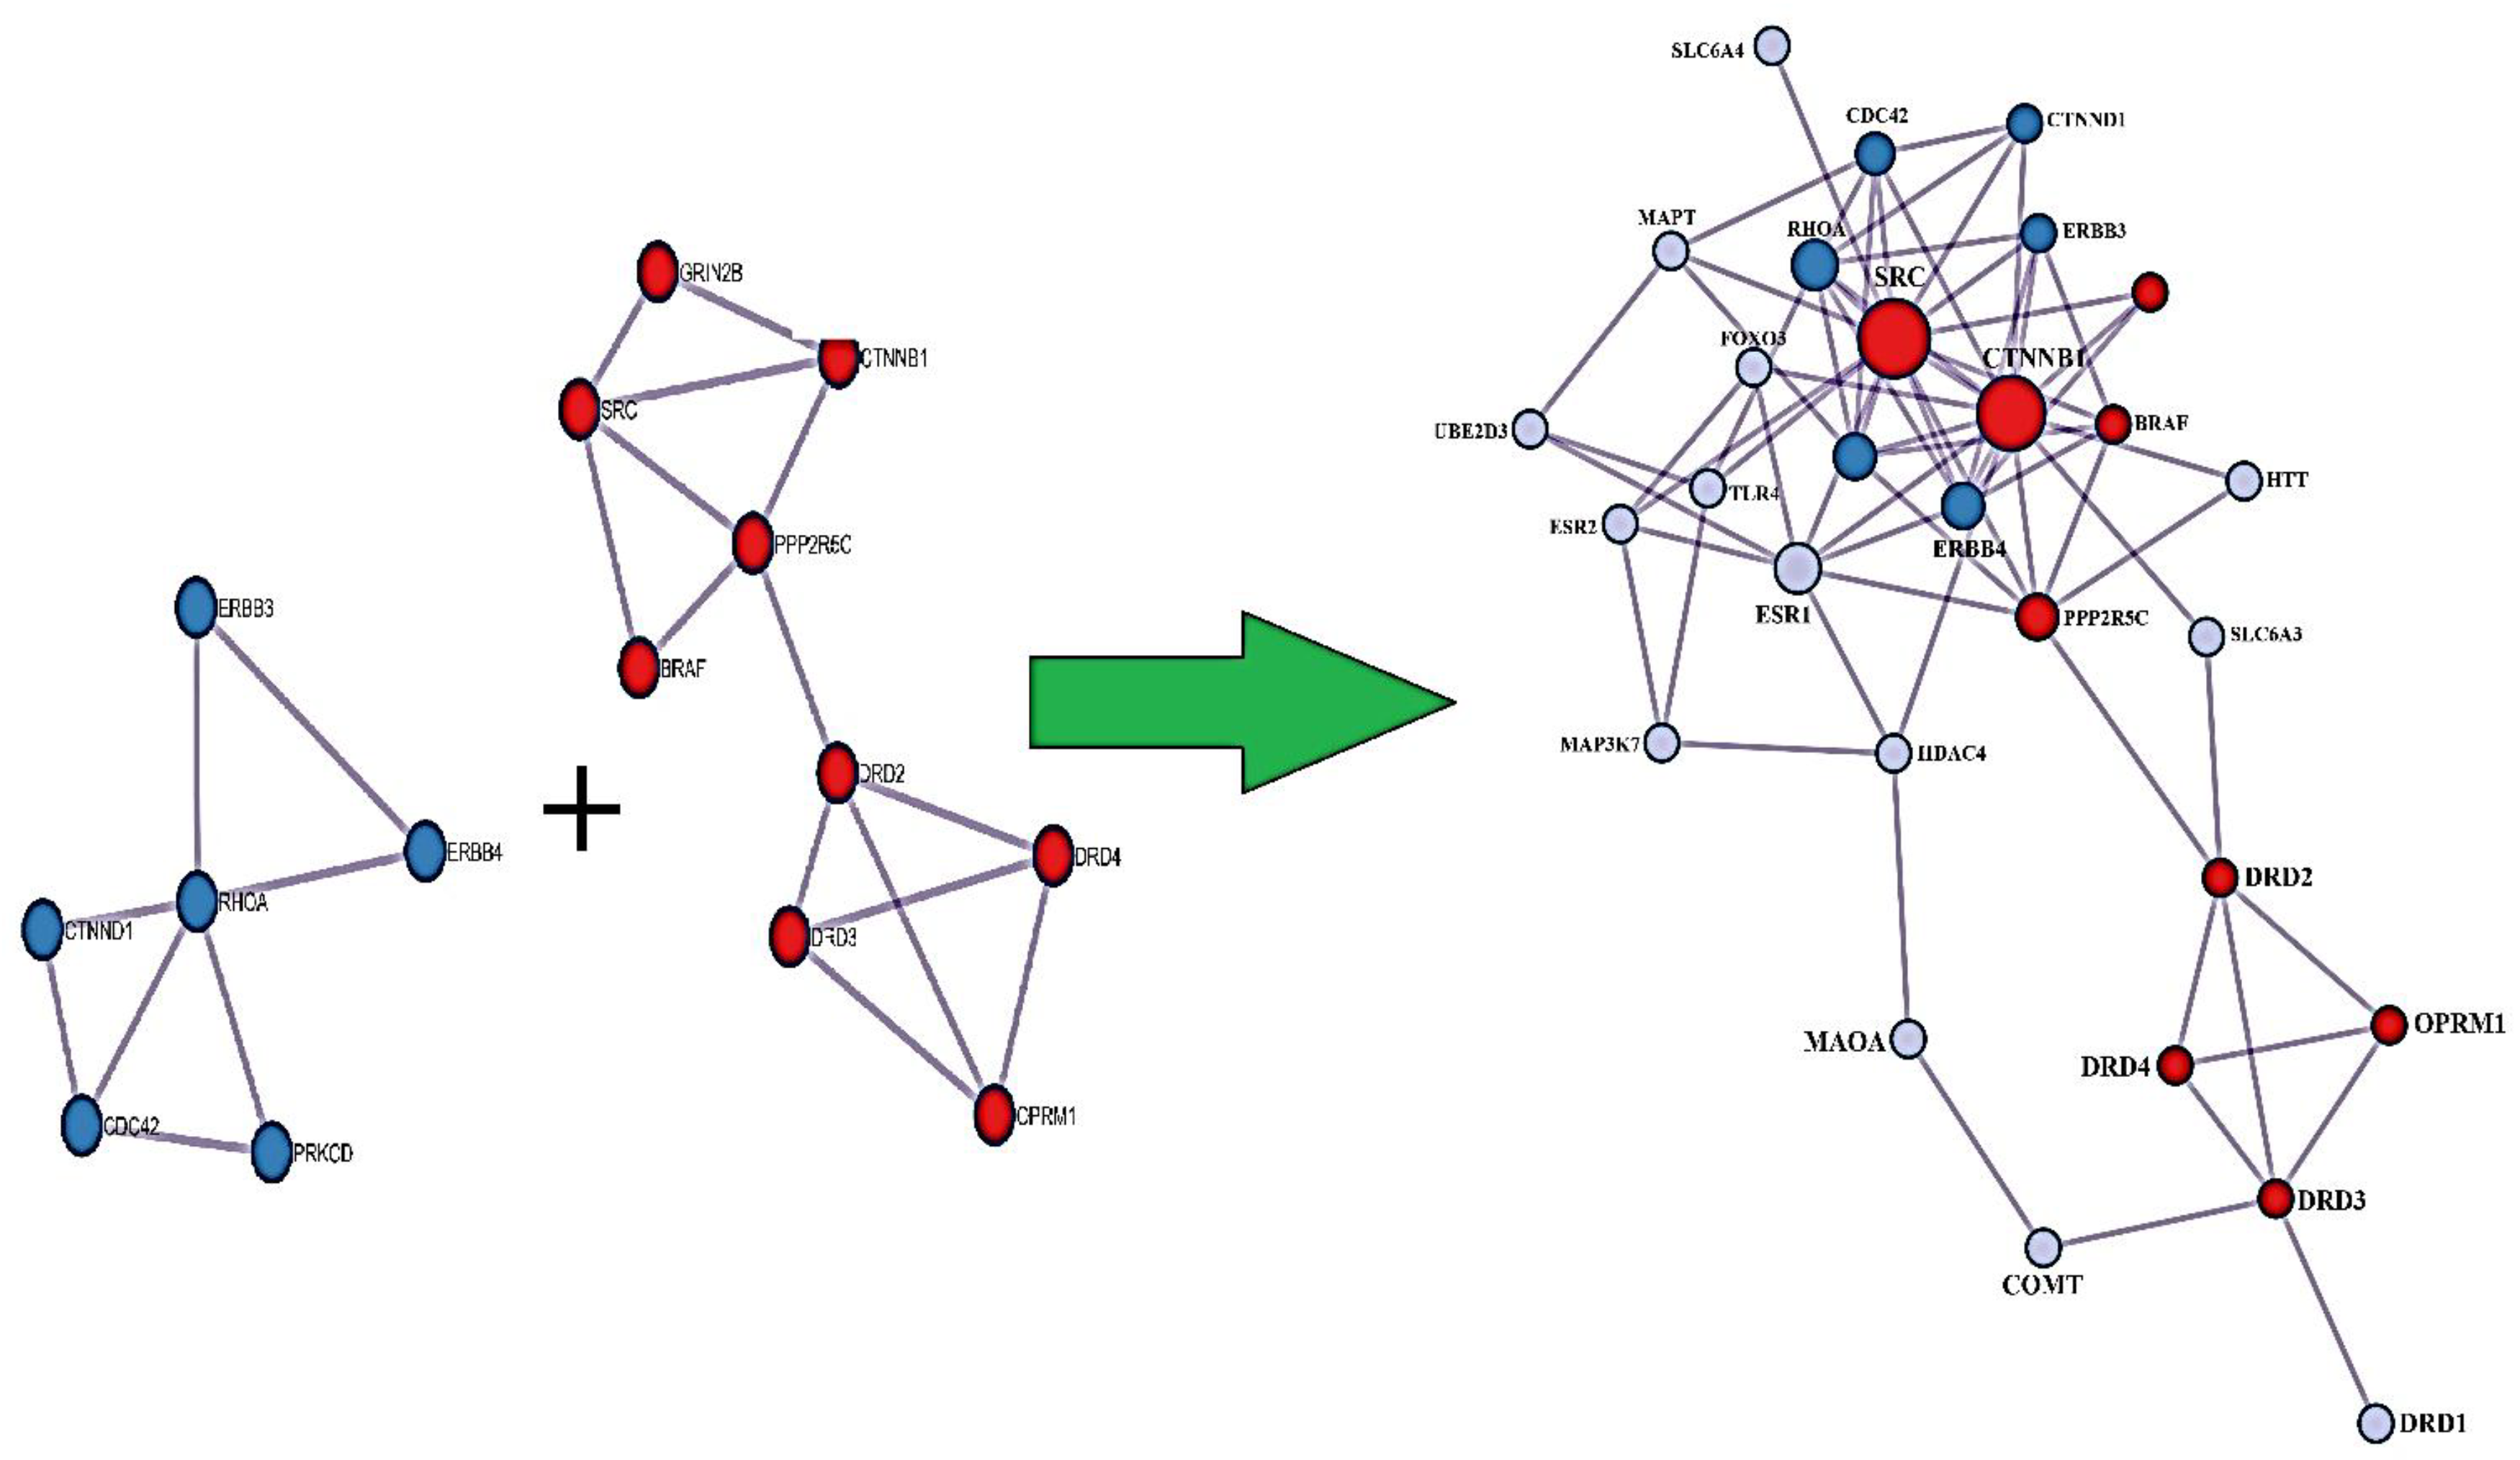
Table 1.
Contents, validations, and references of all primary and deep in silico databases and systems biology approaches utilized in the current paper.
Table 1.
Contents, validations, and references of all primary and deep in silico databases and systems biology approaches utilized in the current paper.
| Level | Database | Site | Software (version) | References |
|---|---|---|---|---|
| GWAS data mining | GWAS catalog | https://www.ebi.ac.uk/gwas/home | EMBL-EBI 2024 |
61 |
| PPIs | STRING-MODEL | https://string-db.org/ | STRING (12.0) |
54 |
| GRNs | GMIs (miRTarBase) | https://mirtarbase.cuhk.edu.cn /~miRTarBase/miRTarBase_2022/php/index.php | NetworkAnalyst (3.0) | 62 |
| Signaling | https://cytoscape.org/ | Cytoscape (3.10.1) | 63 | |
| DDCs | PDIs | https://go.drugbank.com/ | NetworkAnalyst (3.0) | 64 |
| PCIs | https://ctdbase.org/ | NetworkAnalyst (3.0) | 65 | |
| EA | Pathway Analysis | https://maayanlab.cloud/Enrichr/ | Enrichr | 66 |
| GO | https://maayanlab.cloud/Enrichr/ | Enrichr | 67 | |
| DDA | https://maayanlab.cloud/Enrichr/ | Enrichr | 68 | |
| Multi-Omics | Genomics, Proteomics, Transcriptomics, Metabolomics, and Phenomics | https://maayanlab.cloud/enrichr-kg | Enrichr-KG |
69 |
| MA | CEO | https://metascape.org/gp/index.html#/main/step1 | Metascape | 70 |
| PGx | VAA | https://www.pharmgkb.org/ | PharmGKB | 55 |
Abbreviations: PPIs: Protein-Protein Interactions; GRNs: Gene Regulatory Networks; GMIs: Gene-miRNA Interactions; DDCs: Diseases, Drugs & Chemicals; PDIs: Protein-Drug Interactions; PCIs: Protein-Chemical Interactions; EA: Enrichment Analysis; GO: Gene Ontology; DDA: Diseases Drugs Assessment; MA: Meta Analysis; CEO: Clustering Enriched Ontology. PGx: Pharmacogenomics; VAA: Variant Annotation Assessment.
Table 2.
The included raw data from all GWAS related to ASD.
| Phenotype | GWAS CID | Associations (N) | Studies (N) |
|---|---|---|---|
| Autism Spectrum Disorder | EFO_0003756 | 1321 | 55 |
| Autism Spectrum Disorder Symptom | EFO_0005426 | 40 | 12 |
| Autism | EFO_0003758 | 44 | 18 |
| Social Communication Impairment | EFO_0005427 | 21 | 2 |
| Asperger Syndrome | EFO_0003757 | 5 | 2 |
| Obsessive-compulsive Disorder | EFO_0004242 | 258 | 25 |
| Anorexia Nervosa | MONDO_0005351 | 268 | 25 |
| Tourette syndrome | EFO_0004895 | 220 | 14 |
| Attention Deficit Hyperactivity Disorder | EFO_0003888 | 1838 | 85 |
| Schizophrenia | MONDO_0005090 | 5049 | 159 |
| Intelligence | EFO_0004337 | 3846 | 41 |
| Behavior or Behavioral Disorder Measurement | EFO_0004782 | 14 | 17 |
| Bipolar Disorder | MONDO_0004985 | 1592 | 127 |
| Unipolar Depression | EFO_0003761 | 2668 | 299 |
CID means GWAS Catalog ID and N refers to Numbers.
Table 3.
The combined results of Reactome, KEGG, and PANTHER databases are based on a candidate gene list.
Table 3.
The combined results of Reactome, KEGG, and PANTHER databases are based on a candidate gene list.
| N | Index | Name | P-value | q-value | OR |
|---|---|---|---|---|---|
| 1 | KEGG | Dopaminergic synapse | 2.29E-13 | 3.65E-11 | 69.15 |
| 2 | Reactome | Signal Transduction R-HSA-162582 | 3.50E-13 | 1.50E-10 | 16.73 |
| 3 | KEGG | Proteoglycans in cancer | 1.24E-11 | 9.88E-10 | 43.24 |
| 4 | Reactome | Dopamine Receptors R-HSA-390651 | 2.05E-11 | 4.38E-09 | 3072.15 |
| 5 | Reactome | Disease R-HSA-1643685 | 3.34E-11 | 4.76E-09 | 13.88 |
| 6 | Panther | Dopamine receptor mediated signaling pathway Homo sapiens P05912 | 1.30E-11 | 6.49E-09 | 108.28 |
| 7 | Reactome | Transmission Across Chemical Synapses R-HSA-112315 | 6.36E-11 | 6.79 E-09 | 35.68 |
| 8 | Reactome | Diseases Of Signal Transduction By Growth Factor Receptors And Second Messengers R-HSA-5663202 | 3.39E-10 | 2.90 E-09 | 23.62 |
| 9 | KEGG | Rap1 signaling pathway | 6.20 E-10 | 3.29E-08 | 35.59 |
| 10 | KEGG | Adherens junction | 8.95E-10 | 3.56 E-08 | 76.56 |
| 11 | Reactome | Neurotransmitter Clearance R-HSA-112311 | 8.58E-10 | 6.11 E-08 | 511.9 |
| 12 | KEGG | Shigellosis | 2.17 E-09 | 6.89 E-08 | 30.15 |
| 13 | Reactome | Signaling By Receptor Tyrosine Kinases R-HSA-9006934 | 1.55 E-09 | 9.44 E-08 | 20.05 |
| 14 | Panther | CCKR signaling map ST Homo sapiens P06959 | 3.97 E-09 | 9.93 E-08 | 38.16 |
| 15 | Reactome | Neuronal System R-HSA-112316 | 3.39 E-09 | 1.81E-07 | 22.27 |
| 16 | KEGG | Alcoholism | 9.13 E-09 | 2.21 E-07 | 33.65 |
| 17 | KEGG | Cocaine addiction | 9.74 E-09 | 2.21 E-07 | 90.57 |
| 18 | Reactome | PI3K/AKT Signaling In Cancer R-HSA-2219528 | 9.71 E-09 | 3.99 E-07 | 50.18 |
| 19 | Reactome | Signaling By ERBB2 R-HSA-1227986 | 9.74 E-09 | 3.99 E-07 | 90.57 |
| 20 | KEGG | Chemokine signaling pathway | 3.55 E-07 | 7.05E-06 | 26.59 |
| 21 | Panther | Heterotrimeric G-protein signaling pathway-Gq alpha and Go alpha mediated pathway Homo sapiens P00027 | 4.88 E-07 | 8.13E-06 | 39.34 |
| 22 | KEGG | Neuroactive ligand-receptor interaction | 5.72 E-07 | 1.01E-05 | 17.89 |
| 23 | KEGG | Neurotrophin signaling pathway | 8.67 E-07 | 1.38 E-05 | 34.84 |
| 24 | Panther | Angiogenesis Homo sapiens P00005 | 2.08 E-06 | 2.6 E-05 | 28.95 |
| 25 | Panther | Cadherin signaling pathway Homo sapiens P00012 | 2.72 E-06 | 2.72 E-05 | 27.34 |
| 26 | Panther | Adrenaline and noradrenaline biosynthesis Homo sapiens P00001 | 6.85 E-06 | 5.71 E-05 | 100.75 |
| 27 | Panther | EGF receptor signaling pathway Homo sapiens P00018 | 2.05 E-05 | 0.000147 | 29.11 |
| 28 | Panther | Integrin signaling pathway Homo sapiens P00034 | 8.33E-05 | 0.000521 | 20.06 |
| 29 | Panther | Ras Pathway Homo sapiens P04393 | 0.000149 | 0.000829 | 33.51 |
| 30 | Panther | Wnt signaling pathway Homo sapiens P00057 | 0.000753 | 0.003648 | 11.06 |
N, q-value, and OR refer to Numbers, Adjusted p-value, and Odds Ration, respectively.
Table 4.
Merged information of three GO biological indexes related to the candidate gene list.
| Index | Name | P-value | q-value | OR |
|---|---|---|---|---|
| GO Biological Process 2023 | Dopamine Metabolic Process (GO:0042417) | 1.79E-13 | 1.72E-10 | 383.79 |
| GO Biological Process 2023 | Catecholamine Metabolic Process (GO:0006584) | 6.82E-12 | 3.29E-09 | 499.05 |
| GO Biological Process 2023 | Response To Ethanol (GO:0045471) | 4.52E-11 | 1.45E-08 | 307.03 |
| GO Cellular Component 2023 | Neuron Projection (GO:0043005) | 2.40E-10 | 1.80E-08 | 20.6 |
| GO Cellular Component 2023 | Dendrite (GO:0030425) | 1.18E-07 | 4.43E-06 | 22.81 |
| GO Biological Process 2023 | Response To Organic Cyclic Compound (GO:0014070) | 2.32E-08 | 5.58E-06 | 75.16 |
| GO Biological Process 2023 | Prepulse Inhibition (GO:0060134) | 3.04E-08 | 5.85E-06 | 1109.33 |
| GO Biological Process 2023 | Response To Cocaine (GO:0042220) | 6.07E-08 | 9.75E-06 | 739.52 |
| GO Cellular Component 2023 | Axon (GO:0030424) | 5.21E-07 | 1.3E-05 | 24.84 |
| GO Biological Process 2023 | Regulation Of Dopamine Uptake Involved In Synaptic Transmission (GO:0051584) | 1.06E-07 | 1.46E-05 | 554.61 |
| GO Biological Process 2023 | Phospholipase C-activating G Protein-Coupled Receptor Signaling Pathway (GO:0007200) | 1.43E-07 | 1.72E-05 | 51.01 |
| GO Biological Process 2023 | Positive Regulation Of Neuron Death (GO:1901216) | 1.85E-07 | 1.88E-05 | 102.26 |
| GO Biological Process 2023 | Regulation Of Postsynaptic Membrane Potential (GO:0060078) | 2.08E-07 | 1.88E-05 | 98.95 |
| GO Molecular Function 2023 | Kinase Binding (GO:0019900) | 4.19E-06 | 0.000624 | 13.11 |
| GO Cellular Component 2023 | Membrane Raft (GO:0045121) | 0.000114 | 0.00213 | 18.47 |
| GO Cellular Component 2023 | Focal Adhesion (GO:0005925) | 0.000253 | 0.003474 | 10.26 |
| GO Cellular Component 2023 | Cell-Substrate Junction (GO:0030055) | 0.000278 | 0.003474 | 10.04 |
| GO Molecular Function 2023 | Estrogen Response Element Binding (GO:0034056) | 9.72E-05 | 0.004419 | 178.23 |
| GO Molecular Function 2023 | Monoamine Transmembrane Transporter Activity (GO:0008504) | 0.000119 | 0.004419 | 158.42 |
| GO Molecular Function 2023 | Dynactin Binding (GO:0034452) | 0.000119 | 0.004419 | 158.42 |
| GO Molecular Function 2023 | Sodium: Chloride Symporter Activity (GO:0015378) | 0.000168 | 0.00486 | 129.6 |
| GO Molecular Function 2023 | Alkali Metal Ion Binding (GO:0031420) | 0.000196 | 0.00486 | 118.8 |
| GO Molecular Function 2023 | Postsynaptic Neurotransmitter Receptor Activity (GO:0098960) | 0.000366 | 0.007792 | 83.84 |
| GO Molecular Function 2023 | Protein Tyrosine Kinase Activity (GO:0004713) | 0.000433 | 0.008073 | 23 |
| GO Molecular Function 2023 | G Protein-Coupled Receptor Activity (GO:0004930) | 0.000506 | 0.008374 | 12.34 |
| GO Cellular Component 2023 | Catenin Complex (GO:0016342) | 0.000803 | 0.008598 | 54.79 |
| GO Cellular Component 2023 | Non-Motile Cilium (GO:0097730) | 0.000922 | 0.008641 | 50.87 |
| GO Cellular Component 2023 | Bounding Membrane Of Organelle (GO:0098588) | 0.001183 | 0.009858 | 5.89 |
| GO Cellular Component 2023 | Ciliary Membrane (GO:0060170) | 0.001479 | 0.01109 | 39.55 |
| GO Molecular Function 2023 | Protein Kinase Binding (GO:0019901) | 0.000897 | 0.01336 | 7.69 |
GO, q-value, and OR refer to Gene Ontology, Adjusted p-value, and Odds Ration, respectively.
Table 5.
Diseases/Disorders related to the candidate gene list predicted by DisGeNET, GeDiPNet, and Jensen DISEASES.
Table 5.
Diseases/Disorders related to the candidate gene list predicted by DisGeNET, GeDiPNet, and Jensen DISEASES.
| Index | Name | P-value | q-value | OR |
|---|---|---|---|---|
| DisGeNET | Obsessive-Compulsive Disorder | 5.14E-20 | 1.49E-16 | 129.86 |
| DisGeNET | Mental Depression | 4.20E-19 | 6.07E-16 | 45.49 |
| DisGeNET | Abnormal behavior | 1.00E-18 | 8.45E-16 | 54.94 |
| DisGeNET | Addictive Behavior | 1.17E-18 | 8.45E-16 | 77.55 |
| DisGeNET | Nonorganic psychosis | 2.45E-18 | 1.42E-15 | 73.01 |
| DisGeNET | Gambling, Pathological | 6.32E-18 | 2.70E-15 | 1215.26 |
| DisGeNET | Cognition Disorders | 6.54E-18 | 2.70E-15 | 67.41 |
| DisGeNET | Impulsive character (finding) | 8.69E-18 | 3.14E-15 | 237.31 |
| DisGeNET | Hyperactive behavior | 1.42E-17 | 4.57E-15 | 36.43 |
| DisGeNET | Nicotine Dependence | 1.64E-17 | 4.73E-15 | 101.74 |
| Jensen DISEASES | Substance abuse | 3.59E-17 | 6.38E-15 | 198.61 |
| GeDiPNet | Mental Depression | 3.40E-17 | 1.06E-14 | 30.01 |
| GeDiPNet | Mood Disorder | 3.44E-17 | 1.06E-14 | 58.89 |
| Jensen DISEASES | Alcohol dependence | 2.31E-16 | 2.06E-14 | 106.87 |
| GeDiPNet | Schizophrenia | 6.51E-15 | 1.34E-12 | 22.03 |
| Jensen DISEASES | Heroin dependence | 3.57E-13 | 2.12E-11 | 332.58 |
| GeDiPNet | Bipolar Disorder | 2.97E-13 | 4.57E-11 | 24.71 |
| Jensen DISEASES | Nicotine dependence | 1.18E-12 | 5.25E-11 | 131.82 |
| Jensen DISEASES | Gilles de la Tourette Syndrome | 7.85E-11 | 2.80E-09 | 118.62 |
| Jensen DISEASES | Cocaine dependence | 1.38E-10 | 4.10E-09 | 234.74 |
| GeDiPNet | Cognitive Disorder | 6.88E-11 | 8.46E-09 | 121.52 |
| Jensen DISEASES | Dementia | 4.01E-10 | 1.02E-08 | 53.96 |
| GeDiPNet | Status Marmoratus | 1.77E-10 | 1.81E-08 | 221.69 |
| Jensen DISEASES | obsessive-compulsive disorder | 1.23E-09 | 2.74E-08 | 142.44 |
| Jensen DISEASES | Major depressive disorder | 1.72E-09 | 3.41E-08 | 68.14 |
| Jensen DISEASES | Oppositional defiant disorder | 7.39E-09 | 1.20E-07 | 255.87 |
| GeDiPNet | Age-Related Memory Disorders | 4.95E-09 | 4.29E-07 | 104.91 |
| GeDiPNet | Memory Disorders | 5.57E-09 | 4.29E-07 | 102.21 |
| GeDiPNet | Autism | 2.05E-08 | 0.000001399 | 15.1 |
| GeDiPNet | Minimal Brain Dysfunction | 2.95E-08 | 0.000001677 | 170.53 |
*q-value and OR mean adjusted p-value and Odds Ratio.
Table 6.
Multi-Omics results of candidate genes of ASD and GARS.
| Term | Library | p-value | q-value | z-score | combined score |
|---|---|---|---|---|---|
| Obsessive-Compulsive Disorder | DisGeNET | 5.14E-20 | 1.49E-16 | 129.9 | 5767 |
| Mental Depression | DisGeNET | 4.20E-19 | 6.07E-16 | 45.49 | 1925 |
| Abnormal behavior | DisGeNET | 1.00E-18 | 8.45E-16 | 54.94 | 2277 |
| Addictive Behavior | DisGeNET | 1.17E-18 | 8.45E-16 | 77.55 | 3202 |
| Nonorganic psychosis | DisGeNET | 2.45E-18 | 1.42E-15 | 73.01 | 2961 |
| dopamine metabolic process (GO:0042417) | GO_Biological_Process_2021 | 1.79E-13 | 1.82E-10 | 383.8 | 11260 |
| Dopaminergic synapse | KEGG_2021_Human | 2.29E-13 | 3.65E-11 | 69.15 | 2013 |
| Proteoglycans in cancer | KEGG_2021_Human | 1.24E-11 | 9.88E-10 | 43.24 | 1086 |
| catecholamine metabolic process (GO:0006584) | GO_Biological_Process_2021 | 1.59E-11 | 8.09E-09 | 399.2 | 9926 |
| regulation of dopamine uptake involved in synaptic transmission (GO:0051584) | GO_Biological_Process_2021 | 2.87E-10 | 9.73E-08 | 767.9 | 16870 |
| Rap1 signaling pathway | KEGG_2021_Human | 6.20E-10 | 3.29E-08 | 35.59 | 754.4 |
| Adherens junction | KEGG_2021_Human | 8.95E-10 | 3.56E-08 | 76.56 | 1595 |
| Shigellosis | KEGG_2021_Human | 2.17E-09 | 6.89E-08 | 30.15 | 601.5 |
| positive regulation of neuron death (GO:1901216) | GO_Biological_Process_2021 | 7.85E-09 | 2E-06 | 94.9 | 1771 |
| regulation of protein kinase B signaling (GO:0051896) | GO_Biological_Process_2021 | 1.91E-08 | 3.9E-06 | 30.08 | 534.7 |
| Neuroticism | GWAS_Catalog_2019 | 0.000057824 | 0.006743 | 22.11 | 215.7 |
| Bone mineral density (hip) | GWAS_Catalog_2019 | 0.000071735 | 0.006743 | 43.4 | 414.1 |
| BMI (adjusted for smoking behaviour) | GWAS_Catalog_2019 | 0.0002067 | 0.008483 | 29.87 | 253.5 |
| Extremely high intelligence | GWAS_Catalog_2019 | 0.0002147 | 0.008483 | 29.47 | 248.9 |
| Personality dimensions | GWAS_Catalog_2019 | 0.0002256 | 0.008483 | 109.7 | 920.7 |
The items with q-value more than 0.05 are deleted.
Table 7.
Top 20 clusters with their representative enriched terms (one per cluster).
| GO | Category | Description | Log10(P) | Log10(q) |
|---|---|---|---|---|
| GO:0071407 | GO Biological Processes | cellular response to organic cyclic compound | -15.64 | -11.30 |
| GO:0042417 | GO Biological Processes | dopamine metabolic process | -14.94 | -10.90 |
| GO:0007610 | GO Biological Processes | Behavior | -14.11 | -10.54 |
| hsa05205 | KEGG Pathway | Proteoglycans in cancer | -12.50 | -9.24 |
| R-HSA-112315 | Reactome Gene Sets | Transmission across Chemical Synapses | -11.42 | -8.34 |
| GO:0060322 | GO Biological Processes | head development | -11.37 | -8.34 |
| R-HSA-5663202 | Reactome Gene Sets | Diseases of signal transduction by growth factor receptors and second messengers | -11.13 | -8.21 |
| GO:0033674 | GO Biological Processes | positive regulation of kinase activity | -10.95 | -8.07 |
| GO:0043410 | GO Biological Processes | positive regulation of MAPK cascade | -10.74 | -7.87 |
| GO:0070201 | GO Biological Processes | regulation of establishment of protein localization | -10.23 | -7.44 |
| M237 | Canonical Pathways | PID VEGFR1 2 PATHWAY | -10.20 | -7.44 |
| WP399 | WikiPathways | Wnt signaling pathway and pluripotency | -9.16 | -6.54 |
| R-HSA-5683057 | Reactome Gene Sets | MAPK family signaling cascades | -9.11 | -6.52 |
| WP710 | WikiPathways | DNA damage response only ATM dependent | -8.93 | -6.38 |
| GO:0097305 | GO Biological Processes | response to alcohol | -8.30 | -5.82 |
| GO:0071363 | GO Biological Processes | cellular response to growth factor stimulus | -7.74 | -5.34 |
| GO:0001775 | GO Biological Processes | cell activation | -7.67 | -5.29 |
| R-HSA-1280215 | Reactome Gene Sets | Cytokine Signaling in Immune system | -7.35 | -5.02 |
| GO:0010001 | GO Biological Processes | glial cell differentiation | -7.21 | -4.91 |
| WP4312 | WikiPathways | Rett syndrome causing genes | -6.83 | -4.63 |
"Log10(P)" is the p-value in log base 10. "Log10(q)" is the multi-test adjusted p-value in log base 10.
Table 8.
clinical relevance for Autism genes we found in the PGX study.
| GENE | CLINICAL RELEVANCE | SOURCE | COMMENT |
|---|---|---|---|
| CTNNB1 | CTNNB1 neurodevelopmental disorder (CTNNB1-NDD) is characterized in all individuals by mild-to-profound cognitive impairment | PMID: 35593792. | Up to 39% of reported individuals by exudative vitreoretinopathy, an ophthalmologic finding consistent with familial exudative vitreoretinopathy (FEVR). |
| ESR1 | There is evidence for the role of Esr1+ neurons in aversion and sexually dimorphic stress sensitivity. | PMC10322719 |
Excitatory projections from the lateral hypothalamic area (LHA) to the lateral habenula (LHb) drive aversive responses |
| RHOA | Knockdown of RhoA in the dHIP enhanced METH-induced CPP, whereas RhoA overexpression attenuated the effects of METH. | PMID: 34313802. | Findings indicate that the miR-31-3p/RhoA pathway in the dHIP modulates METH-induced CPP in mice. Results highlight the potential role of epigenetics represented by non-coding RNAs in the treatment of METH addiction. |
| CDC42 | cdc42-activated, nonreceptor tyrosine kinase, Ack1, is a DAT endocytic brake that stabilizes DAT at the plasma membrane and is released in response to PKC activation. | PMID: 26621748 |
Findings reveal a unique endocytic control switch that is highly specific for DAT. |
| FOXO3 | Forkhead transcription factor (FOXO) family to be a downstream mechanism through which SIRT1 regulates cocaine action. | PMID: 25698746 |
Overexpressing FOXO3 in NAc enhances cocaine place conditioning |
| MAP3K7 | The multi-component and multi-target properties of Acanthopanax senticosus (AS) play an important role in the alleviation of anxiety and memory impairment caused by AD, and the mechanism is involved in the phosphorylation and activation of the MAPK signaling pathway. | PMID: 38545117 |
The levels of MAP3K7 and P38 phosphorylation increased, and there was also an increase in the expression of HSP27 proteins. |
| PRKCD | It was reported that social choice-induced voluntary abstinence prevents incubation of methamphetamine craving in rats. This inhibitory effect was associated with activation of protein kinase-Cδ (PKCδ)-expressing neurons in central amygdala lateral division (CeL). | PMID: 32205443 |
shPKCδ CeL injections decreased Fos in CeL PKCδ-expressing neurons, increased Fos in CeM output neurons, and reversed the inhibitory effect of social choice-induced abstinence on incubated drug seeking on day 15. |
| ERBB4 | Natural genetic variants of Neuregulin1 (NRG1) and its cognate receptor ErbB4 are associated with a risk for schizophrenia. | PMID: 32354758 |
Findings indicate that ErbB4 signaling affects tonic DA levels and modulates a wide array of behavioral deficits relevant to psychiatric disorders, including schizophrenia. |
| UBE2D3 | It is well known that dysfunction of the ubiquitin-proteasome protein degradation system (UPPDS) is one of the major mechanisms of the pathogenesis of PD. | PMID: 24993970 |
Decreasing transcript levels of genes may indicate decrease in the efficiency of the UPPDS on the whole which in turn may lead to the accumulation of abnormal proteins and toxic protein aggregates and subsequent death of the neurons. |
| MAPT |
MAPT involves myelination, neurite elongation and guidance in cytoskeletal organization and is involved in structural connectivity |
PMID: 38438384 |
Structural connectivity measures are highly polygenic |
| CTNND1 | Functional and positional QTL gene-based approaches identified 249 significant candidate risk genes for OCD, of which 25 were identified as putatively causal, highlighting WDR6, DALRD3, CTNND1 & genes in the MHC region | doi: 10.1101/2024.03.13.24304161. | Obsessive-compulsive disorder (OCD) affects ~1% of the population and exhibits a high SNP-heritability |
| HDAC4 | One family of epigenetic molecules that may regulate maladaptive behavioral changes produced by cocaine use are the histone deacetylases (HDACs)-key regulators of chromatin and gene expression. In particular, class IIa HDACs (HDAC4, HDAC5, HDAC7 and HDAC9) respond to changes in neuronal activity by modulating their distribution between the nucleus and cytoplasm-a process controlled in large part by changes in phosphorylation of conserved residues. | PMID: 28635037 |
Despite high sequence homology, HDAC4 and HDAC5 are oppositely regulated by cocaine-induced signaling in vivo and have distinct roles in regulating cocaine behaviors. |
| BRAF | Expressing BRAF K499E (KE) in neural stem cells under the control of a Nestin-Cre promoter (Nestin;BRAFKE/+) induced hippocampal memory deficits | PMID: 39964758 |
Results demonstrate that ERK hyperactivity contributes to astrocyte dysfunction associated with Ca2+ dysregulation, leading to memory deficits of BRAF-associated RASopathies. |
| ESR2 | Studies indicates that the epigenetic dysregulation of ESR2 may govern the development of autism. | PMID: 28299627 |
Detailed analyses revealed that eight specific CpG sites were hypermethylated in autistic individuals and that four specific CpG sites were positively associated with the severity of autistic symptoms. |
| PPP2R5C | Pathogenic variants resulting in protein phosphatase 2A (PP2A) dysfunction resulting in mild to severe neurodevelopmental delay. | PMID: 39978342 |
PPP2R5C total loss-of-function variants could be inherited from a non-symptomatic parent. This implies that a dominant-negative mechanism on substrate dephosphorylation or general PP2A function is the most likely pathogenic mechanism. |
| ERBB3 | Significant gene-gene interactions were found between (i) NRG1*MBP (perm p-value = 0.002) in the SSD trios sample, (ii) ERBB3*AKT1 (perm p-value = 0.001) in the SSD case-control sample, and (iii) ERBB3*QKI (perm p-value = 0.0006) in the ASD trios sample. | PMID: 34338147 |
Schizophrenia-spectrum disorders (SSD) and Autism spectrum disorders (ASD) are neurodevelopmental disorders that share clinical, cognitive, and genetic characteristics, as well as particular white matter (WM) abnormalities. |
| TLR4 | After TLR4 activation, CD14+ monocytes from autistic children produced increased IL-6 compared to monocytes from children with typical development. IL-6 concentration also correlated with worsening restrictive and repetitive behaviors. | PMID: 35203983 |
Findings suggest dysfunctional activation of myeloid cells, and may indicate that other cells of this lineage, including macrophages, and microglia in the brain, might have a similar dysfunction. |
| HTT | Prenatal alcohol exposure (PAE) results in cerebral cortical dysgenesis. AE inhibited Bcl11a, Htt, Ctnnb1, and other upstream regulators of differentially expressed genes and inhibited several autism-linked genes, suggesting that neurodevelopmental disorders share underlying mechanisms. | PMID: 33997709 |
Episodic PAE persistently alters the developing neural transcriptome, contributing to sex- and cell-type-specific teratology. |
| SRC | Src protein tyrosine kinase plays an important role Opioid addiction | PMID: 34243625 |
Src inhibitors have the potential to be used in combination with opioids to achieve synergy |
|
GRIN2B. |
The N-methyl-D-aspartate (NMDA) glutamate receptors play important roles in the pathophysiology of substance dependence (SD). Results from gene-based association tests showed that the association signal derived mostly from GRIN2B. | PMID: 23855403 |
Rare variants (RVs) with minor allele frequency <1% in the NMDAR-related genes influence the risk of OD |
| GARS GENES | The GARS panel can accurately predict preaddiction | PMID: 28930612 |
Genetically identifying risk for all RDS behaviors, especially in compromised populations, may be a frontline tool to assist municipalities to provide better resource allocation. |
Disclaimer/Publisher’s Note: The statements, opinions and data contained in all publications are solely those of the individual author(s) and contributor(s) and not of MDPI and/or the editor(s). MDPI and/or the editor(s) disclaim responsibility for any injury to people or property resulting from any ideas, methods, instructions or products referred to in the content. |
© 2025 by the authors. Licensee MDPI, Basel, Switzerland. This article is an open access article distributed under the terms and conditions of the Creative Commons Attribution (CC BY) license (http://creativecommons.org/licenses/by/4.0/).
Copyright: This open access article is published under a Creative Commons CC BY 4.0 license, which permit the free download, distribution, and reuse, provided that the author and preprint are cited in any reuse.


