
Submitted:
29 June 2025
Posted:
30 June 2025
You are already at the latest version
Abstract
This article explores the problem of energy conversion and the related storage of hydrogen as an alternative energy source. A method of altering traditional pressure vessels using a composite material based on epoxy resin and graphene is proposed. The test plan for verifying its mechanical properties has been defined. A quantum chemical simulation in Scigress software was performed to analyse the electron distribution in the macromolecules of the epoxy resin and flake graphene. Based on the results of the strength analysis, the strength properties of the composite and the physicochemical changes at the epoxy resin-graphene. It has been proven that the epoxy resin LG 700 with 0.25% by weight of reduced graphene oxide is a potential material for the modification of pressure vessels. The reason behind it is the possibility of improving the mechanical properties of the epoxy resin due to the reorganisation of the polymer chains in the graphene flake region. This effect supports the formation of semicrystalline regions, which can enhance mechanical properties.
Keywords:
epoxy
; resin
; graphene
; composite
; molecular modelling
1. Introduction
Faced with numerous climate threats, the pursuit of alternative energy sources with the lowest possible carbon footprint has become one of the main challenges of modern civilisation. The fourth most greenhouse gas-emitting sector is transport [1]. Several car manufacturers are making numerous attempts to develop low-carbon propulsion systems. The most popular alternative powertrain is one powered by electric motors and batteries [2]. This solution is not ideal due to the low energy density of the current battery packs, which results in their considerable weight. This creates a kind of cause-and-effect chain in which large and heavy battery packs are installed to provide an electric vehicle with a range comparable to its combustion equivalent [3]. The cells significantly increase the weight of the whole machine. This contributes to higher electricity consumption, as well as wear and tear on exploitative components such as tyres, brake discs, and suspension components, which require significant energy input to produce. An alternative to the described drive is hydrogen technology, where internal combustion engines or gas turbines are used to burn hydrogen as in traditional drives [2,4]. Another approach is the use of hydrogen cells, which convert gas into electricity by combining oxygen from the air with hydrogen. The by-products of this reaction are steam and heat. Due to its high energy content, it can provide nearly three times more energy compared to traditional petrol for passenger cars [5]. The currently available hydrogen vehicle, the Toyota Mirai, is able to travel 100 km using 0.55 kg of hydrogen, which, with a storage capacity of 5.6 kg of gas, is a very good value, especially when compared to the range of a BEV (Battery Electric Vehicle) [6]. The hydrogen is stored in its gaseous form in a Class IV tank [7], at a high pressure of 35–70 MPa, depending on the vehicle’s intended use [2].
The biggest disadvantage of this technology, in any sector of its implementation, is the storage of hydrogen, which is realised in both its gaseous and liquid states [8]. Due to its physical properties, its penetrability through other commonly used materials, such as steel or composites, is an equally big problem. Producing low-cost, leak-proof, and lightweight hydrogen tanks is therefore a challenge. One direction in the search for sustainable energy sources is thus the development of hydrogen pressure vessels. One way to ensure the sustainability of hydrogen technology is to modify existing metal pressure vessels. The process involves placing a sealed insert inside the container to cover its walls. Composite materials with graphene appear to be the materials that meet the requirements due to their potential capabilities and properties.
However, no systematic knowledge in the literature exists on the effect of the presence of graphene on the potential reorganisation of polymer systems into which it has been introduced. There is a lack of unambiguous analyses of the possibility that reorganisation of polymer chains may occur as a result of interaction with graphene structures (vacancies of carbon atoms, presence of oxygen groups, etc.). Therefore, this paper relates the physicochemical properties at the molecular level, at the graphene/epoxy resin interface, to the obtained results of mechanical properties. Understanding these mechanisms may lead to the development of a new generation of materials dedicated to, for example, hydrogen transport or storage.
2. Materials and Methods
Specimen Preparation
The research plan was to produce five batches of dedicated composite samples formed from the LG 700 epoxy resin produced by GRM Systems, the dedicated HG 700 hardener and the addition of different weight contents of reduced graphene oxide produced by Advanced Graphene Products: 0%, 0.25%, 0.5%, 1% and 2%. A critical issue was the incorporation of graphene instead of the hardener. Two types of specimens were prepared for the planned flexural, hardness measurement and compression tests. For the first two tests, rectangular specimens complying with PN-EN ISO 178 with dimensions of 10 x 80 x 4 mm [9] were used. For the last test, cylindrical specimens with a diameter of 10 mm and a height of 15 mm, as specified in PN-57/H-04320 [10], were used. All samples were tested after complete curing, following a 7-day period.
Flexural Test
The static flexural test was conducted using the three-point flexural method according to PN-EN ISO 178. In this test, five test groups of six specimens each were subjected to fracture. The three-point bending test was carried out on a Bruker UMT-2. The specimens were supported on support rollers with a radius of 3 mm, which was the only deviation from the standard. The support spacing was 64 mm. Once the specimens were positioned on the bases, an applied force was set at the centre of the specimen. The lowering speed of the crosshead was 0.08 mm/s. The force was applied to the material until the specimen broke. The deflection of the specimens was determined from the difference in crosshead lowering, while the flexural strength of the specimens was calculated from Equation 1 given by
where is the maximum recorded force during the flexural test, is the spacing between supports, is the width of the test specimen, is the thickness of the test sample. The mean and standard deviation were determined for the recorded values.
Compression Test
Five test groups, each comprising five specimens, were subjected to static compression. Although the PN-57/H-04320 standard has been withdrawn and was intended for testing metals, the specimens were prepared in accordance with it. The specimens were examined in accordance with the standard on a Walter + Bai LFV-50kN/PAC-6 machine. The test involved placing cylindrical specimens on a base and then preloading them to a maximum of 1 N. Once the material was prepared for the test, an applied force was distributed across the top base of the specimen. The lowering speed of the indenter was 0.05 mm/s. From the recorded force, the compressive strength was determined, which was determined using Equation 2 given by
where is the highest loading force on the specimen leading to it fracture, is the diameter of the specimen base. Young’s modulus was determined from the ratio of compressive stress to axial strain in terms of elastic deformation. The mean and standard deviation were determined for the recorded quantities.
Hardness Test
The hardness measurement test was conducted using the Vickers method in accordance with ISO 6507-1:2018. For the composite hardness test, undamaged rectangular static flexural specimens were used. Five test groups of six samples in each were subjected to this investigation. On each test specimen used later in the bending test, two measurements were taken on the area with the largest area, along the longest line of symmetry at both ends of the specimen. The hardness measurement test was performed on the INNOVATEST VERZUS 700AS machine. Due to the type of material tested, an HV 1 test was taken, which corresponds to an applied force of 1 kgF (9.807 N) [11]. Mean values were determined for the recorded volumes, and the standard deviation was also calculated.
Heat Capacity Test
Heat capacity (ΔH, J/g) and glass transition temperature (Tg, °C) analyses as a function of GO additive concentration in the epoxy resin were performed on a NETZSCH 204 F1 Phoenix differential scanning calorimetry (DSC) analyser based on a single heating, holding, and cooling cycle. The heating cycle was performed over a temperature range of 28°C to 300°C with a heating rate of 15°C/min. This was followed by a withstand cycle at 300°C for 5 min and a cooling cycle from 300°C to 25°C at a rate of 30°C/min. Nitrogen N5.0 was used as a protective gas at a flow rate of 20 ml/min while the sample mass was 10.0 ÷ 10.8 mg. Two trial heating cycles to 500°C were performed to check the combustion temperature of 333.7°C and 333.9°C for the case under study. Tests were performed for 4 different concentrations of GO (0.25, 0.5, 1.0, 2.0 wt%) in the epoxy resin and a reference sample.
Molecular Simulation
In order to verify the physicochemical properties at the atomic level and relate this to macro-scale mechanical properties, quantum chemical calculations using semi-empirical methods (PM5 and PM6) were conducted. Analyses were carried out using quantum chemistry and physics tools in Fujitsu Scigress, which involved building chemical models of a cross-linked epoxy resin and graphene flakes with optimization of both 3D structures. Based on their models and 3D maps, the electron distribution in the macromolecules was analysed for electrostatic evaluation. Physicochemical changes at the phase boundary of the epoxy resin/graphene interface due to electrostatic effects and chemical interactions in the form of newly generated chemical bonds were also analysed.
3. Results
Reduced Graphene Powder Tests
Structural characterisation of the studied nanopowder was conducted by Raman Spectroscopy (Figure 1).
Three characteristic peaks for carbon materials were observed on the Raman spectrum obtained for the graphene used: D, G, and 2D. The G band, which originates from the stretching vibrations of all the carbon bond pairs with sp2 hybridisation, forming both rings and chains, became visible at 1572.9 cm-1. For graphene oxide (GO) before the reduction process, the G band is usually observed around 1600 cm-1. In the material studied, however, it shifted towards lower wave numbers, a result of the reduction in oxidation state [13].
The D band, which indicates a disordered graphene structure, due to external and surface defects, gaps, adatoms, grain boundaries, edges, and the presence of functional groups [14], occurs at 1344.6 cm-1. The intensity ratio of the D and G bands (ID/IG), considered as a measure of structural disorder, for the graphene studied reached 0.92.
During the reduction of graphene oxide (GO), there is an increase in the ID/IG ratio, which is due to the fact that during reduction, the number of carbon domains with sp2 hybridisation increases in the material, albeit their size decreases. Reduction of graphene oxide restores the graphene crosslink, but this is limited to small areas [15]. In addition, the removal of oxygen functional groups from the graphene network also inevitably leads to the formation of defects and structural flaws, which results in an increase in D-band intensity and a rise in ID/IG ratio values [16].

Table 1.
Summary of the position and intensity of the D, G, 2D bands and the values of the ID/IG and I2D/IG ratios for reduced graphene oxide powder.
Table 1.
Summary of the position and intensity of the D, G, 2D bands and the values of the ID/IG and I2D/IG ratios for reduced graphene oxide powder.
| Intensity [a.u.] | Wavenumber (cm-1) | Intensity ratio | |||||
|---|---|---|---|---|---|---|---|
| ID | IG | I2D | D | G | 2D | ID/ IG | I2D/IG |
| 657.3 | 716.9 | 353.8 | 1344.6 | 1572.9 | 2716.2 | 0.92 | 0.54 |
In addition, an analysis of the functional groups present in the test material was conducted using infrared spectrometry (Figure 2).
On the spectrum of G2.5 nanopowder, absorption bands were observed at wavenumbers of 3438 cm-1, 2927 cm-1, 1712 cm-1, 1581 cm-1, 1169 cm-1, and 1065 cm-1. Among the selected bands, the first one corresponds to O-H hydroxyl groups, the next one indicates the existence of asymmetric and symmetric stretching vibrations of CH2 bonds, 1712 cm-1 may originate from the C=O carbonyl group. On the other hand, the presence of 1581 cm-1 indicates the existence of C=C stretching bonds, 1169 cm-1 and 1065 cm-1 correspond successively to vibrations from C-O-C stretching bonds (coming from the epoxide group) and C-OH bonds coming from the carboxyl group [17].
Three-Point Fexural Test
A comparison of the mean values along with the error bars is shown graphically in Figure 3. The specimens without added graphene had the highest mean flexural strength. The addition of rGO to the other composites did not increase flexural strength. The graphene-added test group with the highest flexural strength was the series with 0.5% by weight addition, which had a mean strength value of 97 MPa — 1.8 MPa less than the reference pure epoxy resin series. The lowest flexural strength value was achieved for the series with 2% by weight rGO was 91.3 MPa — 7.5 MPa lower than the reference series. The flexural strength for the samples with 0. 25% by weight rGO was reduced by 3.3%.
The addition of flake graphene reduced the flexural strength in each of the test groups. The reduction in flexural strength ranged from 1.8% for 0.5% by weight to 7.6% for 2% by weight. Based on the study, it can be assumed that flexural strength values decline when flake graphene exceeds 1% by weight in the curing agent of LG 700 epoxy resin. The standard deviation of the mean flexural strength values for the test groups did not exceed 5.5%.
A comparison of the mean deflection values together with the error bars is shown graphically in Figure 4. The pure epoxy resin specimens exhibited the highest deflection of all the test batches measured. Their deflection was the largest at an average of 11.2 mm. The addition of rGO at 0.25% by weight slightly reduced the composite deformation by 1.8%. Noteworthy, this test series had the lowest standard deviation of 0.4 mm. For the material with 0.5% by weight of graphene, a significant decrease in the deformation of the samples of 12.5% was observed. A decrease in the deflection of the specimens for the 1% and 2% by weight content is noticeable. A change in composition by replacing the hardener with flake graphene resulted in a reduction in mean deflection of 22.3% and 29.5%, respectively. Standard deviation of the mean deflection values of the samples for the tested groups showed a significant range, but did not exceed 30% of the mean values of the respective series. The highest standard deviation was observed in the group containing 2% by weight rGO of 2 mm, with 1.8 mm for 1% by weight.
However, it should be noted that specimens with incorporated graphene tended to fracture when they were tested into more than 2 parts. For the material with the highest graphene addition, the samples cracked into four parts twice, into two parts twice, and once each into five and three parts. For the series with the lowest added amount of rGO, the samples cracked into three parts three times, into two parts twice, and into four parts once. Figure 5 shows samples made from pure epoxy resin (Figure 5a), resin with the smallest (Figure 5c) and largest incorporation of graphene (Figure 5b).
Static Compression Test
A comparison of the mean compression strengths including the error bars is shown graphically in Figure 6. The addition of 0.25% by weight of reduced flake graphene decreased the compression strength to 87.2 MPa, resulting in a weakening of properties by 2% compared to the base material without the addition of rGO. For the series with the highest graphene additions of 1% and 2% by weight, a reduction in properties of 2.5% and 3.6% respectively was recorded.
This was also correlated with the results of the two previous tests, where these specimens had the highest hardness, became more brittle, and exhibited smaller deflection. The greatest decrease in compression strength was observed for the series with 0.5% by weight of rGO, obtaining a 13% lower strength of 77.3 MPa. However, the standard deviation for this test group was the highest of all at 10.8 MPa. The standard deviation of the mean compression strength for the test groups is characterised by a dispersion of no more than 3% of the mean values of all series, except for the group containing 0.5% by weight of rGO, where it was the largest at 13.8%.
A comparison of the mean Young’s modulus values, including the error bars, is shown graphically in Figure 7. The addition of reduced flake graphene in the 0.25% by weight of rGO series reduced the Young’s modulus of the composite by 0.3%, which is an insignificantly low value. The addition of 0.5% by weight of graphene resulted in the lowest compression modulus, reaching 2.79 GPa, a reduction of 3.1% compared to the reference series of pure resin. The highest values of Young’s modulus were obtained by adding 2% by weight of graphene, increasing the brittleness of the samples, and reducing their deformation. The value of the modulus was increased by 0.2 GPa, which is equivalent to a 6.9% increase. A 3.8% increase in Young’s modulus was also observed for the series of specimens with 1% by weight of rGO, with this test group having the largest measurement error of 0.2 GPa. The standard deviation of the mean compression strength for the test groups is characterised by a dispersion of no more than 7%.
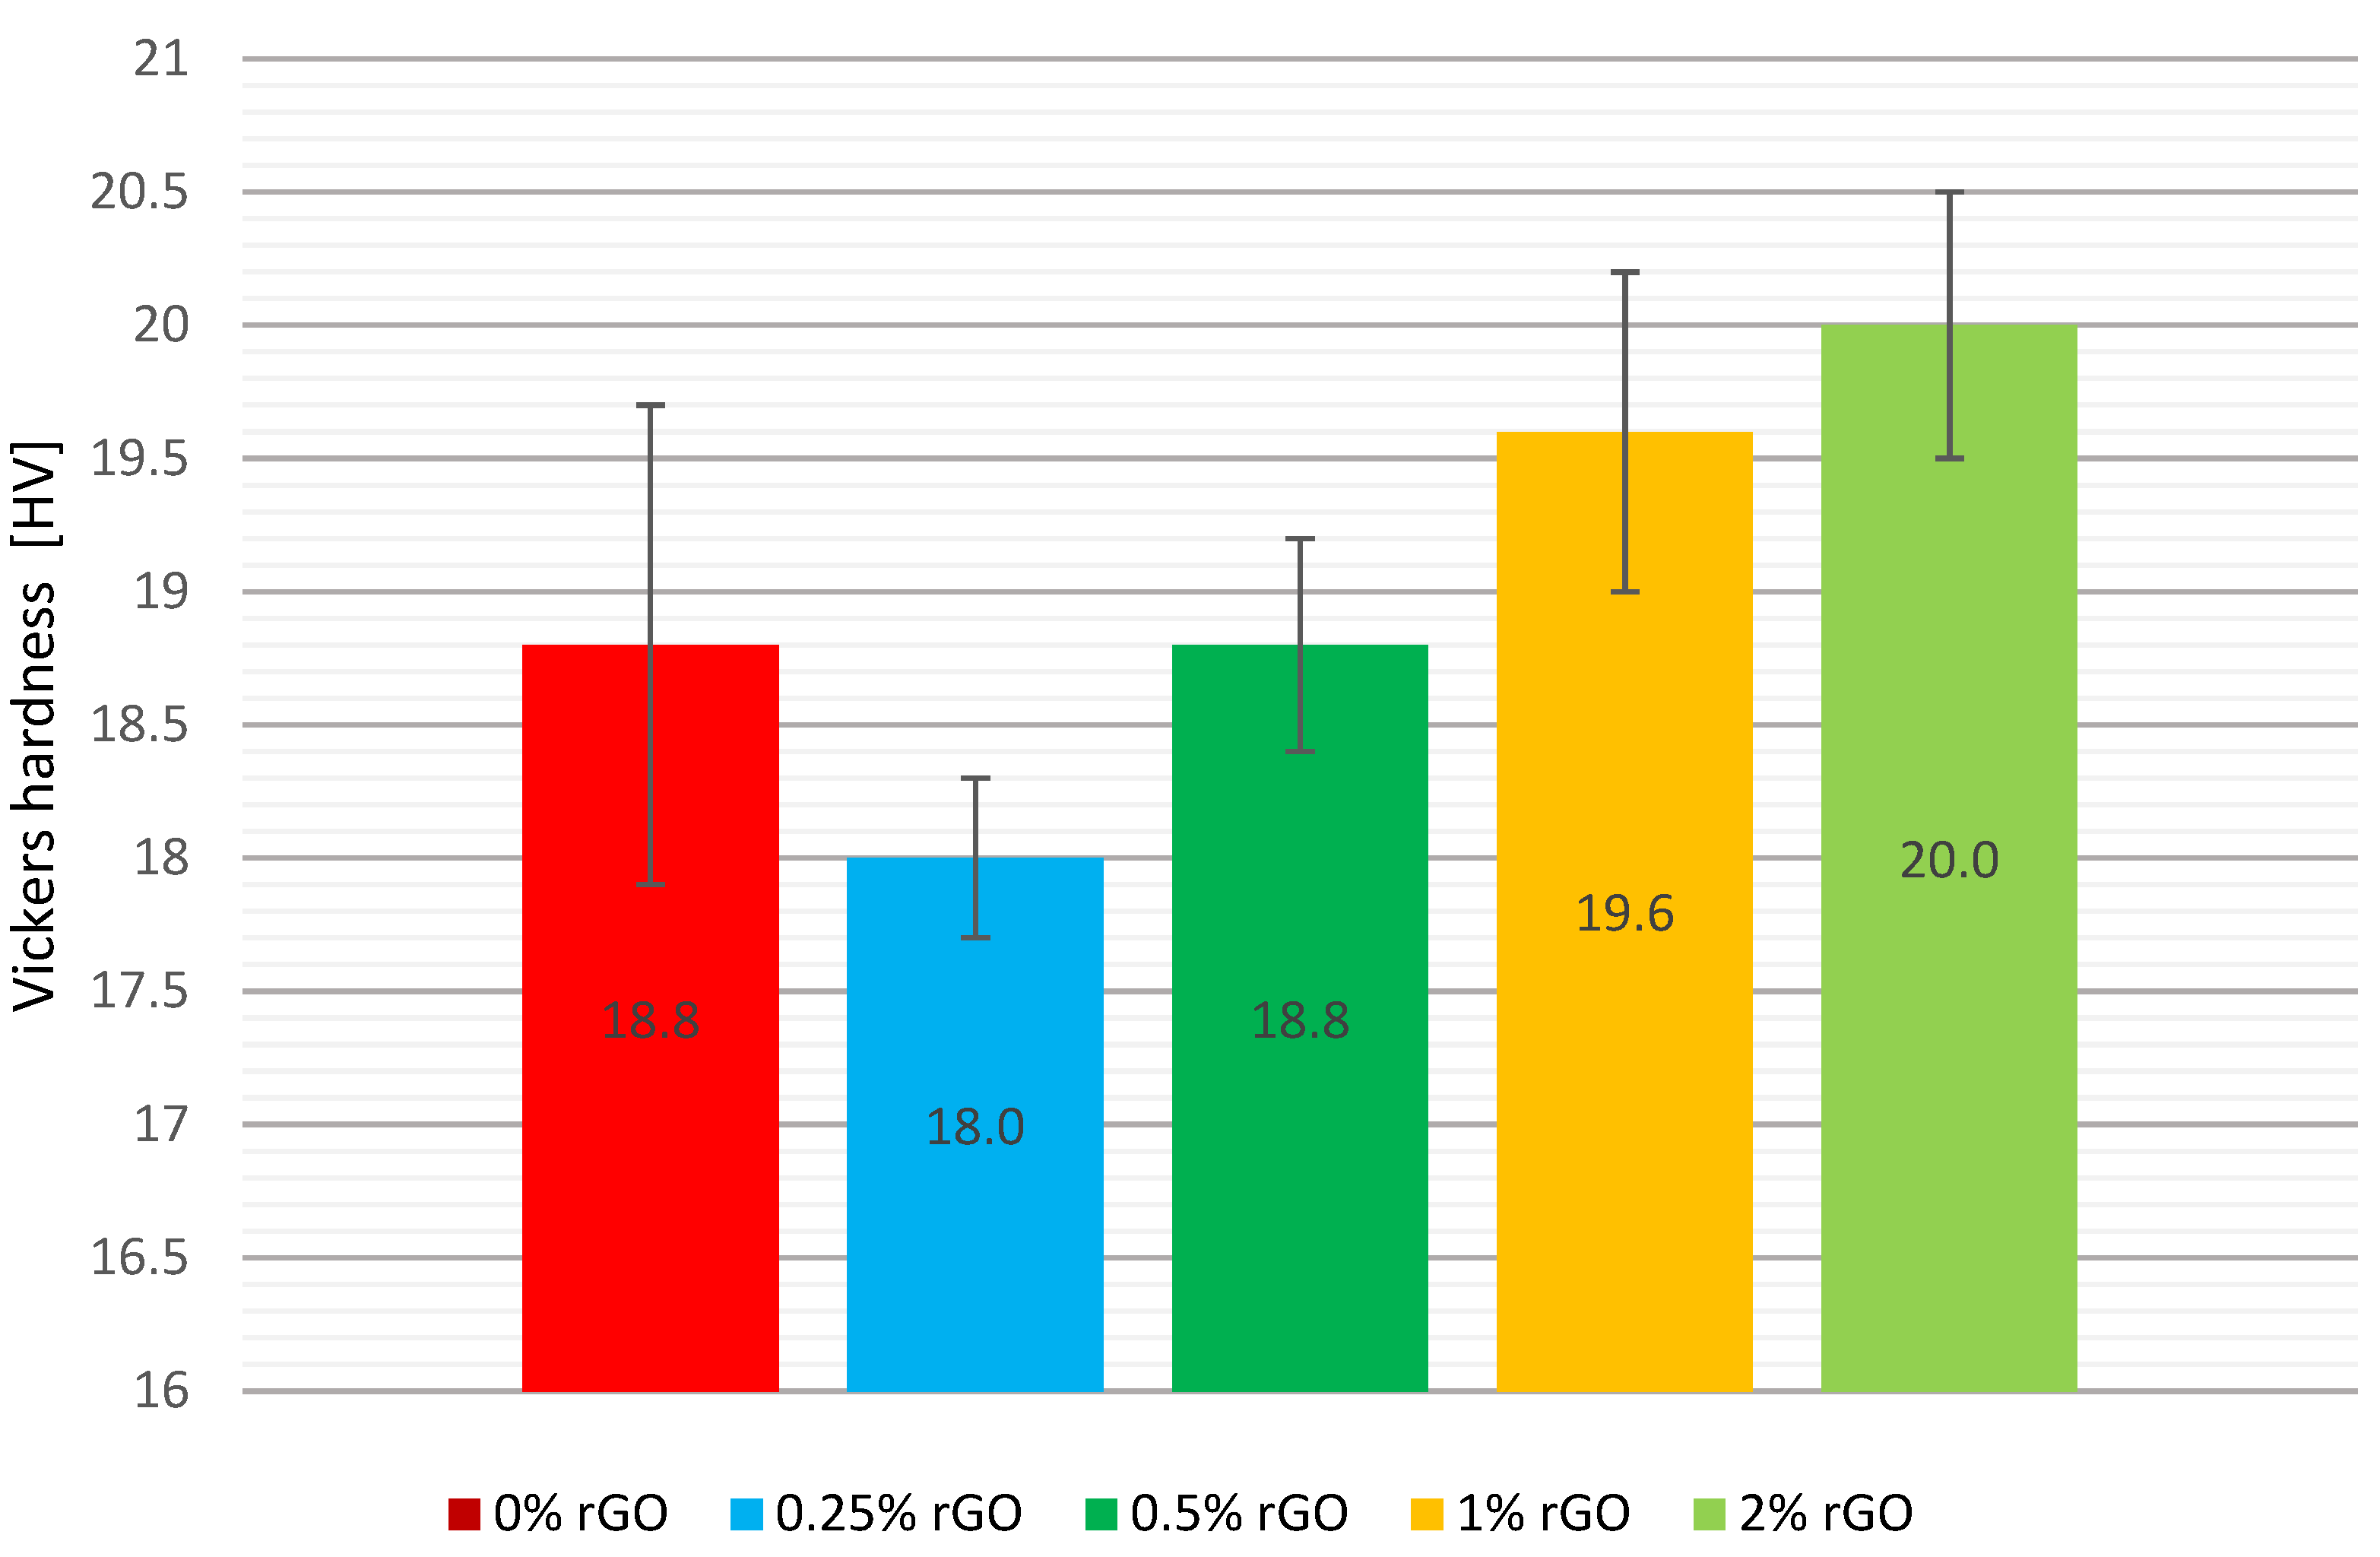
Vickers Hardness Test
A comparison of the mean Vickers hardnesses, including the error bars, is shown graphically in Figure 8. The addition of flake graphene at 0.25% by weight decreased the hardness of the material by 4.3%, while an increase in hardness of 4.3% and 6.4% by weight was seen with an addition of 1% and 2% by weight, respectively. No change in the hardness of the composite was observed with the addition of flake graphene of 0.5% by weight.
However, the greatest dispersion of the tested values was in the pure resin specimens. The standard deviation was 1.8 HV, while for the series with the smallest addition of rGO, the standard deviation values were three times lower at 0.6 HV. This was also the lowest value of variation in the results among all the series tested. For the other test groups, the deviation ranged from 0.8 to 1.2 HV. The standard deviation of the mean hardness values of the specimens for the test groups is characterised by a dispersion of no more than 10% of the mean values of the respective series.
Heat Capacity Test
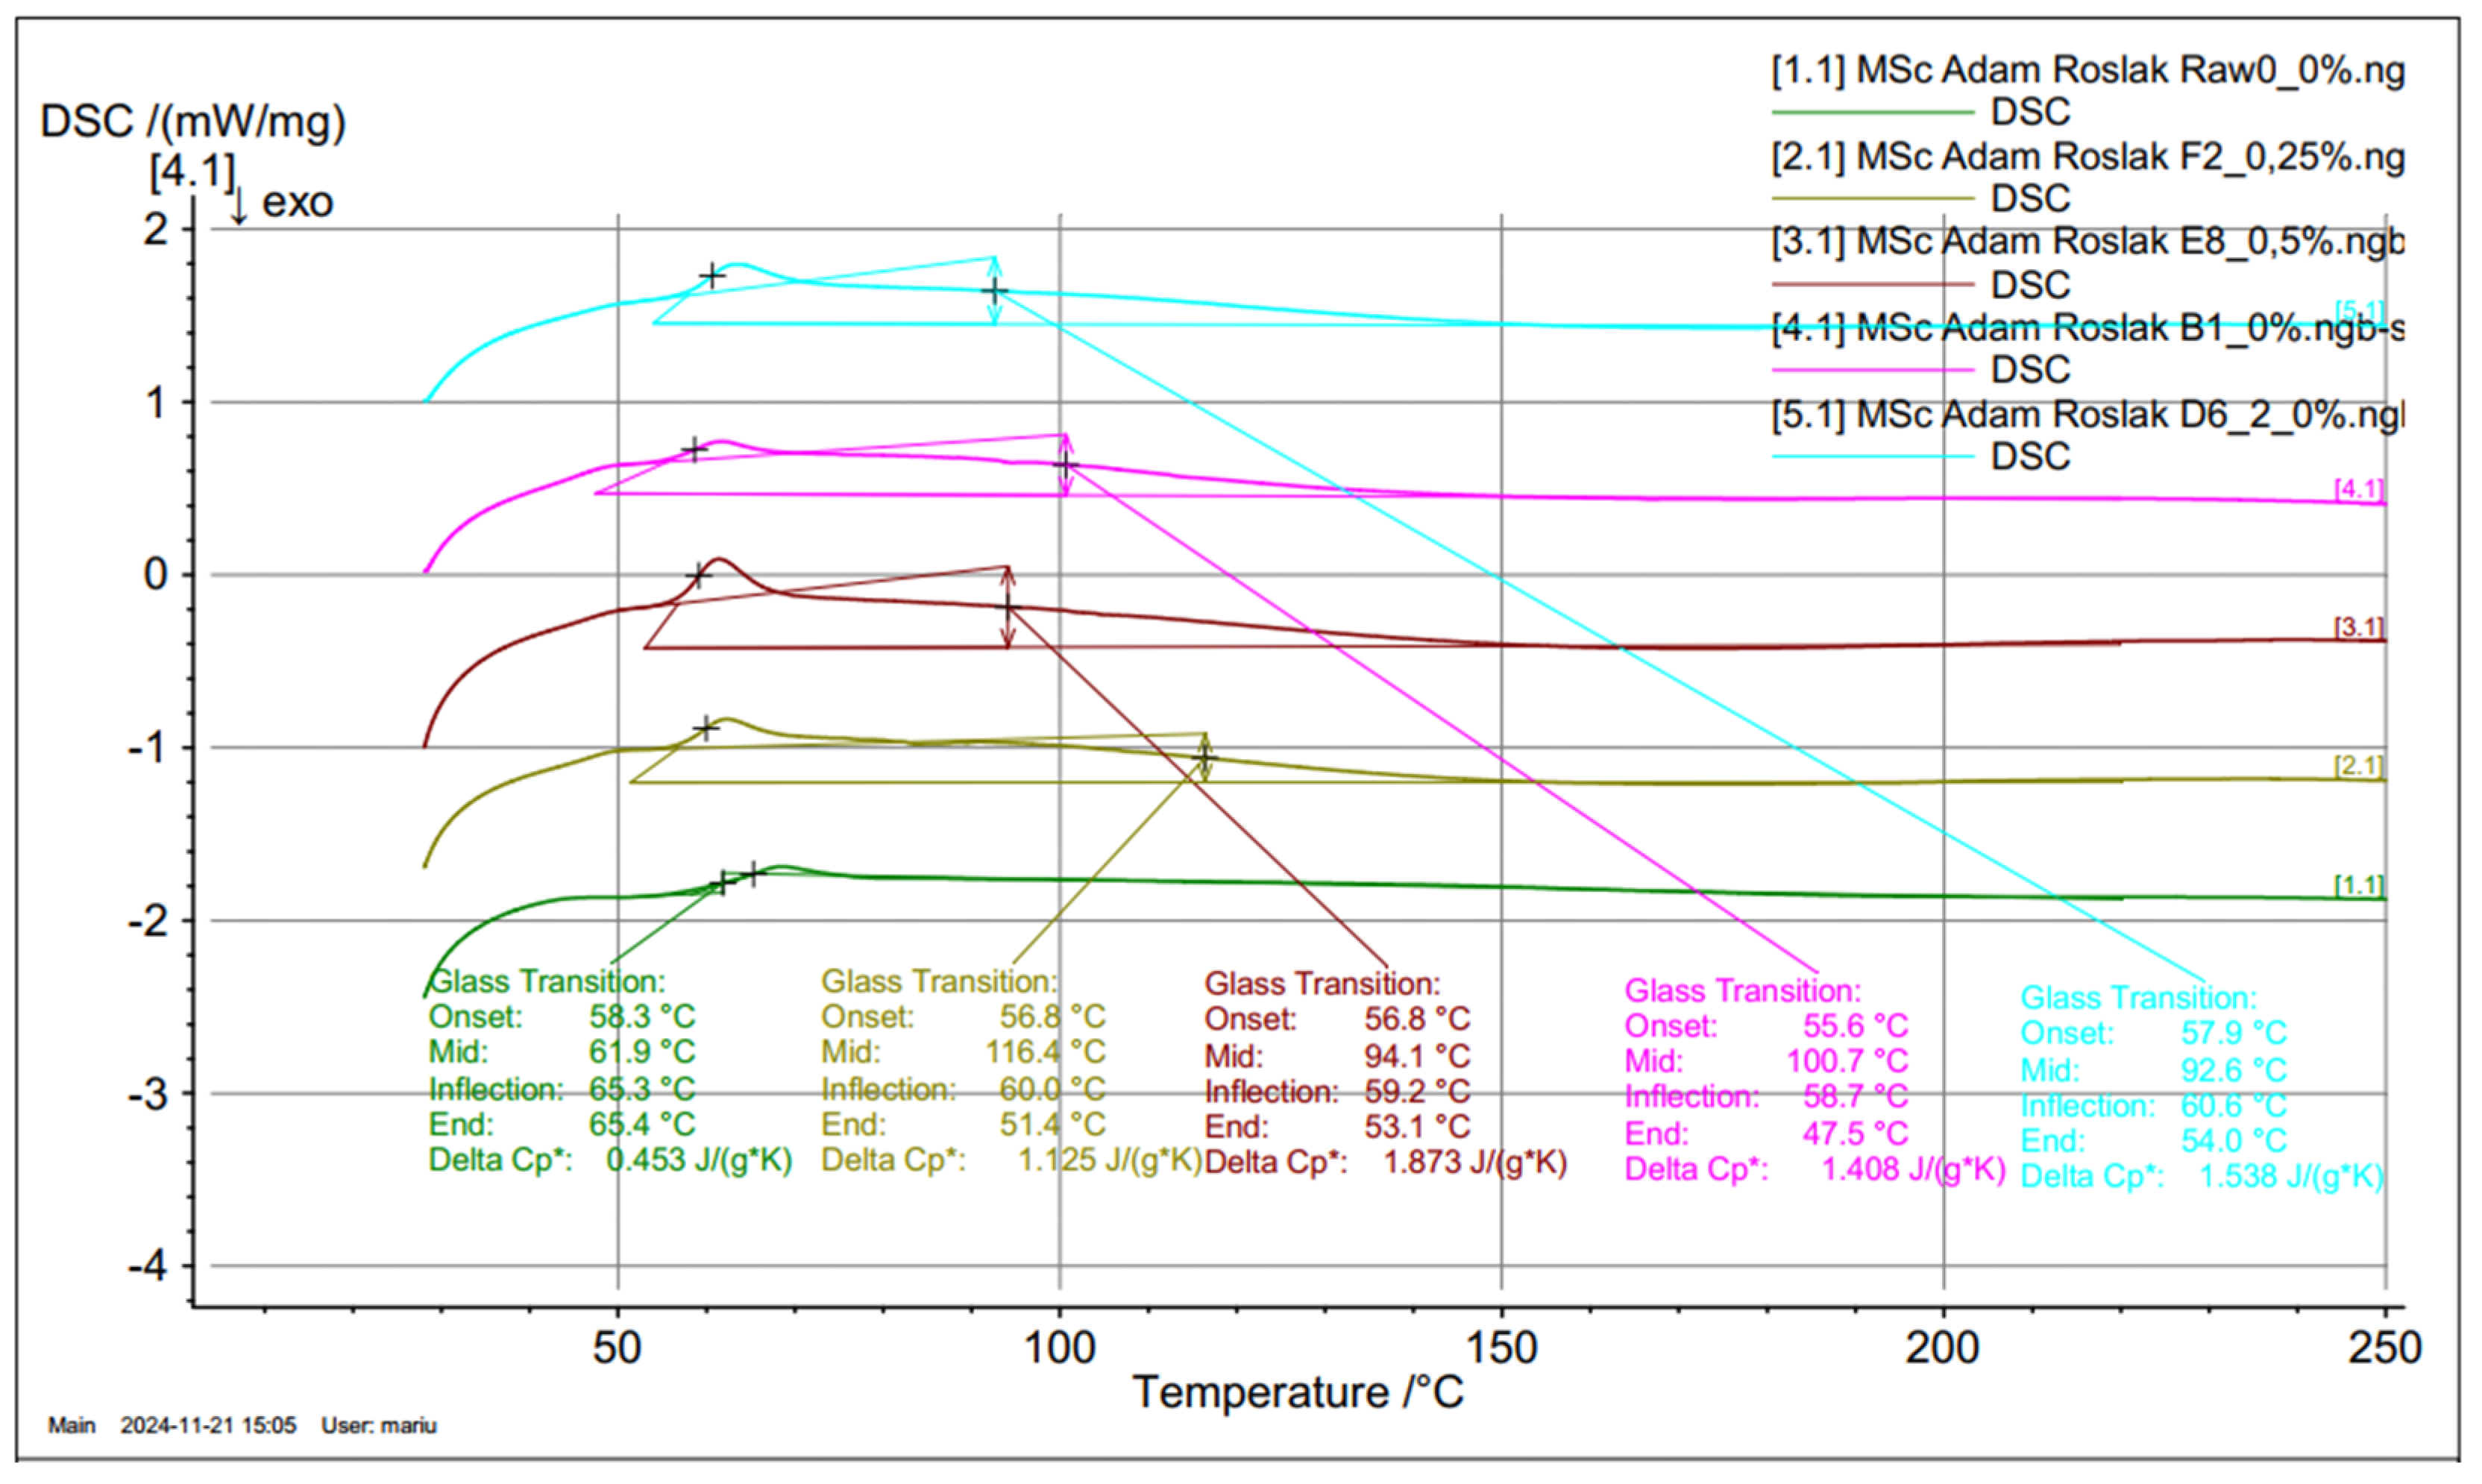
The DSC curve (Figure 9, curve 9.1) for the pure epoxy resin shows that two energy phenomena are obtained, the first within 62 ÷ 65°C, responsible for the glass transition/softening of the material, and the second within 333.7°C, responsible for melting/combustion. A similar DSC curve was observed for the rGO resin; however, the Tg temperature was shifted to lower values by about 5°C. The test material, as an amorphous polymer, shows a glass transition at 65.4°C for the reference 0.0 wt% rGO sample with a specific heat capacity of 0.453 J/(g*K). Similarly, the Tg for 0.25, 0.5, 1.0, and 2.0 wt% is 51.4°C, 53.1°C, 47.5°C, and 54.0°C, followed by an exothermic effect (peak temperature of 65.3°C for pure epoxy resin), due to the final curing of the resin. The effect of increasing the glass transition temperature Ts=116.4°C for 0.25 %wt. The rGO concentration in the epoxy resin, relative to other concentrations, can be interpreted as an increase in the degree of crystallinity of the material and an improvement in the ordering state of the crystals. A comparative analysis of ΔH for the reference sample and with rGO addition finds that a clear glass transition effect of the material is obtained, but for 0.25 wt% rGO, the most significant shift of Ts to higher temperatures. This may indicate a direct effect of rGO on the occurrence of the glass transition; however, at 0.25 wt%, we obtain chemical linkages that affect the crystallization of the material.
Figure 9.
Differential scanning calorimetry comparison charts.
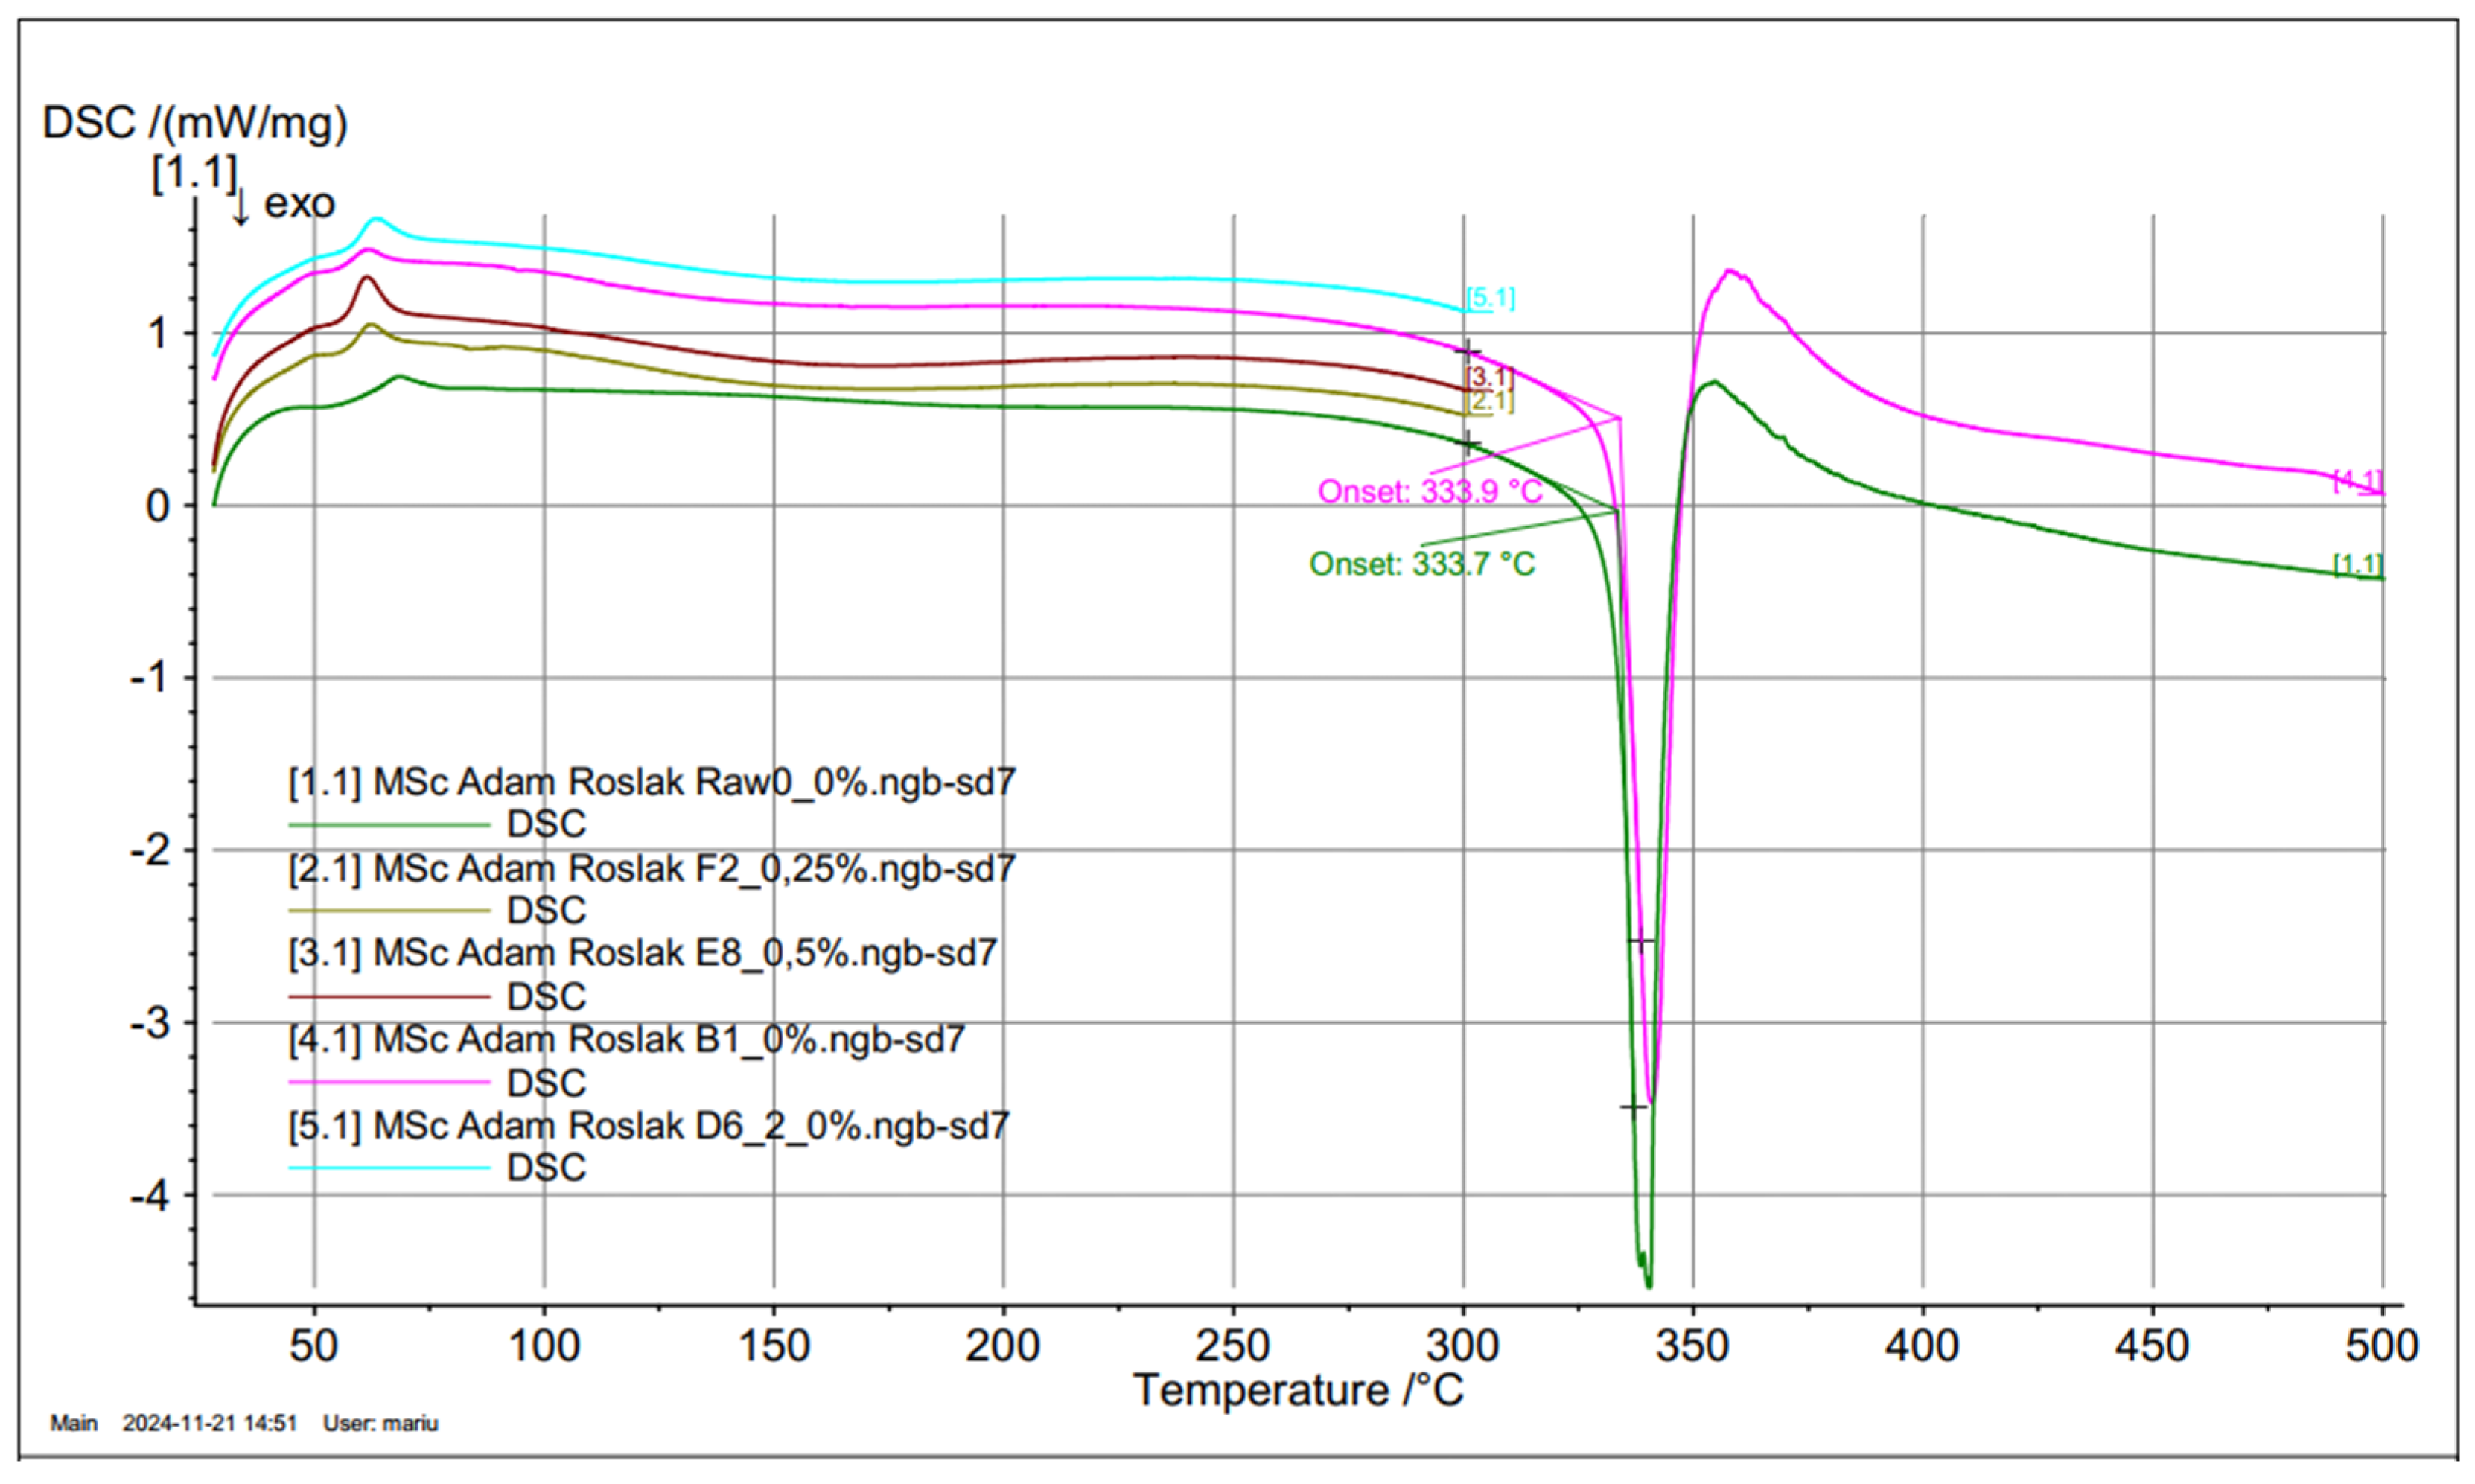
Figure 10.
Comparison diagrams of differential calorimetry with the glass transition observed.
Molecular Simulation
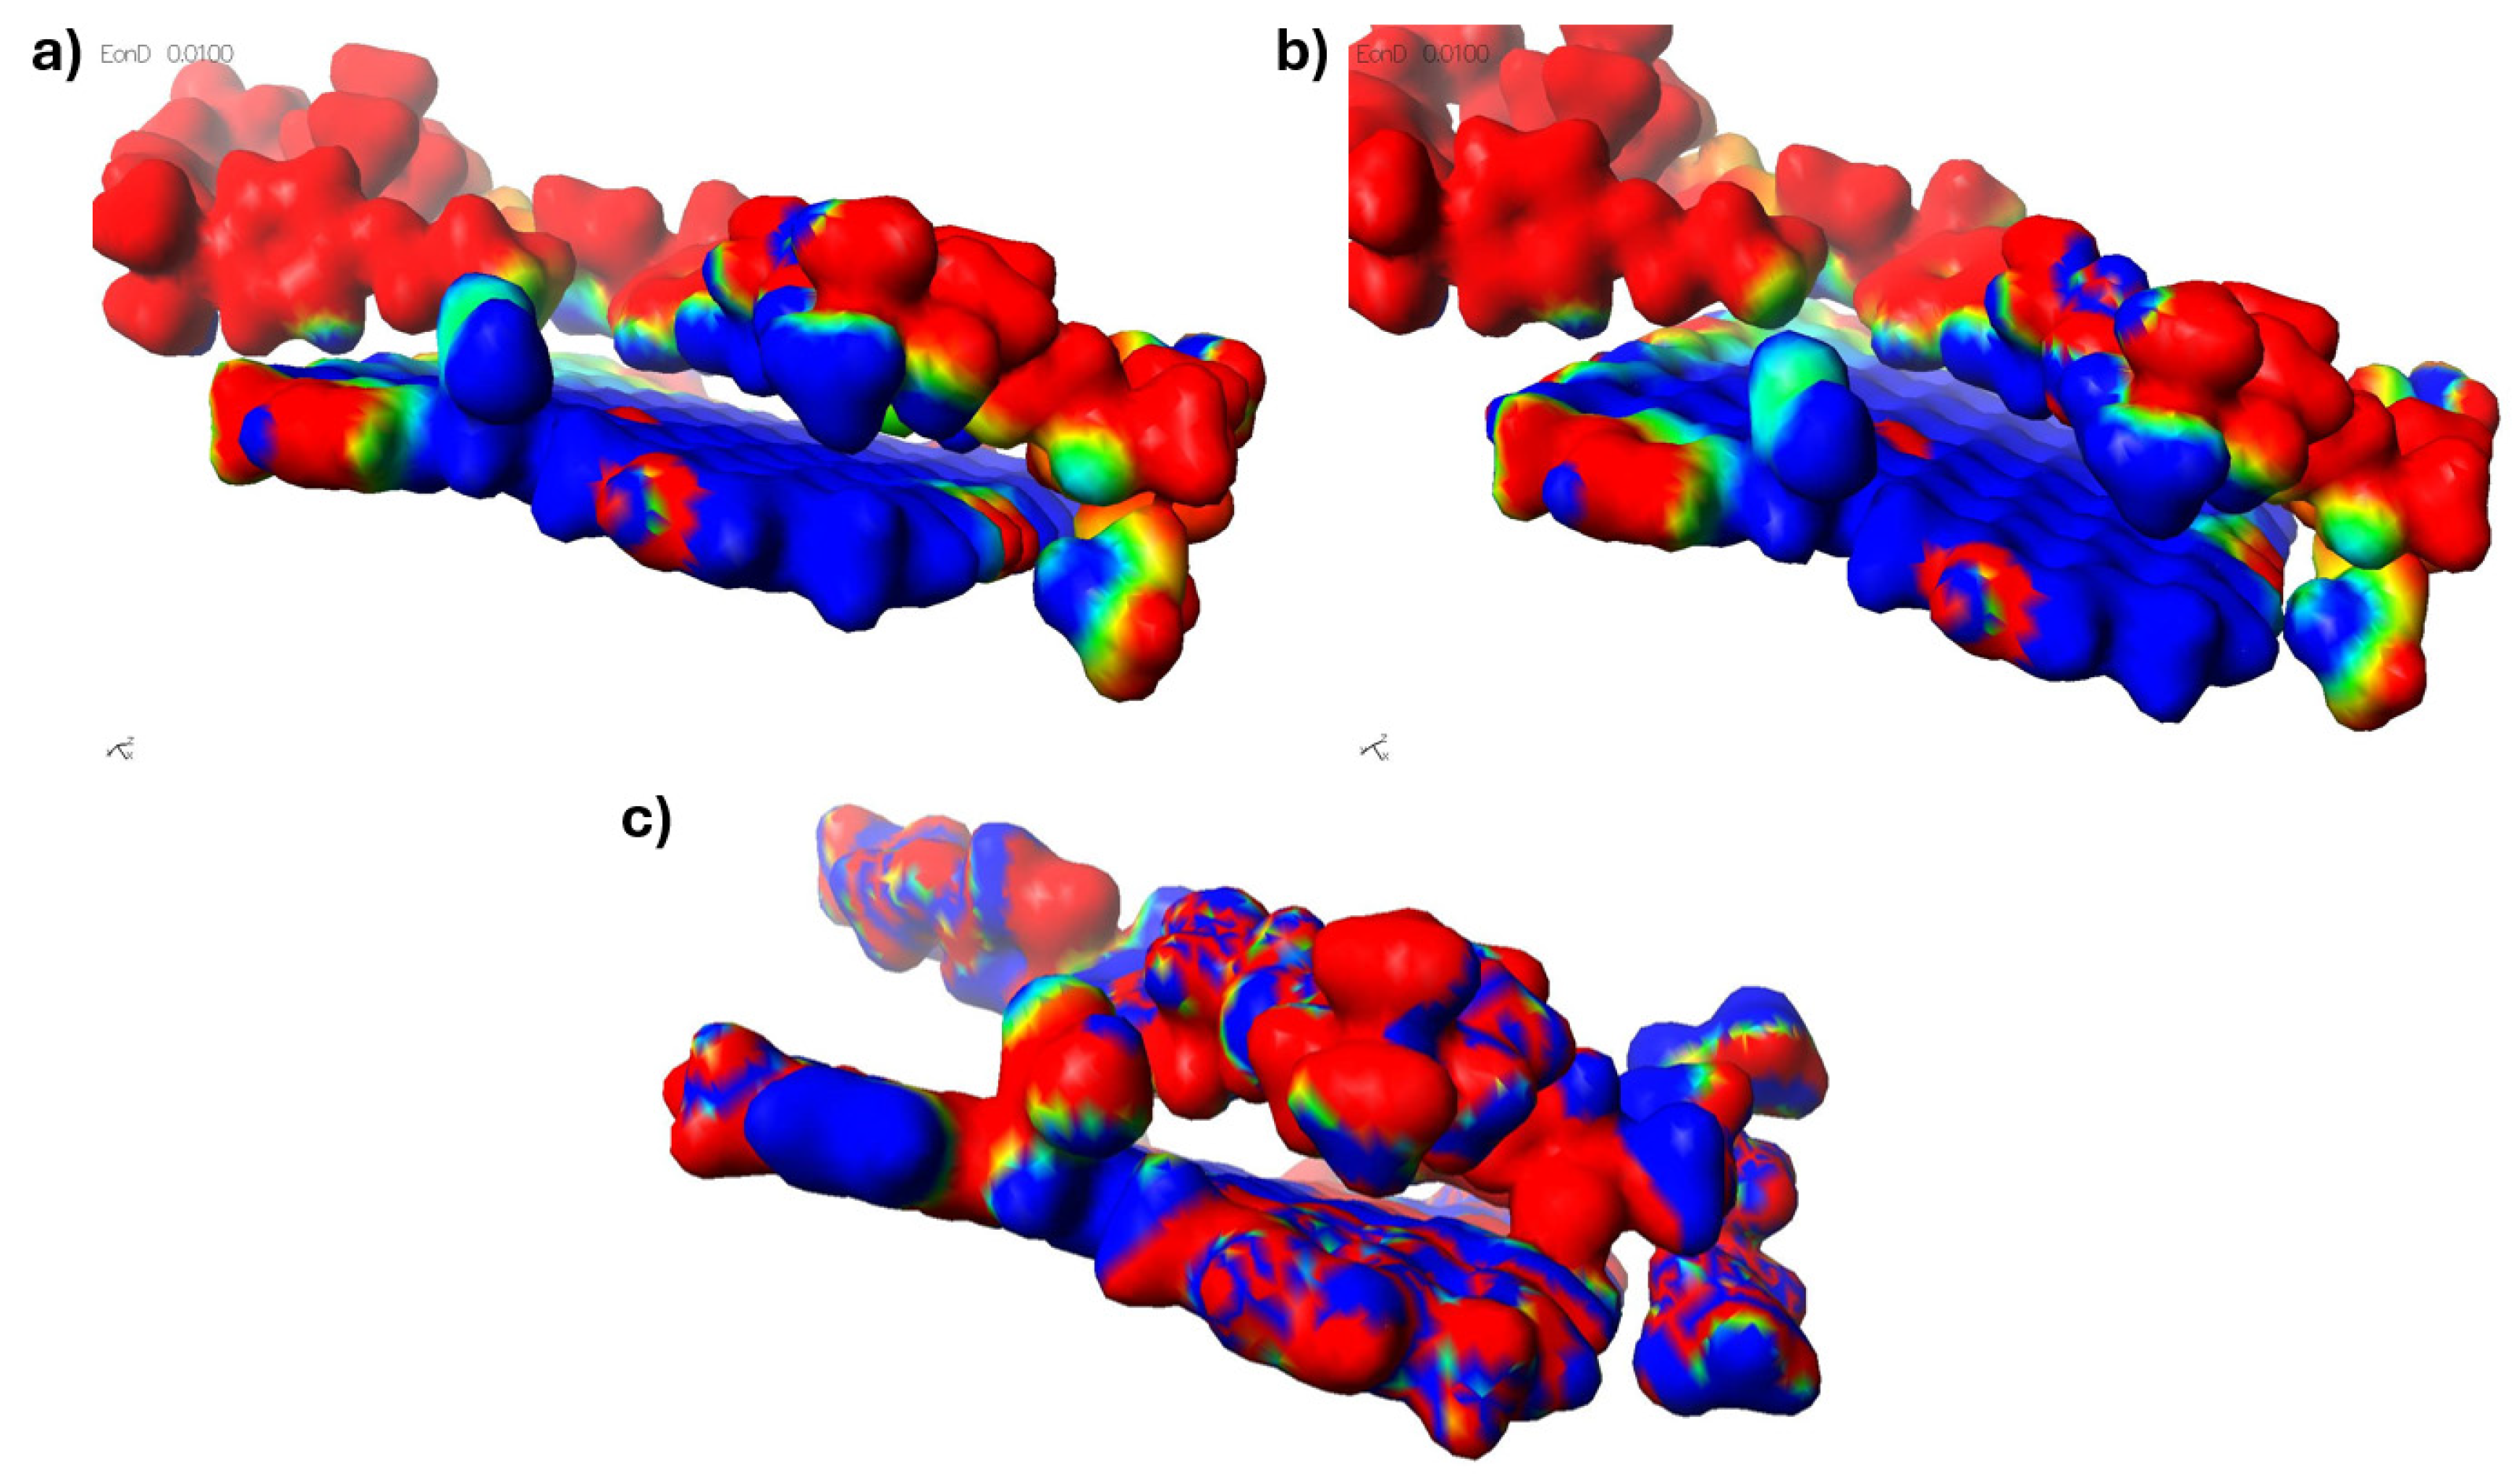
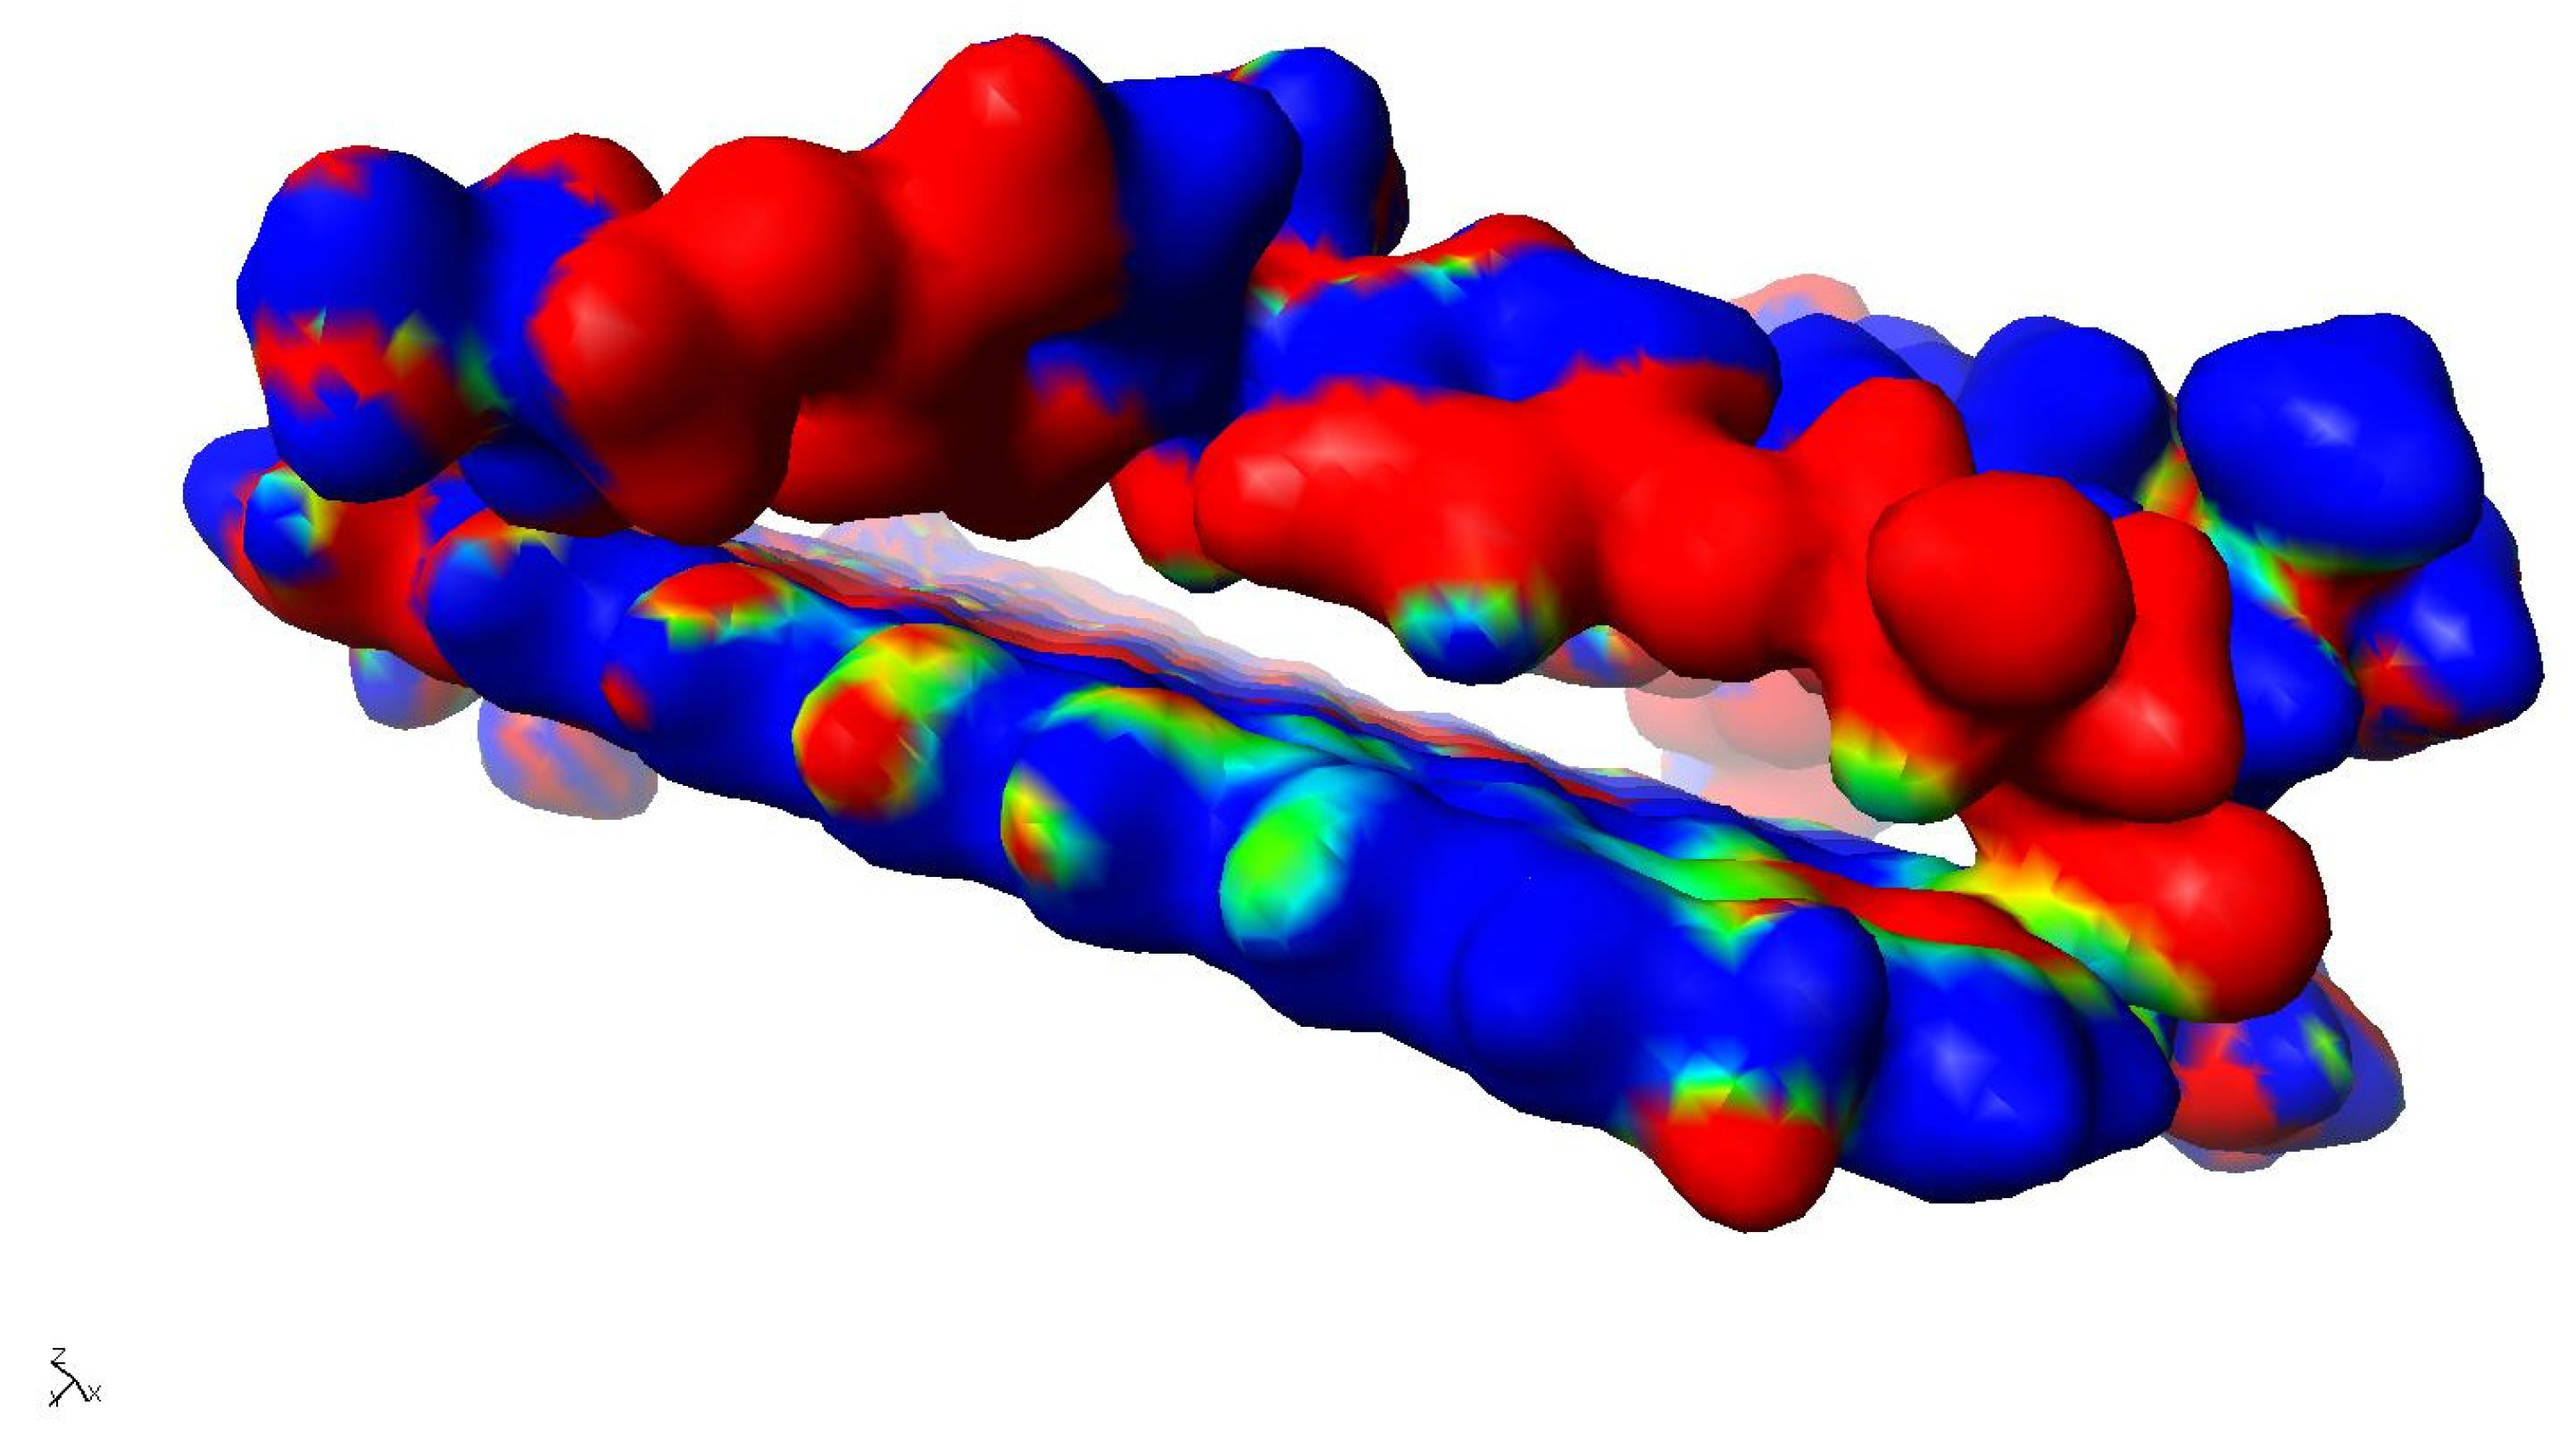
The addition of reduced graphene oxide to the epoxy resin in the range of 0.5-2% by weight results in a significant increase in hardness as well as a reduction in flexural strength and deflection, with a simultaneous decrease in its elasticity. The exception is the addition at 0.25% by weight, where the material shows lower hardness, flexural strength, and deflection, with an increase in plasticity compared to the unmodified resin, whose cross-linked molecules are shown in Figure 11. The increase in plasticity when rGO is added in the range of 0.25% by weight may be due to its so-called ‘hinge’ effect of reducing dipole-dipole interactions between the resin macromolecules by introducing graphene between them. Models of reduced graphene oxide with cross-linked resin are shown in Figure 12.
Altogether, a reduction in the areas of physical interactions is then observed. In addition, in this case, we can observe the phenomenon of dispersion of the fracture energy across the graphene surface. This is due to the fact that the delocalised bond energy in graphene is 4.93 eV [18], whereas the C-C energy in epoxy resin chains is C-C 3.6 eV, and for aromatic rings, C-C is 3.69 eV. This implies that crack initiation at the molecular level will occur with respect to the polymer chains of the epoxy resin. Once the crack propagates in the graphene region, then a change in its propagation direction is possible, according to the spatial orientation of the graphene. As the binding energy in graphene is more than 35% higher, the crack is more likely to be arrested or extinguished on its surface.
Figure 11.
Models of a cross-linked epoxy resin molecule in contact with graphene as a potential internal component of pressure vessels for hydrogen storage in different areas: a) structural model, b) & c) structural models with the valence shells of the atoms indicated.
Figure 11.
Models of a cross-linked epoxy resin molecule in contact with graphene as a potential internal component of pressure vessels for hydrogen storage in different areas: a) structural model, b) & c) structural models with the valence shells of the atoms indicated.
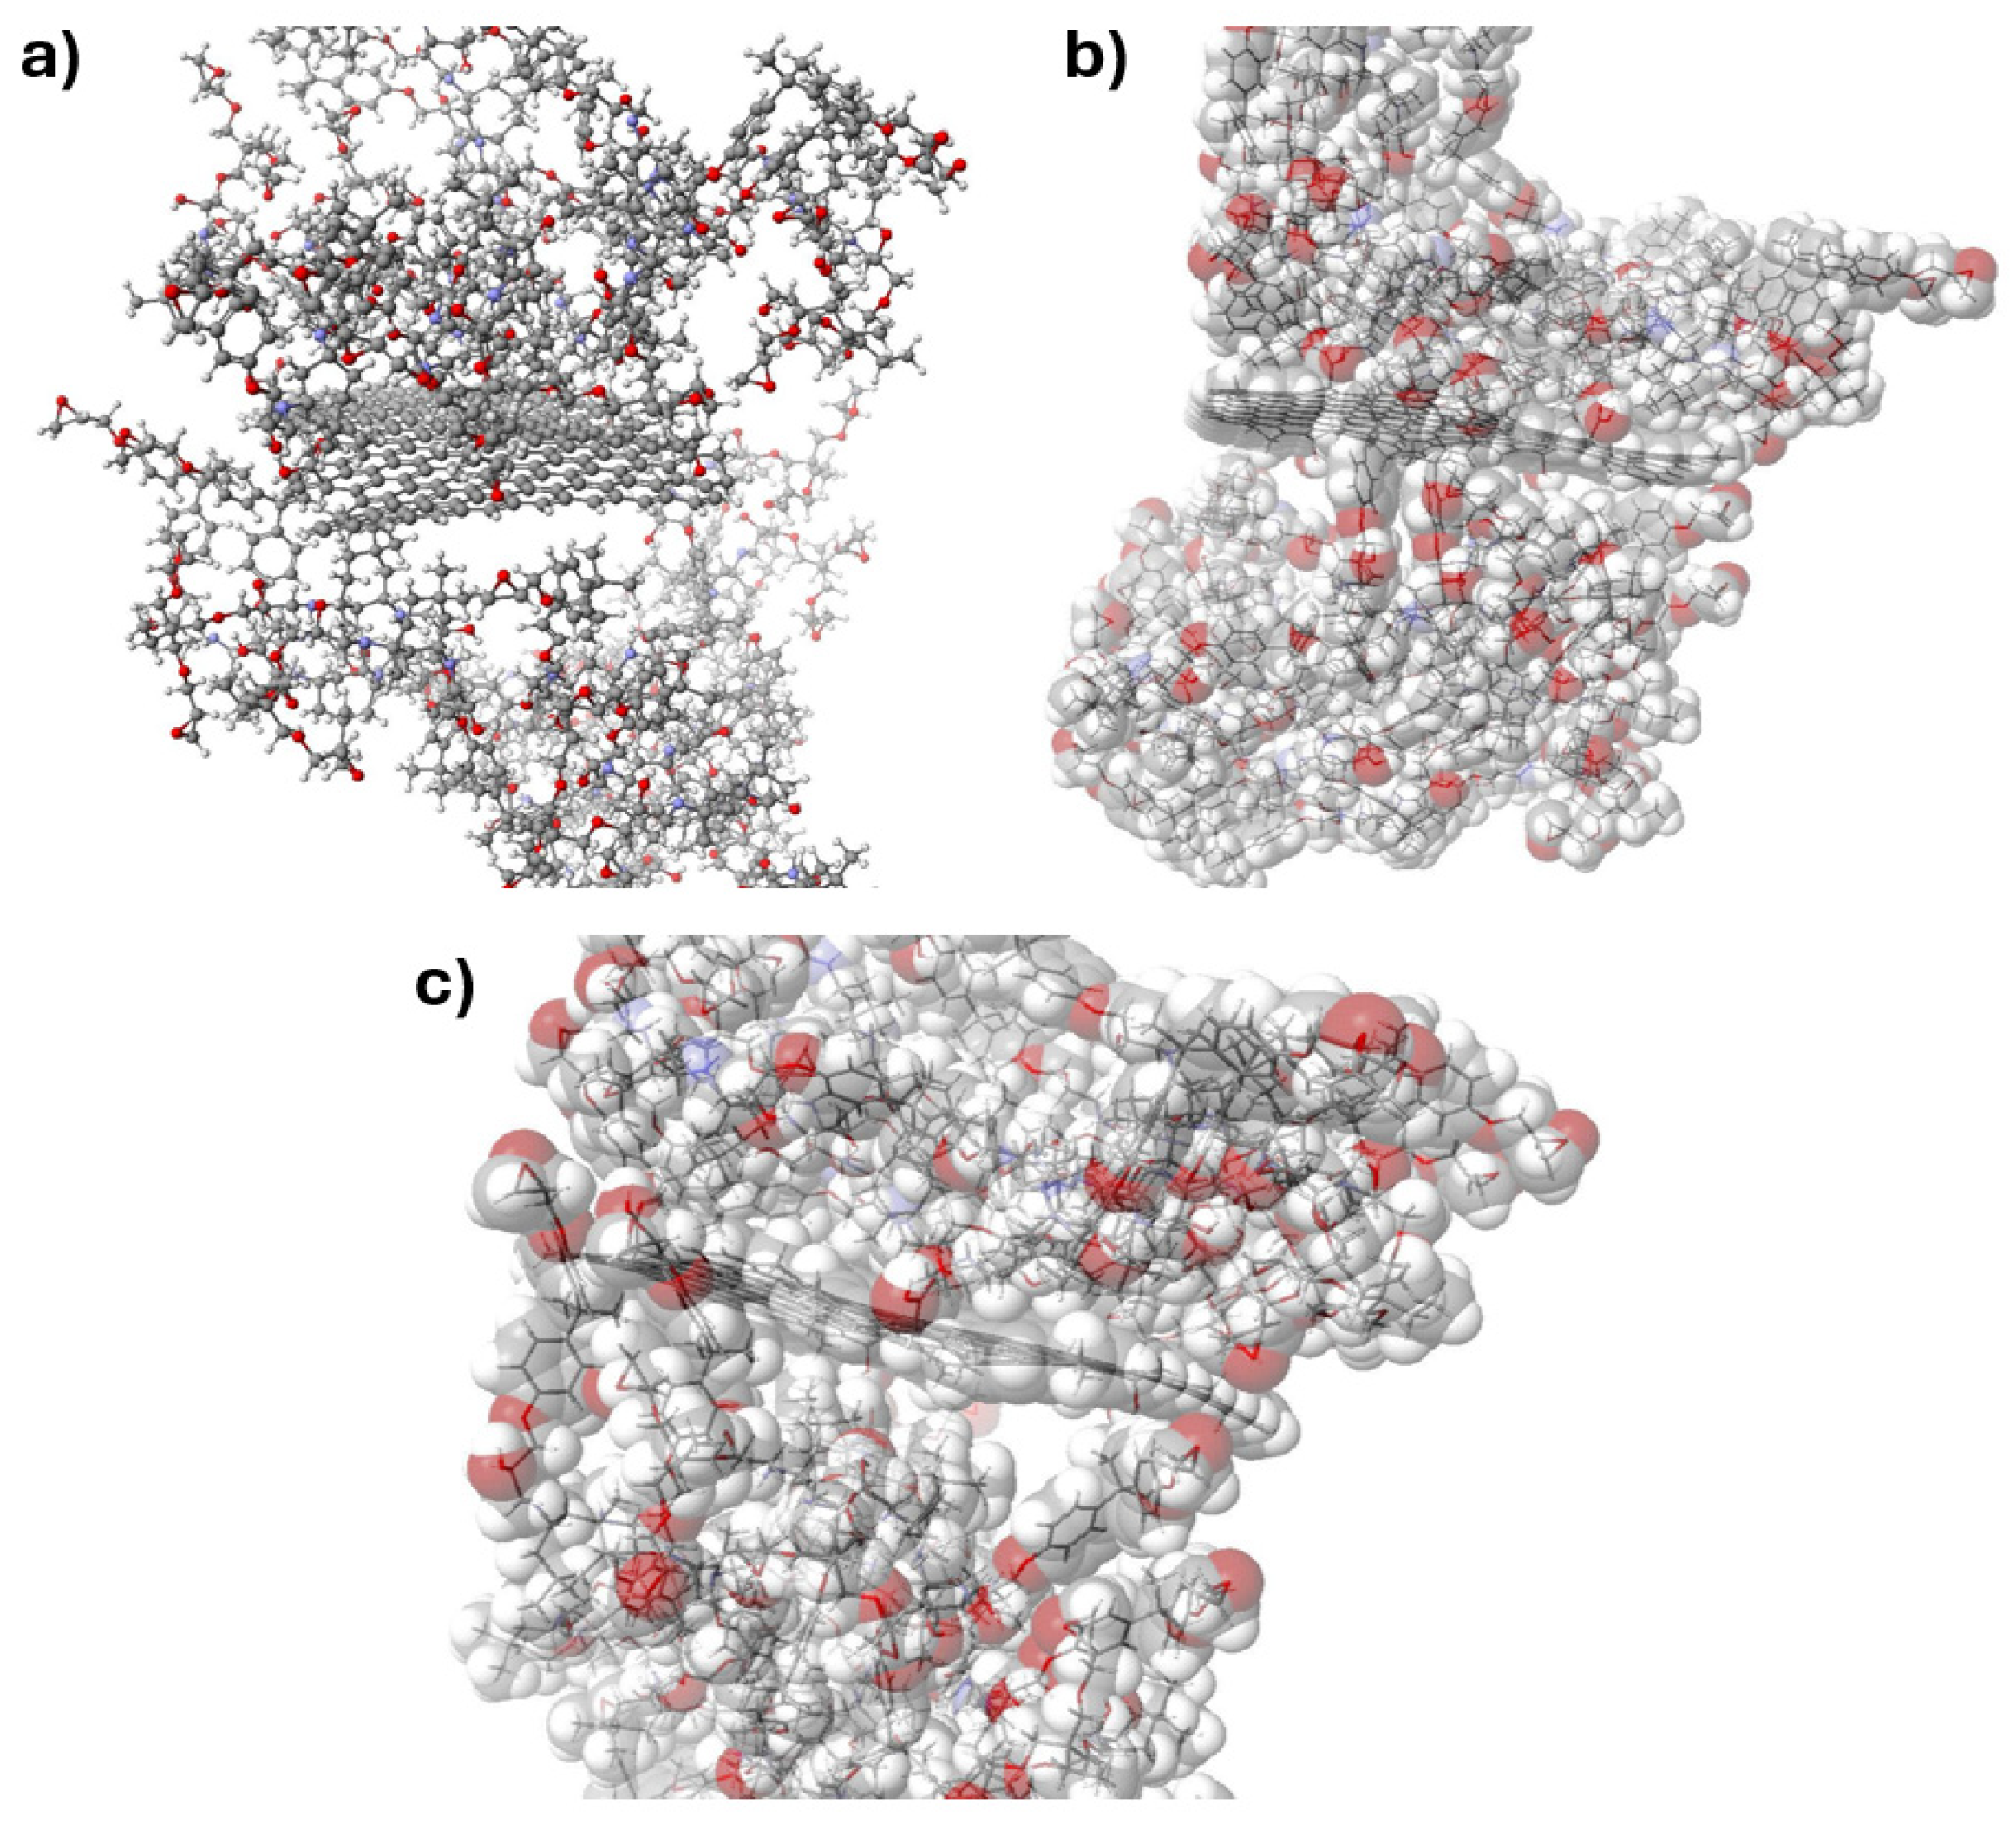
Figure 12.
Models of interfacial interactions between cross-linked epoxy resin and graphene with residual oxygen groups.
Figure 12.
Models of interfacial interactions between cross-linked epoxy resin and graphene with residual oxygen groups.
The synergistic effect in this case manifests itself in the fact that the crack can be inhibited earlier before it interacts with the graphene surface. This is due to the fact that there is a higher density of macromolecules in the graphene surface region, which are additionally mutually polarised and polarised with the rGO itself. This fact results in a significant increase in the mechanical properties of the epoxy resin as a function of the rGO content. Figure 13 shows the interfacial interactions of the cross-linked epoxy resin molecule with cross-linked reduced graphene oxide.
Figure 13.
Model of interfacial interactions between cross-linked epoxy resin and cross-linked graphene with residual oxygen groups.
Figure 13.
Model of interfacial interactions between cross-linked epoxy resin and cross-linked graphene with residual oxygen groups.
On the other hand, an increase in the rGO content above 1% by weight results in a strengthening of the composite, as the generation of areas with increased density is observed due to the accumulation of electrostatic interactions between the resin chains and the reduced graphene oxide surface. The presence of remaining hydroxyl (-OH) and/or carboxyl (-COOH) groups results in an asymmetrical distribution of electrons on the graphene surface. Polarisation of its surface is then observed, which can also orient macromolecules containing atoms such as chlorine or nitrogen with strong electronegativity. These areas show similar properties to metal alloys, where the presence of hardening phases is observed.
4. Conclusions
The effect of reduced flake graphene on the material’s hardness, plasticity and elasticity was determined through the study. Its flexural and compressive strengths were also determined. The addition of rGO in amounts of more than 1% by weight and above significantly increases the hardness and Young’s modulus of the composite. Its introduction, while reducing the amount of hardener, results in an increase in hardness and brittleness, which is noticeable from the addition of 0.5% by weight of graphene. The composites become more rigid and brittle, as indicated by a reduction in the deflection in each tested group.
The exception is the addition at a level of 0.25% by weight, where the material shows lower hardness values, as well as flexural strength and deflection, with high plasticity compared to the unmodified resin. Furthermore, it is also possible to displace macromolecules relative to the graphene surface without disturbing their chemical structure. These motions are on the nanometre level. Thus, a macroscopic increase in the plasticity of the composite is observed, which requires further research to fully confirm the assumed mechanism. This is important from the point of view of the plastic flow of the inner inserts of hydrogen tanks, where they deform under pressure and reach full contact with the walls of a traditional tank, e.g., steel. This fact can be used to produce elements that decrease the permeability of hydrogen in pressure vessels.
References
- Lamb, W. F., Wiedmann, T., Pongratz, J., Andrew, R., Crippa, M., Olivier, J. G. J., Wiedenhofer, D., Mattioli, G., Al Khourdajie, A., House, J., Pachauri, S., Figueroa, M., Saheb, Y., Slade, R., Hubacek, K., Sun, L., Ribeiro, S. K., Khennas, S., de la Rue du Can, S., … Minx. J. (2021). A review of trends and drivers of greenhouse gas emissions by sector from 1990 to 2018. Environmental Research Letters, 16(7), 073005.
- Albatayneh, A., Juaidi, A., Jaradat, M., Manzano-Agugliaro F. (2023). Future of Electric and Hydrogen Cars and Trucks: An Overview. Energies, 16(7), 3230.
- Low, J. M., Haszeldine, R.S., Harrison, G.P. (2023). The hidden cost of road maintenance due to the increased weight of battery and hydrogen trucks and buses—a perspective. Clean Techn Environ Policy, 25, 757–770.
- Boretti, A. (2024). The perspective of hybrid electric hydrogen propulsion systems. International Journal of Hydrogen Energy, 50 part B, 857-868.
- Becherif, M., Ramadan, H. S., Cabaret, K., Picard, F., Simoncini, N., Bethoux, O. (2015). Hydrogen Energy Storage: New Techno-Economic Emergence Solution Analysis. Energy Procedia, 74, 371–380.
- Toyota Europe Newsroom. (2024 June 6). Toyota Mirai breaks world record for distance driven with one fill of hydrogen. Available online: https://newsroom.toyota.eu/toyota-mirai-breaks-world-record-for-distance-driven-with-one-fill-of-hydrogen/.
- AlZohbi, G., Almoaikel, A., AlShuhail, L. (2023). An overview on the technologies used to store hydrogen. Energy Reports, 9(11), 28-34.
- Li, H., Cao, X., Liu, Y., Shao, Y., Nan, Z., Teng, L., Peng, W., Bian, J. (2022). Safety of hydrogen storage and transportation: An overview on mechanisms, techniques, and challenges. Energy Reports, 8, 6258-6269.
- Polski Komitet Normalizacyjny. (2019). Plastics – Determination of flexural properties (PN-EN ISO 178:2019-06 – wersja angielska).
- Wydawnictwa Normalizacyjne. (1971). Próba statyczna ściskania metali. (PN-57/H-04320).
- International Organization for Standarization. (2023). Metallic materials — Vickers hardness test (ISO 6507-1:2023).
- Advanced Graphene Products. (2024 June 5). rGO – zredukowany tlenek Grafenu | AGP. Available online: https://advancedgrapheneproducts.com/produkt/rgo-zredukowany-tlenek-grafenu-45um/.
- Amir Faiz, M. S., Che Azurahanim, C. A., Yazid, Y., Suriani, A. B., & Siti Nurul Ain, M. J. (2020). Preparation and characterization of graphene oxide from tea waste and it’s photocatalytic application of TiO2/graphene nanocomposite. Materials Research Express, 7(1), 015613.
- Reynosa-Martínez, A. C., Gómez-Chayres, E., Villaurrutia, R., López-Honorato, E. (2020). Controlled Reduction of Graphene Oxide Using Sulfuric Acid. Materials, 14(1), 59.
- Tan, S. M., Ambrosi, A., Chua, C. K., Pumera, M. (2014). Electron transfer properties of chemically reduced graphene materials with different oxygen contents. Journal of Materials Chemistry, 2(27), 10668-10675.
- Yap, P. L., Kabiri, S., Auyoong, Y. L., Tran, D. N. H., & Losic, D. (2019). Tuning the Multifunctional Surface Chemistry of Reduced Graphene Oxide via Combined Elemental Doping and Chemical Modifications. ACS Omega, 4(22), 19787–19798.
- Surekha, G., Venkata Krishnaiah, K., N Ravi, N., Padma Suvarna, R. (2020). FTIR, Raman and XRD analysis of graphene oxide films prepared by modified Hummers method. Journal of Physics: Conference Series, 1495, 012012.
- Brenner, D. W., Shenderova, O. A., Harrison, J. A., Stuart, S. J., Ni, B., Sinnott, S. B. (2002). A second-generation reactive empirical bond order (REBO) potential energy expression for hydrocarbons. Journal of Physics. Condensed Matter, 14(4), 783–802.
Figure 1.
Raman spectrum of reduced graphene oxide (rGO, Advanced Graphene Products SA, Zielona Góra, Poland) [12].
Figure 1.
Raman spectrum of reduced graphene oxide (rGO, Advanced Graphene Products SA, Zielona Góra, Poland) [12].
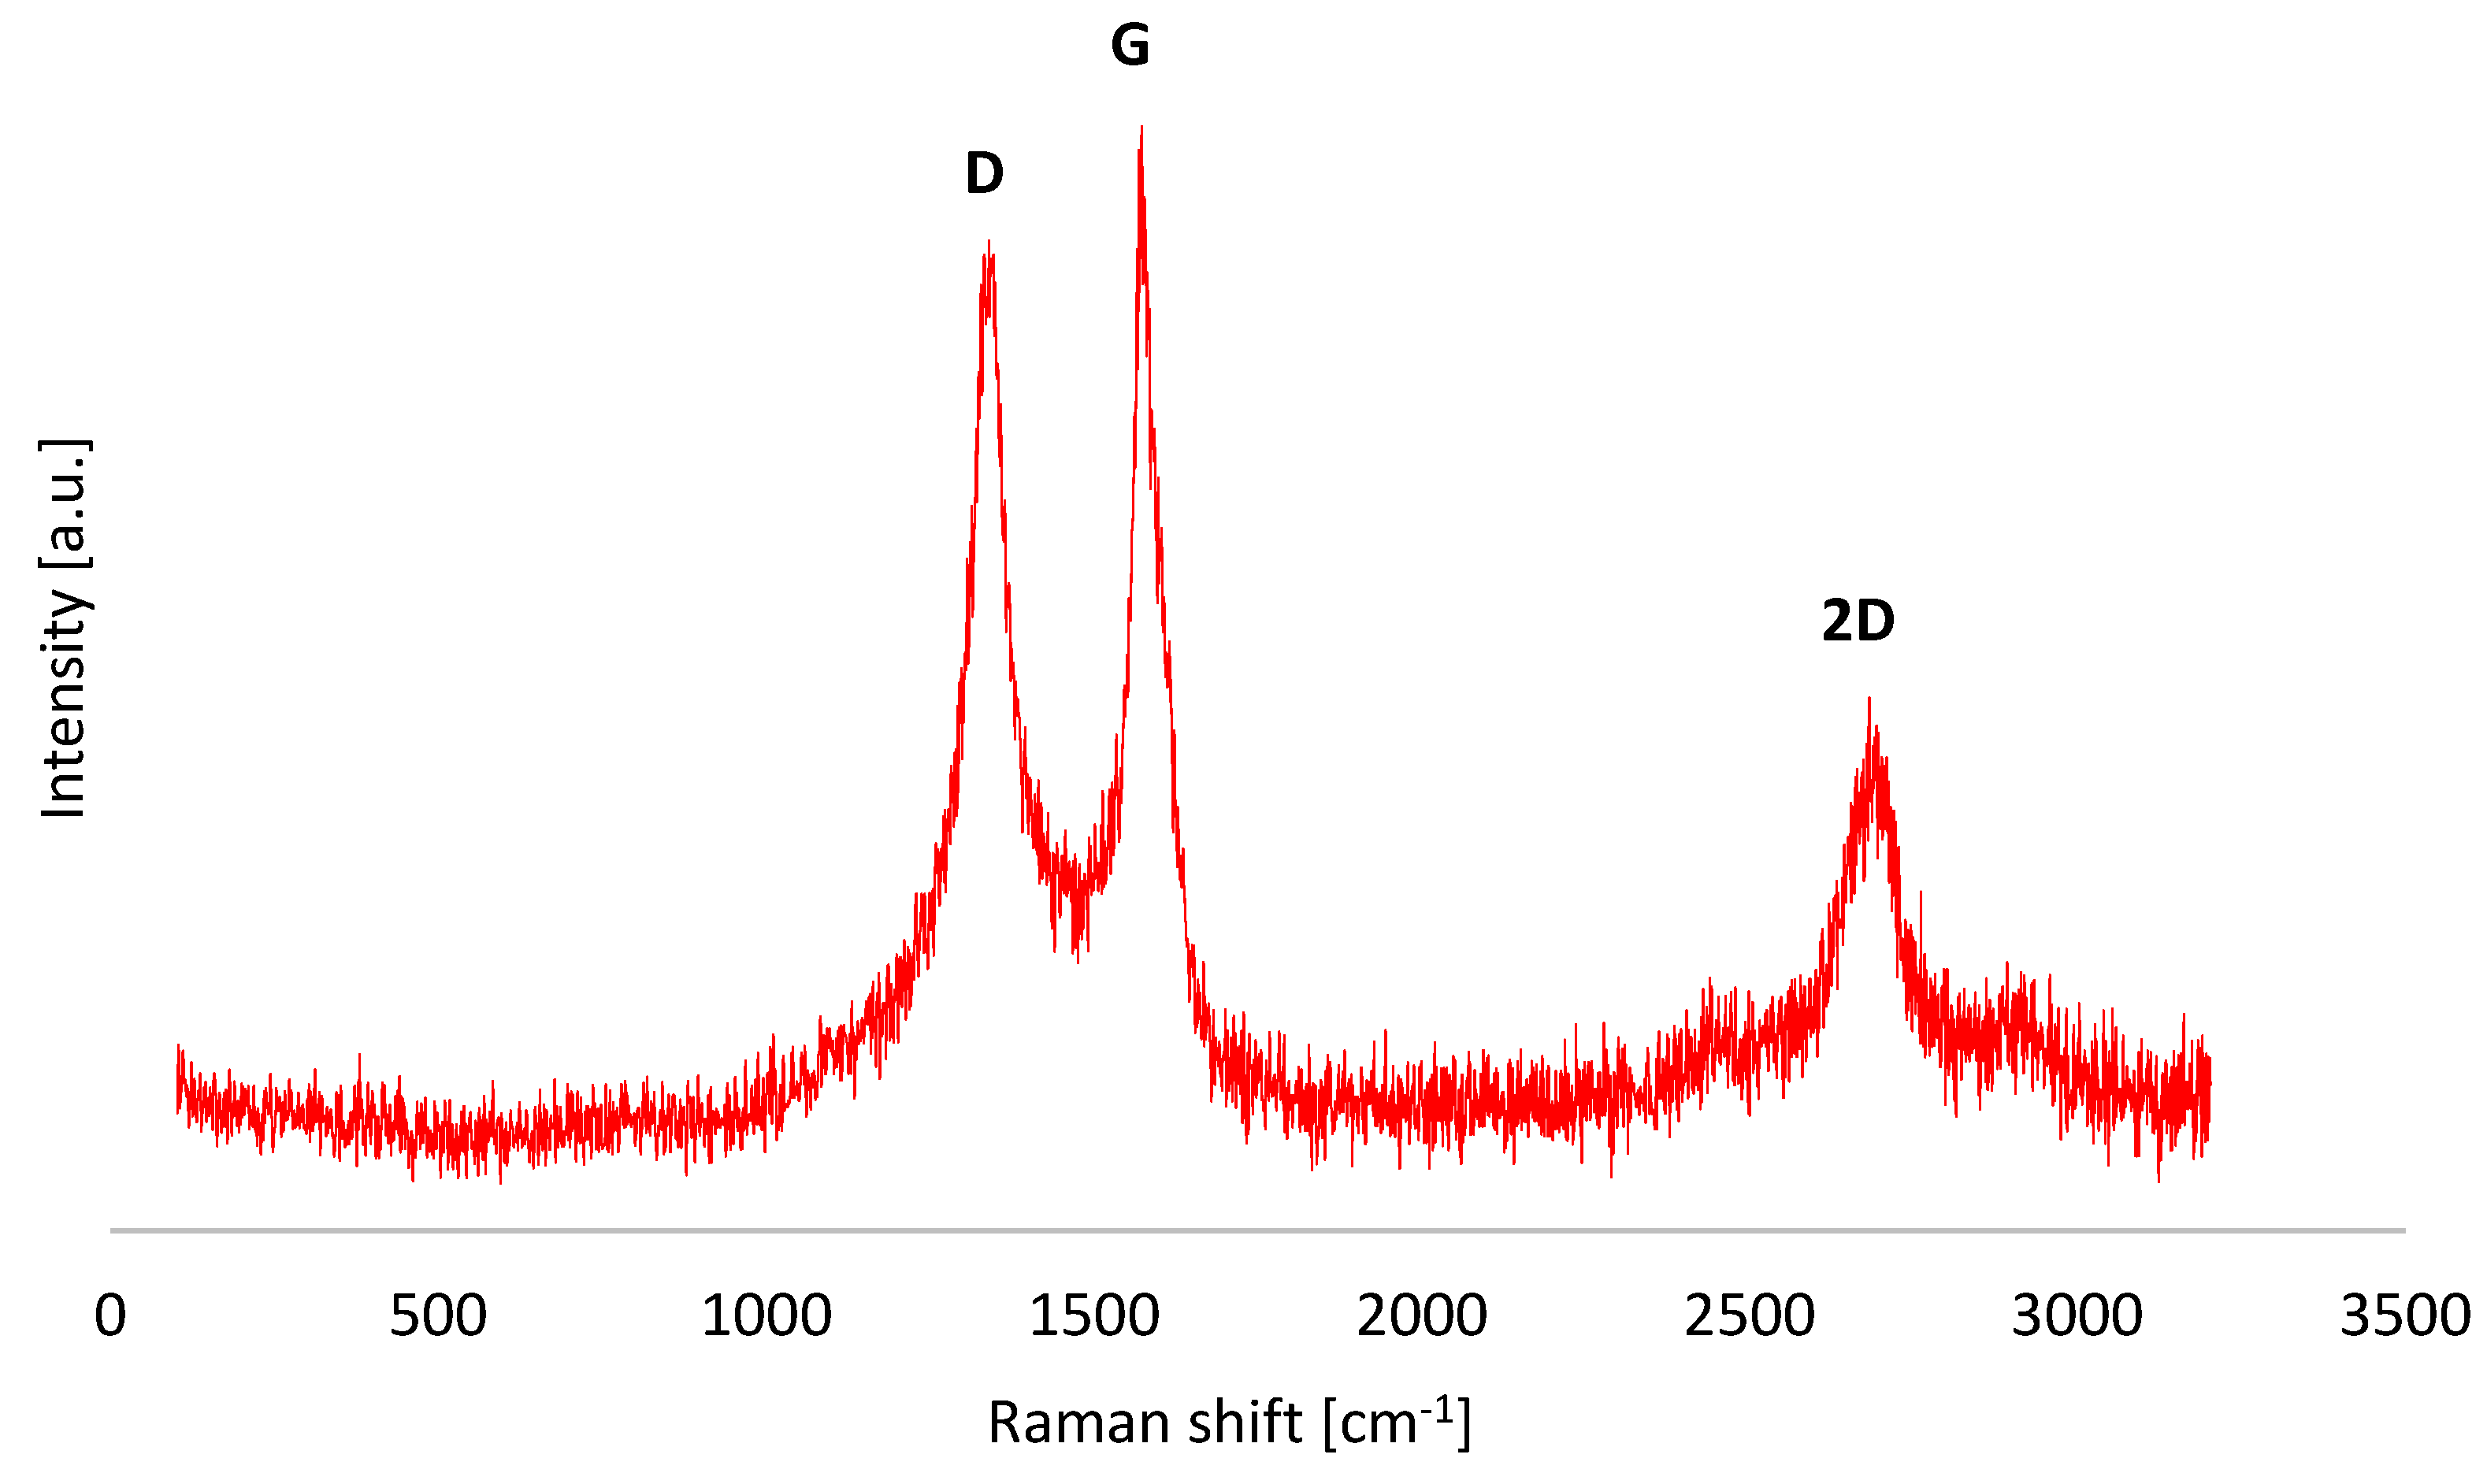
Figure 2.
FTIR spectrum of reduced graphene oxide (rGO, Advanced Graphene Products SA, Zielona Góra, Poland) [12].
Figure 2.
FTIR spectrum of reduced graphene oxide (rGO, Advanced Graphene Products SA, Zielona Góra, Poland) [12].
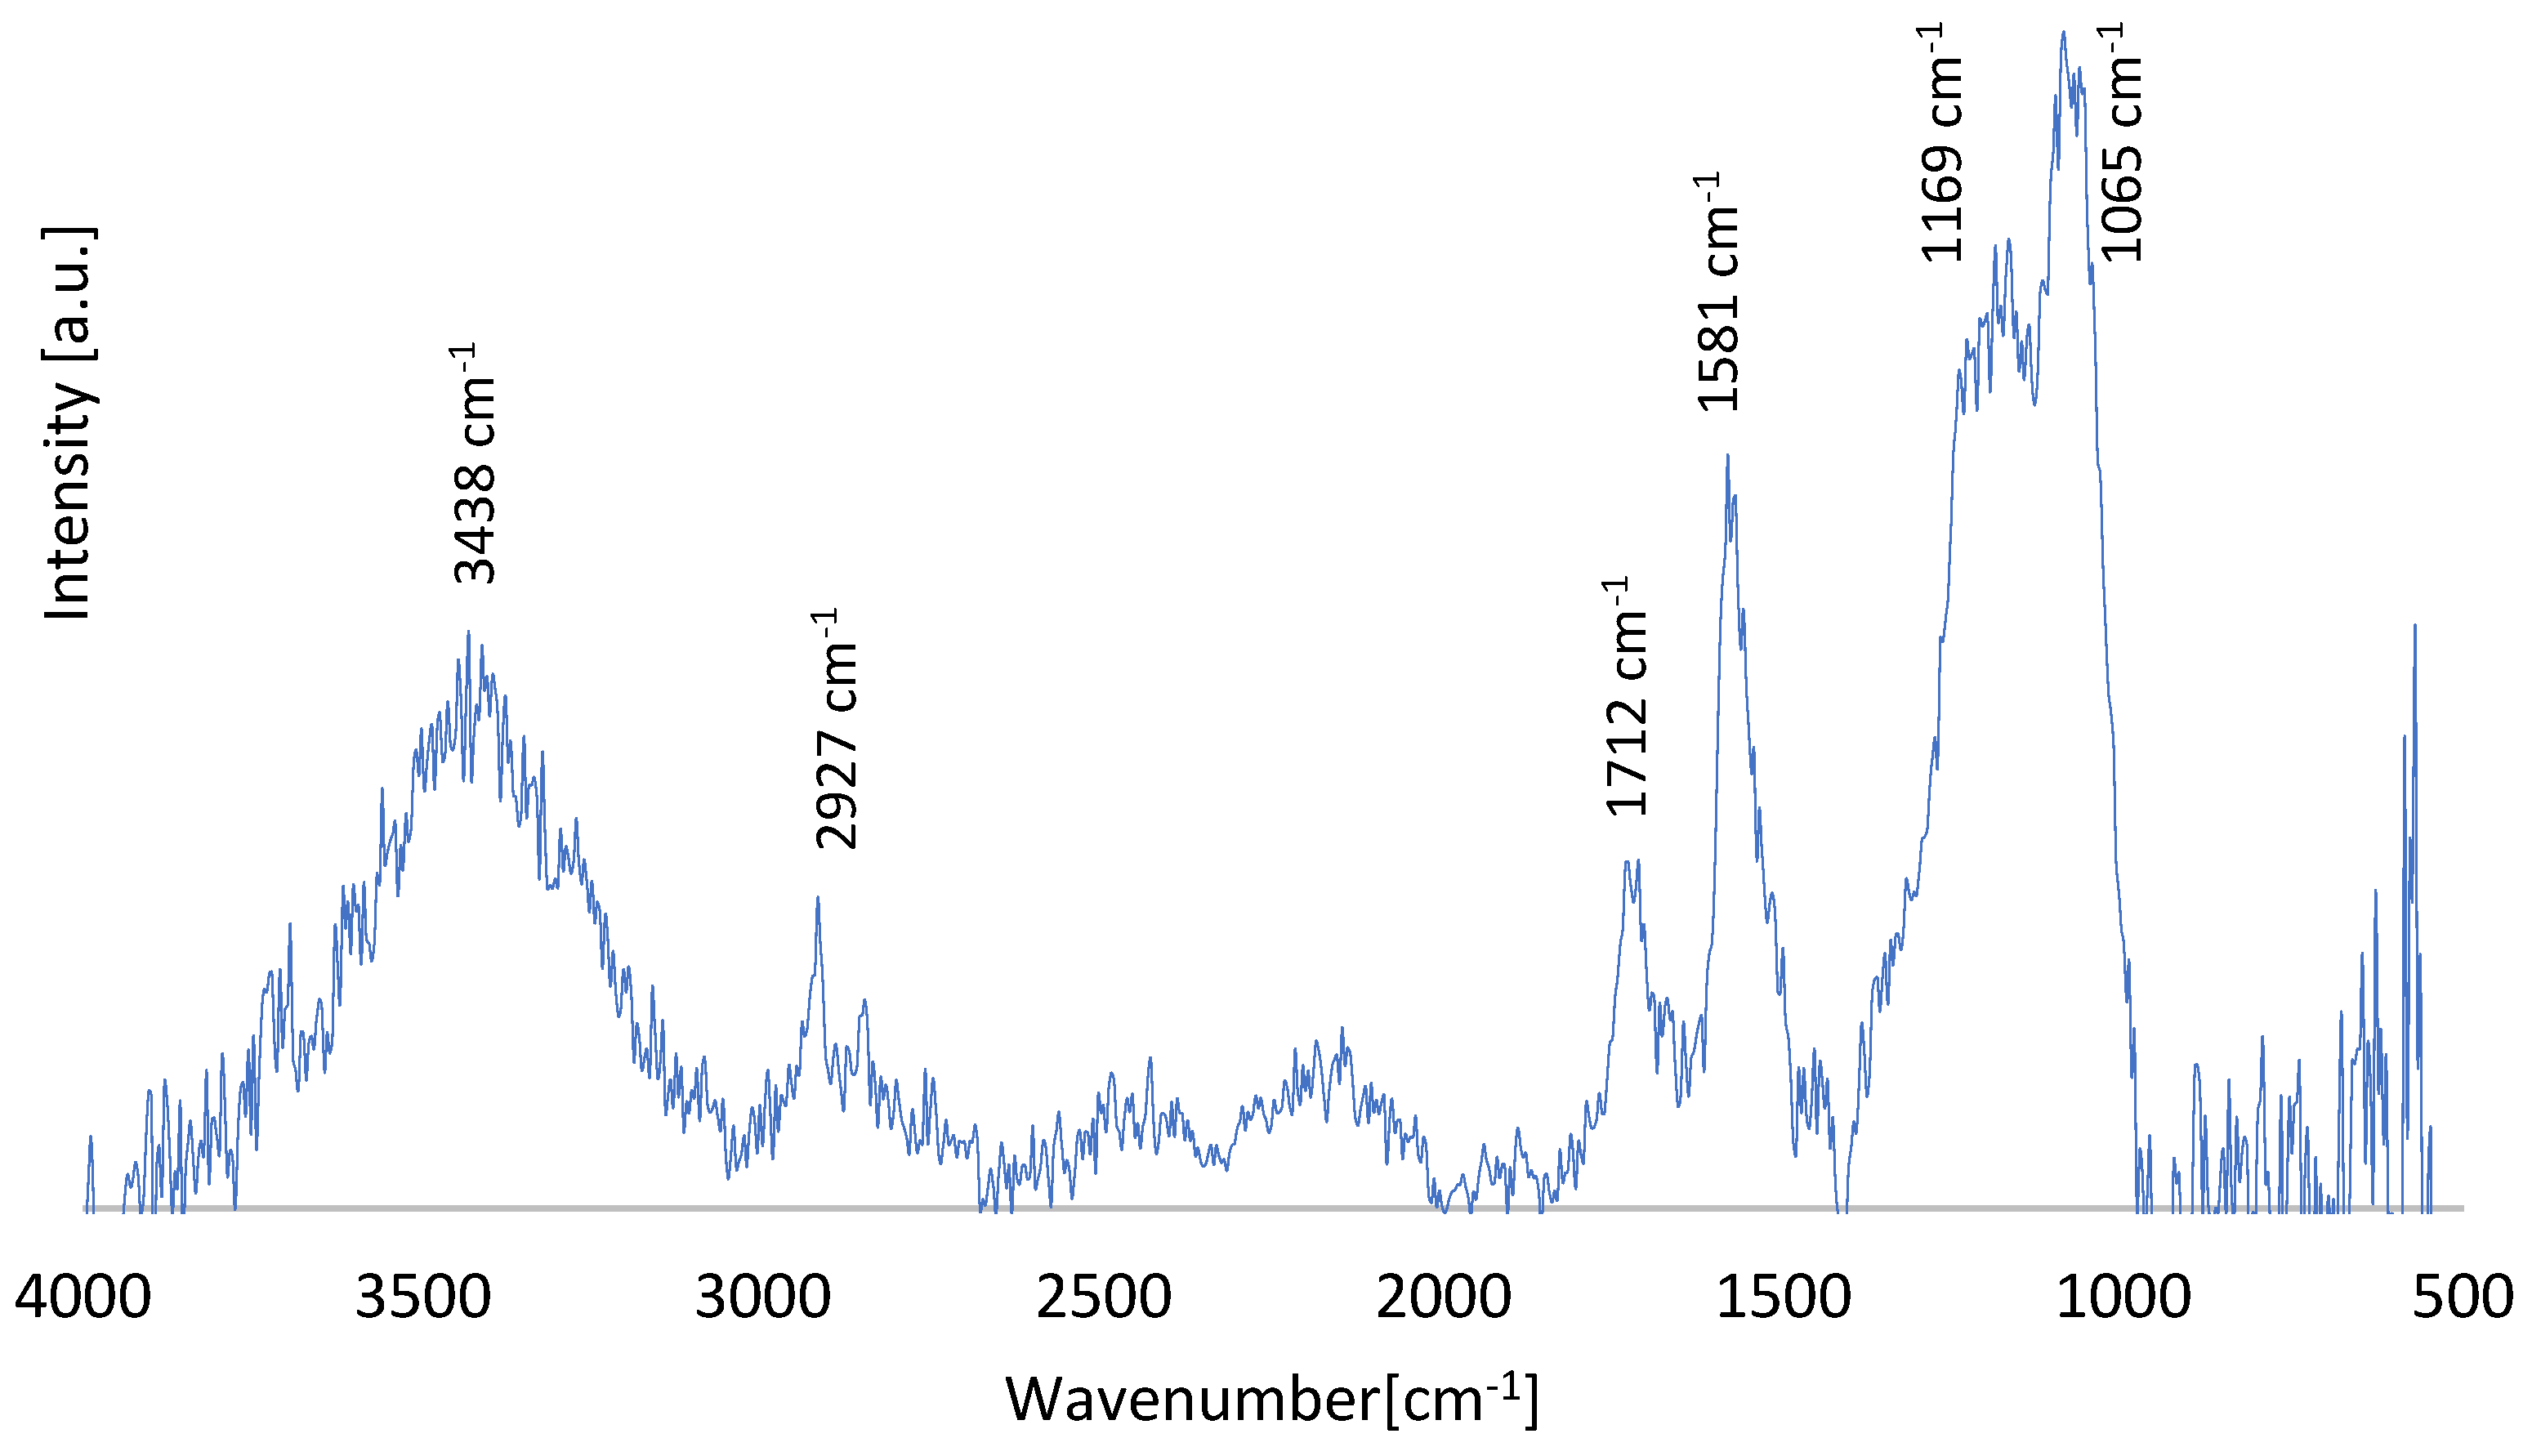
Figure 3.
Comparison chart of the average flexural strength of the test specimens of all series, including the measurement errors.
Figure 3.
Comparison chart of the average flexural strength of the test specimens of all series, including the measurement errors.
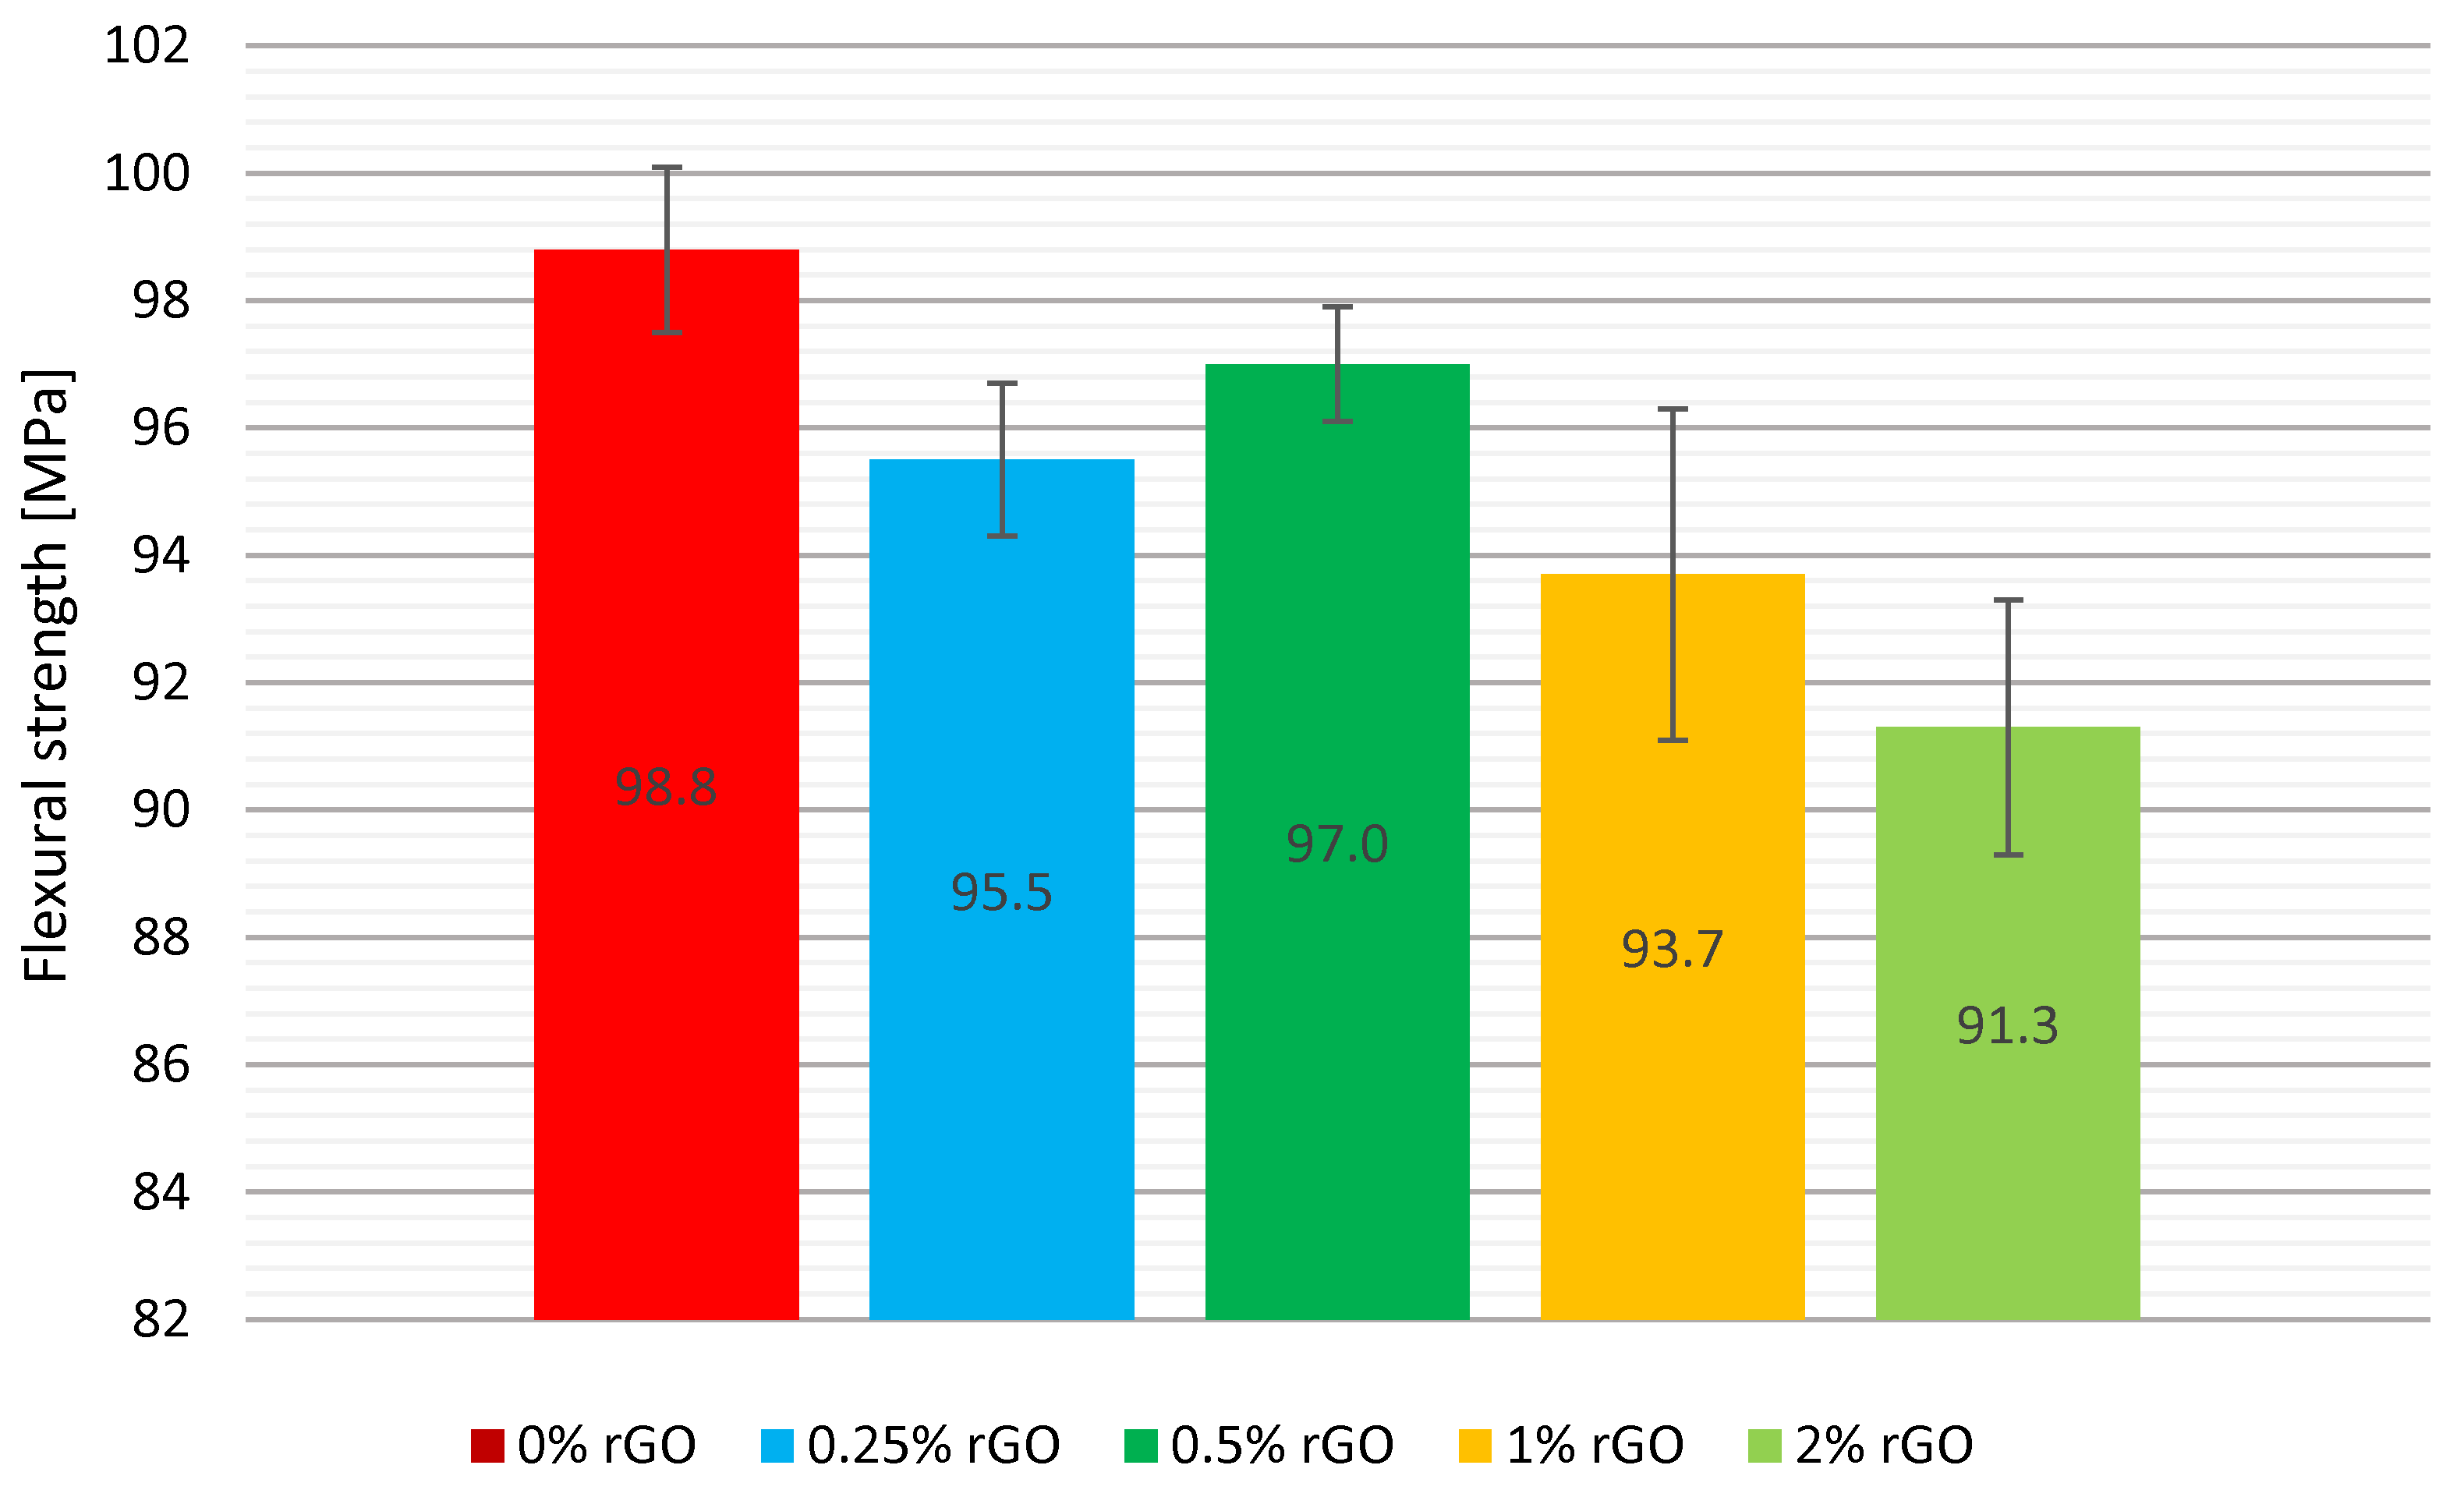
Figure 4.
Comparison chart of the mean deflection of the test specimens of all series, including the measurement errors.
Figure 4.
Comparison chart of the mean deflection of the test specimens of all series, including the measurement errors.
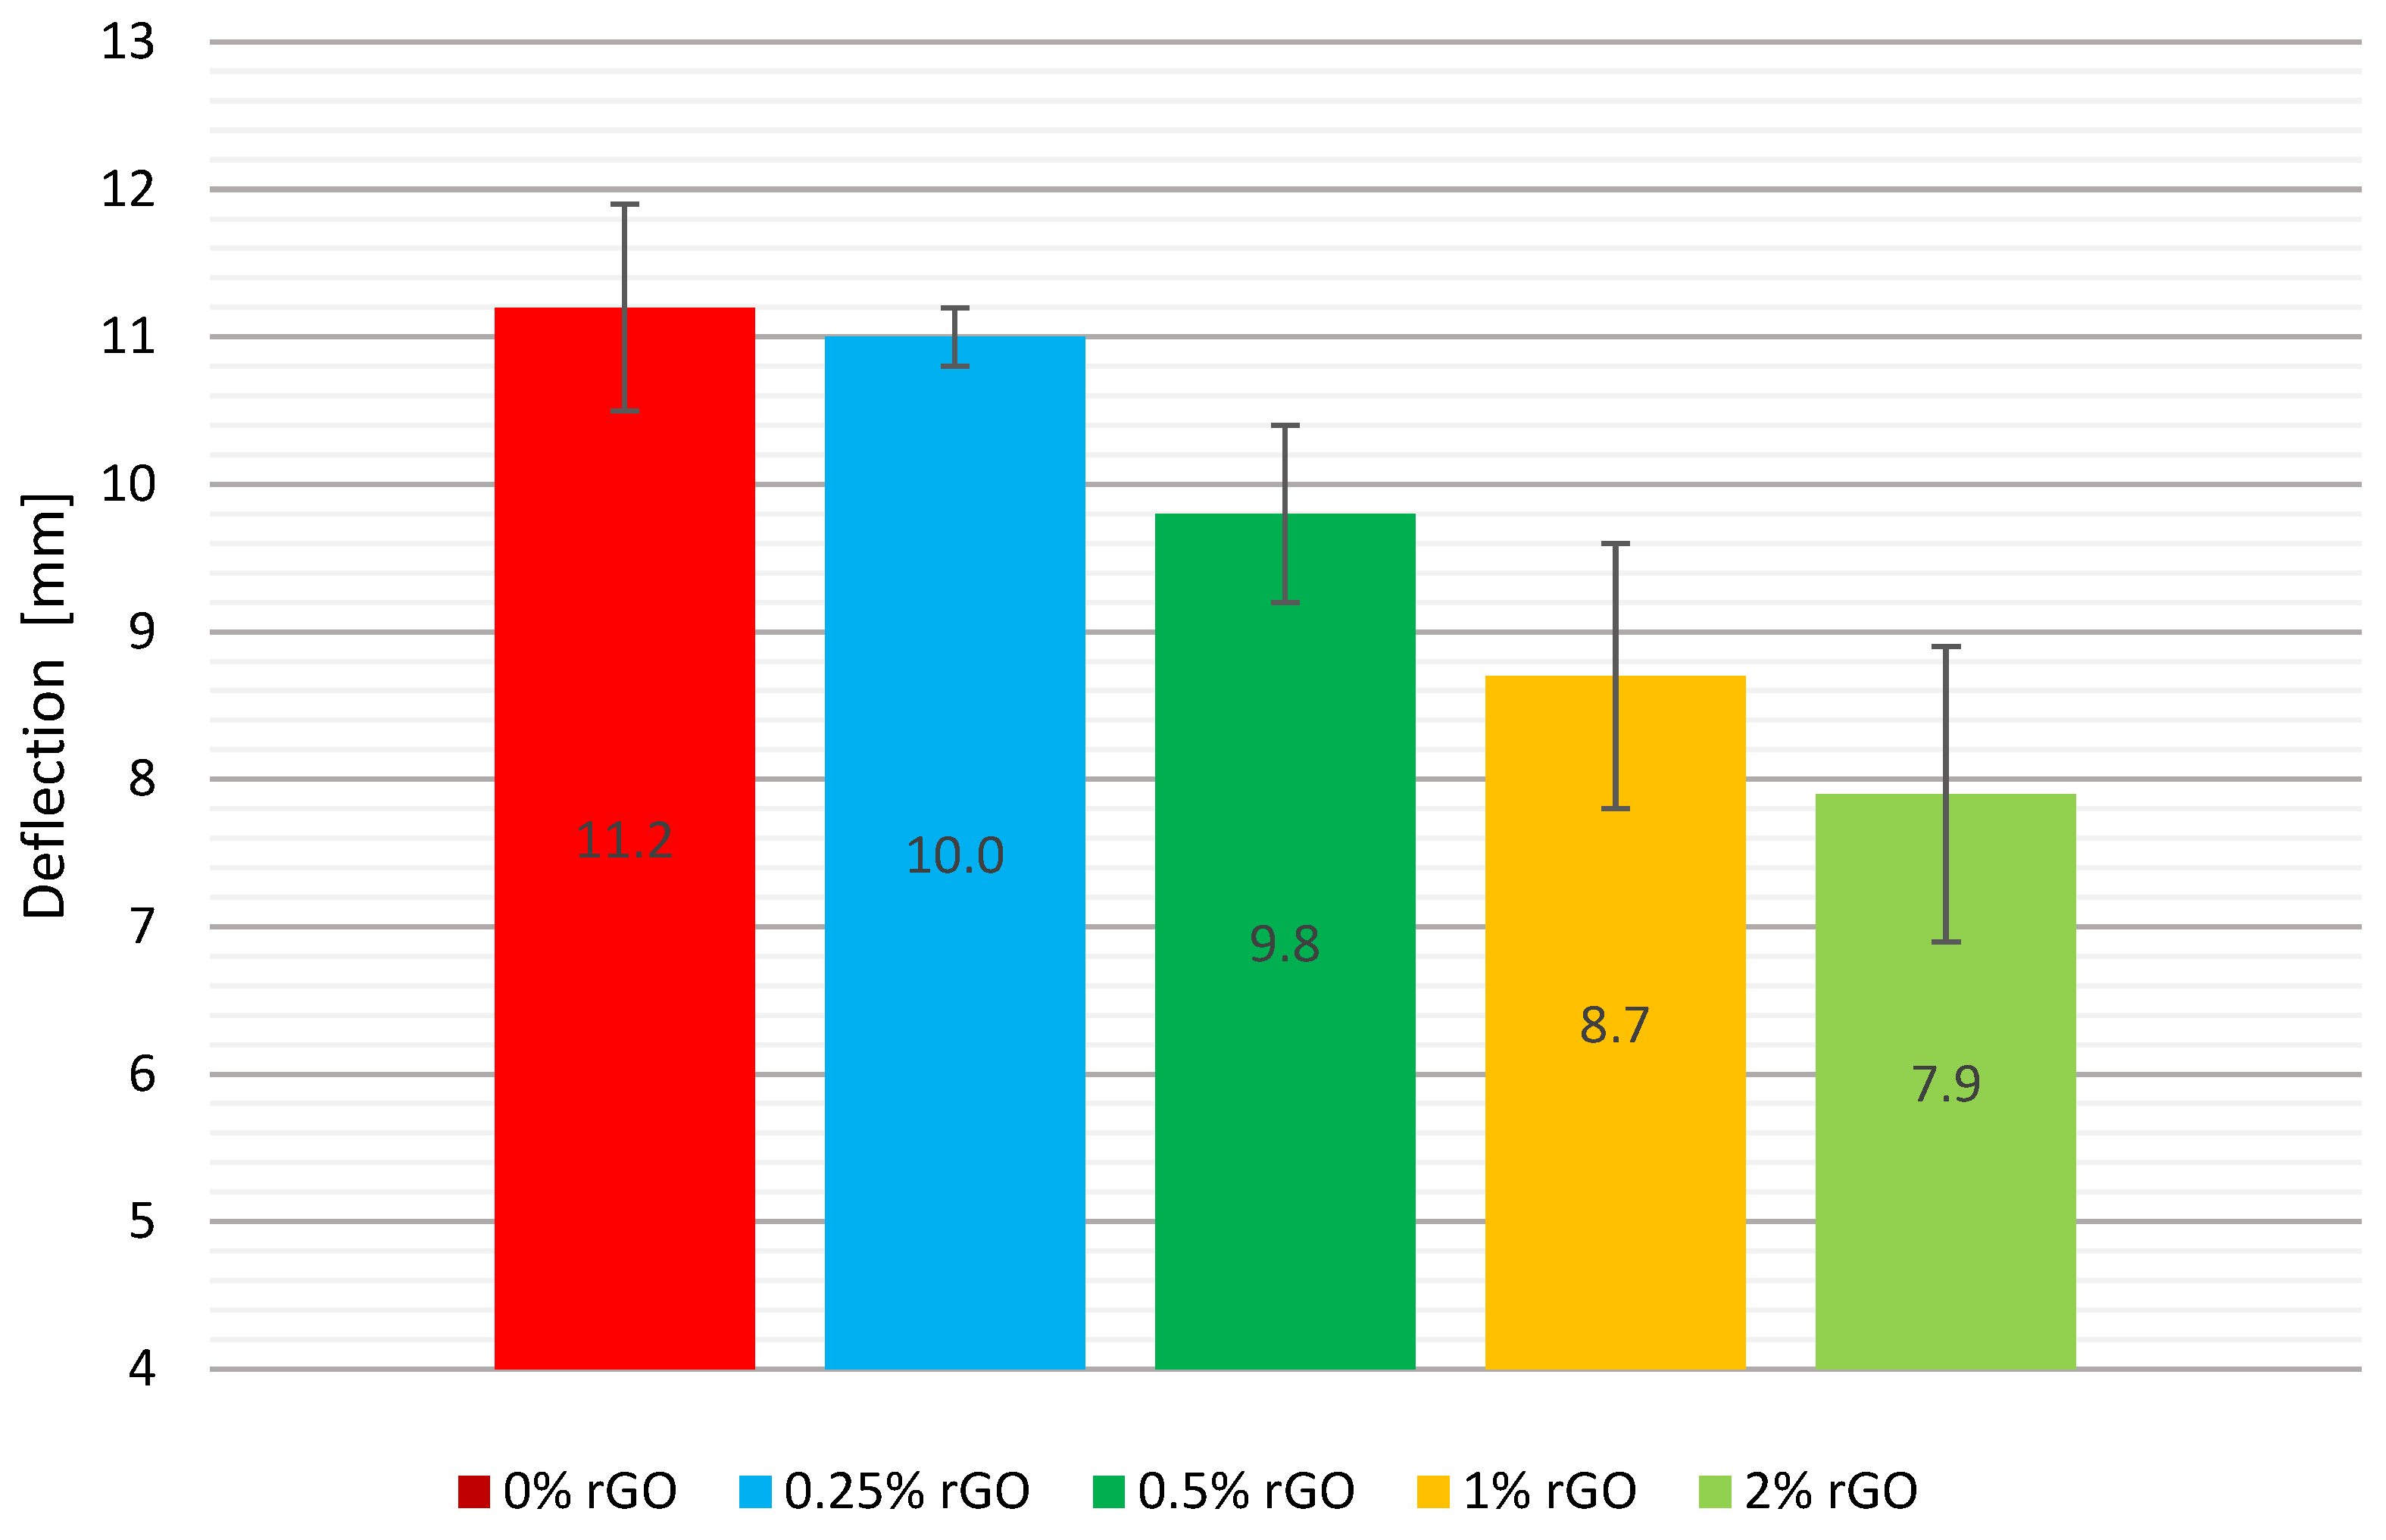
Figure 5.
Fractured specimens after three-point flexural test: a) 0% rGO, b) 2% rGO, c) 0.25% rGO.
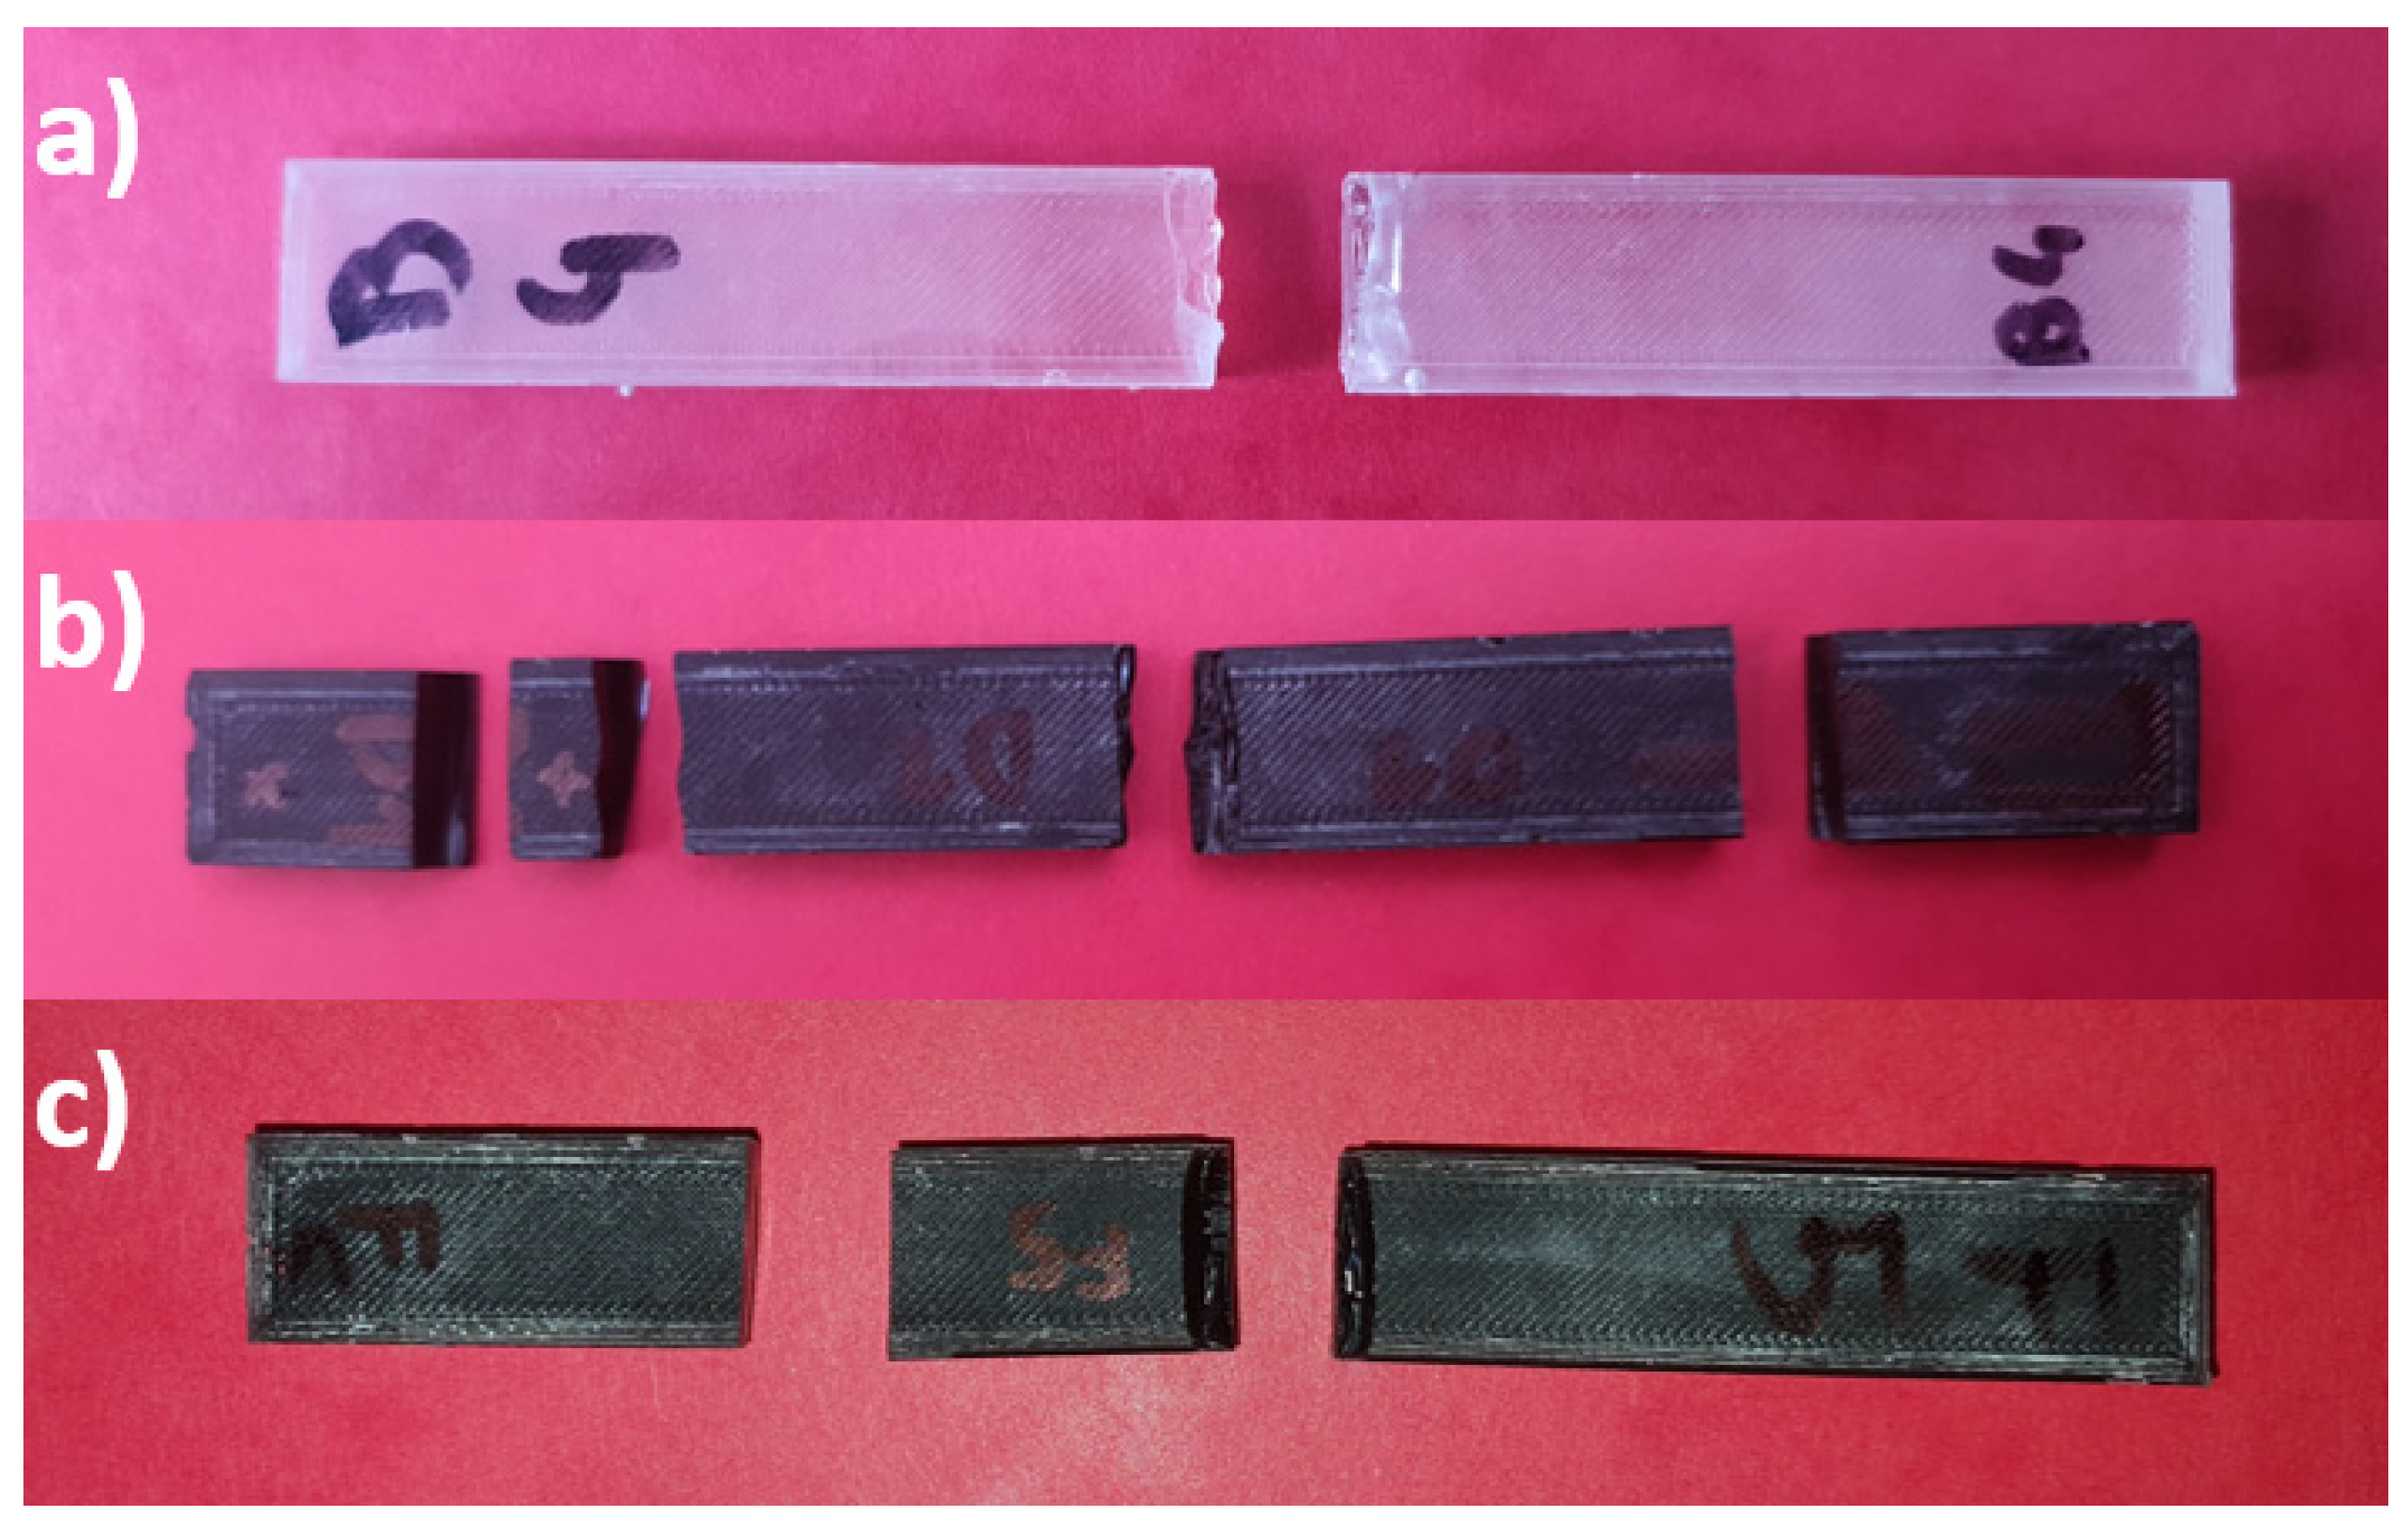
Figure 6.
Comparison chart of the mean compression strength of the test specimens of all series, including the measurement errors.
Figure 6.
Comparison chart of the mean compression strength of the test specimens of all series, including the measurement errors.
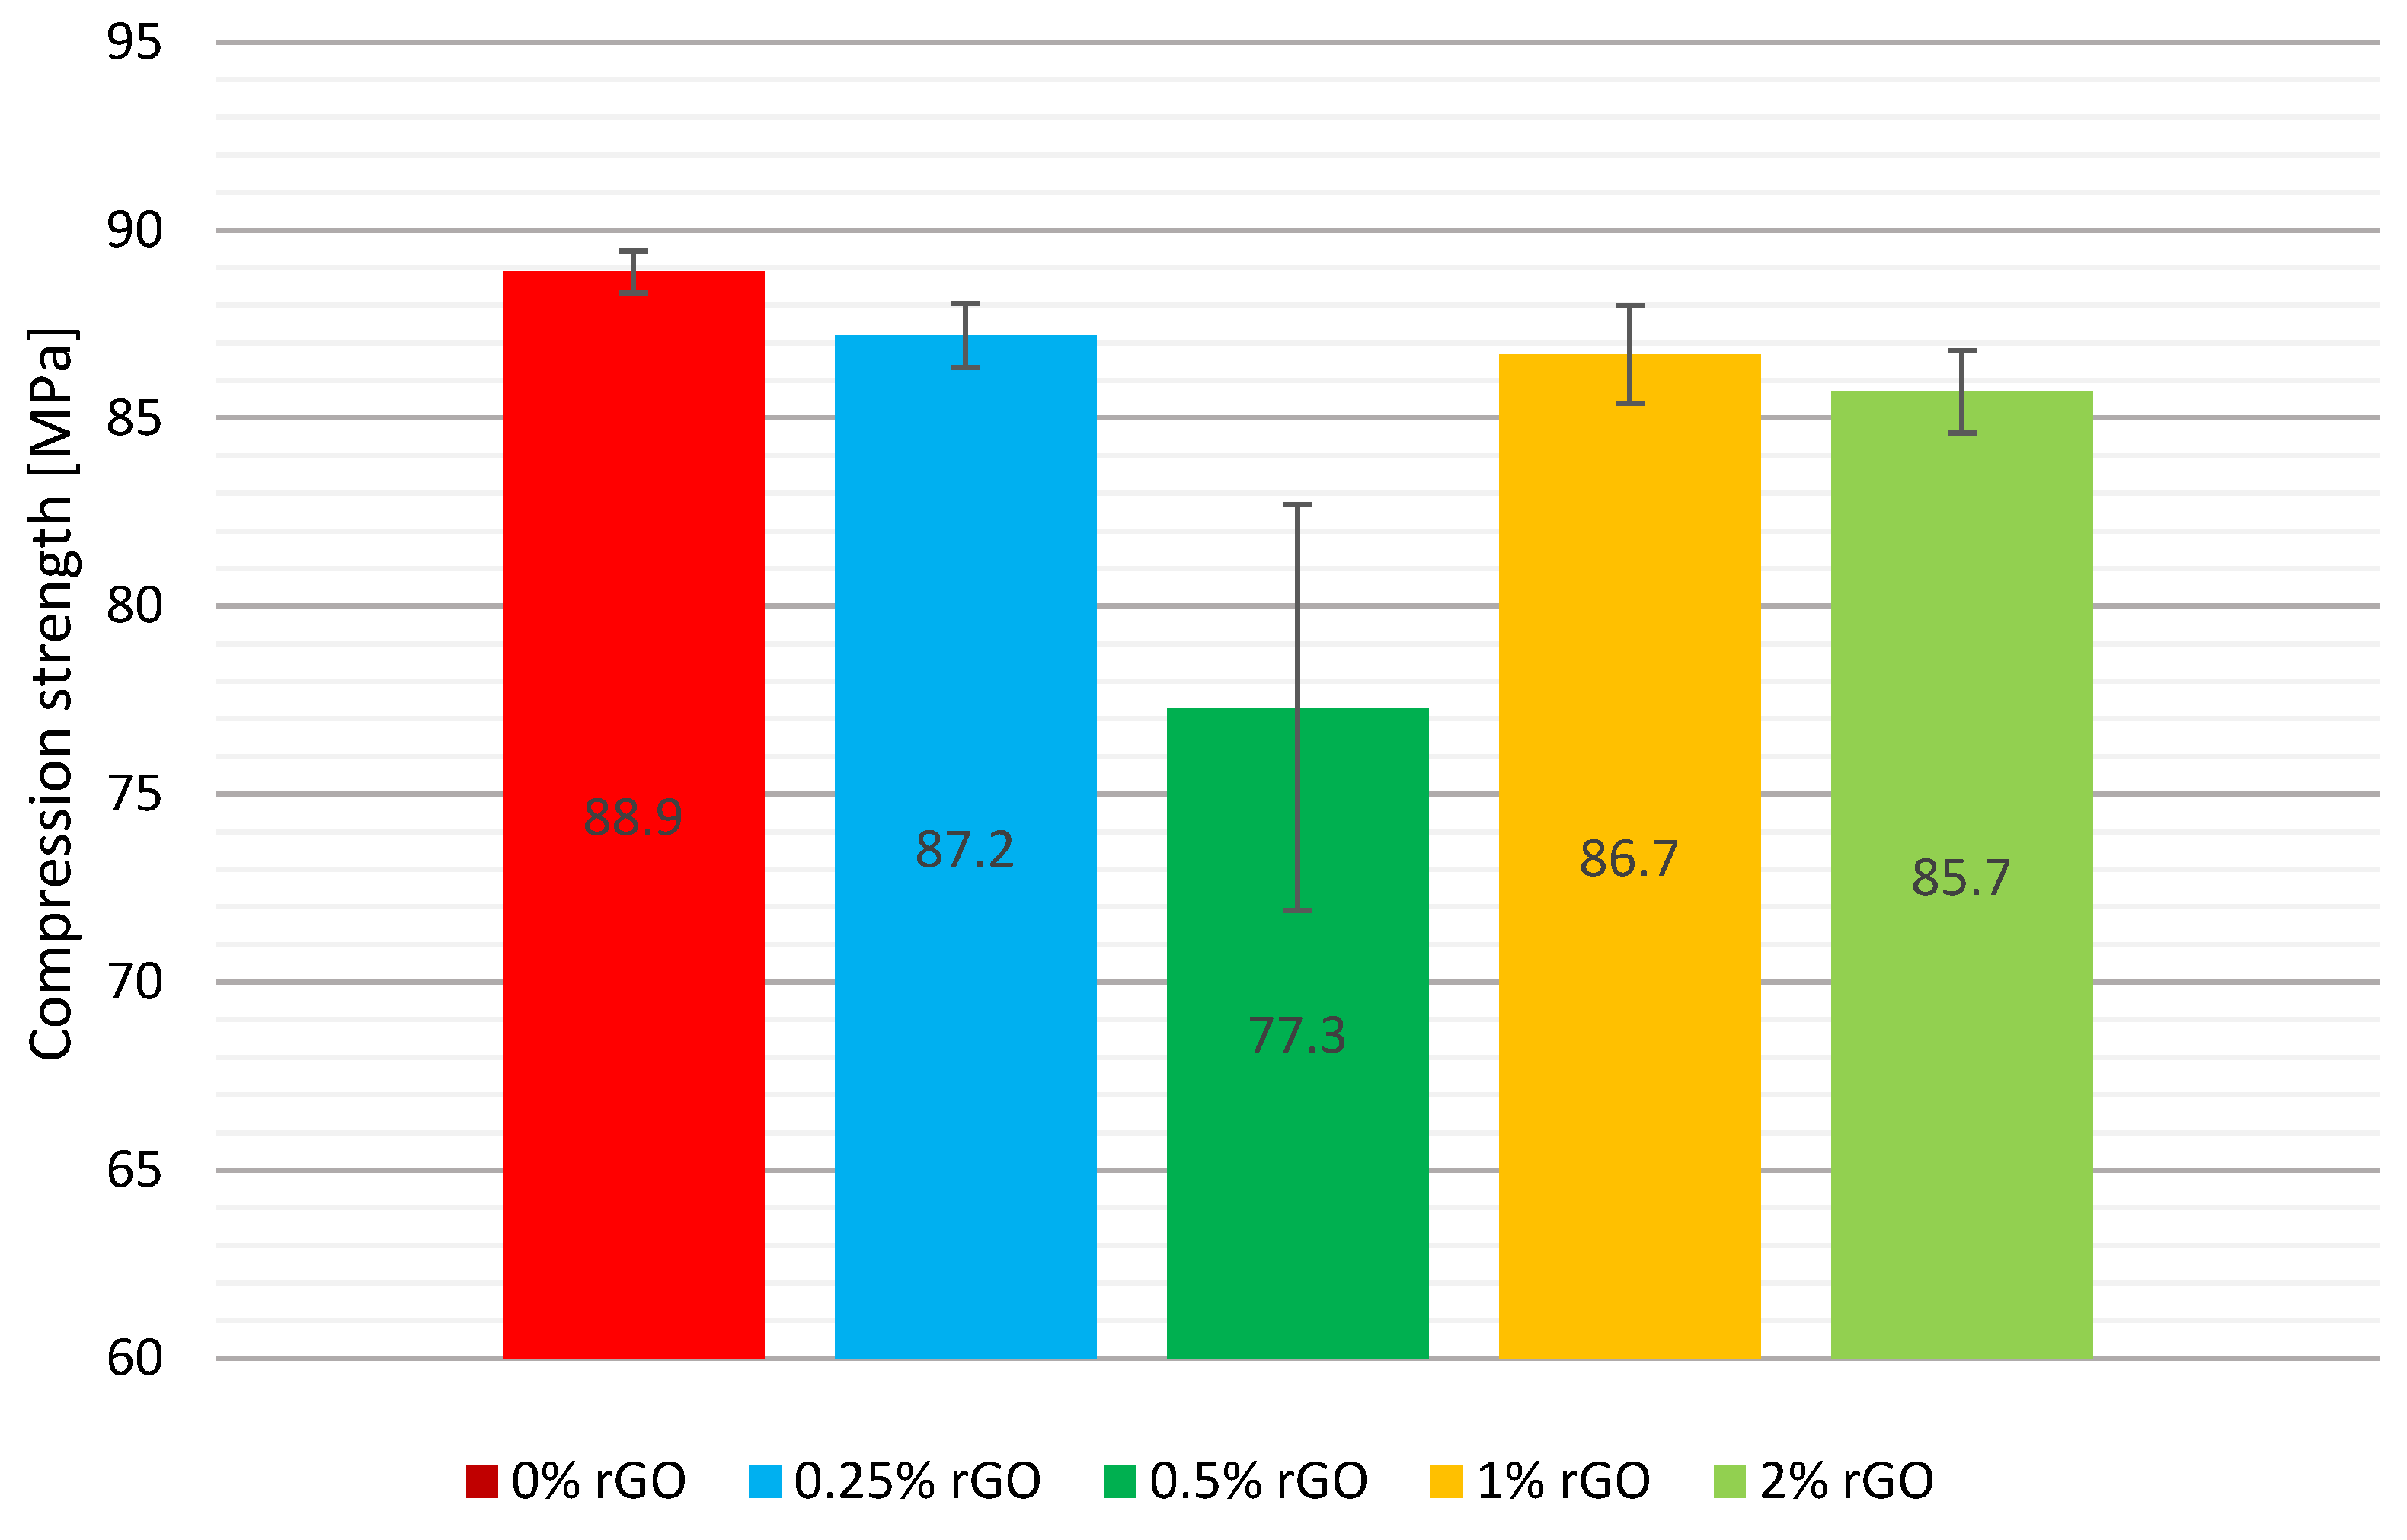
Figure 7.
Comparison chart of the mean of the Young’s modulus of the tested samples of all series, including the measurement errors.
Figure 7.
Comparison chart of the mean of the Young’s modulus of the tested samples of all series, including the measurement errors.
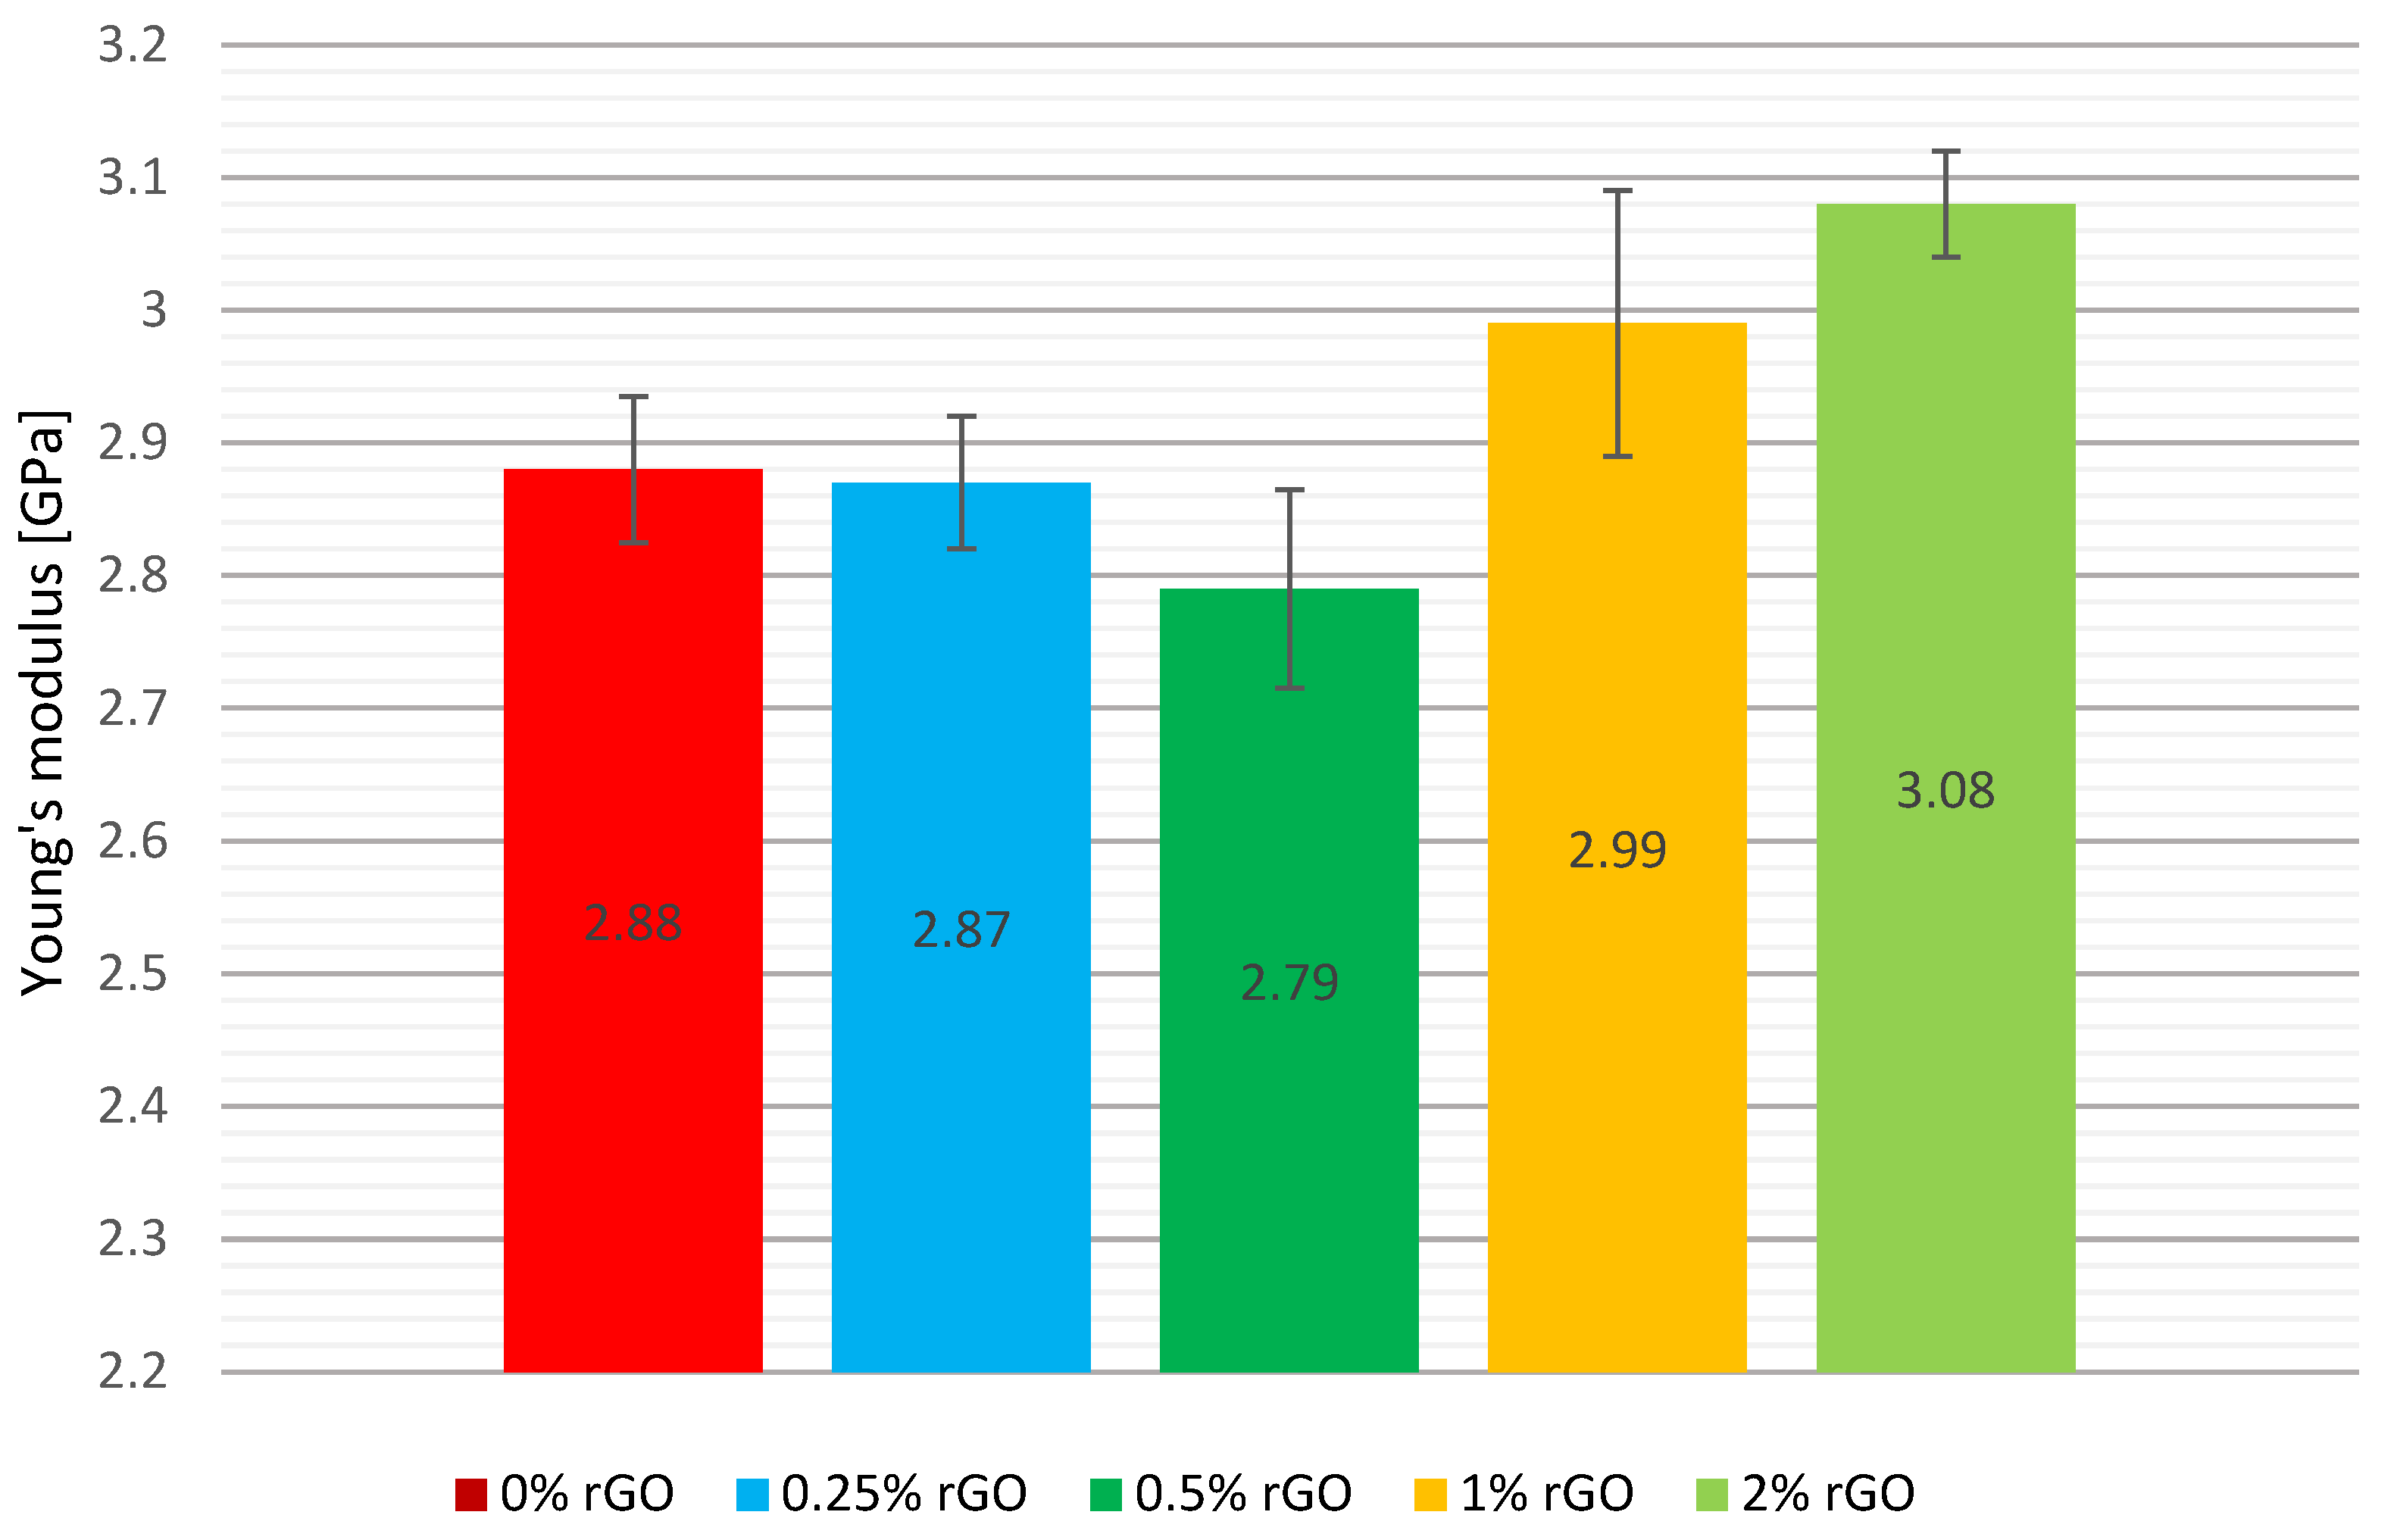
Figure 8.
Comparison chart of the average Vickers hardness of the tested samples of all series, including the measurement errors.
Figure 8.
Comparison chart of the average Vickers hardness of the tested samples of all series, including the measurement errors.
Disclaimer/Publisher’s Note: The statements, opinions and data contained in all publications are solely those of the individual author(s) and contributor(s) and not of MDPI and/or the editor(s). MDPI and/or the editor(s) disclaim responsibility for any injury to people or property resulting from any ideas, methods, instructions or products referred to in the content. |
© 2025 by the authors. Licensee MDPI, Basel, Switzerland. This article is an open access article distributed under the terms and conditions of the Creative Commons Attribution (CC BY) license (https://creativecommons.org/licenses/by/4.0/).
Copyright: This open access article is published under a Creative Commons CC BY 4.0 license, which permit the free download, distribution, and reuse, provided that the author and preprint are cited in any reuse.


