
Submitted:
27 June 2025
Posted:
30 June 2025
You are already at the latest version
Abstract
CAPOX and FOLFOX are widely-used chemotherapy regimens for colorectal cancer (CRC). The superiority of one regimen over the other in a real-world setting (RWE) could have significant clinical implications given their common use, but such RWE is limited. This study analyzed provincial database records of 13,461 Canadian patients treated from 2005-2017. The primary outcomes were rates of Emergency Department visits and/or hospitalizations (ED/H) and overall survival (OS). CAPOX was used less frequently (8.4%) than FOLFOX (91.6%), often in older patients (p< 0.003 for Stage I-III; p< 0.001 for Stage IV). CAPOX recipients had shorter treatment durations (median 15 vs. 20 weeks, p=0.002) and higher unadjusted ED/H rates (60.8% vs. 50.9%, p< 0.001), though this difference was nonsignificant on multivariate analysis (MVA) (HR 1.05 (0.92, 1.20), p = 0.466). Patients receiving CAPOX had worse OS than those on FOLFOX, (5-year OS 70.1% vs. 77.2% (p< 0.001) non-metastatic; 16.6% vs. 33.2% (p< 0.001) metastatic). MVA confirmed inferior OS with CAPOX (HR 1.42, p< 0.001). Other predictors of shorter OS included older age, male sex, comorbidities, rural residence, and lower income. This administrative data is at risk of bias but highlights the need for careful patient selection and informed treatment decision-making.
Keywords:
Colorectal cancer
; Chemotherapy Regimens
; Real-World Outcomes
; Overall Survival
; CAPOX vs. FOLFOX
1. Introduction
FOLFOX (5-fluorouracil, leucovorin and oxaliplatin) chemotherapy is a mainstay of colon cancer treatment in both the adjuvant [1,2] and metastatic [3] settings. While effective, treatment involves significant patient burden as it requires the insertion of a central venous access device (CVAD) such as a peripherally inserted central catheter (PICC) for patients to receive a 46-hour infusion of 5-fluorouracil every two weeks. The CVAD must be kept dry while bathing, regularly accessed, and can interfere with patients’ day-to-day functioning. Patients are also at risk for complications such as line infections and thromboses. One prospective study found that up to 25% of patients ultimately have complications from PICC lines, with 15% requiring PICC removal [4].
CAPOX is an alternate chemotherapy regimen which has been shown to be equivalent to FOLFOX in both the adjuvant [5] and metastatic [6,7] settings. Its main advantage is the use of capecitabine (Xeloda), a 5-FU equivalent that can be taken orally, which eliminates the need for a long-term CVAD. The regimens also differ in the oxaliplatin is given at a higher dose less frequently in the XELOX regimen 130mg/m2 every 3 weeks instead of 85mg/m2 every 2 weeks). Direct comparisons of these regimens have also, however, shown an increased incidence of hand-foot syndrome and high-grade diarrhea in patients receiving CAPOX [6-8]. As a result, despite evidence that the latter regimen is both cost-saving and more convenient for patients compared to FOLFOX [9], its use as adjuvant therapy prior to the publication of the 2018 IDEA meta-analysis – which showed that a 3-month course of adjuvant CAPOX was non-inferior to a 6-months course [10] – was limited [11].
Given the increased interest in CAPOX as a result of the IDEA findings, and the differences in toxicity, the aim of the present study was to analyze the real-world impact of CAPOX versus FOLFOX chemotherapy in a Canadian setting prior to publication of IDEA. We used the ICES database, which links administrative data from several databases capturing essentially all patients in the province of Ontario, Canada. The province of Ontario has a population of almost 15 million people, allowing analyses using ICES to have sample sizes large enough to detect even small differences in outcomes that reflect real-world practice patterns.
2. Materials and Methods
The period examined was 2005 through 2017, which allowed us to compare similar duration treatments prior to publication of IDEA. Patient data was extracted from the ICES database, which includes diagnostic tests, tumour pathology, treatments received as well as medical event dates such as emergency department (ED) visits and hospitalizations for the entire provincial population, presently including over 15 million persons. Demographic data, including vital status, was derived from the provincial Registered Persons Database and Postal Code Conversion File. Chemotherapy treatment use was taken from the New Drug Funding Program and Cancer Activity Level Reporting database. Staging information was obtained through the Ontario Cancer Registry, while admission data was obtained through the National Ambulatory Care Reporting System (NACRS) as well as the Discharge Abstract Database (DAD). Social variables were collected using the Ontario Marginalization Index (ON-Marg), a province-wide data tool providing various demographic measures (e.g., economic, ethno-racial, etc.) to provide a quantifiable estimate of a patient’s overall socioeconomic marginalization based on their area of residence within the province. The primary outcomes of interest were overall survival in patients who received CAPOX or FOLFOX as well as rates of ED visits and/or hospitalizations while on treatment, comparing the two regimens. The study included patients who received either CAPOX or FOLFOX (with or without anti-EGFR, anti-VEGF and/or radiation therapy) in the adjuvant or metastatic setting for colon or rectal cancer. Patients were identified based on the International Classification of Diseases code (ICD-10) associated with their diagnosis (see Appendix I for a complete list of codes used to capture patients’ cancer diagnoses). Patients were excluded if they received any systemic treatment prior to their diagnosis of colorectal cancer, if they had surgery >30 days pre-diagnosis, if they had no follow-up post-diagnosis, if they were Stage 0, and if they had a history of prior malignancy. Patients were considered to have received FOLFOX if they received 5-FU and oxaliplatin within 120 days of their first treatment; patients who received capecitabine and oxaliplatin within 120 days of their first treatment were ruled to have received CAPOX. The 120 day cut-off was used to maximize patient capture, since oxaliplatin is not given as treatment in CRC without use of a fluoropyrimidine and adjuvant treatment beginning after that time would be unlikely. Patients were classified as having ED visits and/or hospitalizations while on treatment if they had either of those events, for any reason, from the first date of initiation of a chemotherapy regimen to 30 days after last dose of that chemotherapy regimen. Last dose of chemotherapy was assigned if no further treatment was given within 6 weeks of that date, acknowledging that a few patients would be lost who resumed treatment while recognizing that incorporating chemotherapy holidays into the analysis was impractical.
Using SAS version 9.0 (SAS Institute, Cary, NC) and R version 4.3.0, descriptive statistics were used to summarize patient demographic, cancer and treatment variables, along with outcomes. Univariable differences in baseline, cancer, treatment and outcome characteristics were explored using the Χ2 test, two-sample t-test or log-rank test, for categorical, continuous and time-to-event variables respectively. Overall survival was defined from date of first treatment with CAPOX/FOLFOX until the date of death, with censoring of patients at the last date they were in contact with the Ontario health care system prior to the data cutoff date (March 31, 2022). The Kaplan-Meier method was used to estimate overall survival. The effect of treatment type on frequency of ED/H, or on overall survival, was tested using logistic regression, or Cox proportional hazards regression analyses. All potential and available covariates were included in the regression model, and the effect of treatment was then assessed adjusting for all other factors. Statistical significance was defined at the alpha=0.05 level and all tests and confidence intervals were two-sided. No adjustment for multiple testing was performed, but results were interpreted cautiously, understanding that multiple tests were conducted.
3. Results
A total of 98,433 patients were recorded as having been diagnosed with colorectal cancer in Ontario between 2005 – 2017, of whom 13,461 eligible individuals received either CAPOX or FOLFOX (see Figure 1).
3.1. Patient Characteristics and Treatment Data
Of 13,461 patients who received either CAPOX or FOLFOX, stage at diagnosis was known for 12,606; 2,017 of these patients (16.0%) had Stage IV disease. Among all patients, FOLOX was administered to 91.6% (11,525) while 8.4% received CAPOX (1,081) (see Table 1). Use of concurrent anti-EGFR therapy or VEGF-targeted therapy was rare, with only 23, 39 and 948 patients in total receiving cetuximab, panitumumab or bevacizumab, respectively. Patients treated with CAPOX were typically older (p<0.003 for Stage I-III; p <0.001 for Stage IV). Among patients with stage IV disease, men represented a higher proportion of those treated with FOLFOX than CAPOX (57.1% versus 49.1%, p=0.029). A slightly higher proportion of patients receiving CAPOX had stage IV disease (214/1801, 19.8%) compared to FOLFOX (1803/11525, 15.6%), although the use of CAPOX increased significantly among stage III patients in later years (p<0.001). A slightly higher percentage of patients receiving CAPOX in the curative (Stage 1-3) setting were from rural areas compared to FOLFOX (18.5% versus 14.9%, p=0.007). Patients who received CAPOX in the adjuvant setting underwent a median 15 weeks of treatment compared to 20 weeks with FOLFOX (p=0.002) against a standard adjuvant duration of 24 weeks for either regimen. In the metastatic setting, median treatment duration was similar between the two groups (22.5 weeks of CAPOX versus 24 weeks of FOLFOX, p=0.15) (see Table 2).
3.2. Treatment Outcomes
3.2.1. Emergency Department Visits and Hospitalizations
Patients treated with CAPOX had higher unadjusted rates of ED visits and/or hospitalizations while on treatment than those who received FOLFOX (60.8% versus 50.9%, p<0.001) (see Table 2). In subset analyses, rates of ED visits, hospitalizations, or either combined remained higher in the CAPOX group for all groups except for those patients with metastatic disease (data not shown).
In univariate analysis, receiving CAPOX as first systemic treatment was more likely to result in an ED visit or hospitalization (HR 1.54 (95% CI 1.36-1.74), p < 0.001), but in a multivariate analysis there was no significant difference between the regimens (HR 1.05 (95% CI 0.92-1.20), p = 0.47) (see Table 3). Rurality was an independent predictor of ED visits and/or hospitalizations (HR 1.30 (95% CI 1.17-1.43) in MVA, p <0.001), as was Charlson score 2 (HR 1.23 (95% CI 1.00-1.50), p=0.017) and treatment in a later year of diagnosis (HR 1.21/year (95% CI 1.20-1.22), p<0.001). Variability in the ED visit or hospitalization risk was also observed according to disease site (p<0.001), with an apparent increased risk in the rectosigmoid (HR 1.32 (95% CI 1.14-1.52)) and Rectum NOS (HR 2.45, 95% CI 2.16-2.76).
3.3. Overall Survival
Patients treated with CAPOX had lower rates of survival at 5 years than those who received FOLFOX among both non-metastatic (5-year OS 70.1% (66.6, 75.3) versus 77.2% (76.2, 78.1), p<0.001) and metastatic (16.6% (11.0, 23.2) versus 33.2% (30.7, 35.6), <0.001) (see Table 2).
In multivariate analysis, patients receiving CAPOX as their first systemic treatment had higher risk of earlier death (HR 1.42 (95% CI 1.27-1.58), p<0.001) (see Table 4). The survival difference was apparent in both the curative and metastatic populations, as seen in the Kaplan Meier curves (see Figure 2).
Poorer survival was also associated with increasing age (p<0.001), male sex (HR 1.08 (95% CI 1.01-1.15), p=0.016), a non-zero Charlson score (p=0.041), rural habitation (HR 1.15 (95% CI 1.06-1.24), p=0.001), and lower income quintile (p=0.04) (see Table 4).
4. Discussion
This report represents the largest analysis of real-world data (RWD) comparing the effectiveness and toxicity of FOLFOX and CAPOX. Our findings were somewhat unexpected, as ED visits and/or hospitalizations were not higher amongst patients treated with CAPOX but survival was worse. The first finding of note is that a comparatively small number of patients were treated with CAPOX in Ontario during the period studied. Of patients who received fluoropyrimidine doublet chemotherapy, 91.4% (11,525) received FOLFOX, while only 8.6% (1,131) received CAPOX. This may reflect a perception among many oncologists that CAPOX is a more poorly-tolerated chemotherapy regimen despite the convenience of avoiding central venous access. However, despite this possible perception, patients receiving CAPOX were typically older; almost 20% of patients receiving CAPOX in the metastatic setting were 75 years old or older, compared to less than 10% of those receiving FOLFOX. Despite this age difference, however, overall co-morbidity between the CAPOX and FOLFOX cohorts, as represented by the Charlson scores for each population, were not significantly different. It should also be noted that provincial funding for capecitabine began in 2008 for the metastatic setting and in 2016 for the adjuvant indication, delaying its use outside of private drug insurance. Nevertheless, the 2017 cut-off date was thought to be useful in that it preceded the 2018 publication of the IDEA meta-analysis. This study, which suggested that 3 months of adjuvant CAPOX is non-inferior to 6 months in patients with low-risk (T3 and N1) disease, was thought likely to make it more difficult to compare treatments of similar length [2].
Unadjusted rates of ED visits and/or hospitalizations were higher among patients who received CAPOX compared to FOLFOX, regardless of stage or time on treatment. However, when controlling for other factors the difference between the two regimens was not statistically significant. The similar ED/hospitalization rate in the two groups was counter to our expectation based on experience, although trial data is not informative. For example, in the NO16996 trial comparing FOLFOX and CAPOX in the first-line metastatic setting, rates of Grade 3 or higher diarrhea (based on CTCAE criteria; diarrhea severe enough to warrant hospitalization) were higher in the CAPOX arm compared to FOLFOX [6]. However, in that trial, overall grade 3/4 toxicity was similar in the two arms (78% vs 72% for FOLFOX vs CAPOX among the patients without bevacizumab), and hospitalization rates related to toxicity were not specified.
Prior real-world comparisons of the relative toxicity of these two regimens have yielded conflicting results. In 200 patients with metastatic CRC, Baqai et al found that patients receiving FOLFOX experienced higher overall toxicity rates despite mucositis and hand-foot syndrome being more common among patients receiving CAPOX [8]. An analysis of SEER data found lower rates of healthcare utilization among patients who received CAPOX compared to FOLFOX, although the spectrum of claims used to determine this utilization was likely too limited to be definitive [12]. In contrast, three retrospective studies of CRC patients found that dose-limiting toxicity was higher in patients receiving CAPOX [13,14]. It is likely that many of the toxicities in these studies would not have led to emergency department assessment or hospitalization, making comparisons with our study difficult. Our study cannot account for dose reductions which may have diminished capecitabine-related toxicity. Prior retrospective studies suggest that doses of both drugs in CAPOX are reduced as compared with FOLFOX, while outcomes remain at least as good [13,14,15,16].
Of note, treatment durations between CAPOX and FOLFOX were similar in the metastatic (median 22.5 versus 24 weeks, p=0.15) setting, but in the non-metastatic setting patients receiving CAPOX received less adjuvant treatment overall (median 20 versus 15 weeks in favour of FOLFOX, p=0.002). This finding is consistent with prior data suggesting that fewer patients complete the intended length of adjuvant therapy with CAPOX compared to FOLFOX: for example, in a multicentre, retrospective analysis of 306 patients with Stage IIB and Stage III CRC from British Columbia, only 67% of patients treated with CAPOX completed the intended 24 weeks of therapy, compared to 82% of those who received FOLFOX [13]. The retrospective nature of our administrative dataset makes explaining this discrepancy in adjuvant treatment duration difficult, especially since adjusted rates of ED visits and/or hospitalizations were similar with each regimen regardless of disease stage. Other significant predictors of ED visits and hospitalizations found in our study correlate with existing literature. Living in a rural location, for example, was associated with an increased risk of ED visits or hospitalizations (HR 1.30 on MVA), which was also a demonstrated in a large population-based cohort of more than 650,000 cancer patients [17]. Patients with higher Charlson Comorbidity Index scores also had higher rates of ED visits and hospitalizations, in line with existing data [18].
In contrast to ED visits and hospitalizations, overall survival was significantly worse in patients who received CAPOX compared to FOLFOX. This unexpected finding was maintained after adjusting for other factors, including the greater age and more common stage IV disease in the CAPOX population (HR of 1.42 on multivariate analysis). This result contrasts with both randomized trial data as well as prior real-world analyses, which show comparable response rates [8] and overall survival rates [12-15]. Other factors in our study population associated with poorer overall survival such as increasing age, rural residence, comorbidities, cancer stage and sidedness are well-known adverse prognostic factors in CRC that have been described previously [19,20,21,22,23]. As would be expected, the survival contribution of factors such as performance status, lifestyle, and patient preferences were not available from the ICES administrative database, and may have altered outcomes. Additional studies would be required in order assess these potential differences using non-administrative datasets.
Regional differences in drug tolerance could also have potentially affected outcomes. An analysis of 5-FU and capecitabine monotherapy within three phase III trials found that American patients were more likely to experience significant side effects with fluoropyrimidine therapy compared with their counterparts outside the United States. Interestingly, European clinicians are reported to routinely use the higher single agent capecitabine (standard) 1250 mg/m2 twice daily dose in patients while US clinicians tend to use 1000 mg/m2 [24]. Dietary folate intake may partly explain this variation. Fluoropyrimidines require the presence of reduced folate for antitumour activity, and elevated serum folate levels predict greater toxicity in patients receiving capecitabine for treatment of colorectal cancer [25,26]. Canada, like the US, mandates the addition of folic acid to various grains, while this practice is relatively less common in Europe and most Asian countries, where patients are also generally more tolerant of fluoropyrimidines. Even so, it is not clear that there is a differential impact of folate levels on capecitabine versus 5-fluorouracil toxicity. Moreover, although unmeasured dose reductions in capecitabine in our study may have occurred, at least some prospective data suggest that intentional dose reduction does not negatively impact clinical outcomes [27]. Furthermore, limited comparison within clinical trials employing CAPOX among international populations do not show a clear difference in outcome by geographic region [5,6,7].
Our study has important limitations. The use of real-world data by definition means that the CAPOX and FOLFOX patient populations were not randomized, and important unmeasured differences may exist, including patients’ smoking status, lifestyle factors, personal preferences, etc. that could have affected regimen usage and outcomes. In addition, the ICES database does not include dosing information and so other markers of potential toxicity such as dose reductions could not be captured. As previously mentioned, the proportion of patients who received CAPOX was small (8.4%), although this number is almost identical to that found in the SEER study conducted by Satram-Hoang et al [12]. Furthermore, our study’s sample size (n=12,656) is arguably representative of a general North American population. Another limitation of administrative database studies such as ours is that data is collected algorithmically (rather than by individual chart review), and some data may have been mis-identified. Finally, as patient and clinician decision making in choosing one regimen over the other and in utilizing ED/H were not available, any association between chemotherapy regimen and toxicity as measured by ED/H will be more difficult to discern.
5. Conclusions
In conclusion, our study suggests that CAPOX may not be associated with more ED visits or hospitalization than FOLFOX, offering reassurance regarding rates of severe toxicity. Conversely, our finding that CAPOX confers a worse survival is a potential cause for concern, although caution is required when inferring results as mitigating factors cannot be identified. This study is a reminder of two seemingly contradictory facts: first, that the results of clinical trials do not necessarily translate into real world outcomes; and second, that big data cannot replace the randomized clinical trial as a source of truth. In either case, while CAPOX remains a viable treatment for patients with CRC, patient selection and informed decision-making remain paramount.
Author Contributions
Conceptualization: J.G., D.C.; Methodology: D.C., J.G. and G.P.; Software: G.P.; Validation: J.G., G.P..; Formal Analysis: G.P.; Investigation: J.G., D.C.; Resources: J.G.; Data Curation: D.C., J.G and G.P..; Writing – Original Draft Preparation: D.C.; Writing – Review and Editing: J.G. and G.P.; Visualization: G.P.; Project Administration: J.G. and G.P.; Funding Acquisition: J.G.
Funding
This research received no external funding.
Institutional Review Board Statement
The study was conducted in accordance with the Declaration of Helsinki, and the protocol was approved by the Hamilton Integrated Research Ethics Board, project identification 7449, on June 11, 2024.
Data Availability Statement
All data used in this research is available upon request.
Acknowledgments
None.
Conflicts of Interest
The authors have no conflicts of interest to disclose.
Appendix I – Data Definitions
Cancer Variables:
- ●
- Cancer diagnosis: colon or rectal cancer diagnosis by ICD-10 codes C18, C19, C20
- ○
- ICD C18.0-C18.9 (colon), C19.9 (rectosigmoid junction), or C20.9 (rectum)
- ●
- Cancer diagnosis date = date of first OHIP billing date for colon or rectal cancer plus an ‘any time’ positive Ontario Cancer Registry recording
- ●
- Cancer stage: I to IV per the Ontario Cancer Registry
Treatment Variables:
- ●
- First Chemotherapy Date = First date of administration within 365 days of diagnosis.
- ●
- Chemotherapy regimens:
- ○
- FOLFOX = 5-fluorouracil administered within 365 days of diagnosis with oxaliplatin prescribed at any point during the treatment period (since oxaliplatin is only used in combination with a fluoropyrimidine)
- ○
- CAPOX = a prescription for capecitabine is filled with oxaliplatin infused within 7 days.
Treatment Variable Data Interpretation:
- ●
- Curative (adjuvant) vs. Palliative vs. Relapse chemotherapy definitions:
- ○
- Curative (adjuvant) chemotherapy = a 5-FU, capecitabine, FOLFOX, or CAPOX regimen begun within 4 months after a curative surgical procedure and having stage II or III colorectal cancer.
- ○
- Relapse chemotherapy = prior receipt of “curative chemotherapy” according to the above definition, followed by another, different, colorectal cancer chemotherapy regimen starting at least 12 months after the surgical date.
- ○
- Palliative chemotherapy = colorectal chemotherapy regimen given for Stage IV disease by registry.
- ○
- Number of cycles = Number of oxaliplatin doses given prior to Day 200 post-operatively (in Stage II-III patients) or over patient’s lifetime (in Stage IV patients).
Outcome Variables
Definitions:
- ●
- Hospitalization during treatment = hospitalization for any reason from first date of a chemotherapy regimen to 30 days after last dose of a chemotherapy regimen
- ●
- Death - Y/N. Age at death or last follow-up. Last follow-up is otherwise defined as the date of the last OHIP billing or hospital discharge for the individual.
- ○
- Death during chemotherapy = death from first date of a chemotherapy regimen to 30 days after last dose of that same chemotherapy regimen
References
- André, T.; Boni, C.; Navarro, M.; Tabernero, J.; Hickish, T.; Topham, C.; Bonetti, A.; Clingan, P.; Bridgewater, J.; Rivera, F.; De Gramont, A. Improved Overall Survival with Oxaliplatin, Fluorouracil, and Leucovorin as Adjuvant Treatment in Stage II or III Colon Cancer in the MOSAIC Trial. J. Clin. Oncol. 2009, 27, 3109–3116. [Google Scholar] [CrossRef]
- André, T.; Meyerhardt, J.; Iveson, T.; Sobrero, A.; Yoshino, T.; Souglakos, I.; Grothey, A.; Niedzwiecki, D.; Saunders, M.; Labianca, R.; Yamanaka, T.; Boukovinas, I.; Vernerey, D.; Meyers, J.; Harkin, A.; Torri, V.; Oki, E.; Georgoulias, V.; Taieb, J.; Shields, A.; Shi, Q. Effect of Duration of Adjuvant Chemotherapy for Patients with Stage III Colon Cancer (IDEA Collaboration): Final Results from a Prospective, Pooled Analysis of Six Randomised, Phase 3 Trials. Lancet Oncol. 2020, 21, 1620–1629. [Google Scholar] [CrossRef]
- de Gramont, A.; Figer, A.; Seymour, M.; Homerin, M.; Hmissi, A.; Cassidy, J.; Boni, C.; Cortes-Funes, H.; Cervantes, A.; Freyer, G.; Papamichael, D.; Le Bail, N.; Louvet, C.; Hendler, D.; de Braud, F.; Wilson, C.; Morvan, F.; Bonetti, A. Leucovorin and Fluorouracil With or Without Oxaliplatin as First-Line Treatment in Advanced Colorectal Cancer. J. Clin. Oncol. 2000, 18, 2938–2947. [Google Scholar] [CrossRef]
- Bertoglio, S.; Faccini, B.; Lalli, L.; Cafiero, F.; Bruzzi, P. Peripherally Inserted Central Catheters (PICCs) in Cancer Patients under Chemotherapy: A Prospective Study on the Incidence of Complications and Overall Failures. J. Surg. Oncol. 2016, 113, 708–714. [Google Scholar] [CrossRef]
- Schmoll, H. J.; Tabernero, J.; Maroun, J.; De Braud, F.; Price, T.; Van Cutsem, E.; Hill, M.; Hoersch, S.; Rittweger, K.; Haller, D. G. Capecitabine plus Oxaliplatin Compared with Fluorouracil/Folinic Acid as Adjuvant Therapy for Stage III Colon Cancer: Final Results of the NO16968 Randomized Controlled Phase III Trial. J. Clin. Oncol. 2015, 33, 3733–3740. [Google Scholar] [CrossRef]
- Cassidy, J.; Clarke, S.; Díaz-Rubio, E.; Scheithauer, W.; Figer, A.; Wong, R.; Koski, S.; Rittweger, K.; Gilberg, F.; Saltz, L. XELOX vs FOLFOX-4 as First-Line Therapy for Metastatic Colorectal Cancer: NO16966 Updated Results. Br. J. Cancer 2011, 105, 58–64. [Google Scholar] [CrossRef] [PubMed]
- Rothenberg, M. L.; Cox, J. V; Butts, C.; Navarro, M.; Bang, Y.-J.; Goel, R.; Gollins, S.; Siu, L. L.; Laguerre, S.; Cunningham, D. Capecitabine plus Oxaliplatin (XELOX) versus 5-Fluorouracil/Folinic Acid plus Oxaliplatin (FOLFOX-4) as Second-Line Therapy in Metastatic Colorectal Cancer: A Randomized Phase III Noninferiority Study. Ann. Oncol. 2008, 19, 1720–1726. [Google Scholar] [CrossRef]
- Baqai, T. I.; Haider, G.; Abro, N. A.; Rani, B.; Kumari, R.; Anzar, J.; Abbas, K. Efficacy and Safety of Xelox in Comparison with Folfox in Metastatic Colorectal Cancer. Pakistan J. Med. Heal. Sci. 2022, 16, 833–835. [Google Scholar] [CrossRef]
- Scheithauer, W.; Cassidy, J.; Figer, A.; Wong, R.; Koski, S.; Lichinitser, M.; Yang, T.; Clarke, S.; Diaz-Rubio, E.; Garrison, L. A Comparison of Medical Resource Use for 4 Chemotherapy Regimens as First-Line Treatment for Metastatic Colorectal Cancer (MCRC): XELOX vs. FOLFOX4 ± Bevacizumab (A). J. Clin. Oncol. 2007, 25. [Google Scholar] [CrossRef]
- Grothey, A.; Sobrero, A. F.; Shields, A. F.; Yoshino, T.; Paul, J.; Taieb, J.; Souglakos, J.; Shi, Q.; Kerr, R.; Labianca, R.; Meyerhardt, J. A.; Vernerey, D.; Yamanaka, T.; Boukovinas, I.; Meyers, J. P.; Renfro, L. A.; Niedzwiecki, D.; Watanabe, T.; Torri, V.; Saunders, M.; Sargent, D. J.; Andre, T.; Iveson, T. Duration of Adjuvant Chemotherapy for Stage III Colon Cancer. N. Engl. J. Med. 2018, 378, 1177–1188. [Google Scholar] [CrossRef]
- Yu, I. S.; Pereira, A. A. L.; Lee, M.; Korphaisarn, K.; Marshall, J.; Segelov, E.; O’Callaghan, C.; Lim, H. J.; Kopetz, S.; Loree, J. M. Medical Oncologists’ Perspectives on How the Results of the IDEA Collaboration Impact the Adjuvant Treatment of Stage III Colon Cancer. Oncologist 2020, 25, 229–234. [Google Scholar] [CrossRef] [PubMed]
- Satram-Hoang, S.; Lee, L.; Yu, S.; Guduru, S. R.; Gunuganti, A. R.; Reyes, C.; McKenna, E. Comparative Effectiveness of Chemotherapy in Elderly Patients with Metastatic Colorectal Cancer. J. Gastrointest. Cancer 2013, 44, 79–88. [Google Scholar] [CrossRef] [PubMed]
- Sha, A.; Abadi, S.; Gill, S. Utilization of Capecitabine plus Oxaliplatin and 5-Fluorouracil/Folinic Acid plus Oxaliplatin in the Adjuvant Treatment of Stage IIB and Stage III Colon Cancer: A Multi-Centre, Retrospective, Chart Review Study. J. Oncol. Pharm. Pract. 2018, 24, 501–506. [Google Scholar] [CrossRef]
- Loree, J. M.; Sha, A.; Soleimani, M.; Kennecke, H. F.; Ho, M. Y.; Cheung, W. Y.; Mulder, K. E.; Abadi, S.; Spratlin, J. L.; Gill, S. Survival Impact of CAPOX Versus FOLFOX in the Adjuvant Treatment of Stage III Colon Cancer. Clin. Colorectal Cancer 2018, 17, 156–163. [Google Scholar] [CrossRef] [PubMed]
- Loree, J. M.; Mulder, K. E.; Ghosh, S.; Spratlin, J. L. Retrospective Comparison of CAPOX and FOLFOX Dose Intensity, Toxicity, and Clinical Outcomes in the Treatment of Metastatic Colon Cancer. J. Gastrointest. Cancer 2014, 45, 154–160. [Google Scholar] [CrossRef]
- Yoon, R.; Wilkinson, K.; Gabriel, G.; Kadaan, N.; Roberts, T.; Lim, S.; Asghari, R.; Lee, C. S.; Chua, W.; Ng, W. Real-World Tolerance and Outcomes of Oxaliplatin-Based Adjuvant Chemotherapy for Stage III Colon Cancer—Does Dose Intensity Matter? Asia. Pac. J. Clin. Oncol. n/a. [CrossRef]
- Grewal, K.; Calzavara, A.; McLeod, S. L.; Eskander, A.; Savage, D. W.; Thompson, C.; Borgundvaag, B.; Ovens, H.; Cheskes, S.; de Wit, K.; Irish, J.; Krzyzanowska, M. K.; Walsh, R.; Mohindra, R.; Thiruganasambandamoorthy, V.; Sutradhar, R. Emergency Department Use before Cancer Diagnosis in Ontario, Canada: A Population-Based Study. CMAJ 2024, 196, E1252–E1261. [Google Scholar] [CrossRef] [PubMed]
- Moe, J.; Wang, E. Y.; McGregor, M. J.; Schull, M. J.; Dong, K.; Holroyd, B. R.; Hohl, C. M.; Grafstein, E.; O’Sullivan, F.; Trimble, J.; McGrail, K. M. People Who Make Frequent Emergency Department Visits Based on Persistence of Frequent Use in Ontario and Alberta: A Retrospective Cohort Study. C. open 2022, 10, E220–E231. [Google Scholar] [CrossRef]
- Pilleron, S.; Withrow, D. R.; Nicholson, B. D.; Morris, E. J. A. Age-Related Differences in Colon and Rectal Cancer Survival by Stage, Histology, and Tumour Site: An Analysis of United States SEER-18 Data. Cancer Epidemiol. 2023, 84, 102363. [Google Scholar] [CrossRef]
- van Eeghen, E. E.; Bakker, S. D.; van Bochove, A.; Loffeld, R. J. L. F. Impact of Age and Comorbidity on Survival in Colorectal Cancer. J. Gastrointest. Oncol. 2015, 6, 605–612. [Google Scholar] [CrossRef]
- Sung, H.; Ferlay, J.; Siegel, R. L.; Laversanne, M.; Soerjomataram, I.; Jemal, A.; Bray, F. Global Cancer Statistics 2020: GLOBOCAN Estimates of Incidence and Mortality Worldwide for 36 Cancers in 185 Countries. CA. Cancer J. Clin. 2021, 71, 209–249. [Google Scholar] [CrossRef] [PubMed]
- Fu, M.-S.; Pan, S.-X.; Cai, X.-Q.; Pan, Q.-C. Urban vs. Rural: Colorectal Cancer Survival and Prognostic Disparities from 2000 to 2019. Front. public Heal. 2024, 12, 1319977. [Google Scholar] [CrossRef] [PubMed]
- Janssens, K.; Boeckx, N.; Van Camp, G.; De Beeck, K. O.; Fransen, E.; Calay, F.; Van Damme, N.; Peeters, M. Comparing Survival in Left-Sided and Right-Sided Colorectal Carcinoma: A Belgian Population-Based Study. Ann. Oncol. 2018, 29, v98. [Google Scholar] [CrossRef]
- Haller, D. G.; Cassidy, J.; Clarke, S. J.; Cunningham, D.; Van Cutsem, E.; Hoff, P. M.; Rothenberg, M. L.; Saltz, L. B.; Schmoll, H.-J.; Allegra, C.; Bertino, J. R.; Douillard, J.-Y.; Gustavsson, B. G.; Milano, G.; O’Connell, M.; Rustum, Y.; Tabernero, J.; Gilberg, F.; Sirzén, F.; Twelves, C. Potential Regional Differences for the Tolerability Profiles of Fluoropyrimidines. J. Clin. Oncol. 2008, 26, 2118–2123. [Google Scholar] [CrossRef] [PubMed]
- Chan, S. L.; Chan, A. W. H.; Mo, F.; Ma, B. B. Y.; Wong, K. C. W.; Lam, D.; Mok, F. S. T.; Chan, A. T. C.; Mok, T.; Chan, K. C. A. Association Between Serum Folate Level and Toxicity of Capecitabine During Treatment for Colorectal Cancer. Oncologist 2018, 23, 1436–1445. [Google Scholar] [CrossRef]
- Sharma, R.; Rivory, L.; Beale, P.; Ong, S.; Horvath, L.; Clarke, S. J. A Phase II Study of Fixed-Dose Capecitabine and Assessment of Predictors of Toxicity in Patients with Advanced/Metastatic Colorectal Cancer. Br. J. Cancer 2006, 94, 964–968. [Google Scholar] [CrossRef]
- Vincent, M. D.; Breadner, D.; Cripps, M. C.; Jonker, D. J.; Klimo, P.; Biagi, J. J.; Lam, W.; O’Connell, A.; Whiston, F.; Stitt, L.; Welch, S. A. Phase I/II Trial of Dose-Reduced Capecitabine in Elderly Patients with Advanced Colorectal Cancer. Curr. Oncol. 2017, 24, 261–268. [Google Scholar] [CrossRef]
Figure 1.
Consort flow diagram of patient selection.
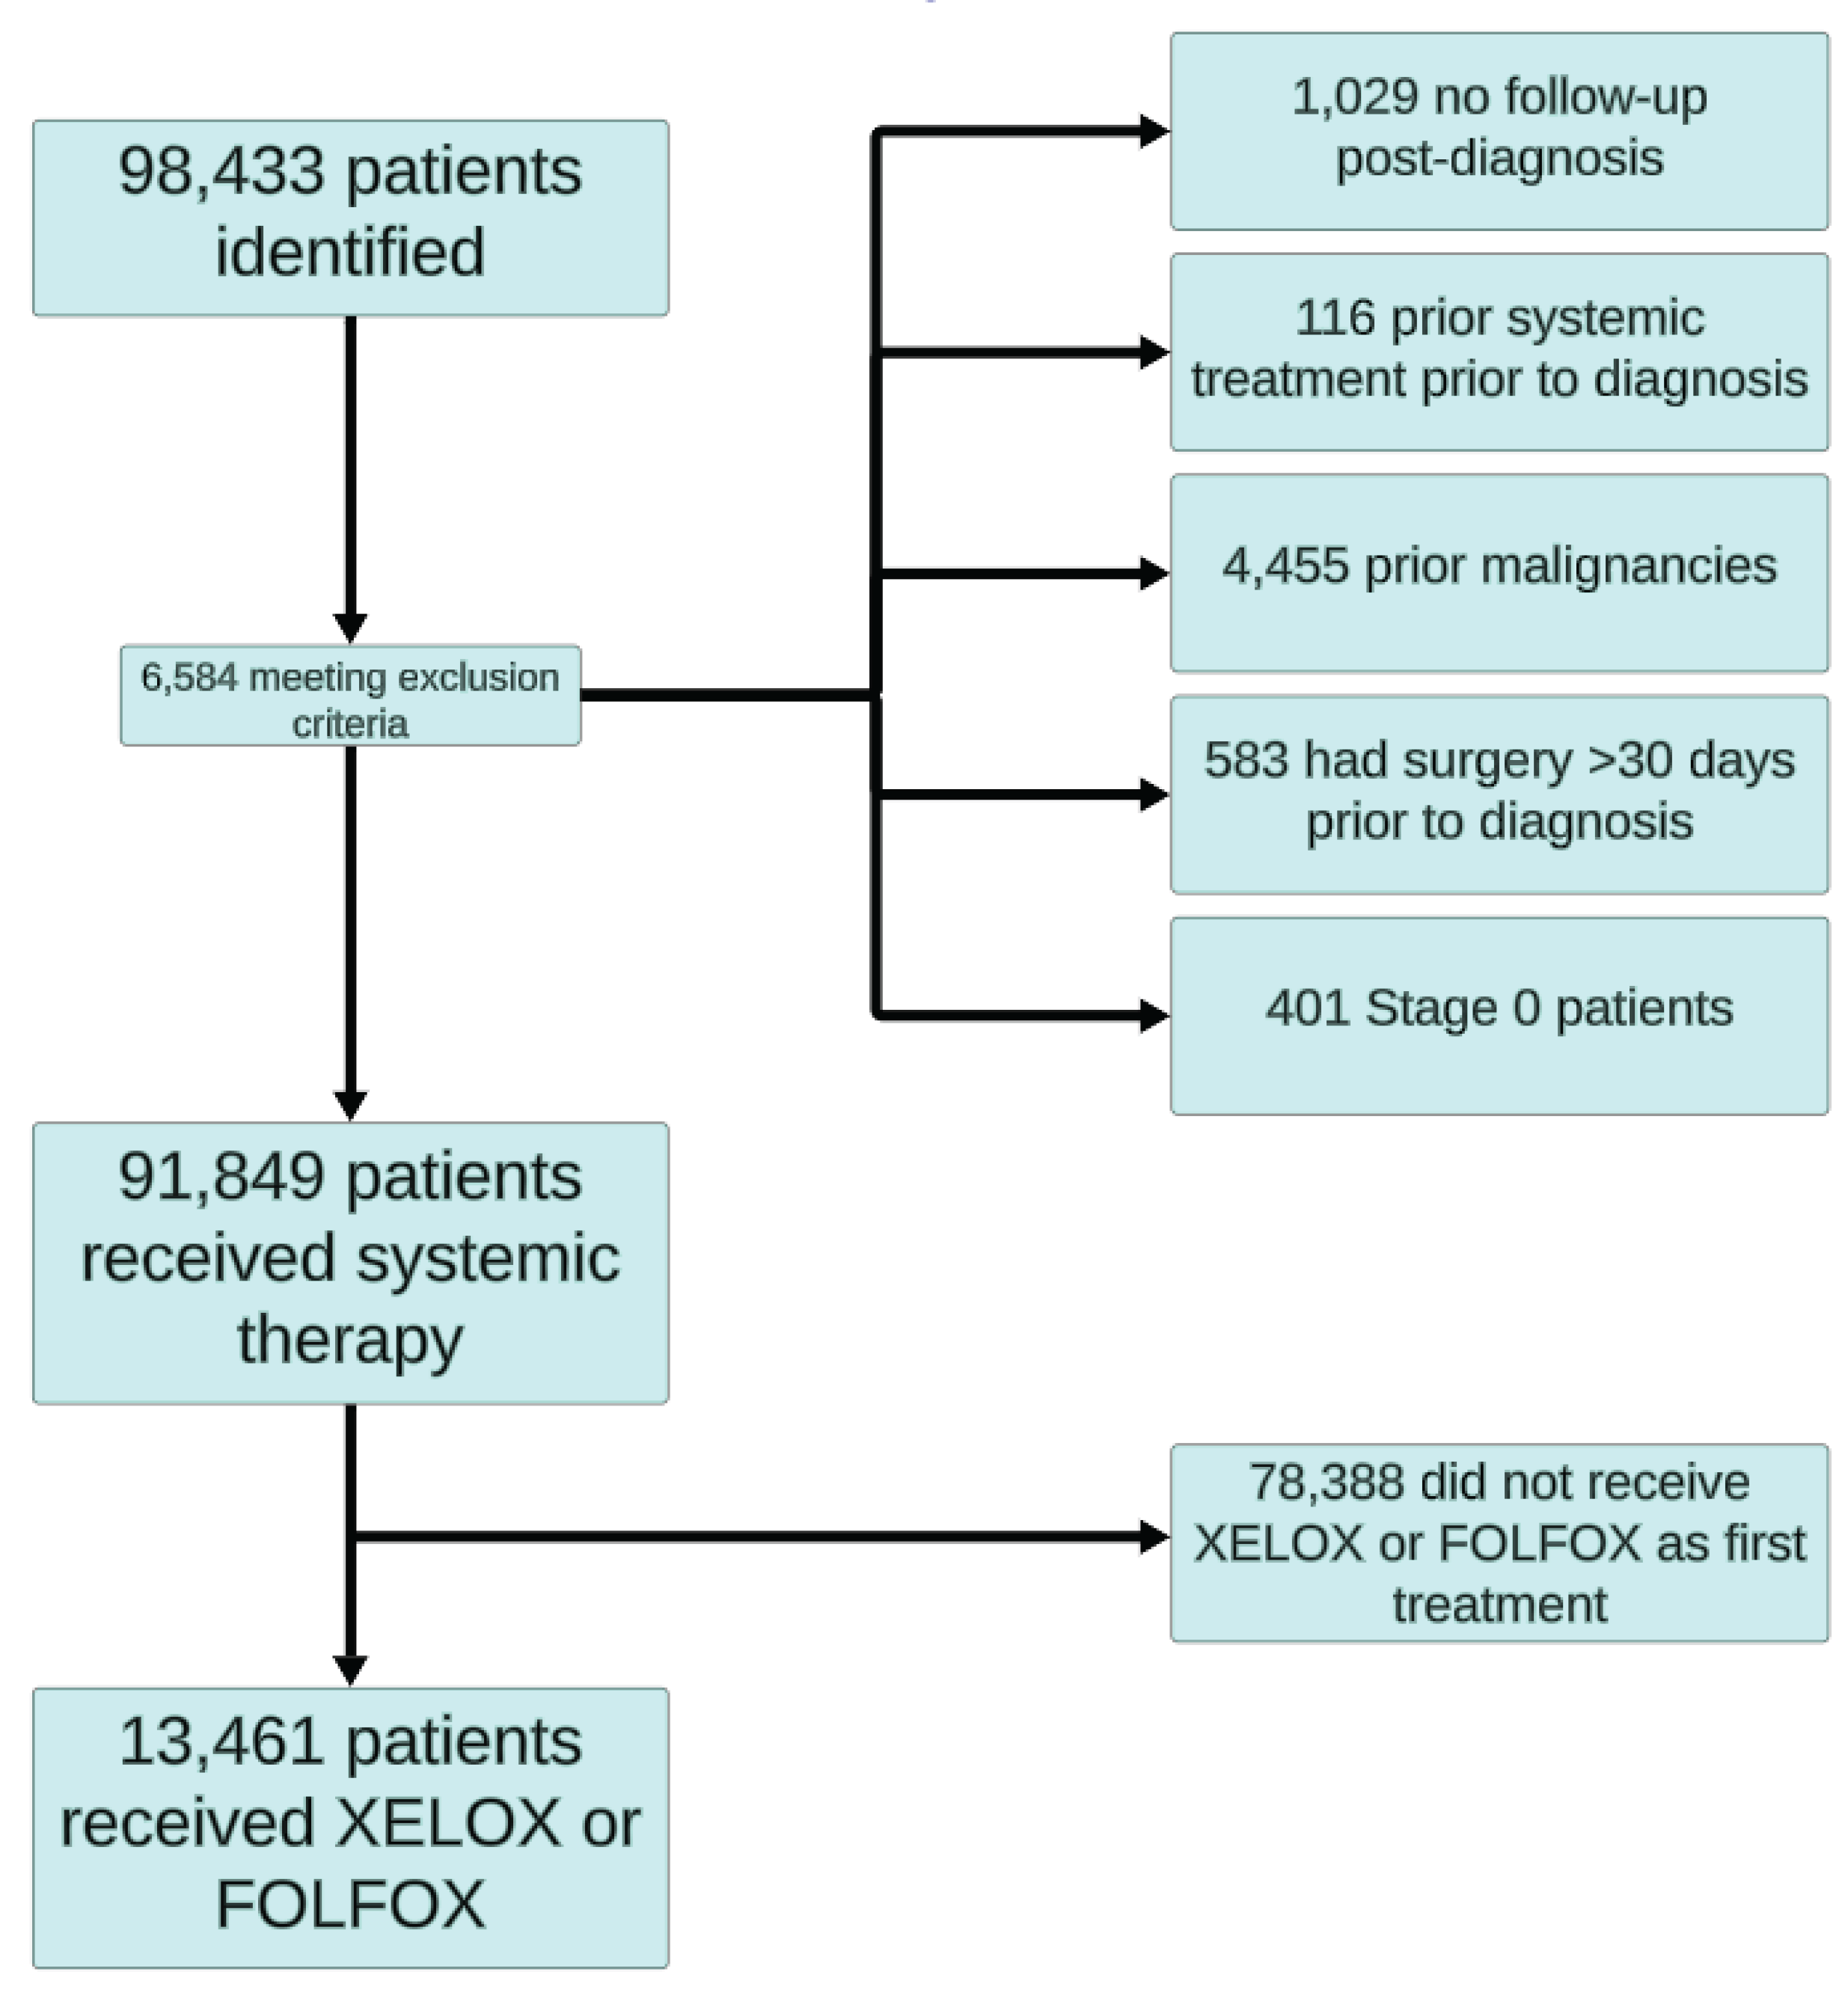
Figure 2.
Survival curves of patients receiving CAPOX and FOLFOX (Stage I-III and Stage IV).
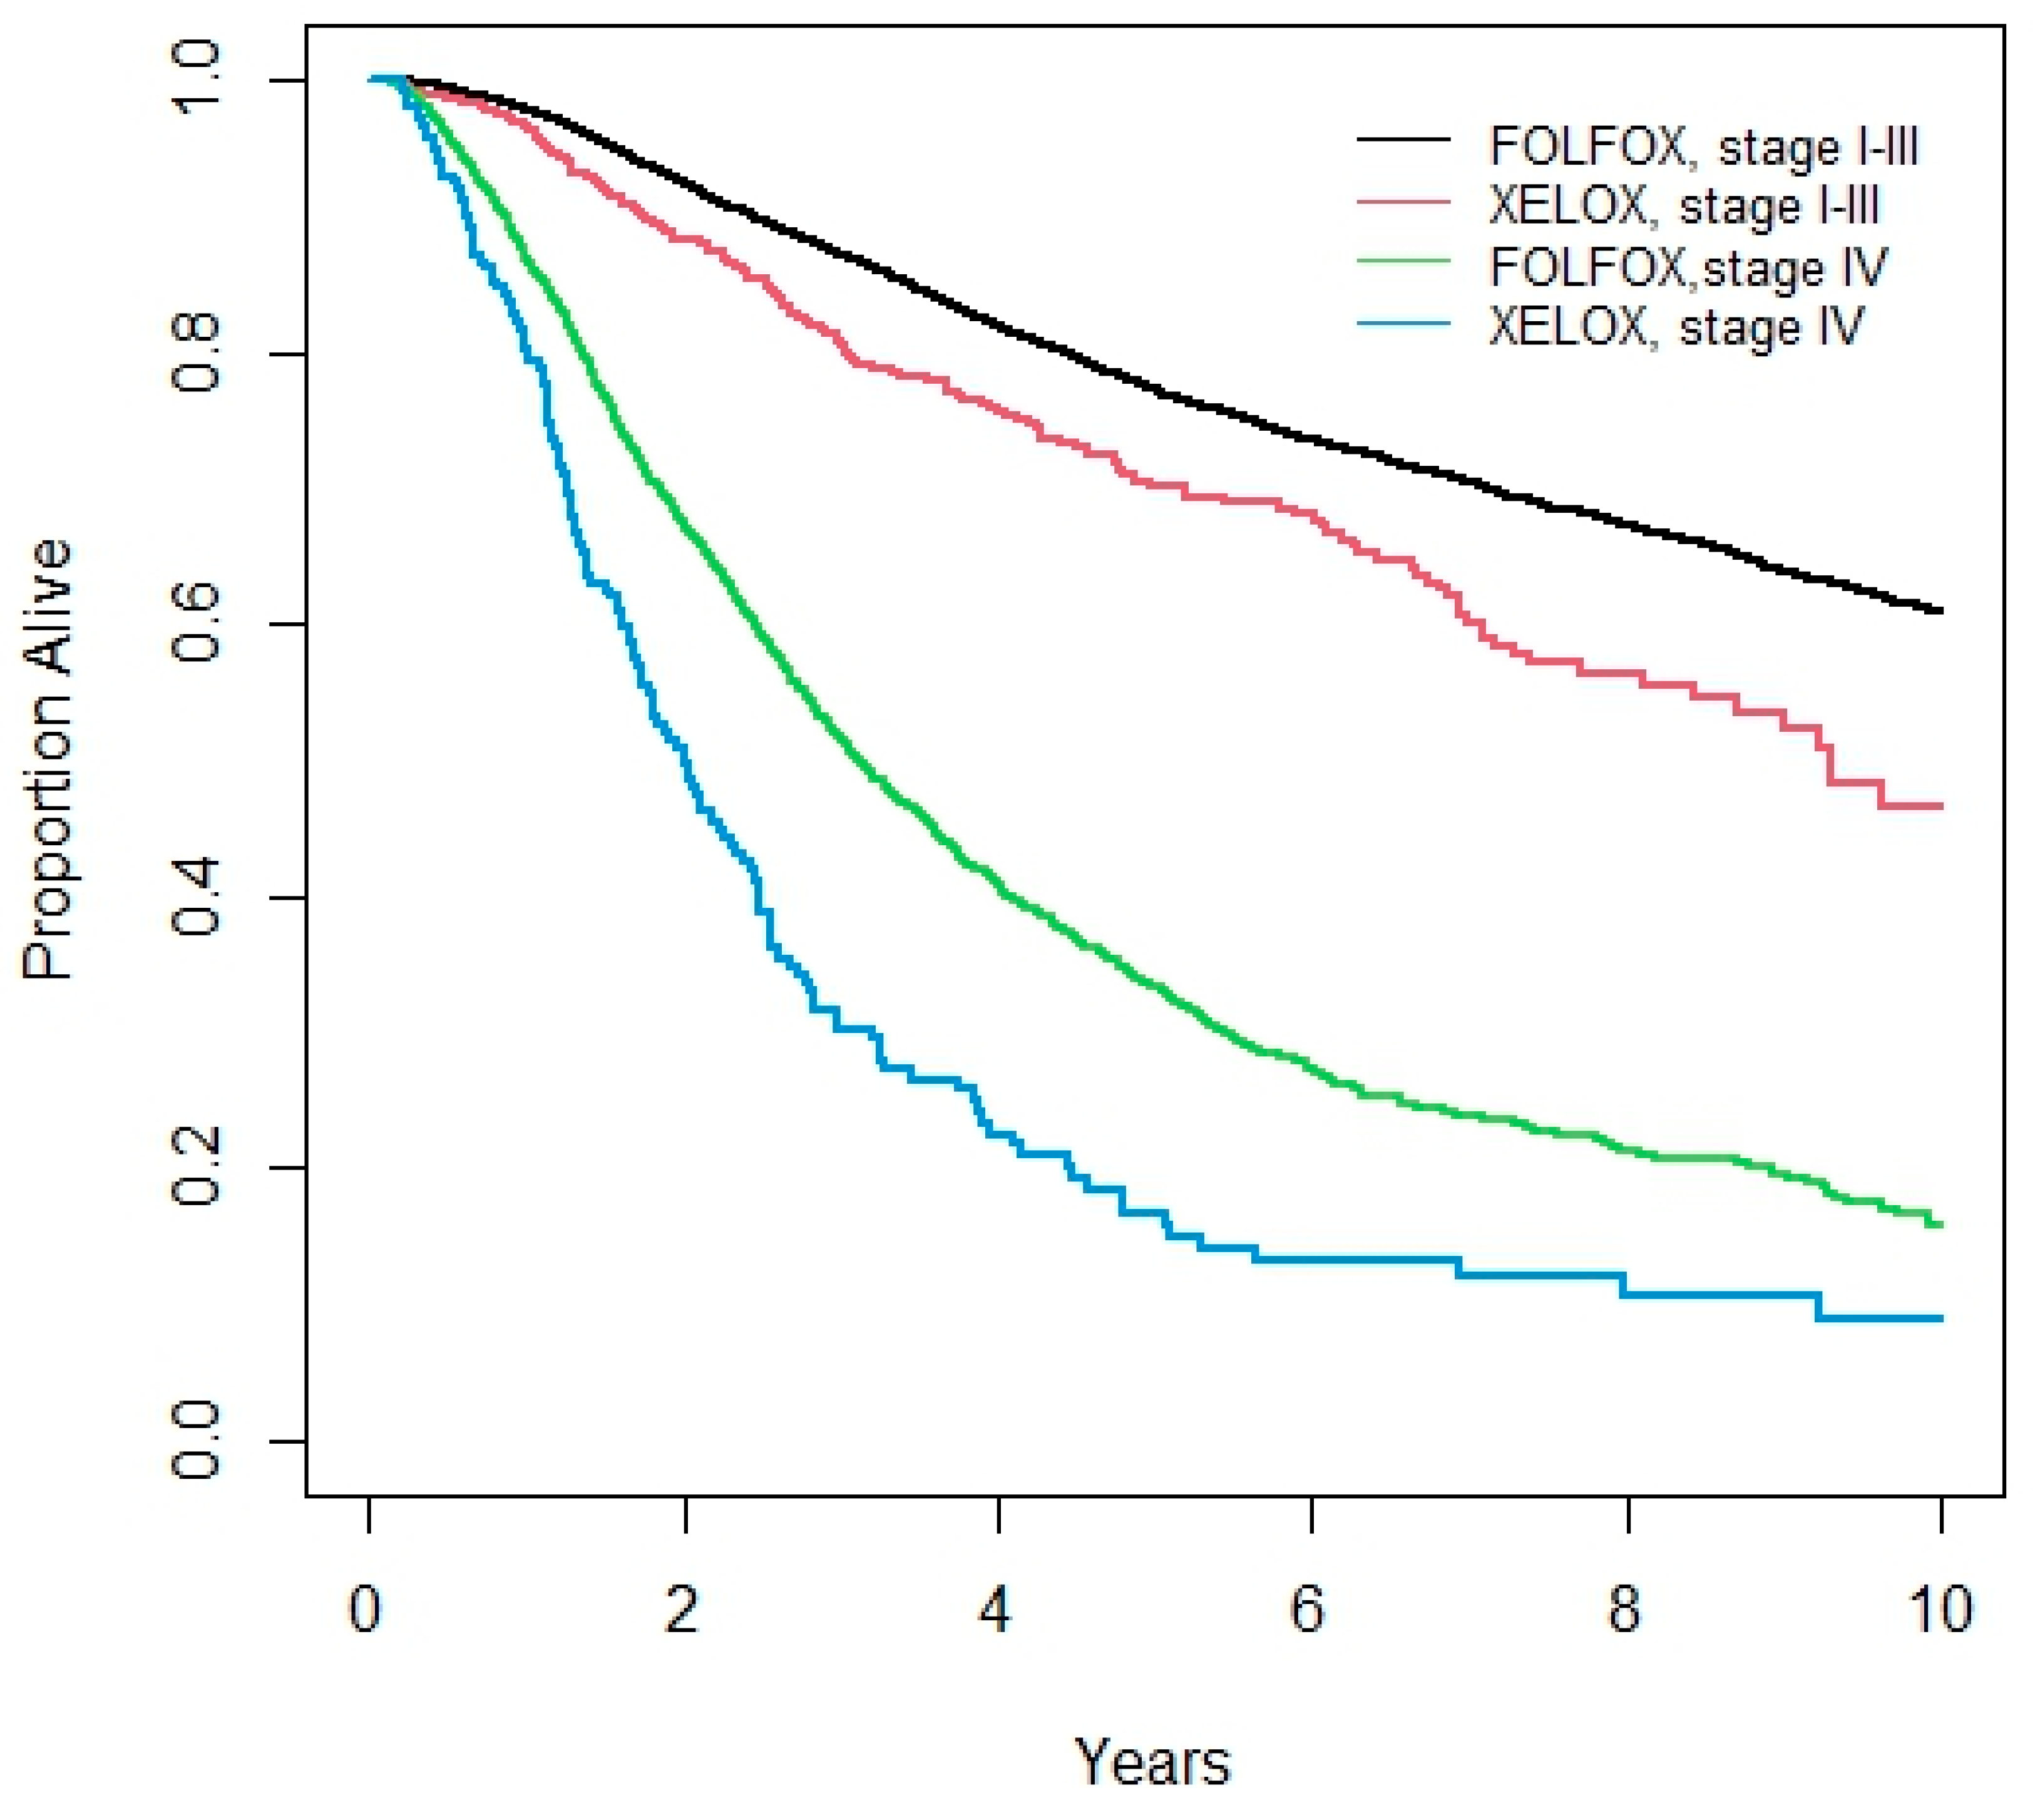

Table 1.
Demographic Data of Patients Receiving CAPOX or FOLFOX.
| Patient Characteristics | Stage 1-3 | Stage 4 | |||||
| CAPOX | FOLFOX | P-value | CAPOX | FOLFOX | P-value | ||
| N | 867 | 9722 | 214 | 1803 | |||
| Age Groups | N (%) 18-39 | 31 (3.6) | 395 (4.1) | 0.003 | 7 (3.3) | 107 (5.9) | <0.001 |
| 40-64 | 480 (55.4) | 5760 (59.3) | 100 (46.7) | 1049 (58.2) | |||
| 65-69 | 185 (21.3) | 1812 (18.6) | 39 (18.2) | 280 (15.5) | |||
| 70-74 | 100 (11.5) | 1177 (12.1) | 27 (12.6) | 212 (11.8) | |||
| 75-79 | 49 (5.7) | 468 (4.8) | 25 (11.7) | 121 (6.7) | |||
| 80+ | 22 (2.5) | 110 (1.1) | 16 (7.5) | 34 (1.9) | |||
| Sex | N (%) Male | 495 (57.1) | 5502 (56.6) | 0.802 | 105 (49.1) | 1030 (57.1) | 0.029 |
| Year of Diagnosis | 2007 | 32 (3.7) | 751 (7.7) | <0.001 | 26 (12.2) | 171 (9.5) | 0.303 |
| 2008 | 43 (5.0) | 955 (9.8) | 23 (10.8) | 176 (9.8) | |||
| 2009 | 33 (3.8) | 959 (9.9) | 13 (6.1) | 121 (6.7) | |||
| 2010 | 35 (4.0) | 958 (9.9) | 13 (6.1) | 111 (6.2) | |||
| 2011 | 57 (5.4) | 890 (9.2) | 15 (7.0) | 153 (8.5) | |||
| 2012 | 53 (6.1) | 960 (9.9) | 15 (7.0) | 200 (11.1) | |||
| 2013 | 46 (5.3) | 965 (9.9) | 11 (5.1) | 200 (11.1) | |||
| 2014 | 64 (7.4) | 910 (9.4) | 13 (6.1) | 206 (11.4) | |||
| 2015 | 84 (9.7) | 889 (9.1) | 31 (14.5) | 157 (8.7) | |||
| 2016 | 228 (26.3) | 761 (7.8) | 28 (13.1) | 160 (8.9) | |||
| 2017 | 202 (23.3) | 724 (7.5) | 26 (12.2) | 148 (8.2) | |||
| Rural | N (%) Yes | 160 (18.5) | 1447 (14.9) | 0.007 | 29 (13.6) | 218 (12.1) | 0.510 |
| Distance to Nearest RCC | Median (IQR) | 15.1 (6.0, 58.1) | 12.6 (5.6, 45.0) | <0.001 | 10.5 (5.1, 34.8) | 10.5 (5.1, 34.8) | 0.393 |
| Charlson Score | n (%) 0 | 204 (23.5) | 2214 (22.8) | 0.794 | 46 (21.5) | 393 (21.8) | 0.511 |
| 1 | 34 (3.9) | 375 (3.9) | 8 (3.7) | 52 (2.9) | |||
| 2+ | 29 (3.3) | 387 (4.0) | 10 (4.7) | 54 (3.0) | |||
| No admission | 600 (69.2) | 6746 (69.4) | 150 (70.1) | 1304 (72.3) | |||
| Hospital Type (for Surgery) | Community | 332 (71.4) | 3388 (74.7) | 86 (64.7) | 648 (71.0) | ||
| Teaching | 102 (21.9) | 992 (21.9) | 47 (35.3) | 241 (26.4) | |||
| Instability Quintile | 1 | 155 (18.1) | 1815 (18.9) | 0.55 | 41 (19.4) | 364 (20.3) | 0.62 |
| 2 | 170 (19.9) | 2038 (21.2) | 37 (17.5) | 356 (19.9) | |||
| 3 | 222 (25.9) | 1975 (20.5) | 41 (19.4) | 306 (17.1) | |||
| 4 | 157 (18.3) | 1868 (19.4) | 45 (21.3) | 372 (20.8) | |||
| 5 | 152 (17.8) | 1935 (20.1) | 47 (22.3) | 394 (22.0) | |||
| Income Quintile | 1 | 153 (17.7) | 1713 (17.7) | 0.595 | 28 (13.1) | 343 (19.1) | 0.104 |
| 2 | 176 (20.4) | 1900 (19.6) | 46 (21.5) | 336 (18.7) | |||
| 3 | 179 (20.7) | 1995 (20.6) | 42 (19.6) | 366 (20.4) | |||
| 4 | 182 (21.0) | 2026 (20.9) | 46 (21.5) | 378 (21.0) | |||
| 5 | 175 (20.2) | 2058 (21.2) | 52 (24.3) | 375 (20.9) | |||
| Deprivation Quintile | 1 | 170 (19.9) | 1979 (20.6) | 0.92 | 55 (26.1) | 384 (21.4) | 0.20 |
| 2 | 183 (21.4) | 1995 (20.7) | 38 (18.0) | 353 (19.7) | |||
| 3 | 180 (21.0) | 1974 (20.5) | 45 (21.3) | 373 (20.8) | |||
| 4 | 166 (19.4) | 1942 (20.2) | 37 (17.5) | 334 (18.6) | |||
| 5 | 157 (18.3) | 1741 (18.1) | 36 (17.1) | 348 (19.4) | |||
| Dependency Quintile | 1 | 121 (14.1) | 1790 (18.6) | <0.001 | 42 (19.9) | 338 (18.9) | 0.58 |
| 2 | 156 (18.2) | 1873 (19.5) | 33 (15.6) | 394 (22.0) | |||
| 3 | 164 (19.2) | 1850 (19.2) | 46 (21.8) | 335 (18.7) | |||
| 4 | 197 (23.0) | 1871 (19.4) | 44 (20.9) | 321 (17.9) | |||
| 5 | 218 (25.5) | 2247 (23.3) | 46 (21.8) | 404 (22.5) | |||
| Ethnicity Quintile | 1 | 225 (26.3) | 2103 (21.8) | <0.001 | 47 (22.3) | 352 (19.6) | 0.22 |
| 2 | 193 (22.6) | 1910 (19.8) | 39 (18.5) | 327 (18.3) | |||
| 3 | 168 (19.6) | 1765 (18.3) | 38 (18.0) | 355 (19.8) | |||
| 4 | 131 (15.3) | 1835 (19.1) | 53 (25.1) | 360 (20.1) | |||
| 5 | 139 (16.2) | 2018 (21.0) | 34 (16.1) | 398 (22.2) | |||
CAPOX: capecitabine-oxaliplatin; FOLFOX: 5-fluorouracil, leucovorin and oxaliplatin; RCC: regional cancer centre; IQR: interquartile range.
Table 2.
Treatment Outcomes among all patients receiving CAPOX or FOLFOX.
| Category | CAPOX | FOLFOX | P-value | |||
| N | 1081 | 11525 | ||||
| 5-year Overall Survival (%) | Stage I-III | 70.1 (66.6, 75.3) | 77.2 (76.2, 78.1) | <0.001 | ||
| Stage IV | 16.6 (11.0, 23.2) | 33.2 (30.7, 35.6) | <0.001 | |||
| Median Weeks on Treatment (Interquartile Range, Highest Number) | Stage I-III | 15 (6-21), 30 | 20 (14-24), 28 | 0.002 | ||
| Stage IV | 22.5 (12-27), 207 | 24 (16-28), 372 | 0.15 | |||
| EDVisits - N (%) | On treatment | 461 (42.7) | 3713 (32.2) | <0.001 | ||
| Within 60 days | 281 (26.0) | 2025 (17.6) | <0.001 | |||
| Hospitalizations - N (%) | On treatment | 435 (40.2) | 3918 (34.0) | <0.001 | ||
| Within 60 days | 164 (15.2) | 1023 (8.9) | <0.001 | |||
| EDVisitsor hospitalization while on-treatment – N (%) | All patients | Within 60 days | 359 (33.2) | 2608 (22.6) | <0.001 | |
| On-treatment | 657 (60.8) | 5870 (50.9) | <0.001 | |||
| Stage I-III | Within 60 days | 283 (32.6) | 2189 (21.9) | <0.001 | ||
| On-treatment | 522 (60.2) | 4688 (48.2) | <0.001 | |||
| Stage IV | Within 60 days | 76 (35.5) | 480 (26.6) | 0.008 | ||
| On-treatment | 135 (63.1) | 1182 (65.6) | 0.49 | |||
CAPOX: capecitabine-oxaliplatin; FOLFOX: 5-fluorouracil, leucovorin and oxaliplatin; ED: emergency department.
Table 3.
Univariate and Multivariate Analyses – ED Visits and Hospitalizations.
| Factor | Comparator | Univariate | Multivariate | ||
| Odds Ratio (95% CI) | P-Value | Odds Ratio (95% CI) | P-Value | ||
| Age Groups | 18-39 | Reference | 0.3 | Reference | 0.354 |
| 40-64 | 0.80 (0.67, 0.94) | 0.84 (0.70, 1.00) | |||
| 65-69 | 0.81 (0.68, 0.98) | 0.86 (0.71, 1.04) | |||
| 70-74 | 0.81 (0.67, 0.99) | 0.91 (0.74, 1.11) | |||
| 75-79 | 0.79 (0.63, 0.99) | 0.91 (0.72, 1.15) | |||
| 80-84 | 0.82 (0.59, 1.16) | 0.84 (0.59, 1.21) | |||
| 85+ | 0.66 (0.28, 1.54) | 0.57 (0.23, 1.42) | |||
| Sex | Male vs Female | 0.99 (0.93, 1.06) | 0.83 | 0.99 (0.93, 1.07) | 0.877 |
| Year of Diagnosis | / year | 1.20 (1.19, 1.22) | <0.001 | 1.21 (1.20, 1.22) | <0.001 |
| Income Quintile | 1 | Reference | 0.16 | Reference | 0.824 |
| 2 | 0.92 (0.82, 1.03) | 0.98 (0.87, 1.10) | |||
| 3 | 0.90 (0.81, 1.01) | 0.95 (0.84, 1.06) | |||
| 4 | 0.91 (0.81, 1.01) | 0.97 (0.87, 1.09) | |||
| 5 | 0.87 (0.78, 0.97) | 0.94 (0.84, 1.06) | |||
| Rural | Yes vs No | 1.23 (1.12, 1.35) | <0.001 | 1.30 (1.17, 1.43) | <0.001 |
| Charlson Score | 0 | Reference | 0.057 | Reference | 0.017 |
| 1 | 0.97 (0.80, 1.17) | 0.86 (0.70, 1.05) | |||
| 2+ | 1.29 (1.07, 1.56) | 1.23 (1.00, 1.50) | |||
| No Admissionⱡ | 1.04 (0.96, 1.13) | 0.94 (0.86, 1.03) | |||
| Site of Primary Lesion | Cecum | Reference | <0.001 | Reference | <0.001 |
| Ascending colon | 0.84 (0.74, 0.96) | 0.87 (0.76, 1.00) | |||
| Hepatic flexure | 0.87 (0.69, 1.10) | 0.97 (0.76, 1.24) | |||
| Transverse colon | 0.99 (0.83, 1.18) | 0.99 (0.82, 1.19) | |||
| Splenic flexure | 0.83 (0.66, 1.04) | 0.85 (0.67, 1.08) | |||
| Descending colon | 0.97 (0.81, 1.16) | 0.97 (0.80, 1.18) | |||
| Sigmoid colon | 0.86 (0.77, 0.96) | 0.90 (0.80, 1.02) | |||
| Overlapping region | 1.87 (0.45, 7.85) | 2.93 (0.67, 12.86) | |||
| Colon NOS | 1.45 (0.77, 2.75) | 1.12 (0.57, 2.21) | |||
| Rectosigmoid junction | 1.29 (1.13, 1.47) | 1.32 (1.14, 1.52) | |||
| Rectum NOS | 2.34 (2.09, 2.63) | 2.45 (2.16, 2.76) | |||
| Stage | 1 | Reference | <0.001 | Reference | <0.001 |
| 2 | 0.58 (0.41, 0.80) | 0.62 (0.44, 0.87) | |||
| 3 | 0.47 (0.34, 0.64) | 0.46 (0.33, 0.63) | |||
| 4 | 0.95 (0.68, 1.32) | 0.99 (0.70, 1.39) | |||
| Unknown | 0.27 (0.19, 0.38) | 0.60 (0.42, 0.86) | |||
| 1st Systemic Treatment Received | CAPOX vs FOLFOX | 1.54 (1.36, 1.74) | <0.001 | 1.05 (0.92, 1.20) | 0.466 |
CAPOX: capecitabine-oxaliplatin; FOLFOX: 5-fluorouracil, leucovorin and oxaliplatin; NOS: not otherwise specified.
Table 4.
Univariate and Multivariate Analyses – Overall Survival.
| Factor | Comparator | Univariate | Multivariate | ||
| Odds Ratio (95% CI) | P-Value | Odds Ratio (95% CI) | P-Value | ||
| Age Groups | 18-39 | Reference | <0.001 | Reference | <0.001 |
| 40-64 | 0.94 (0.80, 1.10) | 0.97 (0.83, 1.14) | |||
| 65-69 | 1.09 (0.92, 1.29) | 1.12 (0.94, 1.32) | |||
| 70-74 | 1.46 (1.23, 1.73) | 1.51 (1.27, 1.80) | |||
| 75-79 | 1.99 (1.66, 2.39) | 1.93 (1.60, 2.32) | |||
| 80-84 | 2.69 (2.11, 3.44) | 2.36 (1.84, 3.02) | |||
| 85+ | 4.84 (2.90, 8.09) | 3.93 (2.34, 6.58) | |||
| Sex | Male vs Female | 1.08 (1.02, 1.15) | 0.011 | 1.08 (1.01, 1.15) | 0.016 |
| Year of Diagnosis | / year | 1.05 (1.04, 1.07) | <0.001 | 1.05 (1.04, 1.06) | <0.001 |
| Income Quintile | 1 | Reference | 0.015 | Reference | 0.04 |
| 2 | 1.14 (1.04, 1.26) | 0.97 (0.88, 1.06) | |||
| 3 | 1.09 (0.99, 1.20) | 0.97 (0.88, 1.07) | |||
| 4 | 1.08 (0.98, 1.18) | 0.89 (0.81, 0.98) | |||
| 5 | 0.99 (0.90, 1.09) | 0.89 (0.80, 0.97) | |||
| Rural | Yes vs No | 1.08 (1.00, 1.17) | 0.065 | 1.15 (1.06, 1.24) | 0.001 |
| Charlson Score | 0 | Reference | 0.006 | Reference | 0.041 |
| 1 | 1.20 (1.03, 1.41) | 1.16 (0.99, 1.36) | |||
| 2+ | 1.10 (0.93, 1.28) | 1.09 (0.93, 1.28) | |||
| No Admissionⱡ | 0.96 (0.89, 1.02) | 0.96 (0.90, 1.03) | |||
| Site of Primary Lesion | Cecum | Reference | <0.001 | Reference | <0.001 |
| Ascending colon | 0.95 (0.85, 1.06) | 0.95 (0.85, 1.06) | |||
| Hepatic flexure | 0.95 (0.79, 1.14) | 0.98 (0.82, 1.18) | |||
| Transverse colon | 1.01 (0.88, 1.16) | 0.99 (0.86, 1.14) | |||
| Splenic flexure | 0.86 (0.72, 1.04) | 0.81 (0.67, 0.97) | |||
| Descending colon | 0.72 (0.61, 0.85) | 0.70 (0.60, 0.83) | |||
| Sigmoid colon | 0.74 (0.67, 0.81) | 0.72 (0.65, 0.79) | |||
| Overlapping region | 1.01 (0.38, 2.70) | 1.01 (0.38, 2.69) | |||
| Colon NOS | 1.92 (1.25, 2.97) | 1.22 (0.79, 1.89) | |||
| Rectosigmoid junction | 0.79 (0.70, 0.88) | 0.72 (0.64, 0.81) | |||
| Rectum NOS | 0.72 (0.65, 0.79) | 0.73 (0.66, 0.81) | |||
| Stage | 1 | Reference | <0.001 | Reference | <0.001 |
| 2 | 0.95 (0.66, 1.36) | 0.99 (0.69, 1.42) | |||
| 3 | 1.35 (0.96, 1.91) | 1.36 (0.97, 1.92) | |||
| 4 | 5.50 (3.89, 7.77) | 5.45 (3.85, 7.70) | |||
| Unknown | 1.66 (1.16, 2.37) | 1.99 (1.39, 2.85) | |||
| 1st Systemic Treatment Received | CAPOX vs FOLFOX | 1.69 (1.52, 1.88) | <0.001 | 1.42 (1.27, 1.58) | <0.001 |
CAPOX: capecitabine-oxaliplatin; FOLFOX: 5-fluorouracil, leucovorin and oxaliplatin.
Disclaimer/Publisher’s Note: The statements, opinions and data contained in all publications are solely those of the individual author(s) and contributor(s) and not of MDPI and/or the editor(s). MDPI and/or the editor(s) disclaim responsibility for any injury to people or property resulting from any ideas, methods, instructions or products referred to in the content. |
© 2025 by the authors. Licensee MDPI, Basel, Switzerland. This article is an open access article distributed under the terms and conditions of the Creative Commons Attribution (CC BY) license (http://creativecommons.org/licenses/by/4.0/).
Copyright: This open access article is published under a Creative Commons CC BY 4.0 license, which permit the free download, distribution, and reuse, provided that the author and preprint are cited in any reuse.


