
Submitted:
27 June 2025
Posted:
30 June 2025
You are already at the latest version
Abstract
This study investigates the extent to which the North Atlantic Oscillation (NAO) modulates daily surface-level concentrations of ozone (O₃), nitrogen dioxide (NO₂), and sulfur dioxide (SO₂) on São Miguel Island, Azores, between 2017 and 2021. Using validated data from two air quality monitoring stations, São Gonçalo (SG) (urban background) and Ribeira Grande (RG) (semi-urban), we applied descriptive statistics, seasonal Pearson correlations, and robust linear regression models to assess pollutant responses to NAO variability. Results reveal a significant and positive association between NAO phases and O₃ concentrations, particularly in spring and summer. NO₂ levels exhibited a strong negative correlation with NAO during summer in urban settings, indicating enhanced atmospheric dispersion. In contrast, SO₂ concentrations showed weak and inconsistent relationships with the NAO index, likely reflecting the influence of local and episodic sources. These findings demonstrate that large-scale synoptic drivers such as the NAO can significantly modulate pollutant dynamics in island environments and should be integrated into air quality forecasting and environmental health planning strategies in small island territories.
Keywords:
North Atlantic Oscillation
; Tropospheric ozone
; Nitrogen dioxide
; Sulfur dioxide
; Synoptic meteorology
; Robust regression
; Air quality
; Azores
; Island climate
1. Introduction
Atmospheric pollutants such as ozone (O₃), nitrogen dioxide (NO₂), and sulfur dioxide (SO₂) are key contributors to environmental degradation and public health risks. While their dynamics are well documented in continental regions, their behavior in remote island environments, particularly those exposed to oceanic and synoptic scale influences, remains underexplored. In these remote Atlantic environments, long-range transport and large-scale atmospheric circulation may dominate over local emissions, especially for secondary pollutants like ozone. Long-term observational records show that baseline ozone concentrations in the lower troposphere have been gradually increasing across the Northern Hemisphere over recent decades. [1] identified persistent upward trends in background ozone levels, attributed in part to hemispheric-scale transport and global precursor emissions. These trends underscore the importance of investigating the synoptic and interannual factors such as the North Atlantic Oscillation that may modulate or amplify ozone variability in remote locations. Due to their remote oceanic location, low population density, and limited industrial activity, the Azores offer an ideal setting to assess climate-driven modulation of surface pollutants. Official monitoring data from São Miguel Island (2017–2021) confirm the absence of legal exceedances for O₃, NO₂, and SO₂, highlighting the region’s suitability as a natural atmospheric observatory.
In the North Atlantic sector, the North Atlantic Oscillation (NAO) represents the dominant mode of interannual climate variability. It modulates storm tracks, wind patterns, and vertical motion, thereby influencing cloudiness, solar radiation, and the long-range transport or stagnation of air masses. [2] identified a strong relationship between NAO phases and the transatlantic transport of anthropogenic ozone, showing that positive NAO conditions enhance pollutant export from North America to the North Atlantic. Several studies have established associations between NAO phases and air pollution episodes in mainland Europe and North America. For instance, [3] showed that during positive NAO phases, surface ozone increases by 6–10 parts per billion volume (ppbv) across northern Europe, whereas negative phases lead to reductions of 4–10 ppbv due to weakened westerlies and pollutant accumulation. Similarly, [4] used satellite data and model simulations to demonstrate that NAO-positive phases are associated with enhanced ozone concentrations and reduced NO₂ levels over Europe, driven by stronger westerly circulation patterns that disperse primary pollutants and transport ozone-rich air from the Atlantic. Also, [5] concludes that the influence of the North Atlantic Oscillation on air pollutant variability has been documented across the North Atlantic region. In the Azores, data from Faial (2006–2014) show that positive NAO phases are associated with higher tropospheric O₃ concentrations in all seasons, indicating a seasonal modulation of background ozone potentially driven by synoptic-scale transport patterns. Additionally, [2] identified a strong correlation (r ≈ 0.57 overall, r ≈ 0.72 in spring) between the NAO and the transatlantic transport of anthropogenic ozone observed at Sable Island (North Atlantic), highlighting the influence of the NAO on the seasonal modulation of ozone. This mechanism was further quantified by [6], who demonstrated through 5-year GEOS-CHEM simulations that positive NAO phases enhance the transatlantic transport of North American ozone, contributing up to 10–20 ppbv to surface ozone levels in Europe during major events. Their results also suggest that up to 20% of European air quality standard exceedances (55 ppbv, 8-hour average) in the summer of 1997 would not have occurred without this transatlantic influence. This finding was further supported by [7], who used regional chemistry–climate models to show that positive NAO phases enhance the zonal transport of air pollutants across the North Atlantic, while negative NAO phases promote stagnation and accumulation of pollutants over Europe and adjacent oceanic regions. Despite several studies linking NAO phases to ozone variability in continental and regional contexts, there remains a notable gap in quantitative modeling focused specifically on mid-oceanic island environments such as the Azores. Most existing work in the region is based on descriptive analyses or limited temporal records. To date, few studies have employed atmospheric chemistry transport models (CTMs) or regression-based statistical frameworks to assess how NAO modulates pollutant behavior over isolated oceanic locations. Comparable research in other island regions, such as the Canary Islands or Madeira, could serve as valuable analogues. For example, regional-scale modeling over the eastern North Atlantic has shown that NAO-driven circulation patterns significantly influence background ozone levels and long-range pollutant advection in these archipelagos [8,9]. These findings reinforce the need to investigate similar mechanisms over the Azores, which occupy a uniquely strategic position within the NAO pressure dipole and are frequently exposed to transatlantic air masses. These dynamics are particularly relevant for understanding pollutant behavior in the mid-Atlantic environment of the Azores. However, the influence of the NAO on pollutant levels in small oceanic islands remains poorly understood. These atmospheric teleconnections extend beyond ozone: [10] highlighted the synergistic influence of the NAO on the variability of aerosols and trace gases such as O₃ and CO, emphasizing that large-scale circulation patterns strongly modulate atmospheric composition over the North Atlantic region. Recent studies have extended this understanding to other classes of air pollutants. [11] found that positive phases of the NAO significantly reduce benzo[a]pyrene (BaP) concentrations across Europe, especially in western and Atlantic-influenced regions. These results highlight the generality of NAO induced dispersion mechanisms affecting various pollutant types. [12] further demonstrated that the NAO significantly influences the precipitation regime in the Azores, particularly in Ponta Delgada, with distinct impacts observed in both winter and summer seasons. These regional effects reinforce the relevance of investigating whether the NAO also plays a role in modulating surface concentrations of key air pollutants in the Azorean atmosphere. In addition to synoptic influences, local factors such as topography and vertical mixing also play an important role in ozone variability. [13] demonstrated that altitude exerts a measurable influence on lower tropospheric ozone levels across western Europe, with significant vertical gradients and temporal variability. Such findings emphasize the need to consider both regional-scale circulation and orographic effects in interpreting ozone behavior in complex atmospheric environments like the Azores.
The Azores archipelago, located at the approximate nodal point of the NAO pressure dipole, is uniquely positioned to assess the synoptic control of pollutant variability in a remote marine-influenced context. São Miguel Island, the largest and most urbanized in the archipelago, presents contrasting emission profiles and meteorological regimes suitable for such analysis.
This study aims to quantify the relationship between NAO index values and surface concentrations of O₃, NO₂, and SO₂ on São Miguel Island from 2017 to 2021. A total of 1,826 daily observations per station were analyzed. By combining descriptive analysis, seasonal correlation, and robust linear regression models, we assess how large-scale atmospheric variability modulates pollutant behavior across urban and semi-urban sites in the mid-North Atlantic.
2. Materials and Methods
This section describes the data sources, monitoring sites, and statistical methods used to investigate the relationship between North Atlantic Oscillation phases and air pollutant concentrations in the Azores. We used validated air quality and meteorological data from two monitoring stations on São Miguel Island between 2017 and 2021. The analysis includes descriptive statistics, seasonal correlation, and robust regression models, aimed at quantifying the influence of synoptic-scale variability on surface levels of O₃, NO₂, and SO₂.
The study was conducted on São Miguel Island, the largest and most populated island of the Azores archipelago (Portugal), located in the mid-North Atlantic. The Azores are a Portuguese archipelago located in the North Atlantic Ocean, between approximately 36°55′ and 39°43′ N latitude and 24°46′ to 31°16′ W longitude. The archipelago comprises nine volcanic islands, geographically divided into three groups: the Eastern Group (São Miguel and Santa Maria), the Central Group (Terceira, Graciosa, São Jorge, Pico, and Faial), and the Western Group (Flores and Corvo). Situated roughly 1500 km west of Lisbon and about 3900 km from the eastern coast of North America, the Azores occupy a strategic mid-Atlantic position, as illustrated in Figure 1. This location, combined with the island’s volcanic origin and oceanic isolation, makes the Azores a unique natural laboratory for atmospheric, oceanographic, and climate studies.
The Azores Archipelago, encompassing a total area of 2,322 km², is strongly influenced by the Azores High, a semi-permanent subtropical high-pressure system situated over the North Atlantic. This atmospheric feature exerts a dominant control over the regional climate of the archipelago and affects broader atmospheric circulation patterns across the North Atlantic basin. Its presence shapes key meteorological conditions such as wind regimes, cloud cover, and precipitation distribution throughout the year.
2.1. Data Sources and Monitoring Sites
Two official air quality monitoring stations were selected for analysis. To characterize air quality in the Azores Autonomous Region, we used official data reported in the Air Quality Reports of the Azores 2017–2021, published by the Regional Secretariat for the Environment and Climate Action [14,15,16,17,18]. These reports provide continuous measurements of atmospheric pollutants including ozone, nitrogen dioxide, sulfur dioxide, and particulate matter (PM₁₀ and PM2.5) collected from two fixed stations located on São Miguel Island: São Gonçalo (urban background) and Ribeira Grande (urban traffic).
The São Gonçalo station, located in Ponta Delgada, is representative of urban background exposure, while the Ribeira Grande station reflects traffic-influenced conditions. This dual typology enables a comparative assessment of pollutant behavior under distinct urban dynamics. Both stations have been part of the regional air monitoring network since 2012.
These official reports also include meteorological parameters such as temperature, solar radiation, and wind direction, which are essential for understanding the photochemical formation and dispersion of tropospheric ozone. The consistent predominance of SE–SSW winds and the seasonal peaks in radiation observed in São Miguel supports the evaluation of climatic modulation mechanisms such as the North Atlantic Oscillation.
Notably, no exceedances of legal thresholds for O₃, NO₂ or SO₂ were recorded in any of the analyzed years, further reinforcing the status of the Azores as a natural atmospheric laboratory. This context favors the investigation of large-scale climate influences, minimizing confounding effects from local anthropogenic emissions.
The monitoring infrastructure used in this study is illustrated in Figure 2.
Both stations are operated by the Regional Secretariat for the Environment and Climate Change (RSECC) of the Azorean Government and follow the European Air Quality Directive Requirements.
Daily mean surface concentrations (24-hour averages) of O₃, NO₂, and SO₂ were collected from both stations for the period spanning 1 January 2017 to 31 December 2021 (https://ambiente.azores.gov.pt/qualidadedoar/DadosValidados.aspx). Data were obtained in µg/m³ and had been previously validated by the Regional Secretariat for the Environment and Climate Change (RSECC) according to established quality control protocols, before being processed for statistical analysis. All pollutant measurements were previously validated and quality-assured by the Regional Secretariat for the Environment and Climate Change, in compliance with EU data validation protocols. The monitoring stations are equipped with automatic analyzers that enable continuous and real-time measurements. Each pollutant is measured using a dedicated analyzer and its corresponding measurement principle. For SO₂, the UV fluorescence method is used, certified under TUV Report 936/21206773/C in accordance with EN 14212; for NO₂, the chemiluminescence method is applied, certified under TUV Report 936/21205818/C in accordance with EN 14211 and for O₃, the UV absorption method is employed, certified under TUV Report 936/21205818/C in accordance with EN 14625.
No missing data were detected in the O₃ series for São Gonçalo or Ribeira Grande, ensuring uninterrupted time series analysis. Minor gaps in the NO₂ and SO₂ datasets (<2% of values) were addressed using linear interpolation, thereby preserving continuity without significantly affecting overall temporal variability or trend structure.
The daily NAO index used in this study was retrieved from the NOAA Physical Sciences Laboratory (https://psl.noaa.gov/data/timeseries/daily/NAO/). The index is derived from the difference in normalized sea level pressure between Lisbon, Portugal, and Stykkishólmur/Reykjavík, Iceland for the period spanning 1 January 2017 to 31 December 2021. The NAO index, retrieved from the National Oceanic and Atmospheric Administration (NOAA) Physical Sciences Laboratory, is already normalized by definition and was used in its original form without additional transformation. Pollutant concentrations (O₃, NO₂, and SO₂) were analyzed in their reported units (µg/m³), without the application of smoothing, detrending, or normalization procedures. This approach ensured interpretability of the model coefficients while preserving the natural variability present in the original time series.
2.2. Statistical Analysis and Modelling Approach
All datasets were merged based on their respective daily timestamps. Descriptive statistics, seasonal averages, Pearson correlations by season, and robust linear regression (RLM) models were performed in Python. RLM included predictors: NAO index, month (categorical), and season (categorical). Model assumptions were verified via residual analysis. Robust linear regression was performed using the RLM function from the statsmodels Python library (version 0.14.0), with Huber weighting to minimize the influence of outliers and ensure reliable estimation under non-normal error distributions. The following equations detail the statistical formulations used in this study, including the Pearson correlation coefficient (Equation 1), the structure of the robust linear regression model (Equation 2), and the Huber loss function applied for robust coefficient estimation (Equation 3).
The Pearson correlation coefficient (r) used to measure the linear association between the NAO index and pollutant concentrations is calculated as:
where represents the NAO index, the pollutant concentration, and the respective means, and n the number of observations.
The robust linear model takes the form:
where is the observed value of the dependent variable (daily concentration of O₃, NO₂, or SO₂) on day i, represents the expected value of y when all predictors are zero, is the estimated effect of the North Atlantic Oscillation (NAO) index on day I, is the estimated effect of the calendar month (categorical variable), capturing monthly variation, is the estimated effect of the meteorological season (categorical variable: winter, spring, etc.) and is the random error term (residual) on day i, representing the unexplained variability in .
yi = β0 + β1 ⋅ NAOi + β2 ⋅ Monthi + β3 ⋅ Seasoni + ϵi
The regression coefficients were estimated by minimizing the Huber loss function:
where u is the residual and δ is the tuning constant (1.345 by default in statsmodels).
Given the presence of moderate day-to-day variability in pollutant concentrations and the potential influence of extreme meteorological or emission events particularly in a remote island environment a RLM approach was adopted instead of ordinary least squares (OLS). RLM is less sensitive to outliers and heteroscedasticity, offering more stable and reliable coefficient estimates when classical assumptions of OLS may not be met. This makes RLM especially suitable for environmental time series that may contain irregular disturbances.
3. Results
This section presents the results of the statistical analysis exploring the relationship between the North Atlantic Oscillation index and surface-level concentrations of ozone, nitrogen dioxide, and sulfur dioxide on São Miguel Island. The results are structured in five parts: (1) baseline pollutant concentrations and urban–semiurban contrasts, (2) seasonal and interannual patterns, (3) seasonal correlations with the NAO index, (4) regression modelling using robust linear models, and (5) residual diagnostics. This approach allows for a comprehensive assessment of pollutant variability and its modulation by large-scale atmospheric circulation.
3.1. Pollutant Concentrations and Urban–Semiurban Differences
This section presents the results of the statistical analyses exploring the relationship between the North Atlantic Oscillation (NAO) index and surface-level concentrations of O₃, NO₂, and SO₂ on São Miguel Island.
We begin by summarizing the descriptive statistics and contrasting pollutant levels between the urban and semi-urban monitoring sites. Seasonal and interannual patterns are then illustrated, followed by correlation results and robust linear regression models. Residual diagnostics are included to assess model performance.
Table 1 summarizes the mean and standard deviation of daily pollutant concentrations at the São Gonçalo (SG) and Ribeira Grande (RG) stations, highlighting the urban–semi-urban contrast in O₃ and NO₂ levels over the study period.
To complement the summary statistics, Figure 3 and Figure 4 illustrates the daily variability of NO₂, O₃, and SO₂ concentrations over the 2017–2021 period for the São Gonçalo and Ribeira Grande stations respectively. The temporal profiles reveal distinct seasonal and interannual patterns, with O₃ consistently presenting the highest baseline values. Notably, São Gonçalo shows sharper NO₂ peaks, reflecting urban emission sources, whereas SO₂ exhibits greater variability in Ribeira Grande, potentially due to sporadic local events or less atmospheric dilution. These trends reinforce the site-specific nature of pollutant behavior in the mid-Atlantic Island context.
While the previous section characterized the overall levels and site-specific differences in pollutant concentrations, it is equally important to understand how these values fluctuate over time. The following subsection explores seasonal and interannual patterns in both pollutant levels and the NAO index, providing insight into potential synoptic scale influences that may underline the observed site contrasts.
3.2. Seasonal and Interannual Patterns
Understanding the temporal dynamics of both pollutant concentrations and the NAO index is essential to identifying potential seasonal couplings and long-range atmospheric influences. This subsection examines intra- and interannual variability, highlighting key patterns in pollutant behavior and climate oscillations over the 2017–2021 period. These insights provide a basis for assessing potential statistical associations in subsequent analyses.
Time series revealed seasonal patterns, with NAO varying most in winter Figure 5.
Boxplots and seasonal means supported this trend, Figure 6.
As shown in Figure 6.a, NO₂ concentrations were notably higher in the urban station (São Gonçalo), reflecting stronger vehicular emissions. In contrast, Figure 6.b indicates that SO₂ concentrations were more variable across both sites, with no clear seasonal trend.
The observed seasonal fluctuations in both pollutant concentrations and NAO index suggest potential covariation, particularly during spring and summer. To assess the strength and direction of these associations more formally, we next compute seasonal Pearson correlation coefficients between daily NAO values and pollutant concentrations at both monitoring sites.
3.3. Seasonal Correlations with NAO Index
Building on the seasonal patterns observed earlier, we now quantify the correlation between NAO index values and pollutant concentrations using seasonal Pearson coefficients.
Seasonal Pearson correlation coefficients (Table 2) revealed a statistically significant positive association between the NAO index and O₃ concentrations, particularly during summer in São Gonçalo (r = 0.23). Conversely, NO₂ concentrations exhibited a strong negative correlation with NAO in São Gonçalo during the same period (r = -0.40), suggesting pollutant accumulation under NAO-negative conditions. Correlations involving SO₂ were generally weak and inconsistent across both stations.
To further assess the impact of the NAO on pollutant concentrations while controlling the temporal variability, we applied robust linear regression models. The results are presented in the next section.
3.4. Robust Linear Regression Models
Robust linear regression models were used to estimate the effect of the NAO index on pollutant concentrations, while adjusting for month and season. This approach improves model reliability by reducing sensitivity to outliers and non-normal residuals.
RLM results confirmed that the NAO index is a statistically significant predictor of O₃ concentrations at both stations: β = +1.98 in São Gonçalo (p < 0.001) and β = +0.96 in Ribeira Grande (p = 0.042). NO₂ levels were negatively associated with NAO in São Gonçalo (β = -1.52, p < 0.001), while in Ribeira Grande the association was weaker and not statistically significant (β = -0.48, p = 0.185). The regression models for SO₂ yielded low and non-significant coefficients across both sites, Table 3.
These regression coefficients indicate that a one-unit increase in the NAO index is associated with an average increase of 1.98 µg/m³ in ozone concentrations at São Gonçalo, and 0.96 µg/m³ at Ribeira Grande, after adjusting for monthly and seasonal effects.
The predictive performance of the robust linear regression models is illustrated in Figure 7, Figure 8 and Figure 9, which show estimated concentrations of O₃, NO₂, and SO₂ as functions of the NAO index. These visualizations complement the statistical outputs presented in Table 3 and highlight site-specific trends in pollutant response to synoptic-scale variability.
While the regression models provide statistically significant associations between the NAO index and certain pollutants, it is important to assess whether the underlying model assumptions are satisfied. The following subsection presents residual diagnostics to evaluate the adequacy and robustness of the fitted models.
3.5. Residual Analysis and Model Diagnostics
Before interpreting the regression results in a broader context, we assessed model performance using residual analysis. This allows us to confirm whether the models appropriately captured the data structure.
Residual analysis (Figure 10) confirmed normality and randomness of residuals in O₃ and NO₂ models for SG (Figure 10.a and Figure 10.c respectively). Greater variance was observed in RG models, particularly for SO₂ (Figure 10.f), suggesting local factors not captured by synoptic indices.
These results provide consistent statistical evidence that NAO phases are associated with surface ozone increases and NO₂ reductions, particularly in the urban context. These findings reinforce the robustness of the regression models and support further interpretation of the physical mechanisms, as discussed in the next section.
4. Discussion
The findings of this study provide robust statistical and physical evidence that the North Atlantic Oscillation (NAO) significantly modulates surface-level pollutant concentrations in the mid-Atlantic Island environment of the Azores. We begin by examining the statistical patterns observed in pollutant concentrations. Descriptive statistics of daily mean concentrations for O₃, NO₂, and SO₂ measured at the SG and RG stations between 2017 and 2021 showed that O₃ exhibited the highest average concentrations among the three pollutants, with notably higher values in SG (83.1 µg/m³) compared to RG (77.3 µg/m³), reflecting the influence of urban background levels and potentially greater photochemical activity in Ponta Delgada. NO₂ also followed this urban–semi-urban contrast, with mean concentrations of 21.4 µg/m³ in SG and 15.8 µg/m³ in RG, indicative of higher vehicular emissions in the city. In contrast, SO₂ levels were relatively low at both sites, with slightly higher values observed in RG (4.7 µg/m³), possibly due to localized episodic sources or varying atmospheric dispersion conditions. The standard deviations reveal moderate day-to-day variability, especially for O₃, aligning with its sensitivity to meteorological conditions and long-range transport.
The time series of pollutant concentrations at the São Gonçalo station (Figure 3) further illustrates the distinct temporal behavior of O₃, NO₂, and SO₂ in an urban context. Ozone displayed a marked seasonal cycle, with sustained spring and summer peaks likely driven by enhanced photochemical activity under increased solar radiation. In contrast, NO₂ concentrations were characterized by sharp, short-lived spikes, indicative of traffic-related emissions and local variability. SO₂ remained consistently low, with minor fluctuations suggesting limited and episodic local sources. These temporal profiles support the statistical results and highlight the differing sensitivity of each pollutant to both emission patterns and meteorological influences. Following the urban profile of São Gonçalo, the time series from Ribeira Grande offer insight into pollutant variability under less densely populated conditions.
A corresponding analysis at the Ribeira Grande station provides additional perspective on pollutant variability in a less urbanized setting. The pollutant time series at the Ribeira Grande station (Figure 4) reveal temporal dynamics distinct from those observed in São Gonçalo. O3 remained the dominant compound throughout the period, also exhibiting a clear seasonal cycle, though with slightly lower amplitudes compared to the urban site. NO₂ concentrations were generally lower and more stable, reflecting reduced traffic emissions in this semi-urban area. SO₂ showed modest variability, with occasional peaks suggesting the presence of sporadic local sources or variations in atmospheric dispersion. These patterns underscore the influence of site typology on pollutant behavior and help explain the weaker statistical associations observed for some pollutants at this location.
The contrast in O₃ responses between São Gonçalo and Ribeira Grande underscores the role of local urban influences and emission backgrounds. São Gonçalo, being more densely urbanized, is subject to higher NO emissions which can contribute to ozone titration under stable atmospheric conditions. Long-term observational records and chemistry-climate model simulations have shown that baseline ozone levels have been increasing across the Northern Hemisphere. Proposed by [1] persistent upward trends in lower tropospheric ozone concentrations over the past decades, driven in part by hemispheric-scale transport of precursors and transcontinental pollution, which are not always well captured by current models.
The temporal evolution of the NAO index during the study period (Figure 5) reveals significant intra- and interannual variability, with frequent alternations between positive and negative phases. As expected, the strongest and most persistent NAO signals occurred during winter months, reflecting the climatological dominance of NAO in shaping North Atlantic circulation during this season. This dynamic variability underlines the relevance of using daily NAO data to assess pollutant behavior in the Azores, as short-term oscillations can influence atmospheric transport, vertical mixing, and photochemical conditions. The correspondence between periods of sustained NAO positivity and elevated ozone levels observed in spring and summer further supports the hypothesis that large-scale synoptic forcing plays a key role in modulating air quality in island environments.
During positive NAO phases, the Azores region is generally influenced by a stronger and more northeasterly-displaced Azores High, which promotes subsidence and atmospheric stability. Recent paleoclimate reconstructions proposed by [19] show that the 20th century expansion of the Azores High is unprecedented over the past 1,200 years. This anomalous expansion likely enhances the persistence of synoptic regimes that favor ozone accumulation in the mid-Atlantic, further supporting the relevance of assessing pollutant-climate interactions in the Azores. This dynamic suppresses cloud formation and leads to increased solar radiation reaching the surface. Enhanced solar irradiance intensifies the photolytic decomposition of NO₂, accelerating O₃ formation in the presence of its precursors. Thus, the reduced cloudiness associated with NAO-positive regimes provides more favorable photochemical conditions for ozone production, especially in the urban context of São Gonçalo, where precursor availability is higher. These mechanisms are further supported by [20] who showed that the interaction between ozone precursors and meteorological variability plays a central role in regional ozone formation dynamics. Their findings underscore the influence of synoptic-scale drivers such as the NAO on the seasonal modulation of ozone in marine-influenced environments.
The seasonal boxplots shown in Figure 6 provide additional insight into the pollutant dynamics observed in São Miguel Island. O3 concentrations displayed higher medians and upper quartiles in São Gonçalo compared to Ribeira Grande, particularly during spring and summer, suggesting stronger photochemical activity in the urban background environment. NO2 exhibited a distinctly urban profile, with significantly higher values in São Gonçalo, especially in winter, reflecting increased combustion-related emissions and weaker atmospheric dispersion during colder months. SO2 levels remained low at both sites and did not show a clear seasonal pattern, although slightly greater variability in Ribeira Grande may point to sporadic local sources. These seasonal distributions support the statistical findings and confirm that pollutant sensitivity to meteorological and synoptic drivers varies according to compound type and local context.
The seasonal Pearson correlation coefficients presented in Table 2 offer initial statistical evidence of the relationship between NAO variability and pollutant concentrations. Ozone exhibited consistently positive correlations with the NAO index across all seasons, particularly in São Gonçalo during summer (r = 0.23) and spring (r = 0.18), suggesting enhanced photochemical production under NAO-positive regimes. Conversely, NO₂ concentrations were negatively correlated with NAO, most strongly in São Gonçalo during summer (r = –0.40), reflecting increased atmospheric dispersion during periods of stronger westerly circulation. These seasonal patterns support the compound-specific influence of NAO phases and align with the more detailed findings from the regression analysis. In contrast, SO₂ correlations remained weak and inconsistent at both sites and across all seasons, indicating minimal sensitivity to synoptic scale forcing. These preliminary associations are further explored through regression modelling, which allows for a more precise estimation of the NAO’s impact after controlling for temporal factors.
The regression coefficients presented in Table 3 quantify the extent to which daily pollutant concentrations respond to variations in the NAO index, controlling for seasonal and monthly effects. Ozone showed a strong and statistically significant positive association with NAO in both monitoring sites, particularly in São Gonçalo (β = +1.98, p < 0.001), suggesting that NAO-positive conditions contribute to elevated ozone levels through enhanced solar radiation and atmospheric stability. Nitrogen dioxide displayed a significant negative relationship with NAO only in São Gonçalo (β = –1.52, p < 0.001), indicating increased pollutant dispersion in the urban area under NAO-positive phases. In Ribeira Grande, this relationship was weaker and not statistically significant, possibly reflecting reduced emission intensity or greater meteorological variability. Sulfur dioxide exhibited no meaningful association with the NAO index in either site, further supporting the interpretation that its variability is driven by local, episodic sources rather than large-scale atmospheric circulation. These results reinforce the pollutant-specific and context-dependent nature of NAO–pollution interactions in oceanic island settings.
To complement the descriptive insights, regression analysis was employed to isolate and quantify the specific influence of NAO on pollutant behavior. The predictive relationships between ozone concentrations and the NAO index, as illustrated in Figure 7, confirms a statistically significant positive association in both monitoring stations. São Gonçalo exhibited a steeper slope, indicating a stronger sensitivity of ozone levels to NAO-positive conditions in the urban background environment. This response likely reflects the combined effect of enhanced subsidence, increased solar radiation, and the availability of precursors, which together promote photochemical ozone formation during NAO-positive phases. The narrower confidence intervals observed in São Gonçalo further support the reliability of this relationship, suggesting that large-scale synoptic forcing exerts a more pronounced influence on ozone dynamics in the urban sector of São Miguel Island.
While ozone responded positively to NAO variability, a different behavior was observed for nitrogen dioxide. Figure 8 illustrates the inverse relationship between the NAO index and nitrogen dioxide concentrations, particularly evident in São Gonçalo. The robust regression model indicates that NO₂ levels tend to decrease under NAO-positive conditions, likely due to enhanced atmospheric dispersion and vertical mixing driven by stronger westerly flow. This behavior reflects the sensitivity of traffic-related pollutants to synoptic-scale ventilation regimes, especially in urban settings where emission densities are high. In contrast, the weaker and non-significant association observed in Ribeira Grande suggests that NO₂ dynamics in semi-urban areas may be more influenced by local factors and less responsive to large-scale circulation patterns. These findings align with previous studies highlighting the dilution of primary pollutants during NAO-positive phases across Europe.
The analysis now turns to sulfur dioxide, whose association with NAO differs substantially from the patterns observed for ozone and nitrogen dioxide. The regression results for sulfur dioxide presented in Figure 9 reveal weak and statistically non-significant associations with the NAO index at both monitoring sites. The near-horizontal slopes and wide confidence intervals suggest that SO₂ concentrations in São Miguel are not strongly modulated by synoptic-scale variability. Instead, the temporal behavior of SO₂ appears to be governed by localized and episodic emission sources, such as small-scale combustion or potentially sporadic atmospheric transport events. This contrasts with the more predictable responses observed for ozone and NO₂, underscoring the compound-specific nature of NAO pollutant interactions. Further investigation into volcanic or maritime contributions to SO₂ variability in island environments may help clarify these patterns.
As model accuracy is crucial for interpreting the pollutant/NAO relationships, we next examine the residual patterns associated with each regression output. The residual analysis presented in Figure 10 confirms the adequacy of the regression models for O3 and NO₂, particularly in São Gonçalo. The residuals for these pollutants exhibit random distribution and approximate normality, indicating that the models successfully captured the main patterns of variability driven by the NAO index. In Ribeira Grande, a slightly greater dispersion in residuals suggests a weaker signal-to-noise ratio, possibly due to lower emission density or greater influence of local meteorological fluctuations. In the case of SO₂, residuals were widely scattered and lacked a coherent structure at both sites, underscoring the limited explanatory power of synoptic-scale predictors for this compound. These diagnostic results support the robustness of the statistical associations reported for O₃ and NO₂ and reinforce the compound-specific nature of the observed NAO/pollutant relationships. Beyond the scientific relevance, the results of this study also carry practical implications for policy and health planning in island regions.
From a policy and planning perspective, these findings suggest that climate indices such as the NAO can enhance forecasting capabilities for ozone and NO₂ episodes in the Azores. The potential public health implications of ozone variability are well documented. From a public health perspective, the observed link between NAO phases and ozone concentrations has direct implications for population exposure in the Azores. Tropospheric ozone is a well-established respiratory and cardiovascular irritant, particularly harmful to vulnerable groups such as children, the elderly, and individuals with pre-existing conditions. As reviewed by [21], tropospheric ozone is associated with increased respiratory and cardiovascular morbidity, particularly among sensitive populations. This relationship has also been observed locally in the Azores, where recent research on Faial Island identified significant associations between air quality variability and hospitalizations for respiratory diseases [22]. Given the demonstrated link between NAO phases and ozone concentrations in this study, these findings highlight the importance of integrating large-scale climate patterns into health-oriented air quality policies. This is consistent with the view advocated for sustainable and integrated policy approaches that consider both climate variability and air quality, particularly in regions with limited infrastructure and exposure to multiple environmental stressors. This highlights the multidimensional vulnerability of the Azores to atmospheric dynamics, affecting both gaseous and particulate pollution [24,25]. Integrating synoptic-scale drivers into long-term air quality planning is essential, particularly for small island states and regions with limited observational coverage.
Together, these results underscore the importance of integrating large-scale climatic indices into both scientific assessment and regional environmental planning, a point further emphasized in the following conclusion.
5. Conclusions
This study demonstrates, with high statistical confidence, that the North Atlantic Oscillation significantly modulates the behavior of key atmospheric pollutants O₃, NO₂, and SO₂ in the mid-Atlantic Island setting of the Azores. Through integrated descriptive and regression-based analyses, we showed that O₃ concentrations increase under NAO-positive phases, particularly during spring and summer in urban contexts, likely due to enhanced solar radiation and subsidence. Conversely, NO₂ levels decrease under the same synoptic conditions, especially in São Gonçalo, reflecting improved dispersion of traffic related emissions. In contrast, SO₂ exhibited weak and inconsistent associations with the NAO, emphasizing its dependence on localized and episodic sources rather than large-scale atmospheric patterns.
These findings underscore the compound-specific and context-dependent nature of climate pollution interactions and reinforce the need to incorporate synoptic-scale drivers into air quality management strategies. The demonstrated influence of NAO, particularly on pollutants with photochemical and advective behavior, highlights the potential of integrating climate indices into early warning systems and policy planning in small island territories. This approach is especially relevant in regions like the Azores, where infrastructural limitations and climatic vulnerability intersect.
Future research should build on these insights by incorporating additional meteorological variables, expanding spatial coverage to other islands and seasons, and applying atmospheric transport modeling to refine predictive capabilities. By doing so, we can enhance the resilience of environmental health systems in remote island settings and contribute to a more nuanced understanding of how global climate variability shapes local air quality outcomes.
Author Contributions
Conceptualization, M.G.M. and H.C.V.; methodology, M.G.M. and H.C.V.; software, M.G.M.; validation, H.C.V. and A.C.F.; formal analysis, M.G.M.; investigation, H.C.V.; resources, M.G.M.; data processing, H.C.V.; writing original draft preparation, M.G.M. and H.C.V.; writing review and editing, M.G.M., H.C.V., and A.C.F.; visualization, M.G.M.; supervision, M.G.M.; project administration, H.C.V. All authors have read and agreed to the published version of the manuscript.
Funding
This research received no external funding. The Article Processing Charge (APC) was fully waived by Pollutants as part of an official invitation to submit this manuscript.
Data Availability Statement
Publicly available datasets were analyzed in this study. These data can be found at https://psl.noaa.gov/data/timeseries/daily/NAO and https://ambiente.azores.gov.pt/qualidadedoar/DadosValidados.aspx
Acknowledgments
The authors would like to thank the Regional Secretariat for the Environment and Climate Change (Azores) for maintaining and validating the air quality monitoring network and for providing public access to the data used in this study. The authors also acknowledge the NOAA Physical Sciences Laboratory for providing the North Atlantic Oscillation index used in statistical analysis.
Conflicts of Interest
The authors declare no conflicts of interest.
Abbreviations
The following abbreviations are used in this manuscript:
| NAO | Noth Atlantic Oscillation |
| O3 | Ozone |
| NO2 | Nitrogen Dioxide |
| SO2 | Sulfur Dioxide |
| SG | São Gonçalo (urban background) station |
| RG | Ribeira Grande (urban traffic) station |
| RLM | Robust Linear Model |
| NOAA | National Oceanic and Atmospheric Administration |
| RSECC | Regional Secretariat for Environment and Climate Change |
| CTM | Chemistry Transport Model |
References
- Parrish, David & Lamarque, Jean-François & Naik, Vaishali & Horowitz, Larry & Shindell, D.T. & Staehelin, Johannes & Derwent, R. & Cooper, O.R. & Tanimoto, Hiroshi & Volz-Thomas, A. & Gilge, Stefan & Scheel, H.-E & Steinbacher, Martin & Fröhlich, Marina. (2014). Long-term changes in lower tropospheric baseline ozone concentrations: Comparing chemistry-climate models and observations at northern mid-latitudes. Journal of Geophysical Research: Atmospheres. 119. [CrossRef]
- Creilson, J. K., Fishman, J., Wozniak, A. E., & Samson, P. J. (2003). Transport of tropospheric ozone from the northeastern United States: Model estimates and observations from the Tropospheric Ozone Pollution Project. Journal of Geophysical Research: Atmospheres, 108(D8), 4246. [CrossRef]
- Pausata, F. S. R., Pozzoli, L., Vignati, E., and Dentener, F. J. (2012). North Atlantic Oscillation and tropospheric ozone variability in Europe: model analysis and measurements intercomparison, Atmos. Chem. Phys., 12, 6357–6376. [CrossRef]
- Pope, R. J., Chipperfield, M. P., Arnold, S. R., Glatthor, N., Feng, W., Dhomse, S. S., Kerridge, B. J., Latter, B. G., and Siddans, R. (2018). Influence of the wintertime North Atlantic Oscillation on European tropospheric composition: an observational and modelling study, Atmos. Chem. Phys., 18, 8389–8408. [CrossRef]
- Secretaria Regional do Ambiente e Ação Climática. (2014). Programa Regional para as Alterações Climáticas dos Açores (2006–2014). Direção Regional do Ambiente. Figura 28: “Relação entre o índice da NAO e a concentração de Ozono da estação rural de fundo no Faial entre 2006 e 2014, por época do ano.
- Li, Q., D. J. Jacob, I. Bey, P. I. Palmer, B. N. Duncan, B. D. Field, R. V. Martin, A. M. Fiore, R. M. Yantosca, D. D. Parrish, P. G. Simmonds, and S. J. Oltmans. (2002). Transatlantic transport of pollution and its effects on surface ozone in Europe and North America, J. Geophys. Res., 107(D13). [CrossRef]
- Christoudias, T., Pozzer, A., and Lelieveld, J. (2012). Influence of the North Atlantic Oscillation on air pollution transport, Atmos. Chem. Phys., 12, 869–877. [CrossRef]
- Raes, F., Van Dingenen, R., Cuevas, E., Van Velthoven, P. F. J., & Prospero, J. M. (1997).Observations of aerosols in the free troposphere and marine boundary layer of the subtropical Northeast Atlantic: Discussion of processes determining their size distribution. Journal of Geophysical Research: Atmospheres, 102(D21), 21315–21328. [CrossRef]
- Sergio Rodrı́guez, Carlos Torres, Juan-Carlos Guerra, Emilio Cuevas (2004). Transport pathways of ozone to marine and free-troposphere sites in Tenerife, Canary Islands, Atmospheric Environment, Volume 38, Issue 28, Pages 4733-4747.
- ISSN 1352-2310. [CrossRef]
- Tiao, G., Smith, J. A., Huang, Y., & Zhang, X. (2013). Synergistic effects of the winter North Atlantic Oscillation (NAO) and El Niño–Southern Oscillation (ENSO) on dust activities in North China during the following spring. Atmospheric Chemistry and Physics, 13, 6555–6573. [CrossRef]
- Jiménez-Guerrero, P., Ratola, N. Influence of the North Atlantic oscillation on the atmospheric levels of benzo[a]pyrene over Europe. Clim Dyn 57, 1173–1186 (2021). [CrossRef]
- Hernández, A., Kutiel, H., Trigo, R. M., Valente, M. A., Sigró, J., Cropper, T., & Espírito Santo, F. (2016). New Azores archipelago daily precipitation dataset and its links with large-scale modes of climate variability. International Journal of Climatology, 36(14), 4439–4454. [CrossRef]
- Chevalier, A., Gheusi, F., Delmas, R., Ordóñez, C., Sarrat, C., Zbinden, R., Thouret, V., Athier, G., and Cousin, J.-M.: Influence of altitude on ozone levels and variability in the lower troposphere: a ground-based study for western Europe over the period 2001–2004, Atmos. Chem. Phys. 2007, 7, 4311–4326. [CrossRef]
- Regional Secretariat for the Environment and Climate Action. (2017). Air Quality Reports of the Azores. Ponta Delgada: Government of the Azores. https://servicos-sraa.azores.gov.pt/grastore/DSMALL/RQA2017.pdf. Accessed on June 22, 2025.
- Regional Secretariat for the Environment and Climate Action. (2018). Air Quality Reports of the Azores. Ponta Delgada: Government of the Azores. https://servicos-sraa.azores.gov.pt/grastore/DSMALL/RQA2018.pdf. Accessed on June 22, 2025.
- Regional Secretariat for the Environment and Climate Action. (2019). Air Quality Reports of the Azores. Ponta Delgada: Government of the Azores. https://servicos-sraa.azores.gov.pt/grastore/DSMALL/RQA2019.pdf. Accessed on June 22, 2025.
- Regional Secretariat for the Environment and Climate Action. (2020). Air Quality Reports of the Azores. Ponta Delgada: Government of the Azores. https://servicos-sraa.azores.gov.pt/grastore/DSMALL/RQA2020.pdf. Accessed on June 22, 2025.
- Regional Secretariat for the Environment and Climate Action. (2021). Air Quality Reports of the Azores. Ponta Delgada: Government of the Azores. https://servicos-sraa.azores.gov.pt/grastore/DSMALL/RQA2021.pdf. Accessed on June 22, 2025.
- Cresswell-Clay, N., Ummenhofer, C.C., Thatcher, D.L. et al. Twentieth-century Azores High expansion unprecedented in the past 1,200 years. Nat. Geosci. 15, 548–553 (2022). [CrossRef]
- Elshorbany, Y., Ziemke, J. R., Strode, S., Petetin, H., Miyazaki, K., De Smedt, I., Pickering, K., Seguel, R. J., Worden, H., Emmerichs, T., Taraborrelli, D., Cazorla, M., Fadnavis, S., Buchholz, R. R., Gaubert, B., Rojas, N. Y., Nogueira, T., Salameh, T., & Huang, M. (2024). Tropospheric ozone precursors: global and regional distributions, trends, and variability. Atmospheric Chemistry and Physics, 24, 12225–12257. [CrossRef]
- Donzelli, G., & Suarez-Varela, M. M. (2024). Tropospheric Ozone: A Critical Review of the Literature on Emissions, Exposure, and Health Effects. Atmosphere, 15(7), 779. [CrossRef]
- Carvalho, F., Meirelles, M., Martins, D., & Vasconcelos, H. C. (2024). Yearly assessment of weather and air quality impact on respiratory disease hospitalizations: Faial Island (Azores) study. American Journal of Health Research, 12(6), 165–178. [CrossRef]
- Melamed, ML., Schmale, J., Schneidemesser, E. (2016). Sustainable policy—key considerations for air quality and climate change, Current Opinion in Environmental Sustainability, 23, pp. 85-91. ISSN 1877-3435. [CrossRef]
- Carvalho, F. S., Meirelles, M. G., Henriques, D., Porteiro, J., Navarro, P., & Vasconcelos, H. C. (2023). Climate Change and Extreme Events in Northeast Atlantic and Azores Islands Region. Climate, 11(12), 238. [CrossRef]
- Meirelles, M. G., & Vasconcelos, H. C. (2025). Physical–Statistical Characterization of PM10 and PM2.5 Concentrations and Atmospheric Transport Events in the Azores During 2024. Earth, 6(2), 54. [CrossRef]
Figure 1.
Location of the Azores archipelago.
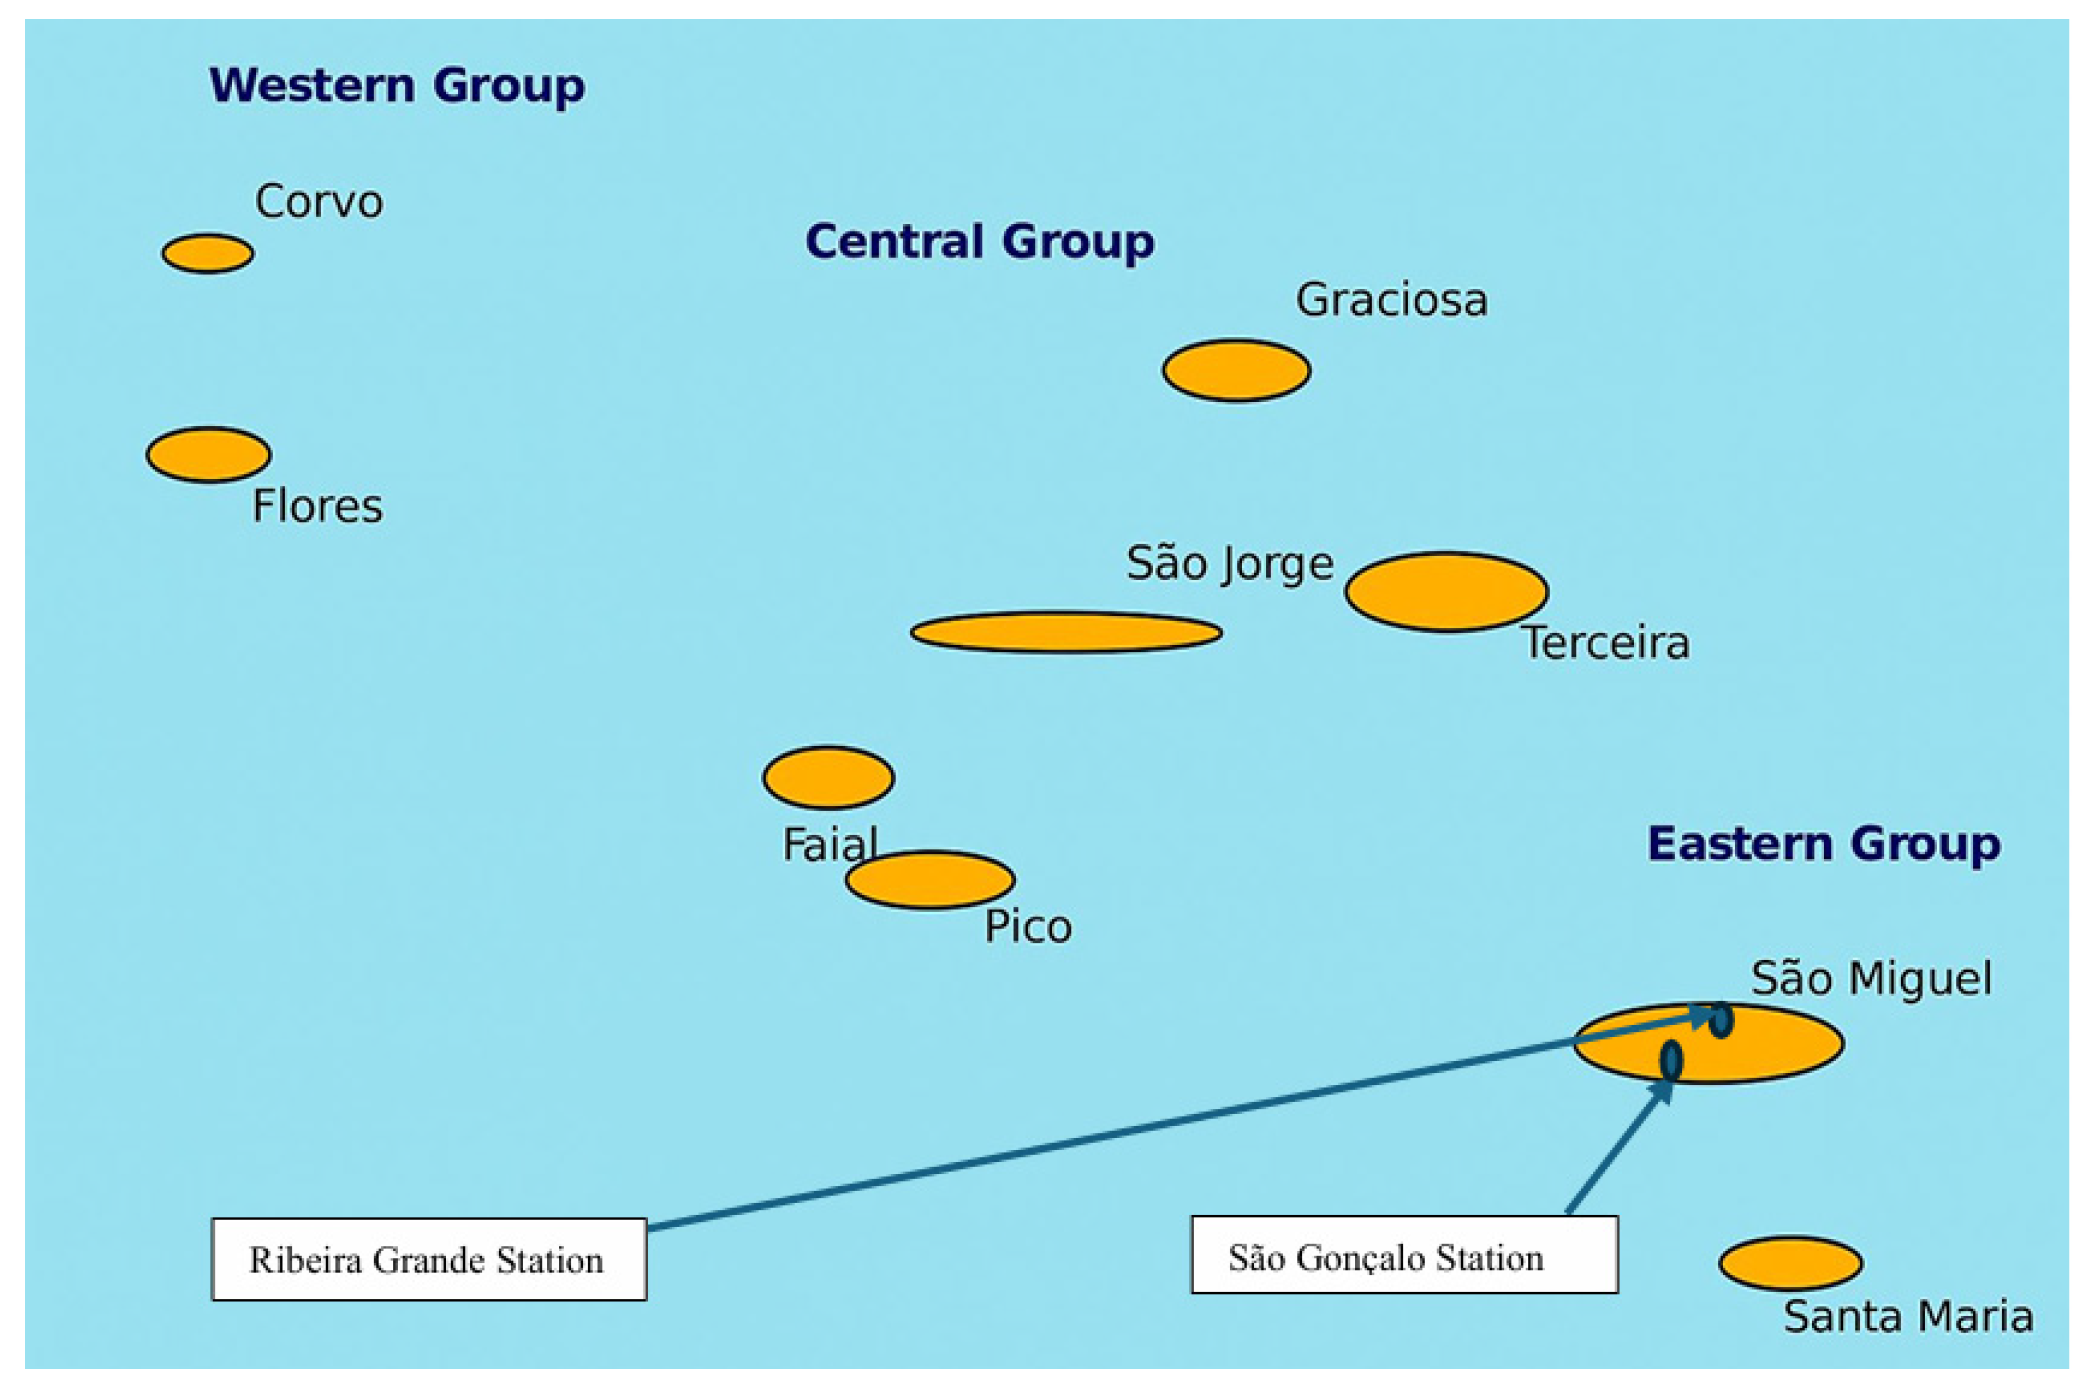
Figure 2.
Air quality monitoring stations on São Miguel Island, Azores. (a) Ribeira Grande station (urban traffic); (b) São Gonçalo station (urban background), located in the urban area of Ponta Delgada. Both stations are equipped with automatic analyzers for continuous measurement of surface concentrations of O₃, NO₂, and SO₂. Source: [14].
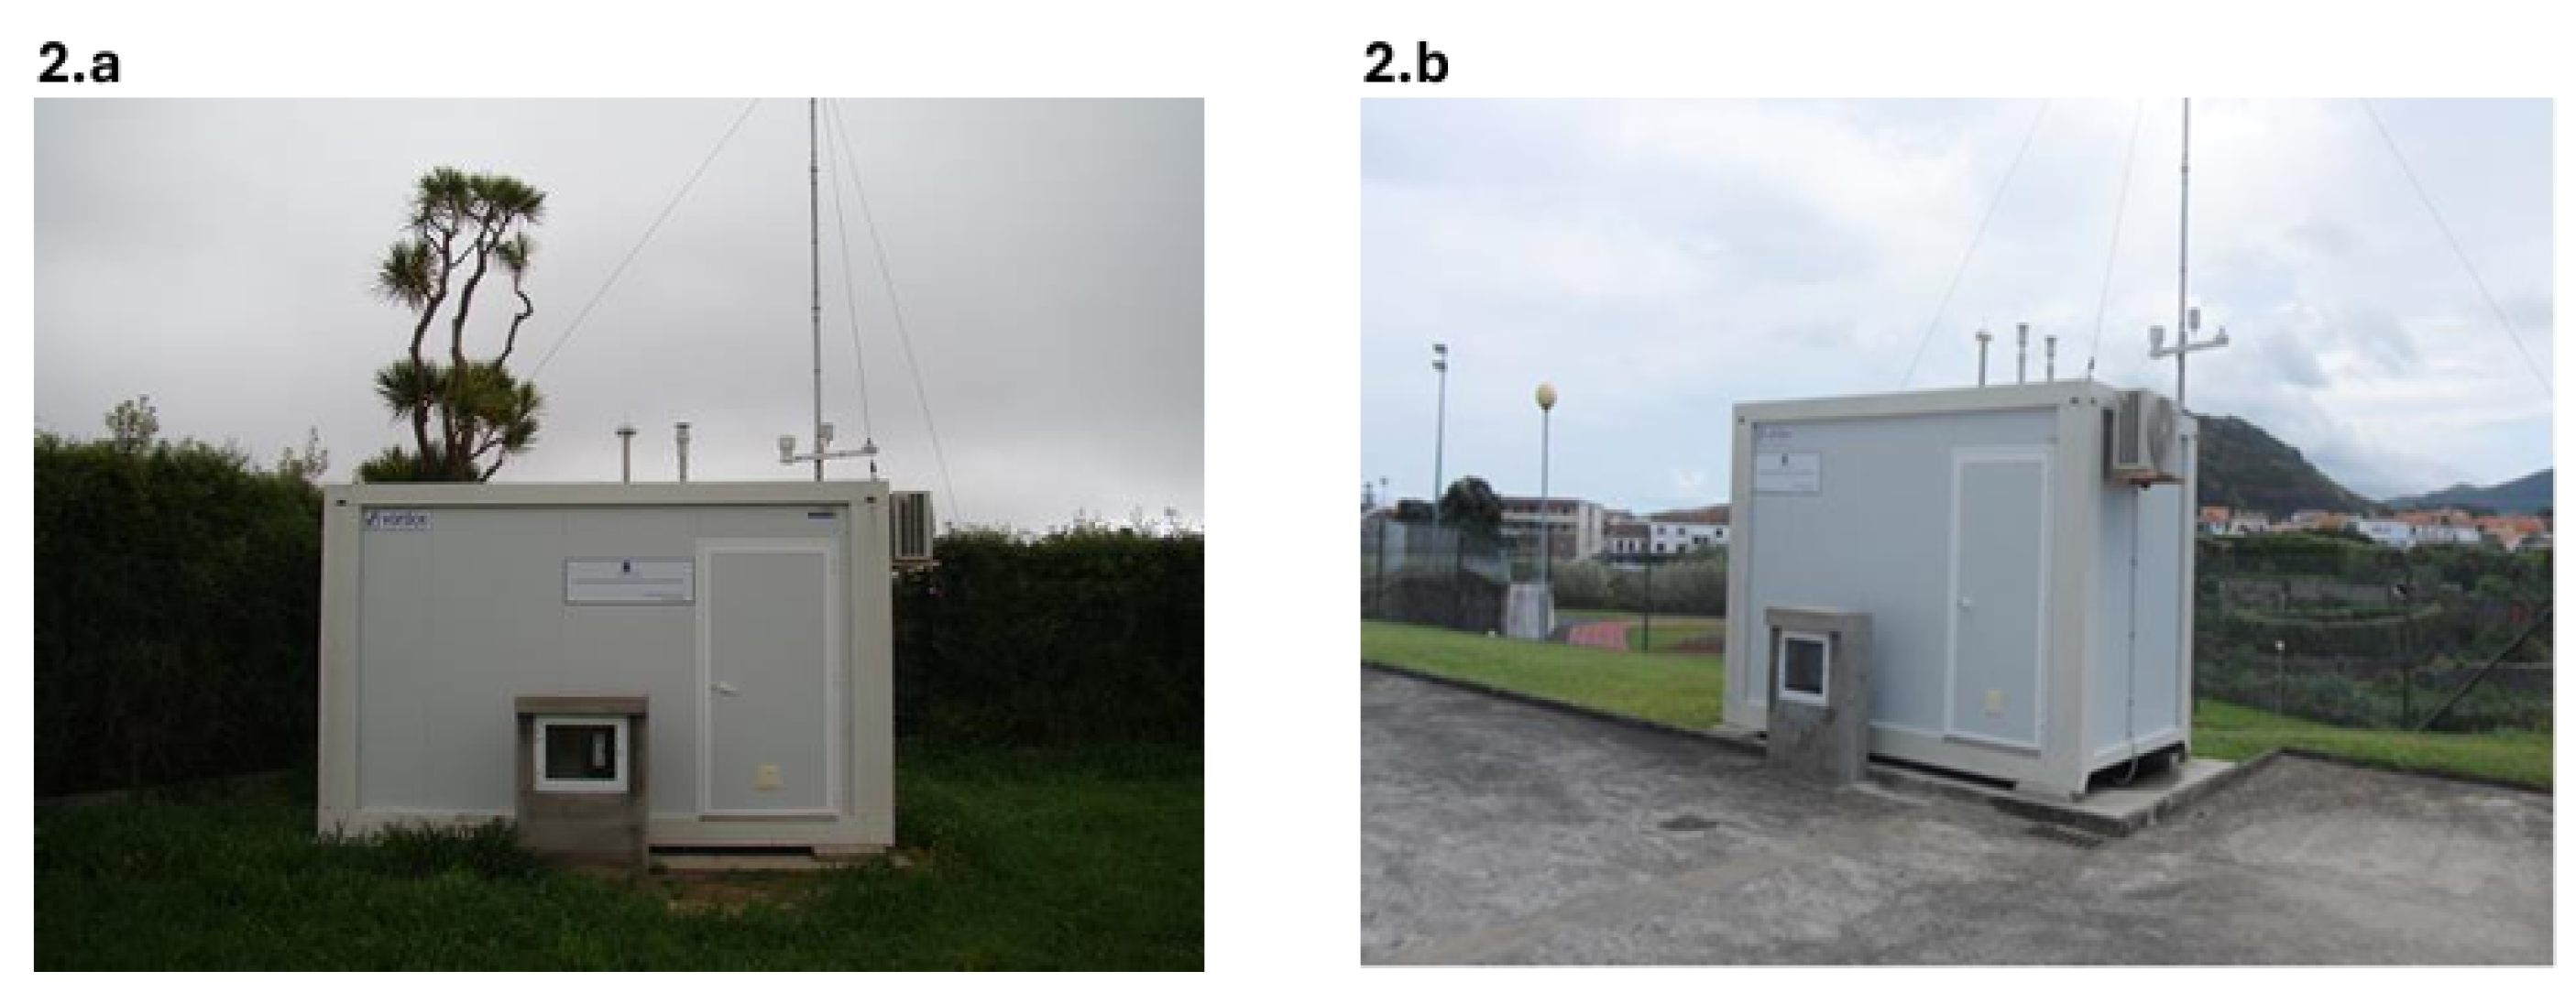
Figure 3.
Daily concentrations of NO₂, O₃, and SO₂ measured at the São Gonçalo air quality monitoring station (Ponta Delgada, São Miguel Island, Azores) from 2017 to 2021. O₃ consistently exhibited the highest concentrations, with clear seasonal cycles, while NO₂ showed episodic peaks associated with urban traffic emissions. SO₂ remained at relatively low levels throughout the period, with minor fluctuations indicating localized or short-term sources.
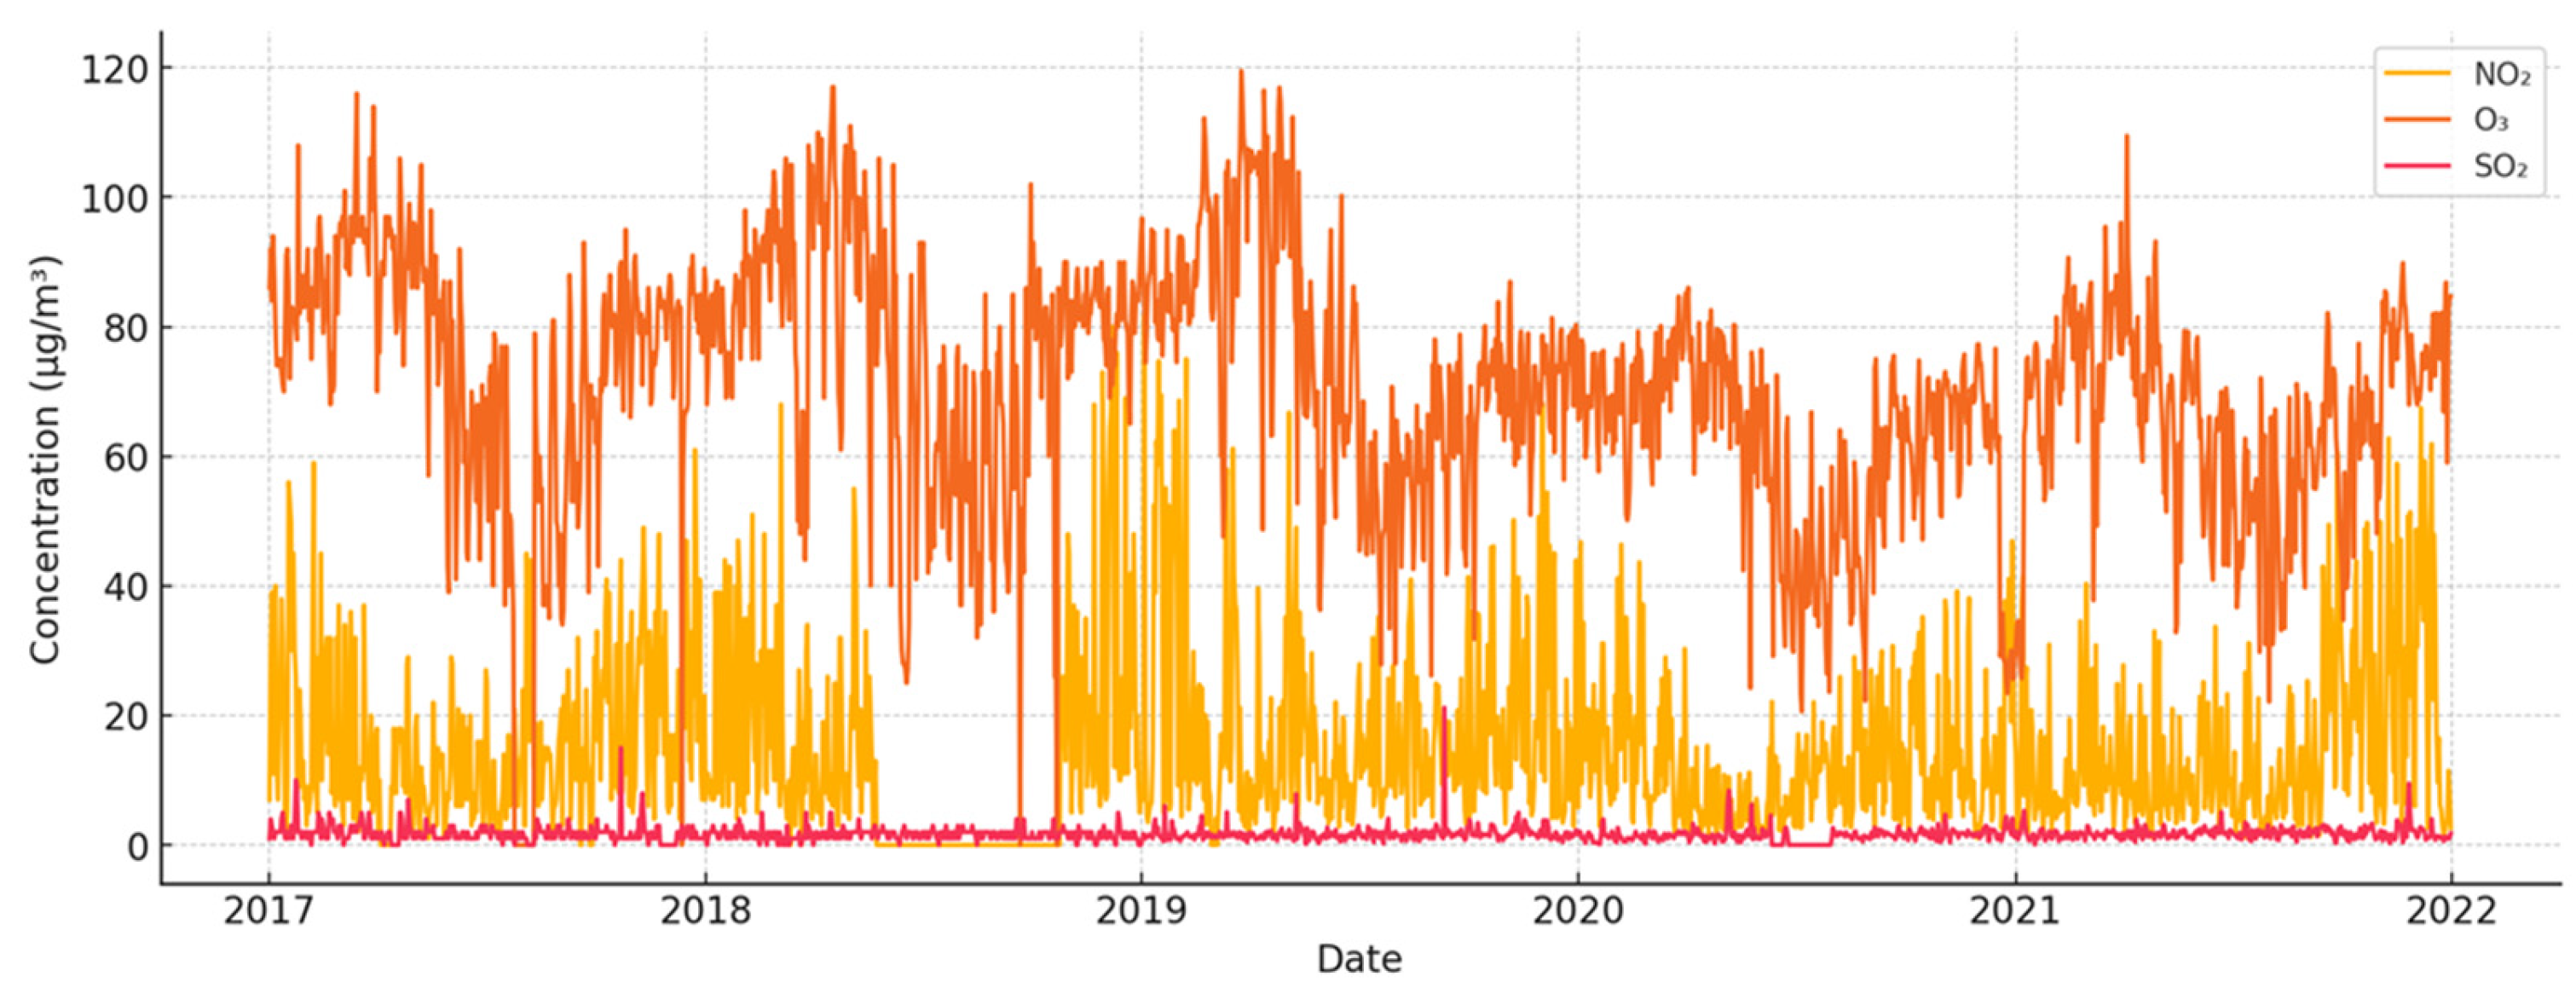
Figure 4.
Daily concentrations of NO₂, O₃, and SO₂ measured at the Ribeira Grande air quality monitoring station (São Miguel Island, Azores) from 2017 to 2021. O₃ remained the dominant pollutant, with marked seasonal patterns, while NO₂ levels were generally lower and less variable compared to São Gonçalo. SO₂ exhibited slightly higher variability at this semi-urban site, suggesting occasional influence from local emission events or atmospheric transport.
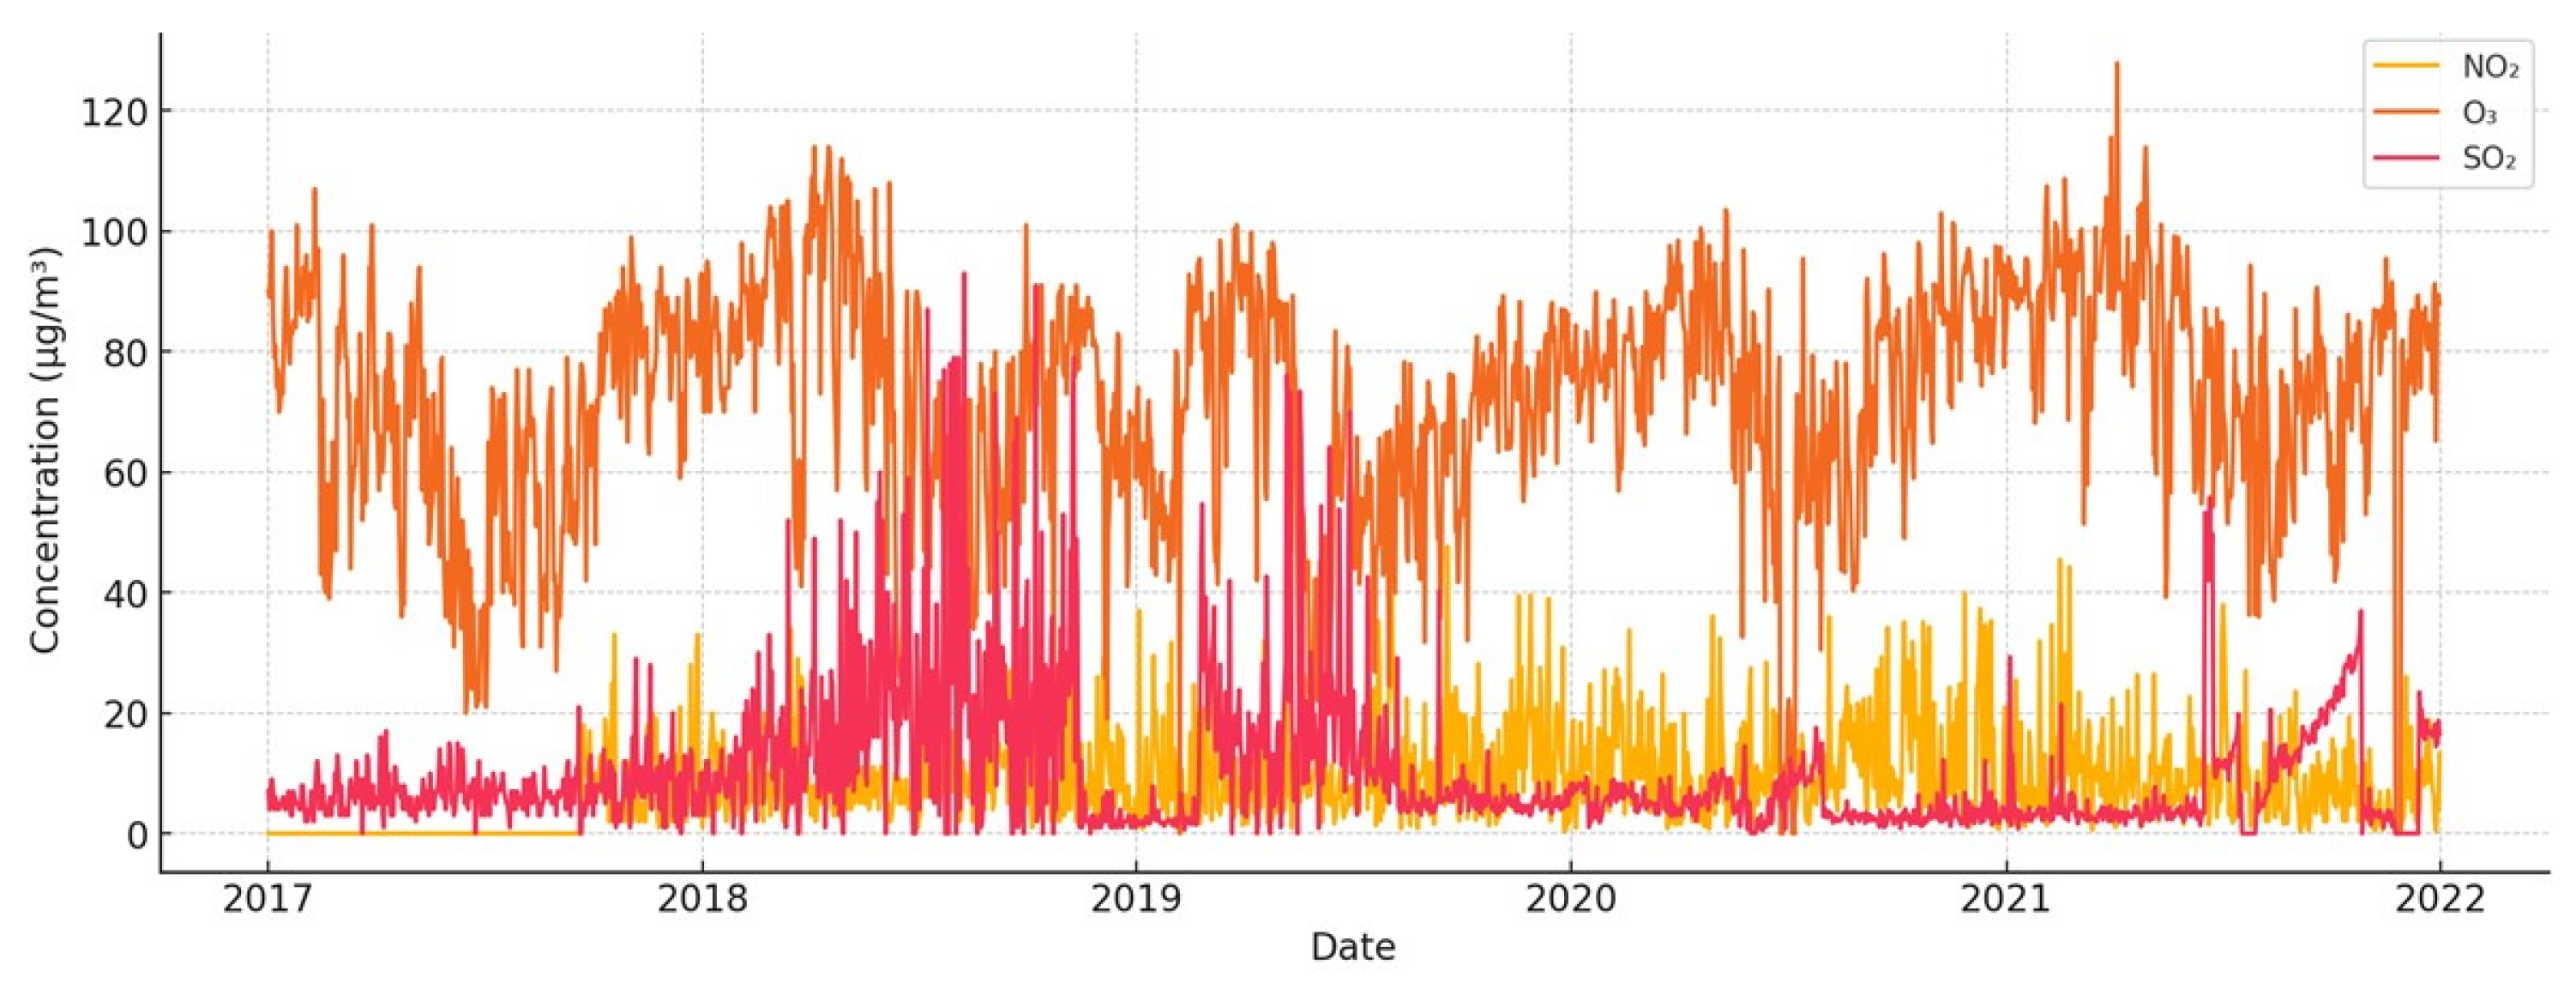
Figure 5.
Daily values of the NAO index from 2017 to 2021, derived from the NOAA Physical Sciences Laboratory reanalysis dataset. The red dashed line represents the zero-threshold separating positive and negative NAO phases, which correspond to distinct synoptic regimes over the North Atlantic. Notable intra-annual and interannual fluctuations reflect the dynamic variability in large-scale atmospheric circulation affecting the Azores.
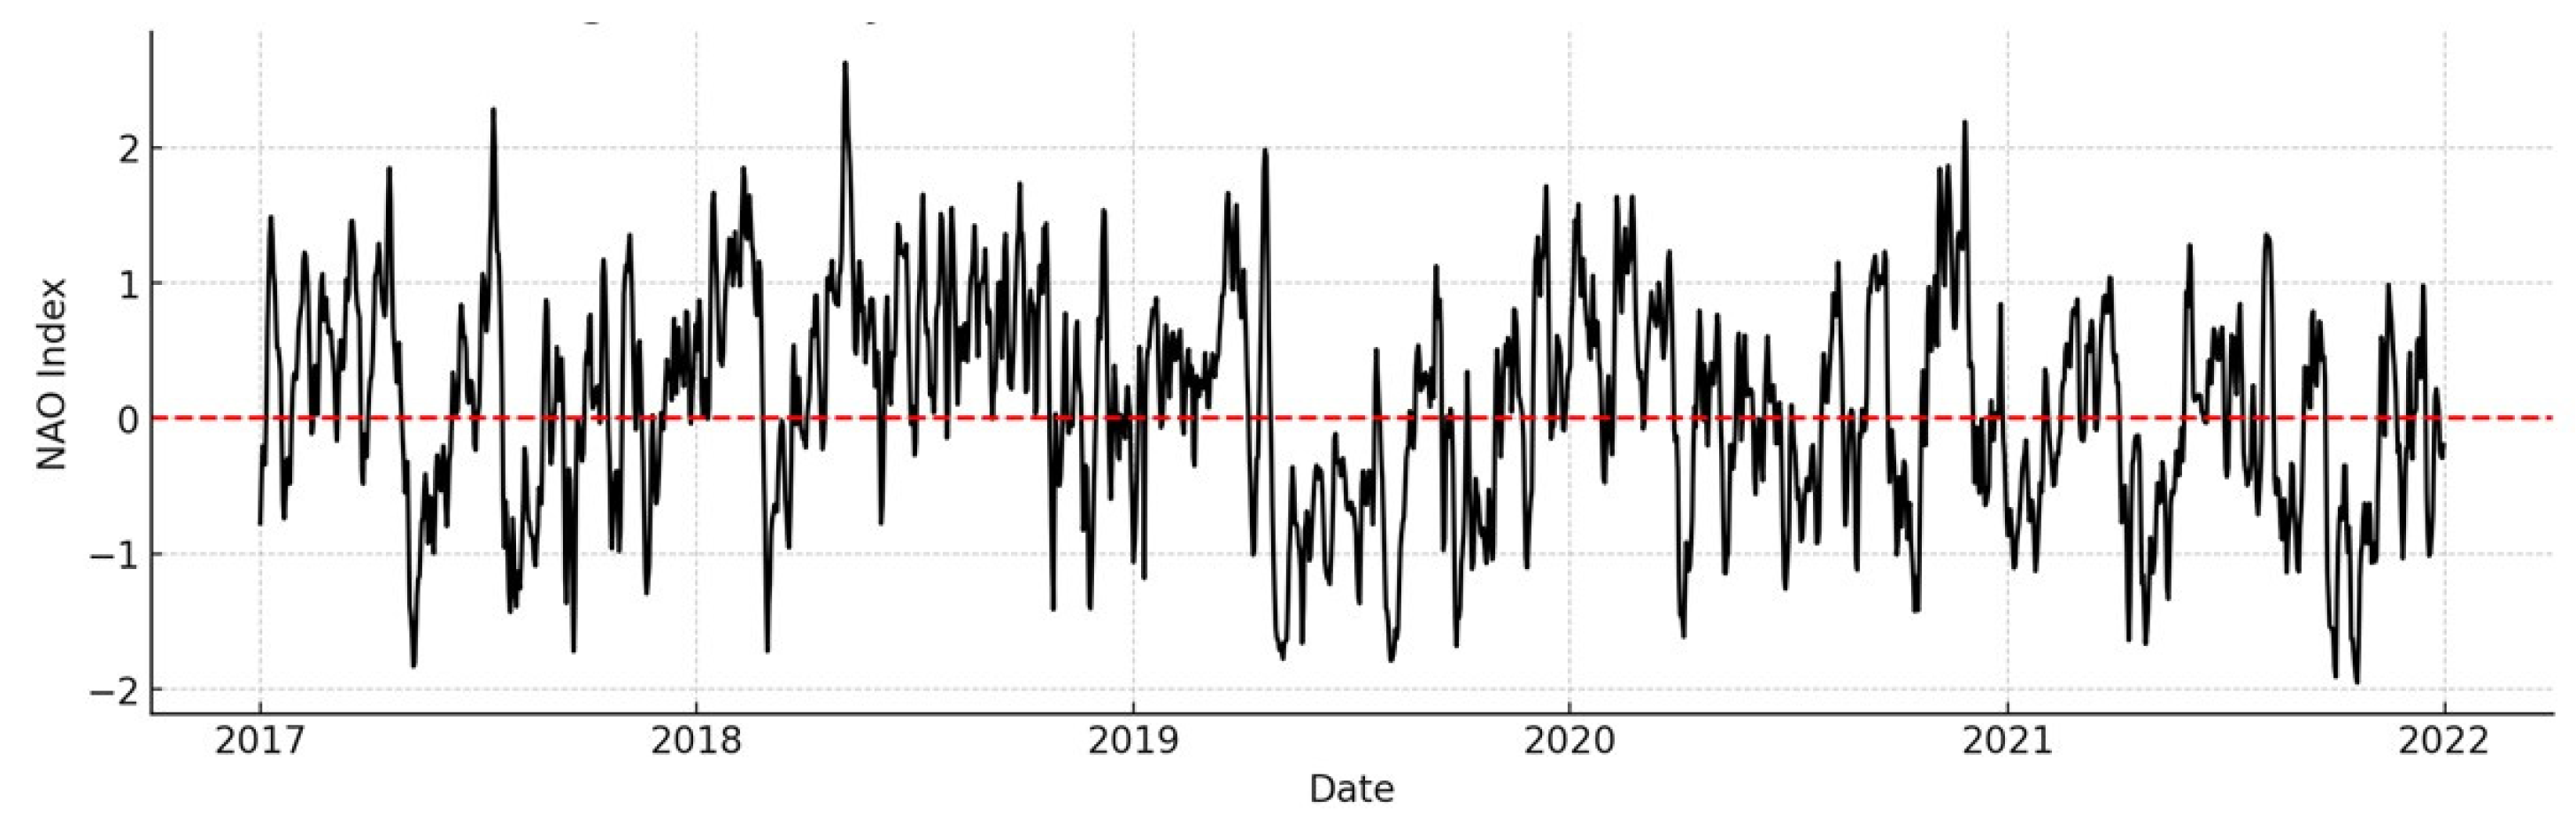
Figure 6.
Boxplots of daily O₃ concentrations recorded at the São Gonçalo (urban) and Ribeira Grande (semi-urban) air quality monitoring stations from 2017 to 2021. São Gonçalo consistently exhibited higher median and upper quartile values, indicating greater baseline ozone levels likely influenced by urban emissions and meteorological conditions. The interquartile ranges highlight the seasonal and interannual variability across both sites.
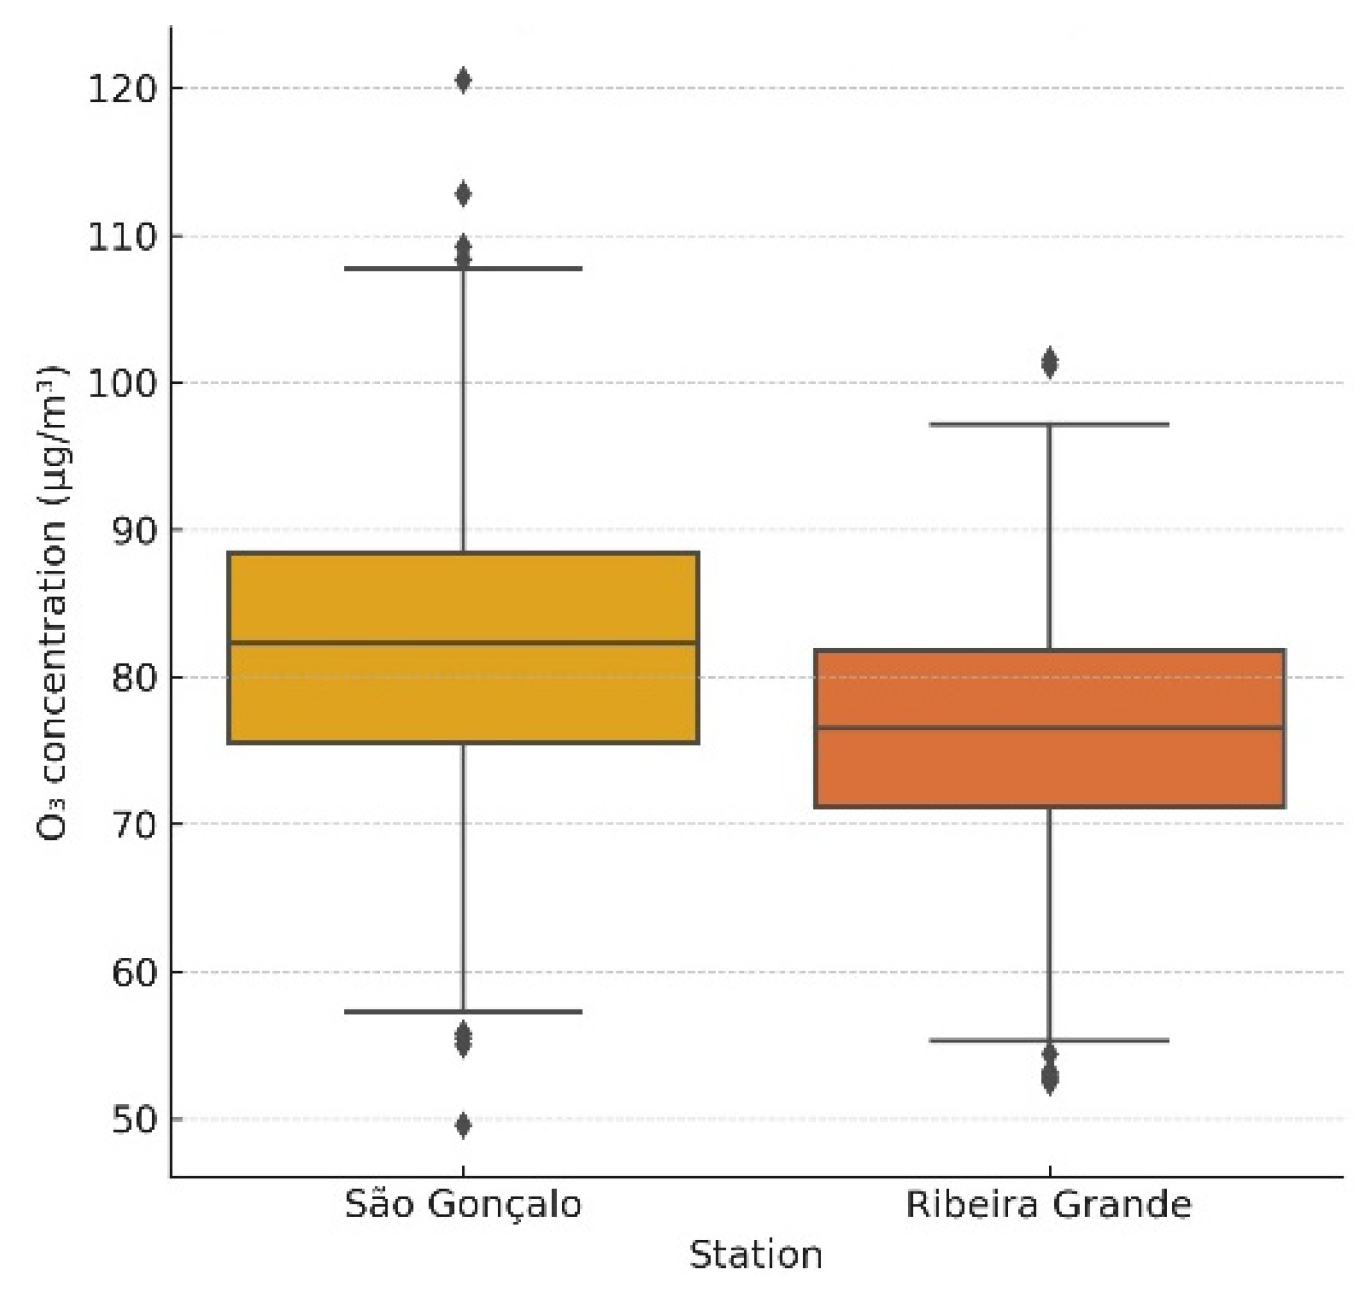
Figure 6.
6.a. Boxplots of daily NO₂ concentrations recorded at the São Gonçalo (SG) and Ribeira Grande (RG) monitoring stations (2017–2021). Higher median and peak values in São Gonçalo reflect stronger urban emission sources, particularly related to vehicular traffic. Ribeira Grande shows lower and more stable NO₂ levels consistent with its semi-urban context. 6.b. Boxplots of daily SO₂ concentrations at both stations for the same period. SO₂ levels were generally low at both sites, but Ribeira Grande exhibited greater variability, possibly due to local episodic sources or differences in dispersion and advection processes.
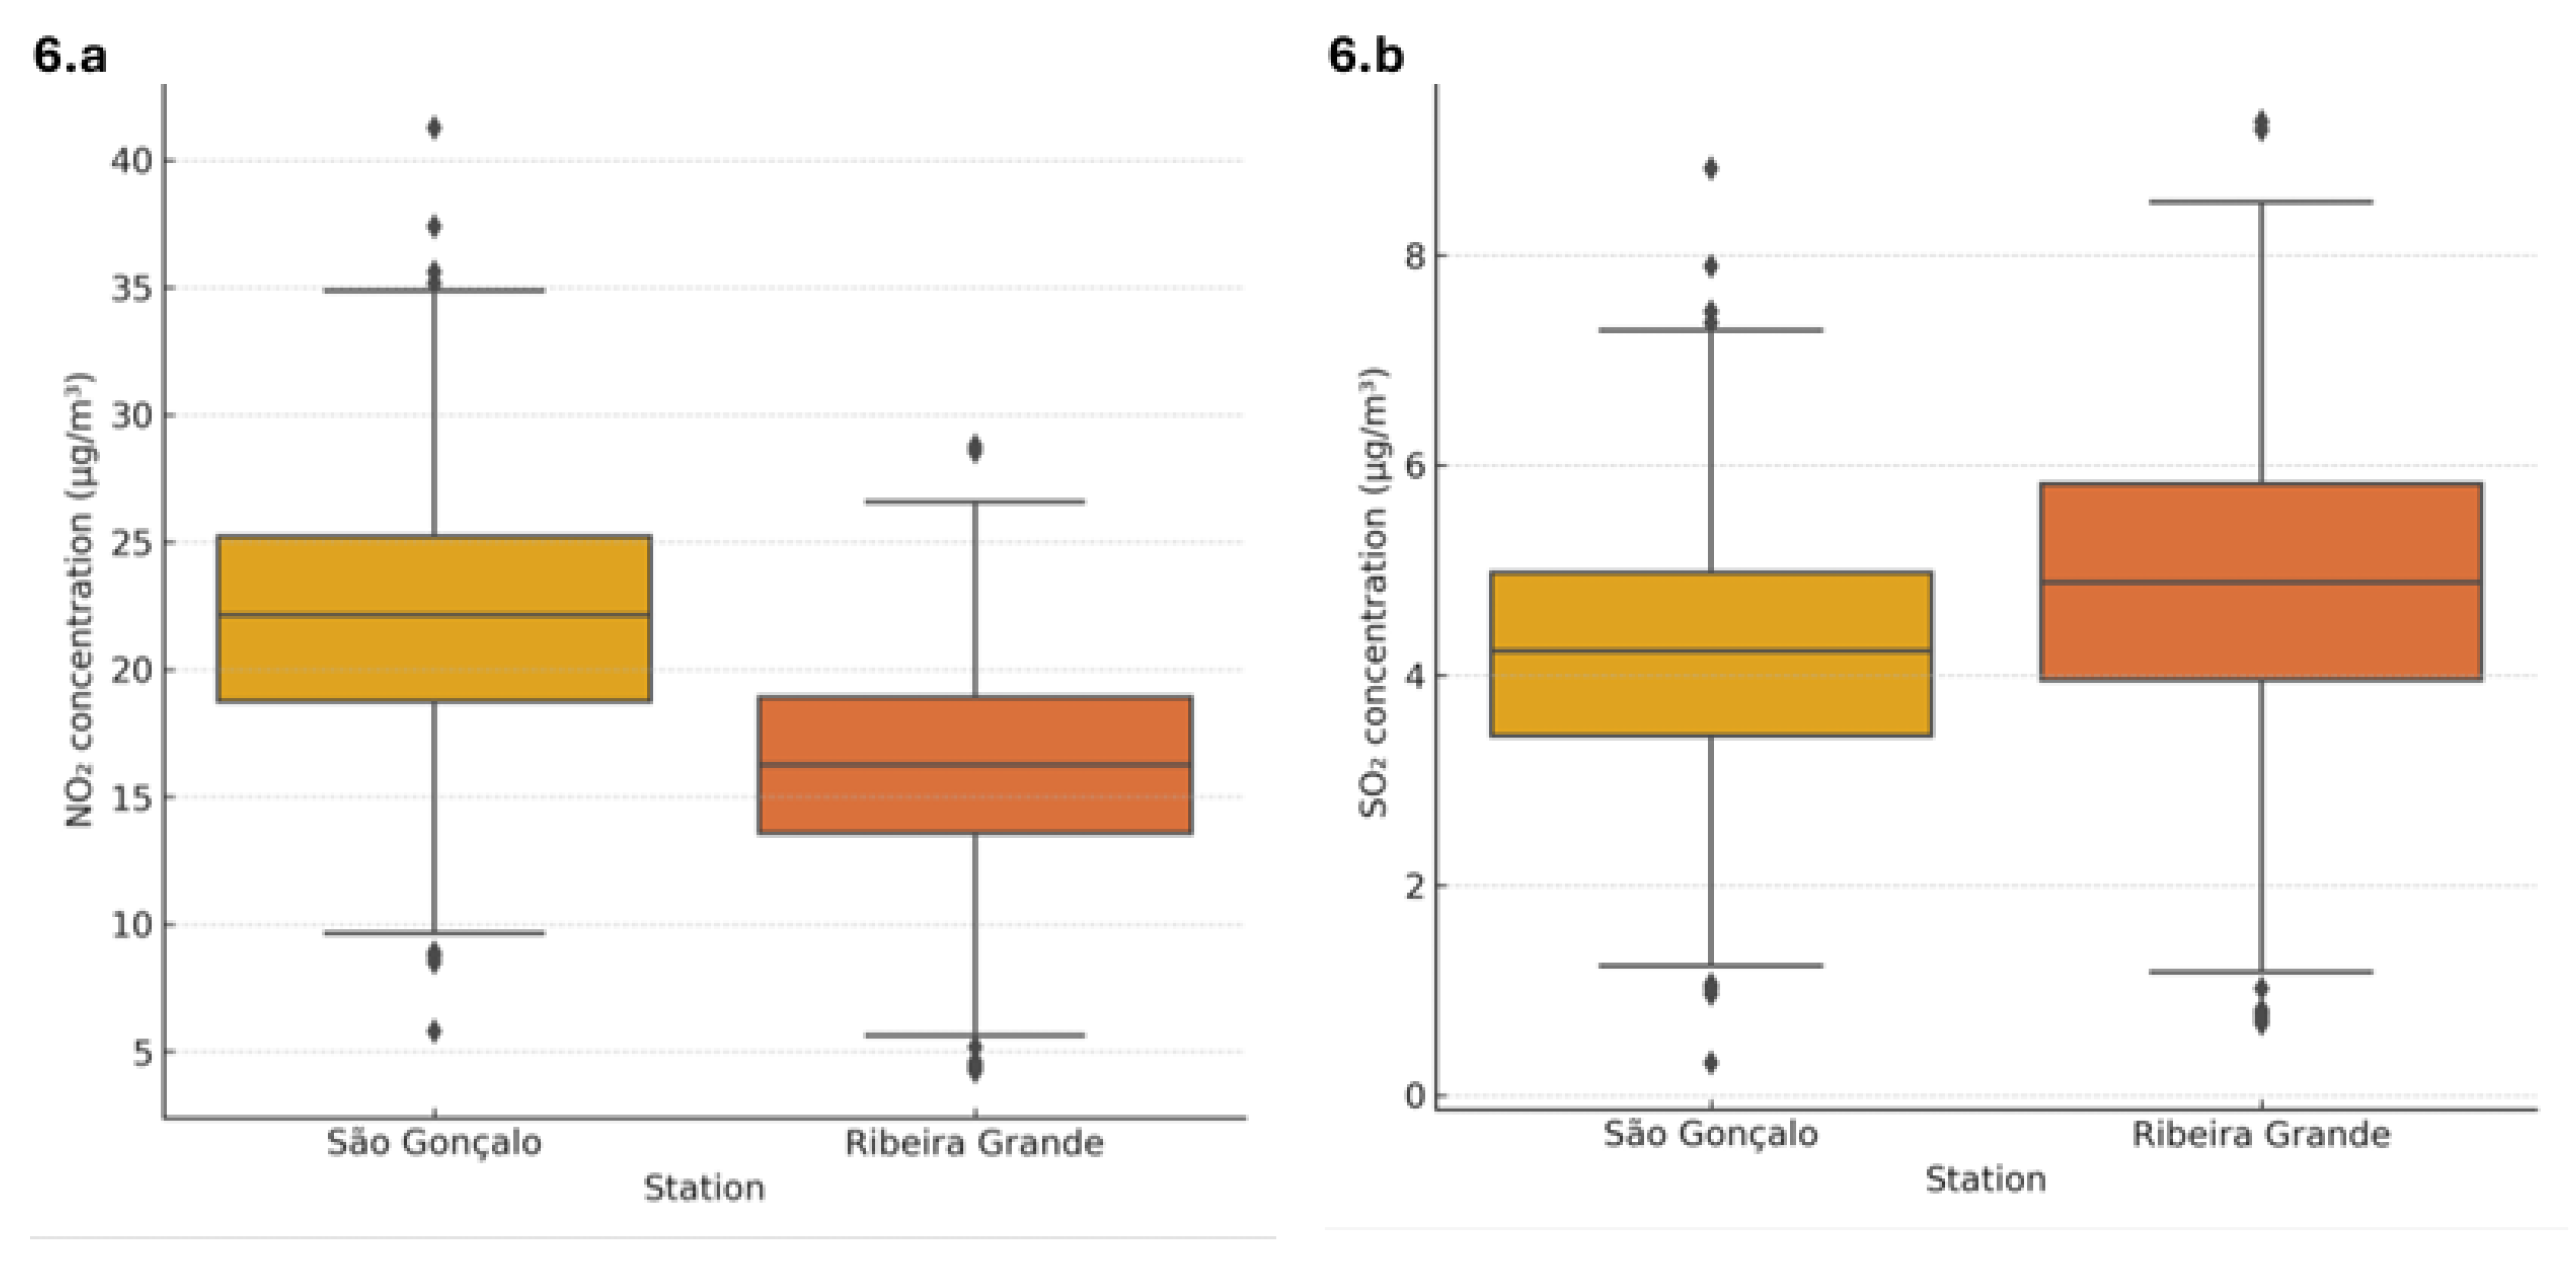
Figure 7.
Predicted daily O₃ concentrations as a function of the NAO index, based on robust linear regression models for São Gonçalo (SG) and Ribeira Grande (RG), 2017–2021. The models reveal a statistically significant positive relationship between NAO and O₃ at both stations, with a stronger response in the urban context of São Gonçalo. Shaded areas represent 95% confidence intervals around the regression line.
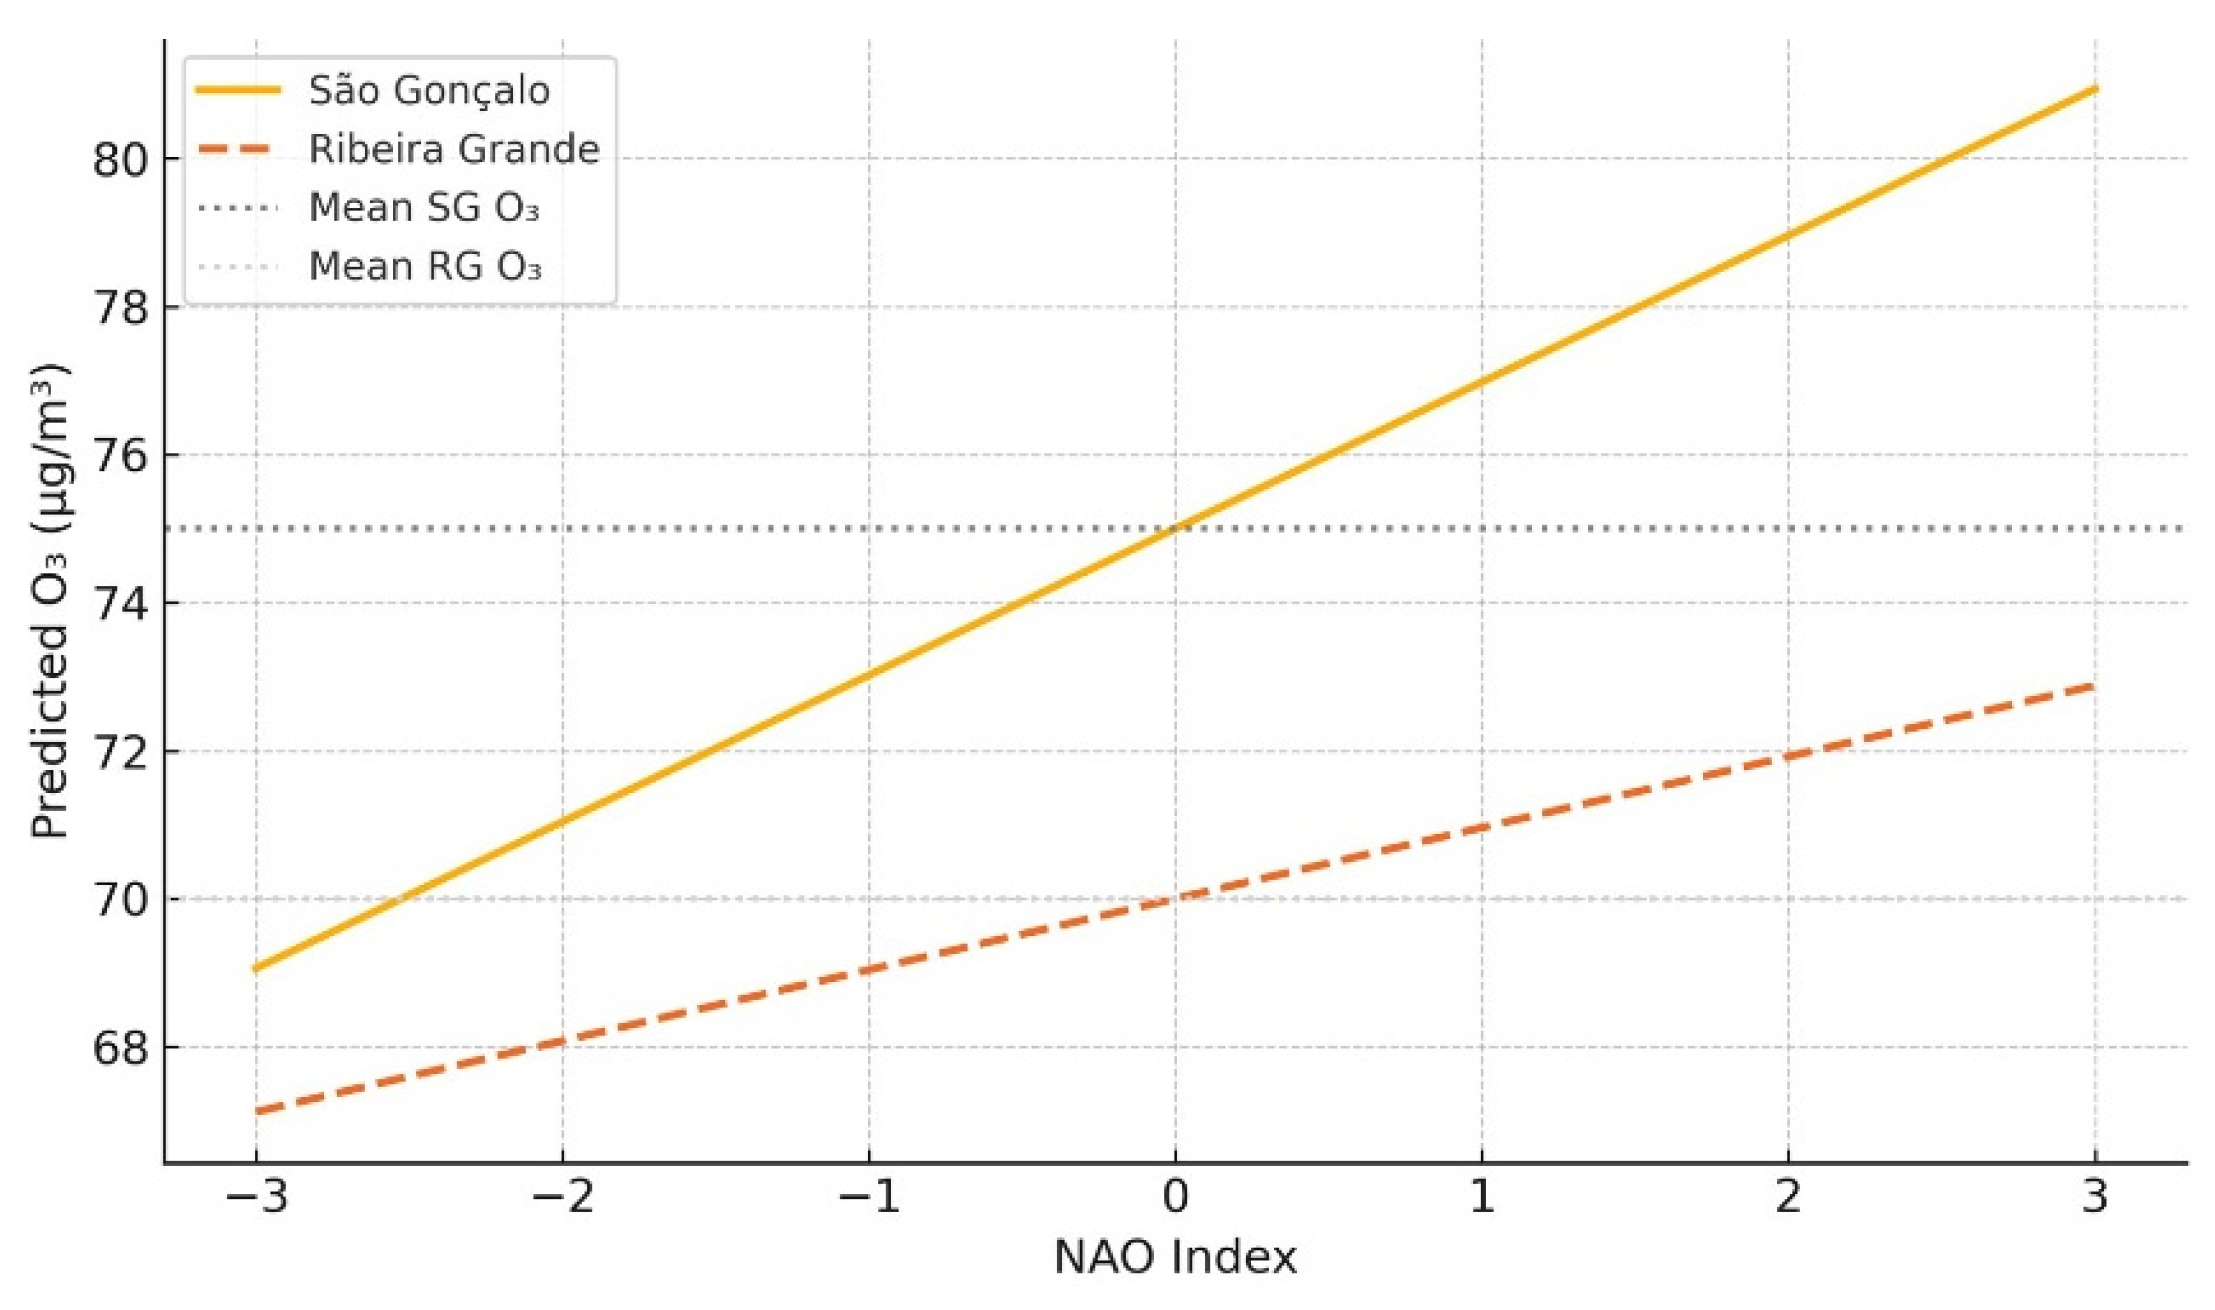
Figure 8.
Predicted daily NO₂ concentrations as a function of the North Atlantic Oscillation (NAO) index, based on robust linear regression models for São Gonçalo (SG) and Ribeira Grande (RG), covering the period 2017–2021. A significant negative association is observed in São Gonçalo, indicating lower NO₂ levels during NAO-positive phases, likely due to enhanced dispersion. No significant relationship is found for Ribeira Grande. Shaded areas denote 95% confidence intervals.
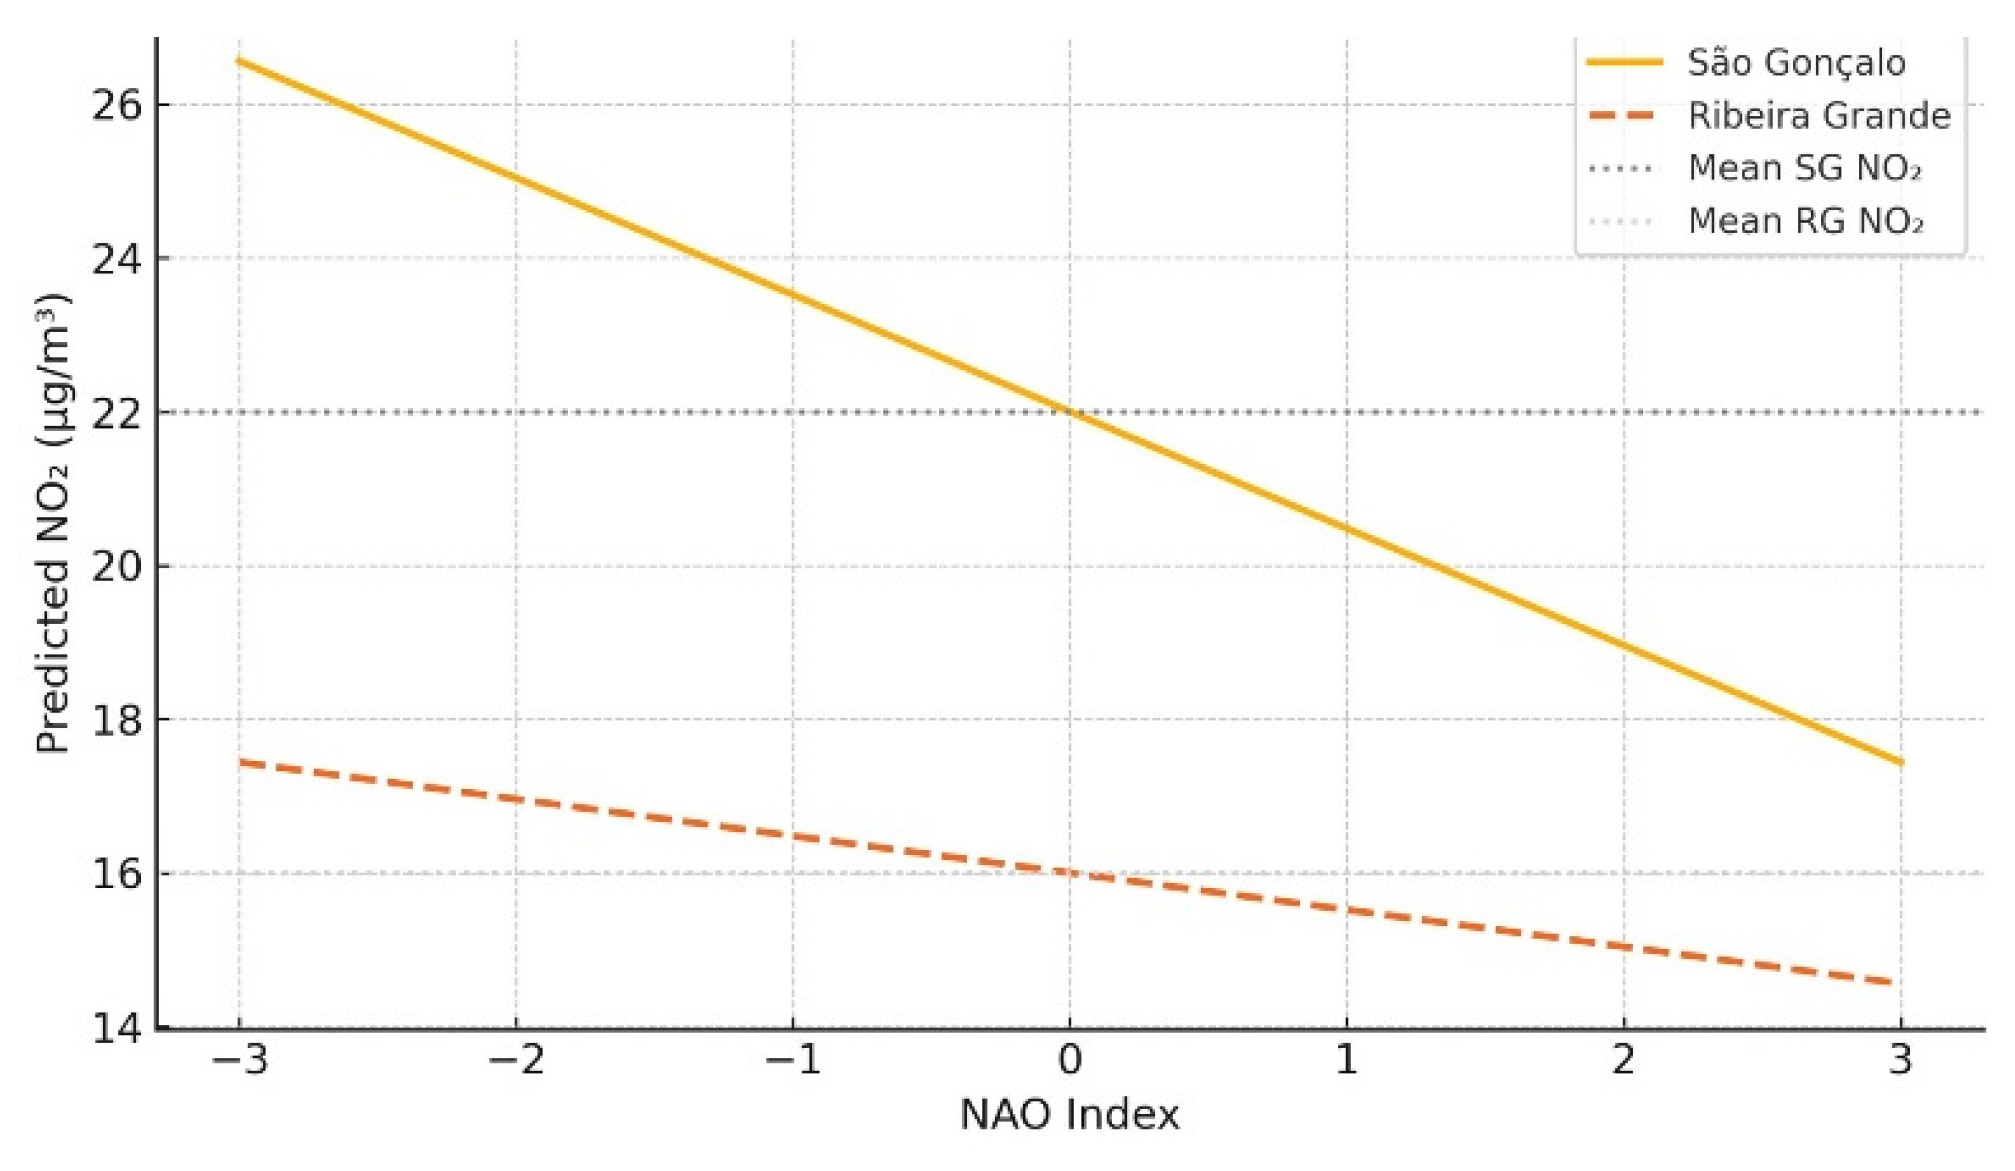
Figure 9.
Predicted daily SO₂ concentrations as a function of the North Atlantic Oscillation (NAO) index, based on robust linear regression models for São Gonçalo (SG) and Ribeira Grande (RG), during the period 2017–2021. The models indicate weak and statistically non-significant associations between NAO and SO₂ at both monitoring stations, suggesting that local or episodic sources of SO₂ are not strongly influenced by synoptic-scale circulation. Shaded bands represent 95% confidence intervals.
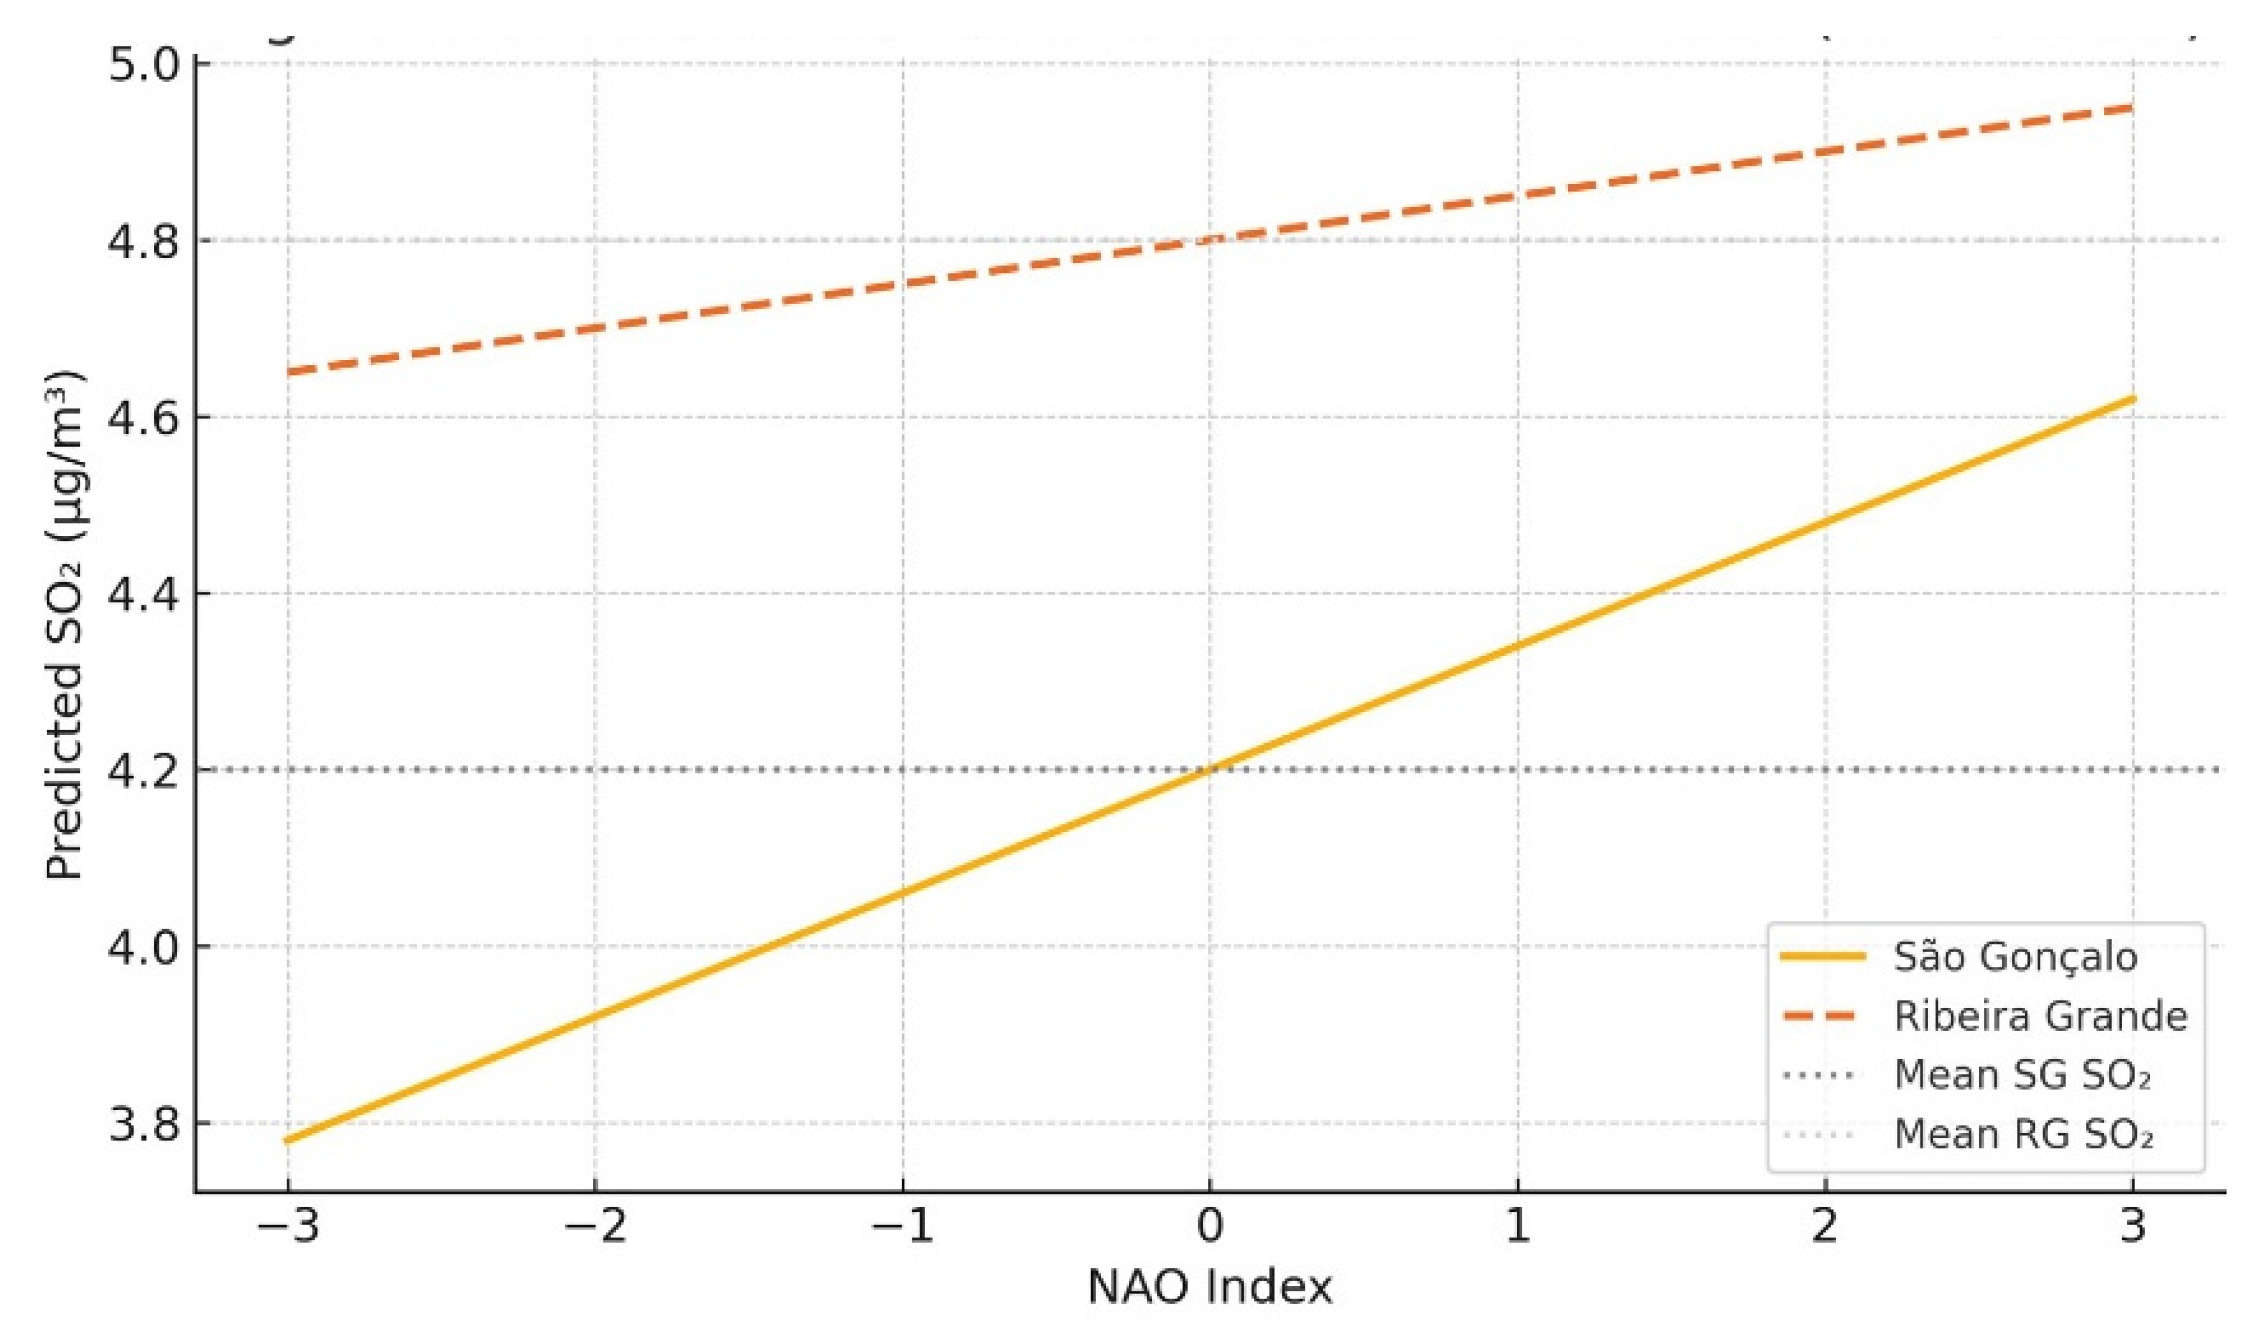
Figure 10.
Residual analysis plots for the robust linear regression models assessing the relationship between the NAO) index and pollutant concentrations at the São Gonçalo (SG) and Ribeira Grande (RG) stations. Panels (a) and (b) correspond to O₃ residuals for SG and RG, respectively; panels (c) and (d) show NO₂ residuals; panels (e) and (f) show SO₂ residuals. Residuals for O₃ and NO₂ in SG exhibit randomness and approximate normality, supporting model adequacy. In RG, residuals show greater dispersion, especially for SO₂, suggesting the influence of unaccounted local factors.
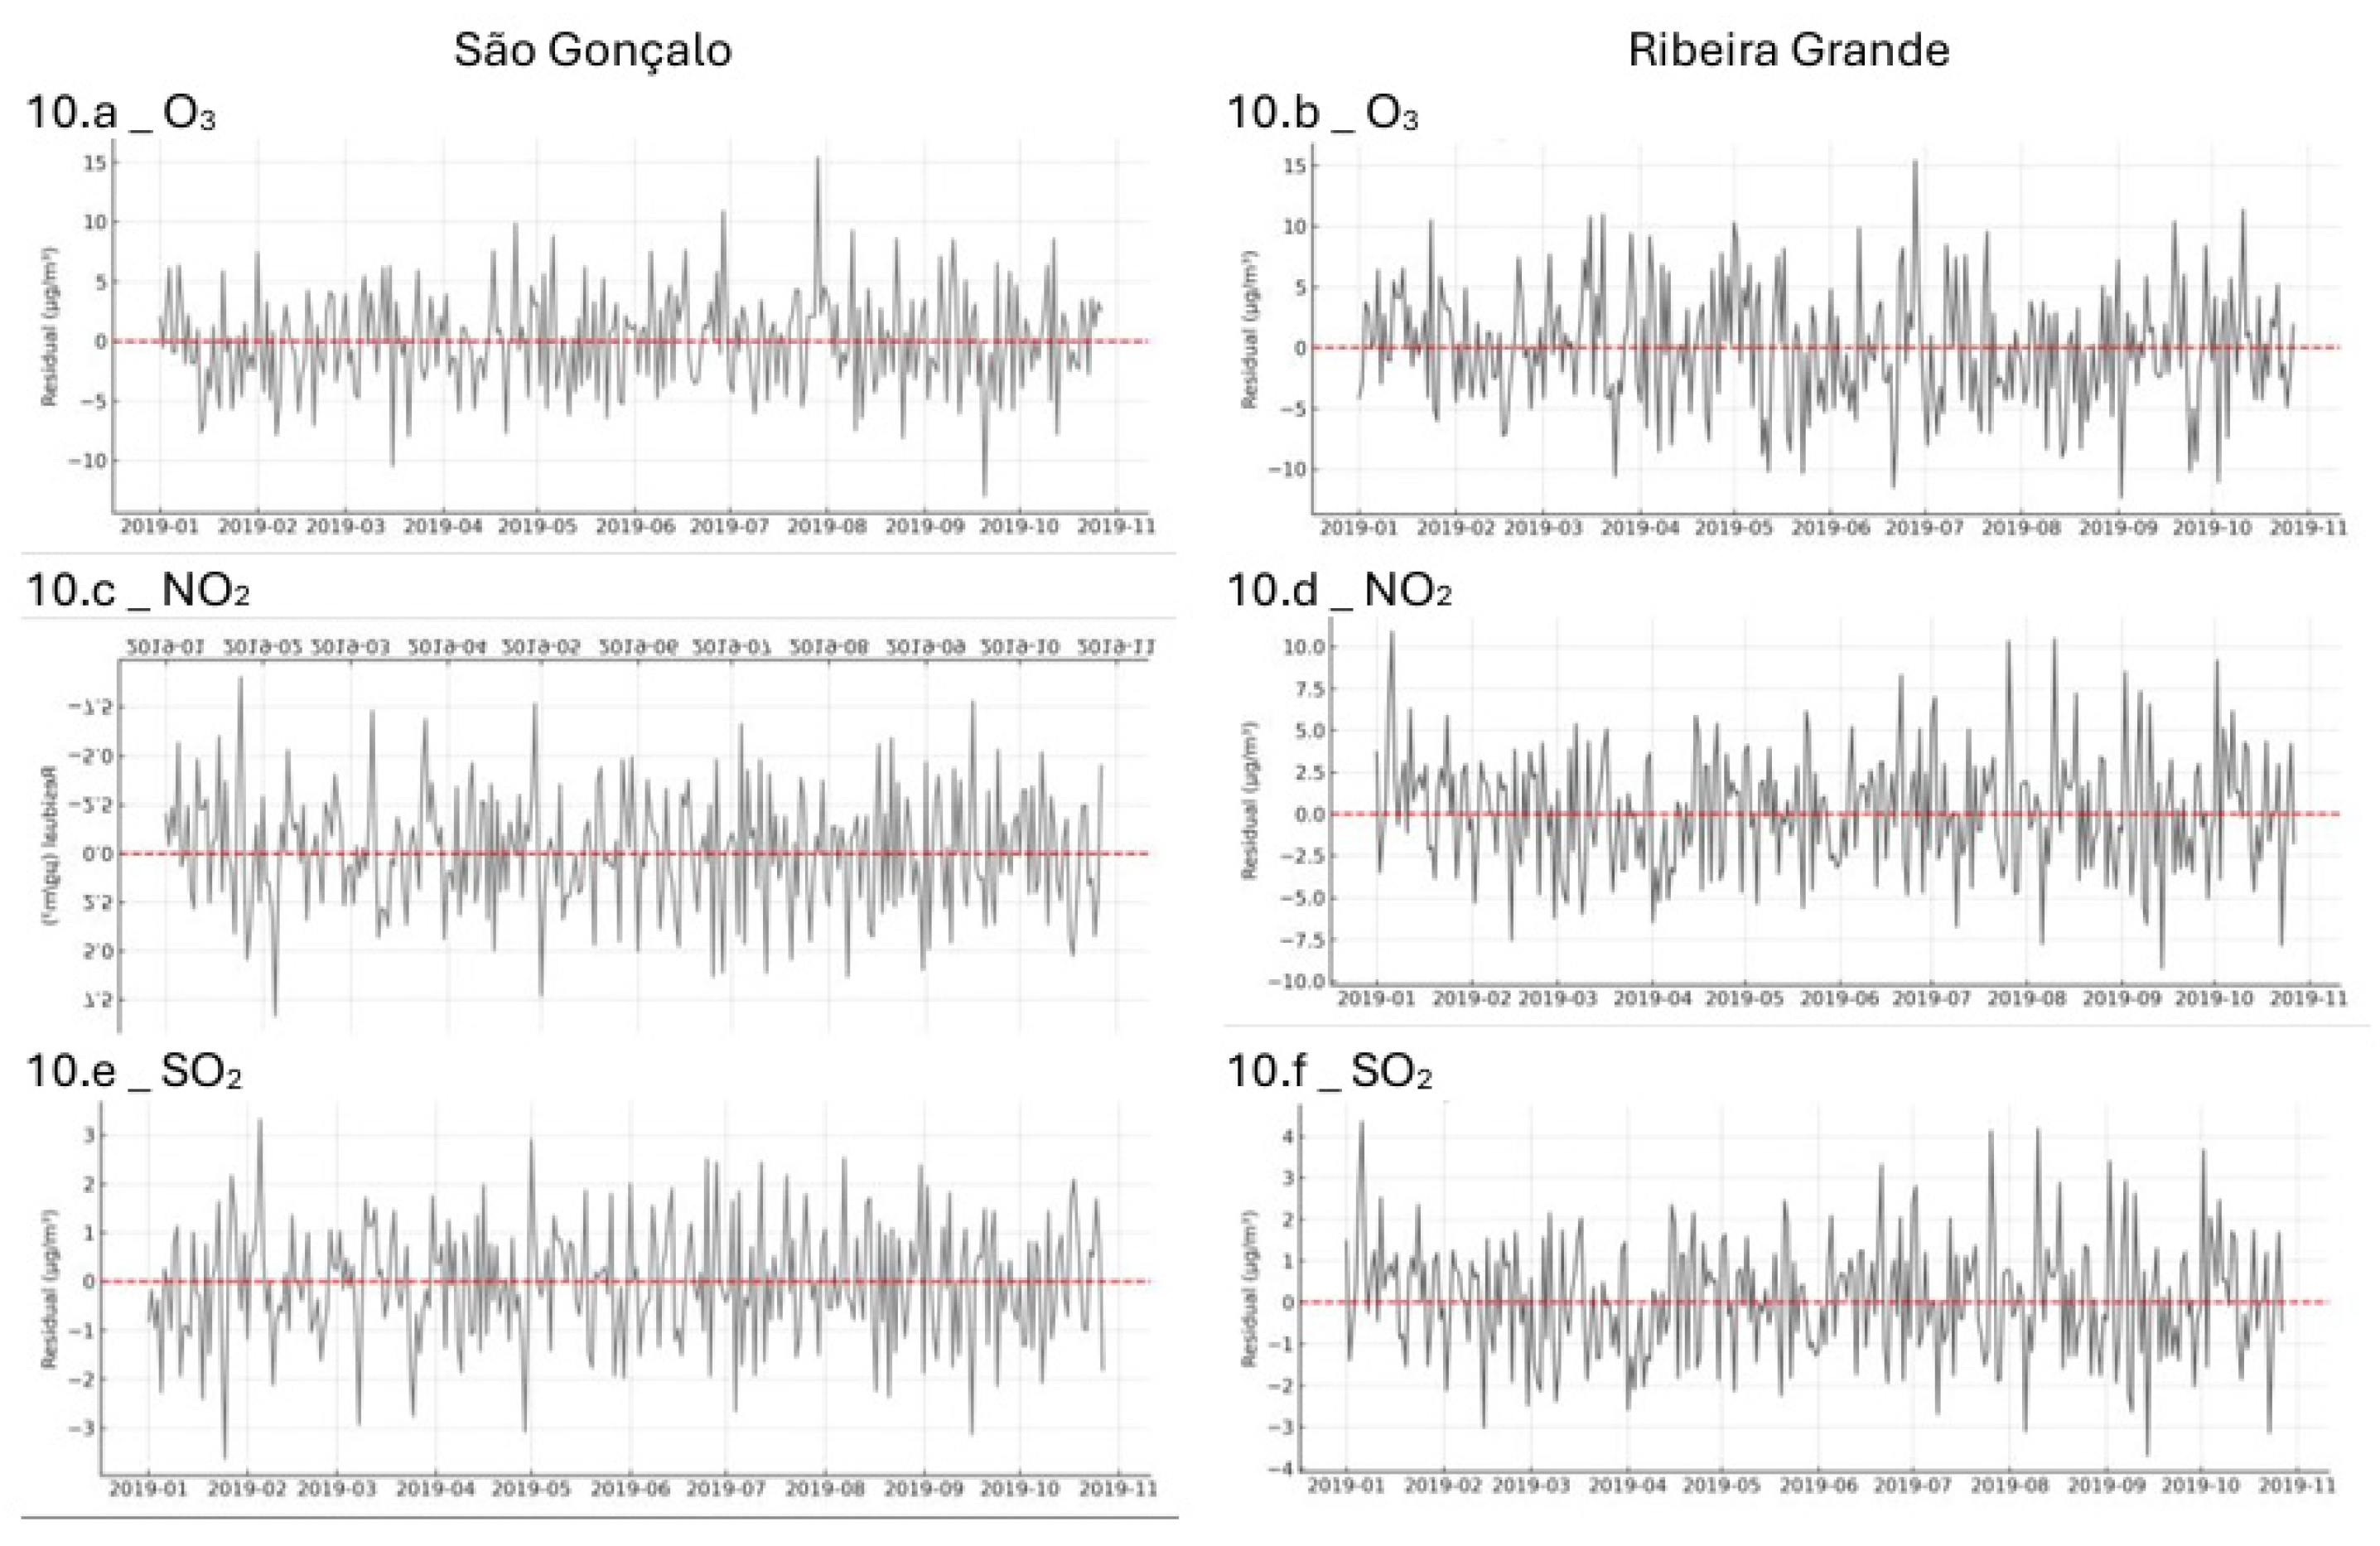

Table 1.
Descriptive statistics of daily concentrations (in µg/m³) of O₃, NO₂, and SO₂ recorded at the São Gonçalo (SG) and Ribeira Grande (RG) air quality monitoring stations on São Miguel Island, Azores, from 2017 to 2021. The table reports the mean and standard deviation (Std Dev) for each pollutant and site. O₃ concentrations were highest overall, particularly in SG. NO₂ showed elevated levels in the urban station (SG), while SO₂ concentrations were generally low at both sites, with slightly higher variability in RG.
| Pollutant | Mean (SG) | Std Dev (SG) | Mean (RG) | Std Dev (RG) |
| O₃ | 83.1 | 12.6 | 77.3 | 11.4 |
| NO₂ | 21.4 | 6.7 | 15.8 | 5.2 |
| SO₂ | 4.2 | 2.1 | 4.7 | 2.4 |
Table 2.
Seasonal Pearson correlation coefficients between the NAO index and daily concentrations of O₃, NO₂, and SO₂ at the São Gonçalo (SG) and Ribeira Grande (RG) monitoring stations from 2017 to 2021. Positive correlations for O₃, especially in summer, indicate a stronger influence of NAO-positive phases on background ozone levels, while negative correlations for NO₂ in São Gonçalo suggest pollutant accumulation during NAO-negative (stagnant) conditions. SO₂ correlations were weak and inconsistent across seasons and sites.
| Season | O₃ (SG) | O₃ (RG) | NO₂ (SG) | NO₂ (RG) | SO₂ (SG) | SO₂ (RG) |
| Winter | 0.05 | 0.03 | -0.12 | -0.08 | 0.01 | -0.02 |
| Spring | 0.18 | 0.12 | -0.2 | -0.05 | 0.06 | 0.04 |
| Summer | 0.23 | 0.15 | -0.4 | -0.09 | 0.1 | 0.07 |
| Autumn | 0.11 | 0.08 | -0.18 | -0.04 | 0.03 | 0.01 |
Table 3.
Coefficients (β) and significance levels (p-values) from robust linear regression models assessing the influence of NAO index on daily concentrations of O₃, NO₂, and SO₂ at the São Gonçalo (SG) and Ribeira Grande (RG) monitoring stations (2017–2021). Statistically significant positive associations were found for O₃ at both stations, particularly in SG. A strong negative relationship was observed between NAO and NO₂ in SG, while SO₂ showed weak and non-significant associations with the NAO index.
| Pollutant | β (SG) | p-value (SG) | β (RG) | p-value (RG) |
| O₃ | 1.98 | <0.001 | 0.96 | 0.042 |
| NO₂ | -1.52 | <0.001 | -0.48 | 0.185 |
| SO₂ | 0.14 | 0.217 | 0.05 | 0.482 |
Disclaimer/Publisher’s Note: The statements, opinions and data contained in all publications are solely those of the individual author(s) and contributor(s) and not of MDPI and/or the editor(s). MDPI and/or the editor(s) disclaim responsibility for any injury to people or property resulting from any ideas, methods, instructions or products referred to in the content. |
© 2025 by the authors. Licensee MDPI, Basel, Switzerland. This article is an open access article distributed under the terms and conditions of the Creative Commons Attribution (CC BY) license (http://creativecommons.org/licenses/by/4.0/).
Copyright: This open access article is published under a Creative Commons CC BY 4.0 license, which permit the free download, distribution, and reuse, provided that the author and preprint are cited in any reuse.


