Submitted:
26 June 2025
Posted:
27 June 2025
You are already at the latest version
Abstract
IntroductionCholecystitis, typically caused by gallstone obstruction, presents with fever and right upper quadrant pain and may lead to severe complications like sepsis or death if untreated. Acalculous cholecystitis, though less common, carries a higher mortality rate of 15–40% compared to the overall 3%, especially in elderly and comorbid populations. Laparoscopic cholecystectomy is the preferred treatment within 7–10 days of symptom onset, with risk assessment tools (e.g., APACHE, P-POSSUM) guiding urgency. Some high-risk patients may require percutaneous cholecystostomy. This study examines U.S. cholecystitis mortality trends from 1999 to 2020, focusing on age-adjusted mortality rates (AAMR) and disparities among elderly and geographically diverse populations, to inform future health strategies.MethodsThis study utilized mortality data from the CDC-WONDER database, analyzing deaths attributed to cholecystitis (ICD-10 code K81) in individuals aged ≥35 years from 1999 to 2020. As the dataset was publicly available and de-identified, IRB approval was not required. Adhering to STROBE guidelines, the analysis included variables such as age, gender, race or ethnicity, place of death, census region, urban-rural classification, and state. Crude death rates (CDRs) and age-adjusted mortality rates (AAMRs) were calculated using the 2000 U.S. standard population. Trends in AAMRs across demographic and geographic subgroups were evaluated using Joinpoint Regression software to compute Annual Percentage Changes (APCs) and Average Annual Percentage Changes (AAPCs), with statistical significance assessed via Monte Carlo Permutation Tests. A p-value < 0.05 was considered significant.ResultsFrom 1999 to 2020, there were 72,843 cholecystitis-related deaths in the U.S., with a modestly increasing overall age-adjusted mortality rate (AAMR) and an average annual percentage change (AAPC) of 0.396%. The AAMR rose from 9.53 in 1999 to 10.7 per million in 2020, with a significant increase seen after 2012. Males consistently had higher mortality rates than females (AAMR: 12.06 vs. 8.40), with male mortality rising notably post-2013. Among racial groups, Black or African Americans had the highest AAMR (10.94), followed by Whites (9.80) and Asian or Pacific Islanders (7.93), with significant temporal shifts observed especially in Black individuals. Regionally, the West showed the highest AAMR (10.36), with West Virginia having the highest state-specific AAMR (13.15). Most deaths (78.7%) occurred in inpatient medical settings. Mortality sharply increased with age, with those aged ≥85 showing a crude rate of 224.6 per million. Urban-rural disparities revealed higher mortality in rural populations (AAMR: 11.48 vs. 9.23), and trends differed significantly across age, sex, race, and geography based on Cuzick and Kruskal-Wallis tests. DiscussionOur analysis of mortality trends due to cholecystitis in the United States from 1999 to 2020 revealed an overall rise in age-adjusted mortality rates (AAMRs), with a particularly steep increase observed from 2012 to 2020. Males consistently exhibited higher mortality than females, with a significant increase in AAMR among men, especially after 2013, while female trends remained largely stable. Racial disparities were evident, with Black individuals experiencing a notable decline in mortality from 2004 to 2011, likely reflecting healthcare reforms, whereas White individuals showed a steady rise in mortality. The highest mortality was seen in patients aged 85 and older, followed by those aged 75–84, largely due to comorbidities and surgical risks. Regionally, states such as West Virginia, Tennessee, and Oklahoma had the highest AAMRs, while Michigan, Florida, and New York had the lowest, potentially reflecting disparities in healthcare infrastructure. Urbanization did not significantly affect mortality trends. Despite women having a higher incidence of gallstones, men had worse outcomes, possibly due to stone composition and surgical complications.
Keywords:
cholecystitis
; age-adjusted mortality rates
; average annual percentage change
; percutaneous cholecystostomy
; cholecystectomy
Introduction
Cholecystitis is the inflammation of gallbladder, most commonly seen due to obstruction with gallstones at the neck. Cases without gallstones, known as acalculous cholecystitis are recognized but uncommon. It presents with fever, and right upper quadrant pain, generally requiring surgical excision and antibiotics. Murphy’s sign or tenderness during the right upper quadrant on deep inspiration during palpation is classic for the disease. It is more common in middle ages, female gender and obese populations due to physiologic tendency to form gallstones. Untreated patients often suffer fatal complications including perforation, sepsis, and even death.
Laparoscopic cholecystectomy is preferred within 7 days of hospitalization or 10 days of symptom onset. It is important to triage higher-risk patients for a sooner intervention. Scores including APACHE, P-POSSUM, or Charlson Comorbidity Index have been employed to assess risk. Sicker patients sometimes undergo percutaneous cholecystostomy (PTC) [1].
The overall cholecystitis-related mortality is about 3% and increases in the elderly, particularly in people with comorbidities. Differently, a higher rate of mortality occurs in acalculous cholecystitis, where it can be as high as 15–40% [2]. Most recent mortality studies have shown a flat trend from 2009 to 2018 across multiple subgroups [3].
Our study aimed to examine the mortality rates due to cholecystitis within the United States from 1999 to 2020. Our study aims to aims to look at longer trends starting from 1999 with extending till 2020. By employing age-adjusted mortality rates (AAMR), we aimed to identify disparities among diverse population groups. Our primary objective was to evaluate temporal trends and geographical variations in cholecystitis-related mortality specifically among the elderly U.S. population. Understanding trends in health outcomes is vital for developing strategies addressing the rising burden of cholecystitis.
Method
Study Design
The mortality data for this study was sourced from the Centers for Disease Control and Prevention (CDC) Wide-Ranging Online Data for Epidemiologic Research (CDC-WONDER) database [4], which is a government-maintained repository containing death certificate data from all 50 US states and the District of Columbia. Since this study used publicly available, de-identified data, we did not require institutional review board (IRB) approval. Our analysis focused on deaths from cholecystitis, defined by the International Classification of Diseases Tenth Revision (ICD-10) codes K81, in individuals aged ≥ 35 years. The multiple cause-of-death data from 1999 to 2020 was used to include all cases where cholecystitis was mentioned on the death certificate. The study adhered to the Strengthening the Reporting of Observational Studies in Epidemiology (STROBE) guidelines [5].
Data Extraction
The patient characteristics extracted from the dataset included population, year, gender, race or ethnicity, age group, place of death, urban-rural classification, census region, and state. There were 3 categories for race or ethnicity considered in the analysis: Black or African American, White, and Asian or Pacific Islander. Place of death was classified into inpatient medical facility, outpatient medical facility or ER, decedent’s home, nursing home or long-term care center, and other. Each age group had a 10-year interval: 35-44, 45-54, 55-64, 65-74, 75-84, and ≥ 85 years. Census regions were classified into Northeast, Midwest, South, and West. Urban and rural areas were defined as those categorized under Large Central Metro and Micropolitan areas, respectively, in the CDC-WONDER according to the 2013 urbanization status. In the CDC-WONDER 2013 Urbanization Classification, a Large Central Metro area refers to counties within metropolitan statistical areas (MSAs) that have a population of 1 million or more and are located within the principal cities of the MSA. In contrast, a Micropolitan area consists of counties within micropolitan statistical areas, which have an urban core population ranging between 10,000 and 49,999.
Statistical Analysis
The crude death rate (CDR) per 100,000 individuals was calculated by dividing the number of cholecystitis-related deaths by the total population in that year. Furthermore, age-specific mortality rates were calculated and applied to the USA 2000 standard population’s age distribution to calculate Age-Adjusted Mortality Rates (AAMRs) as a means of direct standardization of the death rates. This made an adequate comparison of diverse populations possible. AAMRs were employed to investigate death trends by gender, race or ethnicity, census region, specific states, and urban-rural areas.
The Annual Percentage Changes (APCs) and Average Annual Percentage Changes (AAPCs) in AAMRs, along with 95% confidence intervals (95% CIs), were calculated using the Joinpoint Regression Program 5.0.2 (Statistical Research and Applications Branch, National Cancer Institute) [6]. The Annual Percentage Change (APC) measures the yearly rate of change in a trend (e.g., disease incidence or mortality), assuming a constant percentage increase or decrease per year. The Average Annual Percentage Change (AAPC) summarizes trends over multiple years by averaging APCs across different time segments, providing an overall trend estimate. This software identifies the optimal joinpoint model by testing various joinpoints and assessing statistical significance through Monte Carlo Permutation Tests [7]. To categorize APCs as increasing or decreasing, their deviation from zero was evaluated using a two-tailed t-test, considering a p-value < 0.05 statistically significance.
Results
Overall Trend
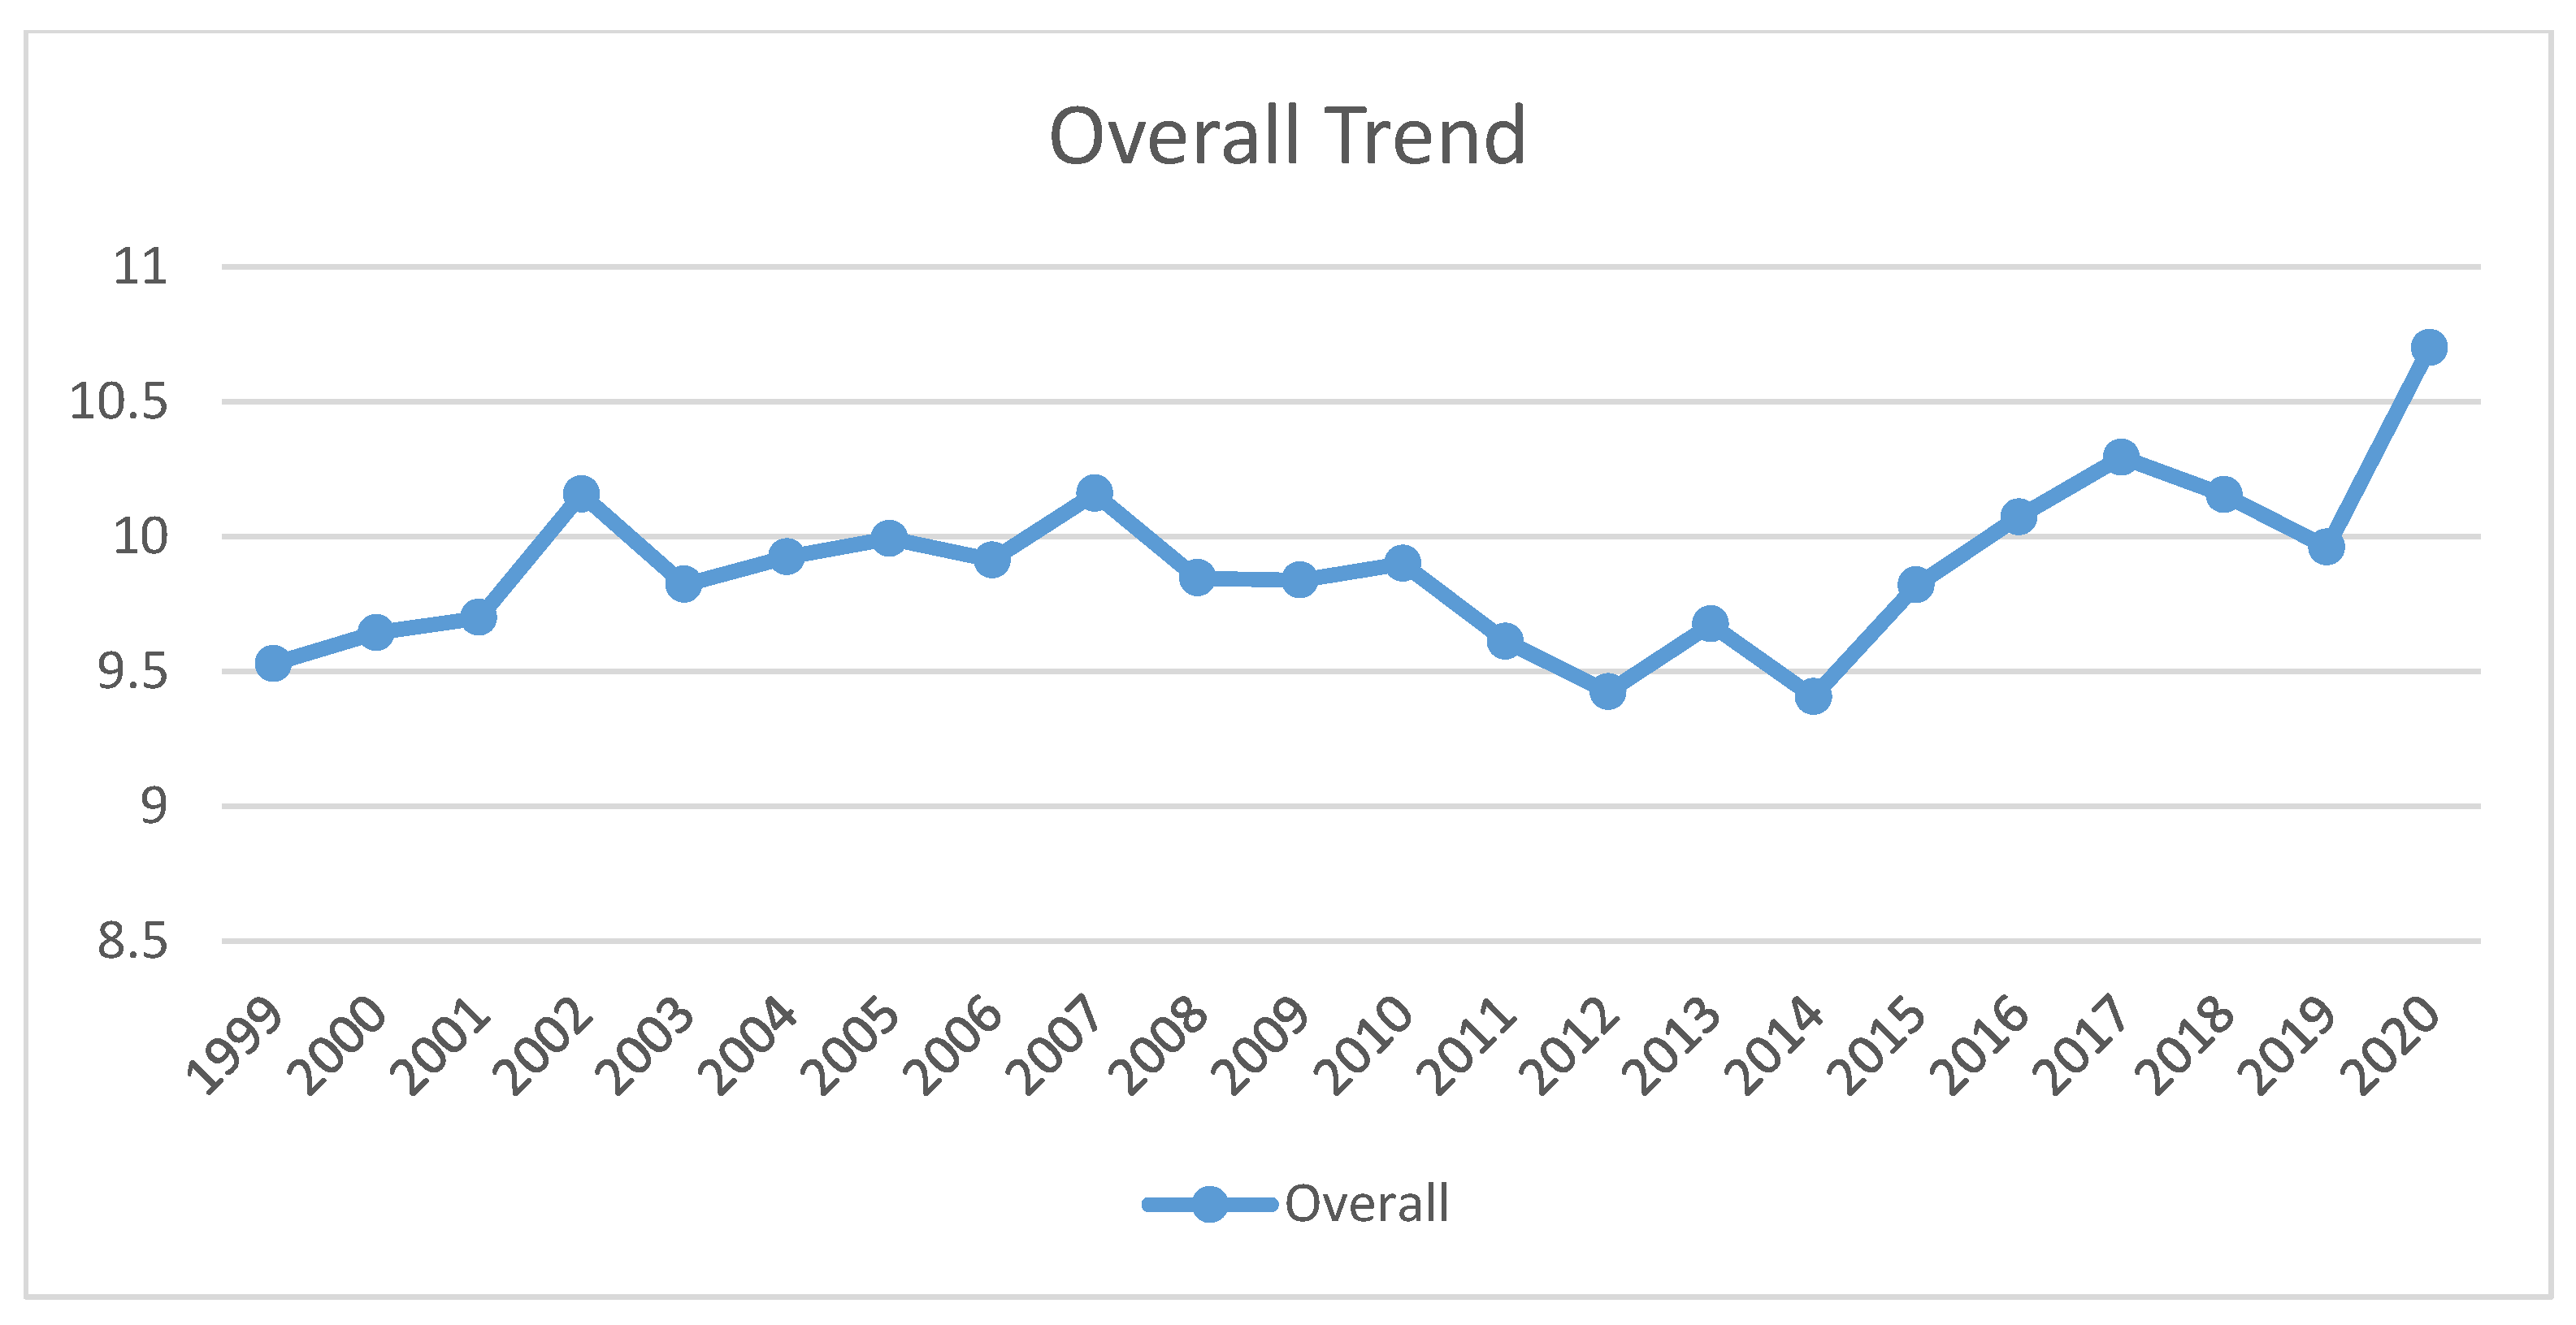
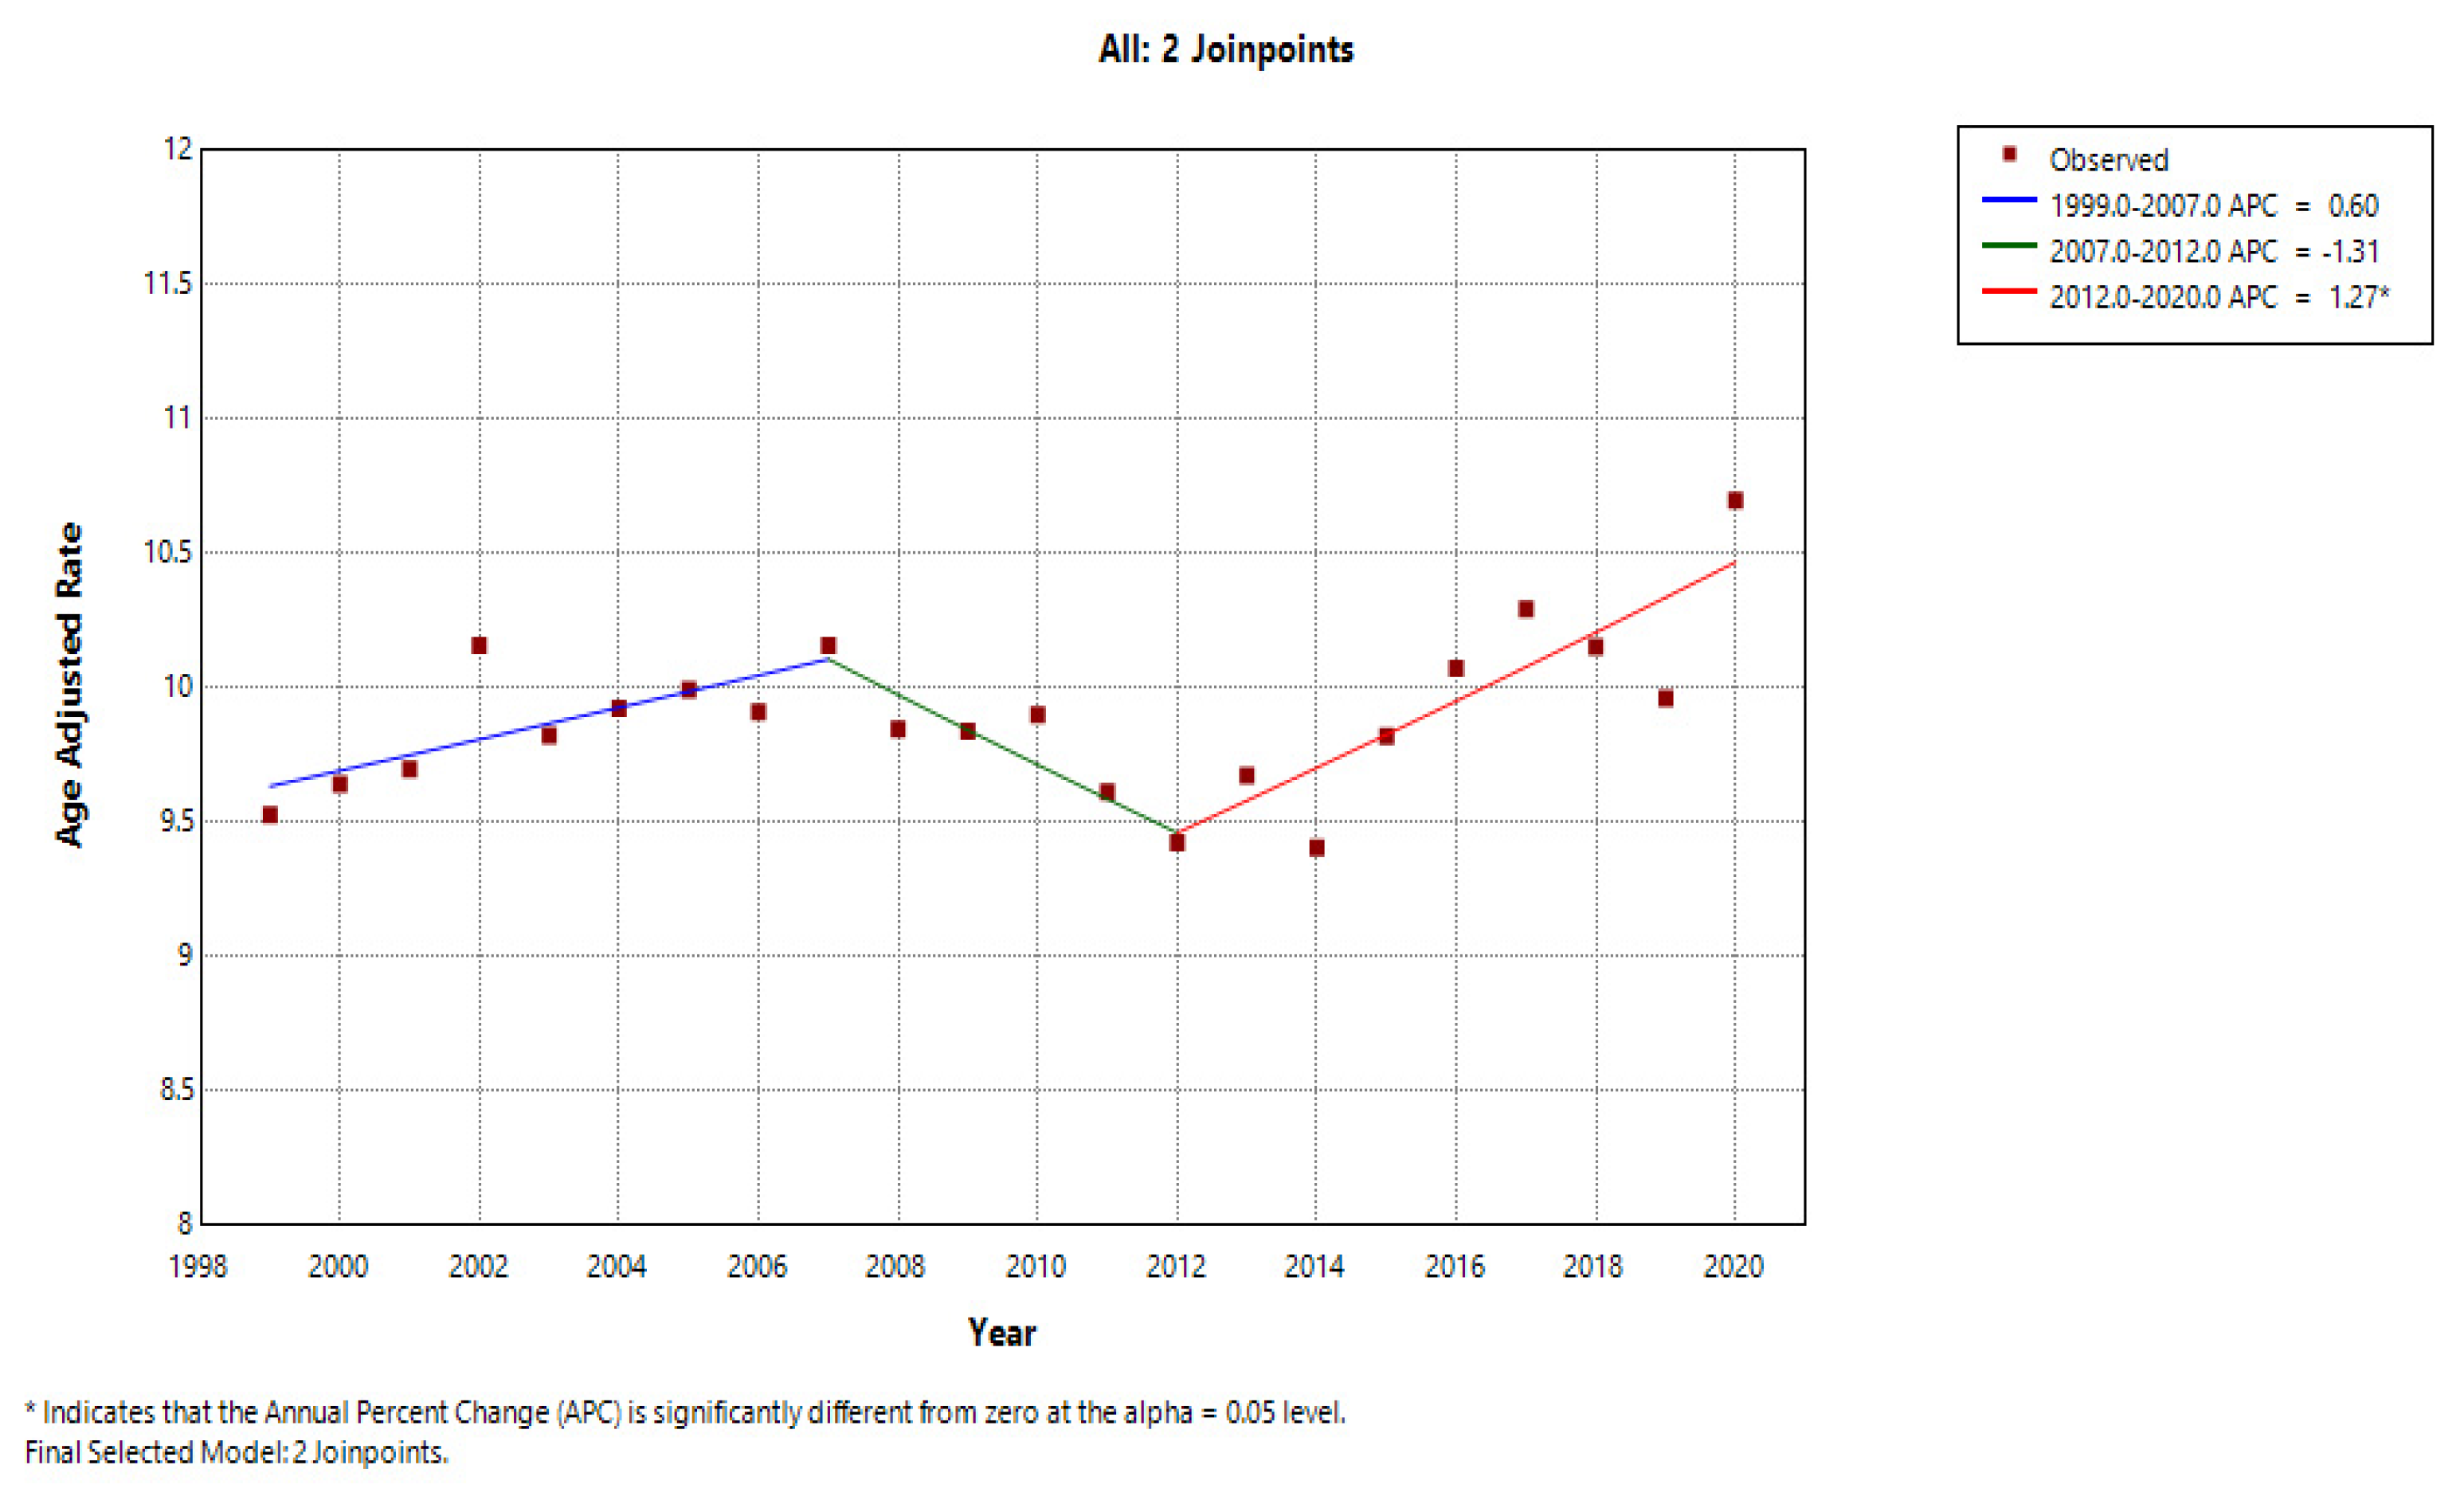
A total of 72843 individuals with cholecystitis died from 1999 to 2020, with an AAPC of 0.396 (95% CI = -0.15 to 0.945). The average AAMR per 1,000,000 was 9.89 (95% CI = 9.818 to 9.962). In 1999, the AAMR was recorded at 9.529 (95% CI = 9.162 to 9.895). This rate eventually increased to 10.7 (95% CI = 10.38 to 11.02) in 2020. The AAMR steadily increased from 1999 to 2007 with an APC of 0.6003 (95% CI = -0.127 to 1.333). Thereafter, a decline in the AAMR was observed till 2012 with an APC of -1.131 (95% CI = -3.248 to 0.663). This is followed by a steep rise in AAMR observed from 2012 to 2020 with an APC of 1.272 (95% CI =0.6387 to 1.9109). We applied the Cuzick test across overall and found a Z value of 1.42 (Prob > |z| = 0.154).
Gender Distribution
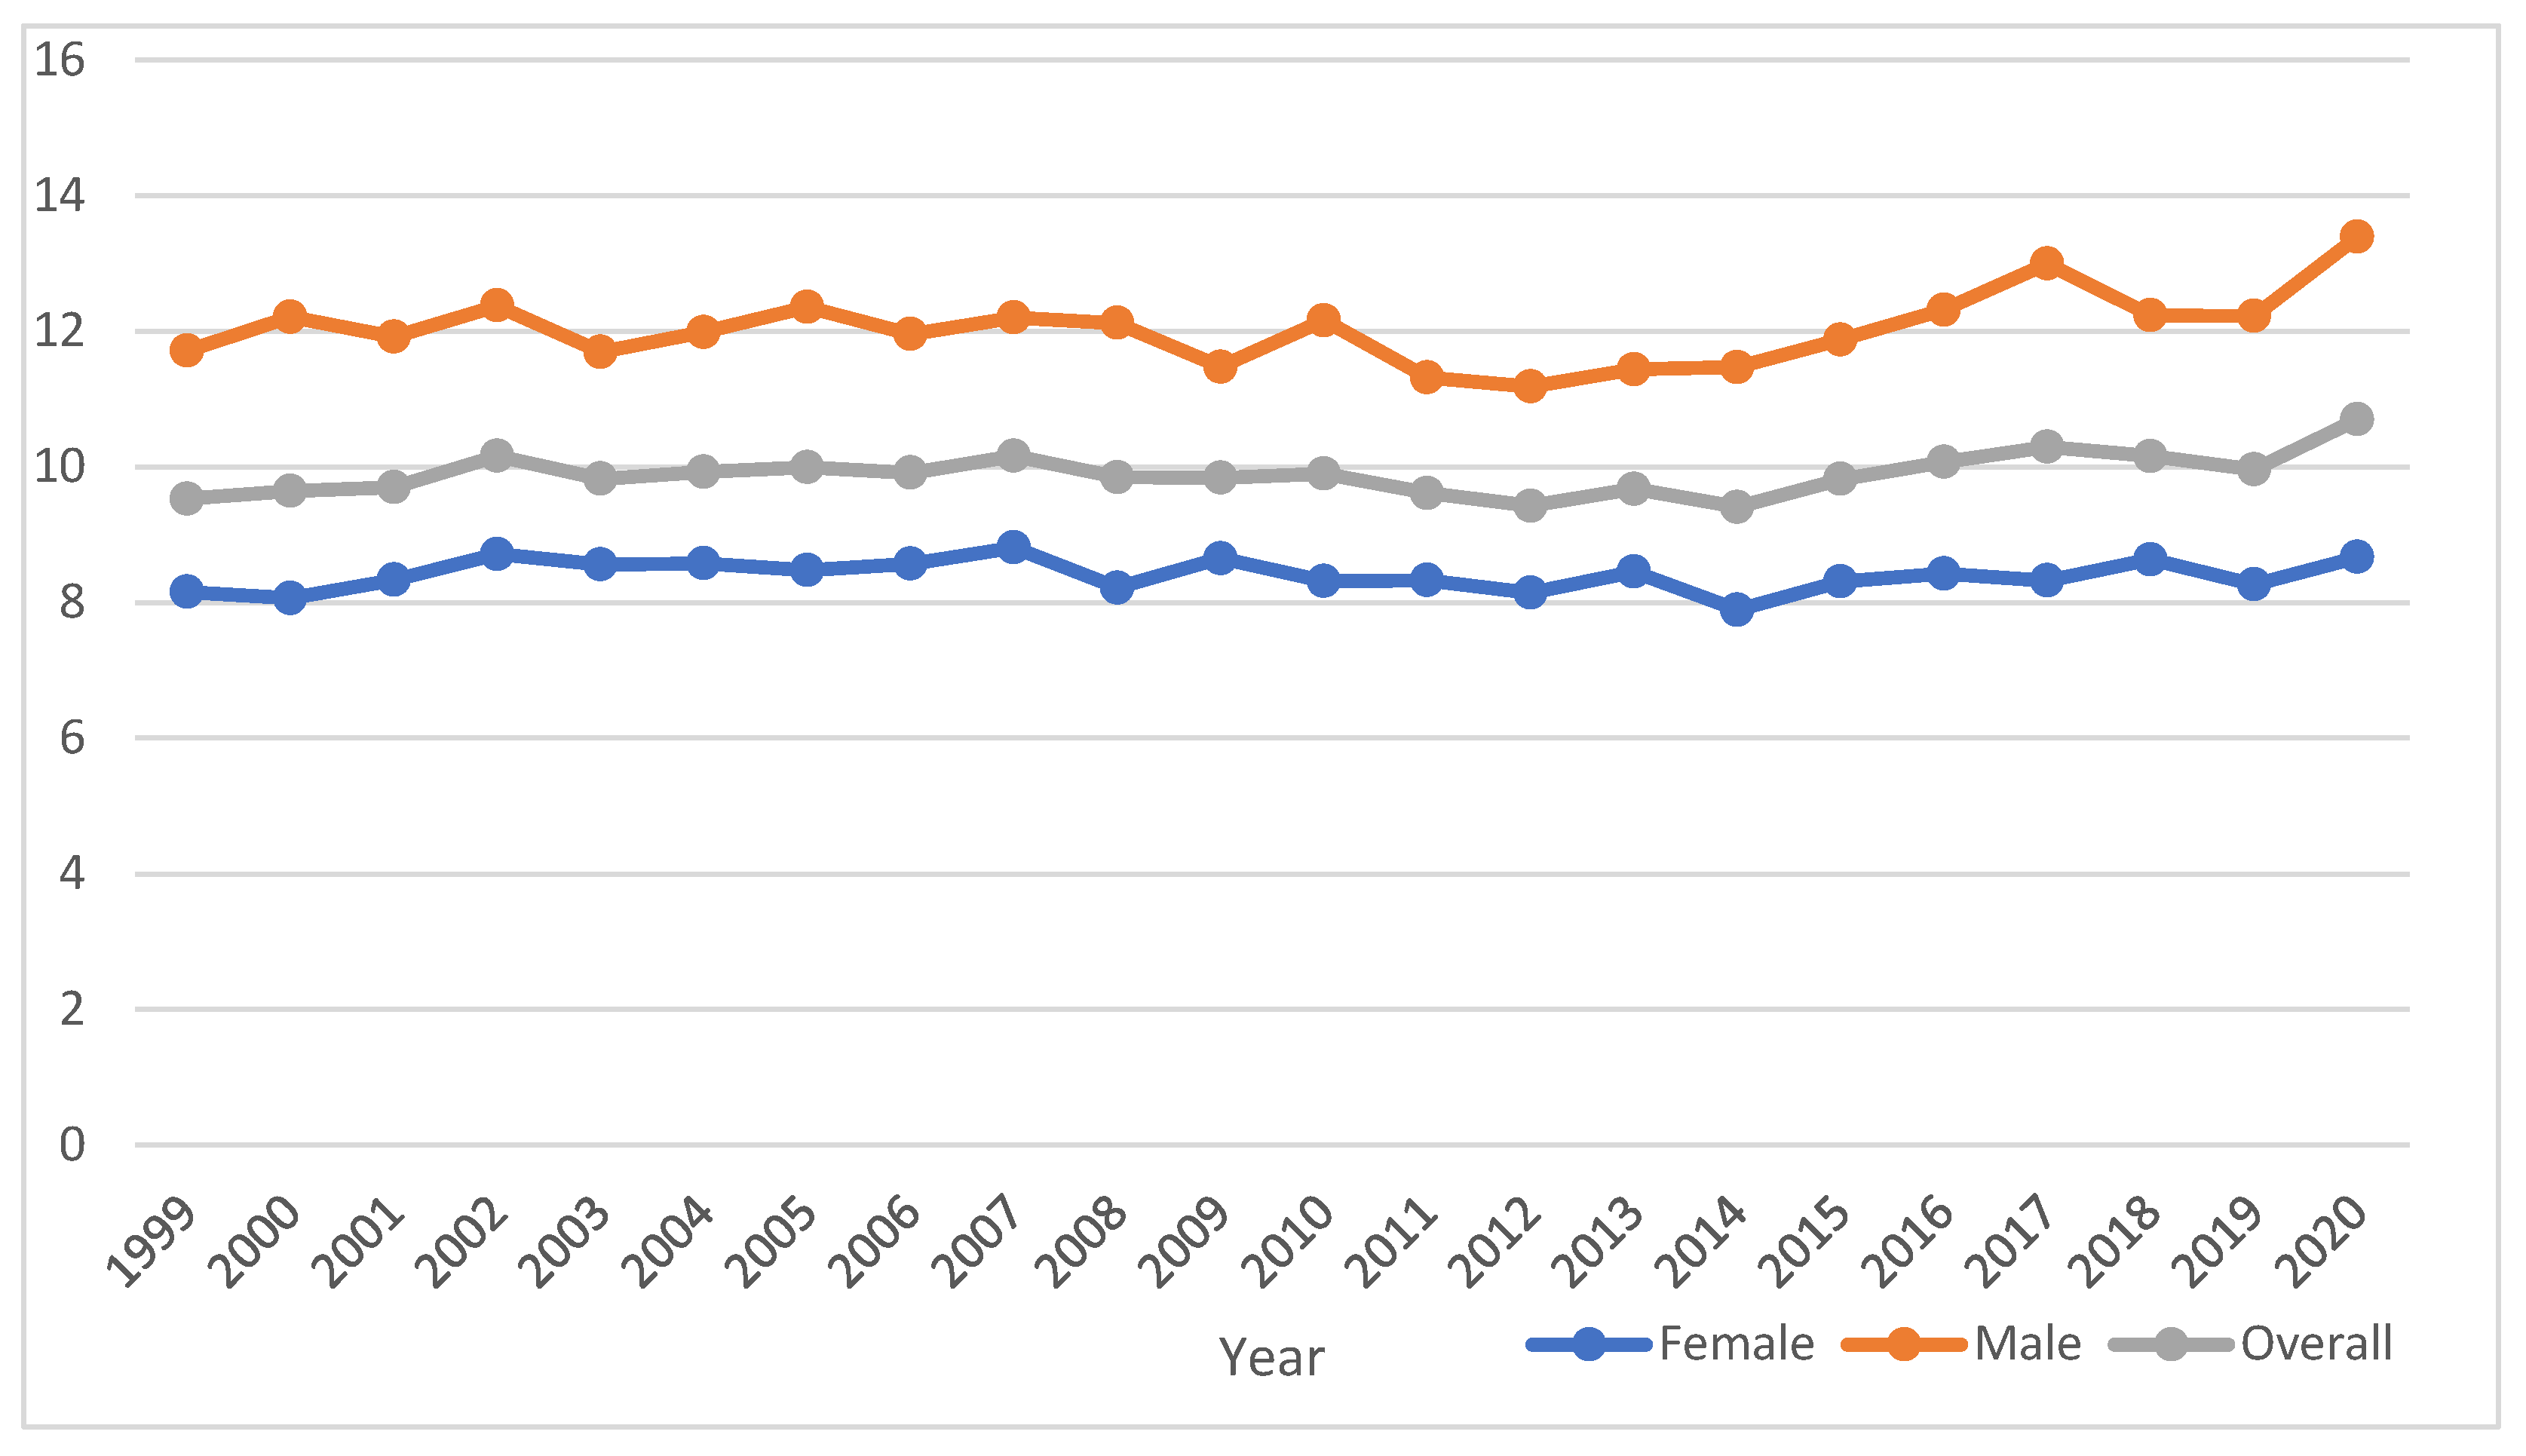
From 1999 to 2020, males exhibited an AAMR of 12.061 (95% CI = 11.935 to 12.188), while females exhibited an AAMR of 8.399 (95% CI =8.312 to 8.485). During this period, the AAMR for males increased considerably from 11.713 (95% CI = 11.041 to 12.385) to 13.392 (95% CI = 12.843 to 13.941), and the AAMR for females increased slightly from 8.157 (95% CI = 7.723 to 8.591) to 8.668 (95% CI = 8.285 to 9.05). The AAMR in males exhibited a declining trend at first from 1999 to 2013, with an APC of -0.4255 (95% CI = -0.917 to 0.068) then a rise from 2013 to 2020 with APC of 1.784 (95% CI = 0.5907 to 2.992). Whereas a pretty straight trend with a relatively minute decline with an APC of -0.0022 (95% CI = -0.2000 to 0.196) from 1999 to 2020 for females. The AAPC recorded for females and males were -0.0022 (95% CI = -0.2000 to 0.196) and 0.3057 (95% CI = -0.171 to 0.785) respectively. We performed the Cuzick test across gender, obtaining a z-value of 5.68 (p-value = 0.000). We applied Mann-Whitney U test across gender as well and found a significant p value of 0.000.
Figure 1.
a: Age-adjusted mortality rates (AAMRs) for Cholecystitis per 1,000,000 individuals in the United States, from 1999 to 2020, presented overall and separated by sex. b: Joinpoint illustration of Cholecystitis related AAMRs per 1,000,000 individuals in the United States, from 1999 to 2020.
Figure 1.
a: Age-adjusted mortality rates (AAMRs) for Cholecystitis per 1,000,000 individuals in the United States, from 1999 to 2020, presented overall and separated by sex. b: Joinpoint illustration of Cholecystitis related AAMRs per 1,000,000 individuals in the United States, from 1999 to 2020.
Trends by Race or Ethnicity
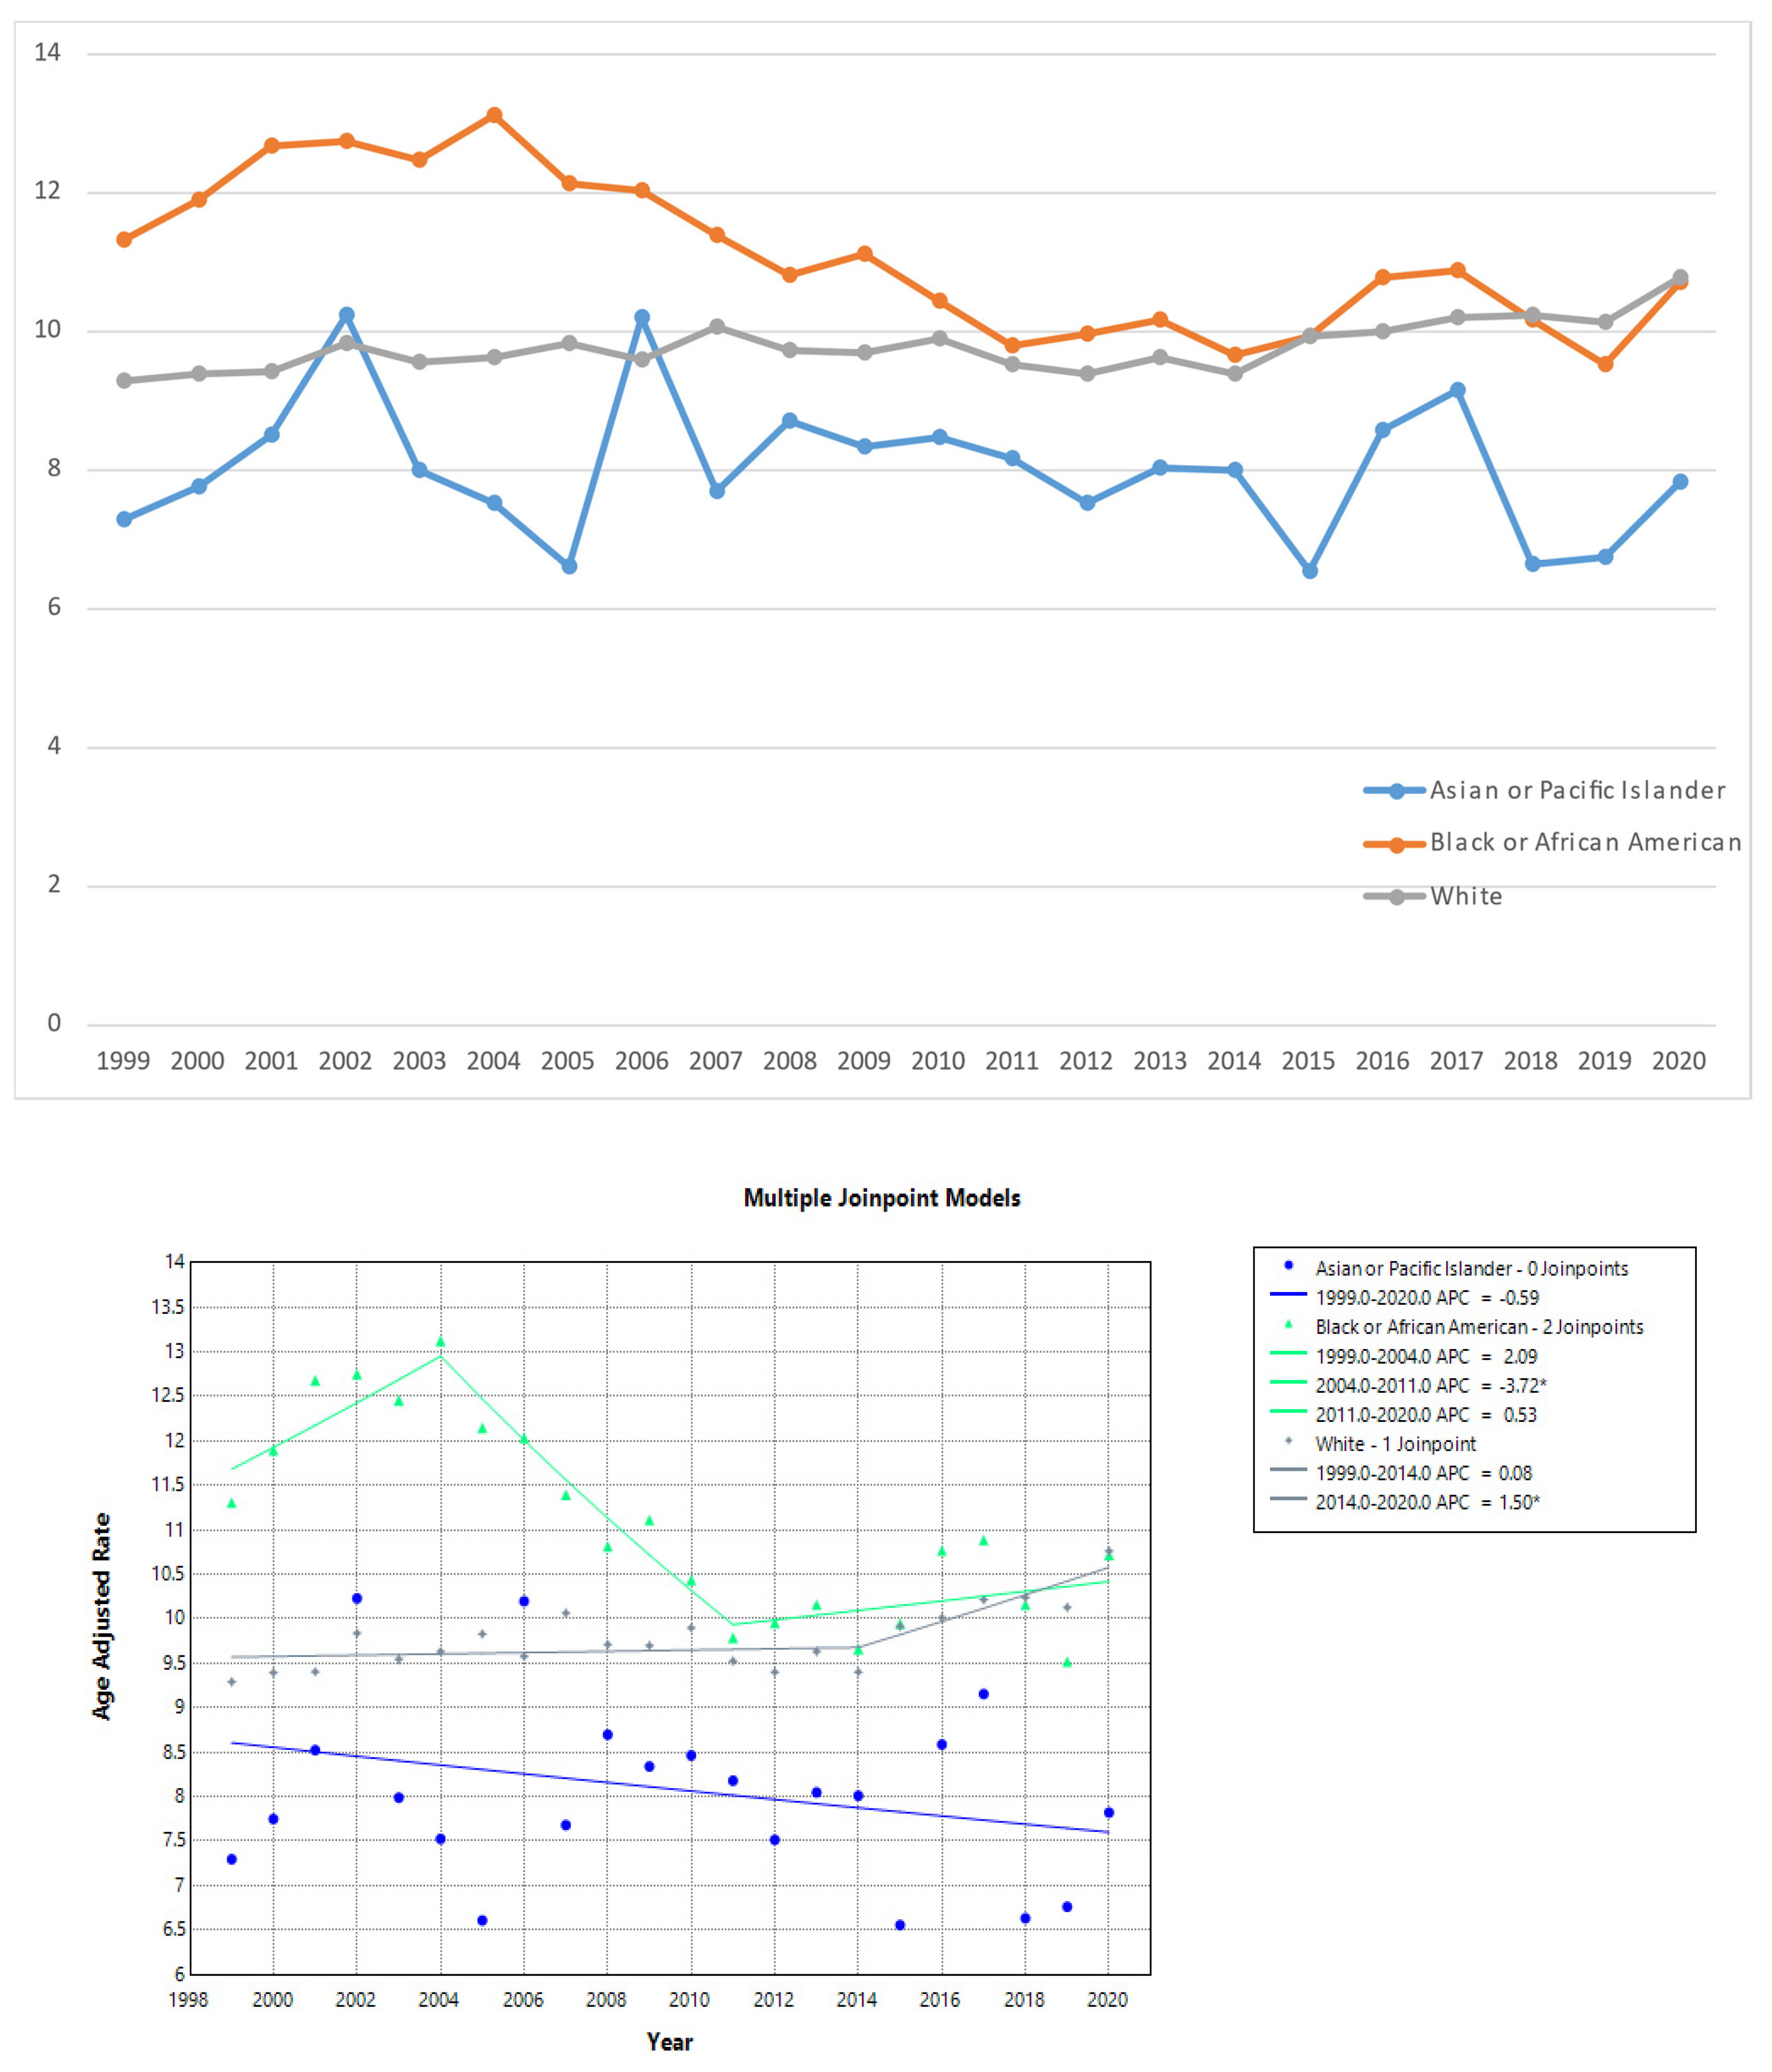
From 1999 to 2020, Black or African American exhibited the highest AAMR of 10.935 (95 % CI = 10.68 to 11.189), followed by White with an AAMR of 9.802 (95% CI = 9.725 to 9.879) and Asian or Pacific Islander with an AAMR of 7.925 (95% CI = 7.584 to 8.266) being the lowest. The Black or African American showed the most peculiar trajectory – an initial rise in AAMR from 1999 to 2004 marked by an APC of 2.087 (95% CI =-0.9809 to 5.205, a decline from 2004 to 2011 with an APC of -3.7215 (95% CI= -5.8478 to -1.5472), and another increase till 2020 with an APC of 0.5298 (95% CI =-0.586 to 1.658) . An increasing APC of 0.0756 (95% CI =-0.2005 to 0.3524) was recorded for White from 1999 to 2014 and an APC of 1.4959 (95% CI =0.5192 to 2.482) from 2014 to 2020. Asian or Pacific Islander represented an insignificant downward steep trend with an APC of -0.5903 (95% CI = -1.4717 to 0.2990). We conducted the Cuzick test across race, yielding a z-value of 3.54 (p-value = 0.000). Additionally, the Kruskal-Wallis test across race showed a significant p-value <0.001.
Figure 2.
a: Age-adjusted mortality rates (AAMRs) for Cholecystitis per 1,000,000 individuals in the United States, from 1999 to 2020, presented by race. b: Joinpoint illustrated model of Cholecystitis related AAMRs per 1,000,000 individuals in the United States, from 1999 to 2020, categorized by race.
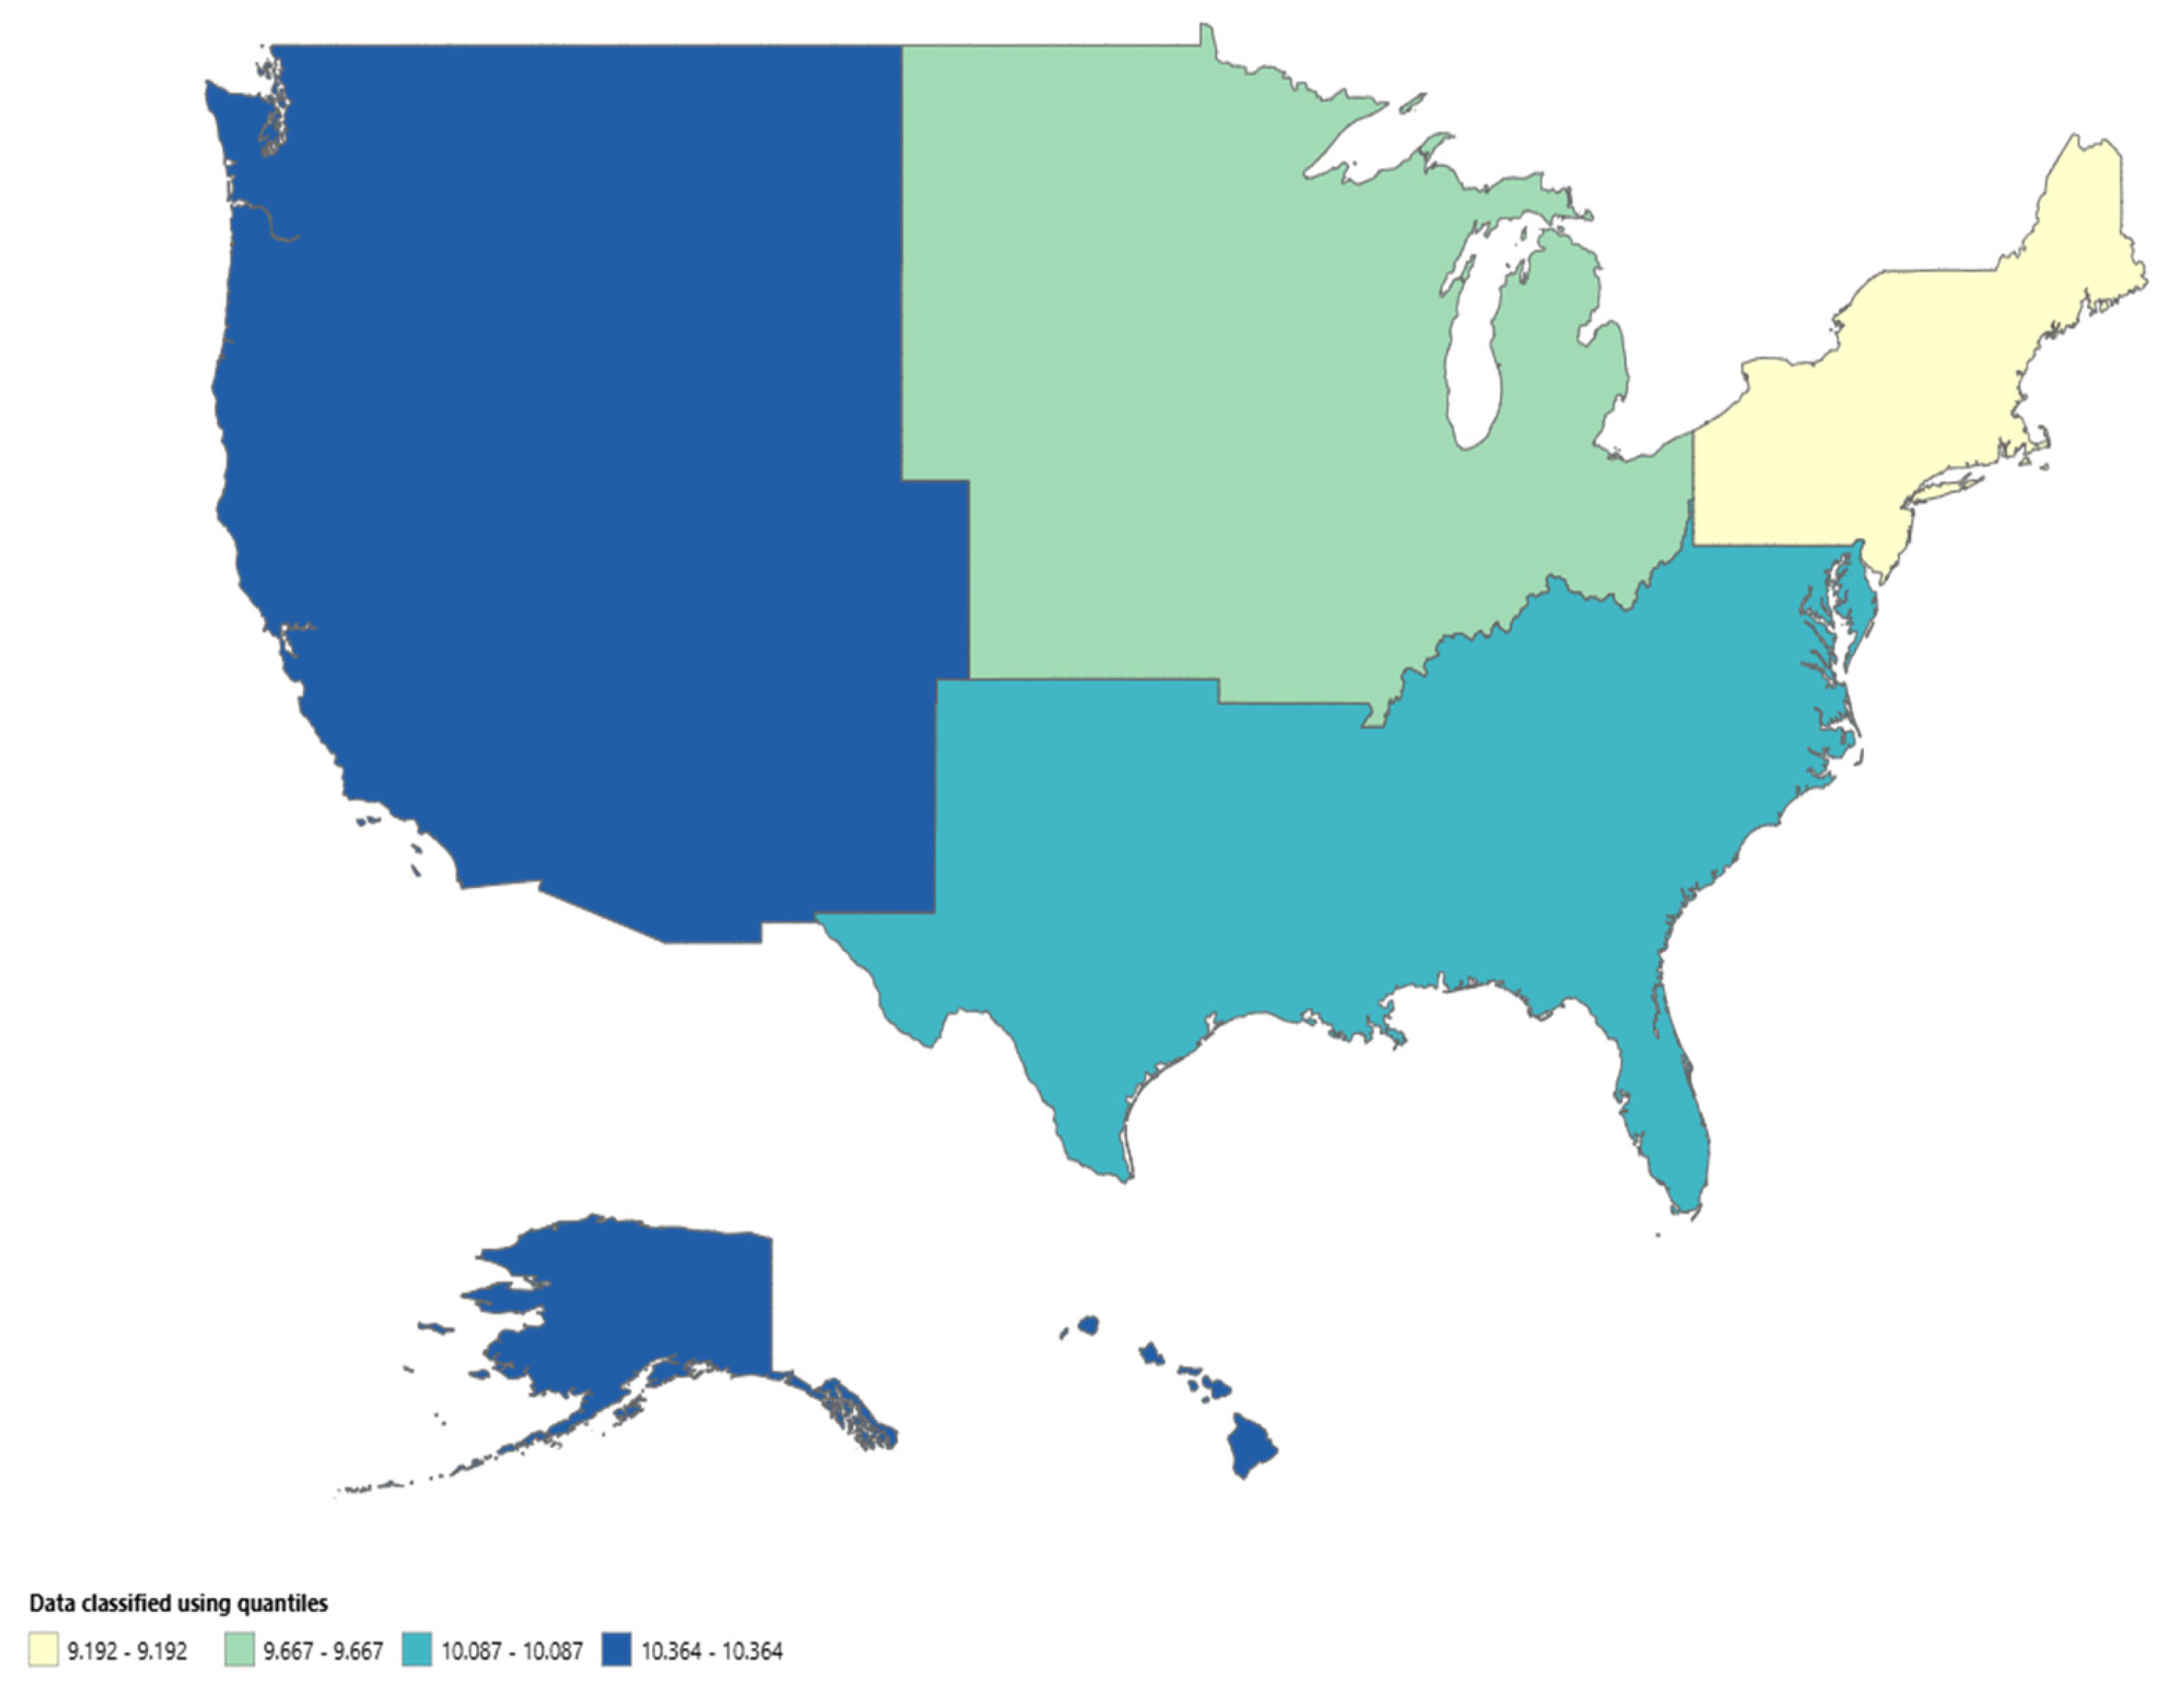
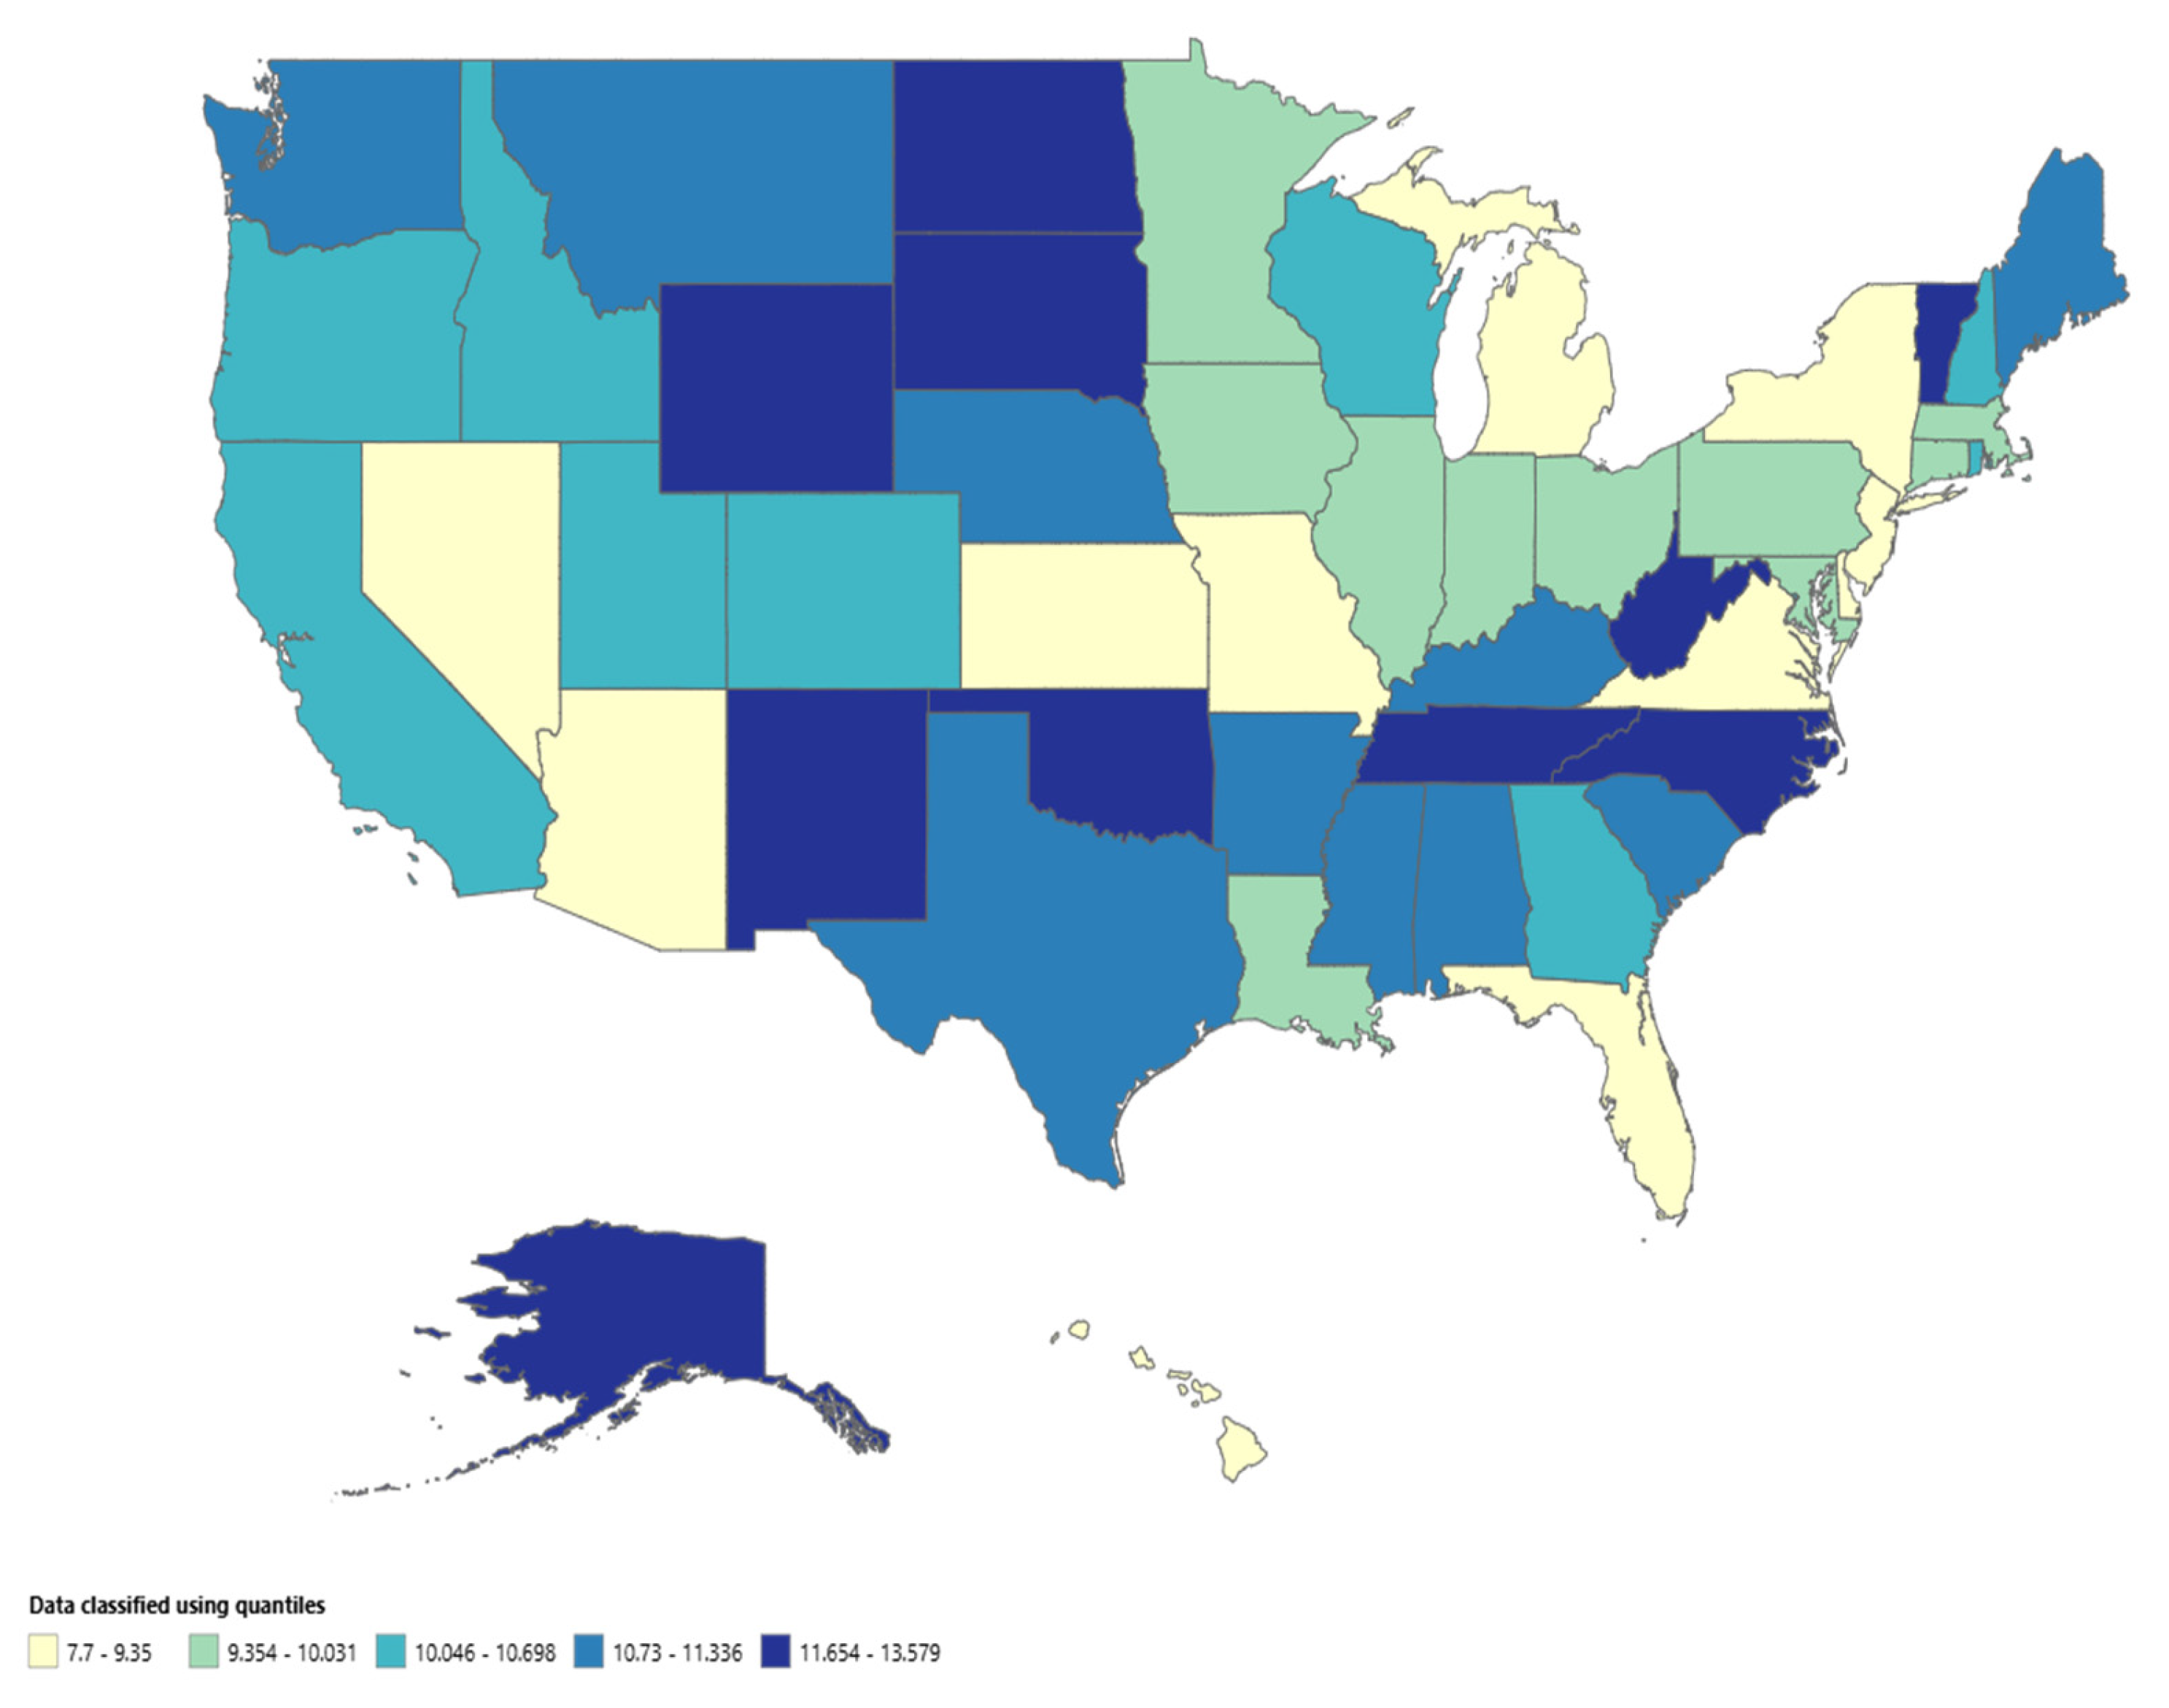
Trends by Place of Death, Region, and State
From 1999 to 2020, 78.7% of the deaths due to cholecystitis occurred in medical facilities-Inpatient, 11% in the Nursing/Long Term Care, 6.5% in Descendant’s home, 2% in medical facilities-Outpatient or ER, and 1.8% in other places. The West region displayed the highest AAMR of 10.364 (95% CI = 10.204 to 10.525), followed by the South with an AAMR of 10.087(95% CI = 9.966 to 10.209). The Midwest and Northeast regions displayed almost the same AAMR with the AAMR of 9.667(95% CI = 9.517 to 9.816) for Midwest. And for Northeast the AAMR was 9.192 (95% CI = 9.037 to 9.347). Differences in AAMRs were prominent across different states. The states with the highest AAMRs – West Virginia (AAMR 13.1532 95% CI = 8.88 to 18.777), Tennessee (AAMR = 12.11; 95% CI = 9.58 to 15.09), Oklahoma (AAMR = 11.94; 95% CI = 8.798 to 15.85), followed by North Carolina (AAMR = 11.823 95% CI = 9.63 to 14.06) – showed rates that were approximately double the AAMRs of states on the lower end of the spectrum – Florida (AAMR = 7.63; 95% CI = 6.56 to 8.70), Arizona (AAMR =8.163; 95% CI = 6.15 to 10.62), New York (AAMR = 8.41; 95% CI =7.20 to 9.63) and Michigan (AAMR = 8.705; 95% CI = 7.019 to 10.55).
Figure 3.
Cholecystitis-Related Age-Adjusted Mortality Rates (AAMRs) per 1,000,000 Individuals, Stratified by Census Region in the United States, 1999 to 2020.
Figure 3.
Cholecystitis-Related Age-Adjusted Mortality Rates (AAMRs) per 1,000,000 Individuals, Stratified by Census Region in the United States, 1999 to 2020.
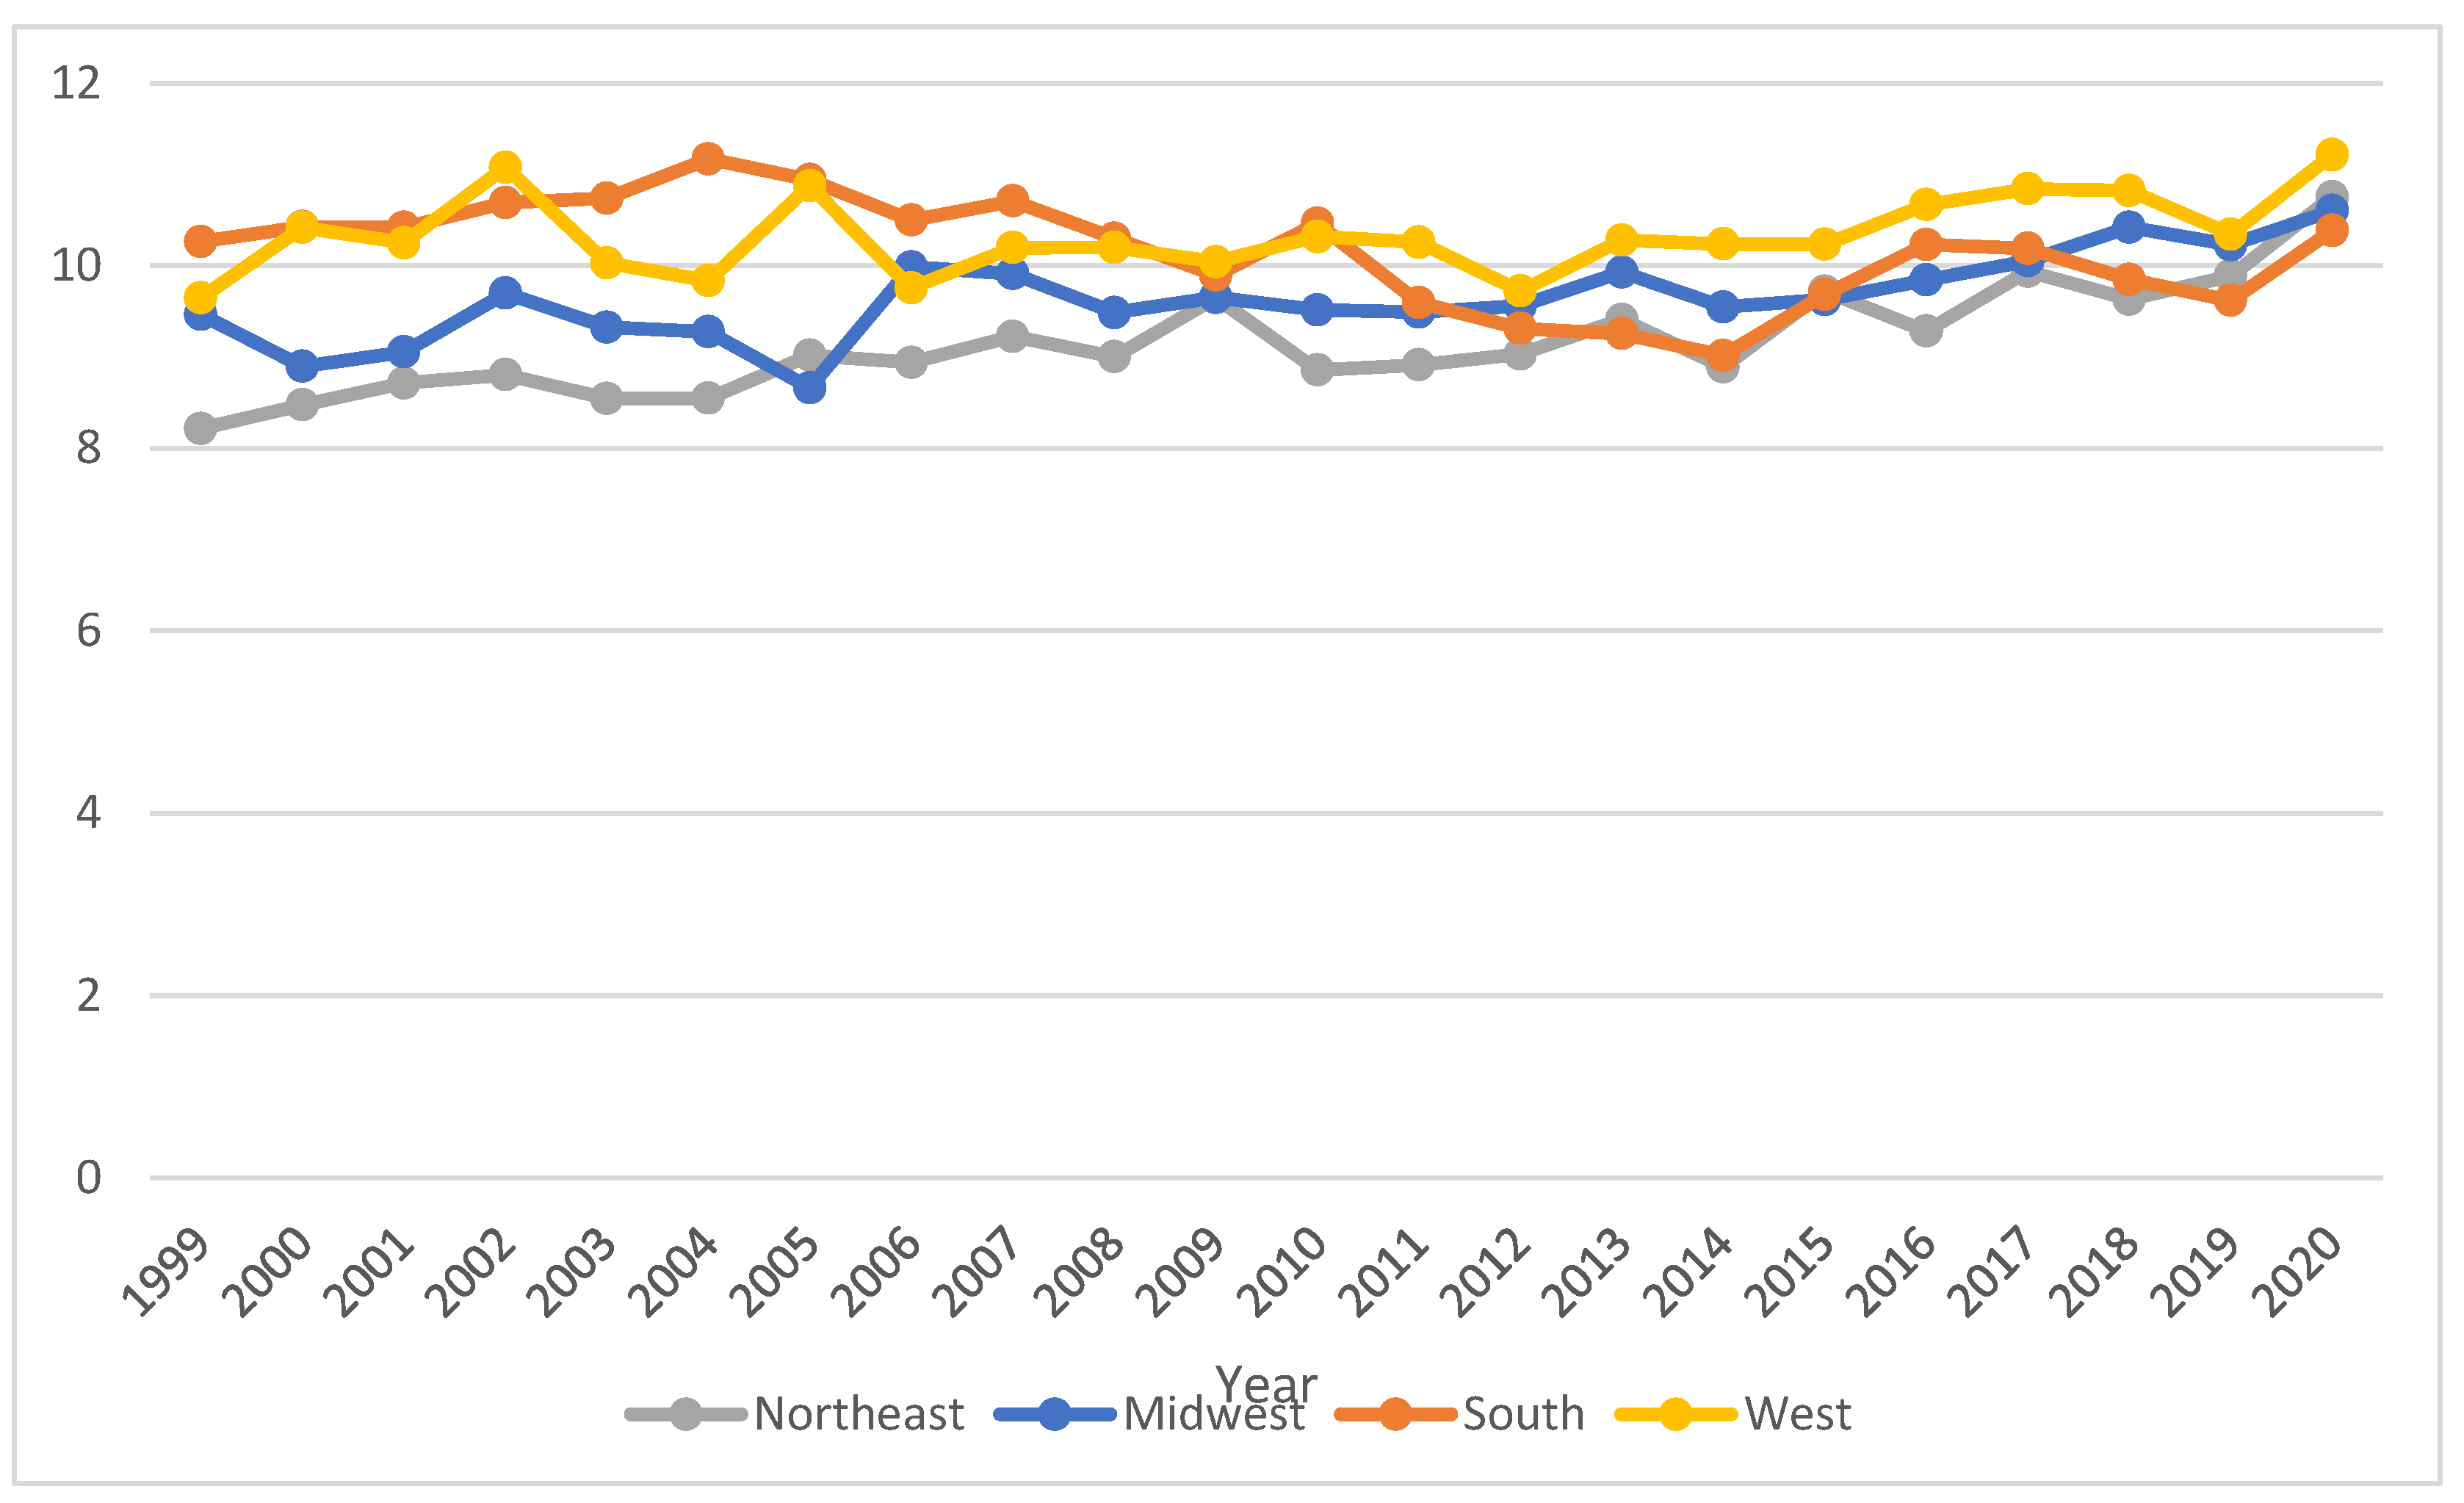
Figure 4.
a: CDC-WONDER Heat map of AAMRs of Cholecystitis related mortality stratified by Census Region. Figure 4b: CDC-WONDER Heat map of AAMRs of Cholecystitis related mortality stratified by States.
Figure 4.
a: CDC-WONDER Heat map of AAMRs of Cholecystitis related mortality stratified by Census Region. Figure 4b: CDC-WONDER Heat map of AAMRs of Cholecystitis related mortality stratified by States.
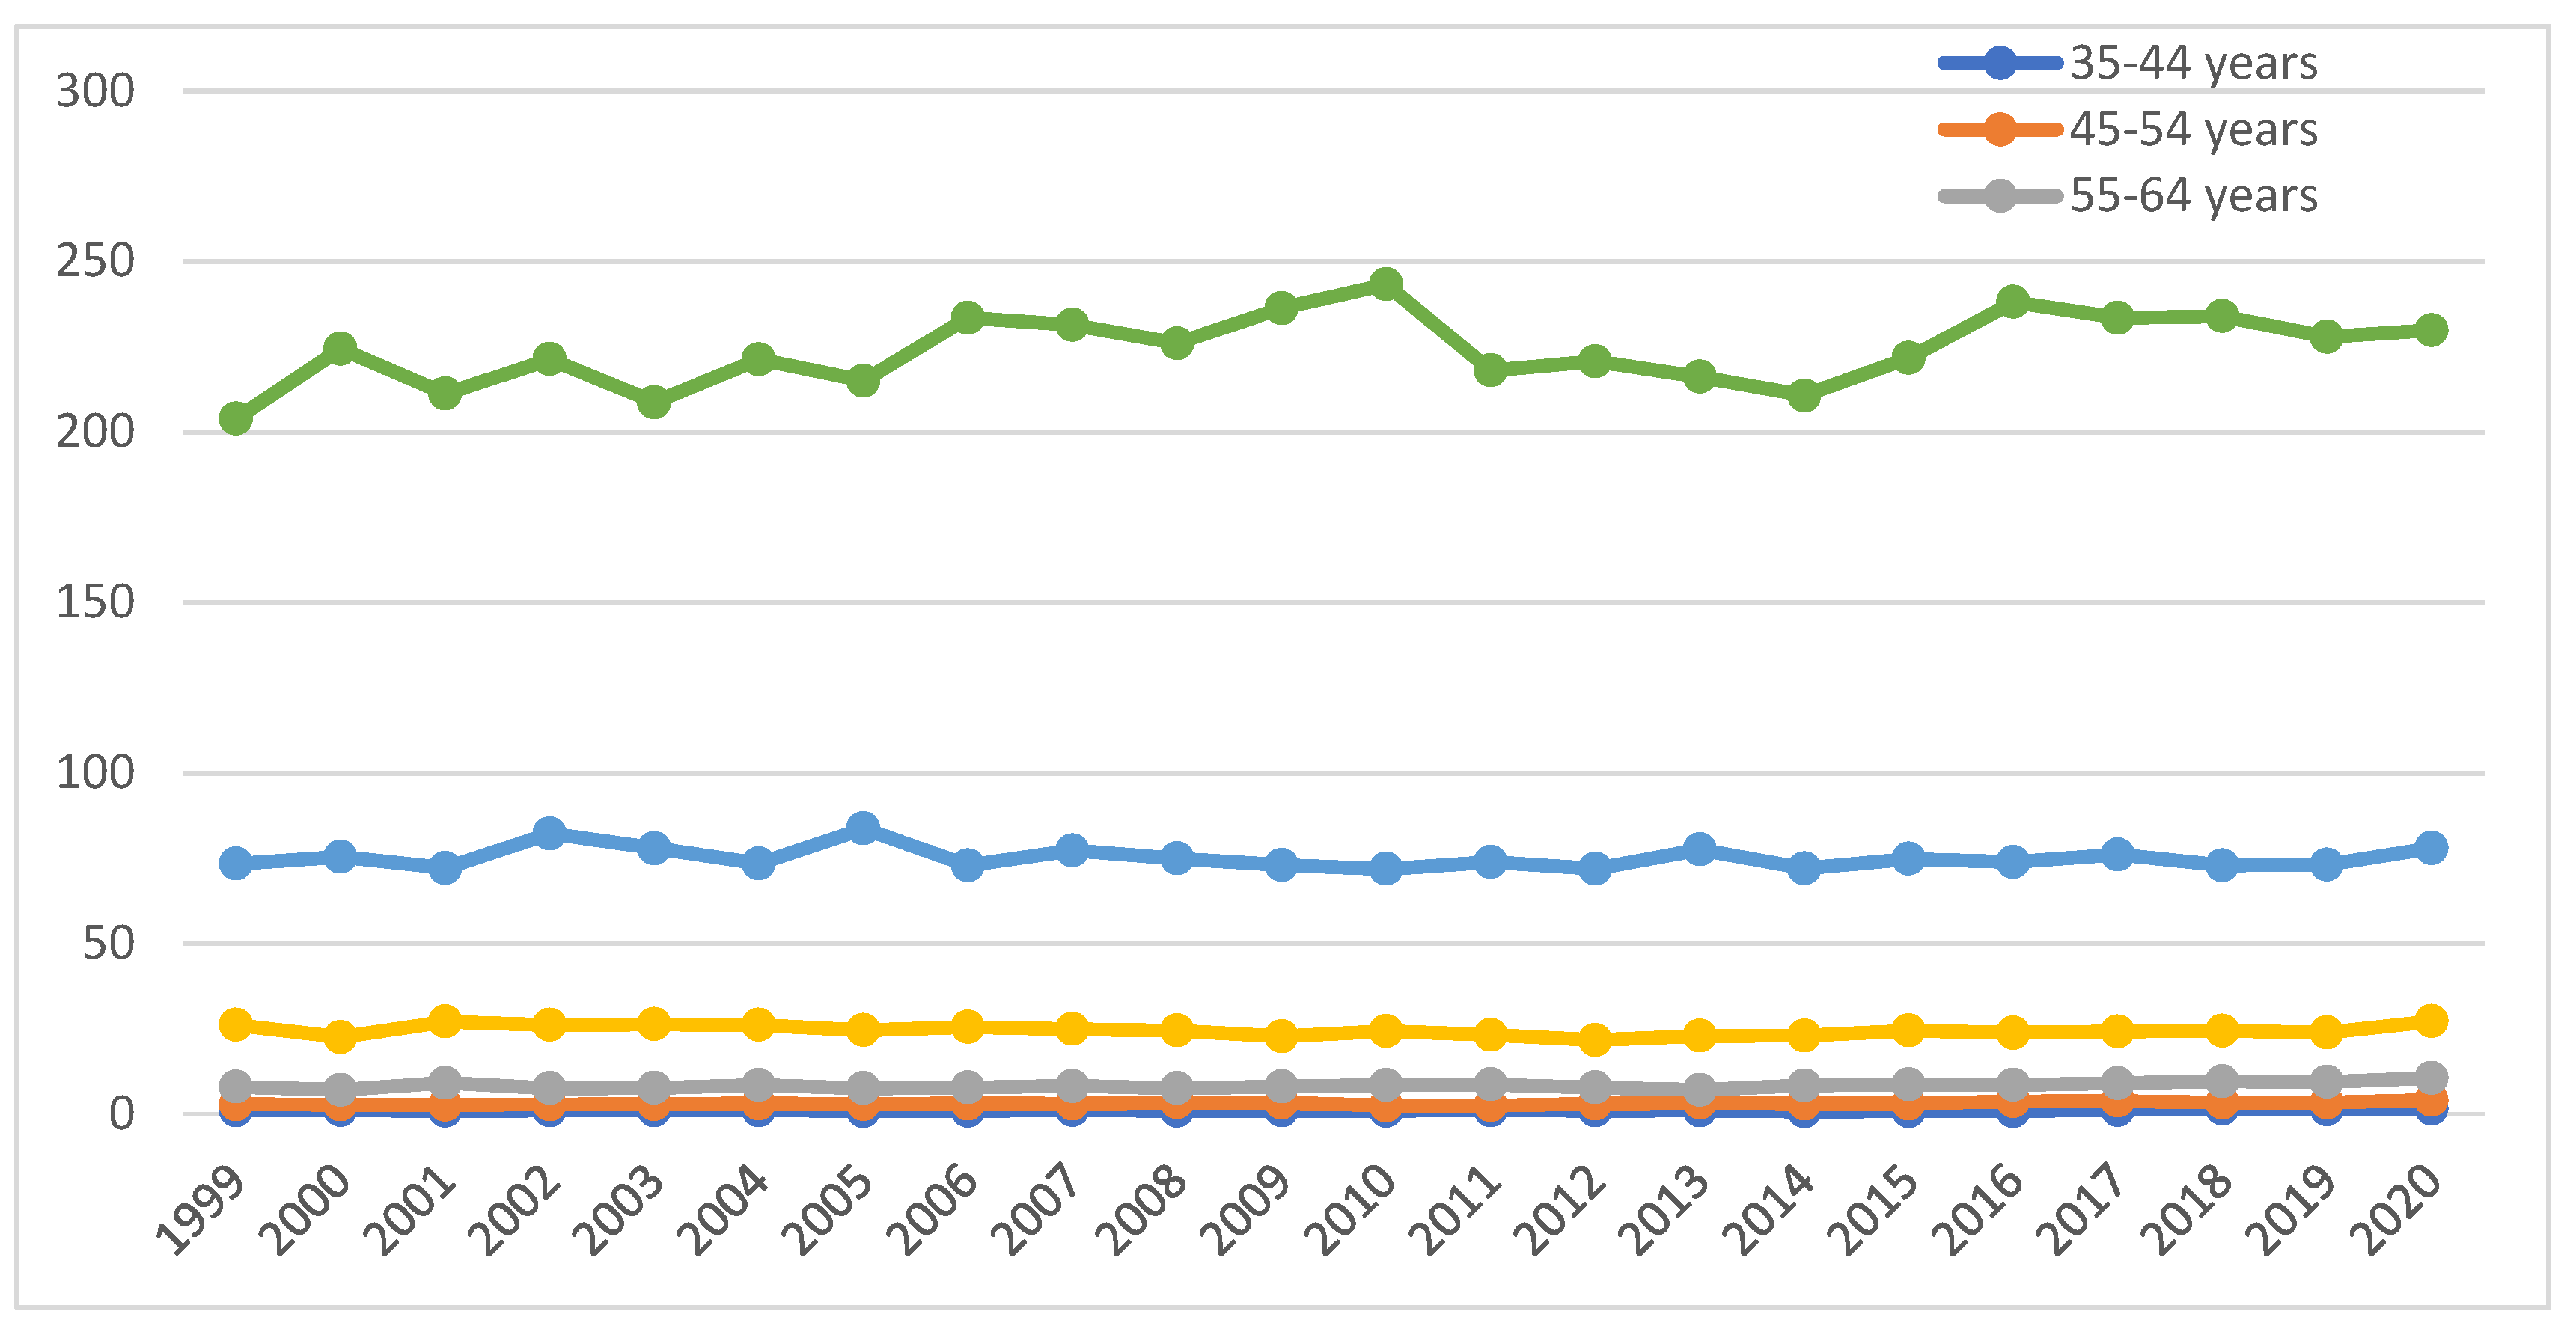
Trends by Age Groups
The most vulnerable population comprised individuals above 85+ years of age, with the highest crude rate (CR) of 224.627 (95% CI = 221.94 to 227.314). The CR exhibited by the age groups of 75 to 84 years and 65 to 74 years were 75.141 (95% CI = 74.158 to 76.125) and 24.521 (95% CI = 24.092 to 24.951) respectively. This was followed by the age groups 55–64 years and 45–54 years, with CRs of 8.476 (95% CI: 8.27–8.68) and 3.176 (95% CI: 3.061–3.291), respectively. The least CR was exhibited by 1.112 (95% CI = 1.045 to 1.18). Males had higher crude death rates as compared to females. We conducted the Cuzick test across age groups, which yielded a z-value of 11.29 (p-value = 0.000). Similarly, the Kruskal-Wallis test indicated a significant difference across age groups, with a p-value of 0.000.
Figure 5.
Cholecystitis-Related Age-Adjusted Mortality Rates (AAMRs) per 1,000,000 Individuals, Stratified by age groups in the United States, 1999 to 2020.
Figure 5.
Cholecystitis-Related Age-Adjusted Mortality Rates (AAMRs) per 1,000,000 Individuals, Stratified by age groups in the United States, 1999 to 2020.
Urbanization
In accordance with 2013 urbanization, a non-parallel trend was observed in which the AAPC in the urban population was 0.03 (95%-CI: -0.25 to 0.31) while the AAPC in the rural population was 0.23 (95%-CI: -0.16 to 0.61). The Mann-Whitney U test gave the p-value of 0.00 while the Cuzick’s test gave a z-value of 8.16.
Figure 6.
Cholecystitis-Related Age-Adjusted Mortality Rates (AAMRs) per 1,000,000 Individuals, Stratified by Urbanization in the United States, 1999 to 2020.
Figure 6.
Cholecystitis-Related Age-Adjusted Mortality Rates (AAMRs) per 1,000,000 Individuals, Stratified by Urbanization in the United States, 1999 to 2020.
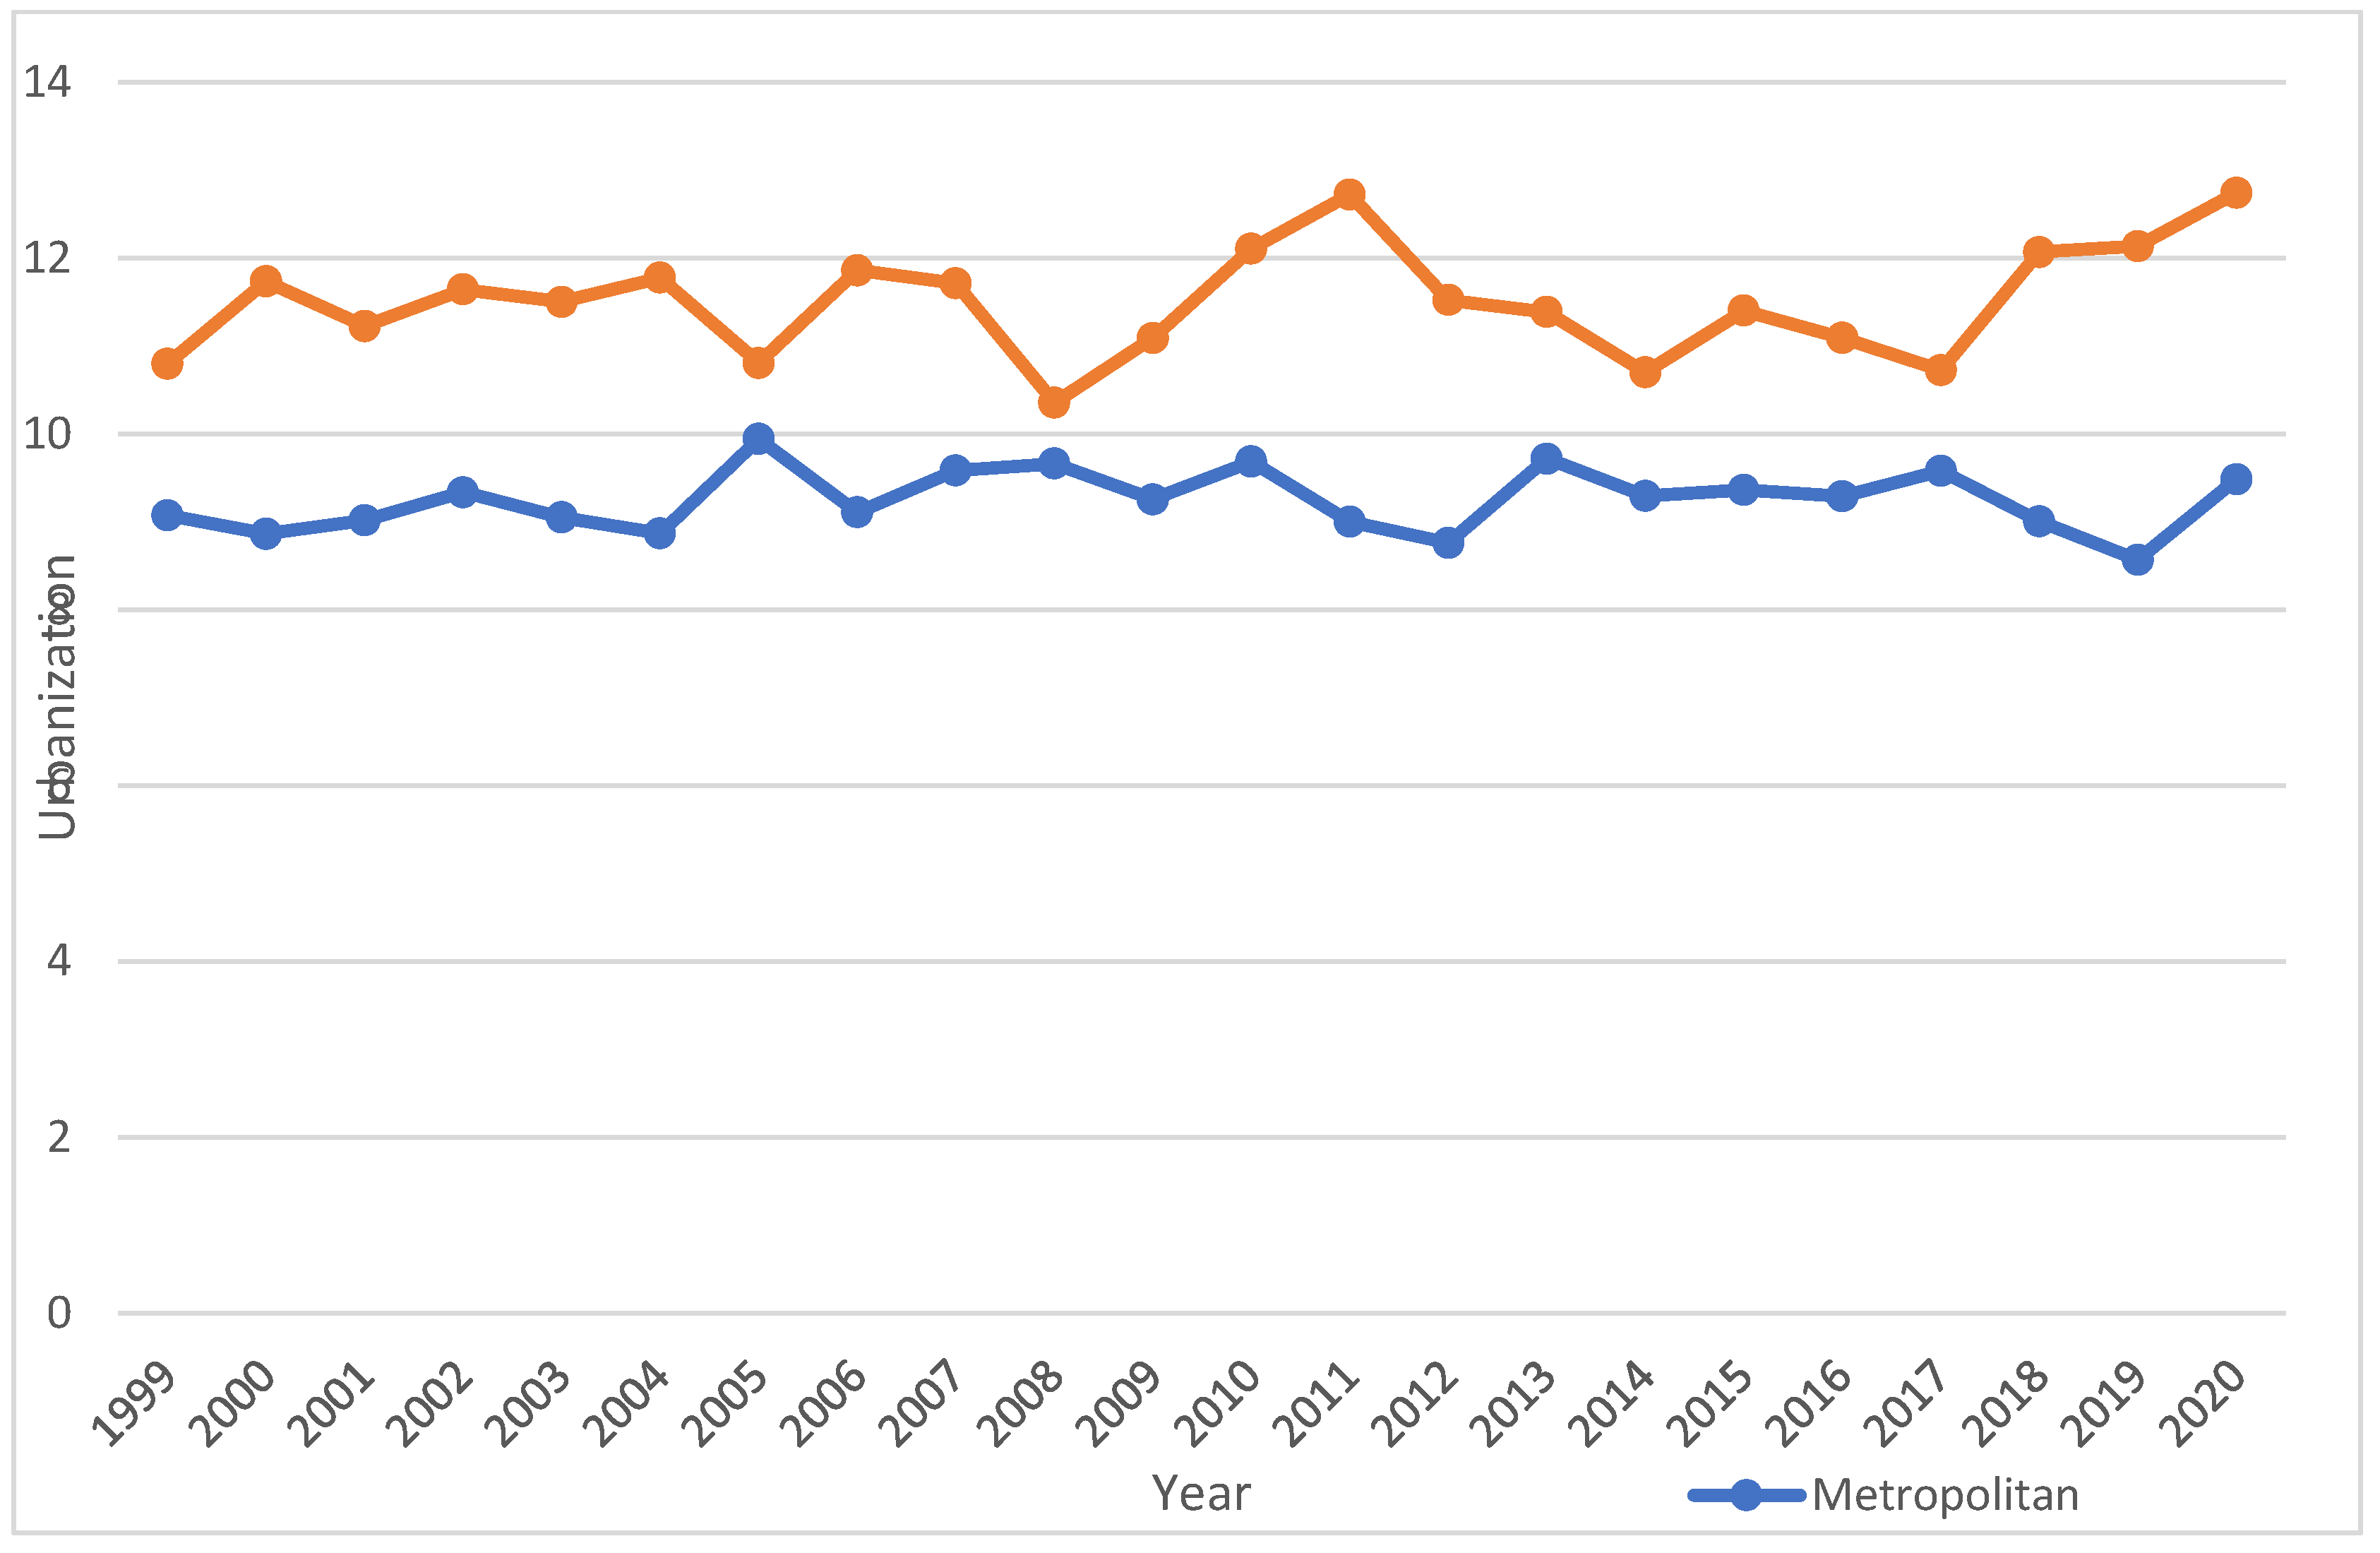

Table 1.
Demographic Characteristics of Deaths due to Infective Endocarditis Among the Geriatric in the USA from 1999 to 2020.
Table 1.
Demographic Characteristics of Deaths due to Infective Endocarditis Among the Geriatric in the USA from 1999 to 2020.
| Variable | Cholecystitis related Deaths (n) | Age Adjusted Mortality Rate (AAMR) per 1,000,000 |
| Overall Population | 72843 | 9.89 |
| Sex | ||
| Male Female |
35790 37053 |
12.061 8.399 |
| US Census Region | ||
| Northeast Midwest South West |
13622 16261 26733 16227 |
9.192 9.667 10.087 10.364 |
| Race/Ethnicity | ||
| Asian or Pacific Islander Black or African American White |
2144 7434 62679 |
7.925 10.935 9.802 |
| Age a | ||
| 35-44 years 45-54 years 55-64 years 65-74 years 75-84 years 85+ years |
1036 2946 6496 12,517 22,430 26,846 |
1.112 3.176 8.476 24.521 75.141 224.627 |
| Place of Death b | ||
| Medical facilities-Inpatient Medical facility-Outpatient or ER Decedent’s Home Nursing/Long Term Care Others |
54,785 1,412 4,539 7,628 1,281 |
- - - - - |
| Urbanization | ||
| Urban Rural |
57771 15072 |
9.234 11.482 |
Note: a Crude mortality rate is used for all age dependent analysis. b Age Adjusted Mortality Rate (AAMR) is not applicable for Place of Death.
Table 2.
Annual Percentage Changes (APCs) and Average Annual Percentage Changes (AAPCs) in Infective Endocarditis Mortality Rate Among the Geriatrics in the USA from 1999 to 2020.
Table 2.
Annual Percentage Changes (APCs) and Average Annual Percentage Changes (AAPCs) in Infective Endocarditis Mortality Rate Among the Geriatrics in the USA from 1999 to 2020.
| Variable | AAPC (95% CI) | Trend segment | Year | APC (95% CI) |
| Overall Population | 0.3962 | 1 2 3 |
1999-2007 2007-2012 2012-2020 |
0.6003 -1.3120 1.2728* |
| Sex | ||||
| Female | -0.0022 | 1 | 1999-2020 | -0.0022 |
| Male | 0.3057 | 1 2 |
1999-2013 2013-2020 |
-0.4255 1.7843* |
| US Census Region | ||||
| Northeast | 0.8548* | 1 | 1999-2020 | 0.8548* |
| Midwest | 0.5600* | 1 | 1999-2020 | 0.5600* |
| South | 0.0289 | 1 2 3 |
1999-2004 2004-2013 2013-2020 |
1.7459 -1.9030* 1.3296* |
| West | 0.2833* | 1 | 1999-2020 | 0.2833* |
| Race/Ethnicity | ||||
| Asian or Pacific Islander | -0.5903 | 1 | 1999-2020 | -0.5903 |
| Black or African American | -0.5444 | 1 2 |
1999-2004 2004-2011 2011-2020 |
2.0872 -3.7215* 0.5298 |
| White | 0.4793* | 1 2 |
1999-2014 2014-2020 |
0.0756 1.4959* |
| Urbanization | ||||
| Urban Rural |
0.03 0.23 |
1 1 |
1999-2020 1999-2020 |
0.03 0.23 |
Note: *Annual Percentage Change (APC) is significantly different from zero at the alpha = 0.05 level.
Discussion
Our analysis of mortality trends due to cholecystitis in the United States from 1999 to 2020 revealed a complex pattern. A steep rise in AAMR was observed from 2012 to 2020 with an APC of 1.272 (95% CI =0.6387 to 1.9109). Consistent with the overall trend, a rise in males was seen from 2013 to 2020 with APC of 1.784 (95% CI = 0.5907 to 2.992). A decline from 2004 tol 2011 with an APC of -3.7215 (95% CI= -5.8478 to -1.5472) was seen in black population, which was not the overall trend but white population had an increasing APC of 1.4959 (95% CI =0.5192 to 2.482) from 2014 to 2020. Men and patients in the highest age quintile of greater than 85 years had the higher mortality. West Virginia , Tennessee, and Oklahoma were the most affected states and Michigan was the least. Urbanization had no impact on the trends in mortality. To our knowledge, this is the biggest study to find trends in acute cholecystitis mortality, based on age, gender, race and urbanization. (7) (8) (9).
Gender disparities were evident in the mortality trends. Males consistently exhibited higher AAMRs than females throughout the study period. While both genders experienced a slight increase in mortality, the increase was significant among males. A significant steep rise was recorded up till 2020. However, on the other side, the female gender showed a pretty constant trend with statistically insignificant changes . This is consistent with the previously documented gender differences in outcomes of cholecystitis by Dua et al.[8]. Women have a higher incidence of gallstones due to estrogen-induced synthesis of cholesterol in the liver and biliary hypersecretion. This is seen during hormone replacement therapy as well. Despite a higher incidence, men have higher chances of worse outcomes. This has been attributed to stone composition. Per an Italian study, cholesterol stones formed 13.5% amongst people with positive blood cultures [9]. In a New Zealand study, 60% of stones from female carriers had more than 70% of cholesterol in their composition, whereas the fraction in men was only 37.5%, which might represent a protective factor for women [10]. Studies showed men had longer operative time, more conversion from laparoscopic to open cholecystectomy, higher postoperative complications rate. Similarly, a German study showed that male cases presented more frequently both necrotizing or gangrenous gall bladders [11].
Our analysis highlights stark racial and ethnic disparities in age-adjusted mortality rates (AAMRs), with Black or African American individuals consistently experiencing higher mortality rates compared to White and Asian or Pacific Islander populations. However, the trends among these groups potray a complex story. Black or African American individuals saw a decline from 2004 until 2011. White individuals, in contrast, faced a steady rise in mortality paralleling the overall findings of the study. Ingraham et al. reported a significantly higher prevalence of GBD among the white group compared to the black group of patients. Everhart et al., suggested the reason being lower gallbladder cholesterol saturation index and better gallbladder motor function [12,13]. Despite higher prevalence, higher mortality in Black population reflects lack of access to healthcare. A decline in Black population mirrors healthcare reforms seen in the country at the time.
Black or African American communities often have higher rates of chronic diseases, such as hypertension, diabetes, and cardiovascular disease, partly due to limited access to preventive care and nutritious food, as well as chronic stress related to social determinants of health.
Regional variations in mortality rates were also apparent. The West region consistently had higher AAMRs than the South, Midwest, and Northeast. Furthermore, substantial differences were observed among states within these regions with West Virginia, Tennessee, Oklahoma and North Carolina being on the higher end of the spectrum with high AAMR values as compared to Florida, New York, Arizona and Michigan which had lower AAMR values and were on lower end of spectrum which might reflect the quality of healthcare and sheer number of hospitals in these states as mentioned in American Hospital Directory [14,15,16].
The highest mortality rates were concentrated among individuals aged 85 and older, followed by those aged 75-84. Mortality rates decreased progressively with younger age groups like people belonging to 45-55 years of age who showed the lowest CR value in our analysis. It has been previously exhibited as well [17,18,19], with different factors being responsible for poor outcomes among the older population. The major factors leading to high risk for mortality in elderly population are higher co-morbidities (heart disease, diabetes, respiratory problems and impaired kidney functions) which can strain, overall decreased functional status and higher rates of surgical complications.
The observed increase in cholecystitis mortality, particularly among males warrants further investigation. Several factors may contribute to these trends, including changes in healthcare access, diagnostic practices, treatment options, and lifestyle factors in order to decrease the burden of gallbladder diseases and also reduce the mortality rates due to cholecystitis in the United S tates population [20,21].
Although our study highlights important trends, it is essential to acknowledge some limitations of our study as well. Firstly, the data utilized is limited to CDC WONDER database only. Furthermore, reporting bias and lack of randomized study designs also limit our study.
Future studies should explore the underlying causes of these disparities, identify factors contributing to the variations among different groups, and evaluate the effectiveness of current prevention and treatment strategies. Better therapeutic and interventional measures are required to tackle this alarming situation in a more effective manner. Additionally, research on the impact of socioeconomic factors, environmental exposures, and genetic variations on cholecystitis risk is warranted.
Conclusions
The analysis of mortality trends for cholecystitis in united states from 1999-2020 showed that higher AAMR and APC was recorded for the male gender with a higher prevalence amongst African-American people. Also, it was further found out that the West region of USA had higher mortality rates with people belonging to older age groups i.e., 85+ or 75-84 years old being at most risk. All these significant findings from analysis provide a foundation for further research, better policy making and providing better solutions in healthcare for such patients and reducing the mortality and poor outcomes.
Author Contributions
Conceptualization, B.S., M.K., M.H.,I.Q.,M.S.,M.A.; methodology, B.S.,L.M., A.K.; investigation, B.S., M.K., M.H.,I.Q.,M.S.,M.A.; resources, B.S., M.K., M.H.,I.Q.,M.S.,M.A.; data curation, B.S., L.M., A.K.; writing—original draft preparation, B.S.; writing—review and editing, B.S., L.M., A.K.; visualization, B.S.; supervision, L.M., All authors have read and agreed to the published version of the manuscript.
Funding
This research received no external funding
Acknowledgments
None
References
- González-Castillo AM, Sancho-Insenser J, de Miguel-Palacio M, Morera-Casaponsa JR, Membrilla-Fernández E, Pons-Fragero MJ, et al. Mortality risk estimation in acute calculous cholecystitis: beyond the Tokyo Guidelines. World Journal of Emergency Surgery. 2021;16(1).
- Mencarini L, Vestito A, Zagari RM, Montagnani M. The Diagnosis and Treatment of Acute Cholecystitis: A Comprehensive Narrative Review for a Practical Approach. JCM. 2024 May 3;13(9):2695.
- Peck GL, Kuo YH, Nonnenmacher E, Gracias VH, Hudson S v., Roy JA, et al. Ten-Year Trends of Persistent Mortality With Gallstone Disease: A Retrospective Cohort Study in New Jersey. Gastro Hep Advances. 2023;2(6).
- Centers for Disease Control and Prevention. National Center for Health Statistics. Multiple Cause of Death 1999-2019 on CDC WONDER Online Database, Released in 2020. Data are from the Multiple Cause of Death Files, 1999-2019, as Compiled from Data Provided by the 57 Vital Statistics Jurisdictions through the Vital Statistics Cooperative Program; 2021. Accessed May 21 http://wonder.cdc.gov/mcd-icd10.html.
- Von Elm E, Altman DG, Egger M, Pocock SJ, Gøtzsche PC, Vandenbroucke JP. The Strengthening the Reporting of Observational Studies in Epidemiology (STROBE) statement: guidelines for reporting observational studies. Journal of Clinical Epidemiology. 2008 Apr;61(4):344–9.
- Joinpoint Regression Program, Version 5.0.2 - May 2023; Statistical Methodology and Applications Branch, Surveillance Research Program, National Cancer Institute.
- Kim HJ, Fay MP, Feuer EJ, Midthune DN. Permutation tests for joinpoint regression with applications to cancer rates. Stat Med. 2000;19(3):335–351. https://doi. org/10.1002/(SICI)1097-0258(20000215)19:3<335::AID-SIM336>3.0.CO;2-Z. Available online: https://onlinelibrary.wiley.com/.
- Dua A, Dua A, Desai SS, Kuy S, Sharma R, Jechow SE, et al. Gender based differences in management and outcomes of cholecystitis. The American Journal of Surgery. 2013 Nov 1;206(5):641–6.
- Cetta F. The role of bacteria in pigment gallstone disease. Ann Surg. 1991;213(4):315–326. [CrossRef]
- Botaitis S, Polychronidis A, Pitiakoudis M, Perente S, Simopoulos C. Does gender affect laparoscopic cholecystectomy? Surg Laparosc Endosc Percutan Tech. 2008;18(2):157–161. [CrossRef]
- Felício SJO, Matos EP, Cerqueira AM, Farias KWSF, Silva RA, Torres MO. Mortality of urgency versus elective videolaparoscopic cholecystectomy for acute cholecystitis. Arq Bras Cir Dig. 2017;30(1):47–50. [CrossRef]
- Ingraham AM, Cohen ME, Ko CY, Hall BL. A current profile and assessment of north American cholecystectomy: Results from the American College of Surgeons national surgical quality improvement program. J Am Coll Surg. 2010;211(2):176–186. [CrossRef]
- Everhart JE, Khare M, Hill M, Maurer KR. Prevalence and ethnic differences in gallbladder disease in the United States. Gastroenterology. 1999;117(3):632–639. [CrossRef]
- Chang YR, Jang JY, Kwon W, Park JW, Kang MJ, Ryu JK, et al. Changes in Demographic Features of Gallstone Disease: 30 Years of Surgically Treated Patients. Gut Liver. 2013 Nov;7(6):719–24.
- Li ZZ, Guan LJ, Ouyang R, Chen ZX, Ouyang GQ, Jiang HX. Global, regional, and national burden of gallbladder and biliary diseases from 1990 to 2019. World J Gastrointest Surg. 2023 Nov 27;15(11):2564–78.
- Wadhwa V, Jobanputra Y, Garg SK, Patwardhan S, Mehta D, Sanaka MR. Nationwide trends of hospital admissions for acute cholecystitis in the United States. Gastroenterology Report. 2017 Feb 1;5(1):36–42.
- Riall TS, Zhang D, Townsend CM, Kuo YF, Goodwin JS. Failure to Perform Cholecystectomy for Acute Cholecystitis in Elderly Patients Is Associated with Increased Morbidity, Mortality, and Cost. Journal of the American College of Surgeons. 2010 May 1;210(5):668–77.
- Pérez Lara FJ, Luna Díaz RD, Moreno Ruiz J, Suescun García R, Rey Moreno AD, Hernández Carmona J, et al. Laparoscopic cholecystectomy in patients over 70 years of age: review of 176 cases. Rev esp enferm dig [Internet]. 2006 Jan [cited 2024 Sep 21];98(1). Available online: http://scielo.isciii.es/scielo.php?script=sci_arttext&pid=S1130-01082006000100006&lng=en&nrm=iso&tlng=en.
- Wiggins T, Markar SR, Mackenzie H, Jamel S, Askari A, Faiz O, et al. Evolution in the management of acute cholecystitis in the elderly: population-based cohort study. Surg Endosc. 2018 Oct 1;32(10):4078–86.
- Unalp-Arida A, Ruhl CE. The Burden of Gallstone Disease in the United States Population [Internet]. medRxiv; 2024 [cited 2024 Sep 21]. p. 2022.07.08.22277386. Available online: https://www.medrxiv.org/content/10.1101/2022.07.08.22277386v2.
- Sandblom G, Videhult P, Crona Guterstam Y, Svenner A, Sadr-Azodi O. Mortality after a cholecystectomy: a population-based study. HPB. 2015 Mar 1;17(3):239–43.
Disclaimer/Publisher’s Note: The statements, opinions and data contained in all publications are solely those of the individual author(s) and contributor(s) and not of MDPI and/or the editor(s). MDPI and/or the editor(s) disclaim responsibility for any injury to people or property resulting from any ideas, methods, instructions or products referred to in the content. |
© 2025 by the authors. Licensee MDPI, Basel, Switzerland. This article is an open access article distributed under the terms and conditions of the Creative Commons Attribution (CC BY) license (http://creativecommons.org/licenses/by/4.0/).
Copyright: This open access article is published under a Creative Commons CC BY 4.0 license, which permit the free download, distribution, and reuse, provided that the author and preprint are cited in any reuse.


