
Submitted:
24 June 2025
Posted:
25 June 2025
You are already at the latest version
Abstract
The integration of manganese (Mn) into silver sulfide (Ag₂S) nanoparticles offers a promising avenue for enhancing their physicochemical properties and biological activity for breast cancer applications. This study investigates the synthesis, characterization, and cytotoxic effects of Mn-doped Ag₂S nanoparticles on four breast cancer cell lines representing distinct subtypes: luminal A (MCF-7), luminal B (BT-474), triple-negative (MDA-MB-231), and HER2-positive (SK-BR-3). Using a sonochemical method, Mn-doped nanoparticles with controlled sizes and compositions were obtained, and their properties were assessed through TEM, FTIR, UV–Vis, and XRF analyses. Results revealed that Mn doping significantly influenced particle size, zeta potential, and quantum confinement effects, leading to enhanced reactivity. Biological evaluations indicated dose- and subtype-dependent cytotoxicity. Mn doping at 1% w/w demonstrated a balance between cytotoxicity and proliferative effects at low concentrations, particularly in luminal subtypes, while 5% w/w Mn doping resulted in pronounced cytotoxicity, especially in aggressive subtypes such as MDA-MB-231 and SK-BR-3. The findings highlight the importance of Ag2S nanoparticle composition and dose optimization for minimizing adverse effects while maximizing therapeutic potential.
Keywords:
Mn-doped Ag₂S nanoparticles
; luminal A
; luminal B
; triple-negative breast cancer
; HER2-positive
; cytotoxic effects
; nanoparticle synthesis
; cancer nanotechnology
1. Introduction
Breast cancer is the most diagnosed in women worldwide and leading cause of cancer-related mortality [1,2]. It comprises different subtypes such as luminal A, luminal B, triple-negative and HER2-positive, each characterized by different molecular profiles, prognoses and therapeutic responses [3,4]. This high degree of heterogeneity poses a major challenge for standardized diagnostics and effective treatments and underscores the need for innovative strategies that selectively target each subtype (Gao & Swain, 2018; Valenza et al., 2024).
Nanotechnology has emerged as a promising field in oncology, offering potential solutions for cancer diagnosis and treatment [6,7,8]. Candidates for such applications include silver sulfide (Ag₂S) nanoparticles, which are characterized by their good biocompatibility, chemical stability, and near-infrared absorption capability [9,10]. Significantly, Ag₂S nanoparticles tend to release fewer toxic ions than their elemental silver (Ag⁰) counterparts, as the conversion of Ag⁰ to Ag₂S reduces the amount of free Ag⁺ and thus reduces acute toxicity (Levard et al., 2013; Opršal et al., 2021).
The incorporation of transition metals such as manganese (Mn) into semiconductor nanoparticles such as silver sulfide (Ag₂S) has attracted considerable attention due to the improved optical and physicochemical properties observed in Mn-doped systems (Ahmed et al., 2024; Jeong et al., 2020).
Early work suggests that Mn doping can alter the size, zeta potential, and reactivity of nanoparticles, which could improve contrast for imaging and influence cytotoxic effects in cancer cells [15]. Nevertheless, a profound understanding of how Mn doping affects the toxicity of Ag₂S nanoparticles in different breast cancer subtypes, which differ significantly in terms of hormone receptor status and aggressive behavior, is lacking [16]
Several in vitro studies have confirmed that Ag₂S nanoparticles have minimal cytotoxicity and genotoxicity compared to other heavy metal-based quantum dots, especially when appropriately coated or stabilized [17,18]. However, there are still important questions about how doping, surface charge and protein coverage can affect cellular uptake, ROS formation and overall biocompatibility. Answering these questions is critical to optimizing the design of nanoparticles for breast cancer diagnostics and therapy, especially for subtypes with less effective treatment options (Vidya Bhargavi et al., 2017).
In this work, we report the synthesis and structural/chemical characterization of Mn-doped Ag₂S nanoparticles and an evaluation of their dose-dependent cytotoxic responses in four representative breast cancer cell lines: luminal A, luminal B, triple-negative and HER2-positive. Our overall goal is to clarify the relationship between Mn doping in Ag₂S nanocrystals and the resulting biological effects to ultimately support the design of safer and more targeted nanoplatforms in precision oncology.
2. Materials and Methods
Materials
Silver nitrate (AgNO₃, ≥99% purity), sodium sulfide nonahydrate (Na₂S-9H₂O, ≥98% purity), manganese (II) chloride tetrahydrate (MnCl₂-4H₂O, ≥99% purity) and L-cysteine (≥98% purity) were purchased from Sigma-Aldrich. All solutions were prepared with distilled water.
Synthesis of Mn-Doped Ag₂S and Ag₂S Nanoparticles
The synthesis of Mn-doped Ag₂S Nanoparticles was via sonochemical method. This method allows for the quick nucleation and formation of nanoparticles in an ultrasonic field, which leads to particles consistent in size and shape
In a typical synthesis, 50 mL of an aqueous solution containing 0.01 M AgNO₃ and 0.001 M MnCl₂ was prepared. L-cysteine (0.02 M) was added to the solution as a stabilizing and capping agent to prevent agglomeration of the nanoparticles. The molar ratio of Ag⁺ to Mn²⁺ ions was kept at 10:1 to achieve the desired doping level.
The mixture was sonicated with an ultrasonic device UP200St with a power of 45 W. The sonication was performed in 5-second pulses (5 s on, 5 s off) to avoid excessive heating of the solution. The total sonication time at this stage was 10 minutes to ensure thorough mixing and interaction between the precursors.
The pH of the reaction mixture was adjusted to 11.3 by the gradual addition of 1 M sodium hydroxide (NaOH) under continuous sonication. Maintaining an alkaline pH is critical for the deprotonation of L-cysteine, enhancing its ability to bind metal ions and stabilizing the nanoparticles.
Subsequently, 50 ml of a freshly prepared 0.01 M Na₂S solution was added dropwise to the reaction mixture over a period of 5 minutes under continuous sonication at 45 W. The addition of the sulfur precursor initiates the formation of Ag₂S nanoparticles [19,20]. After the complete addition of Na₂S, the reaction was allowed to run for a further 5 minutes to ensure the completion of nucleation and growth processes.
The resulting colloidal suspension of Mn-doped Ag₂S nanoparticles was centrifuged at 10,000 rpm for 15 minutes to separate the nanoparticles from the supernatant. Once the nanoparticles are separated, these were washed threefold with deionized water and twice with absolute ethanol to remove unreacted precursors and impurities, after that, the particles were suspended in PBS 1X solution and stored in a dark condition.
To synthesize the bare Ag₂S nanoparticles, the same methodology described for the Mn-doped systems was followed, with the only modification being the exclusion of the Mn precursor. By omitting the manganese source, the reaction proceeded under identical conditions, yielding Ag₂S nanoparticles without Mn incorporation. This approach ensures consistency in the synthesis process, enabling direct comparison between doped and undoped nanoparticles in terms of their physicochemical properties and biological activity
Characterization of Nanoparticles
The Mn-doped Ag₂S nanoparticles were characterized by analytical techniques to clarify their physicochemical properties and confirm the doping with manganese.
The JEOL-JEM-1200 transmission electron microscope (TEM) was used to determine the morphology and size distribution of the nanoparticles. The TEM images provided a visualization of the nanoparticles, detailing their shape, uniformity and the presence of agglomerates.
Fourier transform infrared spectroscopy (FTIR) was performed using a PerkinElmer FT-IR Spectrum Two instrument over a range of 4000 to 500 cm-¹ to identify the vibrational modes and determine the crystal structure to confirm the chemical composition and doped of the nanoparticles.
UV–Vis spectroscopy measurements were performed using a –Shimadzu UV-2600 UV-Vis spectrophotometer in a wavelength range of 200–1000 nm. This analysis was used to evaluate the optical properties of the nanoparticles and confirm their formation. Prior to measurement, the nanoparticle samples were dispersed in deionized water and sonicated for 5 minutes to ensure homogeneous dispersion.
X-ray fluorescence (XRF) analysis was performed to determine the elemental composition of silver (Ag) and sulfur (S) and to quantify the doping with manganese (Mn) in the nanoparticles. Iron (Fe) was used as an elemental reference.
Overall, these characterization techniques provided comprehensive insights into the structure, composition, and surface properties of the Mn-doped Ag₂S nanoparticles.
Cell Culture and Cytotoxicity Assays
All breast cancer cell lines used in this study, MCF-7 (luminal A subtype), MDA-MB-231 (triple negative subtype), BT-474 (luminal B subtype) and SK-BR-3 (HER2-positive subtype), were originally obtained from the American Type Culture Collection (ATCC, Manassas, VA, USA) and provided by Laboratory 2 of the Unit of Biochemistry at the Instituto Nacional de Ciencias Médicas y Nutrición Salvador Zubirán. The cells were cultured in DMEM (Gibco, USA) media supplemented with 10% fetal bovine serum (FBS) (Gibco, USA) and 1% penicillin-streptomycin (Gibco, USA) to ensure optimal growth conditions. Additionally, the cultures were maintained at 37 °C in a humidified atmosphere with 5% CO₂. The experiments were done with cells in passage number 10 or less.
The MTT assay was used to assess cytotoxicity and cell viability. Each cell line was grown for 5 days in 48-well plates at a density optimized according to their proliferation rate to achieve 95–100% confluence at the end of the fifth day. Specifically, MCF-7 cells were seeded at a density of 10,000 cells per well, while MDA-MB-231, BT-474 and SK-BR-3 cells were seeded at a density of 15,000 cells per well. These seeding densities were determined based on the growth profiles of the individual cell lines.
The first two days after the seeding the cells were allowed to adhere without treatment and recover from seeding stress to prevent possible interference with the cell-nanoparticles interaction. After the 48 hr of seeding, the culture medium was carefully removed and replaced with fresh medium containing Mn-doped Ag₂S nanoparticles at concentrations of 1.4, 7 and 14 μg/mL. This treatment was performed for 72 hr to guarantee at least two mitotic cycles for each cell line, to better determine whether there is alteration of the cells by having continuous contact with the nanoparticles
After the 72-hour treatment period, cell viability was determined using the MTT assay [21]. Cells were washed with phosphate buffered saline (PBS) to remove any residual nanoparticles. MTT solution (0.5 mg/mL) was added to each well and the plates were incubated at 37 °C for 4 hours to allow the viable cells to reduce MTT to formazan crystals. After incubation, the supernatant was carefully removed to eliminate unreacted MTT. Dimethyl sulfoxide (DMSO) was then added to each well to dissolve the formazan crystals and the plates were gently shaken to ensure complete dissolution.
The absorbance in each well was measured at 550 nm using a microplate reader Thermo Scientific™ Multiskan™ GO Microplate Spectrophotometer. The absorbance values correlate directly with the number of viable cells, as only living cells can reduce MTT to formazan. Cell viability was calculated as a percentage compared to untreated control cells using equation 1:
where control ABS550 is the absorbance value of the control plate, sample ABS550 is the absorbance value of each sample according with the well.
All experiments were performed in triplicate and data were expressed as mean ± standard deviation (SD).
This methodology enabled the precise evaluation of the dose-dependent cytotoxic effects of Mn-doped Ag₂S nanoparticles on different breast cancer cell lines over a prolonged exposure period. By adjusting the seeding densities according to the proliferation rate of each cell line, we ensured that the cells reached optimal confluence (95–100%) at the end of the experiment.
3. Results
3.1. Characterization of Mn-Doped Ag₂S Nanoparticles
3.1.1. Morphological Analysis
3.1.1.1. Transmission Electron Microscopy (TEM)
Transmission electron microscopy (TEM) revealed remarkable differences in the morphology and size distribution of Ag₂S nanoparticles, both undoped and doped with Mn at concentrations of 1 and 5% w/w (Figure 1A–C). These differences clearly reflect the effects of Mn doping on the nucleation and growth process of Ag₂S nanocrystals.
In the undoped Ag₂S sample (Figure 1A), the nanoparticles were predominantly spherical, well dispersed and showed minimal coalescence, except for one isolated aggregate, which is likely due to preparation artifacts. Statistical size analysis (Figure 1D) revealed an average diameter of 6.3 ± 1.5 nm, with an asymmetric distribution and a tail extending towards larger sizes (~9 nm), indicating a lognormal distribution. No populations with multiple sizes were identified, suggesting a single nucleation event and subsequent homogeneous growth.
In contrast, the nanoparticles doped with 1% w/w Mn (Figure 1B) exhibited significantly smaller (3.4 ± 0.8 nm) and highly uniform particles that formed dense clusters on the carbon support. The size distribution (Figure 1E) was narrower, with a tail barely reaching 5 nm, suggesting that Mn acts primarily as an inhibitor of crystal growth rather than promoting agglomeration. The lognormal nature of the distribution was maintained, but with significantly reduced asymmetry.
Finally, increasing the Mn concentration to 5% w/w (Figure 1C) resulted in a pronounced densification of the nanoparticle film, which covered almost the entire surface of the TEM grating. The mean particle size increased slightly to 4.2 ± 1.3 nm (Figure 1F), accompanied by a higher dispersion and a tail extending up to 8 nm. These observations could be related to incipient sintering or Ostwald ripening processes favored by increased lattice stresses due to excessive doping. Despite this scattering, no second population of particles was detected, ruling out a bimodal distribution.
3.1.2. Chemical Composition
3.1.2.1. Fourier-Transform Infrared Spectroscopy (FTIR)
FTIR spectra for Ag₂S and Ag₂S:Mn nanoparticles were recorded in the range of 500 to 4000 cm⁻¹, as shown in Figure 2.
In Figure 2A, the Ag₂S nanoparticles exhibit three main signals: first one at 690 cm⁻¹ attributed to the characteristic Ag–S bond vibration, another at 1640 cm⁻¹ corresponding to a sulfide group vibration, and a peak at 2985 cm⁻¹ associated with an Ag₂S stretching vibration [22].
Figure 2B presents the spectrum of Ag₂S:Mn 1% w/w nanoparticles. Although these signals closely resemble those of pure Ag₂S, the Ag–S peak exhibits a slight blueshift, likely due to the incorporation of Mn into the lattice. Additionally, two new peaks appear at 1045 and 1085 cm⁻¹, which can be attributed to MnS [23], providing further evidence of successful Mn doping in the Ag₂S nanoparticles.
In Figure 2C, corresponding to Ag₂S:Mn 5% w/w, the same signals are observed with no apparent shifts, except for a minor blueshift in the 685 cm⁻¹ peak, again suggesting Mn integration into the crystalline lattice. The increased intensity of the 1085 and 1045 cm⁻¹ signals in this sample indicates a higher Mn content, amplifying the MnS-related features compared to those observed at lower Mn concentrations.
3.1.2.2. Ultraviolet-visible Spectroscopy (UV-vis)
In Figure 3, the UV-vis absorption spectra of the nanoparticles used in this study are shown, along with the corresponding optical band gap values for each system.
In Figure 3, the UV-vis absorption spectra of the nanoparticles used in this study are shown, along with the corresponding optical band gap values for each system.
In Figure 3A, the primary absorption feature at approximately 322 nm, associated with the presence of Ag₂S (Wu et al., 2017), diminishes as the Mn content increases. Around 300 nm, a subtle signal emerges, indicative of quantum confinement effects particularly in the Mn doped samples are consistent with the smaller particle sizes observed by TEM. Additionally, a negative absorbance region between about 900 and 950 nm likely stems from fluorescence phenomena, reinforcing the notion of quantum confinement due to reduced particle dimensions.
In Figure 3B Tauc plots reveal that the initial band gap is near 3.8 eV, which is larger than that of bulk Ag₂S. This increase is attributed to quantum size effects resulting from the nanoscale dimensions of the particles. As Mn is incorporated into the lattice, the band gap decreases, suggesting that Mn acts as an electron-trapping site, effectively narrowing the energy gap. Given that Mn is a transition metal, the creation of such trap states is plausible (Sovizi & Szoszkiewicz, 2022). Thus, the interplay between reduced particle size, Mn doping, and electron trapping leads to significant modifications of the optical properties.
3.1.3. Elemental Analysis
3.1.3.1. X-ray Fluorescence (XRF)
X-ray fluorescence (XRF) spectroscopy confirmed the composition of the nanoparticles for each specific system. The pure Ag₂S nanoparticles exhibited a silver-to-sulfur (Ag:S) molar ratio of 2.5:1. This excess of silver may account for the larger particle size observed in the TEM micrographs compared to the other systems. The additional silver likely contributes to more extensive crystal growth, resulting in larger nanoparticle dimensions.
For the Ag₂S:Mn 1% w/w system, the measured Ag:S molar ratio was 2.2:1, with a manganese content of 0.83% by weight. This Mn content corresponds exactly to the theoretical 1% intended in the synthesis. The slight reduction in Mn incorporation can be attributed to the incomplete integration of manganese into the crystal lattice during the reaction. Unincorporated Mn may have been removed during the washing steps, leading to the observed deviation. The lower Ag:S molar ratio compared to pure Ag₂S implies that Mn inclusion influences crystal growth. The incorporation of manganese into the lattice probably interferes with the formation of the Ag–S bond, resulting in smaller particle sizes, as shown by TEM analysis.
In the case of the Ag₂S:Mn 5% w/w system, the Ag:S molar ratio decreased further to 2:1, with a manganese weight content of 4.3%, lower than the theoretical 5% target. Similar to the 1% Mn-doped system, this discrepancy suggests incomplete incorporation of Mn during the reaction and subsequent loss of unreacted Mn during washing. The trend of decreasing Ag:S ratio with increasing Mn incorporation highlights the interaction between Mn and sulfur in the lattice. It is plausible that Mn competes with Ag for coordination with sulfur, reducing the likelihood of Ag-S bond formation and subsequently lowering the Ag:S ratio. This mechanism may explain the observed reduction in particle size with increased Mn content. However, while the particle size does not decrease linearly with Mn content, the trend remains consistent: the addition of Mn reduces particle dimensions compared to pure Ag₂S nanoparticles.
These findings underscore the influence of both the Ag:S molar ratio and Mn incorporation on nanoparticle size. The reduction in particle size with Mn doping is likely attributable to the combined effects of disrupted crystal growth due to the presence of Mn and the altered stoichiometric relationships between Ag and S.
3.2. Cytotoxic Effects on Breast Cancer Cell Lines
3.2.1. Cell Viability Assessment
3.2.1.1. MTT Assay Results
In Figure 4, the MTT assay results for the four cell lines, MCF-7, MDA-MB-231, BT-474, and SKBR-3 are presented. Figure 5A shows that none of the nanoparticle systems exhibit apparent cytotoxicity in the MCF-7 cell line. The lowest viability is observed for pure Ag₂S at 14 mg/L, but as the nanoparticle concentration decreases, cell viability increases, reaching 103.37% at 1.4 mg/L. For the Ag₂S:Mn 1% w/w system, although at 14 mg/L the viability is around 97% (higher than pure Ag₂S at the same concentration), the intermediate concentration (7 mg/L) presents the lowest viability among all three nanoparticle systems at this dose level. Interestingly, at 1.4 mg/L, the Ag₂S:Mn 1% w/w nanoparticles yielded a viability of about 110%, suggesting a slight proliferative stimulus at lower concentrations. Meanwhile, the Ag₂S:Mn 5% w/w nanoparticles exhibit roughly 90% viability across all tested concentrations, indicating minimal cytotoxic effect but no significant proliferative influence.
Figure 4B displays the viability of MDA-MB-231 cells. Here, Ag₂S nanoparticles at 14 mg/L show a mild cytotoxic effect (77.8% viability) that diminishes as the concentration decreases, mirroring the trend observed in MCF-7 cells. The Ag₂S:Mn 1% w/w nanoparticles produce the lowest overall viability at 14 mg/L (72%), but, as with the MCF-7 line, lowering the concentration to 1.4 mg/L raises the viability to approximately 98%. In contrast, the Ag₂S:Mn 5% w/w nanoparticles are more consistently cytotoxic toward MDA-MB-231 cells, with viability values of about 72% and 70% at 14 and 7 mg/L, respectively. These findings suggest that the use of 5% Mn-doped Ag₂S nanoparticles may not be suitable for this cell line, as even moderate concentrations lead to pronounced cytotoxicity.
Figure 4C shows the results for BT-474 cells. Both Ag₂S and Ag₂S:Mn 1% w/w nanoparticles produce viability values exceeding 100% at all concentrations tested, indicating a notable proliferative effect rather than toxicity. The Ag₂S:Mn 5% w/w system, however, exhibits a more complex response. At an intermediate concentration (7 mg/L), these nanoparticles yield a relatively higher proliferation, while at the lower concentration (1.4 mg/L), the viability decreases. This behavior could be attributed to a dose-dependent cellular response where an intermediate nanoparticle concentration or specific Mn-to-Ag₂S ratio interacts with the cell membrane or intracellular pathways to induce a mild stress response, leading to short-term proliferative signaling. At lower concentrations, the stimulus may be insufficient to elicit this response, while at higher concentrations, the balance shifts and may cause stress responses detrimental to viability.
Finally, Figure 4D presents the outcomes for SK-BR-3 cells. For Ag₂S, the viability remains around 90% across all three nanoparticle concentrations, suggesting a mild but consistent effect. In the Mn-doped systems, the highest concentration (14 mg/L) results in a slight cytotoxic effect, with viability values above 75%. As concentration decreases, viability increases, indicating that lower particles concentration mitigates toxicity and favors cell survival.
These results demonstrate that both the concentration of nanoparticles and the presence of Mn doping significantly influence the cellular response, and that the effect varies depending on the cell line. While some conditions show mild cytotoxicity, others induce either neutral or even proliferative effects. The interplay between nanoparticle composition, dose, and cell type thus determines the outcome, emphasizing the importance of tuning nanoparticle properties for specific biomedical applications. In Figure 5, the MTT assay results for the four cell lines, MCF-7, MDA-MB-231, BT-474, and SKBR-3 are presented. Figure 5A shows that none of the nanoparticle systems exhibit apparent cytotoxicity in the MCF-7 cell line. The lowest viability is observed for pure Ag₂S at 14 mg/L, but as the nanoparticle concentration decreases, cell viability increases, reaching 103.37% at 1.4 mg/L. For the Ag₂S:Mn 1% w/w system, although at 14 mg/L the viability is around 97% (higher than pure Ag₂S at the same concentration), the intermediate concentration (7 mg/L) presents the lowest viability among all three nanoparticle systems at this dose level. Interestingly, at 1.4 mg/L, the Ag₂S:Mn 1% w/w nanoparticles yielded a viability of about 110%, suggesting a slight proliferative stimulus at lower concentrations. Meanwhile, the Ag₂S:Mn 5% w/w nanoparticles exhibit roughly 90% viability across all tested concentrations, indicating minimal cytotoxic effect but no significant proliferative influence.
3.2.1.2. MTT assay statistical results
To further support the observations made in the MTT assay, a multifactorial ANOVA was performed to assess how nanoparticle concentration and Mn doping influence viability in four distinct breast cancer cell lines (MCF-7, MDA-MB-231, BT-474, and SK-BR-3). The global analysis confirmed that each main factor; cell line, nanoparticle concentration, and doping level significantly affected cell viability (p < 0.05). Moreover, most of the interactions among these factors including the triple interaction also reached statistical significance (p < 0.05), suggesting that the interplay between Mn doping and concentration varies depending on the specific cell line. Levene’s test was conducted prior to ANOVA to evaluate homoscedasticity, revealing some heterogeneity of variances; hence, caution was exercised in interpreting the results. Nevertheless, a post hoc Tukey’s test was performed to pinpoint specific group differences, and a power analysis indicated values above 0.90 for all main effects and interactions, ensuring robust detection of statistically significant differences.
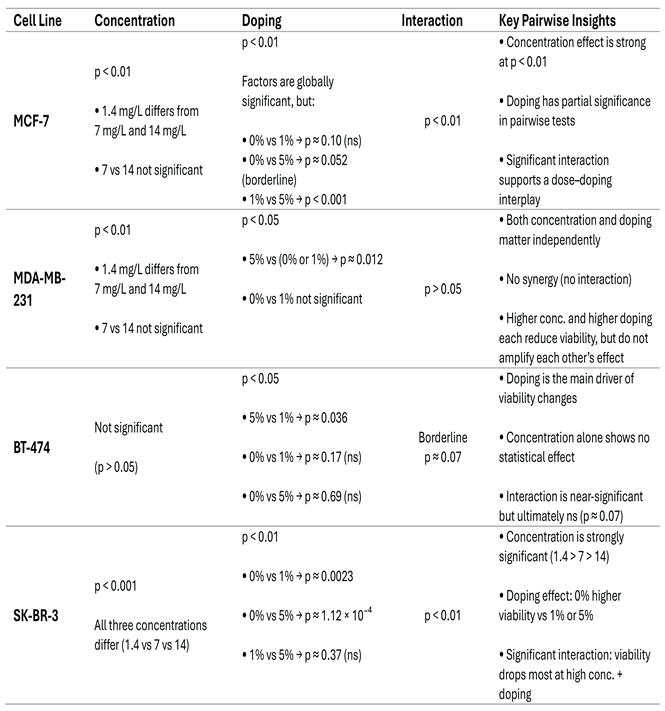
Focusing on MCF-7, a two-way ANOVA (concentration × doping) showed that both factors had statistically significant main effects (p < 0.01), and their interaction term also proved significant (p < 0.01). Post hoc comparisons revealed that the lowest concentration (1.4 mg/L) yielded significantly higher viability than either 7 or 14 mg/L (p < 0.01), whereas 7 and 14 mg/L did not differ from one another (p ≈ 0.41). Regarding Mn content, moving from 1% to 5% doping produced a clear cytotoxic effect (p < 0.001), although differences between 0% and 1% (p ≈ 0.10) and between 0% and 5% (p ≈ 0.052) did not reach strict significance. Nevertheless, at a low concentration (1.4 mg/L), certain formulations demonstrated slightly increased viability, suggesting a potential proliferative effect under those conditions. These findings underscore a complex interplay between concentration and doping for MCF-7, as evidenced by the significant interaction term and the high statistical power (≥ 0.98) observed in the analysis, aligning with the qualitative trends shown in Figure 4A.
In addition, complementary one-way ANOVA with the Dunnett post hoc test provided further details on these concentration-dependent effects for each doping level. For pure Ag₂S nanoparticles (F (3,8) = 31.67, p < 0.0001), a significant decrease in viability was observed at 14 µg/mL (ΔM = 18.58, p = 0.0002), while no significant differences were observed at 1.4 µg/mL (ΔM = −3.37, p = 0.4253) or 7 µg/mL (ΔM = 2.12, p = 0.7298). At 1% Mn-doped Ag₂S (F (3,8) = 15.34, p = 0.0011), viability decreased significantly at 7 µg/mL (ΔM = 10.86, p = 0.0236) and, albeit with a higher p-value, also at 14 µg/mL (ΔM = 2.558, p = 0.7686), while 1.4 µg/mL had no detectable effect. Finally, at 5% Mn-doped Ag₂S (F (3,8) = 10.42, p = 0.0039), all concentrations resulted in a significant decrease in viability compared to the control, with 14 µg/mL showing the strongest effect (ΔM = 11.46, p = 0.0024). Overall, these one-way ANOVA results confirm the dose-dependent response observed in the two-way ANOVA and reinforce that higher concentrations and higher Mn doping generally lead to stronger cytotoxic effects in MCF-7 cells.
In contrast, the two-way ANOVA (concentration × doping) for MDA-MB-231 revealed significant main effects of concentration (F = 16.82, p ≈ 7.59 × 10⁻⁵) and doping (F = 6.94, p ≈ 0.0058), yet the interaction term did not reach statistical significance (F = 1.17, p ≈ 0.356). Post hoc Tukey comparisons confirmed that the lowest concentration (1.4 mg/L) yielded significantly higher viability than either 7 mg/L (p ≈ 0.0033) or 14 mg/L (p ≈ 6.14 × 10⁻⁵), while there was no difference between 7 and 14 mg/L (p ≈ 0.18). Regarding Mn content, a 5% doping level reduced viability more than 0% or 1% Mn doping (both p ≈ 0.012), whereas 0% and 1% did not differ (p ≈ 1.00). Consequently, the highest concentration (14 mg/L) consistently elicited the largest decline in viability, and 5% Mn doping produced the strongest cytotoxic effect; however, no evidence of a synergistic or antagonistic interaction emerged. Power analysis indicated high sensitivity for detecting main effects of concentration (~0.999) and doping (~0.874), but a lower power (~0.63) for the interaction, aligning with its lack of statistical significance. Collectively, these findings align with Figure 5B, where 5% Mn-doped Ag₂S nanoparticles at higher concentrations produced the greatest cytotoxic effect, yet each factor exerted its influence independently.
The one-way ANOVA with the Dunnett post hoc test provided further details on these effects for each nanoparticle formulation. For pure Ag₂S nanoparticles (F (3,8) = 8.94, p = 0.0062), significant reductions in viability were observed at 7 µg/mL (ΔM = 15.80, p = 0.0205) and 14 µg/mL (ΔM = 22.13, p = 0.0031). At 1% Mn-doped Ag₂S (F (3,8) = 27.08, p = 0.0002), viability decreased significantly at 7 µg/mL (ΔM = 16.66, p = 0.0043) and 14 µg/mL (ΔM = 27.84, p = 0.0001), while 1.4 µg/mL showed no significant effect (ΔM = 1.56, p = 0.9462). Finally, at 5% Mn-doped Ag₂S (F (3,8) = 12.36, p = 0.0023), all tested concentrations resulted in a significant decrease in viability, including 1.4 µg/mL (ΔM = 16.66, p = 0.0468), 7 µg/mL (ΔM = 29.95, p = 0.0020) and 14 µg/mL (ΔM = 29.72, p = 0.0021). These results confirm that MDA-MB-231 cells show a pronounced dose-dependent response, especially at higher Mn doping levels, reflecting the trends observed in the two-way ANOVA.
When examining BT-474, the main effect of doping proved significant (F = 8.90, p ≈ 0.0039), whereas concentration did not (p > 0.05). The interaction term approached significance (p ≈ 0.074) but did not surpass the usual threshold (p < 0.05). Post hoc comparisons further indicated that doping at 5% yielded significantly lower viability than 1% (p ≈ 0.036), while 0% did not differ from either 1% or 5%. Notably, 0% and 1% Mn doping often led to viability values surpassing 100%, suggesting a mild proliferative or stimulatory effect in BT-474 cells under certain doping conditions. Concentration itself showed no statistically significant effect (p ≈ 0.885), implying that BT-474’s response within this nanoparticle range is governed more by doping than by dose (Figure 5C). Consistent with these findings, the statistical power for doping was moderate (~0.63), whereas concentration showed very low power (~0.07), aligning with its lack of observed significance. A summary of the more relevant results is presented in table 1
The results of the Dunnett post hoc test from the one-way ANOVA provided further insight into the response of BT-474 cells to specific nanoparticle formulations. For pure Ag₂S nanoparticles (F (3,8) = 0.31, p = 0.8154), no significant differences in viability were observed at any concentration, suggesting a lack of cytotoxicity. In contrast, 1% Mn-doped Ag₂S (F (3,8) = 4.36, p = 0.0424) resulted in a significant decrease in viability only at 1.4 µg/mL (ΔM = 31.32, p = 0.0198), while higher concentrations showed no significant effect. Finally, 5% Mn-doped Ag₂S (F (3,8) = 2.67, p = 0.1186) did not show significant differences at any of the concentrations tested. Overall, these results support the notion that BT-474 cells appear to be relatively tolerant to Ag₂S nanoparticles, even at high concentrations or higher Mn doping.
Lastly, SK-BR-3 cells displayed significant main effects for concentration (F = 40.73, p ≈ 2.08 × 10⁻⁷) and doping (F = 15.17, p ≈ 1.12 × 10⁻⁴), along with a significant interaction (F = 6.43, p ≈ 5.54 × 10⁻⁴). Tukey’s post hoc analysis revealed that all three concentrations differ from one another (p < 0.05), with 1.4 mg/L maintaining higher viability than 7 or 14 mg/L, while 7 mg/L also exceeds 14 mg/L (p ≈ 0.015). Regarding Mn doping, 0% supports significantly greater viability than either 1% (p ≈ 0.0023) or 5% (p ≈ 1.12 × 10⁻⁴), although 1% and 5% do not differ from each other (p ≈ 0.37). This indicates that the effect of concentration is strongly modulated by the Mn doping level. Higher nanoparticle concentrations (7 and 14 mg/L) produced a more pronounced cytotoxic effect relative to 1.4 mg/L, and raising Mn doping, especially above 0% further decreased viability. Consequently, combining the highest nanoparticle concentration with the highest Mn doping typically yielded the steepest drop in viability, although lower concentrations-maintained viability above 75–90% (Figure 4D). In line with these findings, the statistical power for each factor and their interaction exceeded 0.99, confirming the robustness of these results.
Additionally, supplementary one-way ANOVA with Dunnett’s post hoc test provided further details on the different reaction patterns in SK-BR-3. No significant differences were observed at any concentration for pure Ag₂S nanoparticles (F (3,8) = 2.89, p = 0.1021). In contrast, 1% Mn-doped Ag₂S (F (3,8) = 145.2, p < 0.0001) showed a significant reduction in viability at 7 µg/mL (ΔM = 13.90, p < 0.0001) and 14 µg/mL (ΔM = 22.37, p < 0.0001), while 1.4 µg/mL had no effect. Similarly, 5% Mn-doped Ag₂S (F (3,8) = 19.15, p = 0.0005) caused a significant reduction at 7 µg/mL (ΔM = 15.82, p = 0.0064) and 14 µg/mL (ΔM = 24.29, p = 0.0004). These results emphasize the increased sensitivity of SK-BR-3 cells to Mn-doped nanoparticles at higher concentrations, while pure Ag₂S nanoparticles had no significant effects in the tested range.
Overall, these ANOVA findings confirm the importance of both nanoparticle concentration and Mn doping in modulating breast cancer cell viability. The way these factors interact, however, is cell-line dependent. While BT-474 exhibited minimal concentration-dependent changes with doping (particularly 5%) exerting the primary influence MCF-7 and SK-BR-3 revealed significant interaction effects, hinting at synergistic cytotoxic outcomes at elevated levels of both doping and concentration. Meanwhile, MDA-MB-231 showed strong sensitivity to each factor in isolation but no clear interaction between them, indicating that higher concentrations and 5% Mn doping independently reduced viability without an additive or synergistic component. Collectively, these observations underscore the need to fine-tune nanoparticle formulations and dosing regimens to optimize therapeutic effectiveness for different cancer cell types. A summary of the most relevant findings (Figure 4) is presented in Table 2, which provides the ANOVA post hoc (Tukey) test results and highlights the concentration- and doping-dependent responses across all four cell lines. Meanwhile, Table 2 contains the corresponding results obtained with the Dunnett test.

Table 1.
Summary of the most relevant findings from the ANOVA analysis of the MTT assay in MCF-7, MDA-MB-231, BT-474, and SK-BR-3 breast cancer cell lines treated with pure Ag₂S and Mn-doped Ag₂S (1% w/w and 5% w/w) at concentrations of 1.4 mg/L, 7 mg/L, and 14 mg/L after 72 hours of exposure.
Table 1.
Summary of the most relevant findings from the ANOVA analysis of the MTT assay in MCF-7, MDA-MB-231, BT-474, and SK-BR-3 breast cancer cell lines treated with pure Ag₂S and Mn-doped Ag₂S (1% w/w and 5% w/w) at concentrations of 1.4 mg/L, 7 mg/L, and 14 mg/L after 72 hours of exposure.
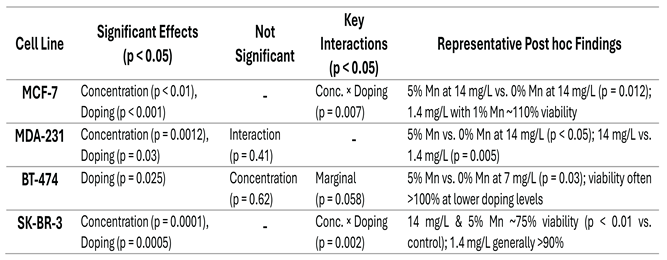 |
Table 2.
Results of the statistical analysis (one-way ANOVA with Dunnett’s post hoc test) comparing the effect of concentration and doping on the viability of four breast cancer cell lines (MCF-7, MDA-MB-231, BT-474, and SK-BR-3).
Table 2.
Results of the statistical analysis (one-way ANOVA with Dunnett’s post hoc test) comparing the effect of concentration and doping on the viability of four breast cancer cell lines (MCF-7, MDA-MB-231, BT-474, and SK-BR-3).
 |
3.2.1.3. Dose-Dependent Effects
The viability results reveal clear dose-dependent trends across all cell lines and nanoparticle systems tested. Generally, higher nanoparticle concentrations tended to produce lower viability values, indicating mild cytotoxic effects, while decreasing concentrations often restored or even enhanced cell survival and proliferation.
In MCF-7 cells, pure Ag₂S at the highest concentration (14 mg/L) showed the lowest viability, but as the concentration decreased, viability improved and even surpassed 100% at 1.4 mg/L. A similar pattern emerged for the Ag₂S:Mn 1% w/w system, where lower doses significantly boosted viability, suggesting a slight proliferative stimulus at reduced nanoparticle concentrations. This trend highlights that, for MCF-7 cells, diminishing the nanoparticle concentration mitigates any initial cytotoxicity and can, in some cases, promote cell growth.
A comparable response was observed in MDA-231 cells. Bare Ag₂S and Ag₂S:Mn 1% w/w nanoparticles both showed lower viability at the highest concentration and improved viability as the nanoparticle dose decreased. Although Ag₂S:Mn 5% w/w exerted a more pronounced cytotoxic effect at higher doses (14 and 7 mg/L), reducing the concentration to 1.4 mg/L led to increased viability. Thus, dose reduction can also lessen cytotoxic effects in this more sensitive cell line, although the presence of higher Mn content appears to intensify concentration-dependent toxicity.
For BT-474 cells, dose-dependent patterns were partially reversed for the Ag₂S and Ag₂S:Mn 1% w/w systems, as both exhibited proliferative responses (>100% viability) at all concentrations tested. However, for the Ag₂S:Mn 5% w/w nanoparticles, dose alterations did influence the outcome: an intermediate concentration (7 mg/L) promoted cell proliferation, while a lower dose reduced viability. This non-linear dose-response behavior suggests a complex interplay between nanoparticle concentration and cellular stress responses, potentially involving dose thresholds that trigger distinct cellular pathways.
In SK-BR-3 cells, a dose-dependent response was again evident. While pure Ag₂S maintained around 90% viability across all concentrations, both Mn-doped systems showed slight cytotoxic effects at 14 mg/L. Lowering the nanoparticle concentration led to improved viability, mitigating the initial adverse effects seen at higher doses.
Taken together, these findings underscore that the concentration of nanoparticles is a critical factor shaping cell viability outcomes. Lower doses generally diminish or negate cytotoxic effects, and in some cases, even enhance cell proliferation. Conversely, higher doses tend to produce mild to moderate cytotoxic responses, particularly in the presence of higher Mn content. This complex, dose-dependent behavior highlights the importance of carefully adjusting nanoparticle concentrations for potential biomedical applications, ensuring that any therapeutic benefits are not overshadowed by unwanted cytotoxicity.
3.2.2. Comparative Analysis Across Cell Lines
3.2.2.1. Differential Sensitivity
The MCF-7 cell line exhibited distinct responses to each nanoparticle system and concentration tested as can be seen in Figure 5, as reflected in both MTT assay outcomes and corresponding microscopy images.
Exposure to pure Ag₂S nanoparticles at the highest concentration (14 mg/L) resulted in a slight decrease in cell density and the appearance of rounder cellular morphologies, suggesting mild cytotoxicity at this dosage. In contrast, at lower concentrations (7 mg/L and 1.4 mg/L), the cell population appeared healthier and more confluent and maintained an adherent and elongated morphology. This observation is consistent with the MTT results, where viability was greater than 100 at 1.4 mg/L, possibly indicating a proliferative effect induced by lower nanoparticle doses.
For the Ag₂S:Mn nanoparticles 1% w/w, cells treated with the highest concentration (14 mg/L) showed higher cell density and fewer morphological changes than cells treated with pure Ag₂S at the same concentration. These results confirm the MTT data, which showed lower cytotoxicity for the 1% Mn-doped system. At a mean concentration of 7 mg/L, a significant decrease in cell density was observed, consistent with a corresponding decrease in viability detected by the MTT assay. This concentration appears to be the most critical in terms of cytotoxic response of the 1% Mn-doped system. At the lowest concentration (1.4 mg/L), there was clear evidence of cellular proliferation with a marked increase in cell density compared to the untreated controls, further supporting the notion of a proliferation stimulus at lower nanoparticle doses.
In contrast, the Ag₂S:Mn 5% w/w nanoparticles triggered a more stable reaction at all concentrations tested. Microscopy showed uniform cell density and intact cell morphology, indicating negligible cytotoxicity. These observations are consistent with the results of the MTT assay, which showed an average viability of approximately 90%. Although this formulation did not elicit the pronounced proliferative response observed with the 1% Mn-doped nanoparticles, cell integrity and viability were maintained under all conditions tested.
Overall, these observations underline the different sensitivity of MCF-7 cells to different compositions and concentrations of nanoparticles. While pure Ag₂S and the Ag₂S:Mn 1% w/w systems showed pronounced dose-dependent effects from mild cytotoxicity at higher concentrations to potential proliferative stimulation at lower doses the Ag₂S:Mn 5% w/w formulation supported stable cellular conditions without significant cytotoxic or proliferative effects. The microscopic images therefore provide visual confirmation of the concentration-dependent responses and highlight the different behavior of the individual nanoparticle systems in this model cell line.
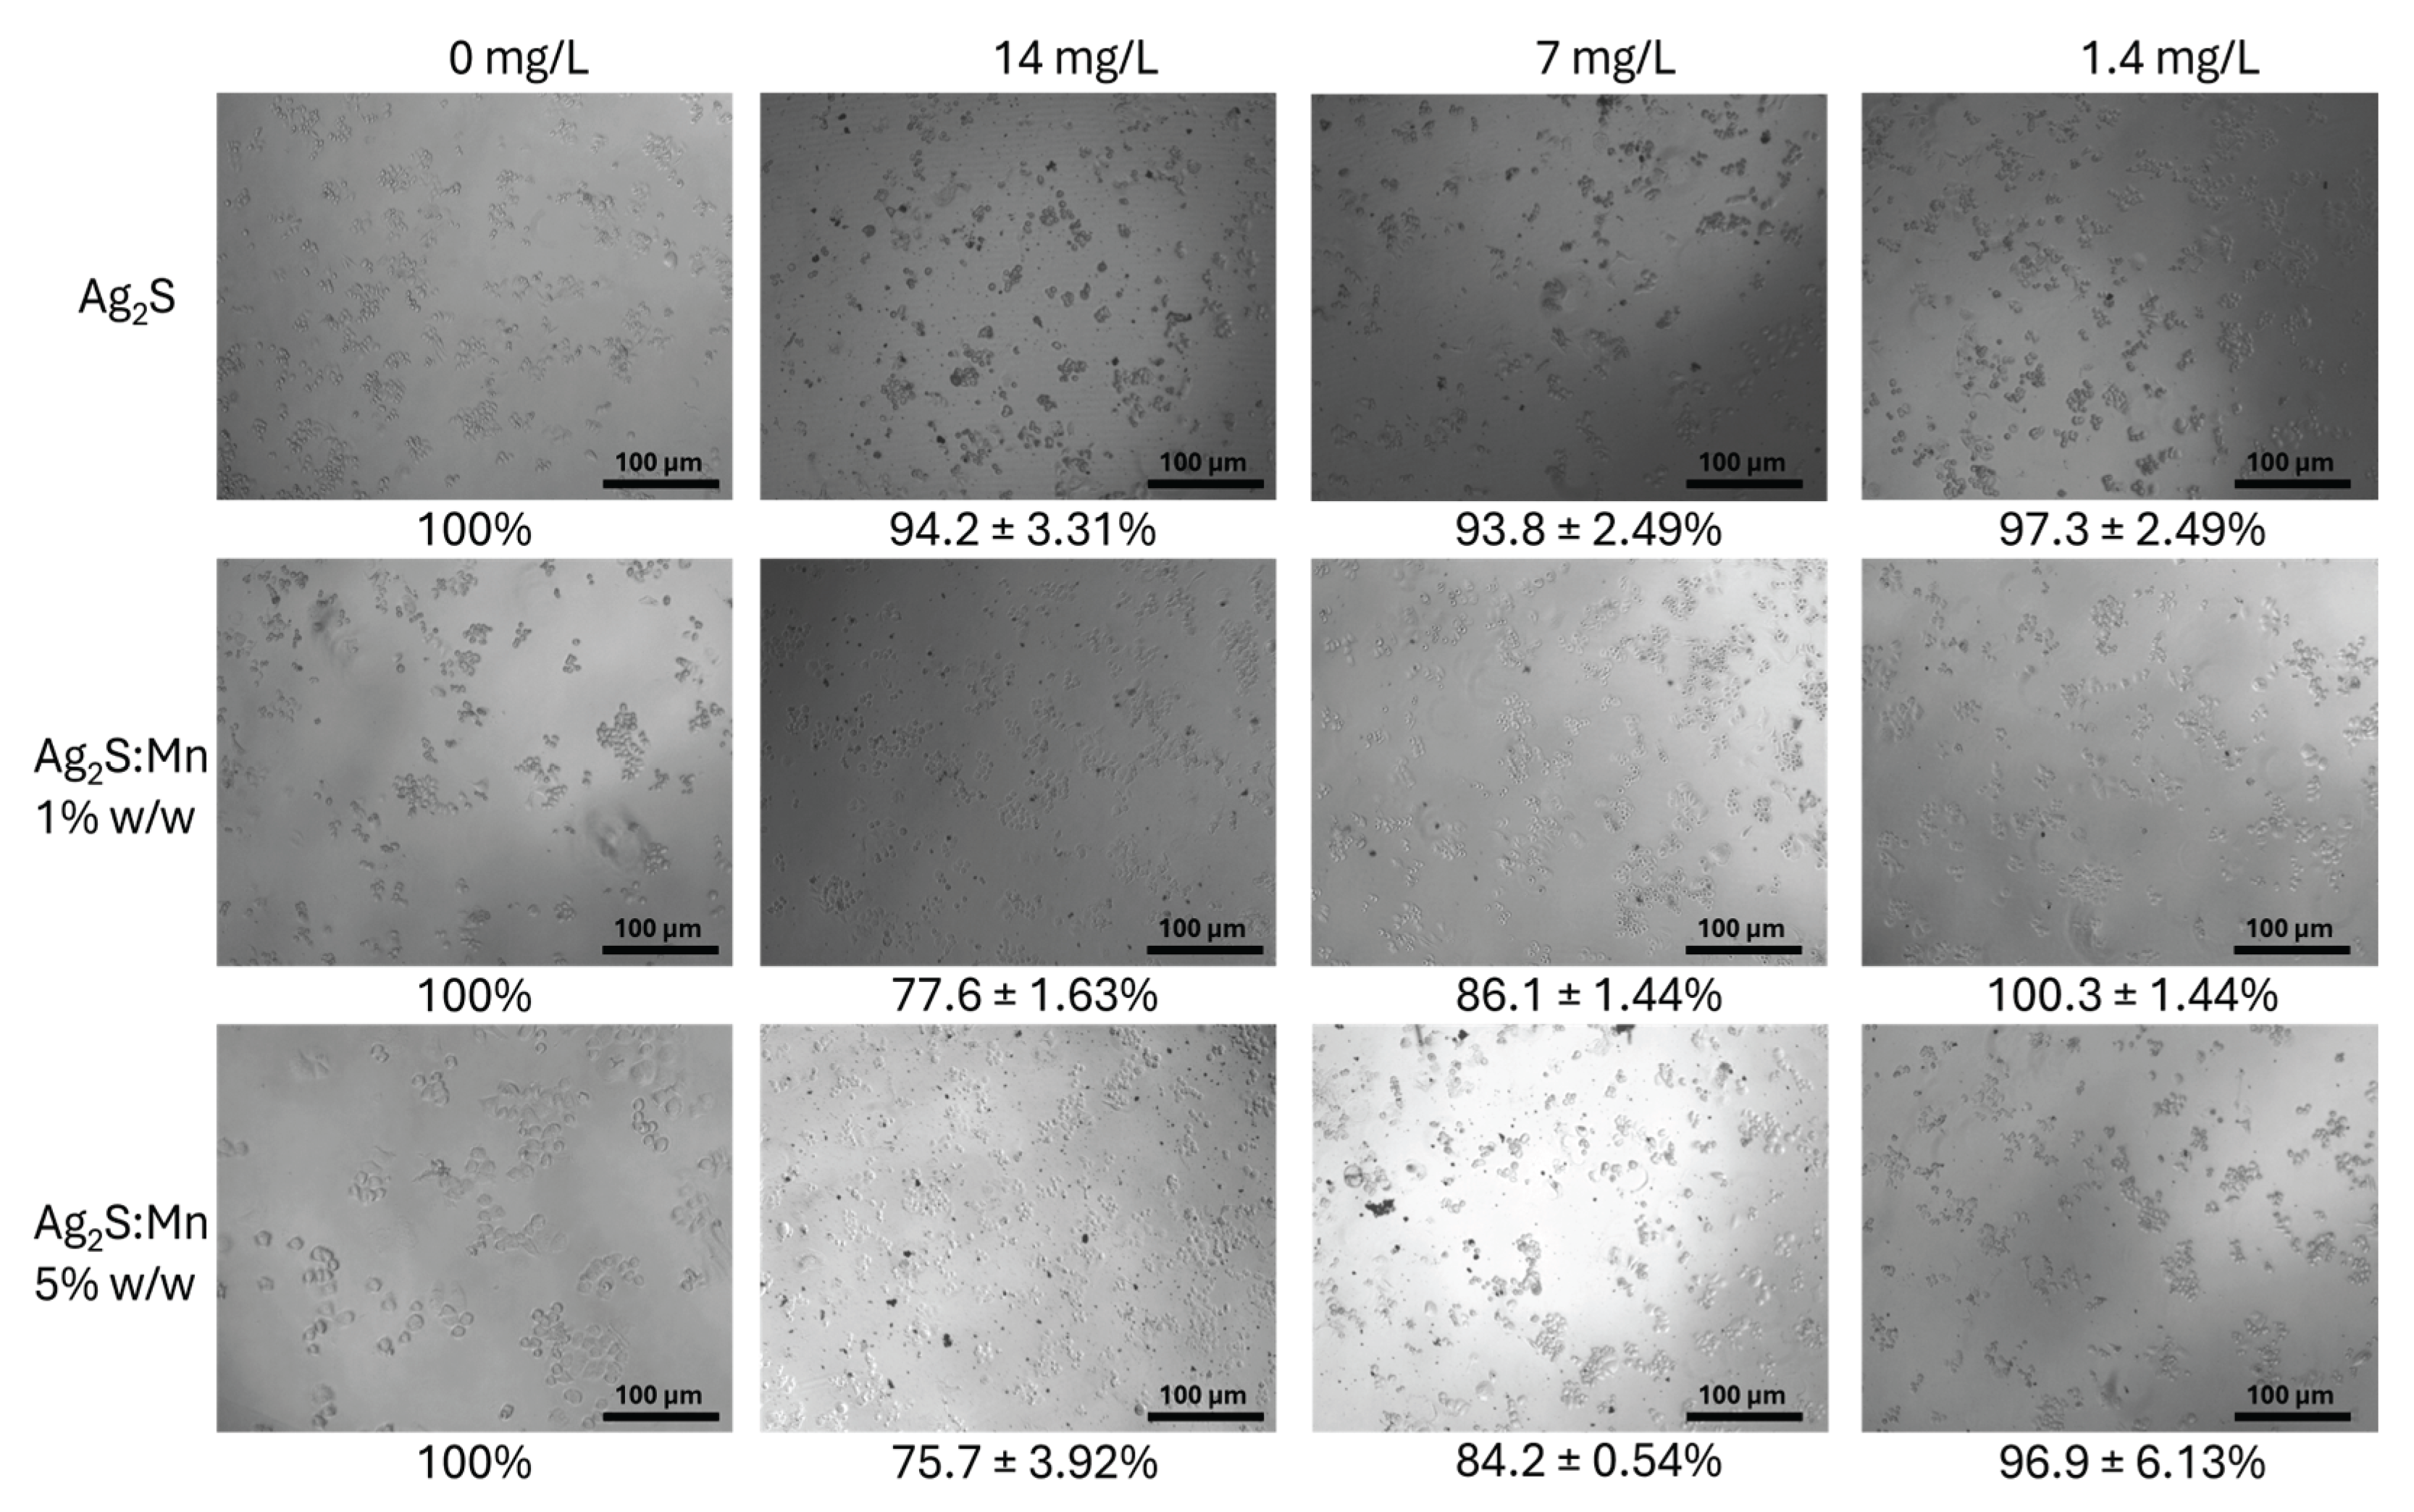
MDA-231 cells demonstrated marked sensitivity to the different nanoparticle systems and tested concentrations, as evidenced by the microscopy images showed in Figure 6.
For pure Ag₂S nanoparticles, the highest concentration (14 mg/L) caused a noticeable reduction in cell density, with some cells adopting a more rounded morphology. However, the minimal presence of cellular debris suggests a predominantly cytostatic effect, meaning that cell growth was inhibited rather than resulting in widespread cell death. At 7 mg/L, cell density increased compared to 14 mg/L, with most cells maintaining an elongated and adherent morphology, indicating reduced cellular stress. At the lowest concentration (1.4 mg/L), an even greater recovery was observed, with cells appearing uniformly distributed, exhibiting typical morphology and a healthy appearance. This aligns with the increased cell viability reported in the MTT assays at this dose.
In the case of Ag₂S:Mn 1% w/w nanoparticles, more pronounced effects were observed at 14 mg/L, including a severe reduction in cell density, rounded and shrunken cells, and the presence of cellular debris the characteristics indicative of membrane damage and cell death (cytotoxic effect). At 7 mg/L, some cellular recovery was apparent, but rounded cells and debris were still observed, suggesting a shift toward a more cytostatic effect without fully restoring initial conditions. Finally, at 1.4 mg/L, most cells regained their elongated morphology, with minimal debris visible. This finding corresponds to the improved viability observed in the MTT assay, indicating that cellular stress is significantly reduced at this lower concentration.
For Ag₂S:Mn (5% w/w) nanoparticles, the impact was most severe at higher concentrations. At 14 mg/L, a marked decrease in cell density, abundant debris, and heavily altered cell morphology (rounded and contracted cells) were observed, clearly indicating a cytotoxic effect. At 7 mg/L, these effects diminished slightly, but the presence of rounded cells and debris persisted. However, at 1.4 mg/L, a notable recovery was evident, with most cells displaying an elongated and adherent morphology, suggesting reduced cytotoxicity and partial restoration of physiological conditions.
In summary, morphological observations indicate that MDA-231 cells exhibit greater vulnerability to Mn-doped nanoparticles (1% and 5% w/w) at high concentrations, with clear evidence of cytotoxic damage. In contrast, pure Ag₂S nanoparticles at high concentrations appear to induce primarily a cytostatic effect, inhibiting cell proliferation without causing widespread cell death. At low concentrations (1.4 mg/L), all systems demonstrated significant recovery in terms of morphology and density, reflecting reduced cellular stress and viability levels closer to those of the controls. These differences underscore the importance of dose optimization, particularly for Mn-doped nanoparticles, to minimize adverse effects while leveraging their therapeutic potential.
The BT-474 cell line exhibited distinct responses to the nanoparticle systems and concentrations evaluated, as shown in Figure 7, which highlights changes in cell morphology, density, and the presence of cellular debris. These observations provide insight into whether the observed effects were primarily cytotoxic, characterized by cell death and debris, or cytostatic, where cell proliferation was inhibited without extensive cellular destruction.
For pure Ag₂S nanoparticles, the highest concentration (14 mg/L) resulted in a clear reduction in cell density, with many cells adopting a rounded and partially detached morphology. These features suggest a mild cytotoxic effect, although the lack of significant debris points to a likely cytostatic component where cellular proliferation is halted rather than widespread cell death occurring. At 7 mg/L, cells appeared healthier, showing a mix of elongated and slightly rounded morphologies, indicating partial recovery from the stress observed at the higher dose. At the lowest concentration (1.4 mg/L), cells regained typical morphology, appearing elongated and adherent, with no visible signs of stress. This is consistent with the MTT results, which indicated cell viability exceeding 100%, likely due to a proliferative stimulus at this dose.
The Ag₂S:Mn 1% w/w nanoparticles triggered stronger effects at the highest concentration of 14 mg/L. A significant reduction in cell density was observed, accompanied by cell debris and the presence of rounded and shrunken cells, indicating a strong cytotoxic effect. At 7 mg/L, cells only partially recovered as some debris and rounded cells remained visible, indicating ongoing cytotoxic stress. At 1.4 mg/L, the cell population appeared to largely recover, with elongated cells and minimal debris, consistent with the increased viability observed in the MTT assay, reflecting reduced cytotoxicity at this lower dose.
The Ag₂S:Mn 5% w/w nanoparticles exhibited the most severe cytotoxic effects. At 14 mg/L, extensive cell debris and shrunken, rounded cells were seen, confirming significant cell death. At 7 mg/L, similar signs of damage were seen, with dense debris and a few adherent cells. However, at 1.4 mg/L, the images showed a slight improvement, with fewer signs of stress, although recovery was less pronounced compared to the other nanoparticle systems. This suggests that while lower concentrations reduce cytotoxicity, the higher Mn content of this system still imposes stress on the cells.
The morphological analysis of BT-474 cells reveals a clear dose-dependent sensitivity to the nanoparticle systems. Higher concentrations of Mn-doped nanoparticles, particularly the 5% w/w system, induced substantial cytotoxic effects, as indicated by the abundance of cellular debris and shrunken cell morphology. Pure Ag₂S nanoparticles at higher concentrations appeared to primarily exert cytostatic effects, inhibiting cell proliferation without widespread death. At lower concentrations (1.4 mg/L), all nanoparticle systems supported cellular recovery, with cells exhibiting healthy morphology and density, indicating reduced stress and restored viability.
The SK-BR-3 cell line demonstrated distinct responses to the nanoparticle systems and concentrations, as shown in Figure 8, which highlights changes in cellular morphology, density, and debris presence. These observations reflect whether the nanoparticles induced primarily cytotoxic effects, characterized by cell death and debris, or cytostatic effects, where proliferation was inhibited without significant cell death.
For pure Ag₂S nanoparticles, the highest concentration (14 mg/L) caused a moderate reduction in cell density, with cells appearing rounded but still partially adherent. The minimal presence of cellular debris suggests that this effect was primarily cytostatic rather than cytotoxic, inhibiting proliferation without widespread cell death. At 7 mg/L, the cells showed signs of recovery, with an increase in density and more adherent morphologies. At the lowest concentration (1.4 mg/L), the cells exhibited nearly complete recovery, appearing healthy, with increased density and morphology typical of SK-BR-3 cells. This observation aligns with the MTT data showing viability near 90%, indicating minimal stress at lower doses.
With Ag₂S:Mn 1% w/w nanoparticles, the effects were more pronounced at 14 mg/L. The cell density was significantly reduced and the cells showed pronounced rounding and some debris, indicating cytotoxic effects. At 7 mg/L, there was a visible improvement in cell density and morphology, with less debris and cells re-adhering to each other, indicating a cytostatic response. At 1.4 mg/L, cells appeared to have largely recovered, with minimal debris and normal morphology, consistent with the increased viability reported in the MTT assay for this dose.
The Ag₂S:Mn 5% w/w nanoparticles elicited the strongest effects. At 14 mg/L, images showed extensive cell death evidenced by significant cell debris and fragmented cells with a marked reduction in cell density. At 7 mg/L, some recovery was observed, with a slight decrease in debris and a small number of adherent cells, although cytotoxic effects were still evident. At 1.4 mg/L, cells showed partial recovery with improved density and less evidence of stress, although recovery was less pronounced compared to the other nanoparticle systems.
These results demonstrate a clear dose-dependent response. Higher concentrations of Mn-doped nanoparticles, particularly the 5% w/w system, caused significant cytotoxic effects, with abundant debris and fragmented cells. In contrast, pure Ag₂S nanoparticles at higher concentrations predominantly exhibited cytostatic effects, as evidenced by minimal debris and cells maintaining adherence despite inhibited proliferation. At the lowest concentration (1.4 mg/L), all nanoparticle systems supported recovery, with cells regaining normal morphology and density.
In summary, the SK-BR-3 cell line showed higher sensitivity to Mn-doped nanoparticles at elevated concentrations, particularly the 5% w/w system, which induced severe cytotoxic effects. Pure Ag₂S nanoparticles primarily caused cytostatic effects at higher concentrations, while lower doses of all systems allowed for cellular recovery and minimal stress.
3.2.3. Time-Dependent Effects
3.2.3.1. Extended Exposure Outcomes
Over three days of treatment, MCF-7 and BT-474 cells demonstrated sustained proliferation at lower nanoparticle concentrations, particularly for pure Ag₂S and Ag₂S:Mn 1% w/w. Images showed healthy, elongated cells with minimal stress, indicating that these systems are well-tolerated by these luminal cell lines under prolonged exposure. In agreement with the ANOVA findings (Section 3.2.1.2 and 3.2.2), MCF-7 exhibited a statistically significant interaction (p < 0.01) between concentration and doping, while BT-474 showed a strong main effect of doping (p < 0.05) but no significant effect of concentration (p > 0.05). From the ANOVA perspective (Section 3.2.1.2), these observations align with the moderate interaction observed in MCF-7 (significant synergy between concentration and doping) and the dominant effect of doping (rather than concentration) found in BT-474. In both lines, lower dosing levels mitigated cytotoxic impacts and, in some cases, even elicited mild proliferative effects.
In contrast, MDA-MB-231 and SK-BR-3 cells showed more pronounced effects when exposed to higher Mn doping (5% w/w). At 14 mg/L, increased cell debris and rounding were observed over time, indicating cumulative cytotoxicity. For MDA-MB-231, the ANOVA confirmed significant main effects of concentration (p < 0.01) and doping (p < 0.05) but no interaction (p > 0.05), whereas SK-BR-3 displayed a strong interaction (p < 0.01), amplifying cytotoxic outcomes whenever both factors were elevated. The ANOVA results corroborate this finding: MDA-MB-231 displayed strong main effects for concentration and doping (but no significant interaction), while SK-BR-3 exhibited a clear interaction between these factors, producing pronounced cytotoxic outcomes when both doping and concentration were elevated. Nevertheless, at lower concentrations (1.4 mg/L), partial recovery was seen across all nanoparticle systems, suggesting that time-dependent stress can be alleviated by reducing the nanoparticle dose.
Overall, this comparative analysis underscores the critical impact of breast cancer molecular subtypes on nanoparticle sensitivity. Luminal subtypes (MCF-7 and BT-474) showed greater tolerance and even proliferative responses at lower doses, whereas the more aggressive subtypes (MDA-MB-231 and SK-BR-3) were significantly more susceptible to Mn-doped systems, especially at higher concentrations. These time-dependent observations also support the high statistical power (≥ 0.87) reported for most main effects and interactions, indicating robust detection of viability changes under prolonged exposure. These results, supported by both microscopic evidence and ANOVA-based statistical significance, highlight the importance of tailoring nanoparticle-based therapies to specific cancer subtypes and optimizing dosing strategies to balance therapeutic benefits against cytotoxic effects.
3.3. Correlation Between Nanoparticle Properties and Biological Activity
3.3.1. Role of Mn Doping
Mn doping significantly altered the biological activity of the nanoparticles. The incorporation of Mn into the Ag₂S lattice resulted in smaller particle sizes and increased surface charge, as well as unique chemical interactions within the cellular environment. The Raman and FTIR analyses indicated structural modifications and the presence of MnS-related signals, which confirmed the successful incorporation of Mn and its influence on nanoparticle properties.
With 1% Mn doping, the nanoparticles achieved a balance between increased biological activity and decreased cytotoxicity, especially at lower concentrations (1.4 mg/L) where proliferative effects were observed in MCF-7 and BT-474 cells. However, at higher concentrations (14 mg/L), the smaller size and increased reactivity of the 1% Mn-doped nanoparticles led to cytotoxic effects in more sensitive cell lines such as MDA-231 and SK-BR-3. These results suggest that the incorporation of Mn creates a more reactive surface that may promote stronger interactions with cell membranes and intracellular components.
The 5% Mn-doped nanoparticles showed an even higher cytotoxic effect, especially in MDA-231 and SK-BR-3 cells. The higher Mn content may have enhanced oxidative stress mechanisms or disrupted cellular homeostasis more than the lower doping, as evidenced by the severe morphological changes and abundant debris observed in these lines, even at moderate concentrations. Although the 5% Mn formulation showed only limited proliferative effects, its consistently increased cytotoxicity suggests that higher Mn concentrations enhance nanoparticle reactivity to an extent that may impair cell viability in various subtypes.
4. Conclusions
This study investigated the physicochemical properties and biological activity of pure and Mn-doped Ag₂S nanoparticles and emphasized their potential for biomedical applications. The results showed that the composition, size, surface charge and concentration of the nanoparticles significantly affect the cytotoxic effect in different breast cancer subtypes (MCF-7, MDA-MB-231, BT-474 and SK-BR-3).
Bare Ag₂S nanoparticles exhibited minimal cytotoxicity and promoted cell proliferation in luminal subtypes (MCF-7 and BT-474) at lower concentrations. In contrast, Mn doping altered the physicochemical properties and resulted in smaller particles with increased surface charge, leading to increased biological activity but also dose-dependent cytotoxic effects. The Ag₂S:Mn 1% w/w formulation achieved a balance between moderate cytotoxicity and biological activity, especially at lower doses, while the Ag₂S:Mn 5% w/w nanoparticles showed pronounced cytotoxicity, especially at the more aggressive subtypes (MDA-MB-231 and SK-BR-3).
ANOVA analysis (Section 3.2.1.2 and 3.2.2) corroborated these findings, confirming that both the Mn doping level (p < 0.05) and nanoparticle concentration (p < 0.05) significantly affect cell viability, with high statistical power (≥0.87) in most comparisons. Moreover, MCF-7 and SK-BR-3 exhibited significant interactions (p < 0.01) between doping and concentration, whereas MDA-MB-231 and BT-474 showed more pronounced main effects but minimal interaction. This underscores how cell-line-specific molecular features influence the combined impact of nanoparticle composition and dose.
These results underscore the importance of optimizing both the composition and dosage of nanoparticles to achieve effective therapeutic performance while minimizing adverse effects. Future investigations should include non-cancerous cell models and in vivo validation to assess biocompatibility further and harness the diagnostic potential of Mn-doped Ag₂S nanoparticles for biomedical applications, given their distinct physicochemical and cytotoxic profiles across different breast cancer subtypes.
Author Contributions
Conceptualization, I.O. and A.J.; methodology, I.O., J.A. and A.J.; validation, R.A., L.S., V.P. and J.C.; formal analysis, I.O. D.G. and J.A.; investigation, I.O., D.G. and A.J.; resources, J.C., V.P., R.A. and L.S.; data curation, I.O. and D.G.; writing—original draft preparation, I.O. and A.J.; writing—review and editing, I.O., D.G., V.P., J.C., R.A., L.S., J.A. and A.J.; visualization, I.O. and D.G. ; supervision, A.J. ; project administration, J.A. and A.J.; funding acquisition, I.O. and A.J. All authors have read and agreed to the published version of the manuscript.
Funding
The funding for this research was specifically provided by the Secretaría de Investigación, Innovación y Posgrado of the Universidad Autónoma de Querétaro, covering a partial contribution exclusively for the publication of the scientific article.
Institutional Review Board Statement
The study was conducted in accordance with the Declaration of Helsinki, and approved by the Ethics Committee of Facultad de Ingenieria de la Universidad Autonoma de Queretaro (protocol code XXX and date of approval).
Data Availability Statement
The data presented in this study are available on request from the corresponding author due to privacy.
Acknowledgments
The authors wish to express their gratitude to the Dirección de Investigación, Innovación y Posgrado of the Universidad Autónoma de Querétaro for partially funding the publication of this article. We also extend our thanks to Dr. Alejandro Zentella Dehesa from Laboratory 2, Unit of Biochemistry at the Instituto Nacional de Ciencias Médicas y Nutrición “Salvador Zubirán” (INCMNSZ) for generously providing the research facilities and the breast cancer cell lines used in this study, and to Dr. José Luis Ventura for his invaluable support in conducting the in vitro experiments at INCMNSZ.
Conflicts of Interest
The authors declare that the research was conducted in the absence of any commercial or financial relationships that could be construed as a potential conflict of interest.
References
- Ahmed, A., Al Hindawi, A. M.,; Shiltagh, N. M. Role of manganese ion in tuning the structural and optical properties of silver sulfide nanostructures. Chemical Review and Letters 2024, 7, 622–629. [Google Scholar] [CrossRef]
- Al-thoubaity, F. K. (2020). Molecular classification of breast cancer: A retrospective cohort study. Annals of Medicine and Surgery, 49, 44. [CrossRef]
- Arrieta-Sandoval, N., Estrada Rojas, P., Olivas-Armendáriz, I., Valencia Gómez, L. E., Hernández Paz, J. F., Monarrez Cordero, B. E., & Rodríguez González, C. A. (n.d.). Effect of Ag 2 S-BSA nanoparticle size on 3T3 fibroblast cell line cytotoxicity. [CrossRef]
- Chen, H., Li, B., Zhang, M., Sun, K., Wang, Y., Peng, K., Ao, M., Guo, Y., & Gu, Y. (2014). Characterization of tumor-targeting Ag2S quantum dots for cancer imaging and therapy in vivo. Undefined, 6(21), 12580–12590. [CrossRef]
- Gao, J. J., & Swain, S. M. (2018). Luminal A Breast Cancer and Molecular Assays: A Review. The Oncologist, 23(5), 556. [CrossRef]
- He, X., Gao, J., Gambhir, S. S., & Cheng, Z. (2010). Near-infrared fluorescent nanoprobes for cancer molecular imaging: status and challenges. Trends in Molecular Medicine, 16(12), 574–583. [CrossRef]
- Ismail, R. A. , R. H. A. , & A. D. S. (2020). High-responsivity hybrid α-Ag2S/Si photodetector prepared by pulsed laser ablation in liquid. Beilstein Journal of Nanotechnology, 11, 1596–1607.
- Jeong, S., Doh, H., & Kim, S. (2020). Colloidal Second Near-Infrared-Emitting Mn-Doped Ag2S Quantum Dots. ChemNanoMat, 6(4), 538–541. [CrossRef]
- Kang, L., Zhang, M., Liu, Z.-H., & Ooi, K. (2007). IR spectra of manganese oxides with either layered or tunnel structures. Spectrochimica Acta Part A: Molecular and Biomolecular Spectroscopy, 67(3), 864–869. [CrossRef]
- Kim, J., Kim, J., Seo, K. H., Lee, K.-H., Park, Y. H., Lin, C.-H., Lu, Y.-S., Ueno, T., Yap, Y.-S., Wong, F.-Y., Tan, V. K. M., Lim, G.-H., Tan, S.-M., Yeo, W., Liu, Q., Leung, R., Naito, Y., Li, H., Lee, H.-B., … Im, S.-A. (2024). Survival outcomes of young-age female patients with early breast cancer: an international multicenter cohort study. ESMO Open, 9(11), 103732. [CrossRef]
- Levard, C., Hotze, E. M., Colman, B. P., Dale, A. L., Truong, L., Yang, # X Y, Bone, A. J., Gordon, ∥, Brown, E., Tanguay, R. L., Di Giulio, R. T., Bernhardt, E. S., Meyer, J. N., Wiesner, M. R., & Lowry, G. V. (2013). Sulfidation of Silver Nanoparticles: Natural Antidote to Their Toxicity. [CrossRef]
- Niell, B. L., Jochelson, M. S., Amir, T., Brown, A., Adamson, M., Baron, P., Bennett, D. L., Chetlen, A., Dayaratna, S., Freer, P. E., Ivansco, L. K., Klein, K. A., Malak, S. F., Mehta, T. S., Moy, L., Neal, C. H., Newell, M. S., Richman, I. B., Schonberg, M., … Slanetz, P. J. (2024). ACR Appropriateness Criteria® Female Breast Cancer Screening: 2023 Update. Journal of the American College of Radiology, 21(6, Supplement), S126–S143. [CrossRef]
- Opršal, J., Knotek, P., Zickler, G. A., Sigg, L., Schirmer, K., Pouzar, M., & Geppert, M. (2021). Cytotoxicity, Accumulation and Translocation of Silver and Silver Sulfide Nanoparticles in contact with Rainbow Trout Intestinal Cells. Aquatic Toxicology, 237, 105869. [CrossRef]
- Purushothaman, B., & Song, J. M. (2021). Ag2S quantum dot theragnostics. Biomaterials Science, 9(1), 51–69. [CrossRef]
- SalmanOgli, A. (2011). Nanobio applications of quantum dots in cancer: Imaging, sensing, and targeting. In Cancer Nanotechnology (Vol. 2, Issues 1–6, pp. 1–19). BioMed Central. [CrossRef]
- Singh, A., Iyer, A. K., Amiji, M., & Ganta, S. (2013). Multifunctional nanosystems for cancer therapy. Biomaterials for Cancer Therapeutics: Diagnosis, Prevention and Therapy, 387–413. [CrossRef]
- Valenza, C., Trapani, D., Zagami, P., Antonarelli, G., Boscolo Bielo, L., Nicolò, E., Ribeiro, J. M., Guidi, L., Reduzzi, C., Spotti, M., Adamoli, L., Cortès, J., Pistilli, B., Tolaney, S. M., Ueno, N., Layman, R. M., Cristofanilli, M., Carey, L. A., Munzone, E., … Curigliano, G. (2024). Immune checkpoint inhibitors for patients with metastatic triple-negative inflammatory breast cancer (INCORPORATE): An international cohort study. European Journal of Cancer, 213, 115097. [CrossRef]
- Vidya Bhargavi, M., Rao Mudunuru, V., & Kalluri, S. (2017). History of Breast Cancer-A Quick Review. Int J Cur Res Rev. [CrossRef]
- Wu, F.-F., Zhou, Y., Wang, J.-X., Zhuo, Y., Yuan, R., & Chai, Y.-Q. (2017). A novel electrochemiluminescence immunosensor based on Mn doped Ag2S quantum dots probe for laminin detection. Sensors and Actuators B: Chemical, 243, 1067–1074. [CrossRef]
- Zhang, X., Liu, M., Liu, H., & Zhang, S. (2014). Low-toxic Ag2S quantum dots for photoelectrochemical detection glucose and cancer cells. Biosensors and Bioelectronics, 56, 307–312. [CrossRef]
Figure 1.
TEM images (A–C) and particle size distribution histograms (D–F) for Ag₂S-based nanoparticles: (A,D) pure Ag₂S, (B,E) Ag₂S:Mn (1% w/w), and (C,F) Ag₂S:Mn (5% w/w).
Figure 1.
TEM images (A–C) and particle size distribution histograms (D–F) for Ag₂S-based nanoparticles: (A,D) pure Ag₂S, (B,E) Ag₂S:Mn (1% w/w), and (C,F) Ag₂S:Mn (5% w/w).
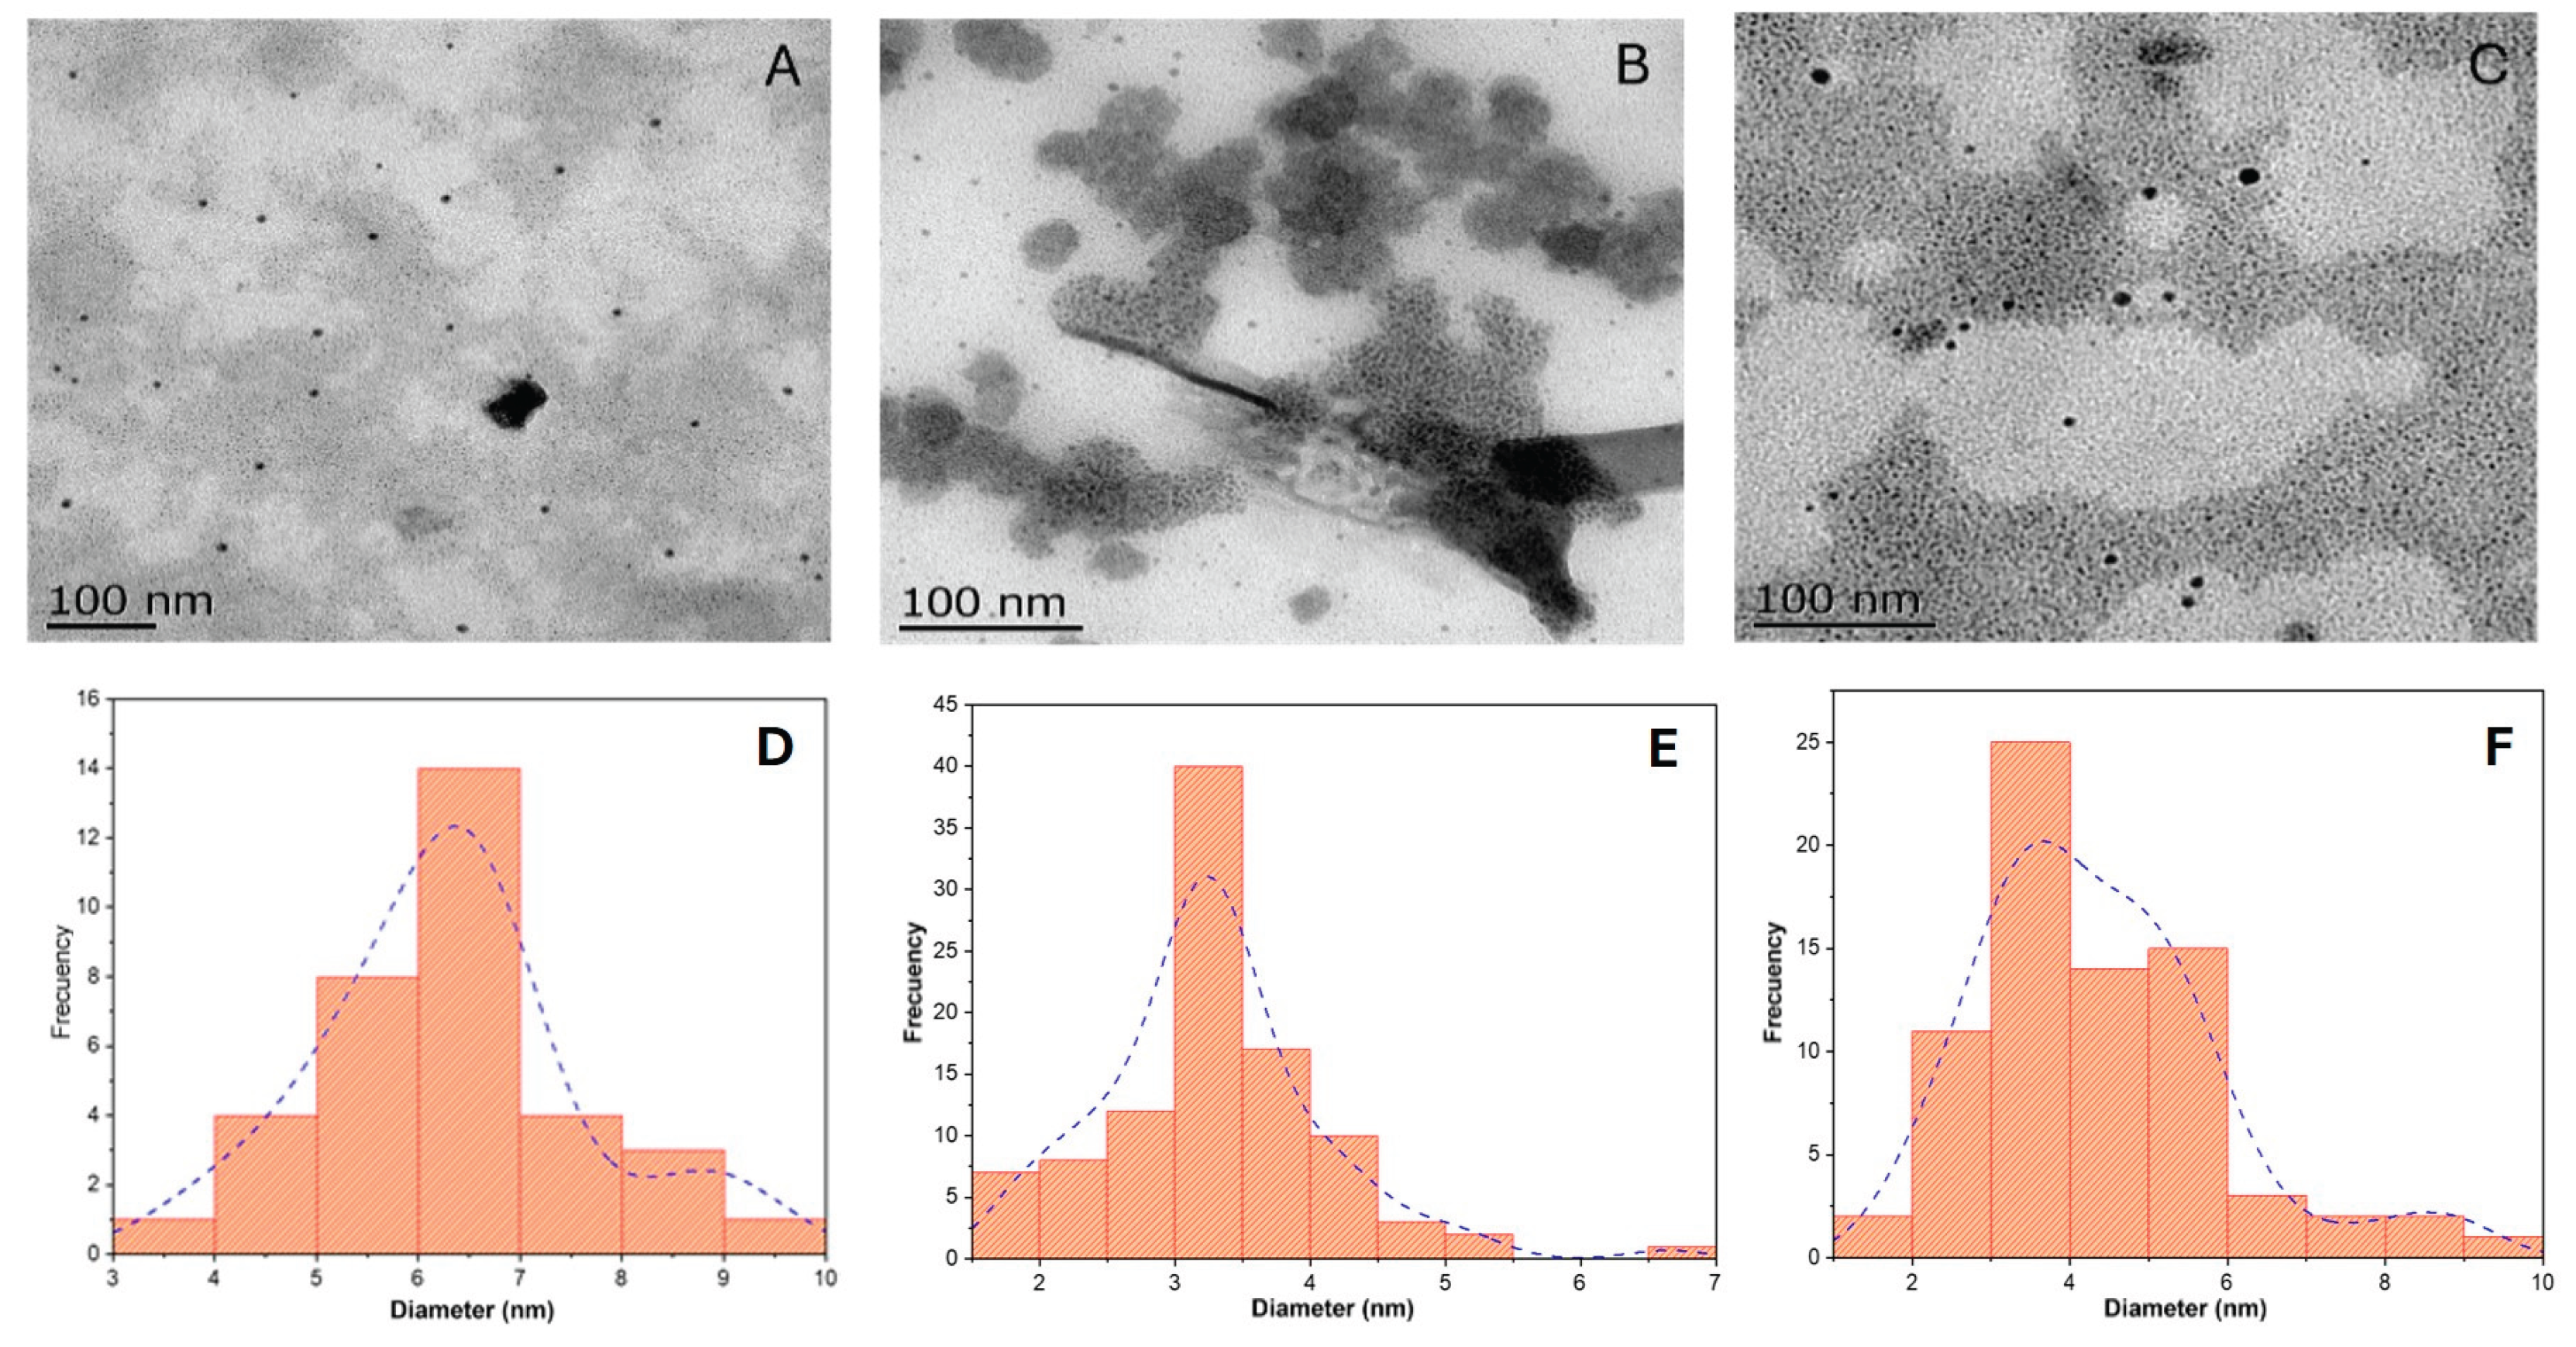
Figure 2.
FTIR spectra of (A) pure Ag₂S, (B) Ag₂S:Mn (1% w/w), and (C) Ag₂S:Mn (5% w/w) nanoparticles measured between 500 and 4000 cm⁻¹.
Figure 2.
FTIR spectra of (A) pure Ag₂S, (B) Ag₂S:Mn (1% w/w), and (C) Ag₂S:Mn (5% w/w) nanoparticles measured between 500 and 4000 cm⁻¹.
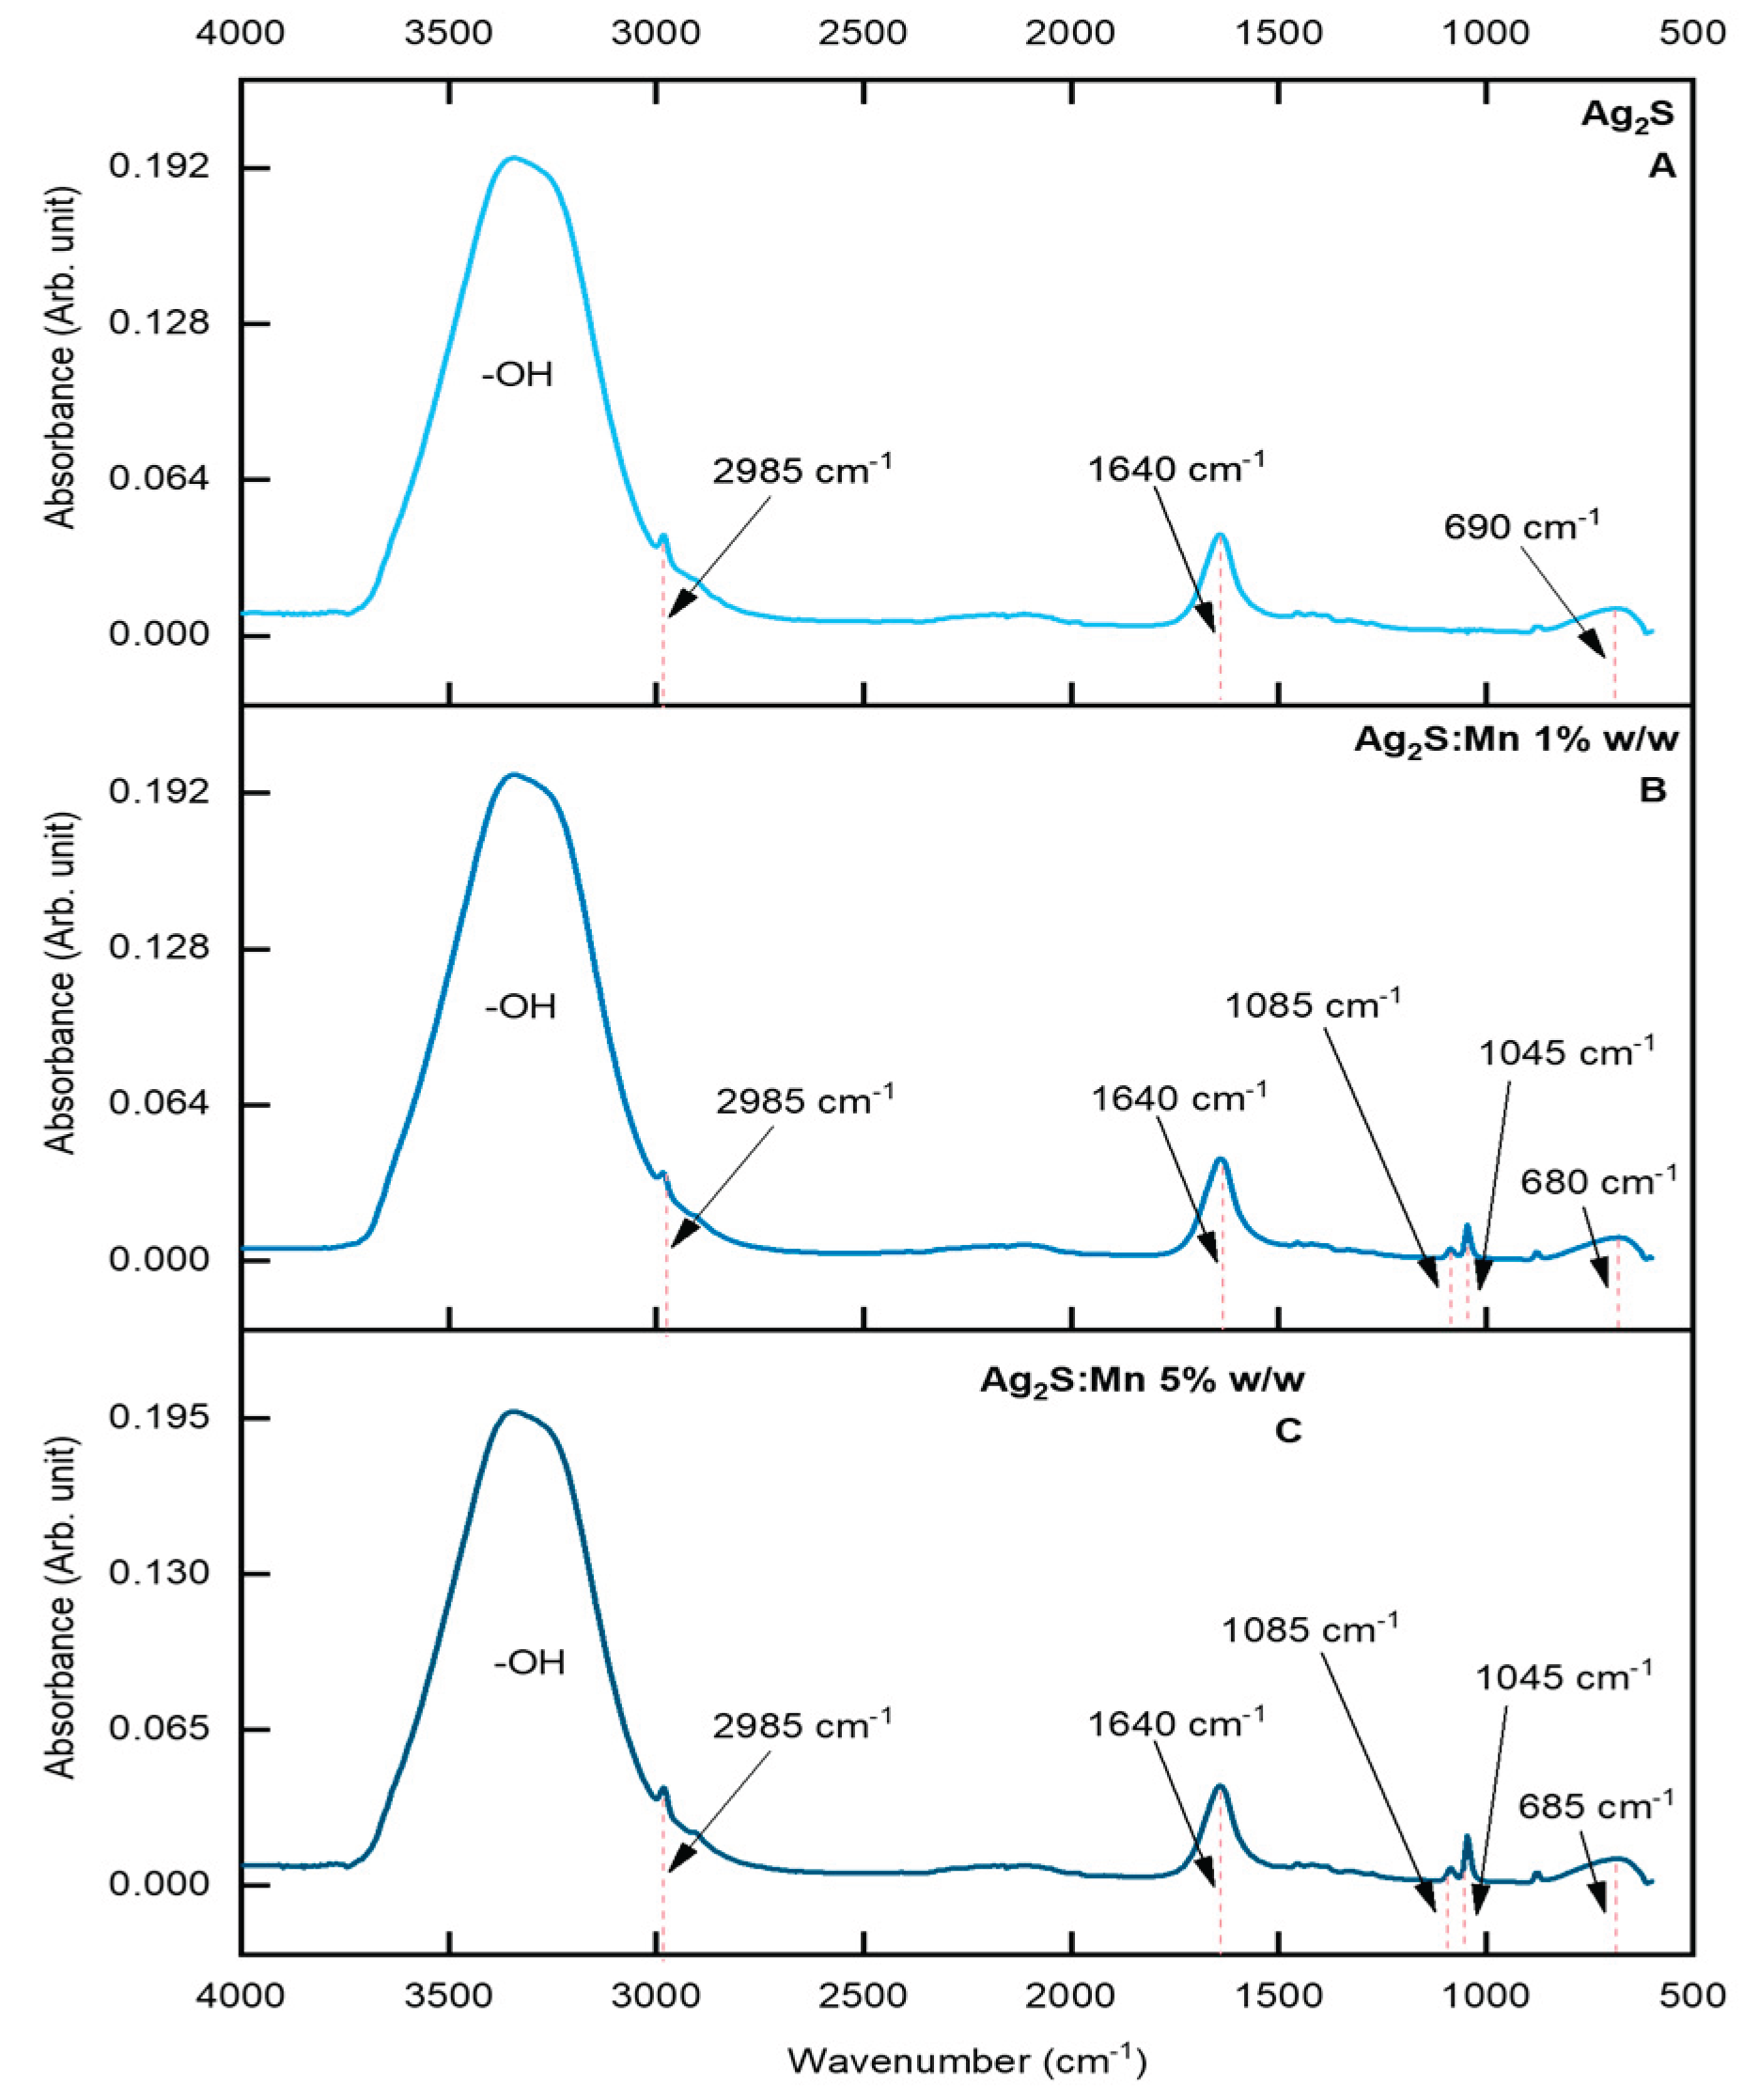
Figure 3.
In Figure 3A, are present the UV-vis spectrum of Ag2S, Ag2S:Mn 1% w/w, and Ag2S:Mn 5% w/w, Figure 3B, are the band gap values obtained by Tauc plot method.
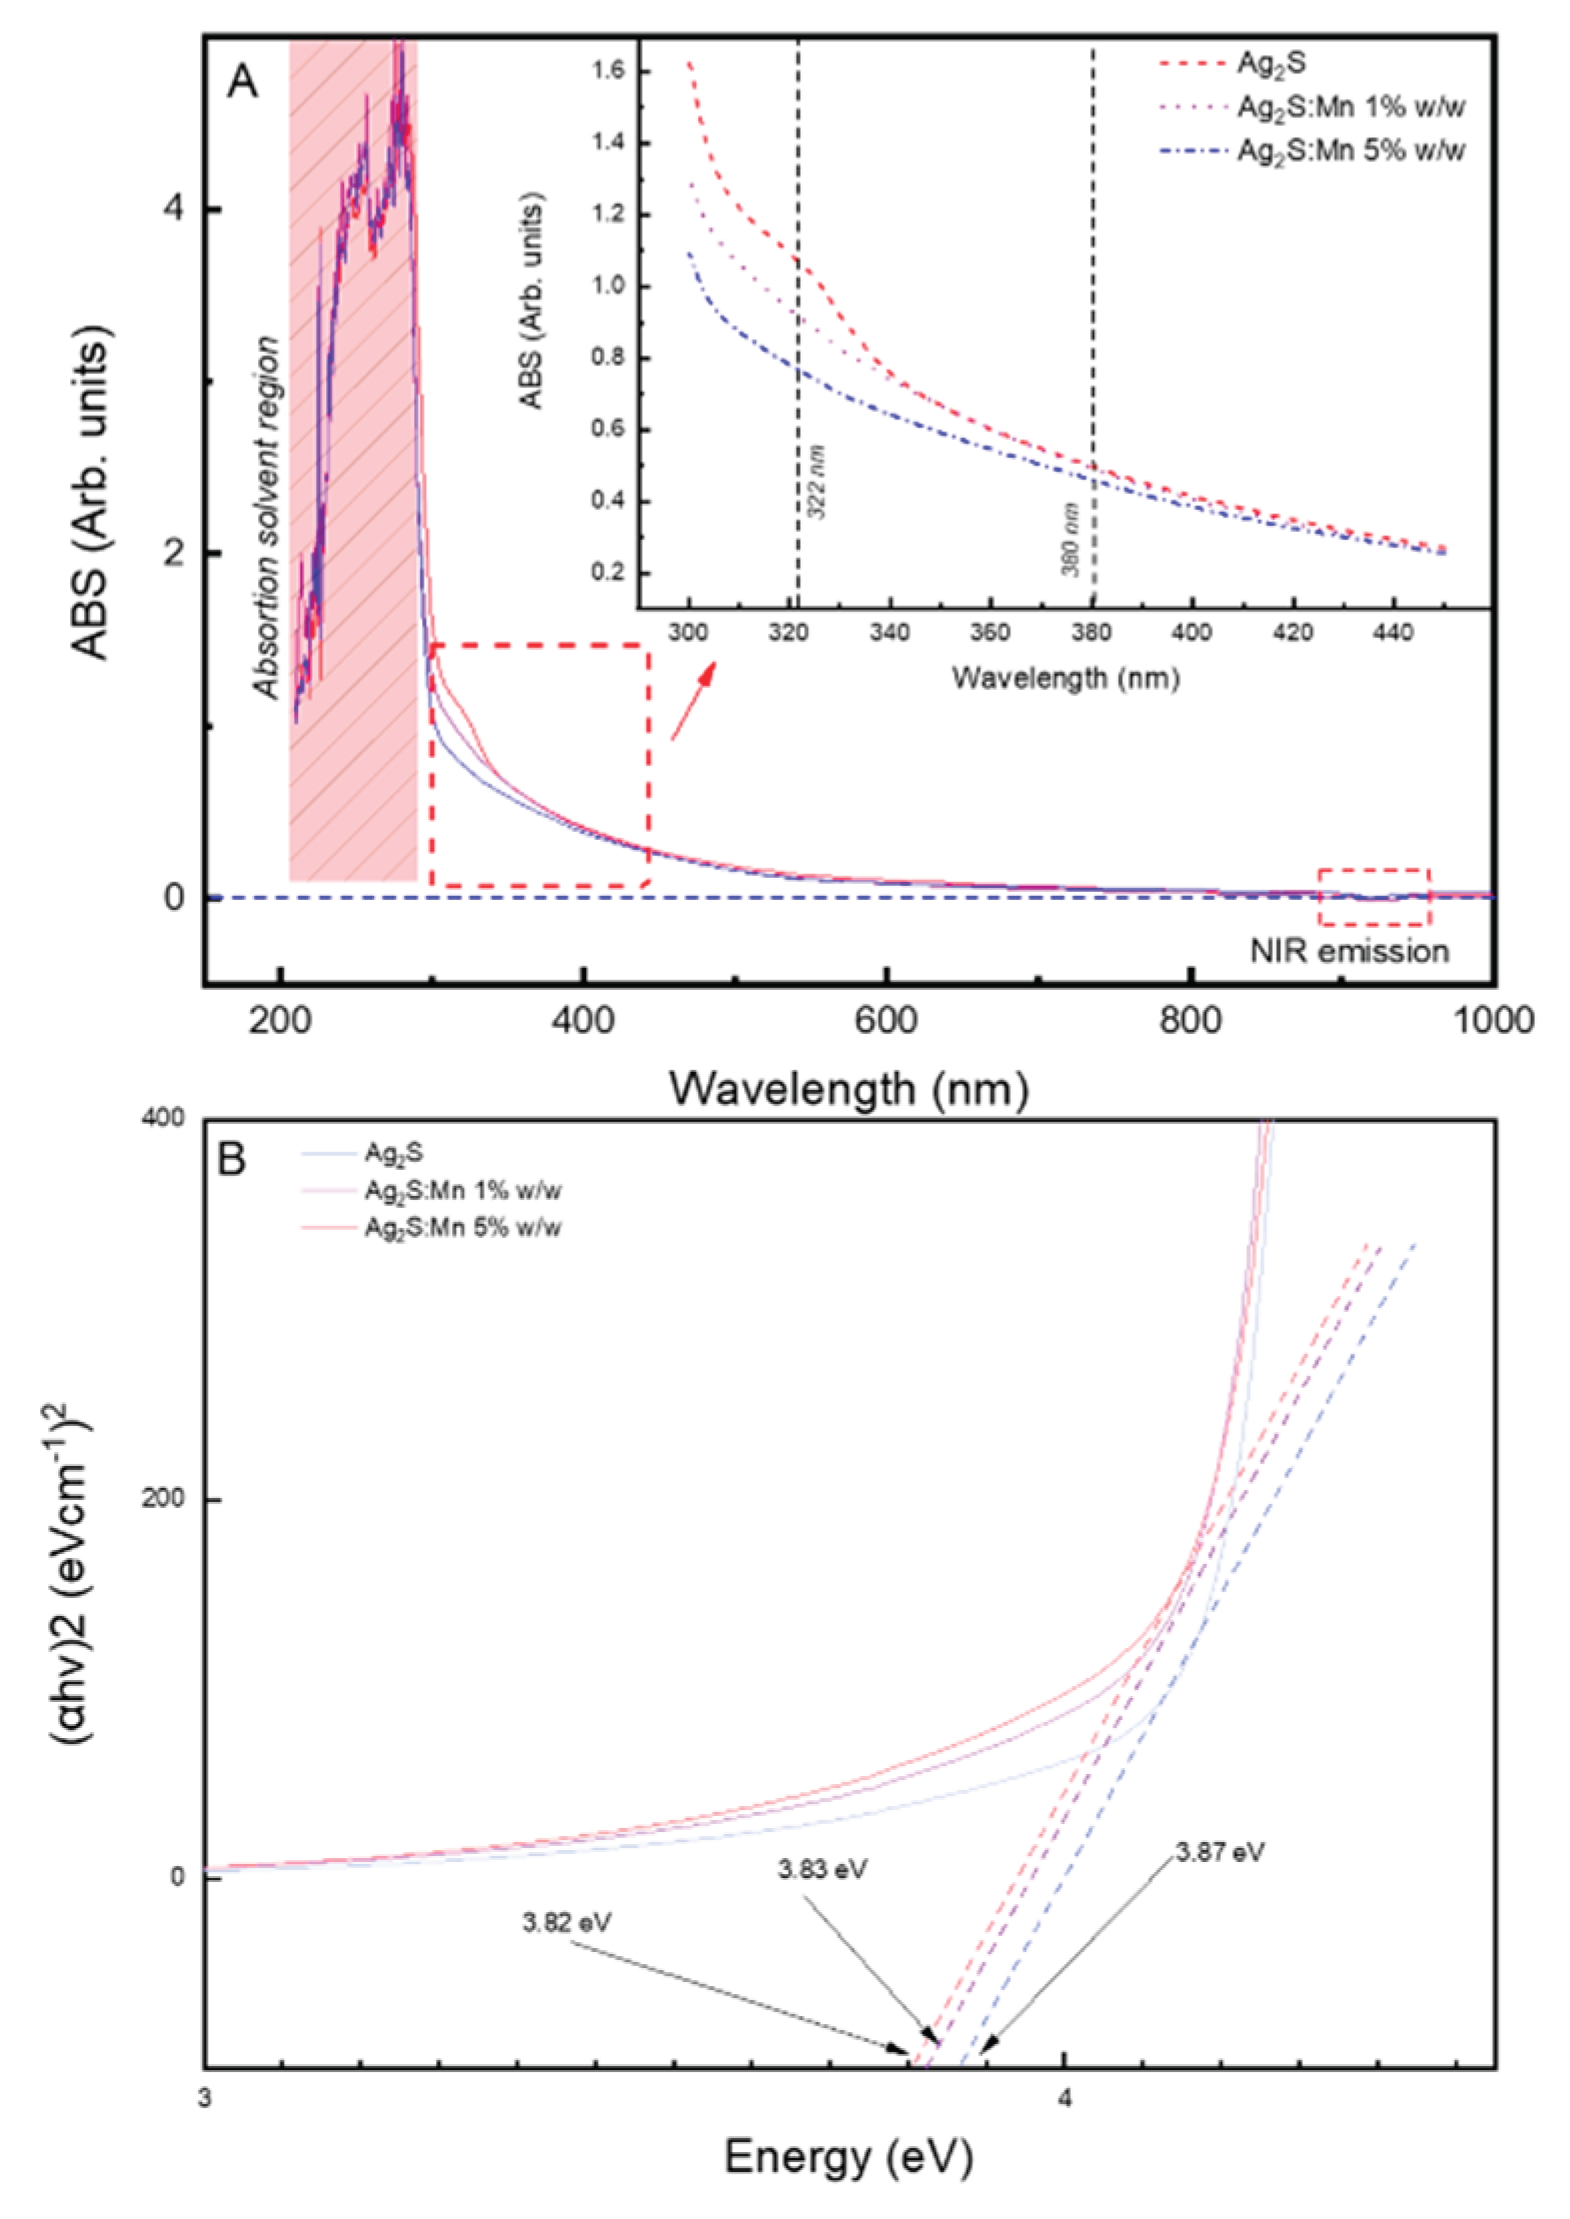
Figure 4.
Cell viability of four breast cancer cell lines (MCF-7, MDA-231, BT-474, and SK-BR-3) treated with Ag₂S and Mn-doped Ag₂S nanoparticles at concentrations of 1.4 mg/L, 7 mg/L, and 14 mg/L after 72 hours of exposure.
Figure 4.
Cell viability of four breast cancer cell lines (MCF-7, MDA-231, BT-474, and SK-BR-3) treated with Ag₂S and Mn-doped Ag₂S nanoparticles at concentrations of 1.4 mg/L, 7 mg/L, and 14 mg/L after 72 hours of exposure.
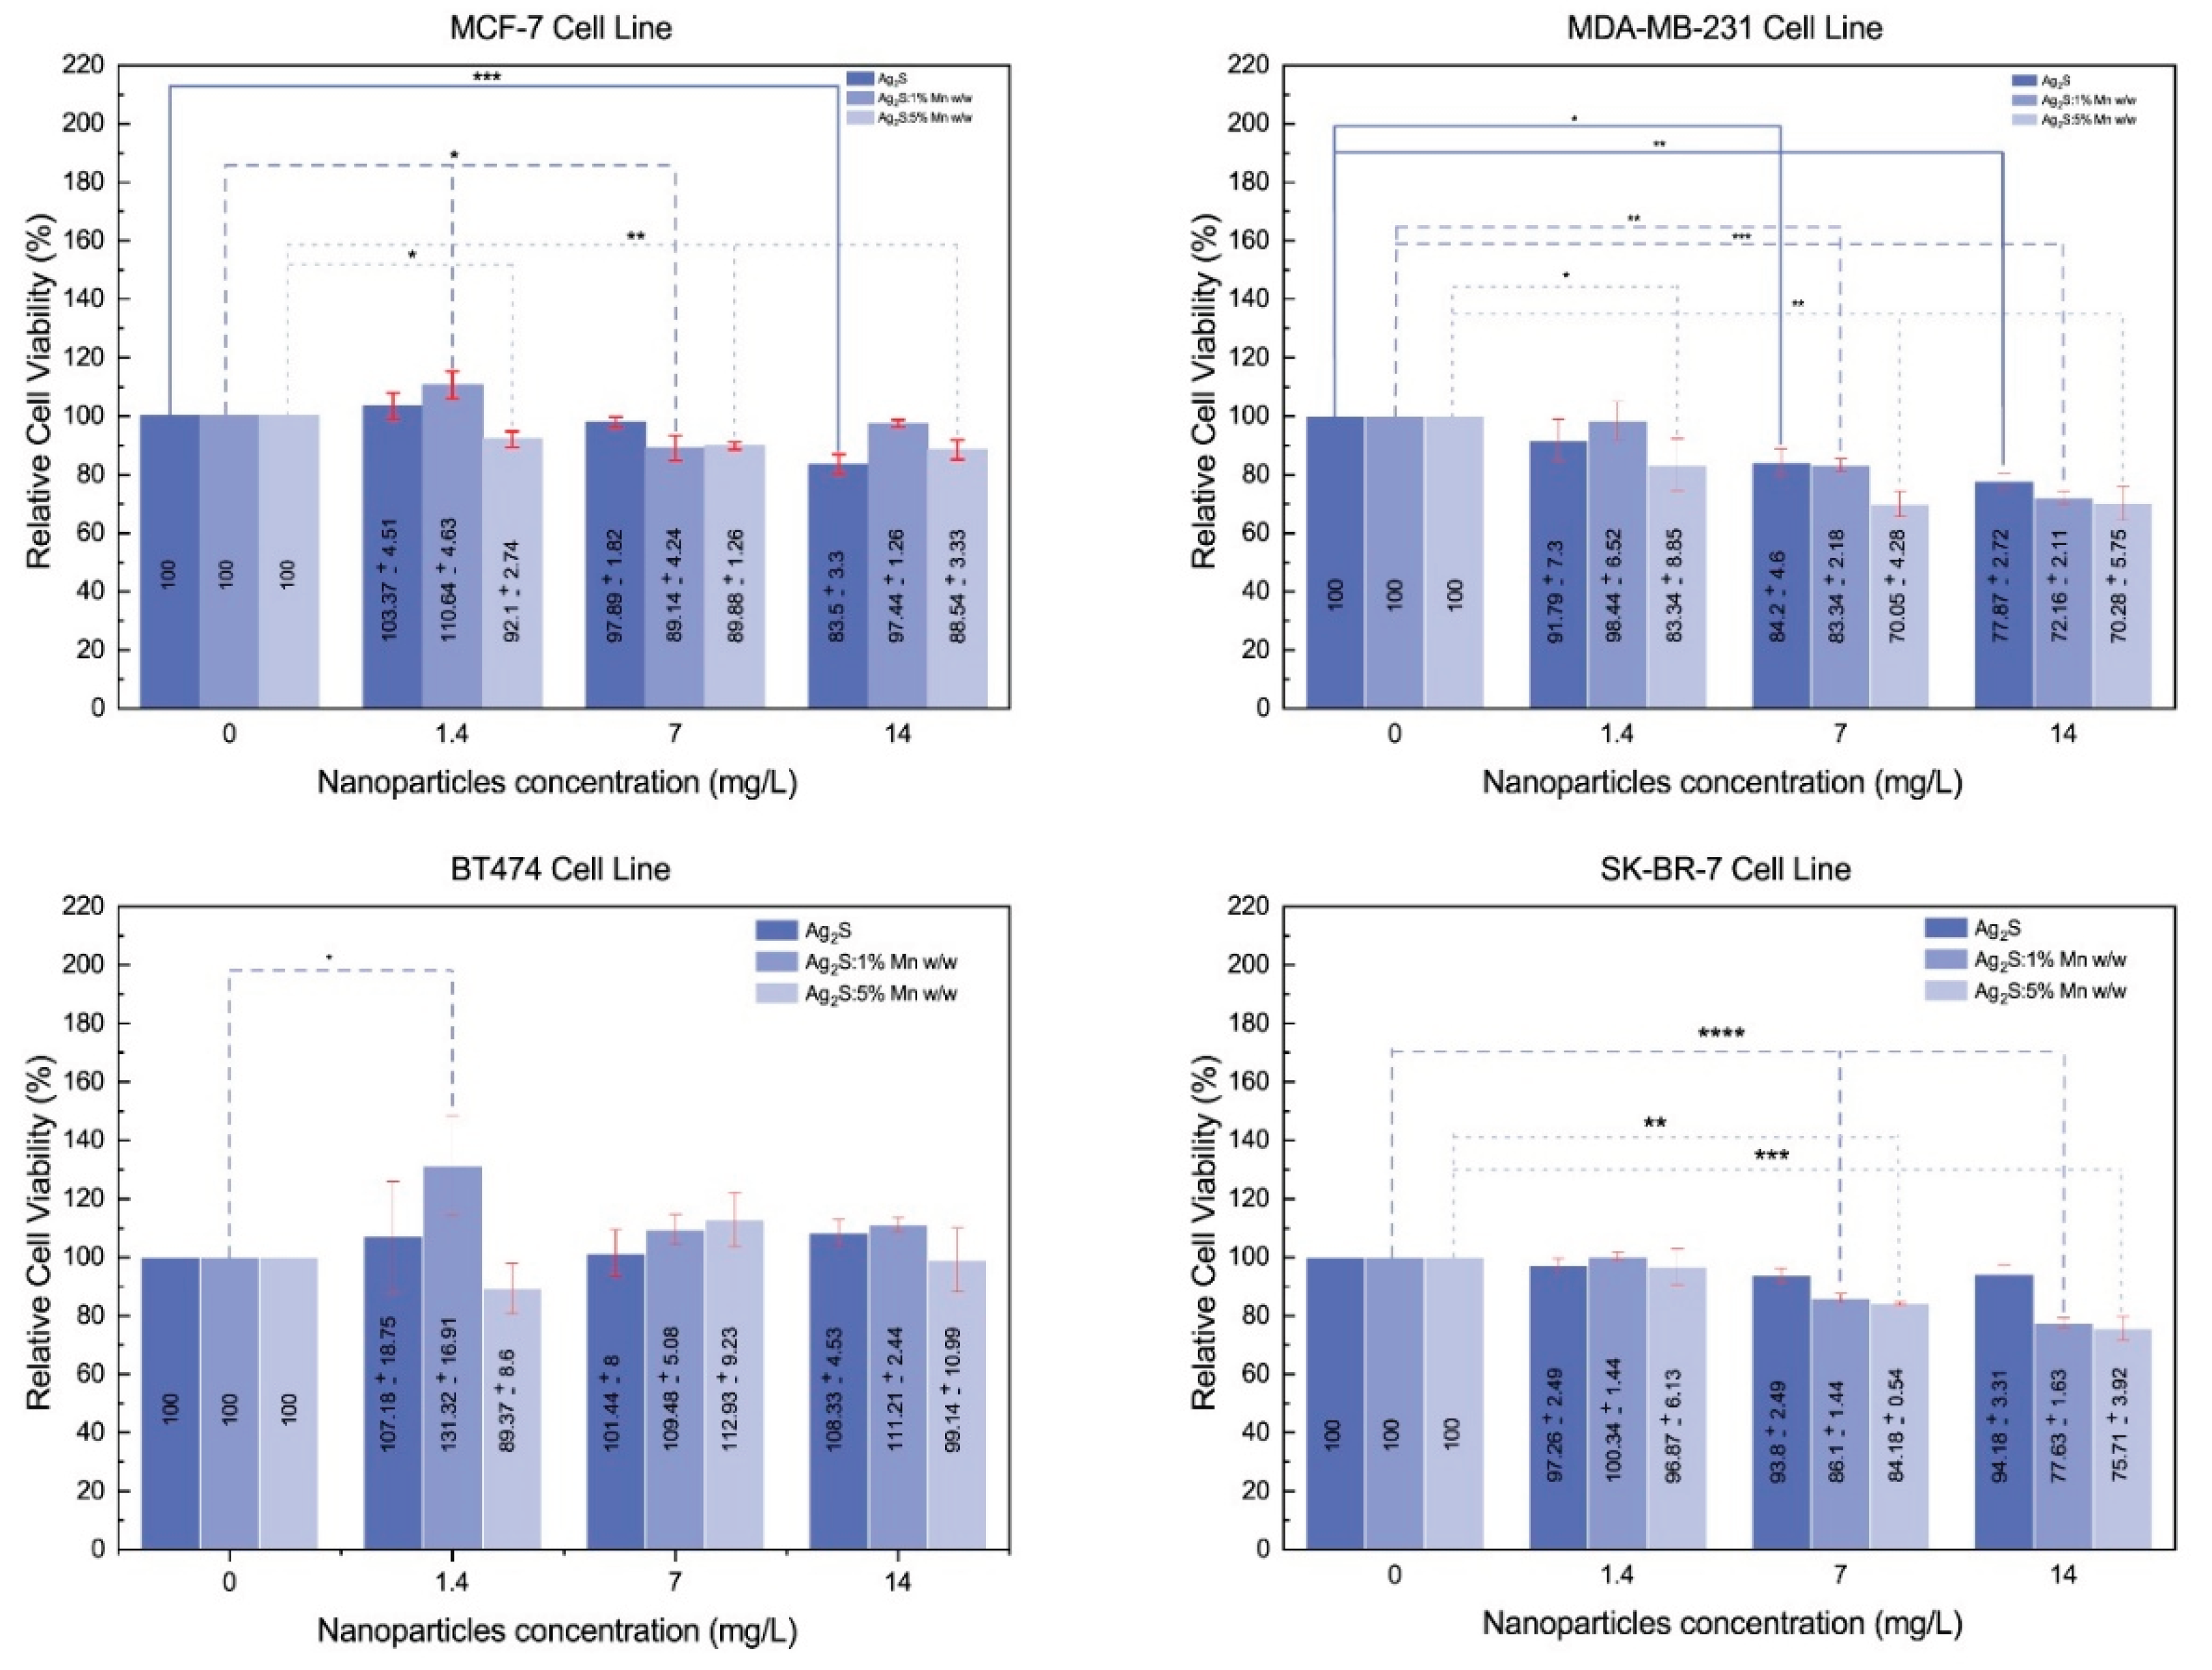
Figure 5.
Representative microscopy images of MCF-7 breast cancer cells treated with Ag₂S and Mn-doped Ag₂S nanoparticles at concentrations of 1.4 mg/L, 7 mg/L, and 14 mg/L after 72 hours of exposure.
Figure 5.
Representative microscopy images of MCF-7 breast cancer cells treated with Ag₂S and Mn-doped Ag₂S nanoparticles at concentrations of 1.4 mg/L, 7 mg/L, and 14 mg/L after 72 hours of exposure.
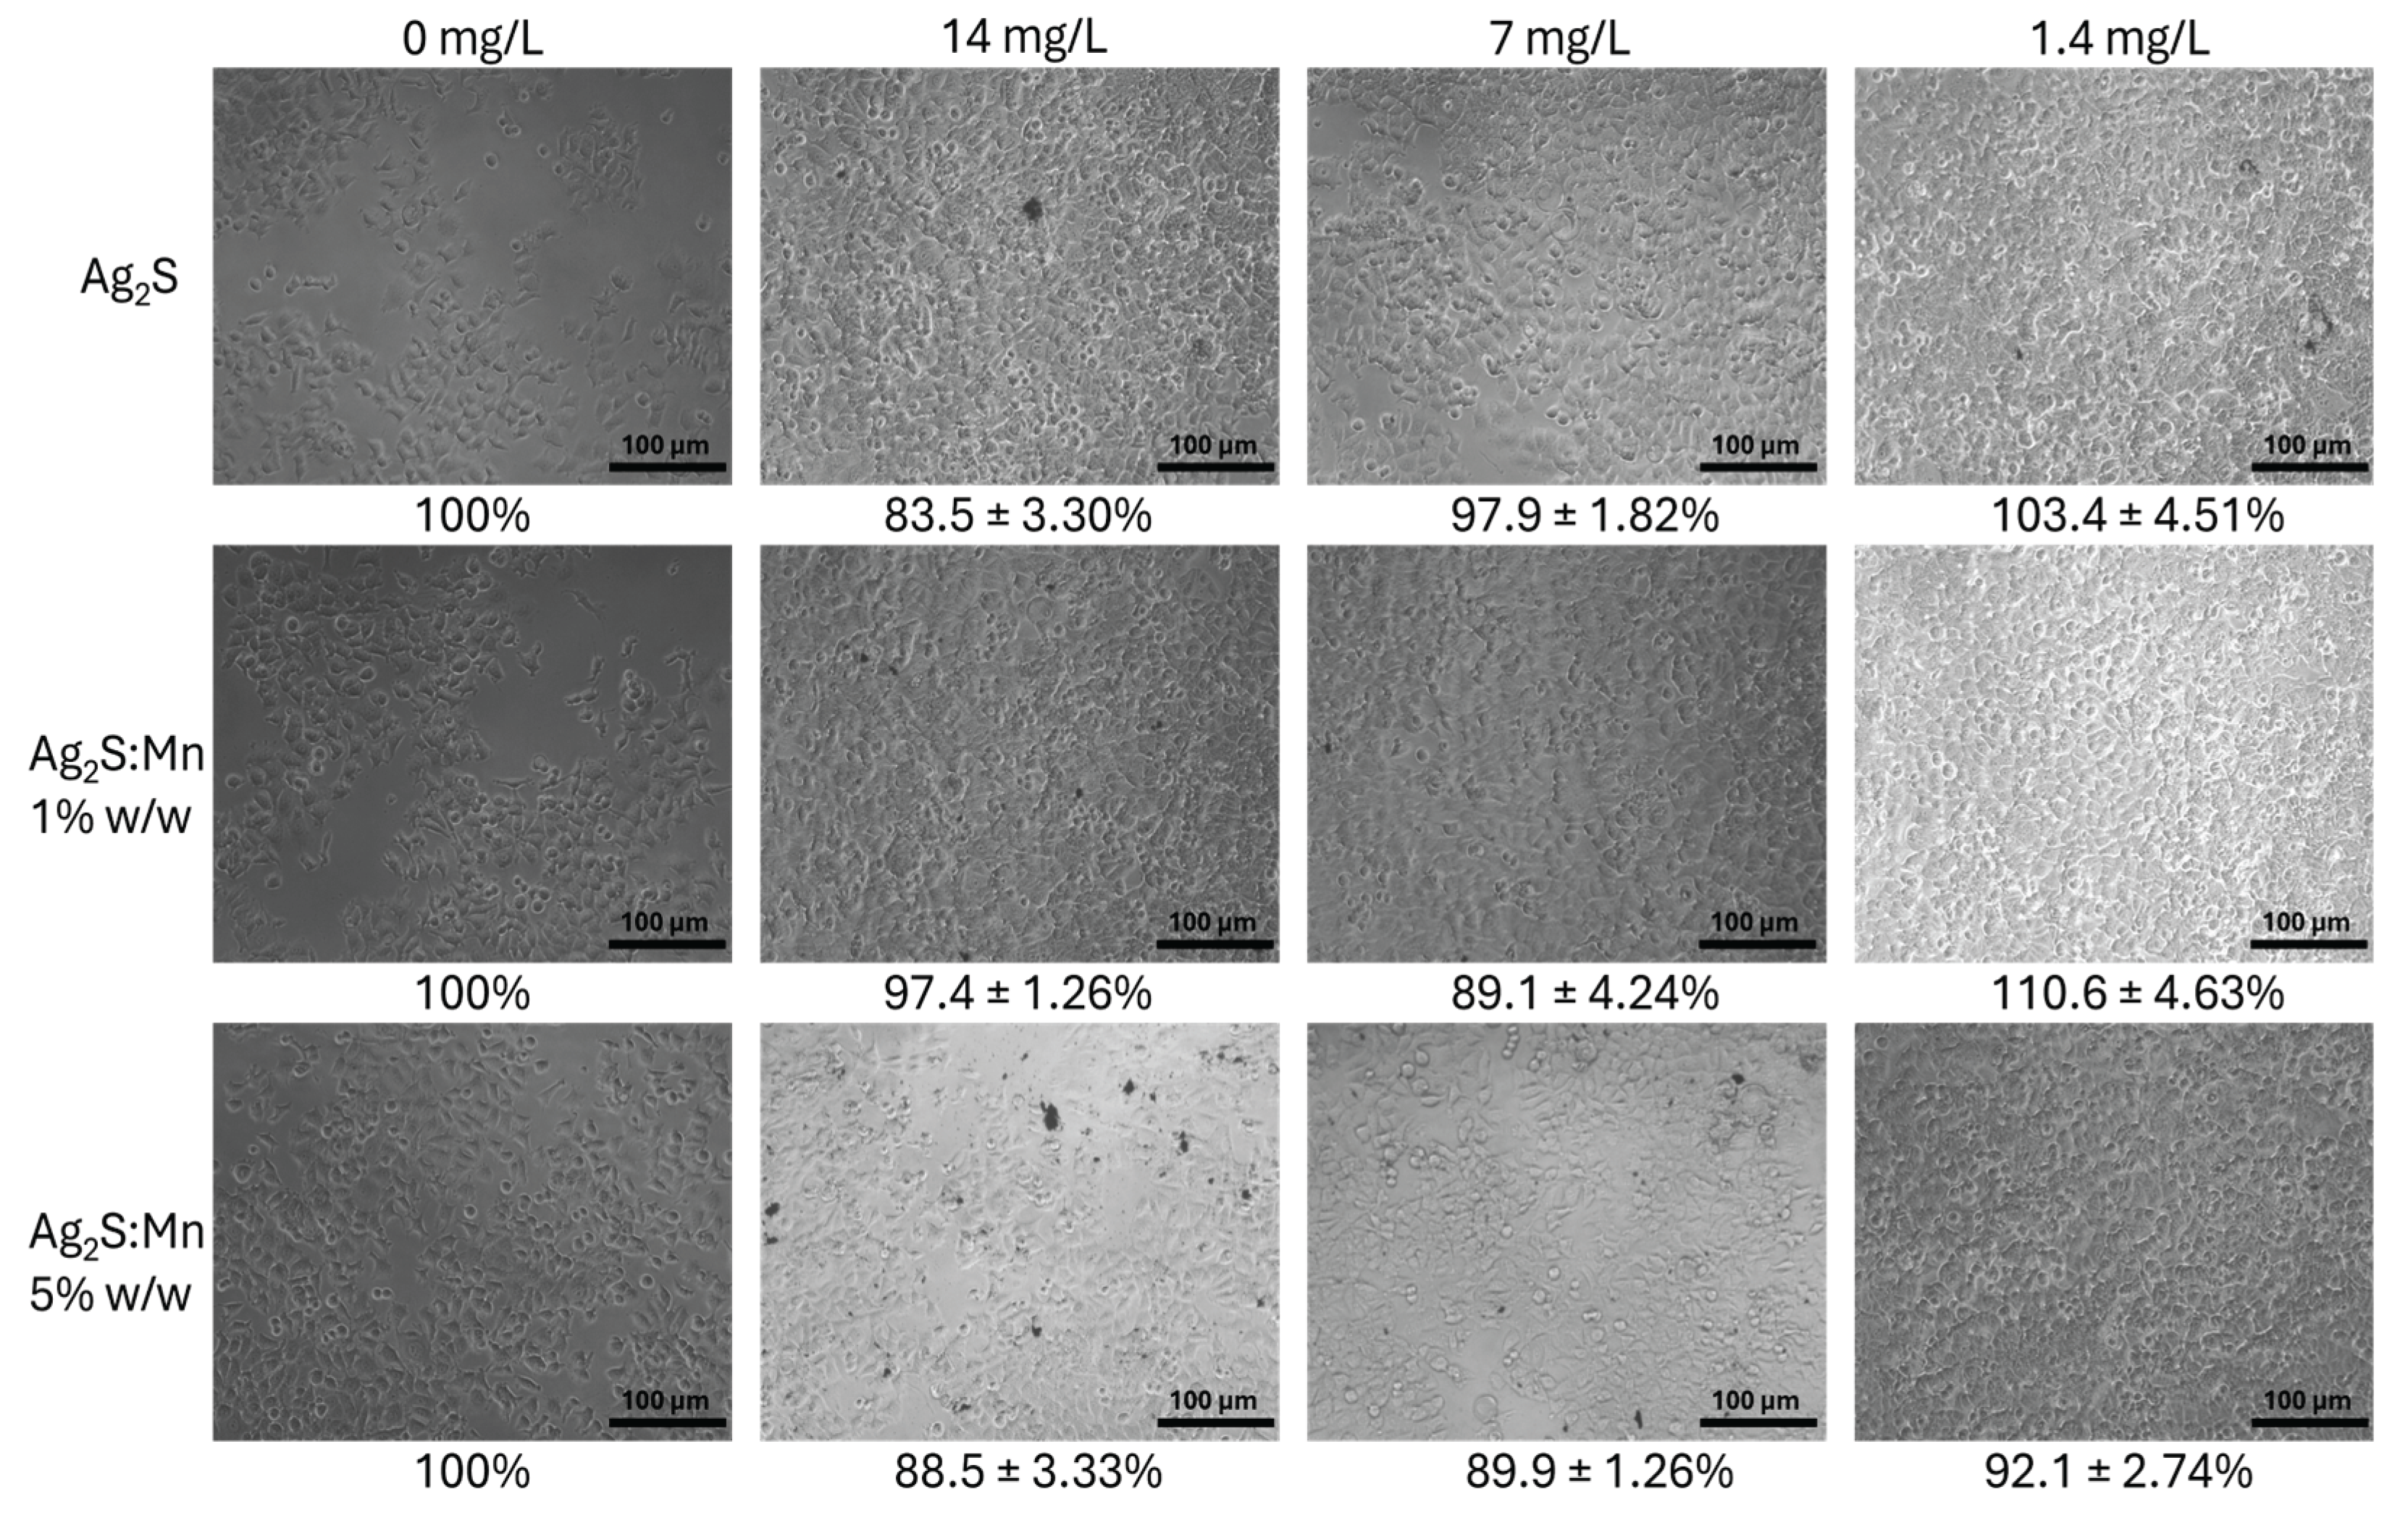
Figure 6.
Representative microscopy images of MDA-231 triple-negative breast cancer cells treated with Ag₂S and Mn-doped Ag₂S nanoparticles at concentrations of 1.4 mg/L, 7 mg/L, and 14 mg/L after 72 hours of exposure.
Figure 6.
Representative microscopy images of MDA-231 triple-negative breast cancer cells treated with Ag₂S and Mn-doped Ag₂S nanoparticles at concentrations of 1.4 mg/L, 7 mg/L, and 14 mg/L after 72 hours of exposure.
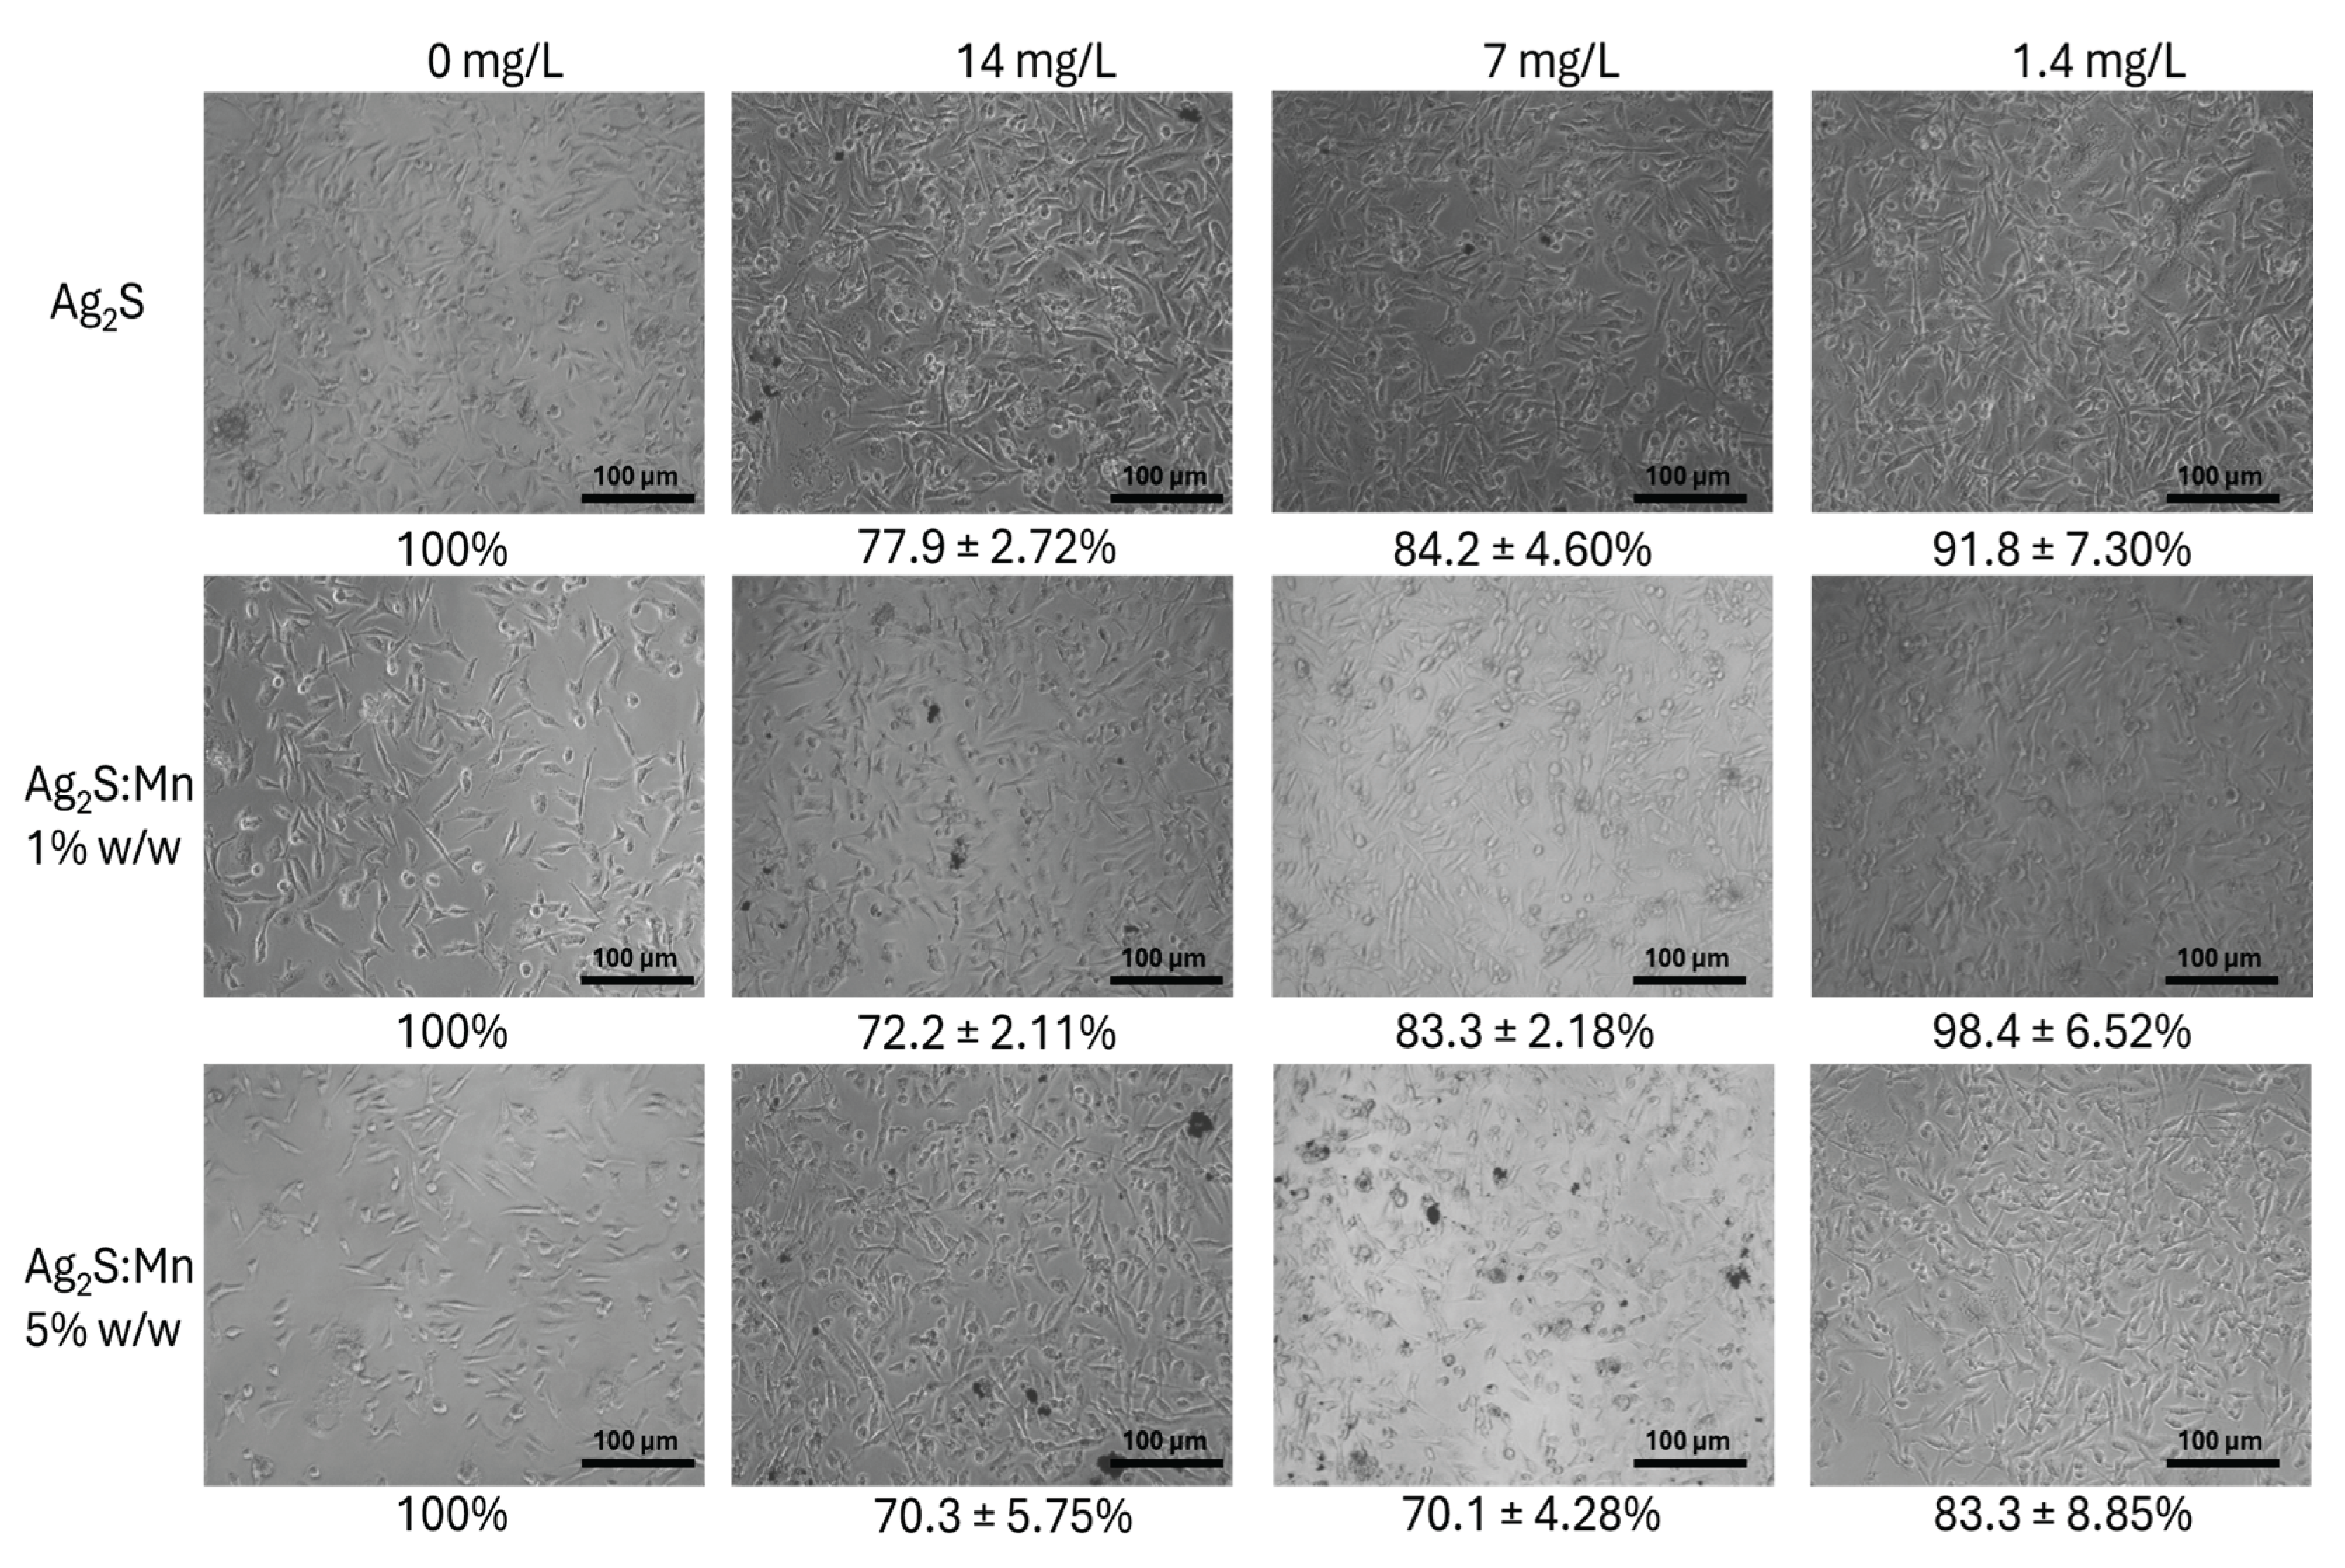
Figure 7.
Representative microscopy images of BT-474 breast cancer cells treated with Ag₂S and Mn-doped Ag₂S nanoparticles at concentrations of 1.4 mg/L, 7 mg/L, and 14 mg/L after 72 hours of exposure.
Figure 7.
Representative microscopy images of BT-474 breast cancer cells treated with Ag₂S and Mn-doped Ag₂S nanoparticles at concentrations of 1.4 mg/L, 7 mg/L, and 14 mg/L after 72 hours of exposure.
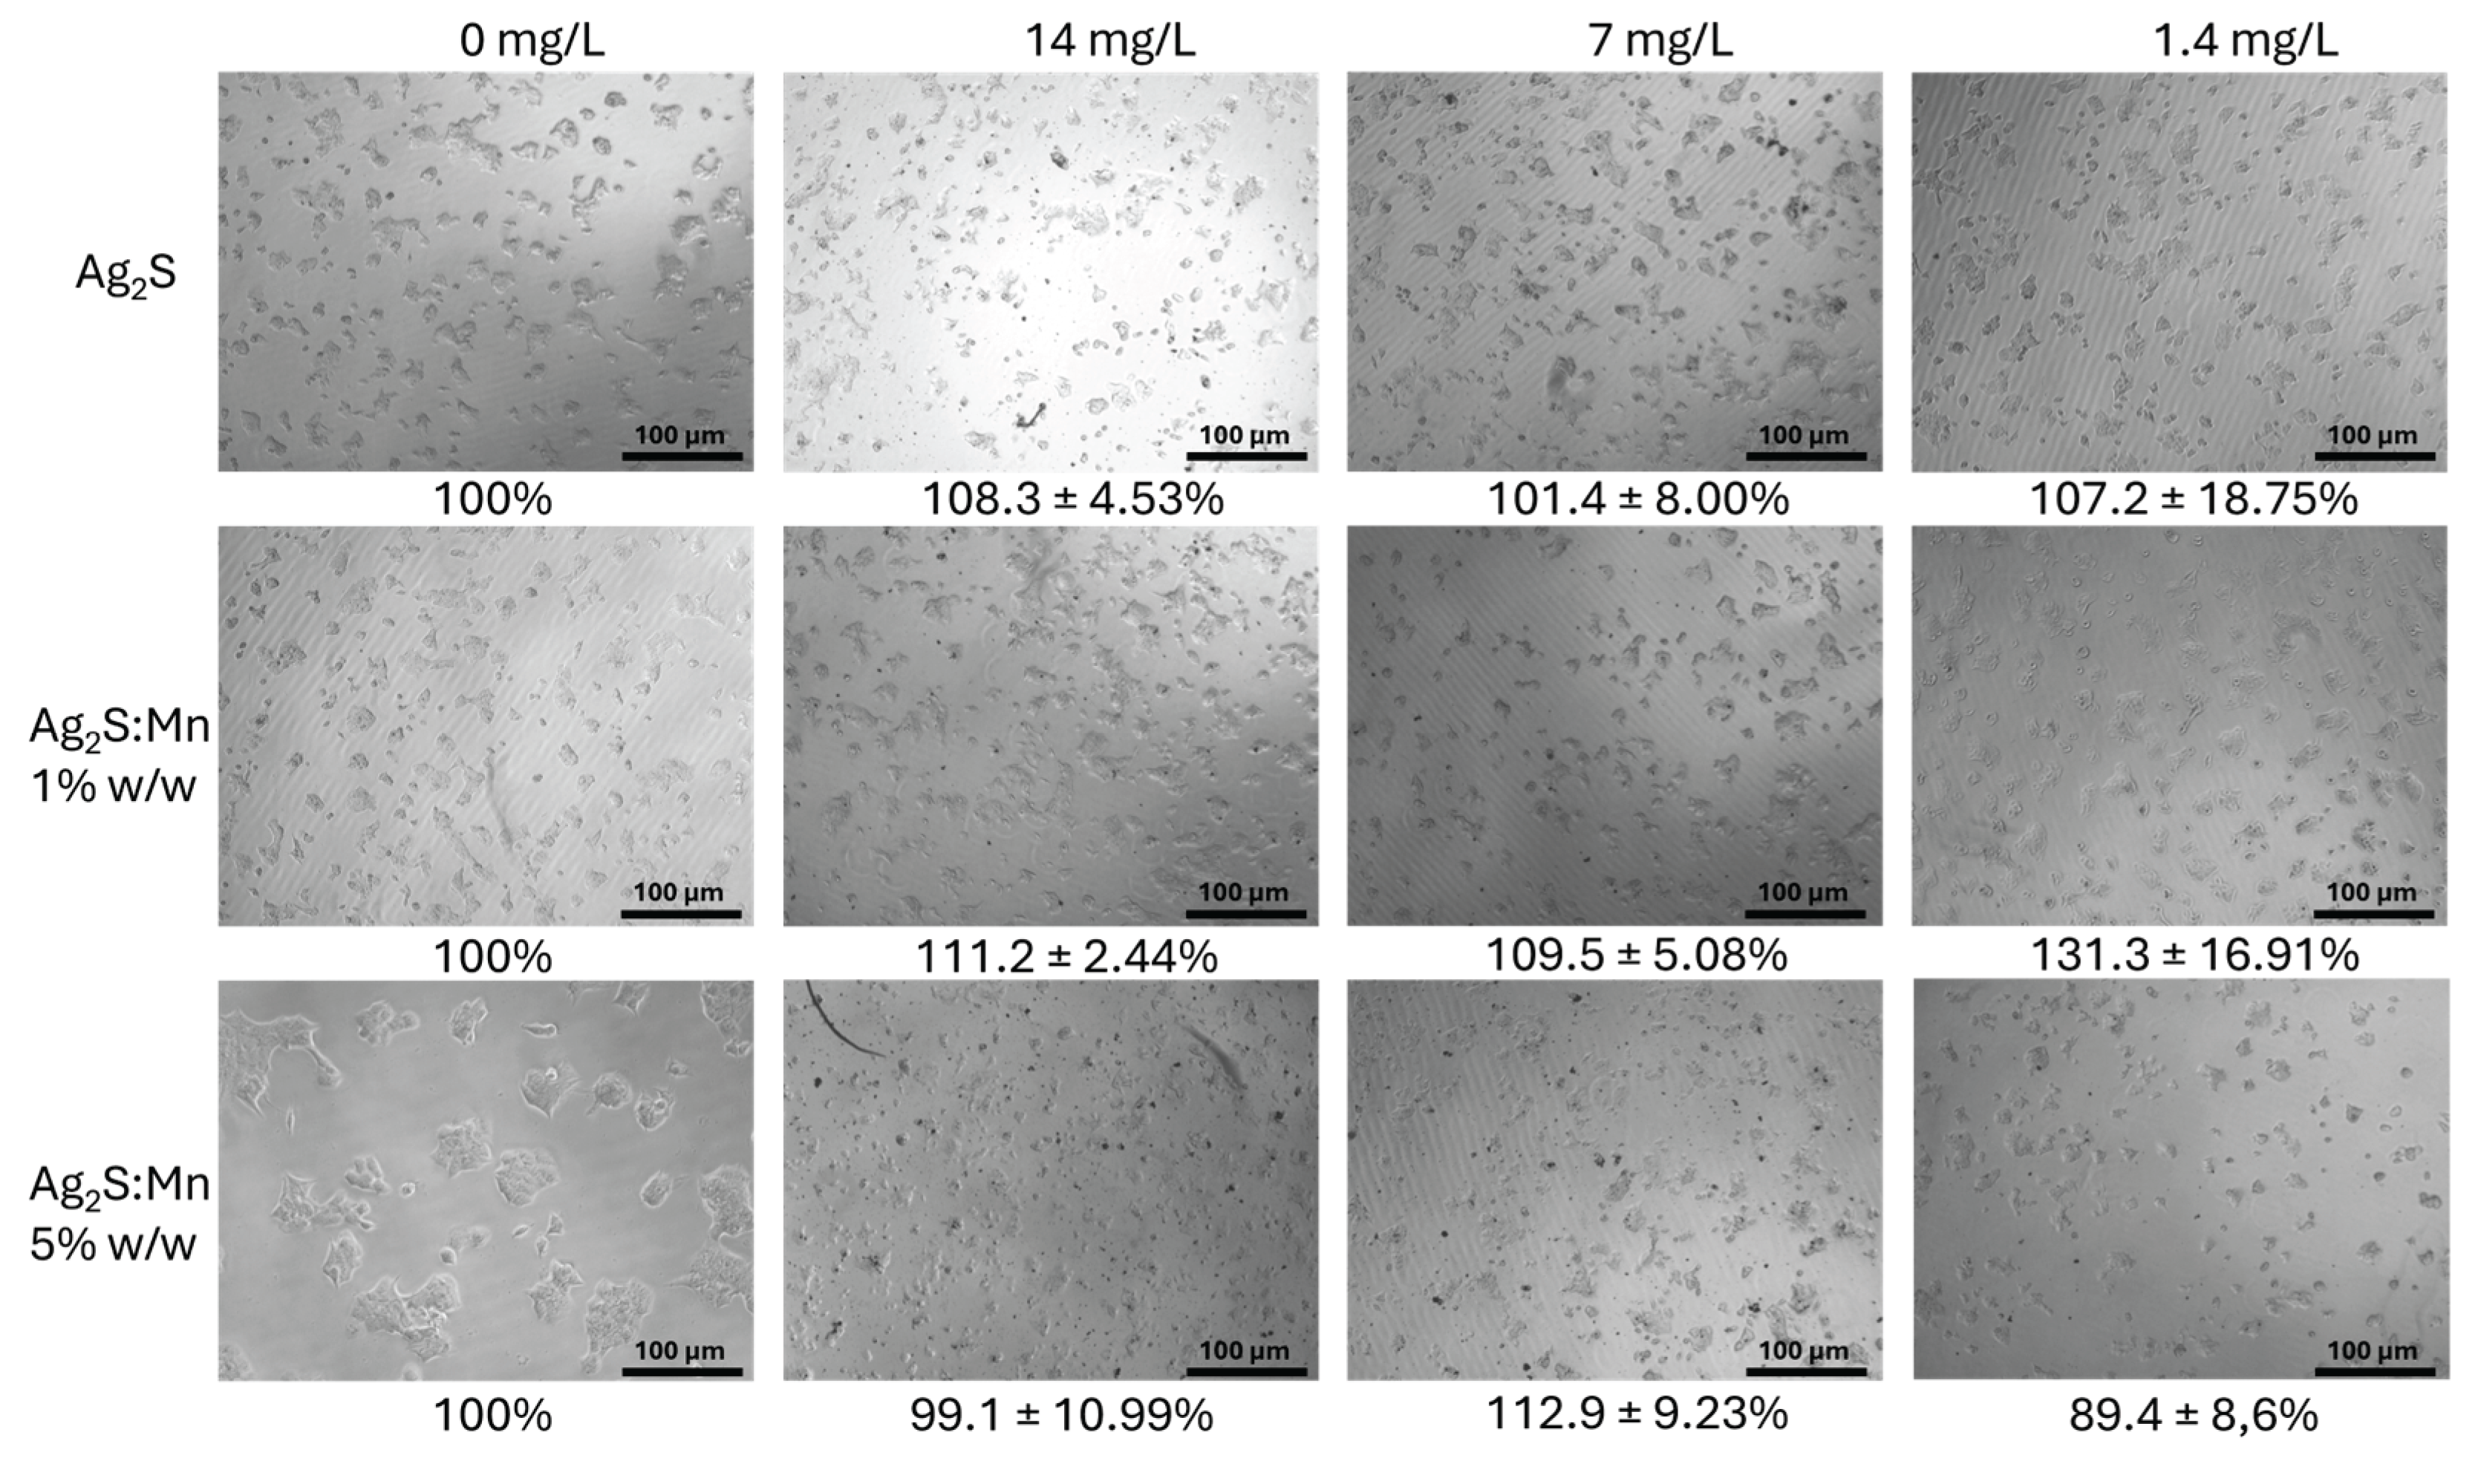
Figure 8.
Representative microscopy images of SK-BR-3 breast cancer cells treated with Ag₂S and Mn-doped Ag₂S nanoparticles at concentrations of 1.4 mg/L, 7 mg/L, and 14 mg/L after 72 hours of exposure.
Figure 8.
Representative microscopy images of SK-BR-3 breast cancer cells treated with Ag₂S and Mn-doped Ag₂S nanoparticles at concentrations of 1.4 mg/L, 7 mg/L, and 14 mg/L after 72 hours of exposure.
Disclaimer/Publisher’s Note: The statements, opinions and data contained in all publications are solely those of the individual author(s) and contributor(s) and not of MDPI and/or the editor(s). MDPI and/or the editor(s) disclaim responsibility for any injury to people or property resulting from any ideas, methods, instructions or products referred to in the content. |
© 2025 by the authors. Licensee MDPI, Basel, Switzerland. This article is an open access article distributed under the terms and conditions of the Creative Commons Attribution (CC BY) license (http://creativecommons.org/licenses/by/4.0/).
Copyright: This open access article is published under a Creative Commons CC BY 4.0 license, which permit the free download, distribution, and reuse, provided that the author and preprint are cited in any reuse.


