
Submitted:
16 July 2025
Posted:
17 July 2025
You are already at the latest version
Abstract
Cancer is still the world's most prevalent cause of death, and the limited efficacy of current treatments highlights the requirement for new therapeutic approaches. In this study, neodymium (Nd)-doped cobalt ferrite (CoFe₂₋?Nd?O₄, z = 0; 0.01; 0.02; 0.03; 0.05; 0.1) nanoparticles (Nd0-Nd5) were synthesized via combustion method. The structural, morphological, and magnetic properties were characterized using X-ray diffraction (XRD), Fourier-transform infrared spectroscopy (FTIR), vibrating sample magnetometry (VSM) and scanning transmitted electron microscopy (STEM) analysis. The synthesized compounds demonstrated single-phase spinel structures, with morphological differences observed between undoped and Nd-doped samples. The biological activity of the nanoparticles was evaluated on immortalized human keratinocytes (HaCaT) and on cancer cell lines: melanoma (A375), breast adenocarcinoma (MCF-7), and pancreatic carcinoma (PANC-1). The cytotoxic effects of Nd0-Nd5 (50–1000 μg/mL) were assessed through Alamar Blue and lactate dehydrogenase (LDH) release assays. The results indicated a dose-dependent cytotoxic effect in cancer cell lines. Changes of cell morphology suggesting the inducement of the apoptotic processes were observed through immunofluorescence staining of F-actin and nuclei. These findings highlight the potential of Nd-doped cobalt ferrite nanoparticles as selective anticancer agents, warranting further investigation to fully elucidate their mechanisms of action and therapeutic applicability.
Keywords:
neodymium-doped magnetic nanoparticles
; cobalt ferrites
; cytotoxicity
; cell viability
; anticancer
1. Introduction
Malignant pathologies stand today as the main leading cause of death worldwide; despite huge improvements in anticancer therapy, modern medicine still lack the tools to avoid drug resistance or the severe side effects that accompany current treatments. Therefore, the search for new therapeutic alternatives continues, including materials of various origins. Nanotechnology has established itself in the biomedical field as a powerful weapon against various pathologies, including cancer, where it provided both therapeutic and diagnostic agents, sometimes combined in multifunctional platforms.
Among the multitude of nanoparticles synthesized to date, metallic nanoparticles carry particular importance due to their tunable properties, flexible surface functionalization and straightforward synthetic approach. Metallic nanoparticles can be obtained in a variety of size range with low dispersity indexes, are biocompatible and inert, are able to penetrate the target organs by crossing biological barriers and, more importantly, may induce an enhanced biological activity due to their specific particle size (<100 nm) and high surface area that enable their binding to cellular compounds such as proteins and nucleic acids [1].
Magnetic nanoparticles have gained interest in the biomedical area due to their ability to be manipulated through an external magnetic field to generate heat which increases tumor temperature above the normal body temperature thus leading to its elimination (hyperthermia); this effect can be combined with drug delivery within multipurposed platforms with high anticancer efficiency [2]. However, the intrinsic cytotoxic activity of such nanoparticles was also explored and revealed that cancer cells are more sensitive to metallic nanoparticles than normal cells. Mechanisms suggested for such effects include the generation of reactive oxygen species, the activation of caspase 3, the increase of mitochondrial permeability and the fragmentation of DNA molecules, overall activating various signaling pathways that lead to cell death [3]. Numerous evidences suggest that nanoparticles, particularly iron oxide-based, are able to interact with the host immune system thus stimulating the immune recognition of the tumor through yet unknown mechanisms [4]. Iron oxide nanoparticles can be doped with other elements that occupy various positions in the crystal lattice and induce the alteration of their resulting physicochemical, biological, electrical and optical properties [5]. A challenge in obtaining doped iron oxide nanoparticles useful for the biomedical field is to find an element with strong magnetic properties combined with stability and biocompatibility; a strategy was to replace divalent iron ions with cobalt ions which are more anisotropic and display comparable ionic size [6]. Cobalt-doped iron oxide nanoparticles also known as cobalt ferrites, possess high intrinsic magneto crystalline anisotropy values which trigger significant higher coercivity compared to pure iron oxide nanoparticles. Unlike other ferrites, cobalt ferrite exhibits an inverse spinel structure with divalent ions occupying octahedral sites in the crystal lattice while trivalent ions are distributed evenly between tetrahedral and octahedral sites [7]. Cobalt is an interesting choice as a doping element given its intrinsic cytotoxic properties; cobalt nanoparticles were tested against breast and colon cancer cells where they easily penetrated cell membrane and induced cell apoptosis and death in a significant proportion while inducing low cytotoxic effects in healthy cells even at high concentrations [8].
The doping process may go even further by employing rare earth elements as supplementary material in an effort to increase anticancer efficiency. Various rare earth metals were assessed among which Nd stands as one of the most widely studied in terms of bio-imaging applications due to its excitation and emission lines within the first NIR biological transparency window [9]. Nd also displays intrinsic anticancer properties by binding to double-stranded DNA with high equilibrium association constants; additionally, Nd in high concentration is able to induce the strong condensation of the DNA’s double helix thus promoting its collapse in a similar manner with conventional chemotherapy agents [10]. However, studies on Nd-doped cobalt ferrites are still scarce particularly in terms of molecular underlying mechanisms.
We aimed to develop Nd-doped cobalt ferrites by means of combustion, a straightforward synthetic approach. The doped ferrites were then assessed in terms of physicochemical properties by employing X-ray diffraction (XRD), Fourier-transform infrared spectroscopy (FTIR), vibrating sample magnetometer (VSM) and scanning transmitted electron microscopy (STEM) analysis. Their biological assessment was carried out using Alamar Blue and LDH release assays on normal HaCaT cell line and on cancer cell lines (A375, MCF-7, and PANC-1), complemented by immunofluorescence staining to evaluate the morphological changes that were associated with the cytotoxic effects.
2. Materials and Methods
2.1. Chemicals
For the synthesis were used the following raw materials: iron nitrate Fe(NO3)3·9H2O, cobalt nitrate Co(NO3)2·6H2O, Nd chloride NdCl3·6H2O and glycine C2H5NO2. All reagents were analytically grade and were purchased from Sigma-Aldrich (Darmstadt, Germany).
2.2. Synthesis by Combustion Method
In order to obtain 0.02 moles cobalt ferrite, a combustion method was employed using cobalt nitrate, iron nitrate, and glycine as the primary precursors; the metal nitrates served as oxidizing agents, while glycine functioned as the fuel. Specifically, 0.02 moles of cobalt nitrate, 0.04 moles of iron nitrate, and 0.09 moles of glycine were placed into a Berzelius glass. The mixture was heated at 60 °C until the color of solution changed to brown. Meanwhile, a porcelain crucible was preheated in a heating mantle at approximatively 350 °C; the temperature was maintained for the entire reaction period. Once the precursor solution developed a viscous consistency due to solvent evaporation, it was transferred into the preheated crucible. As the viscosity further increased, the mass self-ignited, initiating a self-sustained combustion reaction; during this reaction the appearance of yellow flames indicated that a high temperature was reached. The combustion, that lasted around 10 seconds, resulted in a black, porous and brittle powder.
The synthesis of Nd-doped cobalt ferrite followed the same steps, with the addition of Nd chloride as the dopant precursor. In these formulations, the amount of glycine and cobalt nitrate were the same as in the previous method, while the iron nitrate and Nd chloride proportions changed according to Table 1. During the reaction white gases were released and the combustion duration was 4 seconds longer than the undoped counterpart. Additionally, the final powders of the Nd-doped samples appeared bulkier and exhibited a noticeably spongier texture compared to the undoped cobalt ferrite.
2.3. Characterization Methods
XRD analysis was conducted with a Rigaku SmartLab diffractometer (Tokyo, Japan) that operates at 45 kV and 200 mA and is equipped with a Cu anode (1.5406 Å wavelength) [11]. Phase identification was carried out using the Crystallography Open Database, and Rietveld refinement of the diffraction patterns was conducted with the dedicated analysis package included in the the Rigaku SmartLab Studio II software. FTIR spectroscopy was conducted using a Shimadzu IR Affinity-1S spectrophotometer (Shimadzu Scientific Instruments Inc., Columbia, MD, USA), in the range 400-4000 cm-1, with a resolution of 4 cm-1, 40 scans per sample. Sample preparation was carried out using the standard KBr pellet technique. The characterization of the magnetic properties was carried out with a LakeShore 8607 VSM (Shore Cryotronics, Westerville, OH, USA). Prior to all measurements, all samples were demagnetized in an alternating magnetic field. Magnetization curves were measured at room temperature under an applied filed raging from + 30 to -30 KOe. Morphological evaluation was performed using a Hitachi High-Tech HT7700 (Hitachi High-Technologies Corporation, Tokyo, Japan) at 120 kV in high contrast mode. This instrument was equipped with an EDX detector for the elemental analysis, with SAED apertures and with a STEM module. The samples were prepared by drop casting from their water suspension on 300 mesh carbon-coated copper grids (Ted Pella Inc., Redding, California) and then vacuum-dried at 25 °C for 24 h.
2.4. Cell Culture
In this study we used immortalized human keratinocytes (HaCaT) cells obtained from CLS Cell Lines Service GmbH (Eppelheim, Germany), human melanoma (A375), human breast adenocarcinoma (MCF-7) and human pancreatic carcinoma (PANC-1) cells, all obtained from American Type Culture Collection (ATCC, Lomianki, Poland). HaCaT, A375 and PANC-1 cells were grown in Dulbecco’s Modified Eagle Medium (DMEM) whereas MCF-7 cells were grown in Eagle’s Minimum Essential Medium (EMEM); all media were supplemented with 10% fetal bovine serum (FBS) and 1% antibiotics (penicillin-streptomycin 100 IU/ml), presenting normal proliferation in culture. Cells were incubated in 5% CO2 atmosphere at 37°C.
2.5. Cell Viability Assessment
The viability of HaCaT, A375, MCF-7 and PANC-1 cells was assessed using the Alamar Blue assay after a 48h treatment with the newly obtained compounds Nd0-Nd5 (50, 100, 250, 500 and 1000 μg/mL). The cells were seeded in 96 well culture plates (1×10⁴ cells/well) and kept in an incubator at 37°C and 5% CO2. After reaching 80-90% confluence the old media was removed and the cells were stimulated with Nd0-Nd5 for 48h. The cells were then stained with Alamar blue 0.01% and incubated for another 3 hours; the absorbance was measured at 570/600 nm using the BioTek Synergy HTX multimode microplate reader (Agilent Technologies, Santa Clara, CA, United States of America).
2.6. Lactate Dehydrogenase (LDH) Assay
The cytotoxic potential of Nd0-Nd5 (50, 100, 250, 500 and 1000 μg/mL) on A375, MCF-7 and PANC-1 cancer cells was determined by quantifying the extracellular release of the cytosolic LDH in the culture medium, according to a previously established protocol [12]. Briefly, the cells were seeded in 96-well plates (1×10⁴ cells/well), incubated until reaching an appropriate confluence and treated with the newly obtained compounds (Nd0-Nd5). After a 48h treatment period, 50 μL of culture medium was collected from each well and transferred with 50 µL of LDH reaction mixture to a new 96-well plate. After an incubation of 30 minutes at room temperature, the reaction was stopped with 50 µL of stop solution. The absorbance was read at 490/680 nm using an xMark™ Mi-croplate Spectrophotometer, Bio-Rad (Hercules, CA, USA).
2.7. Immunofluorescence Assay
A375, MCF-7 and PANC-1 cells were seeded in 6-well plates until reaching an appropriate confluency and treated for 48h with Nd0, Nd1, Nd2, Nd3, Nd4 and Nd5 at two representative concentrations (500 and 1000 μg/mL). according to a previously established protocol [13], the cells were washed 3 times with cold PBS, fixed with 4% paraformaldehyde, permeabilized with 0.1% Triton X in PBS for 15 minutes, blocked with 30% FCS and washed again 3 times with cold PBS. Actin filaments (F-actin) were labelled using Alexa Fluor™ 594 Phalloidin (Thermo Fisher Scientific, Boston, MA, USA) - 30 minutes incubation at room temperature. The nuclei were stained and morphological analyzed using the Hoechst 34580 staining (Thermo Fisher Scientific, Boston, MA, USA) - 5 minutes incubation at room temperature. The morphological assessment was analyzed using the EVOS™ M5000 Imaging System (Thermo Fisher Scientific, Boston, MA, USA).
2.8. Statistical Analysis
The statistical difference between treatment and control was determined using the one-way ANOVA analysis and the Dunett’s multiple comparisons post-test, respectively (* p < 0.05, ** p < 0.01 and *** p < 0.001).
3. Results
3.1. XRD
As revealed by the allure of the peaks, all samples exhibit high degree of crystallinity. In sample Nd 0, the spectrum contains bands that characterize a single-phase cubic cobalt ferrite Fd3m structure (Figure 1). Samples Nd 1 and Nd 2 exhibit no additional bands thus indicating the successful incorporation of Nd in the ferrite structure. Phase identification was achieved with the COD card 96-153-3164. The diffractions peaks found at angles 18.22°, 30.10°, 35.48°, 37.11°, 43.13°, 53.50°, 57.05°, and 62.66° were attributed to the crystallographic planes (111), (220), (311), (222), (400), (422), (511), and (440), thus confirming the formation of cobalt ferrite. In sample Nd3, only a small peak located at 32.54° was recorded, indicating that the secondary phase occurred in trace amounts. In samples Nd4 and Nd5, additional diffraction peaks were noted indicating the formation of a secondary phase identified as orthorhombic perovskite NdFeO3 using the COD card 96-200-3125. The peaks present at angles 2θ 22.79°, 32.54°, 46.63° and 58.40° were assigned to the crystallographic planes (110), (112), (220) and (204); one can notice that with the increase of Nd content the NdFeO3 peaks became more intense, particularly the one located at 32.54°.
Table 2 displays the α lattice parameter calculated for every sample by means of Rietveld refinement. One can notice that when Nd was added as doping agent a small increase in the lattice parameter was recorded which confirms the inclusion of Nd in the spinel structure. Moreover, an increase of the lattice parameter was noticed as the Nd content progressively increased.
3.2. FTIR
The FTIR spectra (Figure 2) revealed that all samples display an intense absorption band accompanied by another one which is partially visible; both bands are located between 400-800 cm-1 that is characteristic for the metal-oxygen stretching vibration in cobalt ferrite. In addition, a small shift of the band can be noticed as the Nd content increased.
3.3. VSM
The magnetic properties recorded for all samples are presented in Figure 3. A similar behavior can be noticed for all samples, with the hysteresis maintaining the same shape while the intensity varied. The mass magnetization (Ms) recorded for Nd0 (cobalt ferrite) is 76.55 emu/g while the remnant magnetization (Mr) has a value of 33.58 emu/g. For the Nd-doped samples Nd1 – Nd5 a decrease in both Ms and Mr can be noticed with the increase of the Nd content; as an example, in sample Nd5, the Ms decreased to 64.97 emu/g and Ms to 28.38 emu/g.
3.4. STEM
All samples exhibited a pronounced tendency of agglomeration and stacking leading to cluster formation that made difficult the evaluation of particle size. The STEM images (Figure 4) show the formation of doped and undoped cobalt ferrite nanoparticles. For the undoped cobalt ferrite Nd0, the particle size ranges between 20-46 nm while for the doped samples a modest reduction was noted with diameters varying between 19 and 43 nm in Nd1 and between 17 and 42 nm in Nd 2. Samples Nd3 and Nd4 have comparable dimensions of 17-35 nm and 16-36 nm, respectively. In sample Nd5, the size decrease is more obvious compared to the undoped sample, with diameters ranging between 10-30 nm. Thus, one may state that the inclusion of Nd into the ferrite lattice resulted in a decrease in particle dimension in direct correlation with the Nd content.
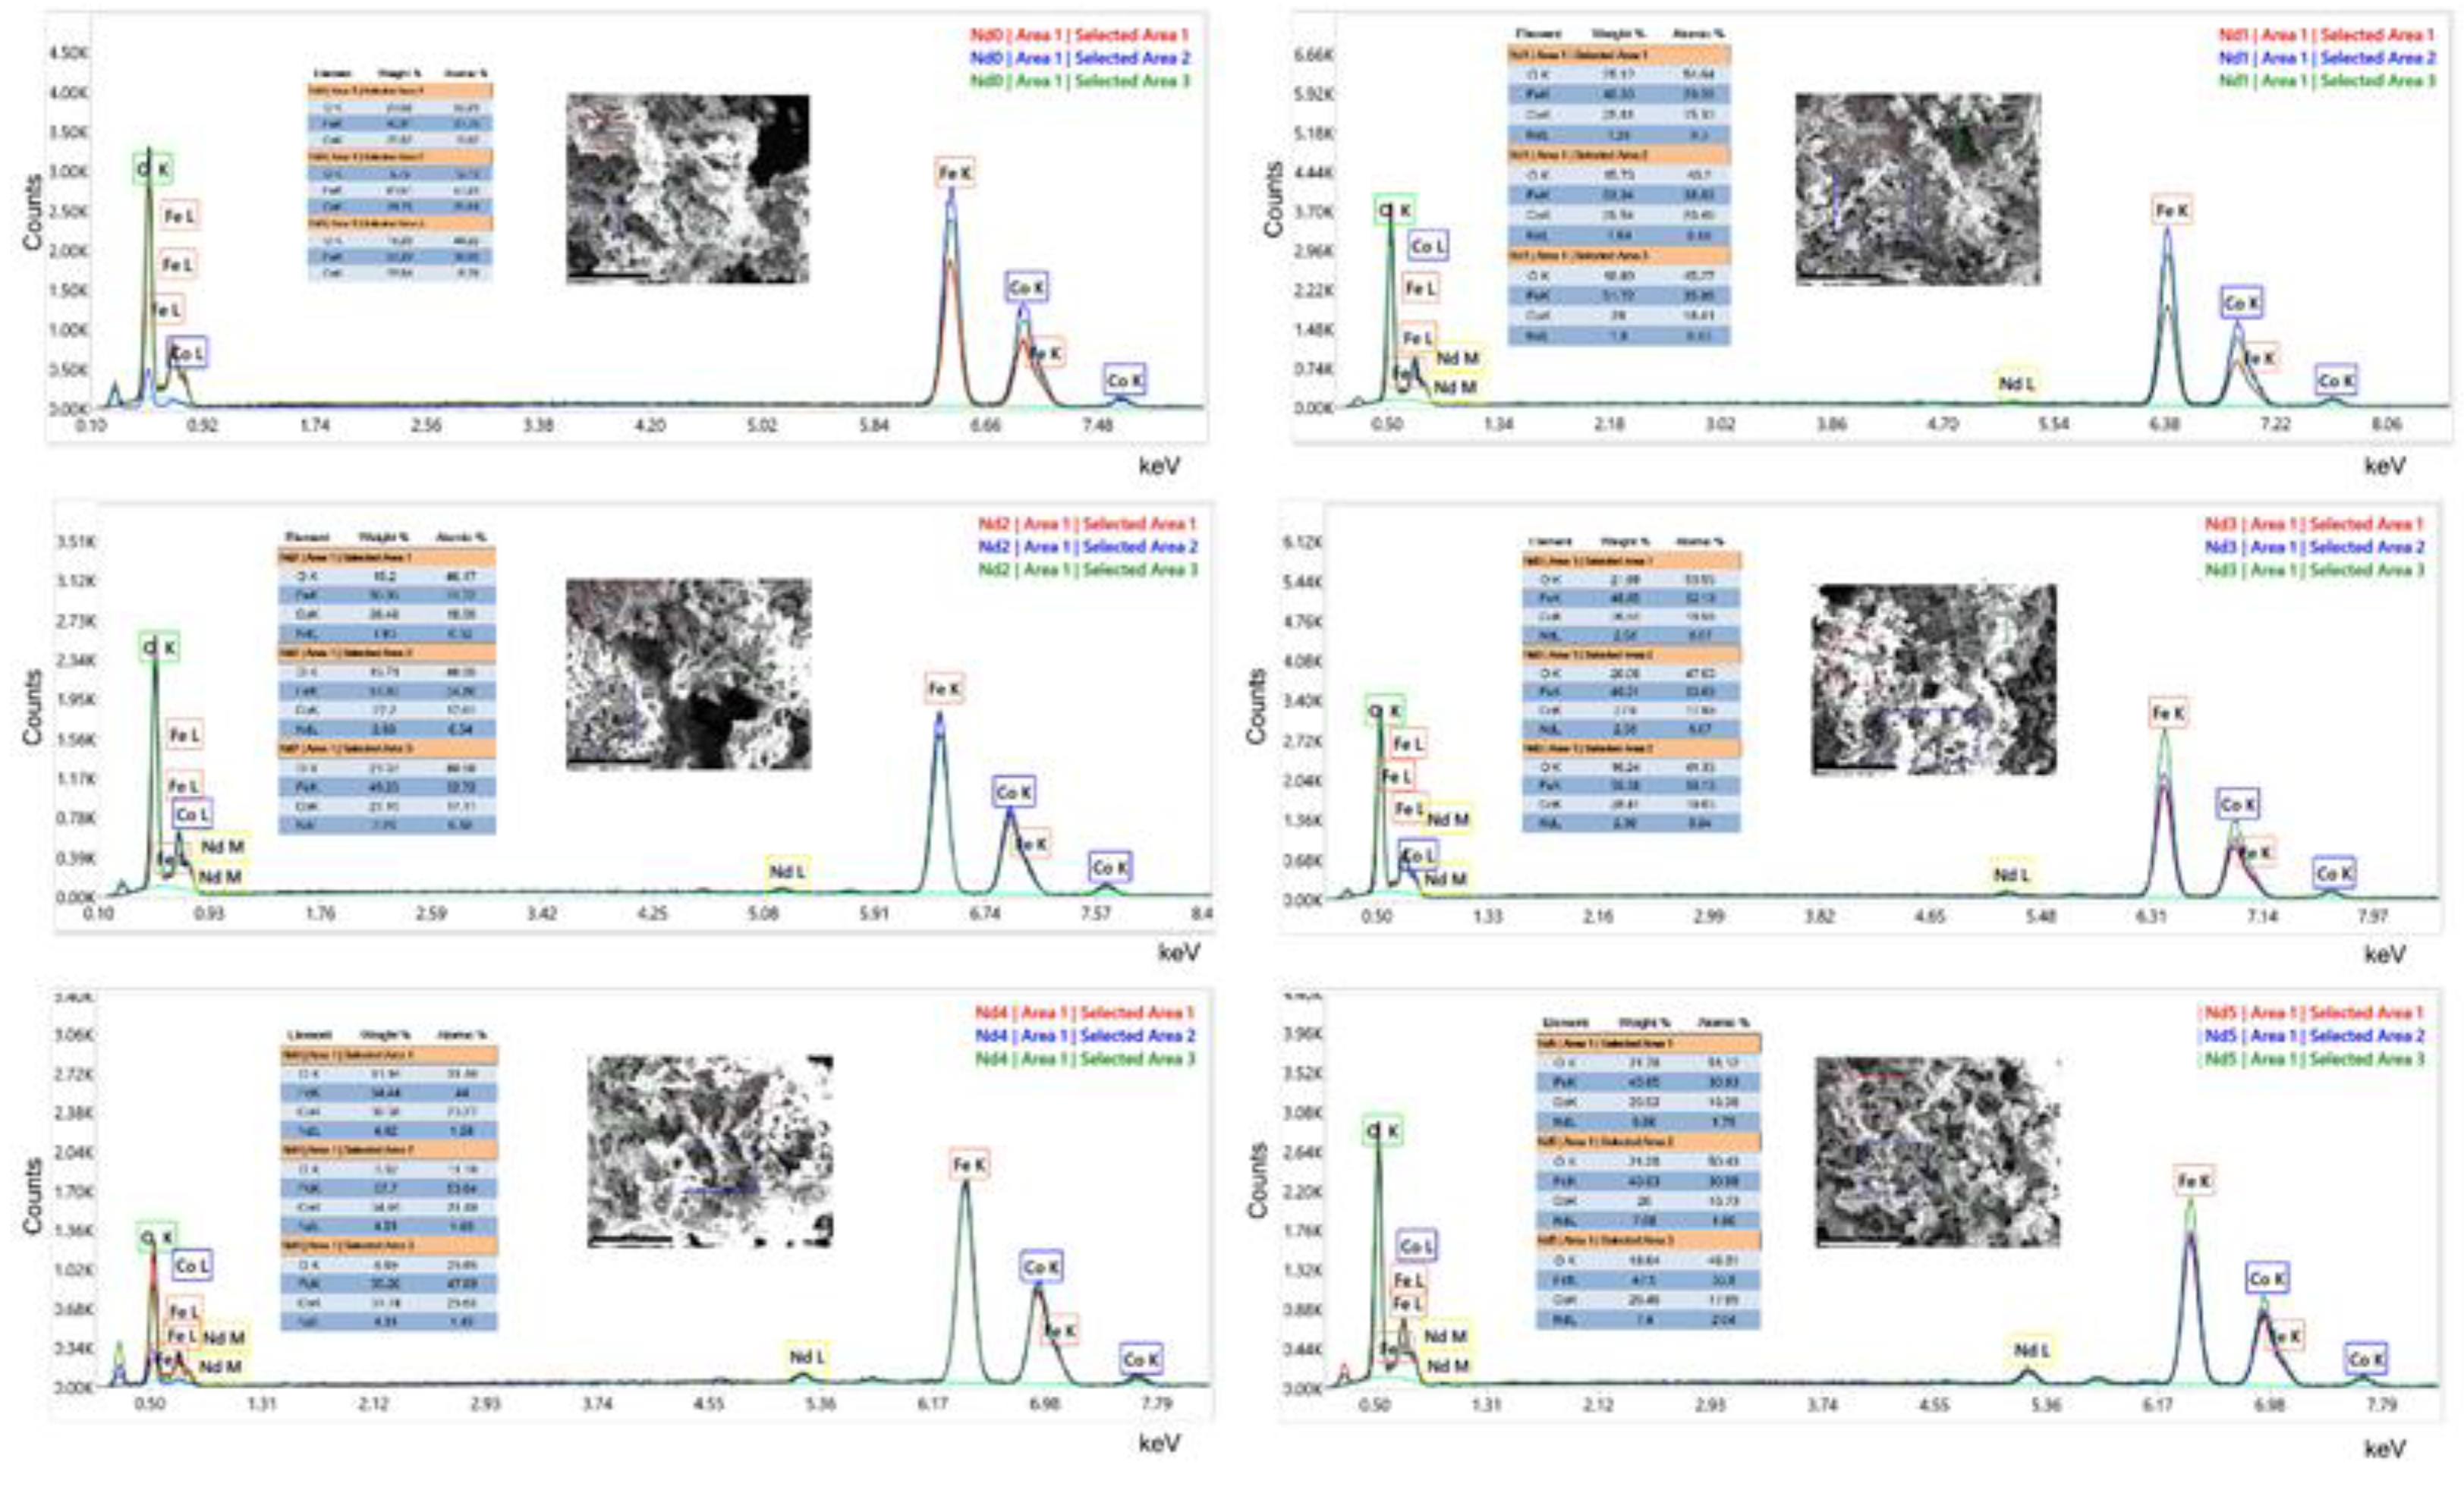
3.5. EDAX
The EDAX analysis confirms the formation of cobalt ferrite as well as the presence of Nd in the doped samples (Nd1 – Nd5).
In sample Nd 0, the EDAX analysis reveals the specific peaks of cobalt ferrite with the Kα line for Fe located at approximatively 6.4 keV and the one for Co around 6.9 keV. The peak located at 7.0 keV was assigned to FeKβ that overlaps CoKα. A smaller peak can be noticed around 7.6 keV and can be attributed to CoKβ. The 0-1 keV region hosts Lα lines for iron and cobalt and the Kα line for oxygen. The content of oxygen was not rigorously obtained due to the limitation of this technique to quantify light elements. For the doped samples, the Nd lines are present, marked by a distinct peak located around 5.2 keV and assigned to NdLα; an M line around 0.8 keV overlapped in the 0-1 keV domain.
Figure 5.
EDAX of the samples.
3.6. Nd Compounds Decrease Cancer Cell Viability
The potential anti-tumor properties of Nd complexes (Nd0, Nd1, Nd2, Nd3, Nd4, and Nd5) in HaCaT, A375, MCF-7 and PANC-1 cells were investigated following a 48h treatment with increasing concentrations – 50, 100, 250, 500, and 1000 µg/mL, respectively. When tested on cell lines, Nd-doped compounds affected cell viability in a dose-dependent manner while expressing different levels of cytotoxicity depending on the cell type (Figure 6, Figure 7, Figure 8 and Figure 9). A common observation for all 6 studied compounds is that lower concentrations (50 µg/mL - 500 µg/mL) did not show cytotoxic effects on HaCaT cells, in some cases even increasing the number of viable cells, with the viability values ranging from 135.27 ± 10.48% vs. control after 50 µg/mL Nd0 treatment, to 85.03 ± 9.12% after 500 µg/mL Nd4 treatment. On the contrary, the highest concentration (1000 µg/mL) reduced the viability of HaCaT cells, to 70.60 ± 5.35% (Nd0), 63.83 ± 7.88% (Nd1), 60.26 ± 1.07% (Nd2), 52.34 ± 4.81% (Nd3), 50.89 ± 3.96% (Nd4), and 50.76 ± 4.85% (Nd5) (Figure 6).
Against A375 cell line, the tested compound exerted a strong cytotoxic activity (Figure 2); the viability of melanoma cells was most affected at the concentration of 1000 µg/mL, by Nd5 (32.67 ± 7.51%), followed by Nd4 (37.43 ± 7.85%), Nd3 (43.84 ± 5.88), Nd2 (51.28 ± 7.06 %), Nd1 (63.65 ± 3.33%), and finally Nd0 (71.88 ± 1.57%) (Figure 7).
A similar dose-dependent trend was observed in MCF-7 line, where there was a significant drop in cell viability after stimulation with 1000 µg/mL concentration of Nd5 (45.79 ± 2.19%), Nd4 (47.34 ± 7.55 %), Nd3 (57.90 ± 5.67%), Nd2 (61.78 ± 9.78 %), Nd1 (63.65 ± 8.44%), and Nd0 (74.87 ± 10.36%), and 500µg/mL concentration of Nd5 (66.75 ± 5.05%) and Nd4 (73.18 ± 8.26%) (Figure 8).
In PANC-1 cancer cells, all of the applied treatments caused a gradual and dose-dependent decline of cell viability (Figure 9). However, the cytotoxic potential was highly dependent of the tested complex. Thus, a statistically significant reduction in the percentage of viable cells was obtained at all concentrations for Nd1-Nd5, while Nd0 produced a significant effect only starting with the concentrations of 250 µg/mL (Figure 9). Specifically, the highest concentrations tested (500 and 1000 µg/mL) of Nd0-Nd5 reduced cell viability of PANC-1 cells as follows: 61.28 ± 3.81% and 35.16 ± 5.21% (Nd0),70.36 ± 6.19% and 28.10 ± 6.53% (Nd1), 46.85 ± 5.97% and 28.03 ± 2.32% (Nd2), 46.75 ± 9.38% and 25.67 ± 6.53% (Nd3), 46.50 ± 7.24% and 29.84 ± 7.20% (Nd4) and to 42.24 ±2.52% and 19.21 ± 2.83% (Nd5) (Figure 4).
The calculated IC50 values of the tested compounds in HaCaT, A375, MCF-7 and PANC-1 cells (Table 3) indicate a similar anti-tumor effect against the cancerous cell lines and a lack of cytotoxic effect against the normal HaCaT cell line.
3.7. Nd Compounds Increase LDH Release
The cytotoxic potential of Nd compounds (50, 100, 250, 500, and 1000 µg/mL) was assessed in A375, MCF-7 and PANC-1 cells by quantifying the lactate dehydrogenase (LDH) released in culture medium after cell membrane rupture or alteration at 48h post-treatment (Figure 10, Figure 11 and Figure 12).
In A375 cells, only the highest concentration of Nd0 (1000 μg/mL) induced a cytotoxic effect vs. control (7.31 ± 1.04% vs. 3.77 ± 0.59%) (Figure 10). Nd1-Nd5 significantly increased the LDH release vs. control (3.77 ± 0.59%) when tested at both 500 μg/mL and 1000 μg/mL, respectively. The obtained values were as follows: 6.48 ± 0.84%% and 8.45 ± 0.69% (Nd1), 7.52 ± 0.72% and 10.45 ± 1.01% (Nd2), 8.14 ± 1.39% and 12.15 ± 1.54 (Nd3), 10.22 ± 2.04% and 12.07 ± 1.69% (Nd4) and 9.96 ± 2.18 and 13.14 ± 1.35% (Nd5).
Treatment of MCF-7 cells with Nd0-Nd5 (50, 100, 250, 500, and 1000 µg/mL) induced a similar cytotoxic effect, observed by the significant increase of LDH release when the cells were treated with the highest concentrations of the compounds. The treatment with 1000 μg/mL with Nd0-Nd5 increased LDH release vs. control (3.03 ± 0.64%), as follows: 6.53 ± 0.57% (Nd0), 8.25 ± 0.91% (Nd1), 8.37 ± 0.79% (Nd2), 9.57 ± 1.22% (Nd3), 10.43 ± 1.72% (Nd4) and 12.76 ± 2.11 % (Nd5) (Figure 11).
In PANC-1 cells the results show that Nd compounds caused a concentration-dependent leakage of LDH starting with the lowest concentration of 50 μg/mL to the highest concentration of 1000 μg/mL (Figure 12). Specifically, Nd0 increased LDH release percentage from 2.72 ± 0.53% (control) to 8.28 ± 1.48% (1000 μg/mL). An increase in cytotoxicity was also obtained for Nd1: 8.04 ± 1.47% (500 μg/mL), 9.09 ± 0.77% (1000 μg/mL), and for Nd2: 9.80 ± 2.73% (500 μg/mL), 14.82 ± 0.20 (1000 μg/mL). Compounds Nd3-Nd5 produced a dose-dependent cytotoxic effect starting with the lowest concentration tested (50 μg/mL) up to 1000 μg/mL. Specifically, Nd3 increased LDH release vs. control (2.72 ± 0.53%), as follows: 8.70 ± 1.07% (50 μg/mL), 10.07 ± 1.31% (100 μg/mL), 10.58 ± 1.42% (250 μg/mL), 11.06 ± 0.74% (500 μg/mL) and 12.64 ± 0.50% (1000 μg/mL). Nd4 increased LDH release up to 8.06 ± 0.30% (50 μg/mL), 10.87 ± 0.90% (100 μg/mL), 11.35 ± 1.01% (250 μg/mL), 11.99 ± 1.51% (500 μg/mL) and 16.67 ± 1.66% (1000 μg/mL), while Nd5 exhibited the highest increase of LDH release, as follows: 14.61 ± 0.26% (50 μg/mL), 16.19 ± 3.03% (100 μg/mL), 16.83 ± 1.37% (250 μg/mL), 17.64 ± 1.41% (500 μg/mL) and 23.72 ± 1.03% (1000 μg/mL).
3.8. Nd Compounds Induce Cell Morphology Changes
Figure 13, Figure 14 and Figure 15 illustrate the changes in nuclear morphology and F-actin organization in A375, MCF-7 and PANC-1 cells after 48h treatment with Nd0-Nd5 at two representative concentrations: 500 and 1000 μg/mL. In all tested cell lines, control cells displayed a normal nuclear and cytoskeletal morphology; the nuclei presented an oval or sphere-like shape with an evenly distributed chromatin that lacked signs of condensation, alongside well-organized F-actin fibers that were distributed throughout the cytoplasm without evidence of constriction.
In contrast, treatment with Nd compounds induced noticeable changes in their morphology, including nuclear condensation and fragmentation, as well as constriction of F-actin bundles, especially at the periphery of the cells. Additional signs of cytotoxicity, such as cell rounding and shrinkage were also observed (Figure 13 15).
4. Discussions
Metal nanoparticles are a hot topic in anticancer research, a pathology that continues to raise worldwide challenges in terms of morbidity and mortality. Among such nanoparticles, cobalt ferrites triggered numerous studies due to their potential as both imagistic and therapeutic agents. The current study aimed to investigate the newly synthesized Nd-doped cobalt ferrites which should hypothetically benefit of the anticancer properties of all components. Cobalt ferrites have already been proven as promising, highly selective anticancer agents that simultaneously display the ability to act as a platform for deciphering and controlling magnetic properties through structural chemistry manipulation [14].
Additionally, Nd has the ability to interact with organic molecules resulting in stable complexes with high biocompatibility; its complex with phenantroline exhibited strong and selective cytotoxic effects [15]. Similarly, Nd formed a stable complex with tungstogermanate and 5-fluorouracil which exhibited significant cytotoxic activity against two cancer cell lines where pure 5-fluorouracil induced lower anticancer effects [16].
We aimed to synthesize Nd-doped cobalt ferrite nanoparticles that were further physiochemically analyzed by employing specific procedures.
The XRD analysis shows the successful incorporation of Nd within the cubic network. The combustion method used in this case for the synthesis of doped and undoped cobalt ferrite ensured optimal conditions for the formation of single-phase cubic CoFe2-zNdzO4 (Fd3m group) in samples Nd0, Nd1 and Nd2 (z = 0; 0.01 and 0.02, respectively). The formation of a secondary orthorhombic phase NdFeO3 (Pbnm group) was reported in samples Nd3 – Nd5 (z = 0.03; 0.05; 0.1, respectively). Furthermore, in sample Nd3 (z = 0.03) only a small peak was noticed, suggesting a trace amount of the secondary phase which did not alter the characteristic patterns of the Nd-doped cobalt ferrite in terms of position and intensity. Muskan et al. [17] also reported the formation of the orthoferrite NdFeO3 as secondary phase in their study that focused on CoNdxFe2-xO4 (x = 0.0 - 0.6) nanoparticles.
Our findings are similar to those reported by Wang et al. [18] who used nitrates, citric acid and the sol–gel self-propagating method to synthesize CoNdxFe2-xO4 (0 ≤ x ≤0.2) nanoparticles. They showed that a doping amount of Nd that exceeded x=0.05 led to the formation of NdFeO3 secondary phase in addition to the cubic cobalt ferrite. In another study focused on Nd-doped cobalt ferrite, Muskan et al. [19] identified x=0.05 as the molar ratio that led to the formation of a secondary phase. In the current study, we synthesized CoFe2-zNdzO4 nanoparticles and the presence of NdFeO3 as secondary phase was confirmed for z=0.05 while only traces were present for z=0.03. The occurrence of the secondary phase can be explained by the difference in the ionic radius between elements, the larger ionic radius (1.07 Å) Nd substituting the smaller ionic radius (0.64 Å) iron within the crystal lattice. Therefore, only a limited amount of Nd will be accommodated into the spinel structure.
In all samples, the lattice parameter a from the cubic spinel network increases with the increase of the Nd content as revealed by the Rietveld refinement thus suggesting that a higher amount of Nd successfully enters the cubic lattice. Consequently, the presence of Nd with a higher atomic radius caused the expansion of the unit cell, and simultaneously of the lattice parameter. The EDAX analysis showed that the characteristic band for Nd in present in samples Nd1 – Nd5 which, combined with the increase in lattice parameter, can be interpreted as proof for the successful inclusion of Nd into the spinel lattice.
The FTIR spectra of the undoped and doped samples show similar absorption bands, characteristic for cobalt ferrite. The intense band located at approximatively 570 cm-1 could be attributed to the metal-oxygen stretching vibration of the tetrahedral sites while the partially visible one around 400 cm-1 can be allocated to the metal-oxygen stretching vibration from the octahedral sites. In addition, a small shift of the absorption band occurred, from 572 cm-1 in Nd0 to 568 cm-1 in Nd5 which contains the highest dopant quantity; this small shift can be attributed to the presence of Nd whose amount triggers the band movement towards lower wavenumbers due to alterations in cation distribution as well as lattice distortion. Furthermore, the band is attributed to the metal-oxygen stretching vibration from tetrahedral sites, so the shift could also indicate a tampering in the metal-oxygen bond [20]. Moreover, Iram et al. [21] studied lanthanum- and Nd-doped cobalt-strontium ferrite and underlined the build-up tension in the spinel structure caused by the presence of higher ionic radius rare earth elements. Additionally, they mentioned that during cation redistribution at the octahedral site the ions of the doping elements could overlap the iron ions leading to distortions at the interstitial positions.
Wu et al. [22] synthetized CoFe1.9RE0.1O4 (RE = Ho3+, Sm3+, Tb3+, Pr3+) nanoparticles by means of the hydrothermal method and similarly reported the two bands characteristic for cobalt ferrite as well as a slight shift in the absorption maximum for the doped samples. Moreover, due to the affinity of rare earth elements for octahedral sites, as well the formation of vacancies, cation redistribution and a potential migration of iron from octahedral to tetrahedral sites, the metal-oxygen vibration will be altered, indicating changes in the Fe-O bond length and strength [18,23].
The magnetic measurements revealed a linear decrease in both mass magnetization Ms and remnant magnetization Mr with the increase of the Nd content. While for the undoped sample Nd0 the values of Ms and Mr are 76.55 emu/g and 33.58 emu/g, respectively, in sample Nd5 the values decrease to 64.97 emu/g and 28.38 emu/g, respectively. The reduced magnetization was also reported in another CoFe2-xNdxO4 study [19] where the Ms starting value of 54.61 emu/g for the undoped sample dropped to 34.53 emu/g for x=0.06. Furthermore, Wang et. al. [18] noted a similar impact exerted by Nd on the magnetic properties of the resulting nanoparticles, stating that the phenomenon could be considered an indirect proof that Nd has successfully entered the ferrite lattice.
The magnetization reduction can be explained by the substitution of the smaller ionic radius Fe3+ with the larger ionic radius Nd3+. As previously mentioned, this notable difference in ionic radius disrupts the crystal structure leading to lattice distortion, cation redistribution between sites, and the occurrence defects. Moreover, the replacement of Fe3+ with Nd3+ in the B site will impair the super exchange interaction between A (tetrahedral) and B (octahedral) sites; according to Wang et al. [18], the super exchange interaction between A and B sites (Fe3+A—O2—Fe3+B or Fe3+A—O2—Co2+B) are weakened, while the interactions from B and B sites (Fe3+B—O2—Co2+B or Fe3+B—O2—Fe3+B) will exhibit an increase in the negative exchange, showing stronger antiferromagnetic behavior.
In addition, a contribution to the decline of the magnetic properties can also be attributed to the presence of the NdFeO3 secondary phase that could disrupt the interaction within the crystal lattice [24].
The STEM analysis revealed that the reaction yielded particles with dimension between 10 and 46 nm. The insertion of Nd into the ferrite lattice caused a decrease in particle size depending on the Nd content; thus, the smallest nanoparticles (10-30 nm) were identified in sample Nd5 which contained the highest amount of the doping element. In our previous study [25] we focused on dysprosium-doped cobalt ferrite CoFe2-xDyxO4 (x=0; 0.1; 0.2; 0.4) and achieved comparable results, with increasingly reduced nanoparticle as the dysprosium content increased. Similar results were reported by Yusafi et al. [23] who synthesized CoNdxFe2-xO4 for x=0.0-0.5 and recorded a particle decrease with the increase of the Nd content. They also noted an intense particle agglomeration as well as a tendency towards irregular nanoparticle shape following Nd insertion into the ferrite lattice. As previously explained, this phenomenon is caused by the difference in ionic radius between iron and Nd which induces alterations in the spinel lattice. Furthermore, Wang [18] noted that, in addition to the Nd insertion in the crystal lattice, the occurrence of the secondary phase can also alter the normal formation of the ferrite grains. As an example, in gadolinium doped nickel ferrites [26] the particle size decrease was justified by the pressure created by Gd3+ ions at the grain boundaries, leading to growth restriction. Moreover, in the case of praseodymium-, holmium-, terbium- and samarium-doped cobalt ferrite, Wu et al. [22] observed that all rare earths induced a particle size reduction, attributed to the localization of the dopants at the boundaries of the grain, thereby exerting pressure and inhibiting their growth.
The newly synthesized nanoparticles were tested in terms of antiproliferative activity against three cancer cell lines aiming to identify a potential correlation between the Nd content and the respective biological effect. The antiproliferative activity was assessed by means of Alamar Blue assay. The antiproliferative effect manifested in a dose-dependent manner with the lowest cell viability reported for the highest applied concentrations of the tested samples. Remarkably, the Nd content significantly influenced the cell viability-decreasing action of the respective compound, its increase being directly proportional to the potency of the antiproliferative action. As clearly shown by previous studies, cobalt ferrites induce anticancer effects in a variety of cancer cells, fact validated in our study by the behavior of the Nd0 sample; however, the insertion of Nd into the cobalt ferrite crystal lattice increased the sample’s antiproliferative effects in all three cancer cell lines. The cytotoxic effect exerted by Nd in MCF-7 cancer cells was revealed by several studies that investigated Nd complexes [27], Nd2O3 nanoparticles [28], Nd-doped carbon dots [29] and Nd3+-doped GdPO4 core nanoparticles [30]; in all studies, the cytotoxic activity was accompanied by reduced toxicity. The gradual increase in Nd content from sample Nd1 to Nd5 is accompanied by a proportional decrease in the nanoparticle’s size which could explain the increased antiproliferative activity by the increased surface-to-volume ratio that ensures a better contact between the nanoparticle and the biological environment. Most importantly, the presence of Nd is essential for the antiproliferative activity; in the form of oxide, Nd2O3, it triggers the production of reactive oxygen species able to alter in a dose-dependent manner the function of cellular components such as DNA, protein and lipids and induce cell death [31]. Such effects add to the anticancer properties of the cobalt ferrite itself which significantly decreased MCF-7 cell viability following uptake or adsorption by means of apoptosis induction [32]. When screening for anticancer therapeutic options one must investigate the selectivity of newly developed agents in order to avoid systemic toxicity; one suitable test is in vitro cell viability in normal cells. We used HaCaT cells (immortalized human keratinocytes) that are widely used as research material due to their facile culture while maintain a relatively stable phenotype [33]. It is of note that in low concentrations all samples lacked antiproliferative effects in HaCaT cells; moreover, some samples (e.g., Nd1, Nd2) even increased cell viability when applied in concentrations up to 500 μg/ml. Only when sample concentration increased to 1000 μg/ml HaCaT cell viability decreased; overall, such behavior characterized a highly selective anticancer activity [34] which might hold promise for future therapeutic opportunities.
In agreement with cell viability tests, the morphological assessment using a immunofluorescence assay revealed spherical nuclei with evenly distributed chromatin in control cells accompanied by well-organized actin fibers within the cytoplasm. Treatment with metallic nanoparticles induced an altered morphology in all cancer cell types with nuclear condensation and fragmentation and the constriction of the actin fibers; cell shrinkage was also noticed thus indicating apoptotic effects [35] whose intensity increased with the Nd content. Indeed, Nd was previously reported as an apoptosis inducer in mouse liver cells but in its most water-soluble form as Nd nitrate which was studied as an environmental pollutant [36]. When tested as Nd2O3 nanoparticles in non-small lung cancer cells, Nd exerted cytotoxic effects mainly through autophagy instead of apoptosis [37]. However, the apoptotic mechanism of cell death was previously reported for undoped cobalt ferrite nanoparticles in liver and colon cancer cells in a concentration-dependent manner [38]. To the best of our knowledge, this is the first study on the cytotoxic effects of Nd-doped cobalt ferrite nanoparticles that occur through apoptotic mechanisms.
In order to confirm their cytotoxic activity, we also assessed the release of lactate dehydrogenase in tested cancer cells following cell membrane alterations at 48h post-treatment. In all three cancer cells, the Nd-free sample Nd0 exhibited cytotoxic effects only when applied in high concentrations while the Nd-doped samples significantly increased the LDH release. LDH is an enzyme that catalyzes the metabolic conversion of pyruvate to lactate in the cytosol whose release in the extracellular space occurs following cell membrane damage or cell death thus making LDH release a reliable marker of cytotoxic effects [39]. Cobalt ferrite nanoparticles were already reported to induce increased LDH release in A549 lung cancer cells [40]; our results confirm such results that also validate cell viability tests.
5. Conclusions
The current study focuses on the design and synthesis of Nd-doped cobalt ferrite nanoparticles by means of a straightforward combustion method followed by their physicochemical analysis. Although Nd-doped metallic nanoparticles have been reported before, to the best of our knowledge this is the first study on the biological effects of Nd-doped cobalt ferrites whose design aimed to unite the anticancer benefits of both the rare earth element and the cobalt ferrite. Five types of doped nanoparticles were synthesized using increasing amounts of Nd (Nd1-5) while undoped cobalt ferrite nanoparticles (Nd0) were used as reference. Samples were assessed in terms of shape, size, morphology and magnetic properties; a clear correlation occurred between size and Nd content whose increase triggered diameter decrease. Cell viability assay revealed significant antiproliferative effects for both undoped and doped cobalt ferrite nanoparticles; the presence of Nd in the crystal lattice was correlated with increased reduction in cell viability compared to the undoped sample. Moreover, results showed that a relationship of direct proportionality could be established between the amount of doping element and the potency of cell viability reduction. Using conventional cytotoxic tests such as morphological assay and lactate dehydrogenase release, the results suggest that apoptosis may be involved as a potential mechanism of cell death. Further studies are needed in order to provide more details on the exact mechanism of action at cellular level and their potential as anticancer agents.
Author Contributions
Conceptualization, S.R. and C.Ș.; methodology, S.R. and A.G.; software, M.M. and A.I.D.; validation, A.G and C.Ș.; formal analysis, M.M., A.M., T.M., O.E., G.A. and N.L.M; investigation, S.R., A.I.D., T.M., O.E. and N.L.M; data curation, R.R. and G.A.; writing—original draft preparation, S.R., R.R. and A.M.; writing—review and editing, A.G and C.Ș.; visualization, A.G and C.Ș.; supervision, C.Ș. All authors have read and agreed to the published version of the manuscript.
Funding
We would like to acknowledge the “Victor Babes” University of Medicine and Pharmacy Timisoara for their support in covering the costs of publication for this research paper. This work was supported by the Romanian National Authority for Scientific Research through the project UEFISCDI PN-IV-P2-2.1-TE-2023-1790. This work was supported by a grant of the Ministry of Research, Innovation and Digitization, CNCS/CCCDI - UEFISCDI, project number PN-IV-P8-8.1-PRE-HE-ORG-2023-0048, within PNCDI IV.
Data Availability Statement
The original contributions presented in the study are included in the article, further inquiries can be directed to the corresponding author.
Conflicts of Interest
The authors declare no conflicts of interest.
References
- Shahalaei, M.; Azad, A.K.; Sulaiman, W.M.A.W.; Derakhshani, A.; Mofakham, E.B.; Mallandrich, M.; Kumarasamy, V.; Subramaniyan, V. A Review of Metallic Nanoparticles: Present Issues and Prospects Focused on the Preparation Methods, Characterization Techniques, and Their Theranostic Applications. Front Chem 2024, 12, 1398979. [Google Scholar] [CrossRef] [PubMed]
- Xu, J.J.; Zhang, W.C.; Guo, Y.W.; Chen, X.Y.; Zhang, Y.N. Metal Nanoparticles as a Promising Technology in Targeted Cancer Treatment. Drug Deliv 2022, 29, 664–678. [Google Scholar] [CrossRef] [PubMed]
- Andleeb, A.; Andleeb, A.; Asghar, S.; Zaman, G.; Tariq, M.; Mehmood, A.; Nadeem, M.; Hano, C.; Lorenzo, J.M.; Abbasi, B.H. A Systematic Review of Biosynthesized Metallic Nanoparticles as a Promising Anti-Cancer-Strategy. Cancers 2021, Vol. 13, Page 2818 2021, 13, 2818. [Google Scholar] [CrossRef] [PubMed]
- Soetaert, F.; Korangath, P.; Serantes, D.; Fiering, S.; Ivkov, R. Cancer Therapy with Iron Oxide Nanoparticles: Agents of Thermal and Immune Therapies. Adv Drug Deliv Rev 2020, 163–164, 65–83. [Google Scholar] [CrossRef] [PubMed]
- Saba, I.; Batoo, K.M.; Wani, K.; Verma, R.; Hameed, S. Exploration of Metal-Doped Iron Oxide Nanoparticles as an Antimicrobial Agent: A Comprehensive Review. Bin Abdulaziz Humanitarian City 2024. [Google Scholar] [CrossRef] [PubMed]
- Sahayaraj, R.; Enoch, K.; Pati, S.S.; Somasundaram, A.A. Cobalt Doped Fe3O4 Nanoparticles with Improved Magnetic Anisotropy and Enhanced Hyperthermic Efficiency. Ceram Int 2025, 51, 20786–20797. [Google Scholar] [CrossRef]
- Kashid, P.; Suresh, H.K.; Mathad, S.N.; Shedam, R.; Shedam, M.R. A Review on Synthesis, Properties and Applications on Cobalt Ferrite. Int. J. Adv. Sci. Eng 2022, 9, 2567. [Google Scholar] [CrossRef]
- Rauwel, E.; Al-Arag, S.; Salehi, H.; Amorim, C.O.; Cuisinier, F.; Guha, M.; Rosario, M.S.; Rauwel, P. Assessing Cobalt Metal Nanoparticles Uptake by Cancer Cells Using Live Raman Spectroscopy. Int J Nanomedicine 2020, 15, 7051–7062. [Google Scholar] [CrossRef] [PubMed]
- Bravo, M.; Yang, S.; Wen, D.; Krzyzowska, S.; Taemaitree, F.; Zaman, S.; Fortuni, B.; Rocha, S.; Mulvaney, P.; Uji-i, H.; et al. Neodymium-Doped Nanocrystals for Diffraction-Limited in Vitro Temperature Sensing. bioRxiv, 5795. [Google Scholar] [CrossRef]
- Batista, J.A.D.; de Oliveira, R.M.; Lima, C.H.M.; Lana, M.L.; dos Anjos, V.C.; Bell, M.J.V.; Rocha, M.S. Probing the Potential of Rare Earth Elements in the Development of New Anticancer Drugs: Single Molecule Studies. Beilstein Journal of Nanotechnology 16:15 2025, 16, 187–194. [Google Scholar] [CrossRef] [PubMed]
- Oprean, C.; Zambori, C.; Borcan, F.; Soica, C.; Zupko, I.; Minorics, R.; Bojin, F.; Ambrus, R.; Muntean, D.; Danciu, C.; et al. Anti-proliferative and antibacterial in vitro evaluation of the polyurethane nanostructures incorporating pentacyclic triterpenes. Pharm. Biol. 2016, 54, 2714–2722. [Google Scholar] [CrossRef] [PubMed]
- Munteanu, A.; Gogulescu, A.; Șoica, C.; Mioc, A.; Mioc, M.; Milan, A.; Lukinich-Gruia, A.T.; Pricop, M.A.; Jianu, C.; Banciu, C.; et al. In Vitro and In Silico Evaluation of Syzygium Aromaticum Essential Oil: Effects on Mitochondrial Function and Cytotoxic Potential Against Cancer Cells. Plants 2024, 13. [Google Scholar] [CrossRef] [PubMed]
- Milan, A.; Mioc, M.; Mioc, A.; Gogulescu, A.; Mardale, G.; Avram, Ștefana; Maksimović, T. ; Mara, B.; Șoica, C. Cytotoxic Potential of Betulinic Acid Fatty Esters and Their Liposomal Formulations: Targeting Breast, Colon, and Lung Cancer Cell Lines. Molecules 2024, Vol. 29, Page 3399 2024, 29, 3399. [Google Scholar] [CrossRef]
- Ansari, S.M.; Bhor, R.D.; Pai, K.R.; Mazumder, S.; Sen, D.; Kolekar, Y.D.; Ramana, C. V. Size and Chemistry Controlled Cobalt-Ferrite Nanoparticles and Their Anti-Proliferative Effect against the MCF-7 Breast Cancer Cells. ACS Biomater Sci Eng 2016, 2, 2139–2152. [Google Scholar] [CrossRef] [PubMed]
- de Oliveira Neto, J.G.; Viana, J.R.; Abreu, K.R.; Butarelli, A.L.A.; dos Santos, A.P.A.; Lage, M.R.; de Sousa, F.F.; Souto, E.B.; dos Santos, A.O. Antitumor Neodymium(III) Complex with 1,10-Phenanthroline and Nitrate Ligands: A Comprehensive Experimental-Theoretical Study, in Silico Pharmacokinetic and Cytotoxic Properties. J Mol Struct 2025, 1321, 139757. [Google Scholar] [CrossRef]
- Liu, H.; Zhou, B.; Zhao, C.; Zhang, D.; Wu, Q.; Li, Z. Synthesis and in Vitro Anticancer Properties of a Novel Neodymium(III) Complex Containing Tungstogermanate and 5-Fluorouracil. J Coord Chem 2018, 71, 2102–2108. [Google Scholar] [CrossRef]
- Muskan, A.; Kumar, N.; Singh, R.K.; Kumar, P.; Siddique, M.M.H. Rare Earth (Nd3+) Mediated Structural, Magnetic, Ferroelectric Properties of Cobalt Ferrite Nanomaterials for Its Varied Applications. Journal of the Indian Chemical Society 2024, 101, 101214. [Google Scholar] [CrossRef]
- Wang, Y. Structural, Magnetic, and Electrical Properties of Nd-Substituted Cobalt Ferrite. Journal of Materials Science: Materials in Electronics 2022, 33, 11017–11024. [Google Scholar] [CrossRef]
- Muskan, A.; Singh, R.K.; Kumar, N.; Kumar, P. ; Monalisa Analogous Behaviour of Nd3+ Rare Earth Substituted Tunned Structural, Stability, Magnetic and Ferroelectric Properties of CoFe2O4 Ferrite Nanomaterials for Its Multifunctional Application, Synthesized Using Green Approach. Journal of Materials Science: Materials in Electronics 2024, 35, 1–28. [Google Scholar] [CrossRef]
- Zhao, L.; Yang, H.; Zhao, X.; Yu, L.; Cui, Y.; Feng, S. Magnetic Properties of CoFe2O4 Ferrite Doped with Rare Earth Ion. Mater Lett 2006, 60, 1–6. [Google Scholar] [CrossRef]
- Ahmad, I.; Safdar, M.; Yasmin, N.; Iftikhar, A.; Kalsoom, A.; Khalid, S.; Shams, Z.E.; Mirza, M. Rare Earth Ions (La3+, Nd3+) Substituted Cobalt–Strontium Spinel Ferrites for Photocatalytic Degradation of Textile Dyes. Water Pract Technol 2023, 18, 1742–1755. [Google Scholar] [CrossRef]
- Wu, X.; Ding, Z.; Song, N.; Li, L.; Wang, W. Effect of the Rare-Earth Substitution on the Structural, Magnetic and Adsorption Properties in Cobalt Ferrite Nanoparticles. Ceram Int 2016, 42, 4246–4255. [Google Scholar] [CrossRef]
- Yunasfi, Y.; Mashadi, M.; Winatapura, D.S.; Setiawan, J.; Taryana, Y.; Gunanto, Y.E.; Adi, W.A. Enhanced Magnetic and Microwave Absorbing Properties of Nd3+ Ion Doped CoFe2O4 by Solid-State Reaction Method. Physica Status Solidi (A) Applications and Materials Science 2023, 220, 2200718. [Google Scholar] [CrossRef]
- Khan, N.U.H.; Gilani, Z.A.; Abid, M.; Samiullah; Hussain, G. ; Khalid, M.; Noor Huda Khan Asghar, H.M.; Nawaz, M.Z.; Ali, S.M.; Khan, M.A.; et al. Structural, Dielectric and Magnetic Characteristics of Praseodymium Doped Cobalt-Zinc Spinel Ferrites for Communication and Microwave Frequency Applications. Appl Phys A Mater Sci Process 2024, 130, 1–15. [Google Scholar] [CrossRef]
- Rotunjanu, S.; Racoviceanu, R.; Mioc, A.; Milan, A.; Negrea-Ghiulai, R.; Mioc, M.; Marangoci, N.L.; Şoica, C. Newly Synthesized CoFe2−xDyxO4 (x = 0; 0.1; 0.2; 0.4) Nanoparticles Reveal Promising Anticancer Activity against Melanoma (A375) and Breast Cancer (MCF-7) Cells. International Journal of Molecular Sciences 2023, Vol. 24, Page 15733 2023, 24, 15733. [Google Scholar] [CrossRef]
- Heiba, Z.K.; Bakr Mohamed, M.; Arda, L.; Dogan, N. Cation Distribution Correlated with Magnetic Properties of Nanocrystalline Gadolinium Substituted Nickel Ferrite. J Magn Magn Mater 2015, 391, 195–202. [Google Scholar] [CrossRef]
- Sarkar, T.; Banerjee, S.; Mukherjee, S.; Hussain, A. Mitochondrial Selectivity and Remarkable Photocytotoxicity of a Ferrocenyl Neodymium(III) Complex of Terpyridine and Curcumin in Cancer Cells. Dalton Transactions 2016, 45, 6424–6438. [Google Scholar] [CrossRef] [PubMed]
- Sundrarajan, M.; Muthulakshmi, V. Green Synthesis of Ionic Liquid Mediated Neodymium Oxide Nanoparticles by Andrographis Paniculata Leaves Extract for Effective Bio-Medical Applications. J Environ Chem Eng 2021, 9, 104716. [Google Scholar] [CrossRef]
- Alexander, A.; Sumohan Pillai, A.; Manikantan, V.; Sri Varalakshmi, G.; Allben Akash, B.; Enoch, I.V.M.V. Magnetic and Luminescent Neodymium-Doped Carbon Dot–Cyclodextrin Polymer Nanocomposite as an Anticancer Drug-Carrier. Mater Lett 2022, 313, 131830. [Google Scholar] [CrossRef]
- Bheeram, V.R.; Dadhich, A.S.; Nagumantri, R.; Rentala, S.; Saha, A.; Mukkamala, S.B. Gamma Ray Enhanced Vis-NIR Photoluminescence and Cytotoxicity of Biocompatible Silica Coated Nd3+ Doped GdPO4 Nanophosphors. Nucl Instrum Methods Phys Res B 2019, 440, 11–18. [Google Scholar] [CrossRef]
- Ahmad, J.; Wahab, R.; Siddiqui, M.A.; Farshori, N.N.; Saquib, Q.; Ahmad, N.; Al-Khedhairy, A.A. Neodymium Oxide Nanostructures and Their Cytotoxic Evaluation in Human Cancer Cells. Journal of Trace Elements in Medicine and Biology 2022, 73, 127029. [Google Scholar] [CrossRef] [PubMed]
- Ghanbari, M.; Davar, F.; Shalan, A.E. Effect of Rosemary Extract on the Microstructure, Phase Evolution, and Magnetic Behavior of Cobalt Ferrite Nanoparticles and Its Application on Anti-Cancer Drug Delivery. Ceram Int 2021, 47, 9409–9417. [Google Scholar] [CrossRef]
- Wilson, V.G. Growth and Differentiation of HaCaT Keratinocytes. 2013, 33–41. [CrossRef]
- Munteanu, A.; Gogulescu, A.; Șoica, C.; Mioc, A.; Mioc, M.; Milan, A.; Lukinich-Gruia, A.T.; Pricop, M.A.; Jianu, C.; Banciu, C.; et al. In Vitro and In Silico Evaluation of Syzygium Aromaticum Essential Oil: Effects on Mitochondrial Function and Cytotoxic Potential Against Cancer Cells. Plants 2024, Vol. 13, Page 3443 2024, 13, 3443. [Google Scholar] [CrossRef] [PubMed]
- Povea-Cabello, S.; Oropesa-Ávila, M.; de la Cruz-Ojeda, P.; Villanueva-Paz, M.; De La Mata, M.; Suárez-Rivero, J.M.; Álvarez-Córdoba, M.; Villalón-García, I.; Cotán, D.; Ybot-González, P.; et al. Dynamic Reorganization of the Cytoskeleton during Apoptosis: The Two Coffins Hypothesis. International Journal of Molecular Sciences 2017, Vol. 18, Page 2393 2017, 18, 2393. [Google Scholar] [CrossRef] [PubMed]
- Leng, J.; Wang, N.; Chang, X.; Zhang, X.; Xu, J.; Yang, Z.; Qian, K.; Zheng, Z.; Tao, G.; Jia, X.; et al. Neodymium Nitrate Promotes the Apoptosis of Mouse Liver Cells via Bcl2l1/Caspase 3 Pathway. Toxicol Mech Methods 2025, 1–36. [Google Scholar] [CrossRef]
- Lee, K.H.; Jun, S.; Hur, H.S.; Ryu, J.J.; Kim, J. Candida Albicans Protein Analysis during Hyphal Differentiation Using an Integrative HA-Tagging Method. Biochem Biophys Res Commun 2005, 337, 784–790. [Google Scholar] [CrossRef] [PubMed]
- Abudayyak, M.; Altincekic Gurkaynak, T.; Özhan, G. In Vitro Toxicological Assessment of Cobalt Ferrite Nanoparticles in Several Mammalian Cell Types. Biol Trace Elem Res 2017, 175, 458–465. [Google Scholar] [CrossRef] [PubMed]
- Kumar, P.; Nagarajan, A.; Uchil, P.D. Analysis of Cell Viability by the Lactate Dehydrogenase Assay. Cold Spring Harb Protoc 2018, 2018, pdb.prot095497. [Google Scholar] [CrossRef] [PubMed]
- Akhtar, M.J.; Ahamed, M.; Alhadlaq, H. Cobalt-Based Nanoparticles Strongly Diminish CalceinAM Fluorescence Independently of Their Cytotoxic Potential in Human Lung Cell Line. J King Saud Univ Sci 2024, 36, 102987. [Google Scholar] [CrossRef]
Figure 1.
XRD spectra of the samples.
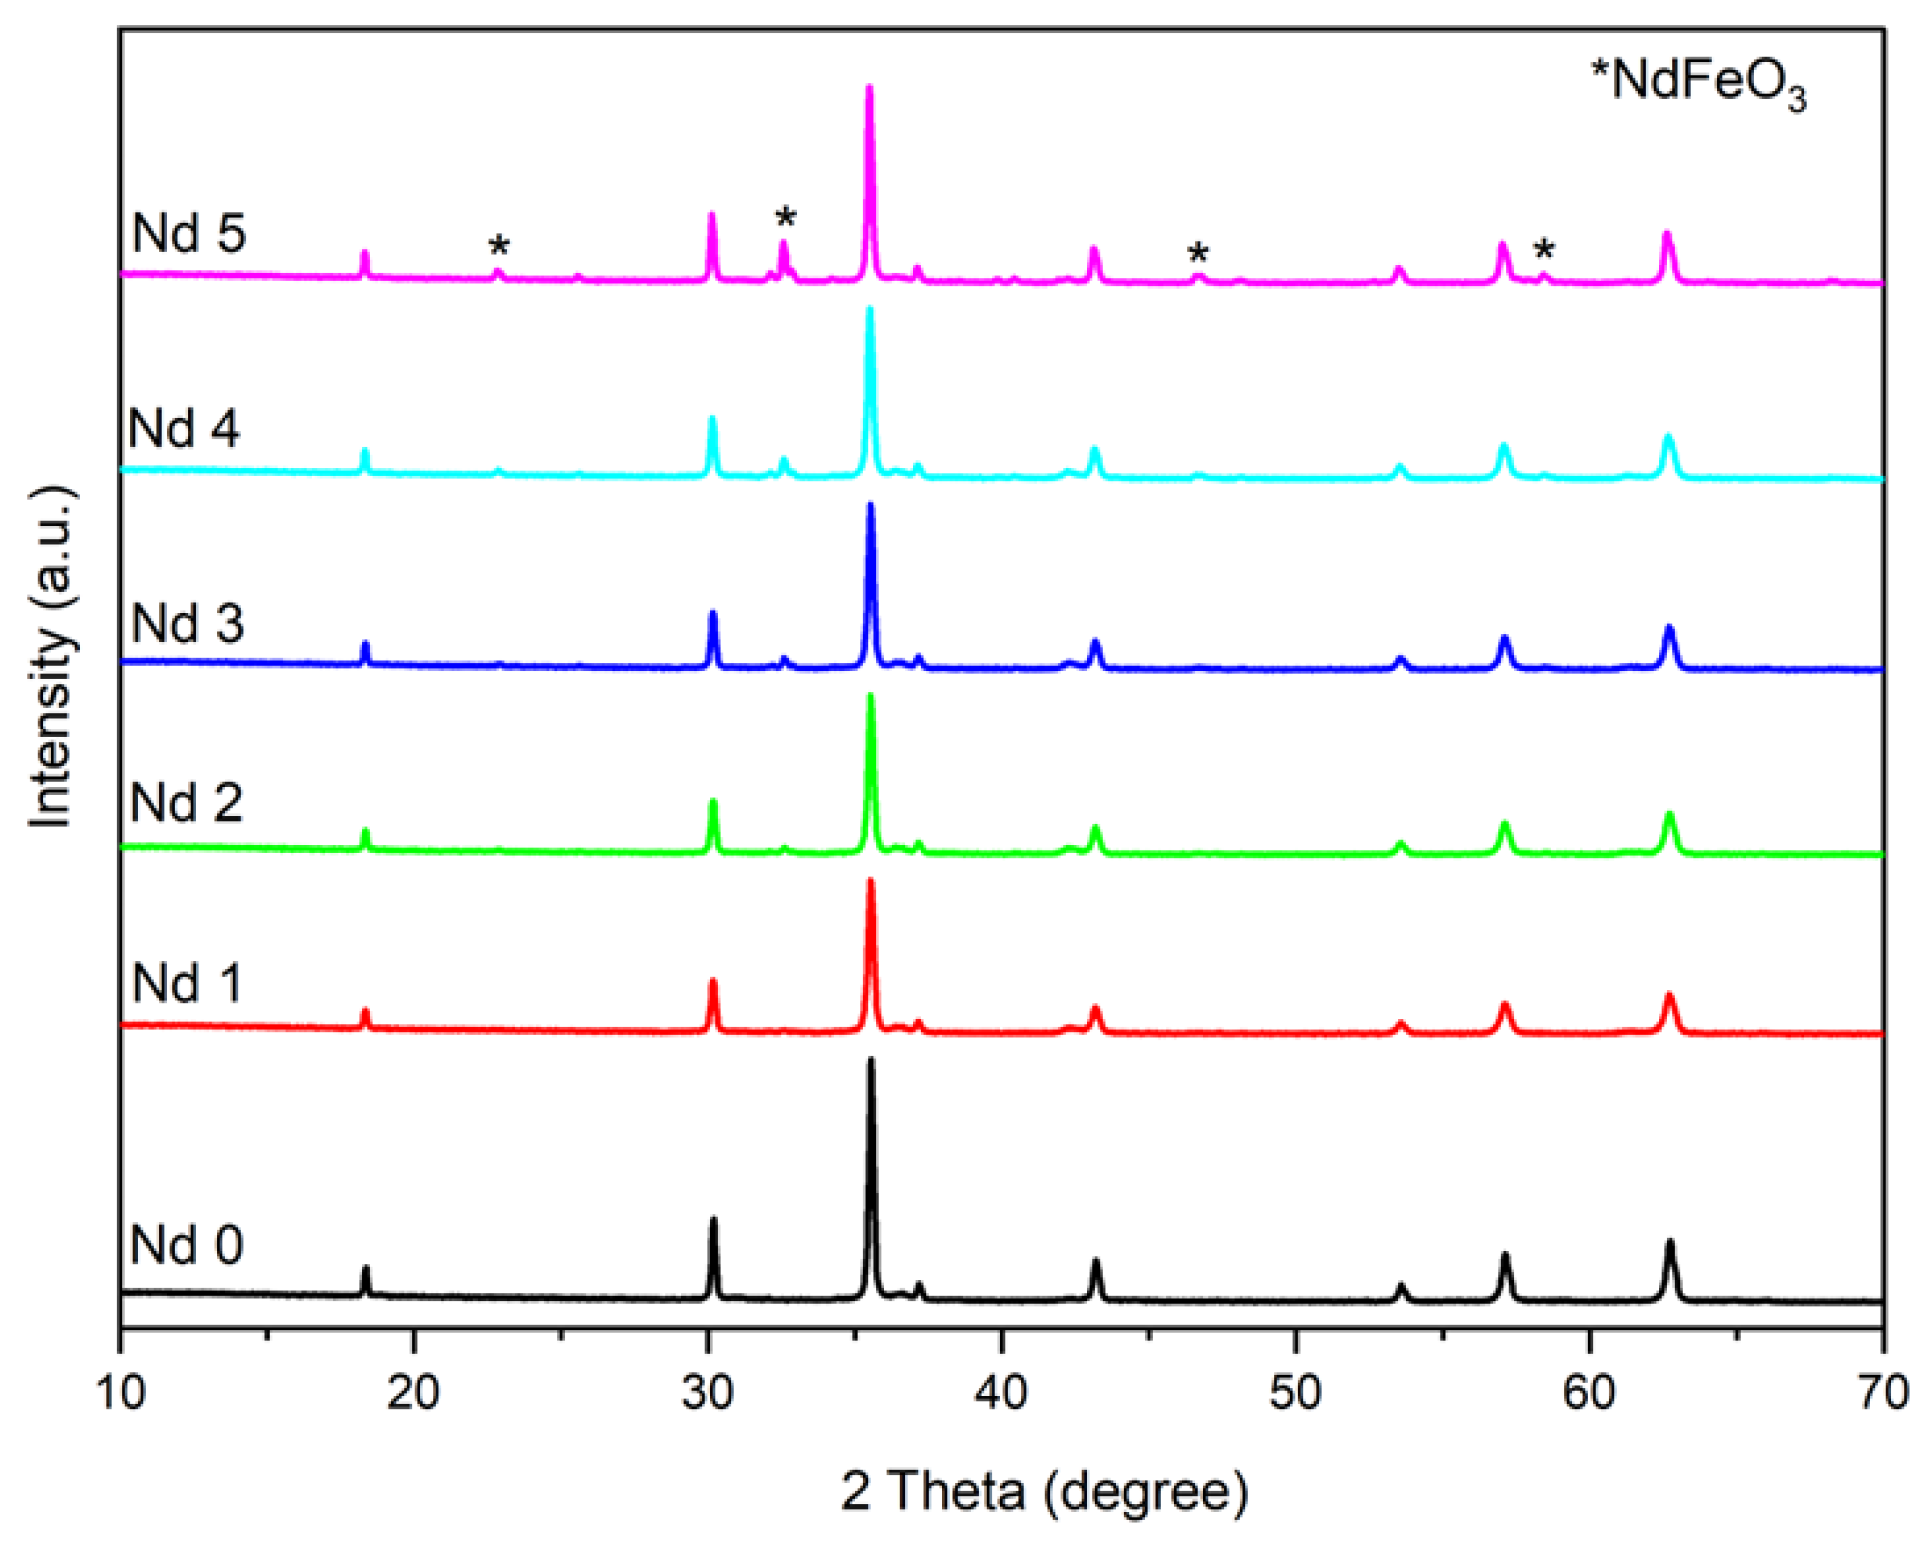
Figure 2.
FTIR spectra of the samples.
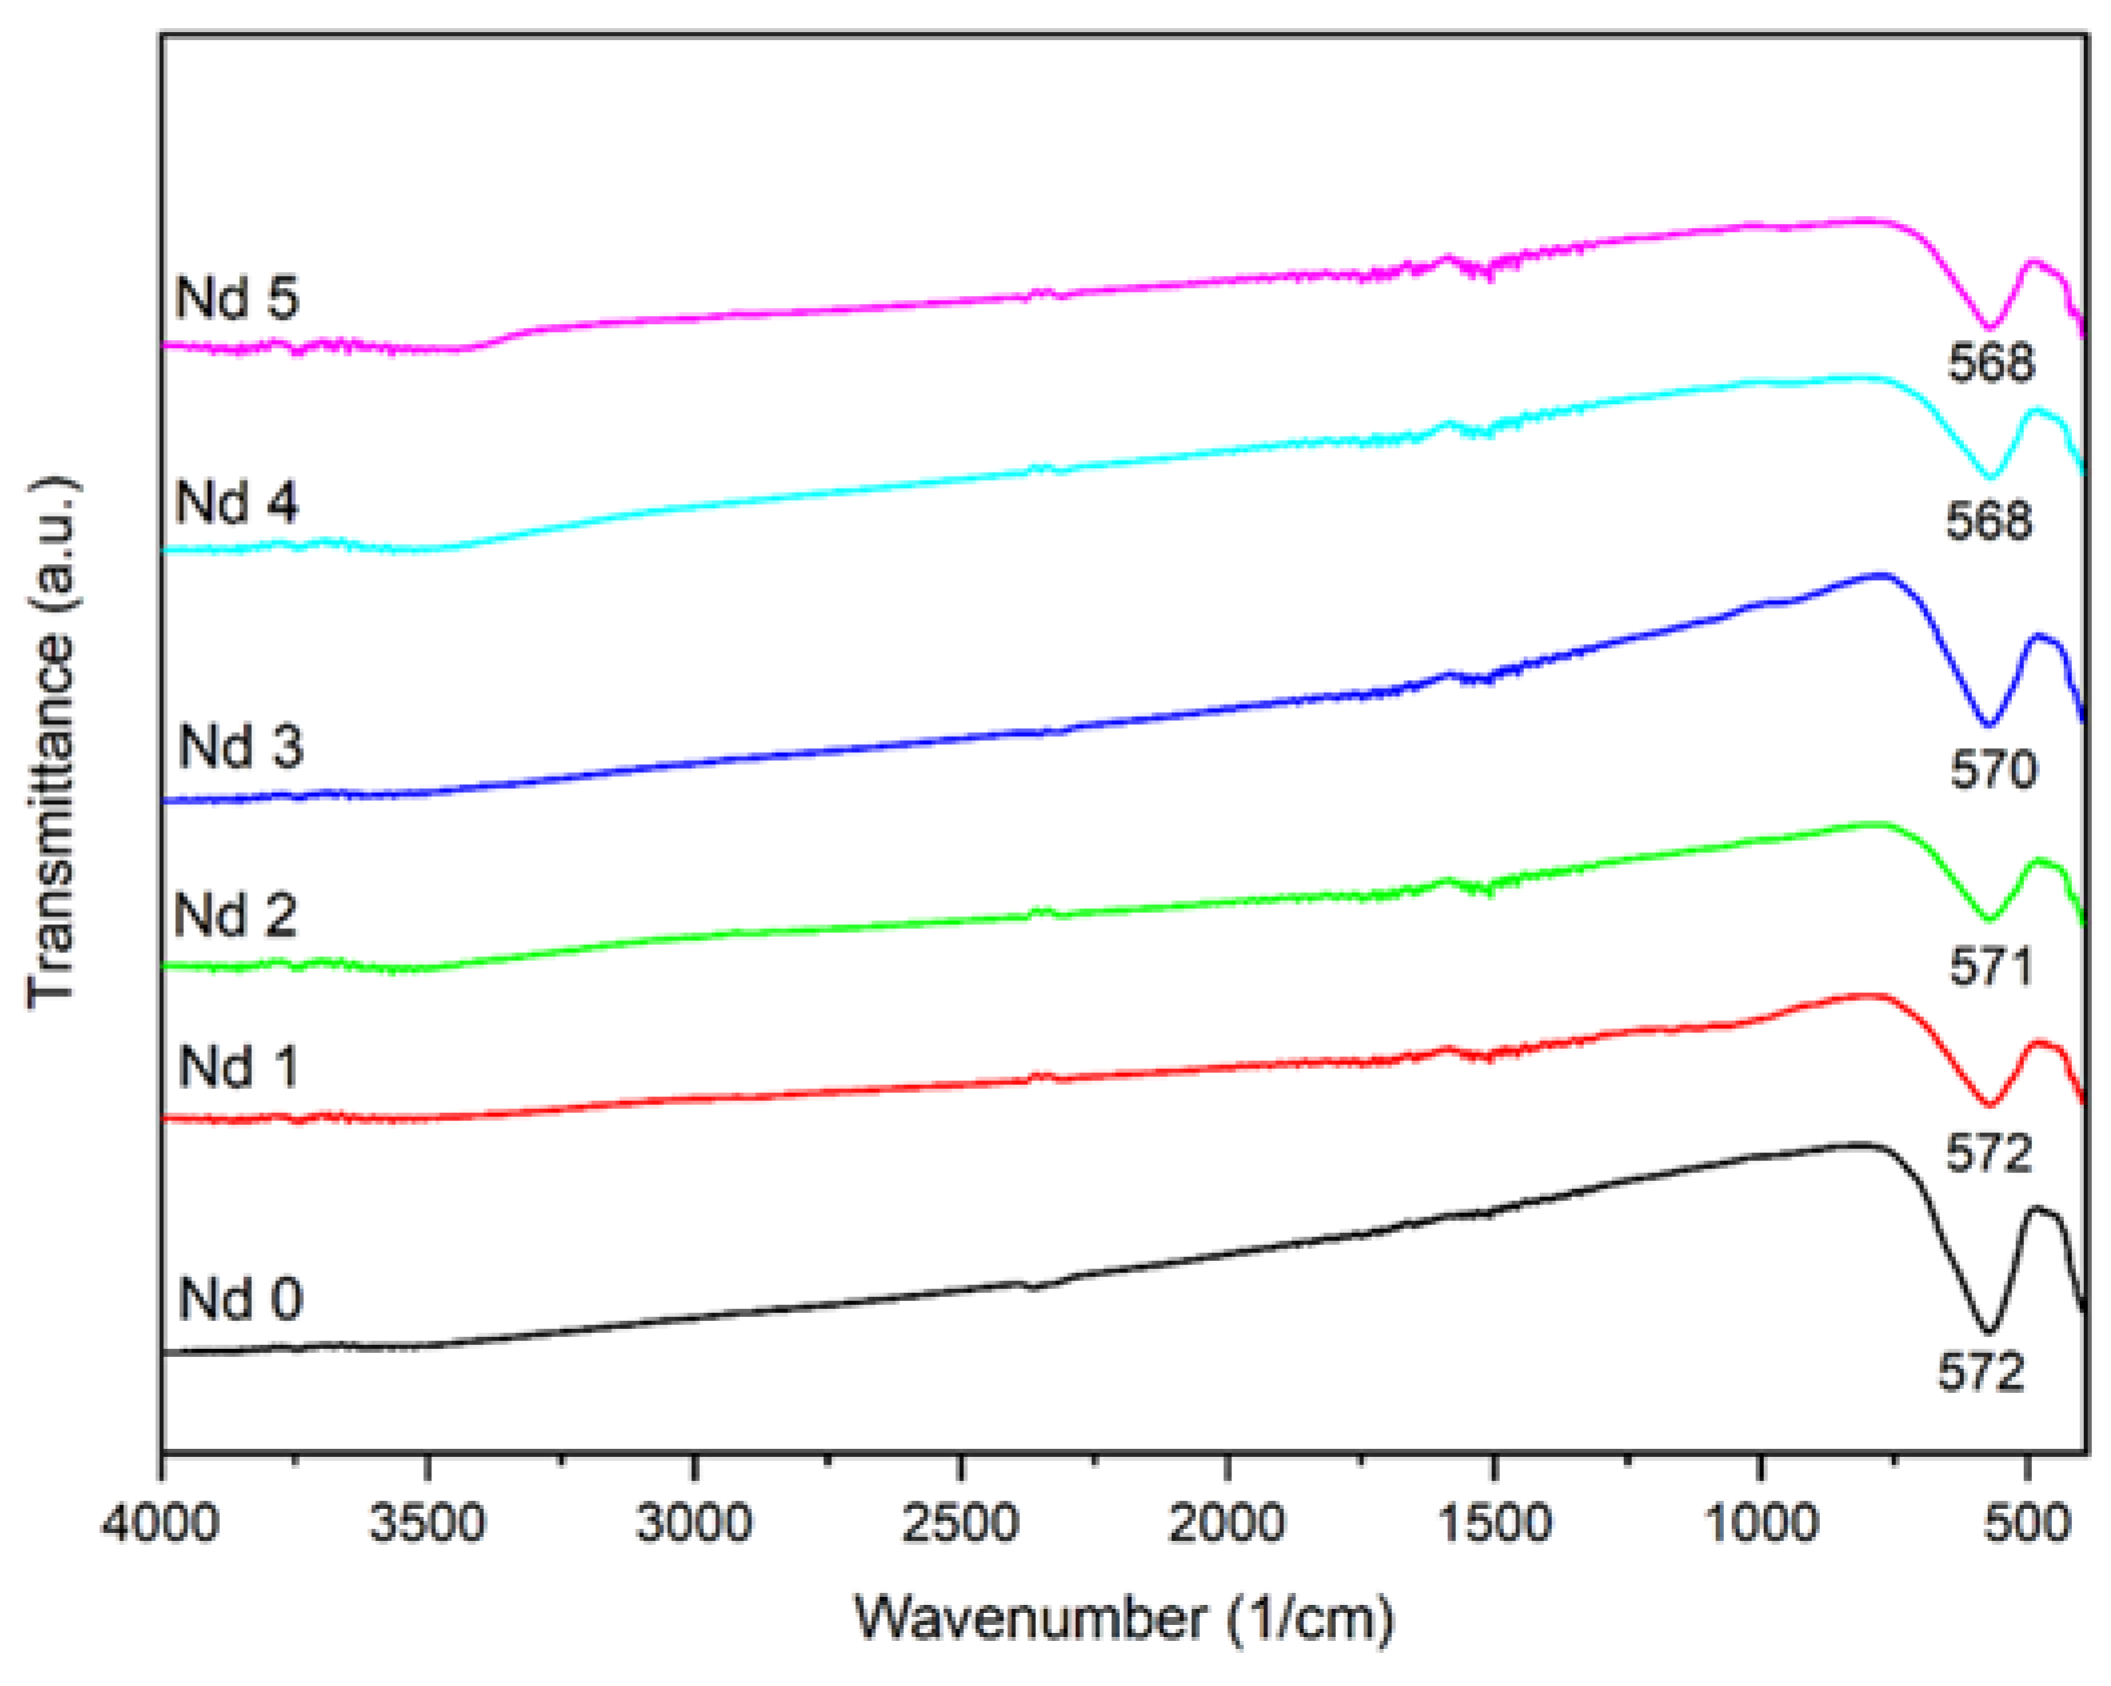
Figure 3.
Magnetic hysteresis of samples.
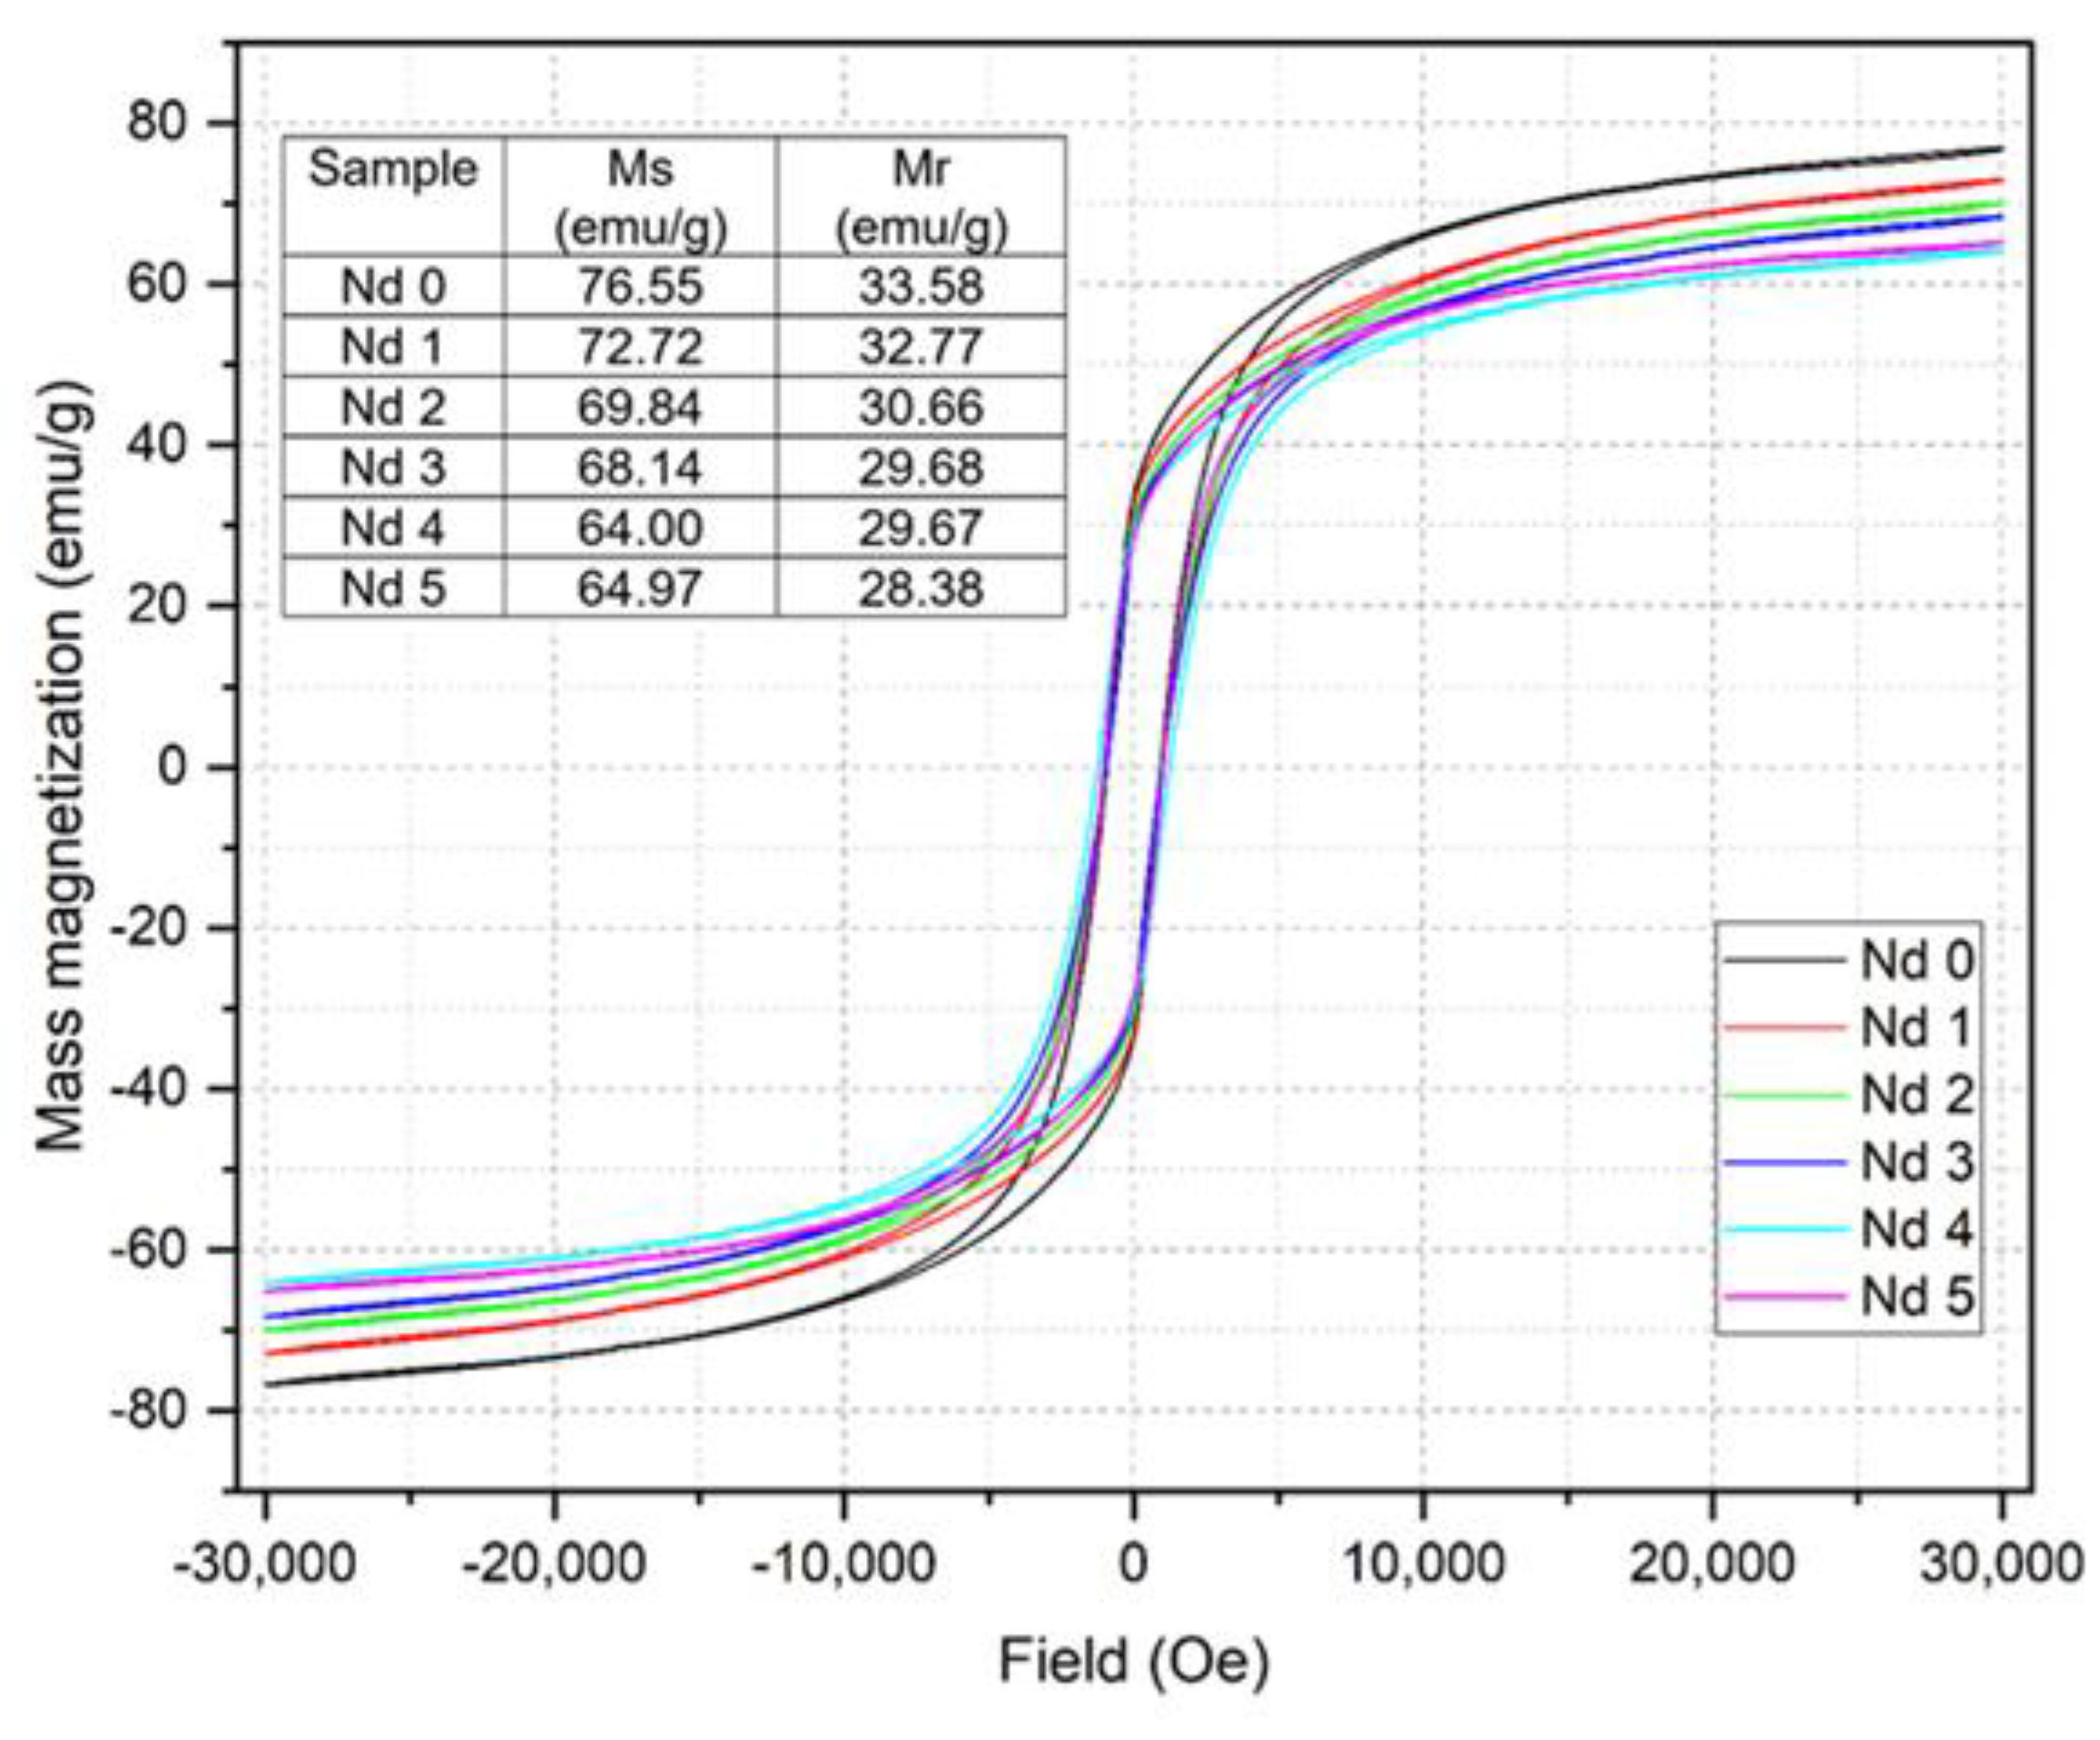
Figure 4.
STEM images for samples Nd0 – Nd5.
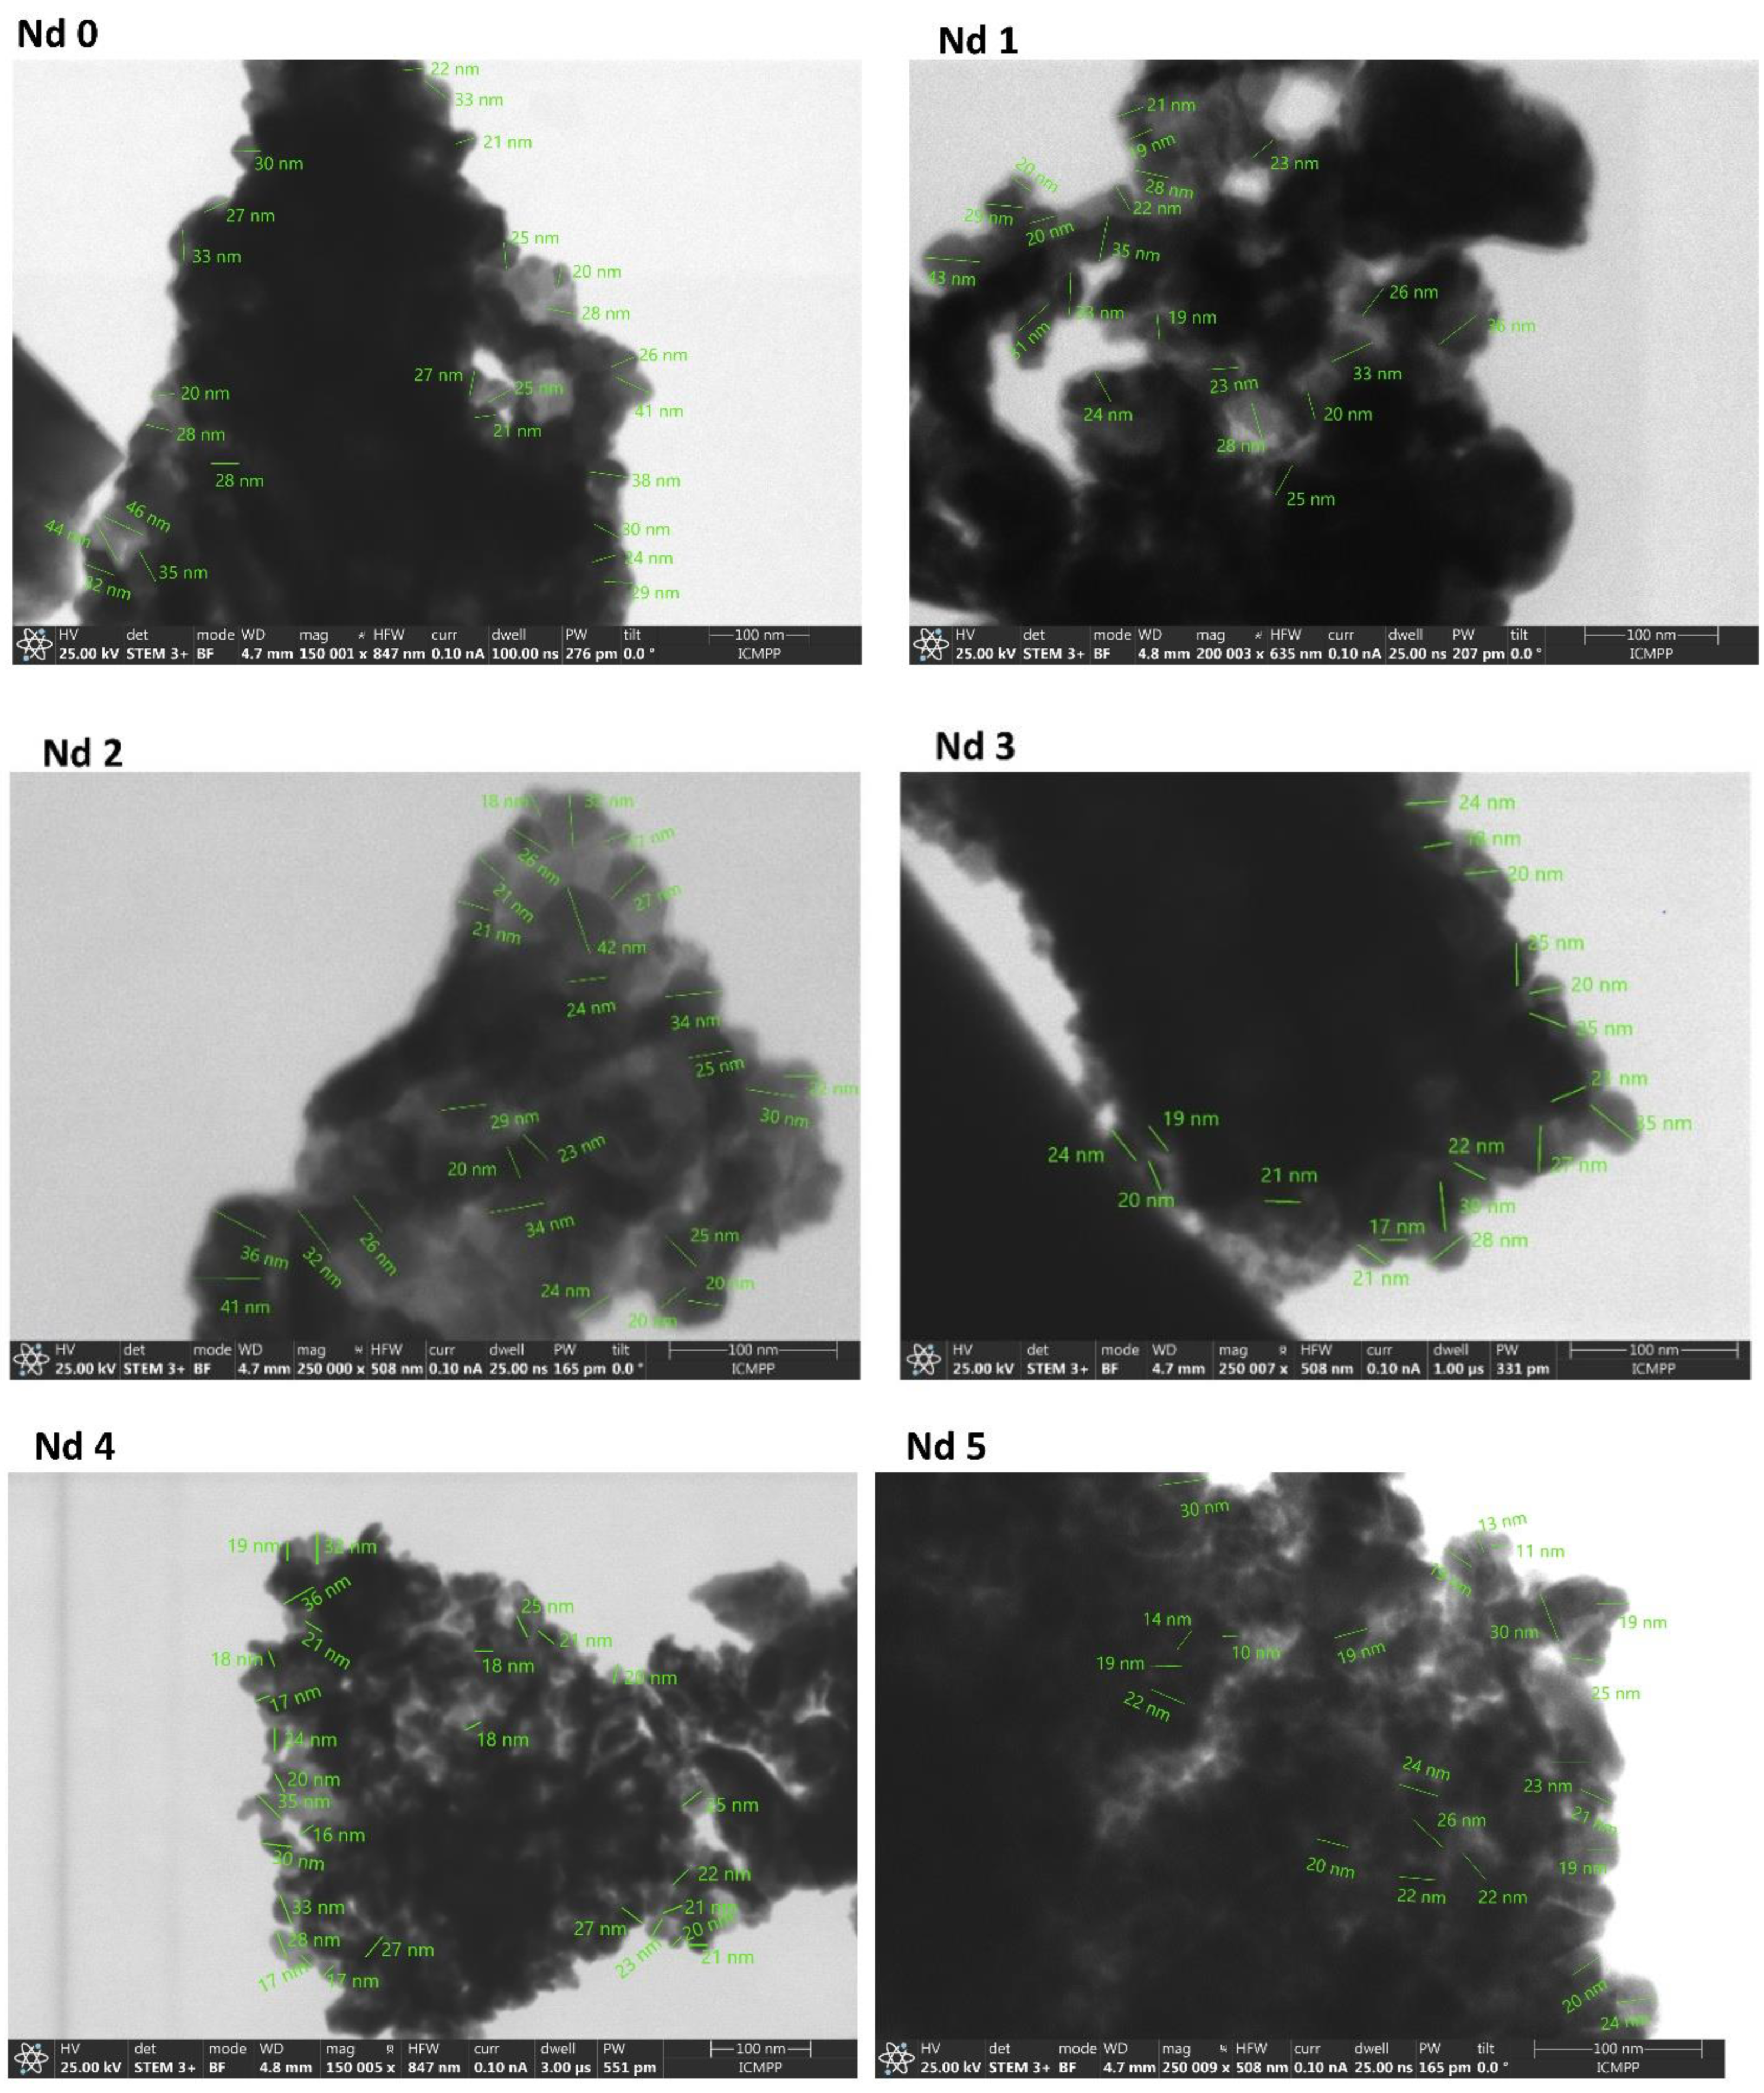
Figure 6.
The viability of HaCaT cells treated for 48h with Nd0, Nd1 and Nd2 (A) and with Nd3, Nd4 and Nd5 (B) at five concentrations (50, 100, 250, 500 and 1000 μg/mL). These results are presented as cell viability % normalized to control (100%, cells without treatment) and represent mean values ± SD of three independent experiments performed in triplicate. (* p < 0.05, ** p < 0.01 and *** p < 0.001).
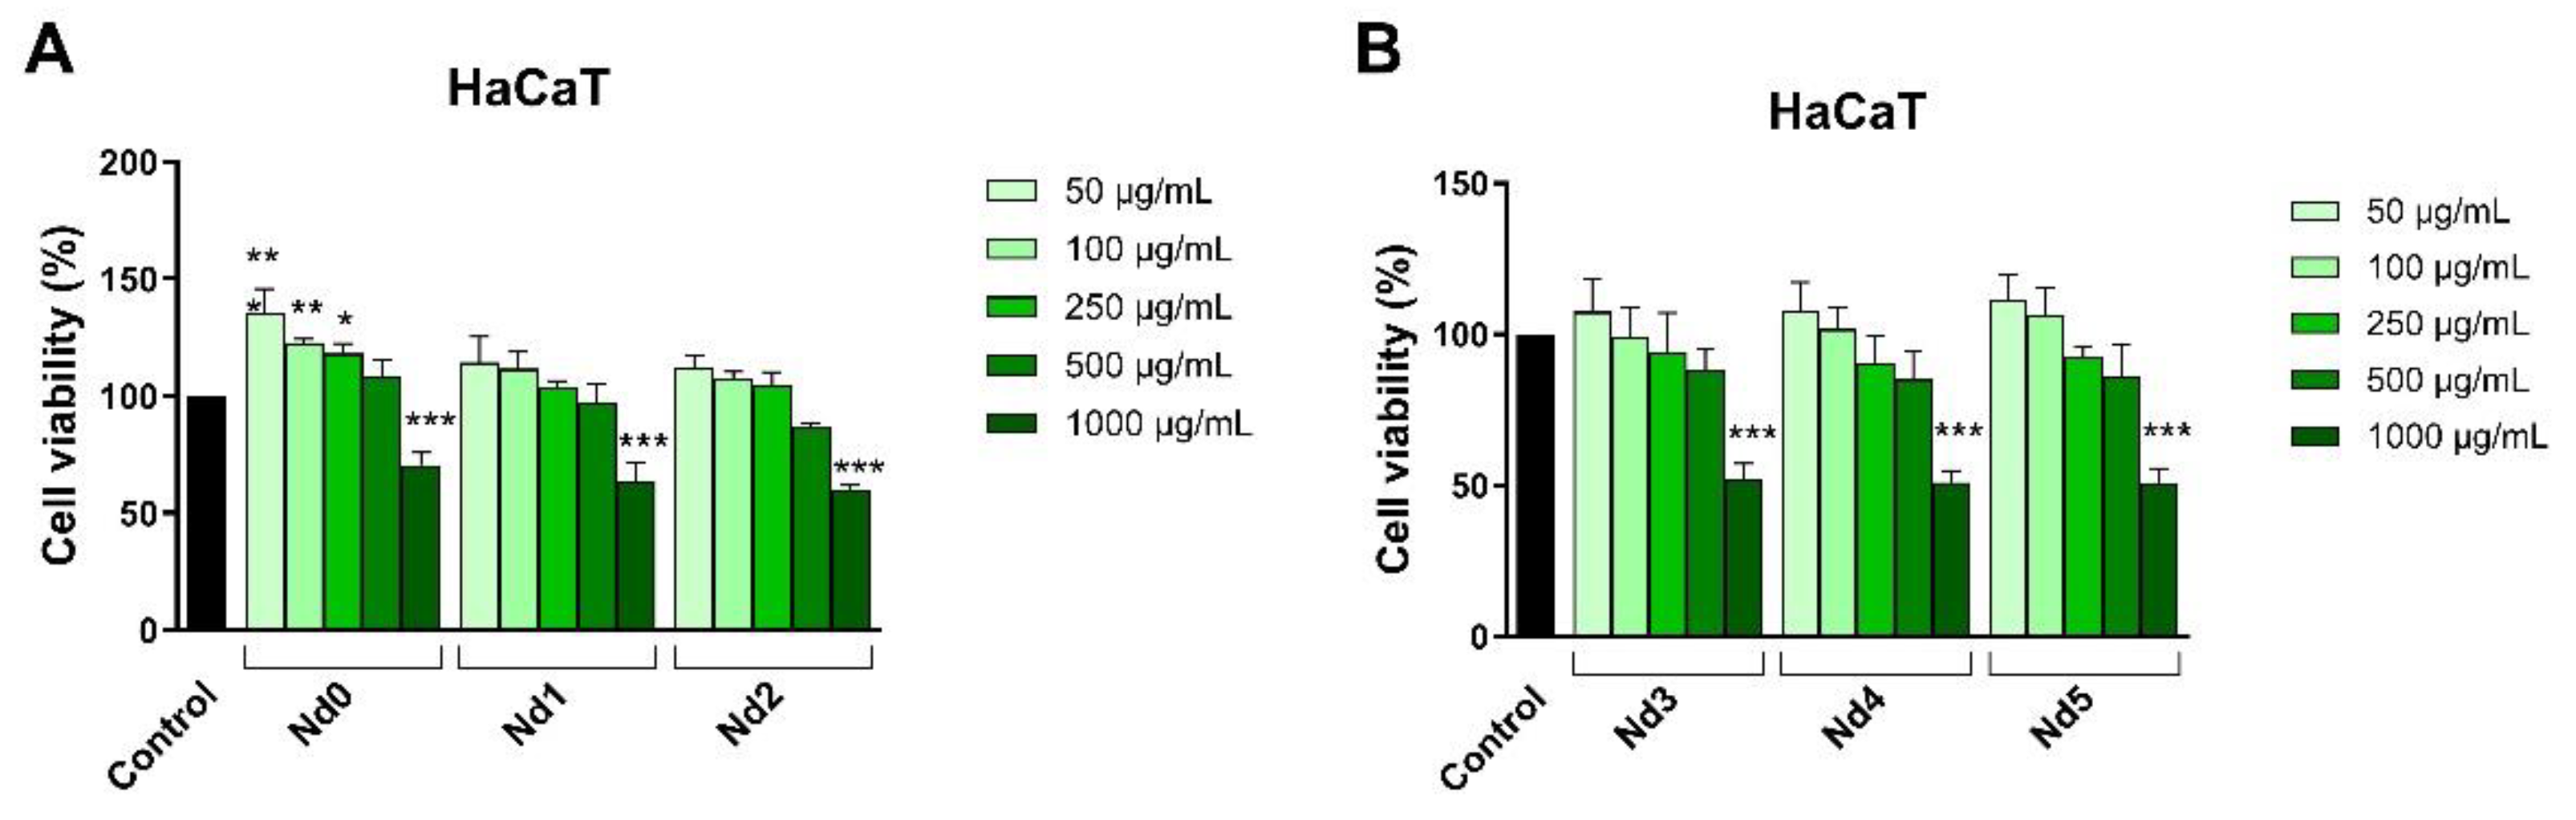
Figure 7.
The viability of A375 cancer cells treated for 48h with Nd0, Nd1 and Nd2 (A) and with Nd3, Nd4 and Nd5 (B) at five concentrations (50, 100, 250, 500 and 1000 μg/mL). These results are presented as cell viability % normalized to control (100%, cells without treatment) and represent mean values ± SD of three independent experiments performed in triplicate. (** p < 0.01 and *** p < 0.001).
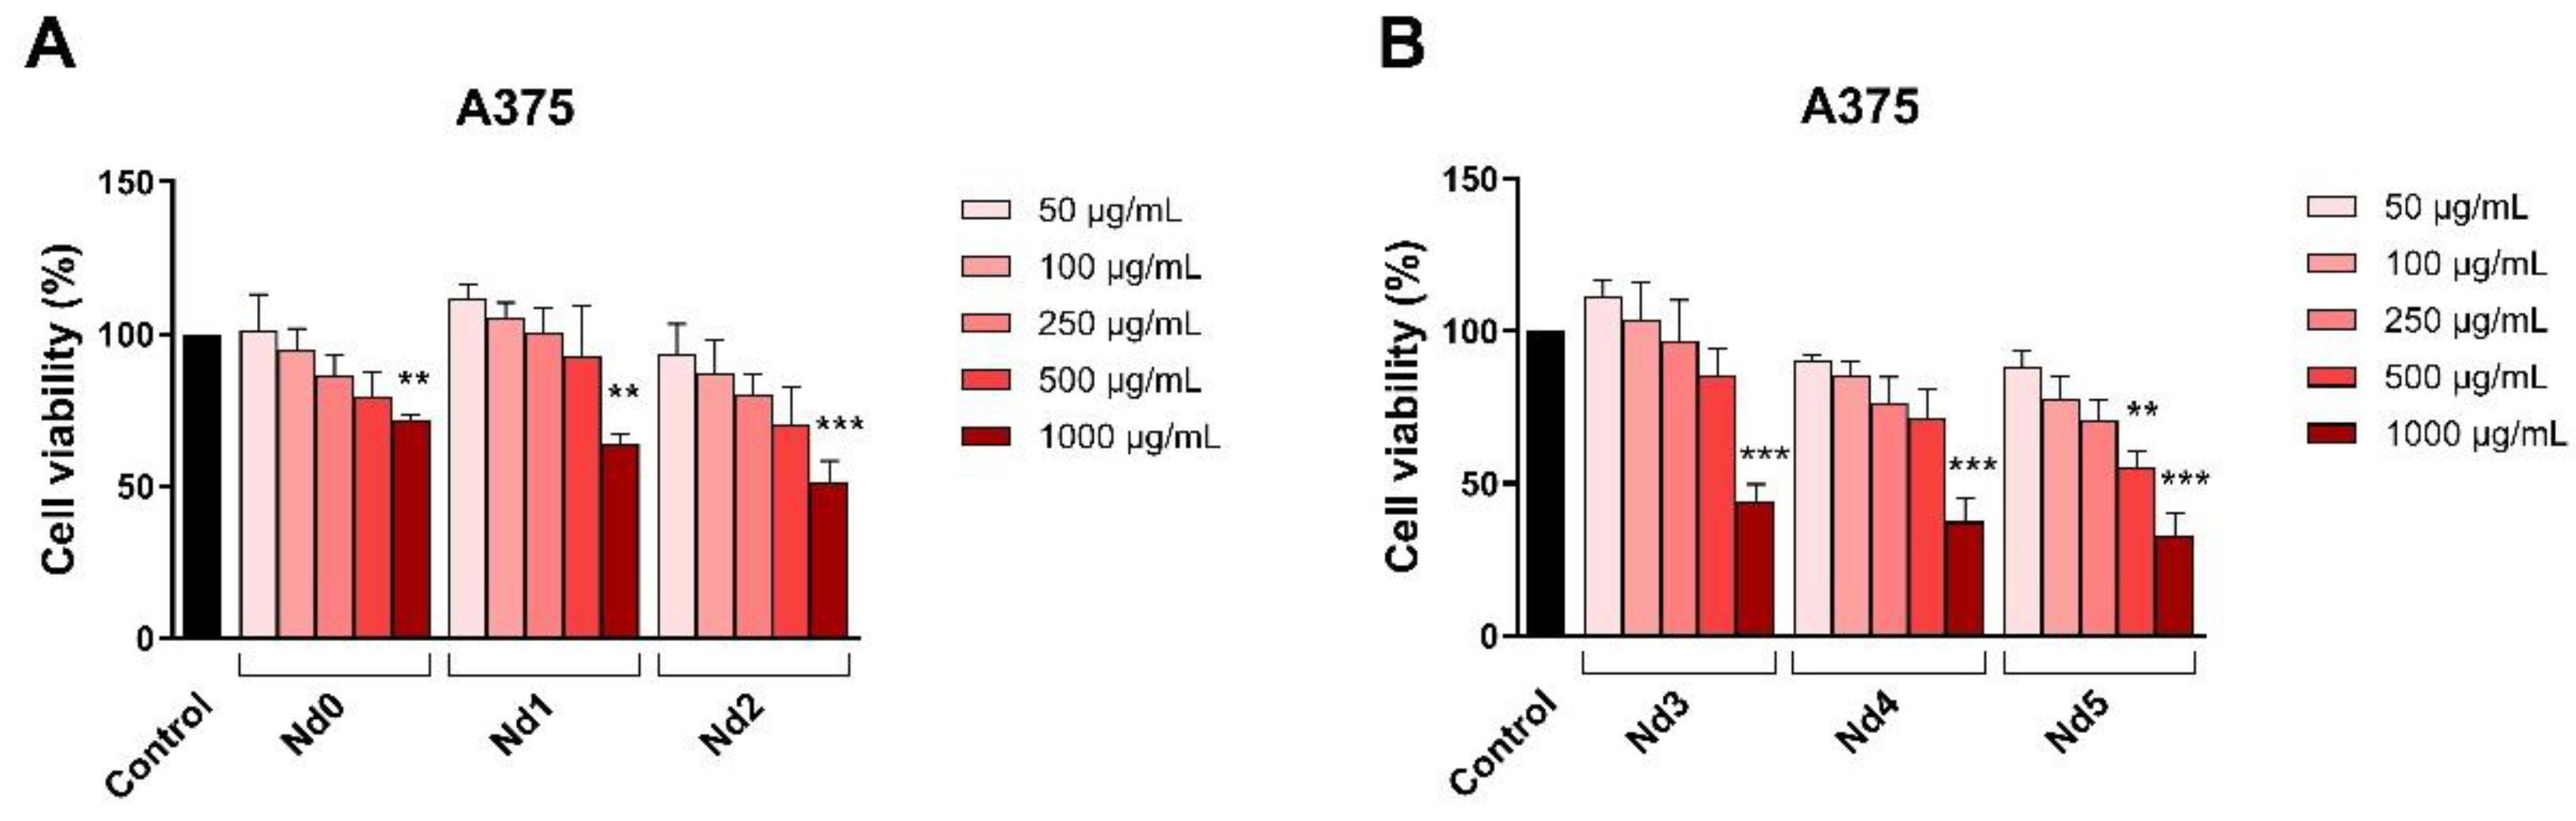
Figure 8.
The viability of MCF-7 cancer cells treated for 48h with Nd0, Nd1 and Nd2 (A) and with Nd3, Nd4 and Nd5 (B) at five concentrations (50, 100, 250, 500 and 1000 μg/mL). These results are presented as cell viability % normalized to control (100%, cells without treatment) and represent mean values ± SD of three independent experiments performed in triplicate. (* p < 0.05, ** p < 0.01 and *** p < 0.001).
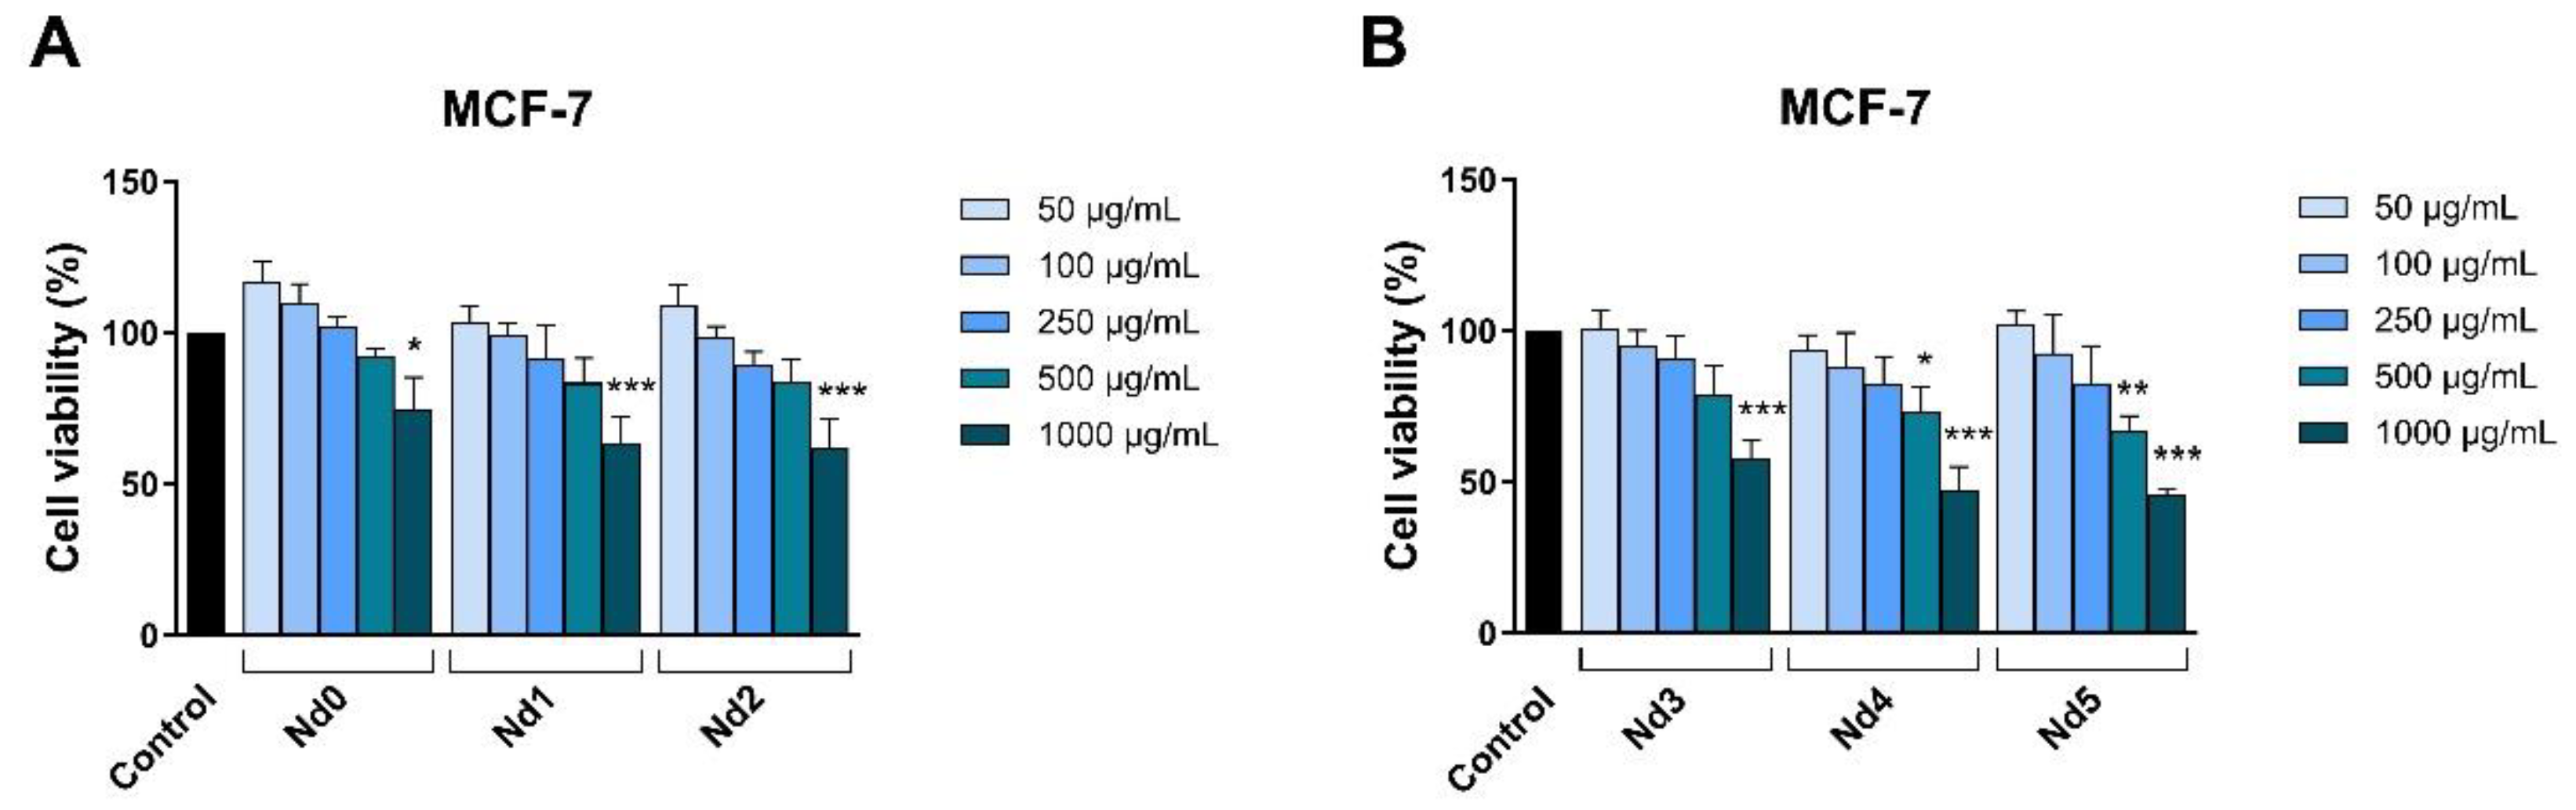
Figure 9.
The viability of PANC-1 cancer cells treated for 48h with Nd0, Nd1 and Nd2 (A) and with Nd3, Nd4 and Nd5 (B) at five concentrations (50, 100, 250, 500 and 1000 μg/mL). These results are presented as cell viability % normalized to control (100%, cells without treatment) and represent mean values ± SD of three independent experiments performed in triplicate. (* p < 0.05, ** p < 0.01 and *** p < 0.001).
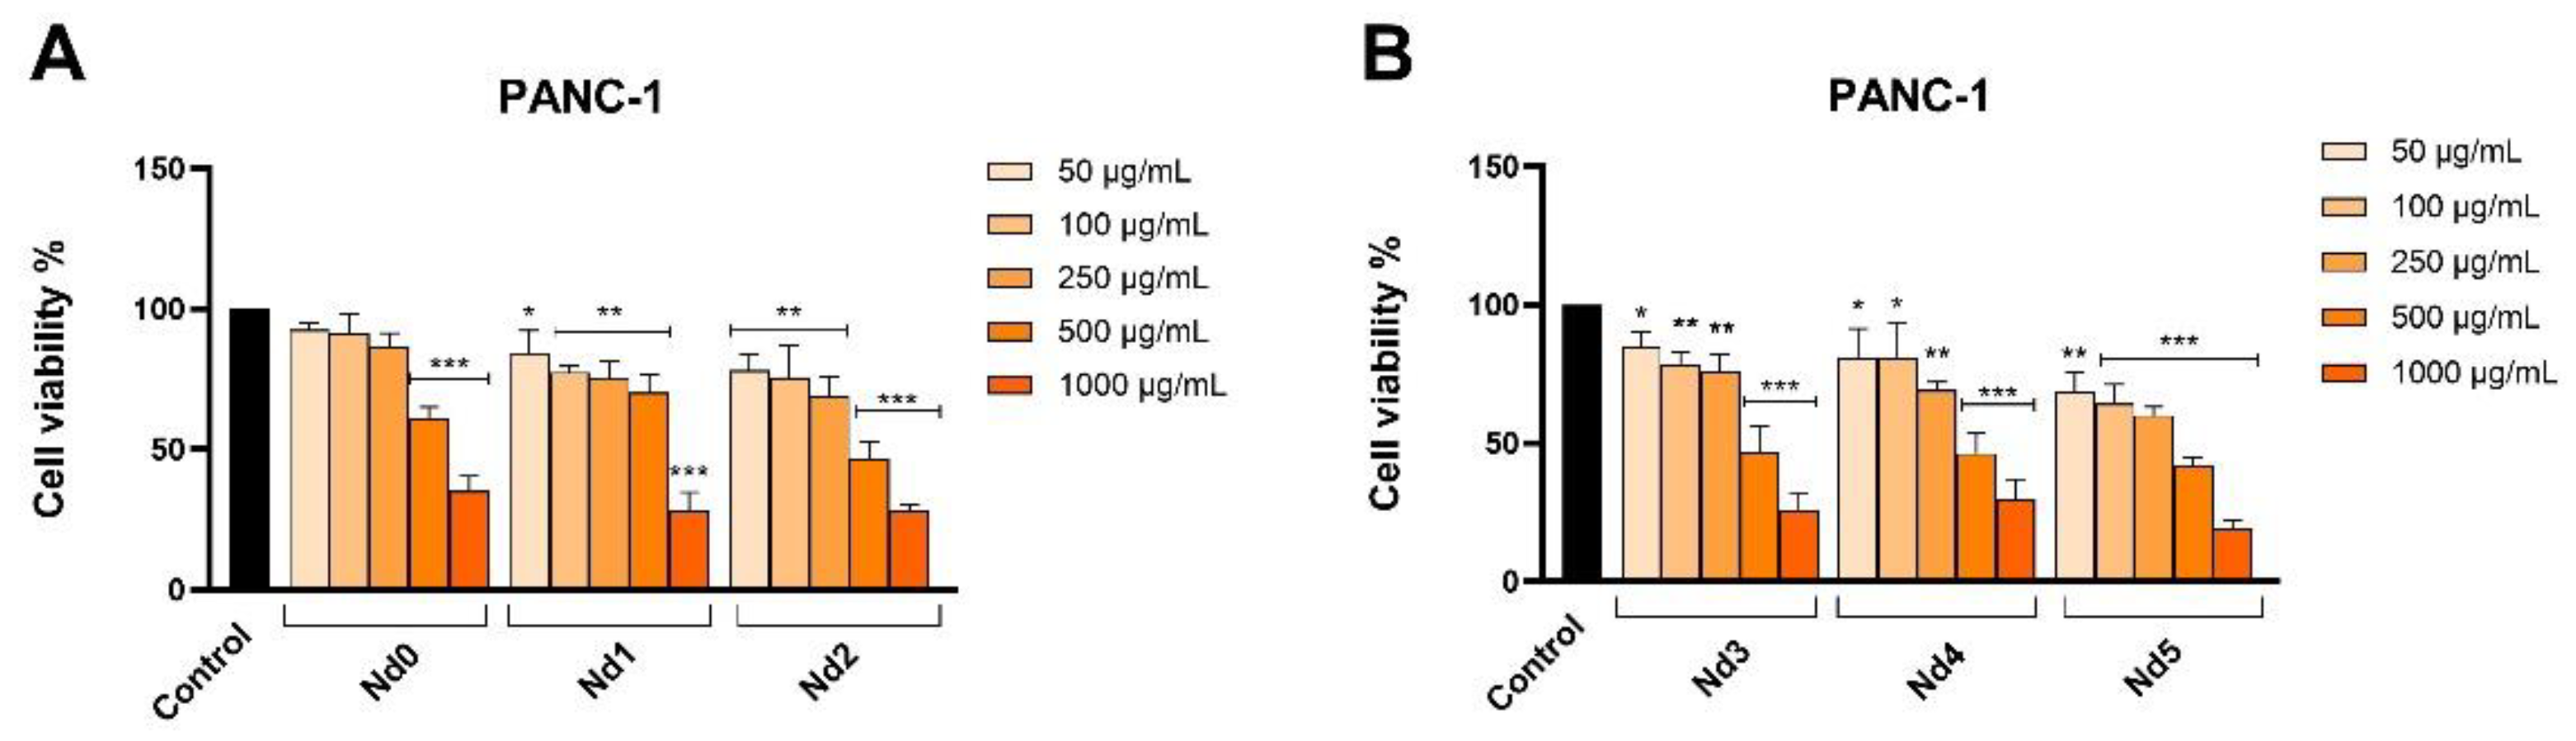
Figure 10.
Lactate dehydrogenase (LDH) release percentages in A375 cancer cells after 48h treatment with Nd0, Nd1 and Nd2 (A) and after treatment with Nd3, Nd4 and Nd5 (B) at five concentrations (50, 100, 250, 500 and 1000 μg/mL). These results are presented as LDH Release (%) and represent mean values ± SD of three independent experiments performed in triplicate. (* p < 0.05, ** p < 0.001 and *** p < 0.001).
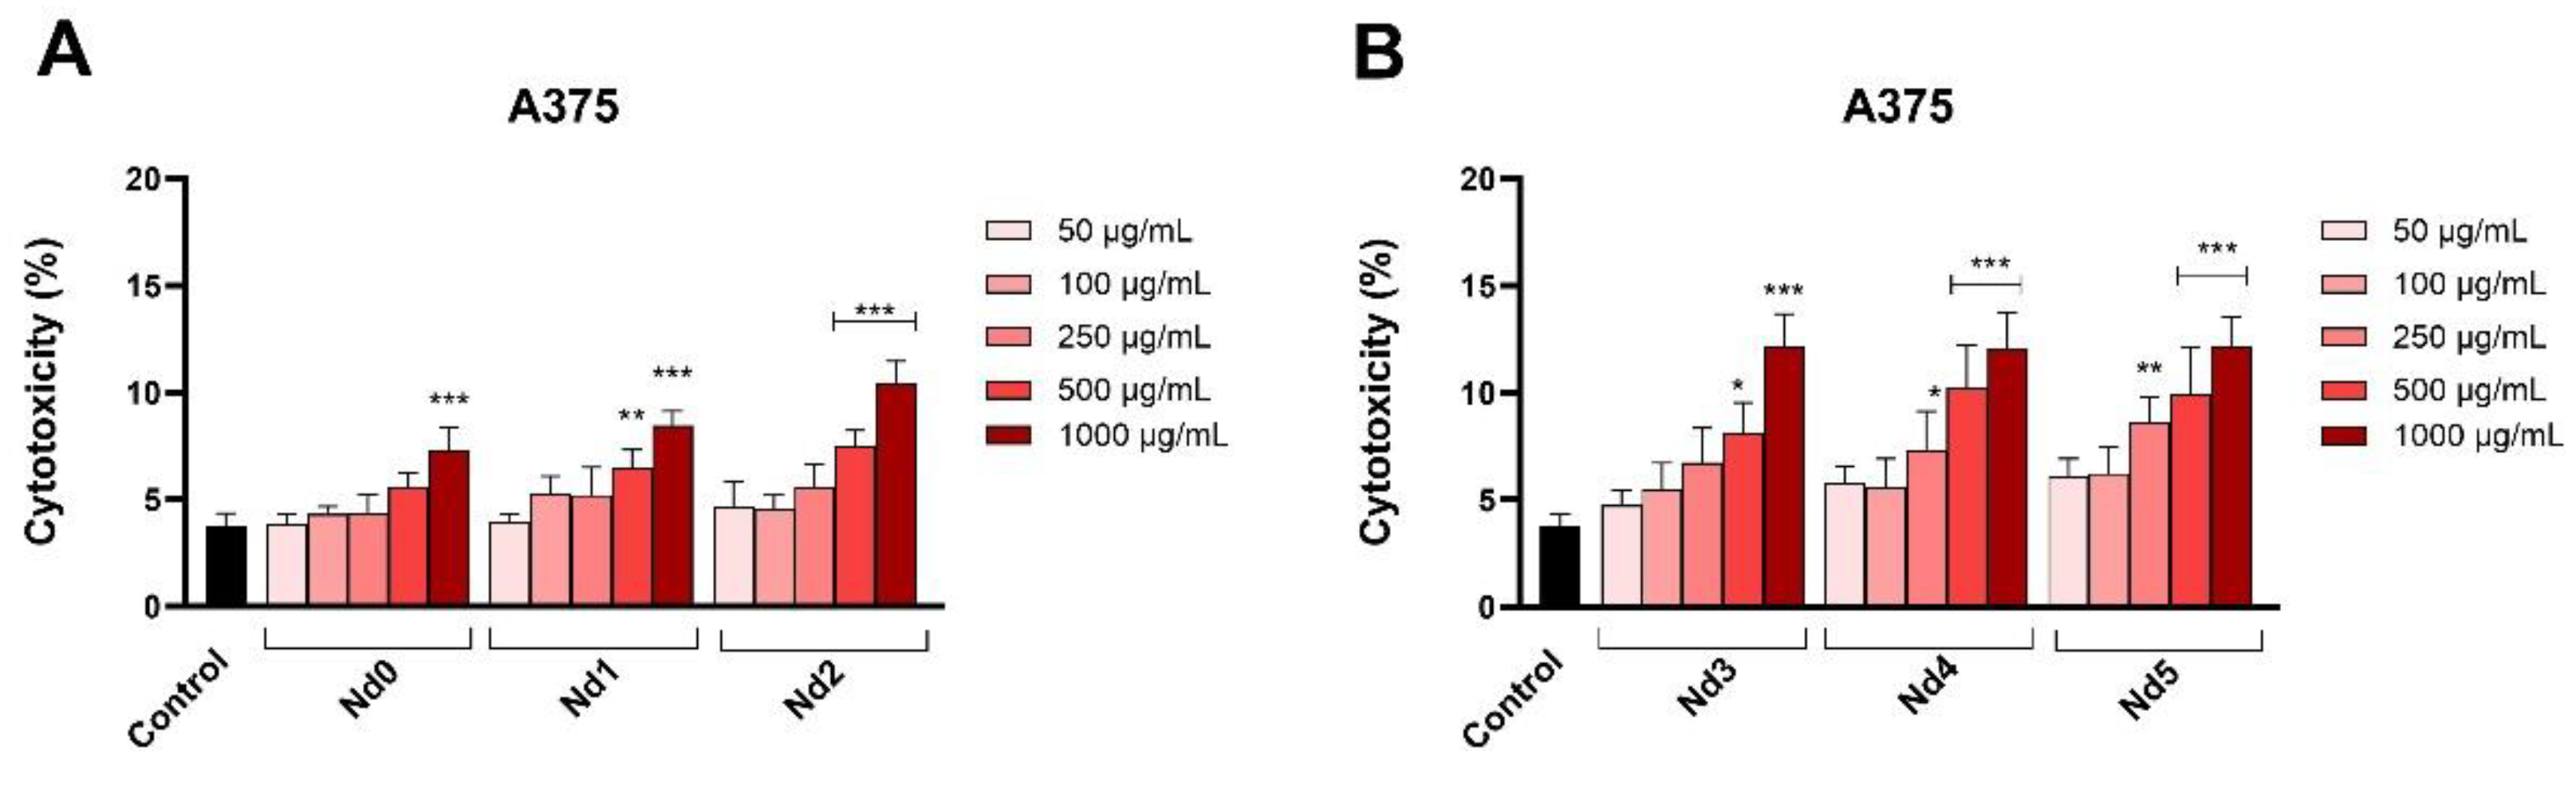
Figure 11.
Lactate dehydrogenase (LDH) release percentages in MCF-7 cancer cells after 48h treatment with Nd0, Nd1 and Nd2 (A) and after treatment with Nd3, Nd4 and Nd5 (B) at five concentrations (50, 100, 250, 500 and 1000 μg/mL). These results are presented as LDH Release (%) and represent mean values ± SD of three independent experiments performed in triplicate. (* p < 0.05, ** p < 0.001 and *** p < 0.001).
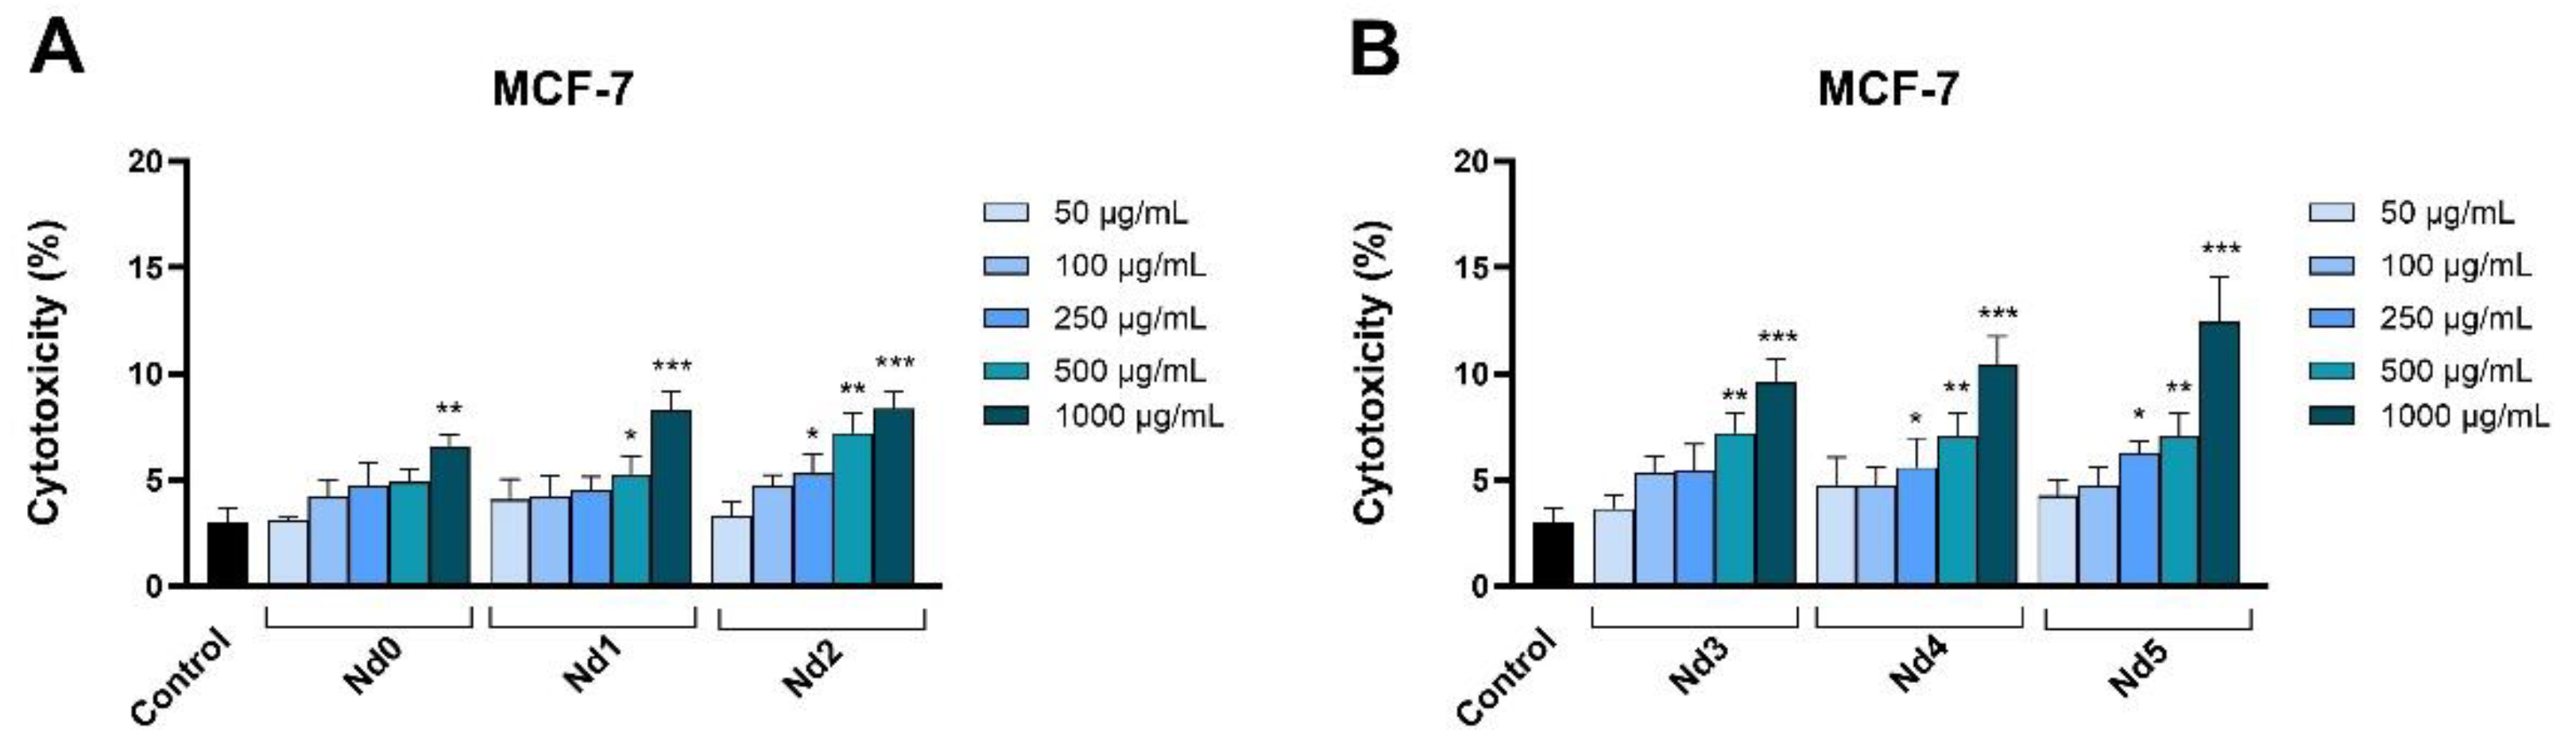
Figure 12.
Lactate dehydrogenase (LDH) release percentages in PANC-1 cancer cells after 48h treatment with Nd0, Nd1 and Nd2 (A) and after treatment with Nd3, Nd4 and Nd5 (B) at five concentrations (50, 100, 250, 500 and 1000 μg/mL). These results are presented as LDH Release (%) and represent mean values ± SD of three independent experiments performed in triplicate. (* p < 0.05, ** p < 0.001 and *** p < 0.001).
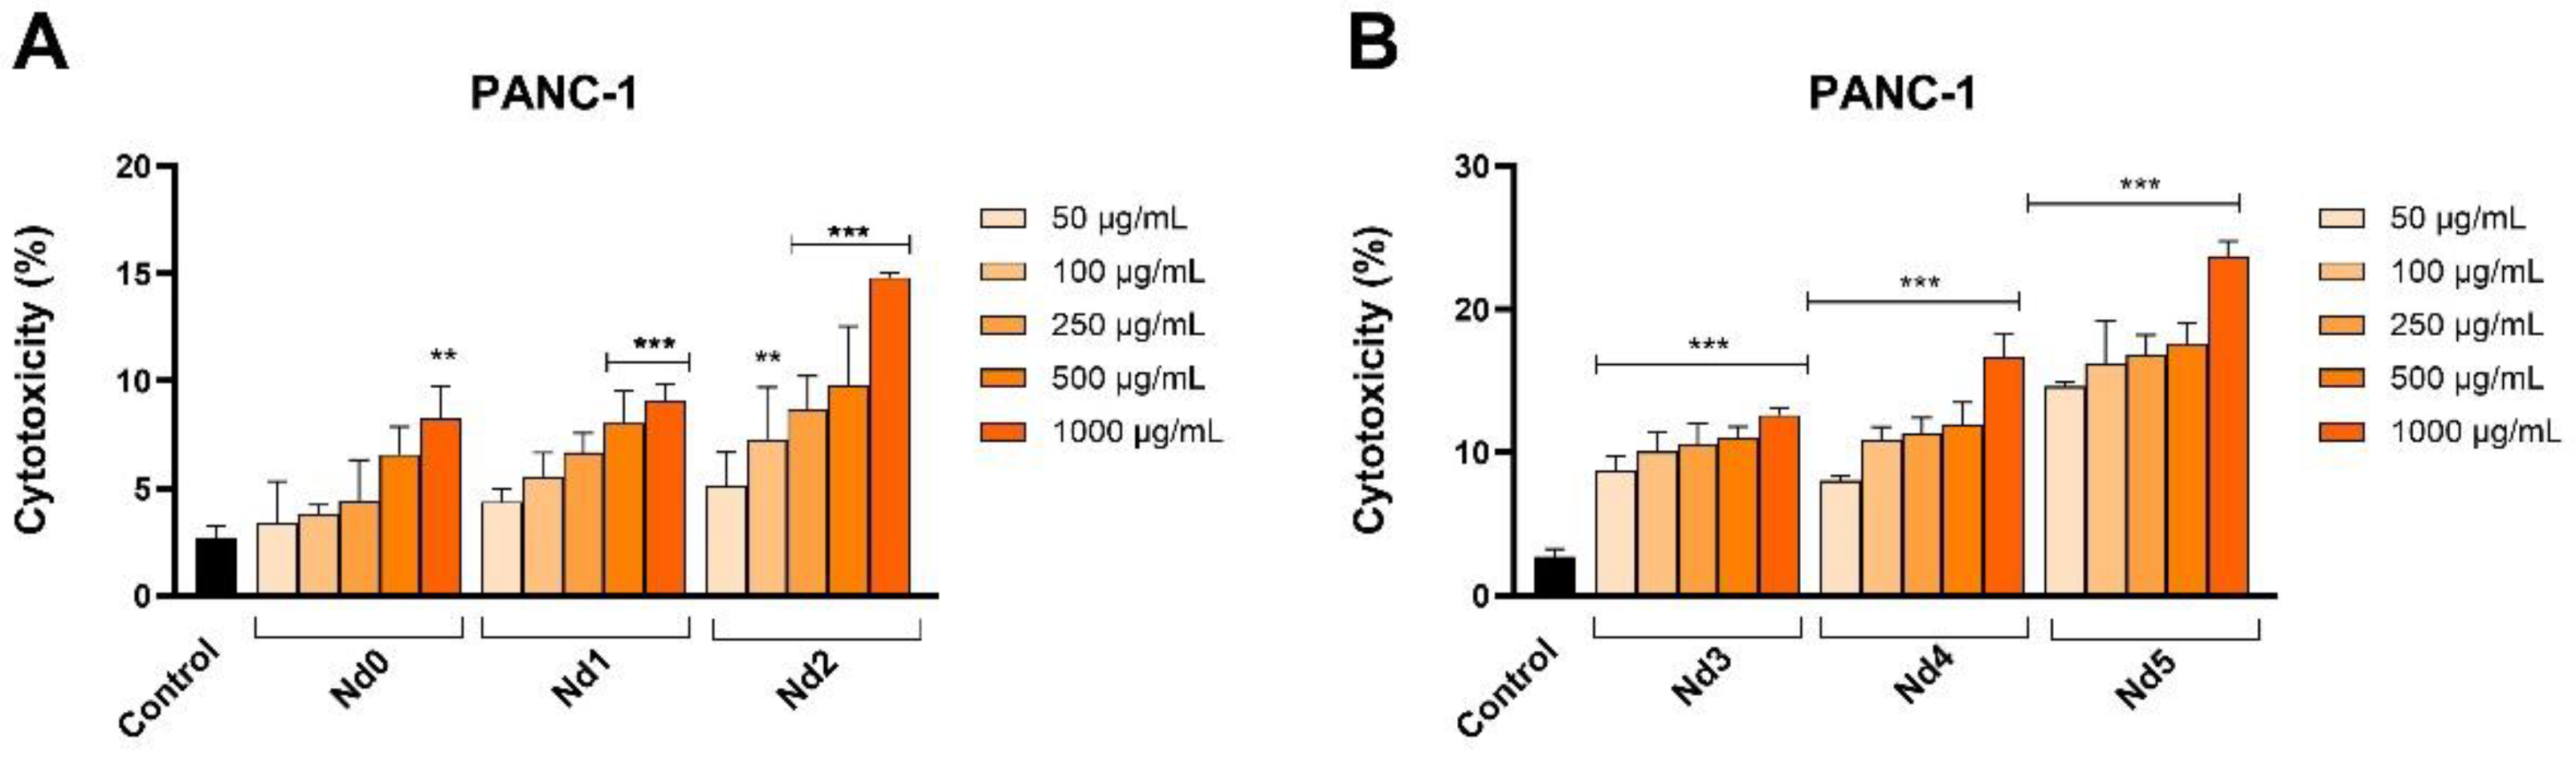
Figure 13.
Aspect of the nuclei and F-actin fibers in A375 cells treated for 48 h with Nd3, Nd4 and Nd5 at two representative concentrations (500 and 1000 μg/mL). The scale bars indicate 50 µm.
Figure 13.
Aspect of the nuclei and F-actin fibers in A375 cells treated for 48 h with Nd3, Nd4 and Nd5 at two representative concentrations (500 and 1000 μg/mL). The scale bars indicate 50 µm.
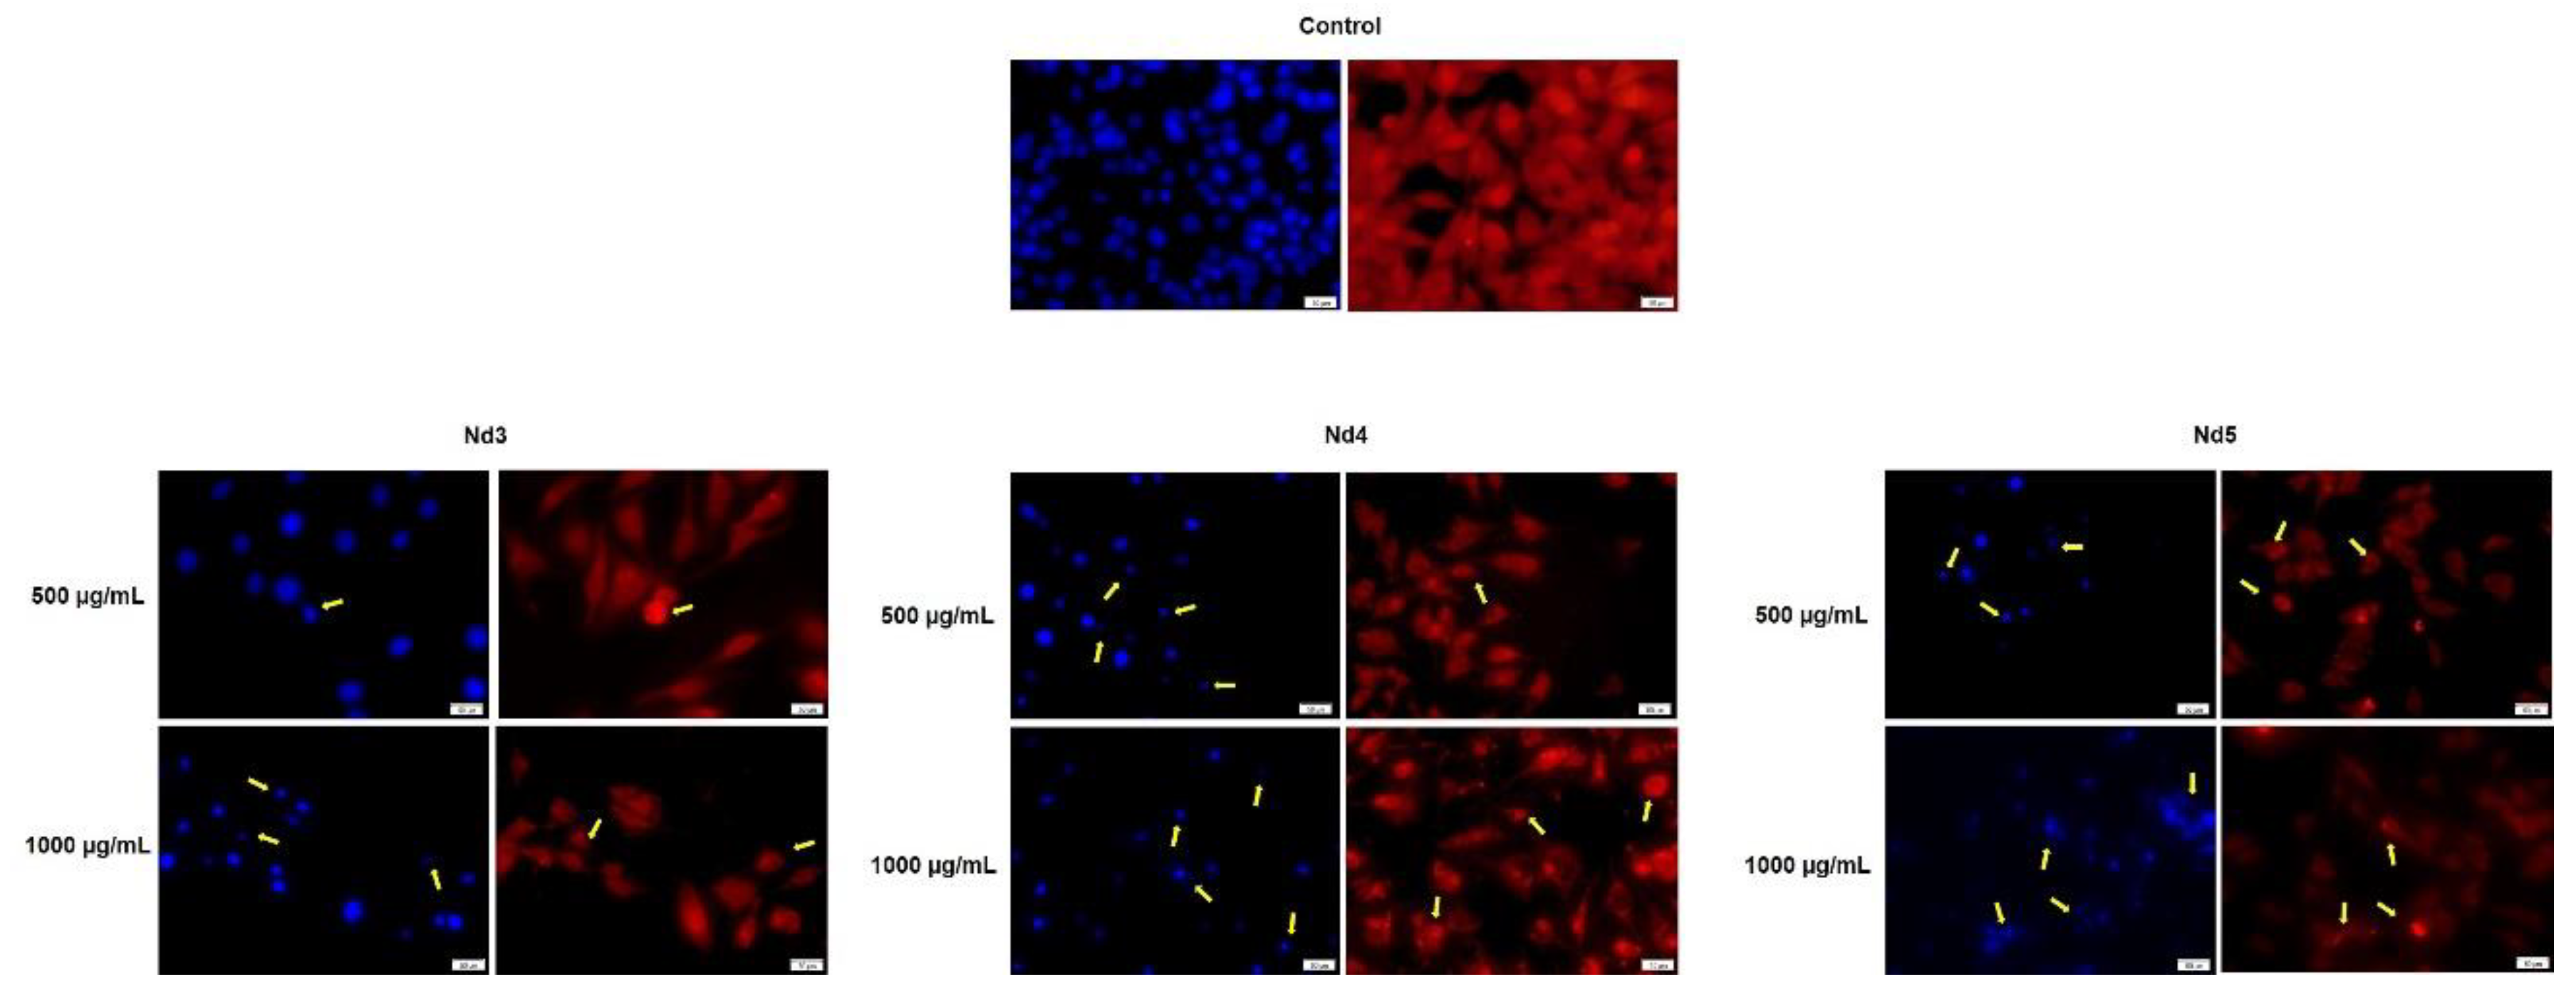
Figure 14.
Aspect of the nuclei and F-actin fibers in MCF-7 cells treated for 48 h with Nd3, Nd4 and Nd5 at two representative concentrations (500 and 1000 μg/mL). The scale bars indicate 50 µm.
Figure 14.
Aspect of the nuclei and F-actin fibers in MCF-7 cells treated for 48 h with Nd3, Nd4 and Nd5 at two representative concentrations (500 and 1000 μg/mL). The scale bars indicate 50 µm.
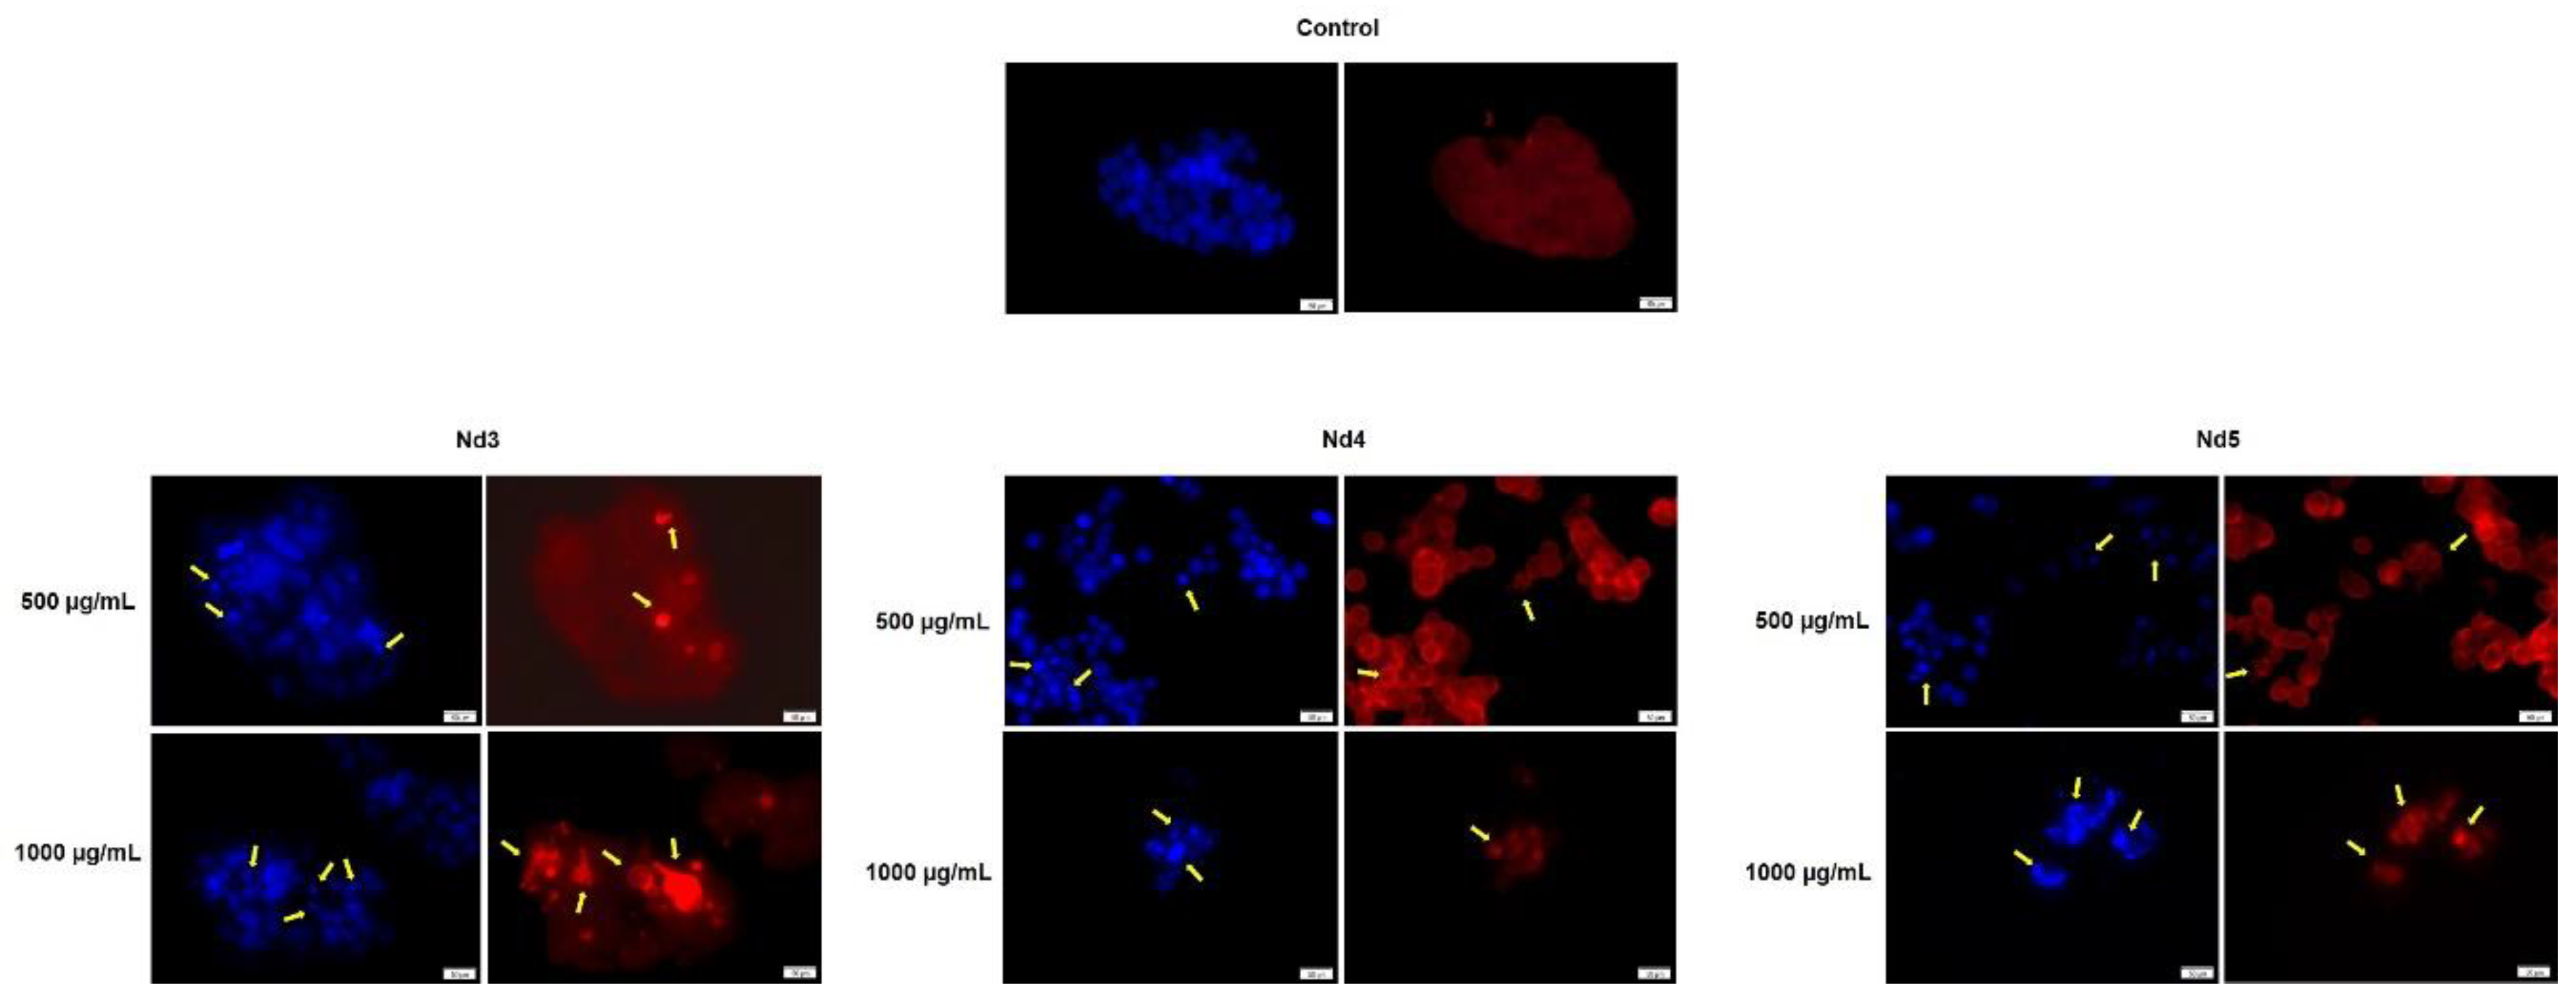
Figure 15.
Aspect of the nuclei and F-actin fibers in PANC-1 cells treated for 48 h with Nd0, Nd1, Nd2, Nd3, Nd4 and Nd5 at two representative concentrations (500 and 1000 μg/mL). The scale bars indicate 50 µm.
Figure 15.
Aspect of the nuclei and F-actin fibers in PANC-1 cells treated for 48 h with Nd0, Nd1, Nd2, Nd3, Nd4 and Nd5 at two representative concentrations (500 and 1000 μg/mL). The scale bars indicate 50 µm.
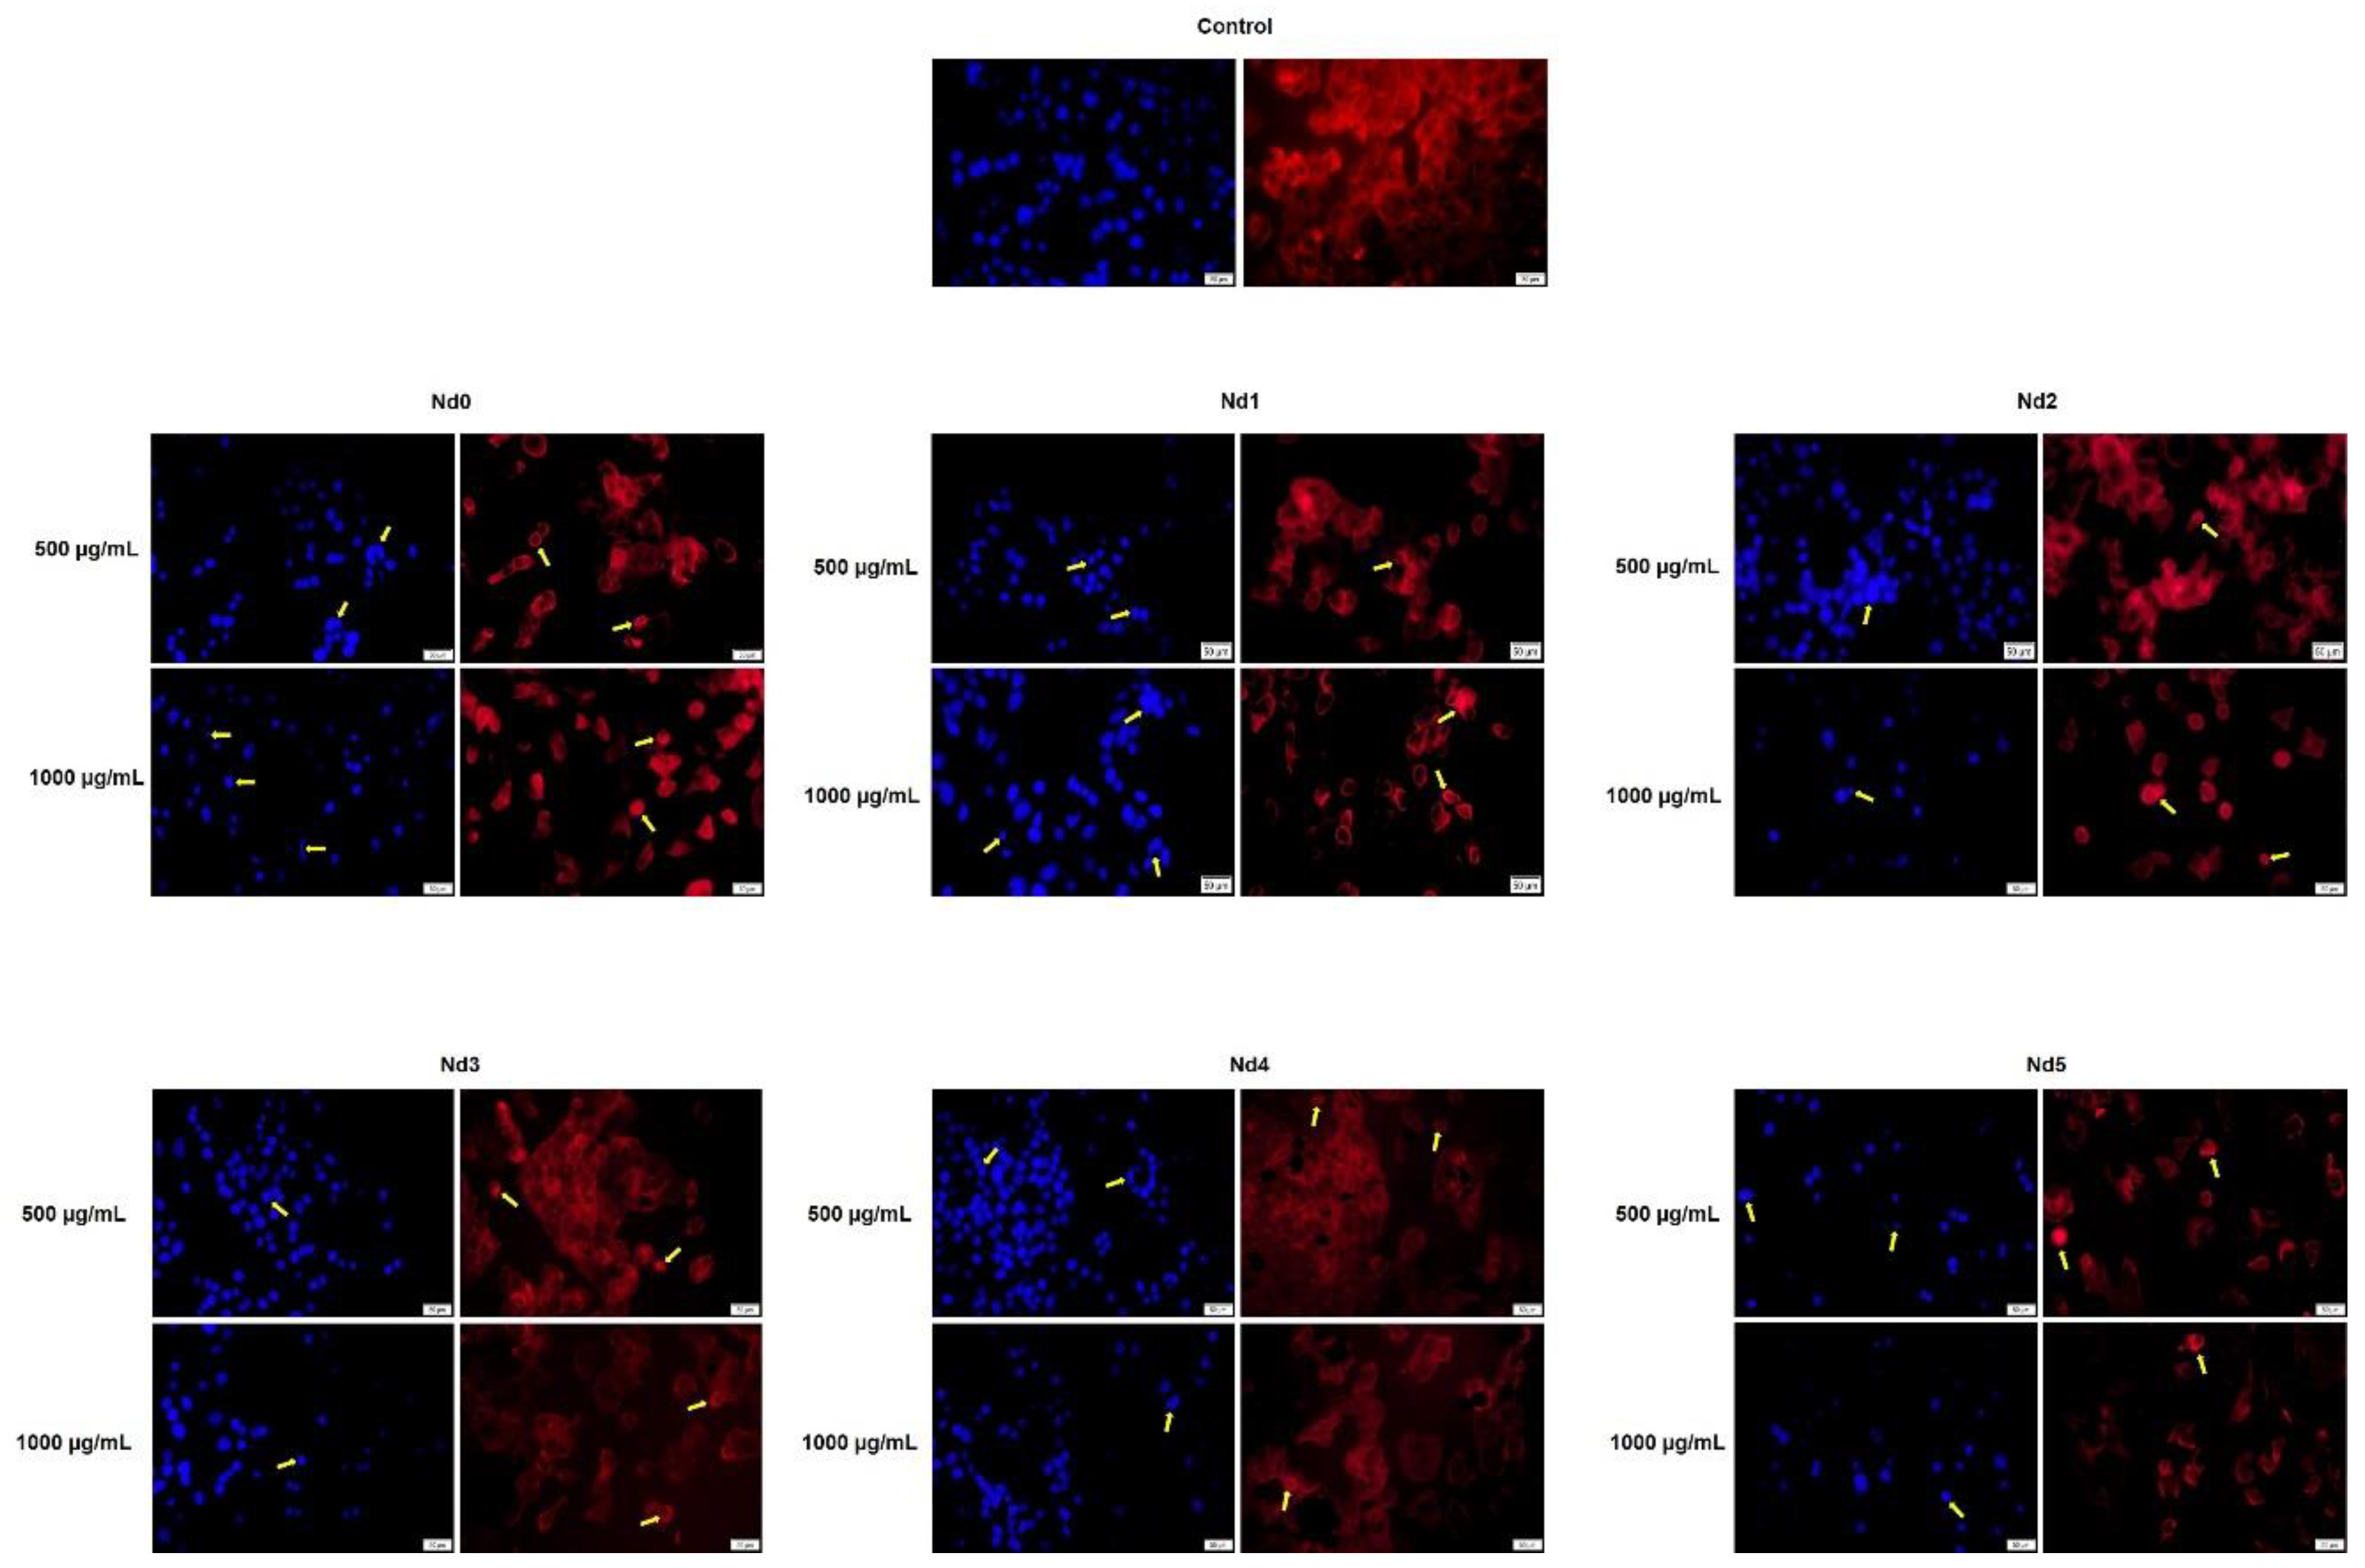

Table 1.
The sample composition.
| Sample | NdCl3·6H2O (moles) | Fe(NO3)3·9H2O (moles) |
|---|---|---|
| Nd0 | - | 0.0400 |
| Nd1 | 0.0002 | 0.0398 |
| Nd2 | 0.0004 | 0.0396 |
| Nd3 | 0.0006 | 0.0394 |
| Nd4 | 0.0010 | 0.0390 |
| Nd5 | 0.0020 | 0.0380 |
Table 2.
Calculated lattice parameter a.
| Sample | Lattice parameter a (Å) |
|---|---|
| Nd0 | 8.3762 ± 0.0003 |
| Nd1 | 8.3781 ± 0.0004 |
| Nd2 | 8.3796 ± 0.0004 |
| Nd3 | 8.3799 ± 0.0004 |
| Nd4 | 8.3830 ± 0.0004 |
| Nd5 | 8.3873 ± 0.0002 |
Table 3.
The calculated IC50 values (µg/mL) of Nd0, Nd1, Nd2, Nd3, Nd4 and Nd5 in HaCaT, A375, MCF-7 and PANC-1 cells after a 48h treatment.
Table 3.
The calculated IC50 values (µg/mL) of Nd0, Nd1, Nd2, Nd3, Nd4 and Nd5 in HaCaT, A375, MCF-7 and PANC-1 cells after a 48h treatment.
| HaCaT | A375 | MCF-7 | PANC-1 | |
|---|---|---|---|---|
| Nd0 | >1000 | >1000 | >1000 | 748.7 |
| Nd1 | >1000 | >1000 | >1000 | 687.9 |
| Nd2 | >1000 | >1000 | >1000 | 593.5 |
| Nd3 | >1000 | 943.5 | >1000 | 581.8 |
| Nd4 | >1000 | 798.8 | 956.3 | 572.3 |
| Nd5 | >1000 | 650.7 | 877.2 | 397.7 |
Disclaimer/Publisher’s Note: The statements, opinions and data contained in all publications are solely those of the individual author(s) and contributor(s) and not of MDPI and/or the editor(s). MDPI and/or the editor(s) disclaim responsibility for any injury to people or property resulting from any ideas, methods, instructions or products referred to in the content. |
© 2025 by the authors. Licensee MDPI, Basel, Switzerland. This article is an open access article distributed under the terms and conditions of the Creative Commons Attribution (CC BY) license (http://creativecommons.org/licenses/by/4.0/).
Copyright: This open access article is published under a Creative Commons CC BY 4.0 license, which permit the free download, distribution, and reuse, provided that the author and preprint are cited in any reuse.


