
Submitted:
23 June 2025
Posted:
24 June 2025
You are already at the latest version
Abstract
This study presents a practical and scalable framework for mid- to long-term distribution network planning that reflects real-world infrastructure constraints and investment requirements. While traditional methods often rely on simplified network models or reactive reinforcement strategies, the proposed approach introduces an investment-oriented planning model that explicitly incorporates physical elements such as duct capacity, pole availability, and installation feasibility. A linear programming (LP) formulation is adopted to determine the optimal routing and sizing of new facilities under technical constraints including voltage regulation, power balance, and substation capacity limits. To validate the model’s effectiveness, actual infrastructure and load data were used. Results show that the model can derive cost-efficient expansion strategies over a five-year horizon by prioritizing existing infrastructure use and flexibly adapting to spatial limitations. The proposed approach enables utility planners to make realistic, data-driven decisions and supports diverse scenario analyses through a modular structure. By embedding investment logic directly into the network model, this framework bridges the gap between high-level planning strategies and the engineering realities of distribution system expansion.
Keywords:
distribution network planning
; mid- to long-term distribution planning modeling
; load modeling
; investment based network modeling
; advanced distribution planning system (ADPS)
; linear programming
1. Introduction
In recent years, the electric power industry has witnessed substantial transformations driven by increasing electricity demand, widespread urban development, and the global shift toward cleaner and decentralized energy systems. Among the many challenges facing power utilities, the need to secure long-term infrastructure reliability and economic investment efficiency has placed growing importance on mid- to long-term distribution network planning [1,2,3,4]. This type of planning involves systematically preparing the distribution grid for expected changes over a time horizon typically ranging from five to fifteen years.
The primary objectives of mid- to long-term distribution planning include ensuring power supply stability, identifying economically viable infrastructure investments, and facilitating the integration of emerging technologies such as distributed energy resources (DERs), electric vehicles (EVs), and energy storage systems (ESS) [5]. Traditionally, distribution systems have been planned based on short-term load growth and reactive reinforcement strategies [6]. However, the increasing complexity and uncertainty in energy demand and supply have rendered such approaches inadequate for anticipating future challenges [7,8,9].
In this context, long-term planning must incorporate not only accurate demand forecasting, but also physical and operational constraints associated with the distribution infrastructure [10,11]. This includes assessing the capacity of substations, overhead and underground lines, duct availability, and pole configurations. Moreover, as new residential areas, industrial complexes, and public infrastructure continue to expand—particularly in rapidly growing urban environments such as new towns or special administrative regions—planning tools must evolve to reflect both spatial and temporal constraints [12,13].
While several methodologies have been proposed for long-term distribution planning, many rely on simplified system models that lack sufficient granularity in physical network representation. Existing approaches often focus on feeder-level abstraction and overlook critical aspects such as the availability of existing ducts, pole occupancy, or installation feasibility along candidate routing paths. As a result, there is a clear gap between academic optimization models and the detailed engineering realities faced by utility planners.
To address these limitations, this study proposes a practical and scalable planning framework that combines physical network modeling with investment-based optimization. The core contribution of this work lies in the development of a distribution network model tailored for long-term investment planning, in which physical constraints and existing infrastructure availability are explicitly modeled. This framework allows planners to identify feasible routing paths, calculate costs based on actual installation units, and optimize network reinforcement while minimizing overall investment costs.
To solve the planning problem, the study adopts a linear programming (LP) formulation, which enables efficient computation of optimal investment strategies under technical constraints such as voltage limits, substation capacity, and power flow restrictions [14,15]. The proposed model is implemented using IBM CPLEX Optimization Studio and validated through a case study of Sejong City, South Korea—a newly developed urban area characterized by fast-growing electricity demand and complex planning requirements.
The remainder of this paper is organized as follows: Section 2 describes the architecture and key features of the proposed investment-oriented network model. Section 3 formulates the linear programming model, detailing the objective function and technical constraints. Section 4 presents a real-world case study, demonstrating the model’s applicability and analyzing the resulting investment plans. Section 5 concludes by summarizing the study’s contributions, highlighting the practical value of the proposed planning methodology and its foundation on a realistic, infrastructure-based system model.
2. Mid- to Long-Term Distribution Planning Model
2.1. Distribution System Modeling
Mid- to long-term distribution planning is a strategic process typically conducted over a planning horizon of 5 to 15 years. It is designed to address growing electricity demand and the increasing integration of distributed energy resources (DERs) by systematically identifying the optimal strategies for expanding and reinforcing the distribution network [16,17]. The ultimate objective is to ensure power supply stability, reliability, and cost-effectiveness through demand forecasting, evaluation of existing capacity, and prioritization of infrastructure investments.
To support this planning process, it is essential to construct a distribution system model that accurately reflects the current network configuration and evaluates its capacity for future expansion. Unlike conventional line-based models, mid- to long-term planning requires a more advanced model that incorporates physical infrastructure constraints—such as duct availability, pole locations, and right-of-way feasibility.
The core objective of this modeling effort is to determine the optimal placement and sizing of new facilities while accounting for the limitations and layout of the existing system. To achieve this, the model must incorporate two key types of information:
- First, information about candidate paths for line routing. This refers to whether overhead or underground lines can physically be installed along each potential route.
- Second, information regarding the capacity of existing infrastructure along these candidate paths. For example, if the duct capacity in a given path is already fully utilized, no additional underground cables can be installed along that route.
To incorporate this information, the conventional line-segment-based models are insufficient. A new model that considers physical infrastructure such as ducts and poles is required. Therefore, the system model for mid- to long-term planning should integrate all existing and potential line segments within the same candidate path into a unified representation, enabling route-level analysis and planning.
Figure 1 shows an example of a distribution system. The feeder extending from the substation consists of underground cables and overhead lines. The corresponding distribution network is abstracted into the planning model presented in Figure 2.
Figure 2 illustrates the distribution system model for planning. The system consists of nodes and branches and may appear simple in structure. Each branch must contain essential information, including the number of overhead lines, spare overhead line positions, number of underground cables, and spare duct spaces. The detailed network information in Figure 2 is summarized in Table 1 below.
As shown in Table 1, Branch1 currently uses 3 out of 9 available ducts, leaving 6 spare ducts for potential future cable installations. Even though no overhead lines are currently installed in this branch, if further expansion is required, additional ducts must be constructed.
In Branch2, two overhead lines are already installed and both the upper and lower sides of the pole are in use, leaving no space for further overhead lines. Therefore, any future expansion in this branch would require underground cable installation via newly constructed ducts.
In Branch3, one overhead line is installed, leaving one more overhead line available. Additional installations beyond this would require underground expansion as well.
2.2. Load Modeling
In mid- to long-term distribution planning, future load must be forecasted and incorporated into the network model. This study classifies load modeling into two categories.
First, the projected load growth of existing customers is considered. This is estimated by applying utilization rates to the contracted demand, taking into account the industrial sector of each customer [18].
Second, the expected load from new, planned customers is incorporated. If future developments such as industrial complexes or residential areas are already planned and their expected demand is known, this information is included in the model to more accurately reflect anticipated system expansion requirements.
The future load of each existing customer is projected by applying an annual growth rate based on their industry classification. The forecasted load for customer i in year y is given by:
Where:
- : Projected load of existing customer i in year y
- : Base-year load of existing customer i
- : Annual growth rate for the industry type s(i) that existing customers
- : Number of years after the base year
For newly planned customers, the forecasted load is calculated by multiplying the contracted demand by a time-dependent weight factor associated with the customer’s industry type. The weight factor increases annually but is capped at a predefined maximum. The load in year y is expressed as:
Where:
- Projected load of planned new customer j in year y
- : Contracted demand of new customer j
- : Initial load weight factor for industry type s(j)
- : Annual increment of weight factors for industry type s(j)
- Maximum allowable weight factor for industry type s(j)
The total load at each node is calculated as the sum of the projected loads from both existing and planned new customers connected to that node. Existing customers follow an industry-specific annual growth rate, while new customers are modeled using time-dependent weight factors based on their contracted demand and industry type. The total load at node n in year y is given by:
Where:
- Total load at node n in year y
- : Set of existing customers at node n
- : Set of planned new customers at node n
2.3. PV Modeling
In mid- to long-term distribution planning, PV output is modeled as a fraction of the installed capacity using a weight factor ϒi, which reflects long-term solar potential at each location [19]. The expected PV generation at node n is given by:
where captures the range of possible generation outcomes based on worst- and best-case solar conditions.
3. Problem Formulation
3.1. Objective Function
The objective of mid- to long-term distribution planning is to minimize future investment costs in response to anticipated load growth, taking into account the existing system configuration. The major cost components include overhead lines, utility poles, underground cables, and underground ducts. Each cost is calculated proportionally to the length of each branch, as expressed in the following formulas:
Where:
- : Length of branch n
- : Unit cost per km of overhead line
- : Cost of overhead switch
- : Number of poles required per km
- : Cost of overhead pole
- : Unit cost per km of underground cable
- : Cost of underground switch
- : Cost of duct installation (e.g., corrugated conduit)
- : Cost of manhole installation
Equation (5) represents the investment cost for overhead line installation, including both line material and switch. Equation (6) accounts for the cost of utility pole installation, calculated based on the number of poles required per unit length. Equation (7) denotes the cost of underground cable installation, incorporating both the cable and associated underground switch. Equation (8) refers to the cost of constructing underground duct infrastructure, including conduit and manhole installation.
Based on these cost components, the objective function is formulated as:
This objective function minimizes the total investment cost of new distribution infrastructure across all planning years and for all branches under consideration.
3.2. Constraints
3.2.1. Power Balance Constraint
Optimization is subject to power flow constraints that ensure the physical laws of energy balance across the entire network. At each node, the incoming and outgoing power flows must be equal [20]. This condition can be mathematically expressed as follows:
Where:
- The power flows from node i to node j
- Power supplied by the substation at node i
- Load at node i
3.2.2. Maximum Power Flow Constraint
The model includes maximum power flow constraints to ensure that no branch exceeds its rated thermal capacity [21].
Where:
- Maximum power flow between node i and node j
3.2.3. Voltage Constraint
The system is subject to voltage drop constraints to ensure that all node voltages remain within acceptable limits.
Where:
- voltage at node i
- Lower bound of acceptable voltage range
- Upper bound of acceptable voltage range
3.2.4. Substation Capacity Constraint
A substation capacity constraint is imposed to ensure that the total power supplied from each substation does not exceed its rated limit [22].
Where:
- Active power output of substation at node s
- Maximum active power output of the substation at node s
3.2.5. New Customer Supply Constraints
In accordance with utility design practices, newly contracted loads exceeding a predefined threshold Lth must be supplied through dedicated new distribution feeders. This constraint ensures that large customer loads do not overload existing infrastructure and are instead supported by newly constructed lines. The threshold value can be flexibly set depending on the utility’s planning standards or regional policies.
The corresponding constraint is formulated as:
Where:
- predefined threshold load [MVA]
- : auxiliary variable representing the excess demand beyond the threshold
- : substation feeder capacity newly allocated to node j
3.3. Solution Approach Using Linear Programming
To solve the mid- to long-term distribution network planning problem, this study adopts a linear programming (LP) approach. LP is particularly effective for optimization problems in which both the objective function and all constraints are linear [23,24,25,26,27]. It enables the use of deterministic algorithms such as the simplex and interior-point methods, offering high computational efficiency and scalability, which are crucial for large-scale grid planning.
In the proposed model, all constraints—such as power balance, line capacity limits, voltage constraints, and substation output limits—are formulated as linear equalities or inequalities. This allows the model to fully comply with the LP framework and benefit from efficient solver performance.
Moreover, the LP formulation enables the interpretation of dual variables, including shadow prices, which offer insights into the marginal value of constrained resources. For instance, a nonzero shadow price for substation capacity or duct availability reveals the economic benefit of relaxing such constraints, thereby aiding investment prioritization.
The model was implemented using IBM CPLEX Optimization Studio and solved using its LP solver. The platform provides fast and reliable solutions and supports extensive scenario analysis involving variations in load growth and DER penetration. Thus, the LP-based approach offers both theoretical rigor and practical utility for planners seeking cost-effective and scalable long-term distribution strategies. Table 2 summarizes the main advantages of using LP in this context [28].
3.4. Overall Distribution Planning Work
The planning process proposed in this study is structured into three sequential phases: Modeling, Strategy, and Optimization. In the Modeling Phase, the existing distribution system is reformulated into a planning-oriented network model. This model incorporates key physical infrastructure data such as duct capacity, pole availability, and candidate routing paths. Unit investment costs for various equipment—such as overhead lines, poles, underground cables, and ducts—are also defined for use in cost estimation. The Strategy Phase focuses on scenario development based on planning objectives. For example, different weighting combinations can be applied to represent high-load/low-PV or low-load/high-PV conditions. This phase configures assumptions for load growth, PV generation scaling, and technical constraints such as voltage and capacity limits. Finally, in the Optimization Phase, a linear programming (LP) model is formulated and solved using IBM CPLEX Optimization Studio to identify the cost-minimizing expansion strategy under the defined assumptions.
An overview of this three-phase framework is illustrated in Figure 3.
4. Case Study
The proposed distribution system modeling and linear programming formulation were implemented in ADPS (Advanced Distribution Planning System), a platform developed by KEPCO for mid- to long-term distribution planning. The modeling components including physical infrastructure representation, load and PV modeling, and investment cost structures were customized according to the framework proposed in this study. The optimization module within ADPS also integrates the LP-based problem solution developed by the authors.
A case study based on this implementation is presented in Section 4 to validate the effectiveness and practicality of the proposed approach.
4.1. Case Study System Description
This study targets a city-scale distribution system, which is a typical scope for mid- to long-term distribution planning due to the scale and complexity of required investments. The distribution system of Sejong City, South Korea, was selected as the case study because of its unique characteristics as a newly developed urban area with a rapidly increasing electricity demand. Sejong’s continuous growth in residential and administrative facilities provides a realistic and challenging testbed for validating the proposed planning framework.
The proposed distribution system is illustrated as illustrated in Figure 4.
Figure 4 shows the topology of the distribution system in Sejong City, which consists of six substations labeled A through F. These substations collectively supply 1,052.48 MVA of capacity to the city’s network. The initial year total load is 540 MVA, and demand is expected to increase by approximately 300 MVA over the next five years due to rapid urban development. The supply capacity of each substation is detailed in Table 3. These substations collectively form the backbone of the Sejong distribution system and serve as the primary sources for power delivery throughout the network.
The projected load increase consists of two components: the natural growth of existing loads and newly contracted customer demands.
Approximately 247.89 MVA is attributed to newly contracted loads, while 52.70 MVA accounts for natural growth. The detailed year-by-year breakdown of the load increase is provided in Table 4.
A total of nine new customer connections have been confirmed for future integration into the distribution system, including six industrial complexes, two residential developments, and one large-scale manufacturing facility. These newly contracted loads represent a significant portion of the projected demand growth and are scheduled to be commissioned progressively over the five-year planning horizon. Table 5 summarizes the total contracted capacities by customer type and presents the annual allocation of these loads from N+1 to N+5, where N denotes the base year.
Accurate estimation of investment costs requires the definition of standardized unit costs for each distribution component. In this study, ACSR 160 sq conductors are adopted as the standard specification for overhead lines, and CNCE-W AL 400 sq cables are used for underground lines. Both types of lines are designed to accommodate a maximum power transfer capacity of 10 MVA, ensuring consistent modeling across installation methods. Table 6 summarizes unit investment costs of the major components utilized in the proposed distribution planning model.
4.2. Optimization Results
The proposed optimization model was applied to the distribution system model using the data and assumptions described in Section 4.1. The objective function aimed to minimize total investment cost while satisfying forecasted load growth, physical infrastructure constraints (e.g., spare duct and pole availability), and technical constraints such as voltage drop and substation capacity. The linear programming model was solved using CPLEX, yielding a year-by-year expansion strategy for the five-year planning horizon (N+1 to N+5). Over the entire planning horizon, a total of 27 new feeders are introduced, extending more than 85 km of overhead lines and 250 km of underground cables, with a cumulative investment cost of approximately 97.8 million USD.
To reflect practical planning practices, this study introduces a design constraint based on load magnitude. A threshold value, denoted as , is defined to represent the minimum load capacity that warrants a dedicated distribution feeder. In this model is set to 0.5 MVA, aligning with typical utility guidelines. Accordingly, any newly contracted load exceeding must be supplied via a new feeder. Based on this condition, as detailed in Table 7, a total of nine new feeders were introduced in year N+1, each exclusively serving newly connected customers. No additional feeders were required to accommodate the growth of existing loads, as their increase remained within the capacity of the current infrastructure.
Figure 5 illustrates the optimized distribution system configuration for the planning year N+1 as below.
Figure 5 presents the optimization results for the year N+1. The red lines in the figure indicate sections where new feeders are installed. As proposed in this study, the optimization process identifies available space within the existing infrastructure and minimizes investment costs accordingly.
According to the results, two new feeders are drawn from Substation A, supplying an additional load of approximately 18.16 MVA. Substation B accommodates the largest expansion, with five new feeders and a total capacity of 49.82 MVA. Substation C also expands with two new feeders, supplying an additional 18.16 MVA.
From years N+2 to N+4, the system responds to increasing demand from both newly contracted and existing customers through the optimal expansion of distribution lines. In year N+5, although only five new feeders are required, most of the areas suitable for cost-effective overhead line installation have already been utilized. Consequently, the remaining demand must be met using underground cables, resulting in the highest investment cost across the five-year planning horizon.
4.3. Discussion
The optimization results obtained from the proposed LP-based mid- to long-term distribution planning model offer several practical insights.
First, the model successfully identifies cost-effective expansion strategies by leveraging available physical infrastructure. For instance, in the early planning years (N+1 to N+3), the model prioritizes the use of spare duct spaces and available overhead pole capacity to minimize total investment costs. This demonstrates the importance of including existing structural information—such as pole and duct availability—into the planning model.
Second, as observed in year N+5, when existing overhead line routes become saturated, the model naturally shifts toward more expensive underground installations. Although only five new feeders were introduced in N+5, the lack of remaining overhead capacity led to the highest annual investment cost over the five-year horizon. This result highlights a common challenge in mature or densely developed areas, where above-ground expansion becomes increasingly constrained.
Another noteworthy observation relates to the use of the new customer connection constraint. By setting a threshold load (e.g., 0.5 MVA) above which a new dedicated feeder must be introduced, the model more accurately reflects practical utility planning standards. While this constraint increases total investment, it ensures that large customers are supplied with sufficient capacity and reliability. The flexibility of treating this threshold as a parameter also allows for sensitivity analysis in future studies.
Moreover, the planning framework allows for diverse scenario configurations by adjusting growth rates and PV weights. This strategic flexibility enables planners to test best- and worst-case assumptions regarding load expansion and renewable penetration without altering the underlying system structure. It reflects a key strength of using a linear model: scalability and transparency of planning logic.
Lastly, the application of this model within the ADPS (Advanced Distribution Planning System) framework further validates its feasibility for real-world utility planning. The integration of actual system data from Sejong City and the use of practical investment unit costs confirm that the model is not only computationally efficient but also realistically implementable in the field.
These results suggest that the proposed framework can serve as a reliable decision-support tool for distribution utilities seeking to optimize infrastructure investment over a multi-year horizon while accounting for technical and physical constraints.
5. Conclusions
This study presents a mid- to long-term distribution planning framework based on a newly structured, investment-oriented network model. By incorporating physical constraints—such as available ducts, pole locations, and candidate routing paths—the proposed model enables realistic and cost-effective expansion strategies that reflect the actual conditions of urban power systems.
The optimization problem was formulated as a linear program (LP) and solved using IBM CPLEX to minimize total investment costs while satisfying technical constraints. These include voltage regulation, substation capacity limits, and line flow constraints, all of which were expressed as linear relationships. The LP formulation enabled efficient computation and scalability to large-scale planning problems.
The case study of Sejong City demonstrated that the proposed model can effectively leverage existing infrastructure and guide optimal system expansion over a five-year horizon. For example, the model identified when and where overhead line additions were feasible and when higher-cost underground installations were necessary due to spatial limitations. These results validate the model’s capability to reflect practical trade-offs in long-term investment planning.
The main contribution of this work lies in the development of a planning-oriented network model that integrates investment decision-making directly into the system configuration. Unlike traditional topological models, this approach allows planners to assess infrastructure constraints and routing feasibility early in the planning phase—thereby supporting proactive and data-driven decisions.
In addition, the proposed framework is designed to be modular and flexible. Utility planners can easily incorporate additional constraints—such as feeder installation thresholds or service reliability criteria—based on internal standards or regulatory requirements. This adaptability ensures the model’s applicability across a wide range of real-world planning environments.
Future research may incorporate stochastic programming to address load and DER uncertainty, or apply two-stage optimization to assess the trade-off between investment and reliability under disaster scenarios.
Author Contributions
Conceptualization, H.R. and J.C.; methodology, H.R. and J.C; software, H.R. and H.K.; validation, H.R. and W.C.; formal analysis, H.R. and H.K.; resources, W.C.; All authors have read and agreed to the published version of the manuscript.
Funding
research was funded by the Korea Institute of Energy Technology Evaluation and Planning (KETEP) and the Ministry of Trade, Industry & Energy (MOTIE) of the Republic of Korea (No. 20225500000060, R22DG02).
Data Availability Statement
The data supporting the findings of this study are available from the corresponding author upon reasonable request and with approval from KEPCO.
Conflicts of Interest
Not applicable.
References
- Shair, J.; Li, H.; Hu, J.; Xie, X. Power system stability issues, classifications and research prospects in the context of high-penetration of renewables and power electronics. Renew. Sustain. Energy Rev. 2021, 145. [CrossRef]
- Akhtar, I.; Kirmani, S.; Jameel, M. Reliability Assessment of Power System Considering the Impact of Renewable Energy Sources Integration Into Grid With Advanced Intelligent Strategies. IEEE Access 2021, 9, 32485–32497. [CrossRef]
- Kihara, M.; Lubello, P.; Millot, A.; Akute, M.; Kilonzi, J.; Kitili, M.; Mukuri, F.; Kinyanjui, B.; Hoseinpoori, P.; Hawkes, A.; et al. Mid- to long-term capacity planning for a reliable power system in Kenya. Energy Strat. Rev. 2024, 52. [CrossRef]
- Vahidinasab, V.; Tabarzadi, M.; Arasteh, H.; Alizadeh, M.I.; Beigi, M.M.; Sheikhzadeh, H.R.; Mehran, K.; Sepasian, M.S.; Mohammadbeygi, M. Overview of Electric Energy Distribution Networks Expansion Planning. IEEE Access 2020, 8, 34750–34769. [CrossRef]
- De Lima, T.D.; Franco, J.F.; Lezama, F.; Soares, J. A Specialized Long-Term Distribution System Expansion Planning Method With the Integration of Distributed Energy Resources. IEEE Access 2022, 10, 19133–19148. [CrossRef]
- G., V.; J., B.E. A review of uncertainty management approaches for active distribution system planning. Renew. Sustain. Energy Rev. 2024, 205. [CrossRef]
- IEA, P. World energy outlook 2022. Paris, France: International Energy Agency (IEA).
- Scott, I.J.; Carvalho, P.M.; Botterud, A.; Silva, C.A. Long-term uncertainties in generation expansion planning: Implications for electricity market modelling and policy. Energy 2021, 227. [CrossRef]
- Mohseni, S.; Brent, A.C.; Kelly, S.; Browne, W.N. Demand response-integrated investment and operational planning of renewable and sustainable energy systems considering forecast uncertainties: A systematic review. Renew. Sustain. Energy Rev. 2022, 158. [CrossRef]
- Iweh, C.D.; Gyamfi, S.; Tanyi, E.; Effah-Donyina, E. Distributed Generation and Renewable Energy Integration into the Grid: Prerequisites, Push Factors, Practical Options, Issues and Merits. Energies 2021, 14, 5375. [CrossRef]
- Bin Nadeem, T.; Siddiqui, M.; Khalid, M.; Asif, M. Distributed energy systems: A review of classification, technologies, applications, and policies. Energy Strat. Rev. 2023, 48. [CrossRef]
- Farivar, M.; Low, S.H. Branch Flow Model: Relaxations and Convexification—Part I. IEEE Trans. Power Syst. 2013, 28, 2554–2564. [CrossRef]
- Aschidamini, G.L.; da Cruz, G.A.; Resener, M.; Ramos, M.J.S.; Pereira, L.A.; Ferraz, B.P.; Haffner, S.; Pardalos, P.M. Expansion Planning of Power Distribution Systems Considering Reliability: A Comprehensive Review. Energies 2022, 15, 2275. [CrossRef]
- Dantzig, G. B. Linear programming and extensions. 2016.
- Morais, H.; Kádár, P.; Faria, P.; Vale, Z.A.; Khodr, H. Optimal scheduling of a renewable micro-grid in an isolated load area using mixed-integer linear programming. Renew. Energy 2010, 35, 151–156. [CrossRef]
- Elkadeem, M.R.; Elaziz, M.A.; Ullah, Z.; Wang, S.; Sharshir, S.W. Optimal Planning of Renewable Energy-Integrated Distribution System Considering Uncertainties. IEEE Access 2019, 7, 164887–164907. [CrossRef]
- Cho, G.-J.; Kim, C.-H.; Oh, Y.-S.; Kim, M.-S.; Kim, J.-S. Planning for the Future: Optimization-Based Distribution Planning Strategies for Integrating Distributed Energy Resources. IEEE Power Energy Mag. 2018, 16, 77–87. [CrossRef]
- Taylor, J.W. Short-Term Load Forecasting With Exponentially Weighted Methods. IEEE Trans. Power Syst. 2011, 27, 458–464. [CrossRef]
- Son, N.; Jung, M. Analysis of Meteorological Factor Multivariate Models for Medium- and Long-Term Photovoltaic Solar Power Forecasting Using Long Short-Term Memory. Appl. Sci. 2020, 11, 316. [CrossRef]
- Zhou, S.; Han, Y.; Yang, P.; Mahmoud, K.; Lehtonen, M.; Darwish, M.M.; Zalhaf, A.S. An optimal network constraint-based joint expansion planning model for modern distribution networks with multi-types intermittent RERs. Renew. Energy 2022, 194, 137–151. [CrossRef]
- Ryu, H.-S.; Kim, M.-K. Combined Economic Emission Dispatch with Environment-Based Demand Response Using WU-ABC Algorithm. Energies 2020, 13, 6450. [CrossRef]
- Wei, Y.; Ye, Q.; Ding, Y.; Ai, B.; Tan, Q.; Song, W. Optimization model of a thermal-solar-wind power planning considering economic and social benefits. Energy 2021, 222. [CrossRef]
- Dantzig, G. B., & Thapa, M. N. (2003). Linear programming: Theory and extensions (Vol. 2). New York: Springer.
- Conejo, A.J.; Carrión, M.; Morales, J.M. Decision Making Under Uncertainty in Electricity Markets; Springer Nature: Dordrecht, GX, Netherlands, 2010.
- Bixby, R.E. A brief history of linear and mixed-integer programming computation. Documenta Mathematica 2012, 2012, 107-121.
- Wood, A. J.; Wollenberg, B. F.; Sheblé, G. B.. Power generation, operation, and control 2013. John wiley & sons.
- Momoh, J. A. Smart grid: fundamentals of design and analysis 2012 (Vol. 33). John Wiley & Sons.
- Benidris, M.; Elsaiah, S.; Mitra, J. An emission-constrained approach to power system expansion planning. Int. J. Electr. Power Energy Syst. 2016, 81, 78–86. [CrossRef]
Figure 1.
illustrates an example of a distribution system.
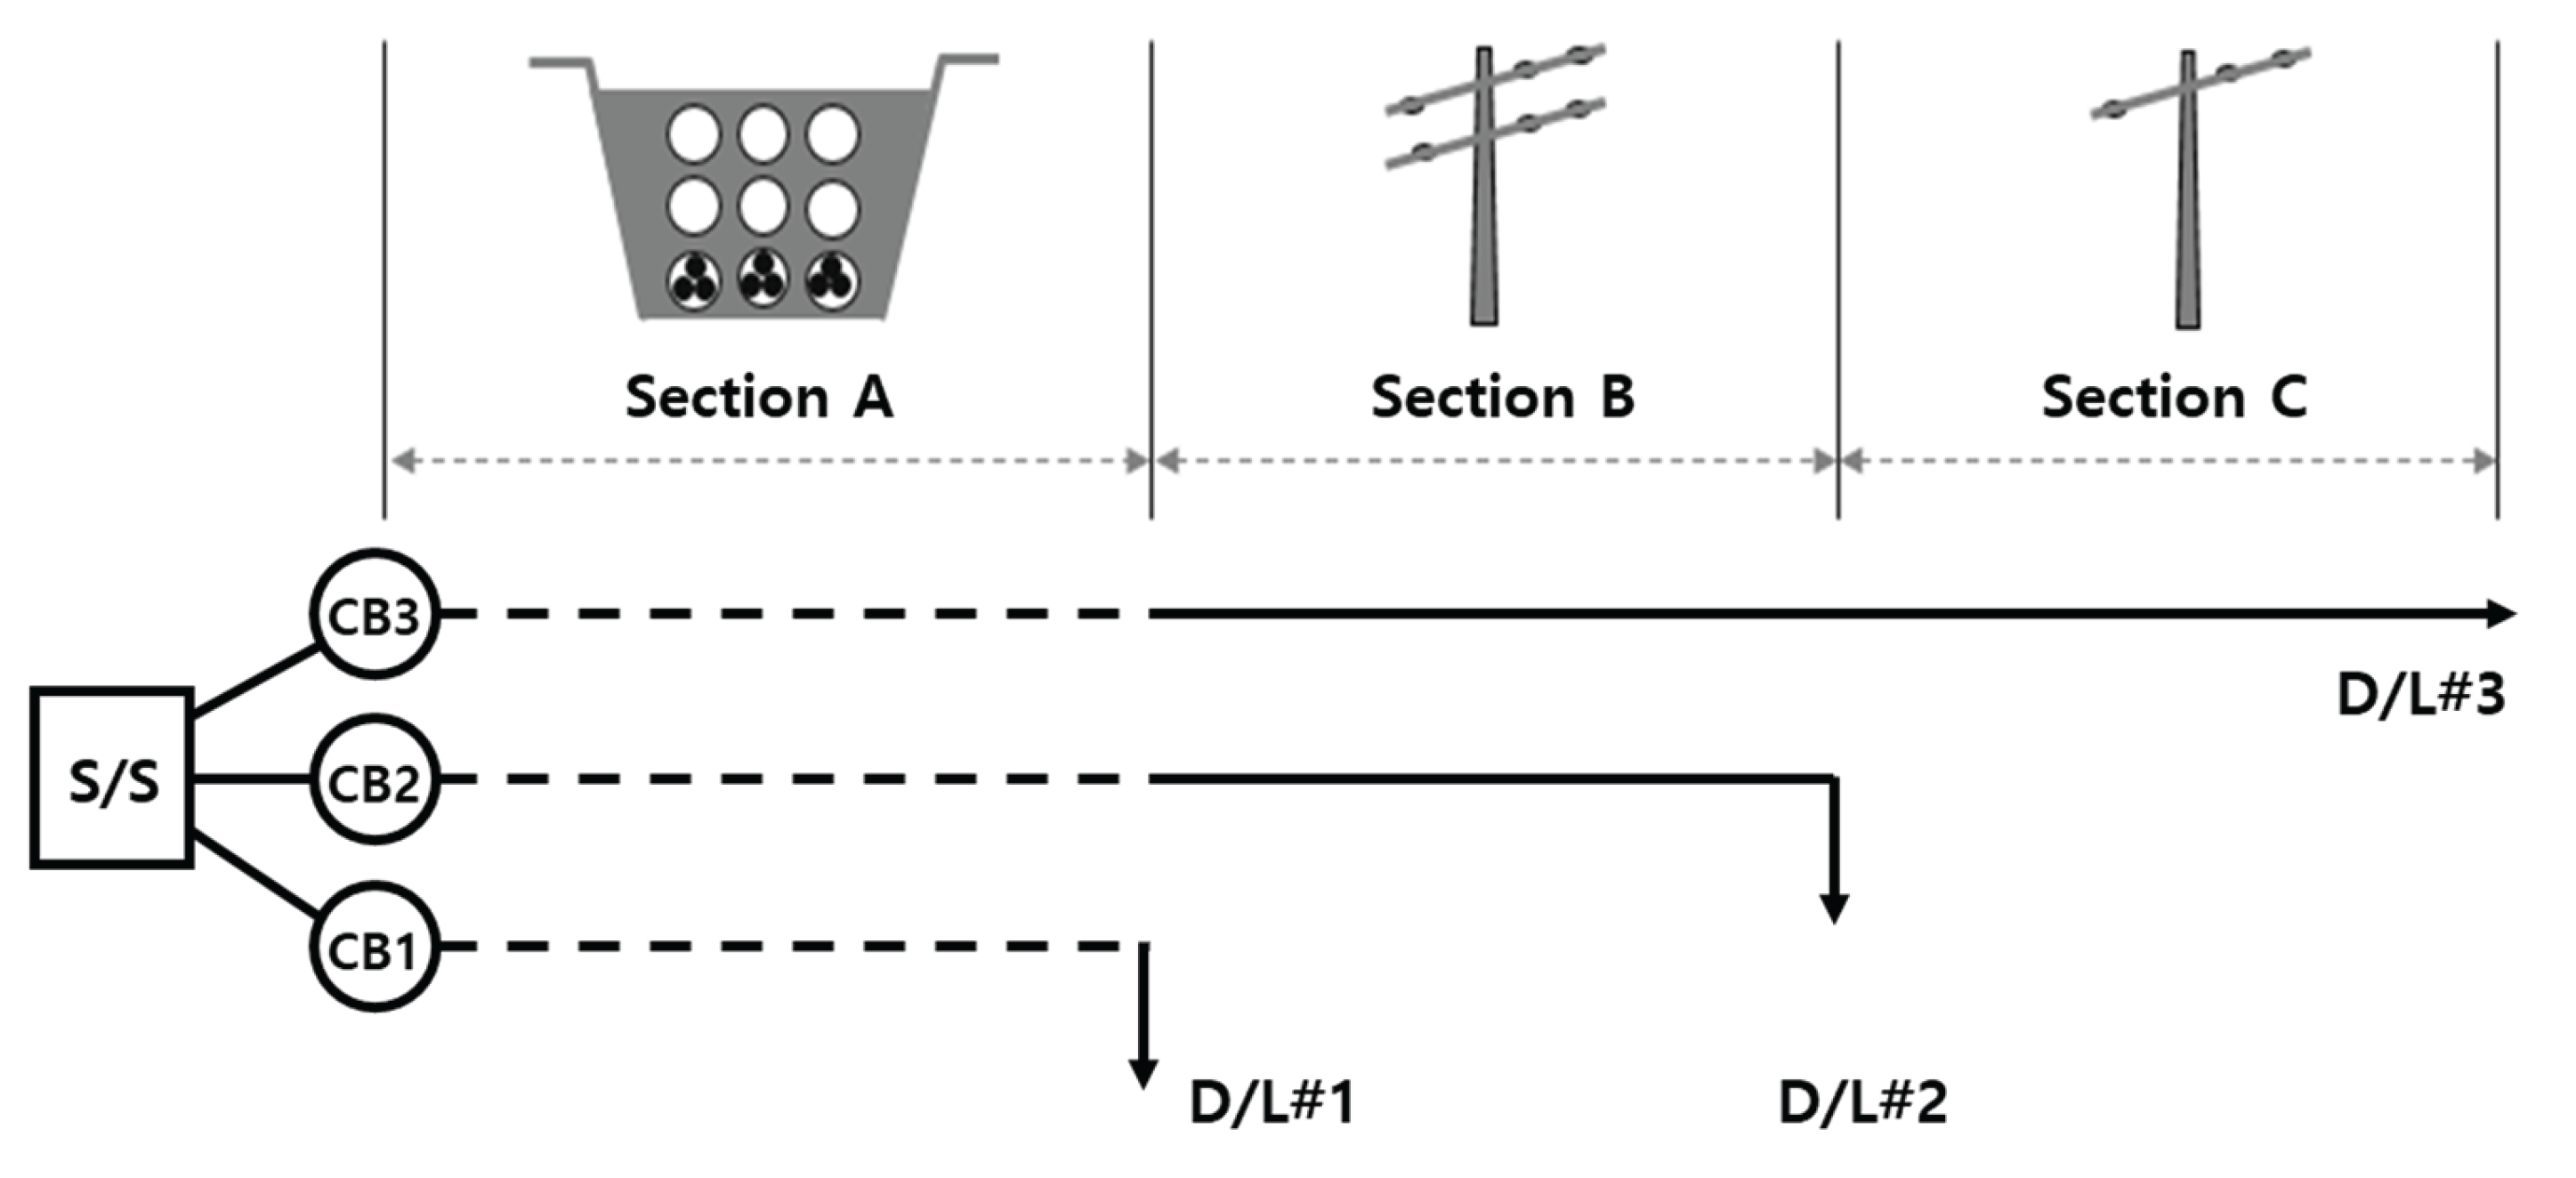
Figure 2.
Distribution network planning model structure.
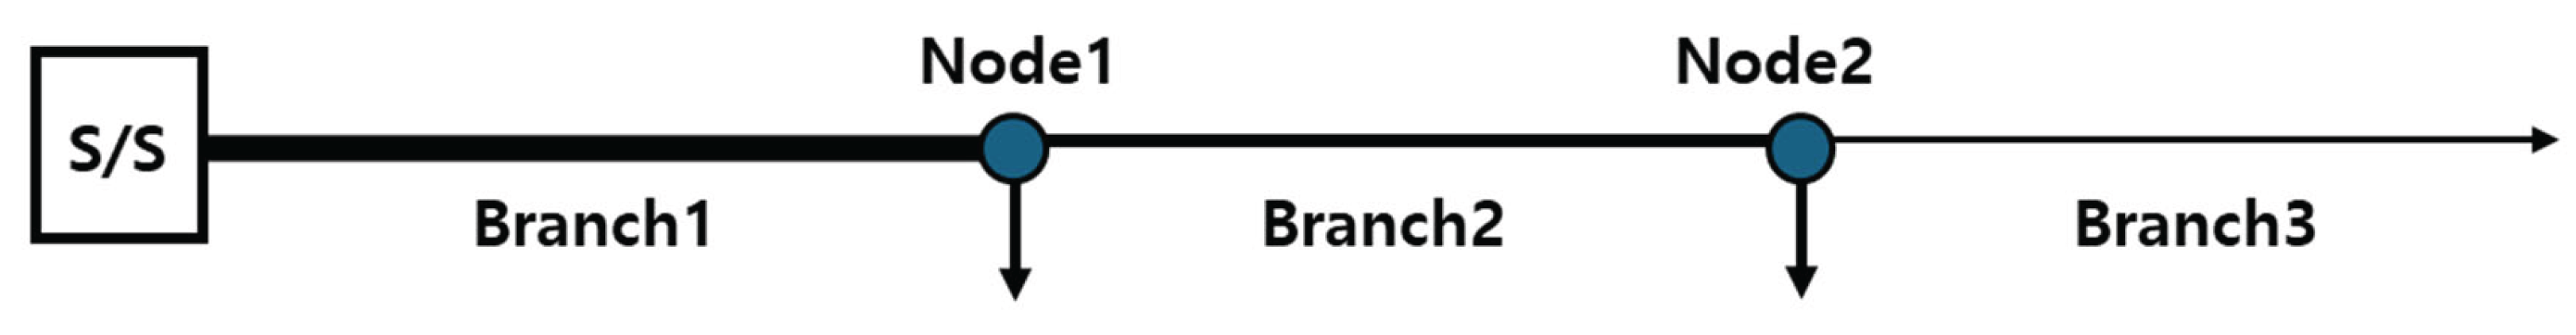
Figure 3.
Overall framework for mid- to long-term distribution planning.
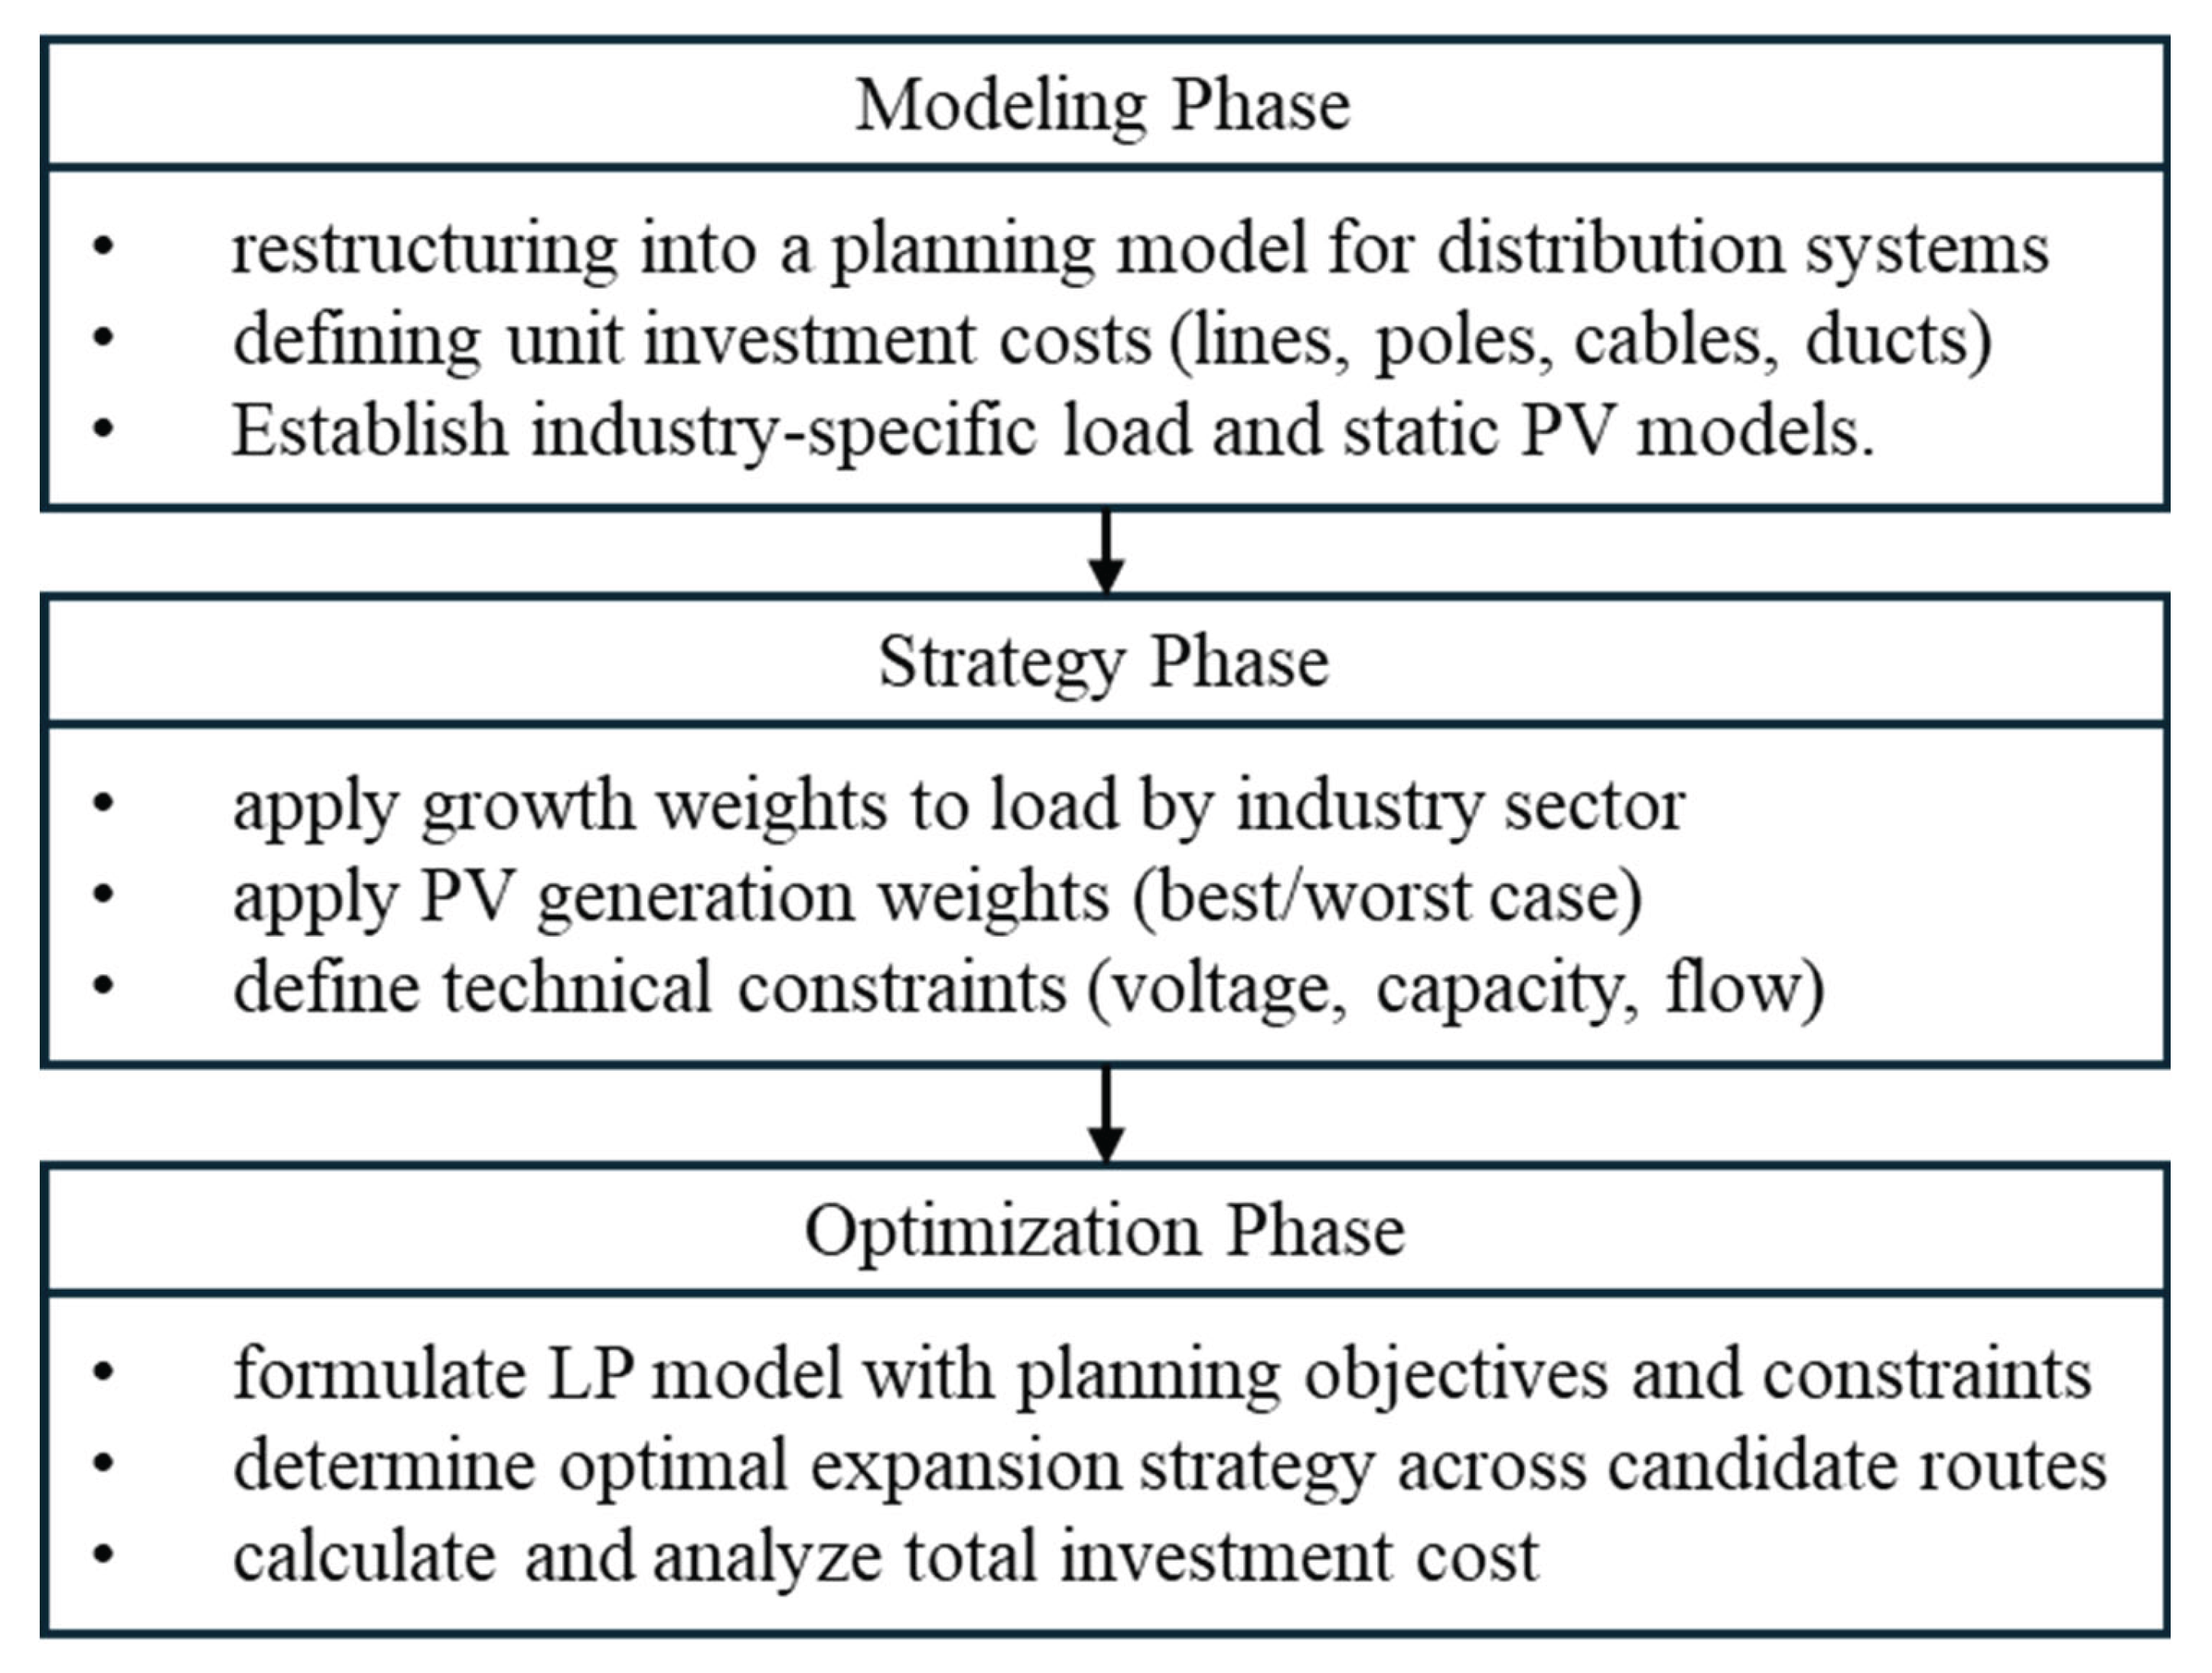
Figure 4.
Topology of the Sejong city distribution system.
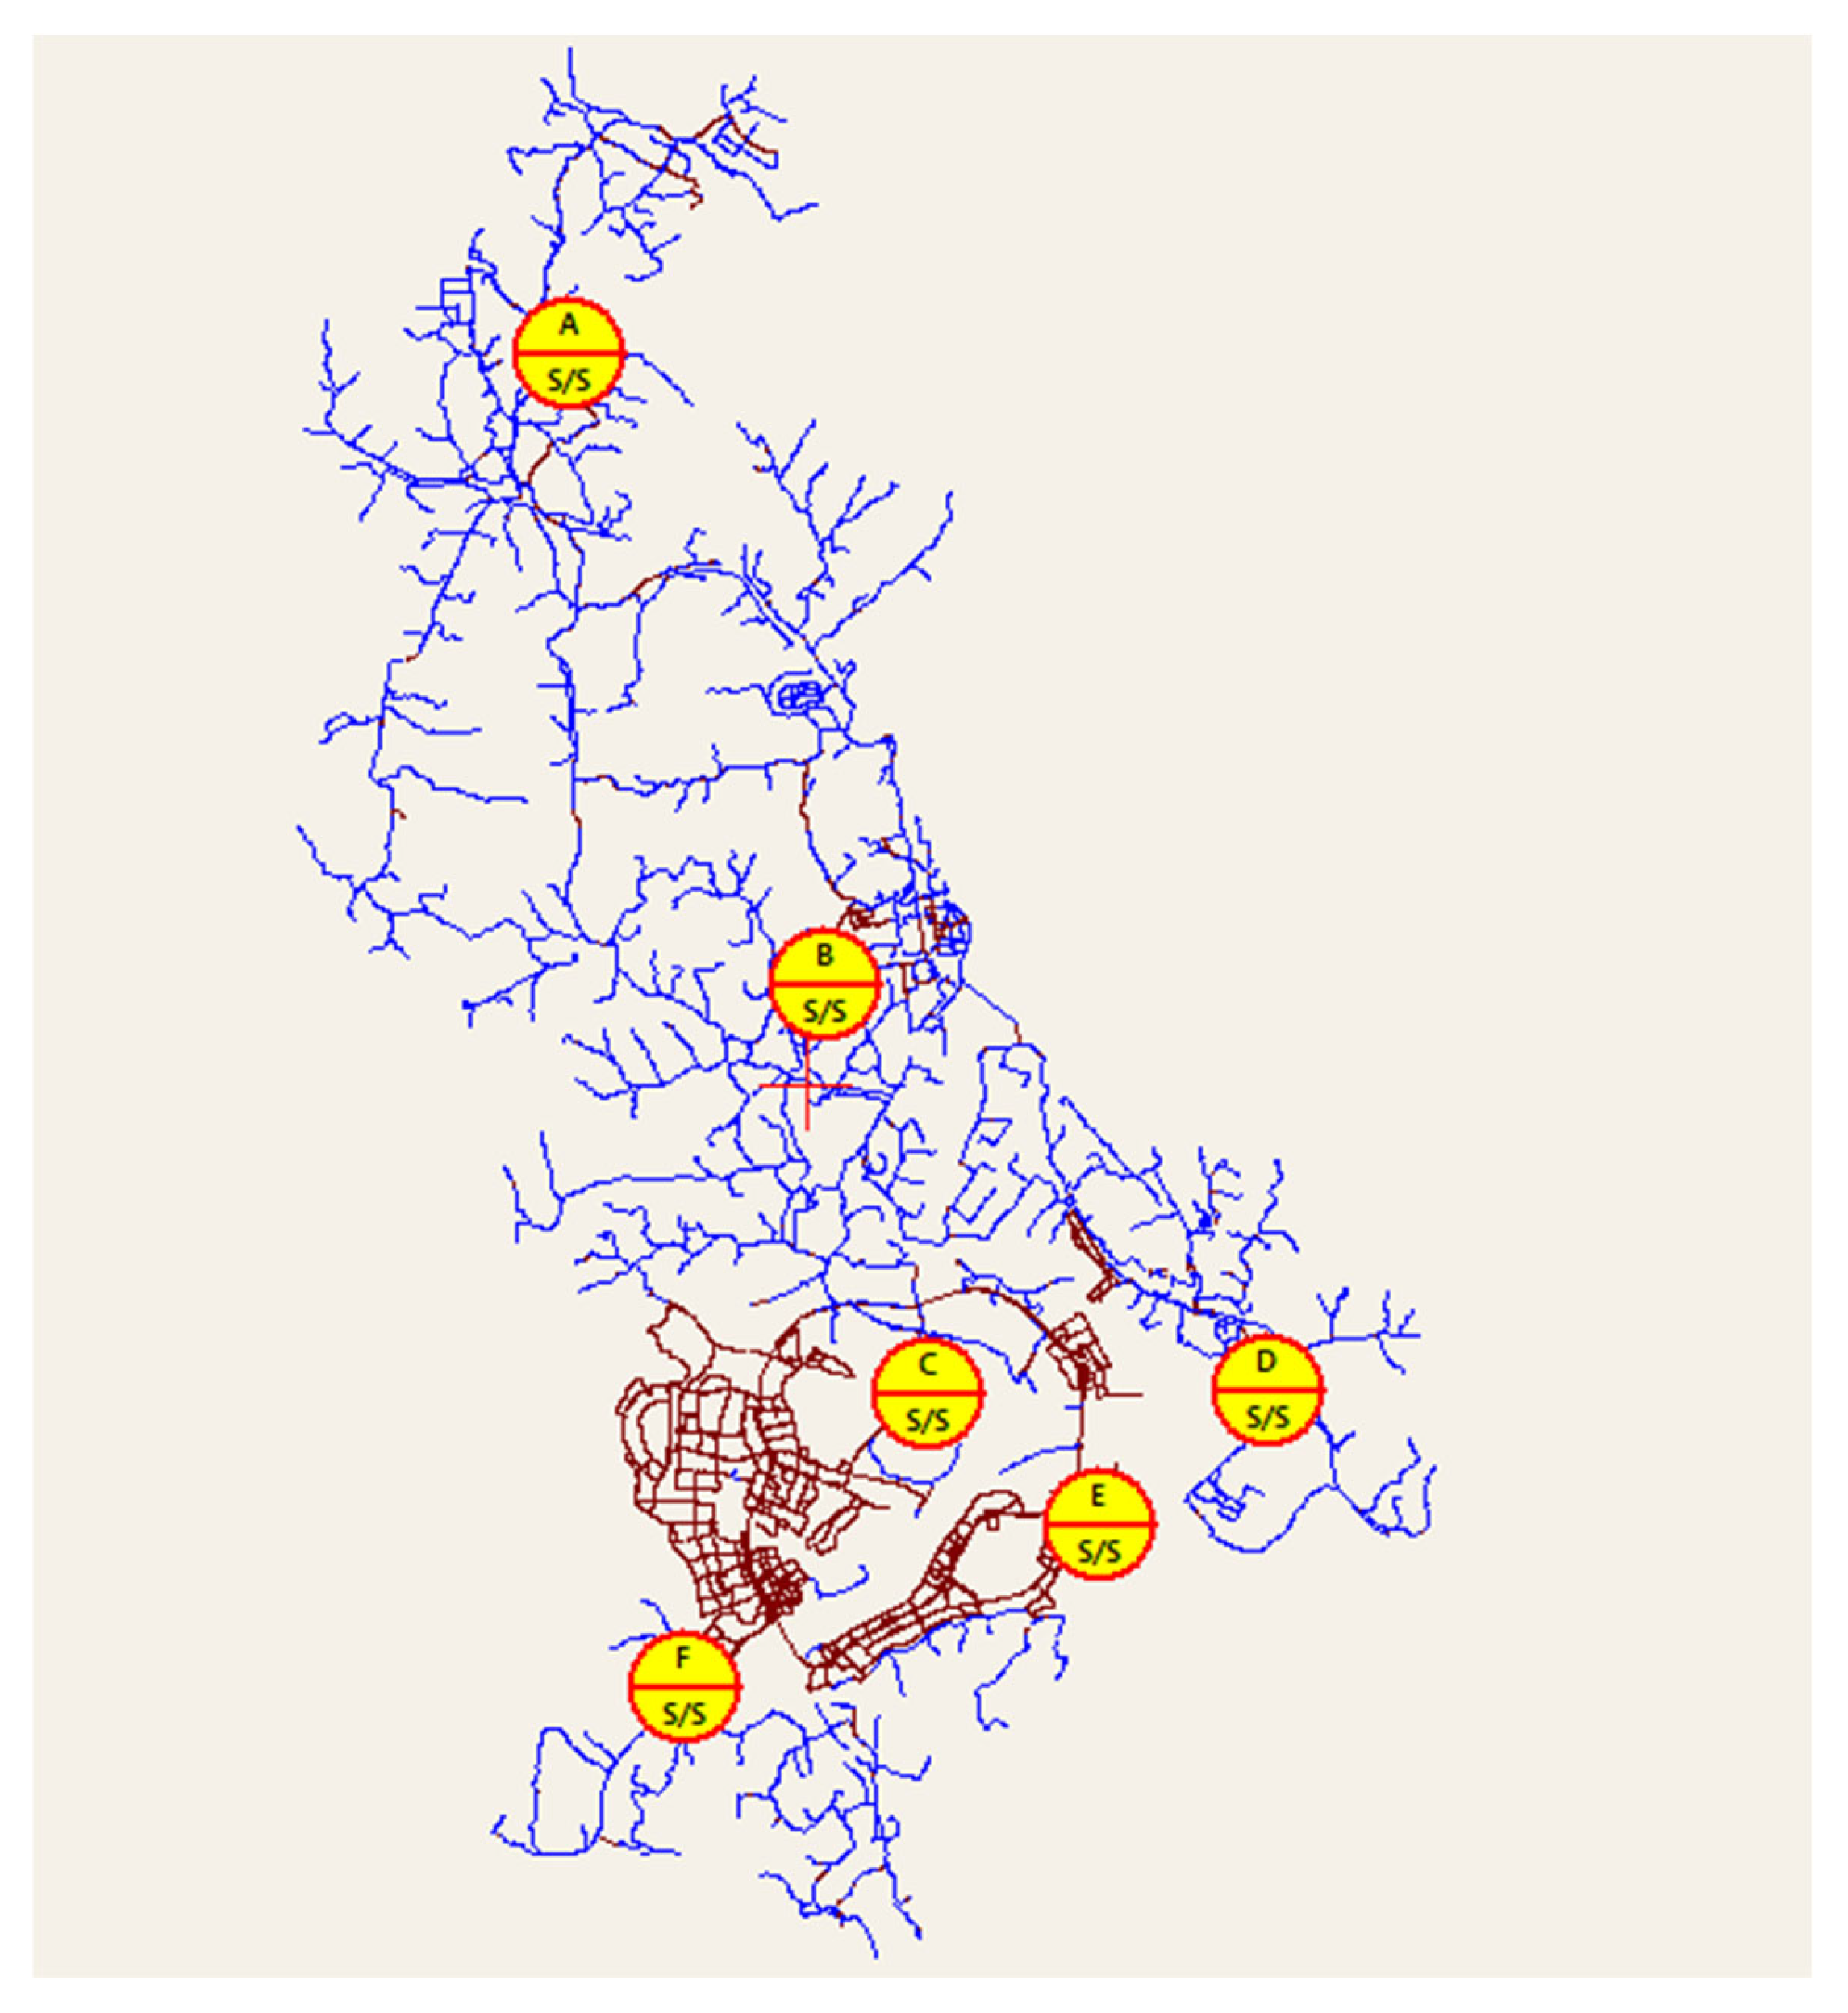
Figure 5.
Optimized distribution system configuration for the year N+1.
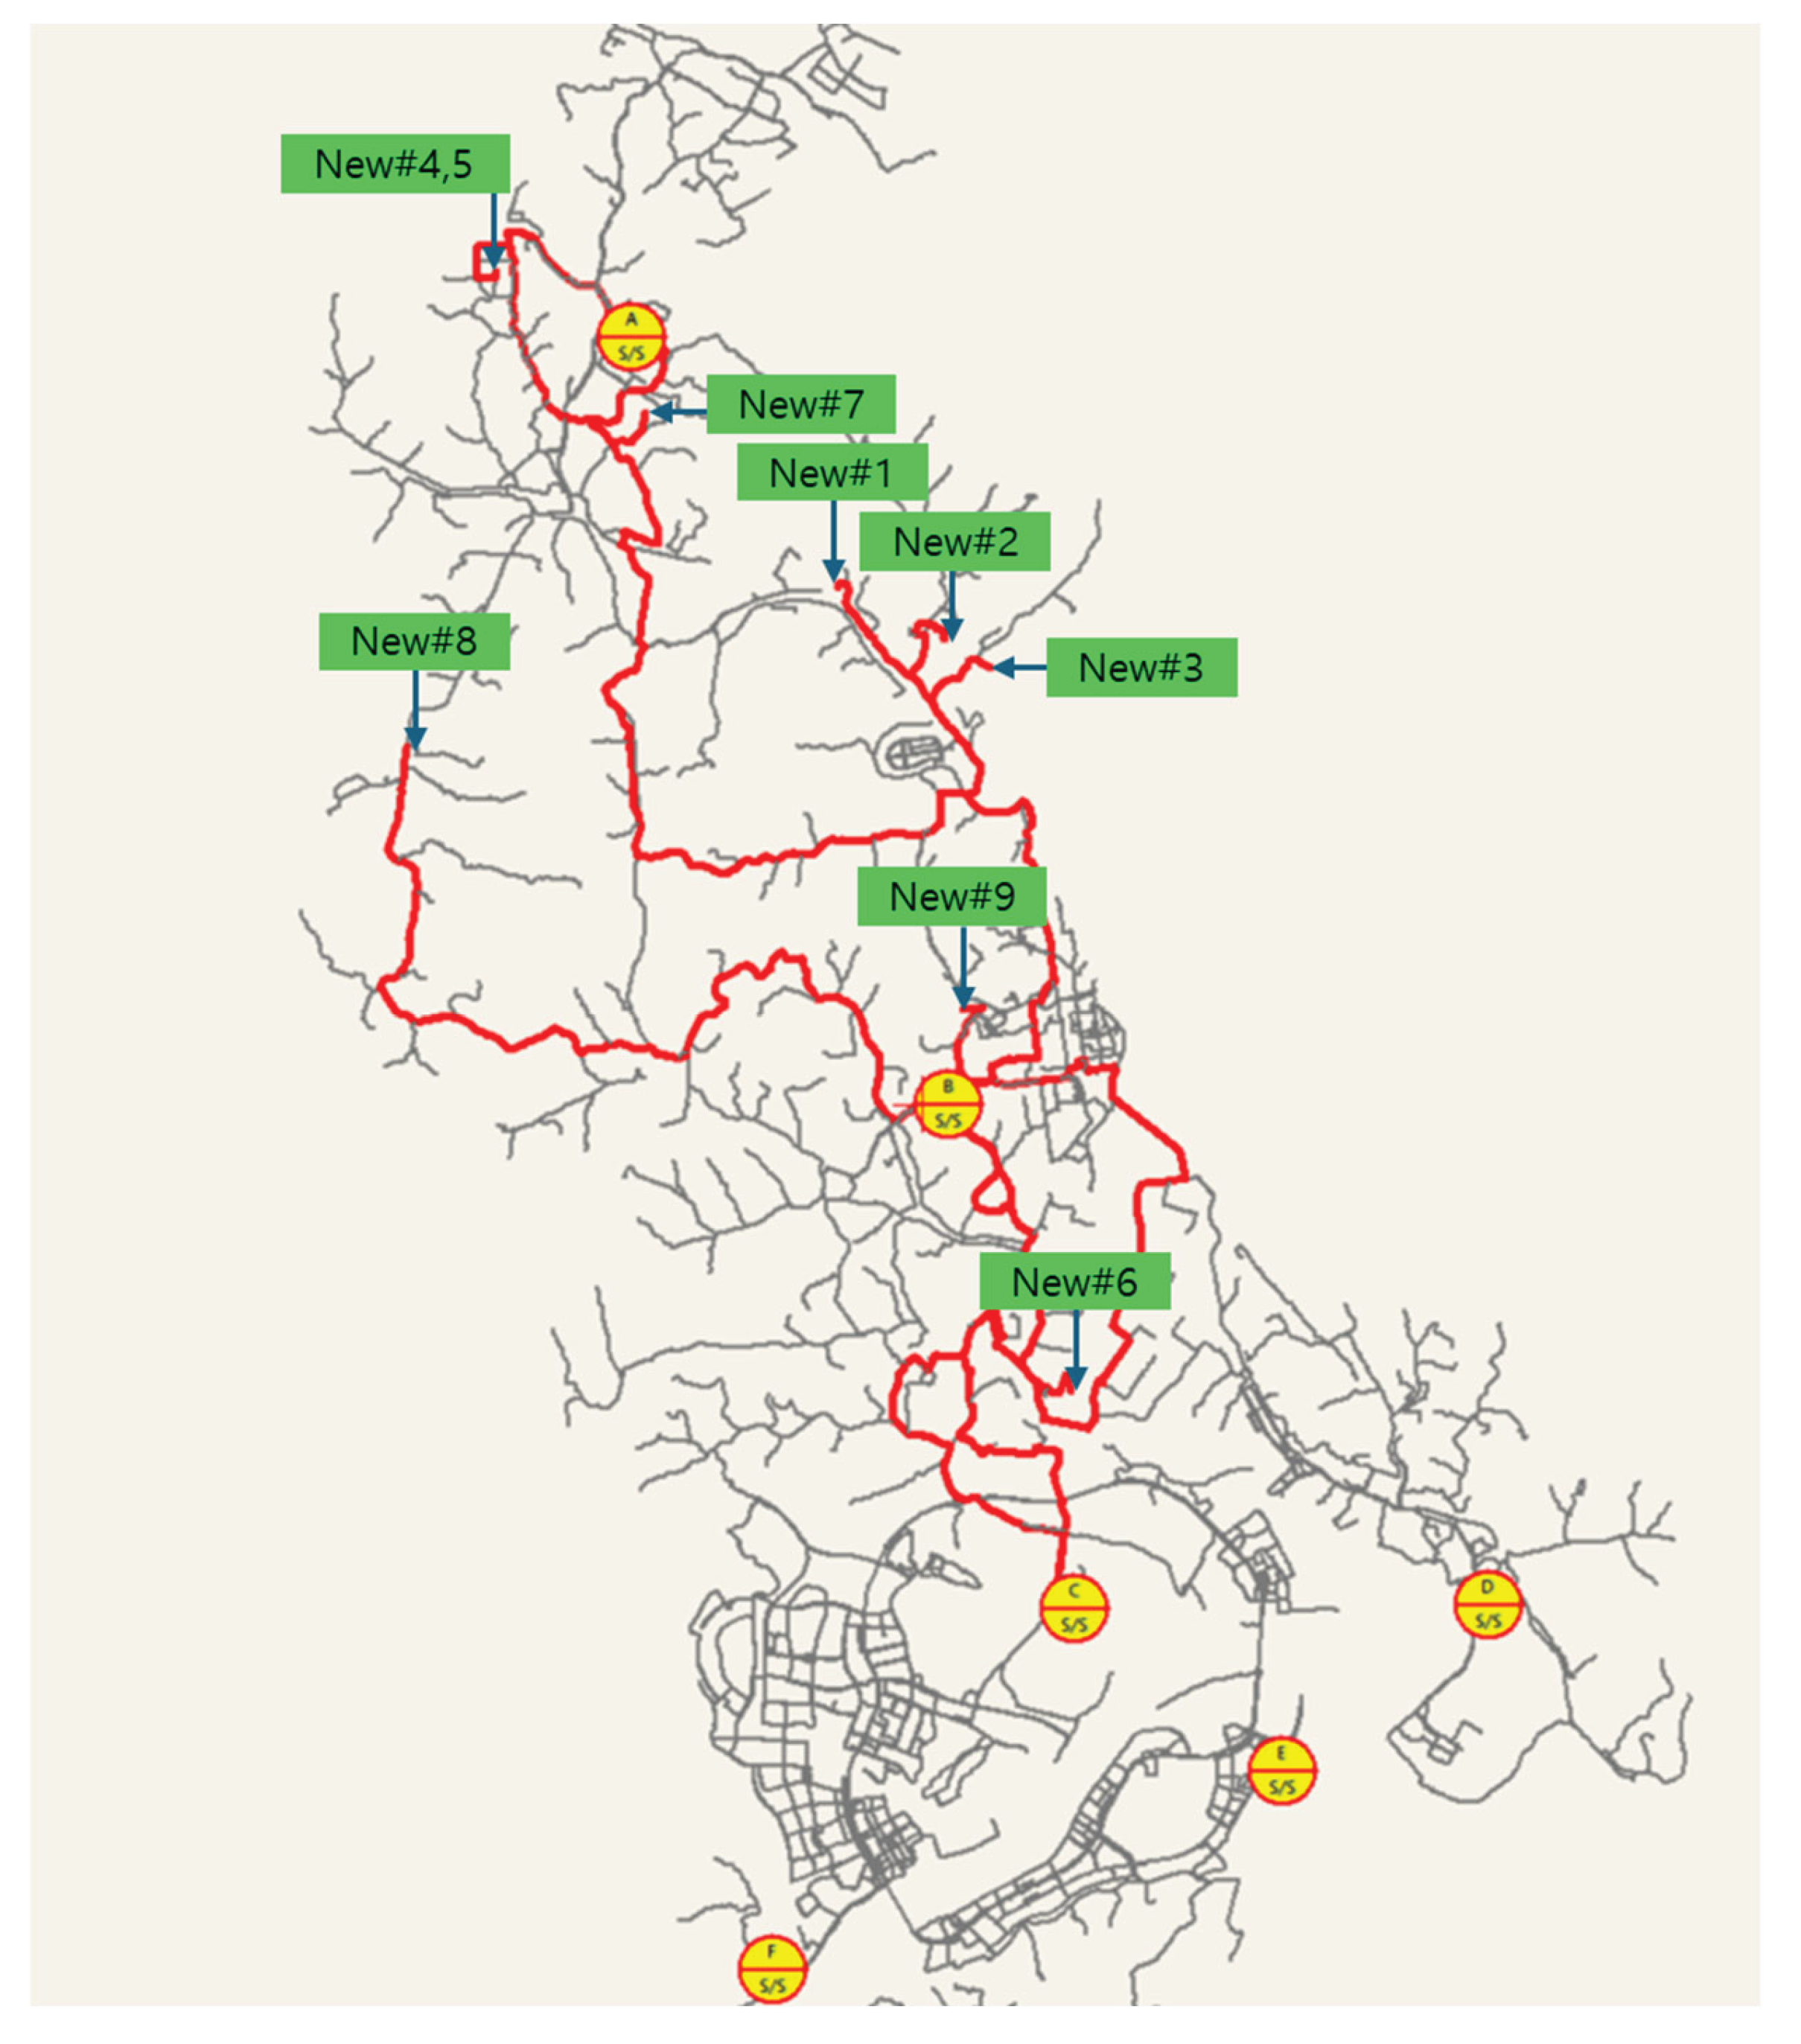

Table 1.
Infrastructure configuration by branch.
| Branch Info. | |||
| Branch1 | Branch2 | Branch3 | |
| Number of overhead lines | - | 2 | 1 |
| Number of spare overhead lines | - | 0 | 1 |
| Number of underground cables | 3 | 0 | 0 |
| Number of spare duct spaces | 6 | 0 | 0 |
Table 2.
Advantages of Linear Programming (LP) in Distribution Network Planning.
| Advantage | Description |
| Computational efficiency [23] | LP problems can be solved efficiently using deterministic algorithms, which is suitable for large-scale grid planning. |
| Scalability [24] | LP models scale well with network size and complexity, which is essential in distribution planning. |
| Solver compatibility [25] | LP is supported by various robust solvers such as CPLEX, Gurobi, and GLPK. |
| Interpretability [26] | Results such as shadow prices and dual variables can provide useful economic and technical insights. |
| Flexibility in scenario analysis [27] | The LP framework allows easy incorporation of different load growth and DER penetration scenarios. |
Table 3.
Substation Information.
| 1 | 2 | 3 | 4 | 5 | 6 | |
| Substation Label | A | B | C | D | E | F |
| Supply Capacity | 182.16 | 182.16 | 182.16 | 141.68 | 182.16 | 182.16 |
| Location | North | Central | Central | East | Southeast | Southwest |
Table 4.
Load Growth Over the Planning Horizon.
| Year | N | N+1 | N+2 | N+3 | N+4 | N+5 |
| Existing loads | 539.93 | 550.73 | 561.20 | 571.86 | 582.15 | 592.63 |
| Newly loads | 0 | 83.59 | 111.34 | 155.47 | 199.11 | 247.90 |
| Total loads | 539.93 | 634.32 | 672.54 | 727.33 | 781.26 | 840.53 |
Table 5.
Summary of Newly Contracted Loads.
| Feature | Total Contracted Capacity (MVA) | N+1 (MVA) |
N+2 (MVA) |
N+3 (MVA) |
N+4 (MVA) |
N+5 (MVA) |
|||||
| Manufacturing Facility | 8.5 | 8.5 | 0.0 | 0.0 | 0.0 | 0.0 | |||||
| Industrial Complex #1 | 2.8 | 1.0 | 0.3 | 0.3 | 0.3 | 0.7 | |||||
| Industrial Complex #2 | 12.3 | 4.6 | 1.5 | 1.5 | 1.5 | 1.5 | |||||
| Industrial Complex #3 | 8.2 | 3.1 | 1.0 | 1.0 | 1.0 | 2.1 | |||||
| Industrial Complex #4 | 0.8 | 0.3 | 0.1 | 0.1 | 0.1 | 0.2 | |||||
| Industrial Complex #5 | 12.4 | 4.7 | 1.6 | 1.6 | 1.6 | 3.1 | |||||
| Industrial Complex #6 | 19.9 | 7.5 | 2.5 | 2.5 | 2.5 | 5.0 | |||||
| Residential development #1 | 173.4 | 52.0 | 17.3 | 34.7 | 34.7 | 34.7 | |||||
| Residential development #2 | 9.6 | 1.9 | 3.4 | 2.4 | 1.9 | 0 | |||||
Table 6.
Unit Costs of Major Distribution Components.
| Component | Rated Capacity | Unit Cost | Unit |
| Overhead Line | 10MVA | $57,992 | $/km |
| Underground Cable | 10MVA | $186,085 | $/km |
| Overhead Switch | - | $8,608 | $/km |
| Underground Switch | - | $102,918 | $/km |
| Pole | - | $2,569 | $/unit |
| Duct | - | $139,416 | $/km |
| Manhole | - | $45,735 | $/km |
Table 7.
Detail Annual Optimization Results.
| Year | New Feeders (unit) | Overhead Line Extension (km) | Underground Cable Extension (km) | Duct Installation (km) |
Investment Cost (USD) |
| N+1 | 9 | 65.281 | 58.274 | 30.616 | 26.623M |
| N+2 | 3 | 3.653 | 10.553 | 9.689 | 4.848M |
| N+3 | 4 | 1.19 | 34.338 | 12.002 | 12.545M |
| N+4 | 6 | 6.218 | 67.415 | 21.717 | 24.292M |
| N+5 | 5 | 9.516 | 79.453 | 33.641 | 29.453M |
| Total | 27 | 85.858 | 250.033 | 107.665 | 97.762M |
Disclaimer/Publisher’s Note: The statements, opinions and data contained in all publications are solely those of the individual author(s) and contributor(s) and not of MDPI and/or the editor(s). MDPI and/or the editor(s) disclaim responsibility for any injury to people or property resulting from any ideas, methods, instructions or products referred to in the content. |
© 2025 by the authors. Licensee MDPI, Basel, Switzerland. This article is an open access article distributed under the terms and conditions of the Creative Commons Attribution (CC BY) license (http://creativecommons.org/licenses/by/4.0/).
Copyright: This open access article is published under a Creative Commons CC BY 4.0 license, which permit the free download, distribution, and reuse, provided that the author and preprint are cited in any reuse.


