
Submitted:
08 August 2025
Posted:
11 August 2025
You are already at the latest version
Abstract
Kapton-H type is an optical plastic with an UV-Vis-NIR spectrum characterized by abrupt absorbance change at a wavelength of ca. 550nm. Such sharp optical discontinuity, known as fundamental absorption edge, has been investigated by the Tauc plot method and a band gap energy (Eg) of (2.22±0.05) eV for an indirect transition model has been found. The Cody plot has been also applied and a slightly lower band gap energy value (i.e., Eg = 2.33±0.05 eV) was found. The Urbach rule applied to the spectrum tail has provided an Urbach energy value (EU) of ca. (185±2) meV, which is a quite high value, fully compatible with the highly disordered structure of this sterically rigid amorphous polymer. Cut-on wavelength (550nm), visible transparency (T% of ca. 80), and other relevant optical characteristics of Kapton-H type have been evaluated too.
Keywords:
Kapton-H type
; UV-Vis spectroscopy
; Cut-on
; Band gap energy
; Urbach energy
; Structural disorder
; Polyetherimide
1. Introduction
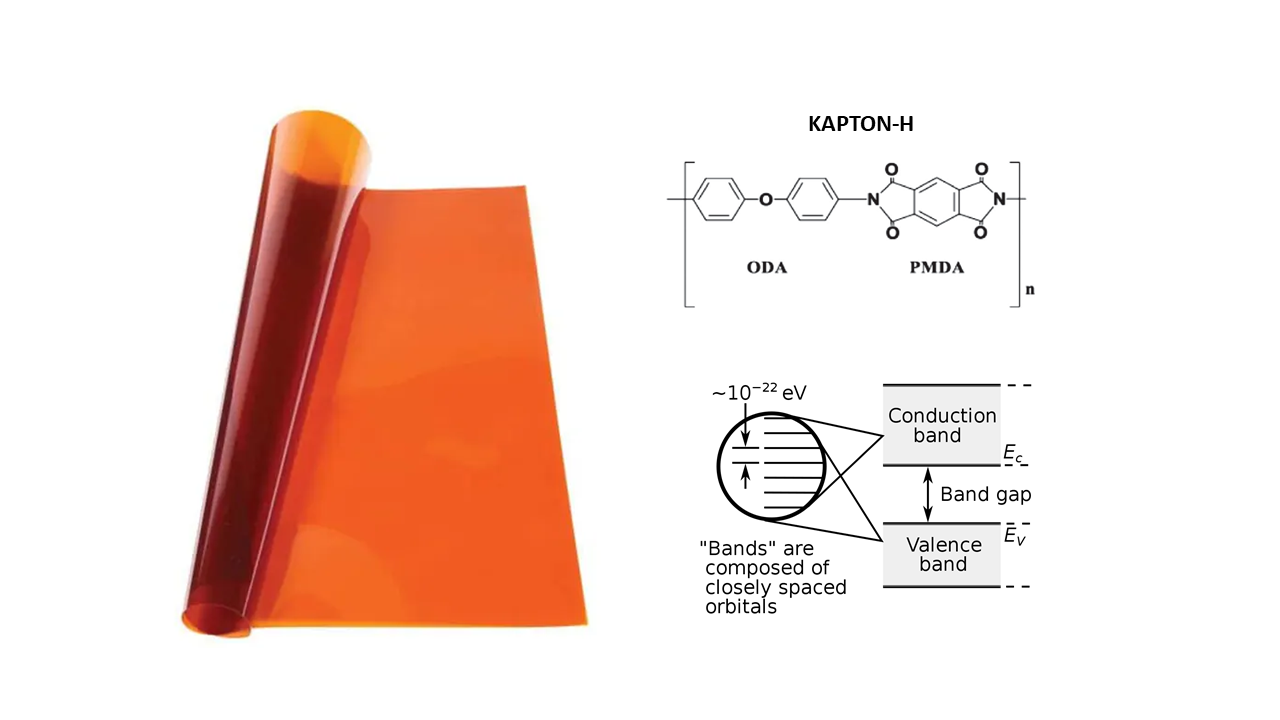
Kapton-H type is a high performance thermoplastic polymer, well-known for its high thermal stability, great electrical/thermal insulation capability, good resistance to ionizing radiations (e.g., X-rays), etc. [1]. However, Kapton-H is an optical-grade plastic too [2]; indeed, it is a perfectly transparent organic solid [3] with a refractive index value quite close to that of silica glass (ca. 1.70, sodium D-line, 589.0nm). The Kapton-H high optical transparency is due to its practically amorphous nature [4,5] (only a partial alignment of polymer chain folding is present), that makes this polymer completely unable to scatter visible light. Kapton-H has two important functional properties that lead it as very attractive material for industrial applications. Firstly, Kapton-H films uniformly absorb the full ultraviolet spectral region [6], that is, the electromagnetic radiations with a wavelength ranging from 190nm to 400nm and therefore it can be used as shield for this type of ionizing radiation (precisely, radiations belonging to the UV-A, -B and -C spectral sub-bands are completely extinguished). Since Kapton-H is a high performance thermoplastic polymer widely used in space technology [7], such an additional shielding characteristic expand further the advantages deriving from its use in this special area of technology (UV radiation is particularly abundant outside the earth atmosphere). In addition, this optical plastic strongly absorbs visible light in the 400-500nm spectral range (i.e., violet, blue and green lights) and such strong optical absorption causes the characteristic bright gold-yellow coloration showed by this plastic material [8], that consequently can be industrially exploited for applications as color filter [9]. In particular, yellow color filters are very useful optical devices since they have a number of industrial applications, varying from the pharmaceutical packaging, to snow/night goggles, safety lighting systems, car headlights and/or fog lights, etc. [10,11].
The photo-excitation of Kapton-H in ultraviolet/visible spectral regions can be accurately described by using the band theory [2]. This solid-state physical theory can be indifferently applied to all type of covalent crystals and amorphous solids included polymers, glasses and other dielectric substances [12,13,14]. The special absorption behavior of Kapton-H is a consequence of the interband electronic transitions. In particular, photons have the capability of exciting electrons from whatever occupied levels in the valence band (VB) to whatever unoccupied levels in the conduction band (CB). The band edge transition is named HOMO-LUMO transition. This interband transition is purely quantum mechanical in nature and therefore it is quantized; however, energetic levels in both bands are so close (ca. 10-22eV) that photon absorption appear like a continuum phenomenon taking place when the band edge energy is exceeded.
Here, the absorption properties of Kapton-H in the UV-Vis-NIR spectral regions have been in-depth investigated by using optical spectroscopy measurements, combined with standard analysis methods like the Tauc plot [15], Urbach rule [16], Cody plot [17], etc. In particular, the performed analyses have allowed to evaluate Kapton-H electronic/optical characteristics like the band gap energy (Eg), Urbach energy (EU), visible transparency percentage, cut-on wavelength and to quantify the structural disorder in this amorphous material.
2. Materials and Methods
Films of Kapton-H were provided by Wetec (GmbH, Germany) and polyetherimide (PEI) pellets were provided by Aldrich. Kapton-H (i.e., poly-oxydiphenylene-pyromellitimide, PMDA-ODA, -(C22H10N2O2)n-) is a linear polymer having heterocyclic rings linked together by one or more covalent bonds. Optical spectra were obtained at room temperature by using a double beam UV/Visible spectrophotometer (VWR, UV-6300PC Spectrophotometer). These spectra were recorded in the 190-1100nm wavelength range with low scan speed and a scan step (resolution) of 0.5nm (the slit 0.0 was used). Spectra have been processed by a devoted analysis software (UV-Vis Analyst, Version 5.44). In particular, Kapton-H was tested in form of films (rectangular specimens, 1cmx3cm), without to use any type of reference sample. These rectangular films were stuck to the instrument sample holder by paper adhesive tape. Thin PEI films were obtained by solution casting technology, using chloroform (Aldrich) as solvent. Film thickness for absorption coefficient determination was measured by using a digital precision micrometer (Mitutoyo, Kawasaki, Japan) and resulted of 44μm for Kapton-H and 240μm for PEI.
3. Results
Optical spectra of Kapton-H films have been obtained in both absorbance (A) and transmittance (T) modes in the 190nm-1100nm spectral range (see Figure 1a,b). As visible, the optical spectrum is characterized by a very sharp transmittance change in the visible light spectral range (precisely, the green-yellow region). In particular, this rapid variation of the visible light transmittance value takes place at a wavelength of ca. 550nm; indeed, the Kapton film transmittance percentage is close to 80 at wavelengths higher than 600nm and close to zero at wavelengths lower than 500nm. Therefore, the transmittance switching can be assumed to take place at a wavelength value of ca. 550nm. It must be pointed out that at wavelengths lower than 500nm the transmittance value assumes a continuous value very close to zero, up to the extreme spectroscopically measurable spectral value (190nm). Therefore, Kapton should have a very broad absorption band characterized by a large extinction coefficient in the ultraviolet spectral region and consequently, absorption measurements made on this polymer only record the absorption edge. Since the transmittance change starts at 600nm and complete at 500nm, it is possible to assume for the Kapton-H optical filter a cut-on (or cutoff) wavelength of 550nm. In particular, cut-on is defined as the wavelength where the absorption coefficient is 50cm-1.
The absorption coefficient, α, (i.e., fractional attenuation in intensity per unit distance) has been calculated from the raw absorbance data, A, by using the law: α=2.303∙A/d [18], where d is the path length of light, corresponding to the film thickness (d=0.044mm). The wavelength corresponding to each absorption coefficient values have been converted to energy (expressed in eV) by using the equation: λ(nm)=1239.8/E(eV) [16]. A plot of absorption coefficient versus energy in semi-logarithmic scale has been made (see Figure 2). This type of spectrum representation has been used to estimate the Urbach energy value from the slope of the linear part of the spectrum. Indeed, according to the Urbach rule, the absorption coefficient (α) grows exponentially with the increasing of the photon energy (E):
which in logarithm form becomes:
α = α0·exp(E/EU)
ln(α) = ln(α0) + (1/EU)·E
The inverse of this slope corresponds precisely to the Urbach Energy (EU) of Kapton expressed in eV and this quantity is directly proportional to the structural disorder in this amorphous polymer. A value of (185±2) meV has been found by the regression analysis of the linear part of the spectrum (R2=0.9996) shown in Figure 2 and such quite high energy indicates a high disordered structure of this amorphous polymer, probably due to its steric rigidity.
The band gap energy (Eg) value is a further important physical property of Kapton-H, that can be optically estimated. The measurement of the band gap energy is really essential in both the semiconductor and nanomaterial industries, however it can be very useful also in the case of dielectric substances like polymers and glasses since this quantity defines the electrical and thermal insulation capability of the material. This quantity can be evaluated by drawing the Tauc plot for a direct and indirect allowed transition model, with the aim to establish which model provides a better fitting of the experimental optical data. According to the Tauc plots shown in Figure 3a,b, data were more conveniently described by an indirect allowed band gap transition model (i.e., (αhγ)1/2=k(hγ-Eg)), which is the classical expression used by Tauc for the amorphous semiconductors. Such indirect allowed transition model has provided an Eg value of (2.22±0.05) eV (intercept of the linear part of the graph characterized by R2=0.9993, obtained as opposite of the ratio between intercept and slope, -Y(intercept)/Slope), which is in accordance with the value given in the literature for this type of amorphous polymer [2]. The optical measurement of the band gap energy can be exploited also for analytical uses, like the identification of polymers of unknown nature by comparing their Eg values with date given in the literature for the different polymers.
Alternatively, the band gap energy of Kapton-H can be determined by elaborating the optical absorption measurements according to Cody plot method [17]. The Cody model is based on a constant dipole matrix approximation and it is related to the absorption coefficient by the following expression: (α/hγ)2=k(hγ-Eg). As shown in Figure 4, this plot shows a linear behavior in the high photon energy range (R2=0.9975). Such an approach has provided a value of Eg of (2.33±0.05) eV, which is slightly higher than that estimated by the Tauc plot for the indirect transition model and therefore close to the value usually assigned this polymer [2].
Finally, the Kapton-H optical spectrum has a quite standard behavior, that includes a dramatic transmittance change from a very high value (ca. 80%) to zero at the cut-on wavelength. Compared to the typical solid polymer spectral behavior, Kapton-H has the following two peculiarities: (i) the cut-on is located just in the middle of the visible spectral range, i.e., at ca. 550nm, while such transition is typically observed in the UV-A/B region for other types of polymer and (ii) a pronounced exponential decay (i.e., the so called Urbach tailing) is visible in the region of the fundamental absorption edge. Owing to the quite sterically rigid structure, short-range order in this amorphous polymer should be much lower than in polymers with a flexible backbone.
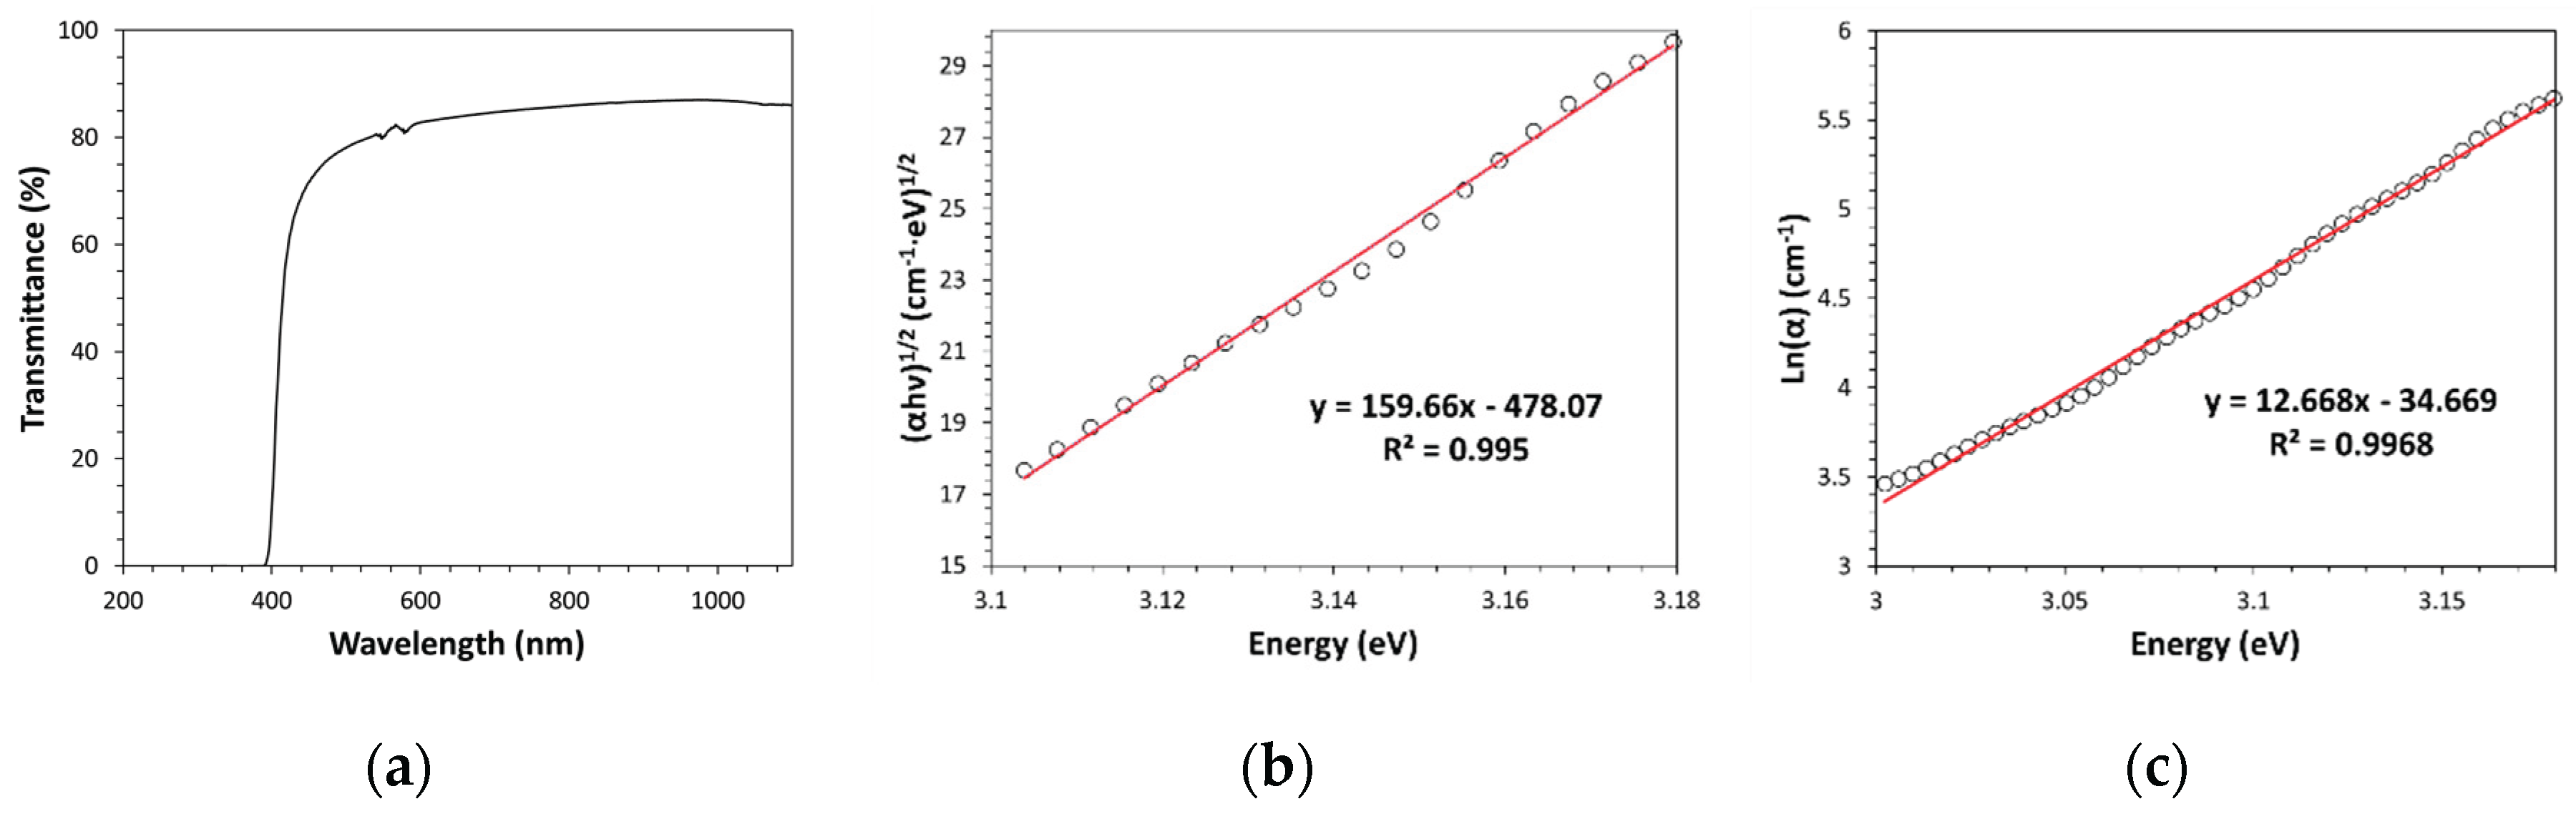
Kapton-H belongs to the polymeric class of polyimides; however, it is characterized by a band gap energy value slightly lower than that of other polyimides. Such a behavior is probably due to the much more extended conjugation in the contained aromatic heterocyclic groups and to the involved light absorption mechanism based on electron transfer [19]. For example, according to the results obtained by applying the Tauc plot method, for an indirect allowed electron transition model, to polyetherimide (PEI) (see Figure 5 a,b), a band gap value of (2.99±0.02) eV has been found. In this type of analysis, Cody plot and other electron transition models (e.g., direct allowed electron transition) do not seem to be adequate for describing electronic transition in PEI; indeed, they do not show a linearity region. The Urbach rule applied to PEI (see Figure 5c) leads to an Urbach energy value of (78.9±0.5) meV, thus indicating a lower content of structural disorder compared to Kapton-H. Such lower content of structural disorder should be related to the much higher PEI backbone flexibility (i.e., lower macromolecular chain stiffness). As visible in Figure 5a, PEI has a cut-on located at a wavelength lower than that of Kapton-H (ca. 400nm); however, it is pale-yellow colored since its optical absorption starts in the spectral region of blue. Similarly to Kapton-H, PEI is an amorphous polymer and therefore it has a quite high visible transparency (ca. 80%).
The technological potentialities of polymers are related to their physical properties and some of them are strictly depending on the values of these optically-measured parameters. Particularly useful in the amorphous polymers characterization is the determination of the Urbach energy value. Indeed, in semi-crystalline polymers, XRD measurements allow to establish only the fraction of amorphous phase in the solid and usually a low crystalline fraction characterizes most semi-crystalline polymers. Differently, optical plastics are fully amorphous phases and consequently the XRD technique cannot provide useful information about them. Structural disorder in the Kapton-H or PEI amorphous phases cannot be assessed by XRD since the diffuse halo shape of these two polymers is not related to it. However, the nature of this amorphous phase changes significantly between different amorphous polymers; indeed, chain rearrangement capability depends on the polymer flexibility and it may vary significantly. Highly stereorigid aromatic polymers, like Kapton-H, do not have the possibility to reorganize the own macromolecular segments for increasing the intermolecular interactions; differently, the flexibility of PEI chains is much higher than Kapton-H and therefore these polymeric chains can better organize lowering the system entropy. Optical measurements can be indifferently applied to all types of polymers in form of thin films for achieving information on the structural disorder in the amorphous phase.
4. Discussion
The optical investigation of the Kapton-H electronic structure is useful for different reasons. For example, this investigation may allow (i) to establish which technological potentialities has such type of polymer in fields like optics (e.g., color filters, UV-blocking optical windows, etc.); (ii) to identify an unknown polymer sample based on its characteristic band gap energy value; (iii) to acquire in-depth structural information on it (e.g., structural disorder content); etc. The electronic structure of a polymer can be determined by investigating its capability to interact with photons of different wavelengths. In particular, absorption measurements in different spectral regions are required in order to obtain information on the full electronic structure of the polymer. Here, the optical spectrophotometer has allowed to measure the Kapton capability to absorb photons of low energy (near infrared radiation, NIR), medium energy (visible radiation) and high-energy (ultraviolet radiation, belonging to the A, B and C sub-bands). Such photon absorption is a direct consequence of the electronic transitions that can occur in the solid phase and therefore, in turn, the absorption measurement allows deducting the external (valence) electronic configuration of the polymer. According to the achieved optical spectra, Kapton like other solid polymers have a band electronic structure, that is, contains wide spatial regions made of energetically very close levels (delocalized orbitals) that can be both filled or unfilled by electrons (valence and conduction bands, respectively). The measurement of absorbed photon energy has allowed to establish both spacing (i.e., band edge energy corresponding to the HOMO-LUMO transition) and extension of these bands.
It must be pointed out that absorption spectroscopy practically constitutes a universal characterization technique for polymers; indeed, optical spectra can be obtained for both amorphous and semi-crystalline polymers by using adequately thin films. As a consequence, the optical measurement of the band gap energy value can be used as a simple analytical approach to establish the nature of an unknown polymeric sample; indeed, each polymer has a own specific value of Eg.
On the other hand, the Kapton optical absorption for energies below the fundamental absorption edge (Urbach region) is exponential in nature and this behavior can be in-depth investigated and the curvature can be quantitatively described by the Urbach energy value, which reflects the amount of local intermediate states and therefore the level of structural disorder characterizing the polymeric system. Such information coming from this simple optical analysis of the amorphous polymer electronic structure makes possible to classify amorphous polymers based on their disorder content. Finally, in the case of Kapton-H, this investigation has evidenced a high disorder content, which is compatible with the amorphous nature of a stereorigid polymer.
5. Conclusions
The Kapton optical characterization in the spectral region of the fundamental absorption edge has shown: (i) strong optical absorption for photons with energy larger than (2.22±0.05)eV (band gap energy values obtained by the Tauc plot, while the Cody plot gives an Eg value of 2.33±0.05eV); (ii) indirect allowed band gap behavior (the best Tauc plot fitting has been obtained with the indirect allowed transition model, which is a characteristic of all amorphous semiconductors); (iii) 80% transmittance for photons with energy values below (2.22±0.05) eV; and (iv) significant tailing (EU=(185±2) meV), as expected for a high disordered amorphous polymer characterized by a stiff aromatic backbone. The same optical approach has been applied to PEI, finding a lower EU value (that is, (78.9±0.5) meV). This special optical behavior allows Kapton-H to be used for fabricating yellow color filters, UV-absorbers, thermally-resistant optical windows, etc.
Funding
This research received no external funding.
Data Availability Statement
Data are available from the Author.
Acknowledgments
The author is grateful to Mrs. Alessandra Aldi (IPCB-CNR) and Mrs. Maria Rosaria Marcedula (IPCB-CNR) for the technical support and useful discussions.
Conflicts of Interest
The authors declare no conflicts of interest.
References
- Sezer Hicyilmaz, A.; Celik Bedeloglu, A. Application of polyimide coatings: a review. SN Appl. Sci. 2021, 3, 363. [CrossRef]
- Kumar, V.; Goyal, P.K.; Gupta, R.; Kumar, S. Tailoring of optical gap and refractive index of heat treated Kapton-H polyimide. AASR 2011, 2(2), 79-85.
- Shi, J.; Gong, C.; Tian, X.; Yang, S.; Chu, P.K. Optical properties and chemical structures of Kapton-H film after proton irradiation by immersion in a hydrogen plasma. Appl. Surf. Sci. 2012, 258, 3829-3834. [CrossRef]
- Gupta, S.K.; Gupta, R.; Singh, P.; Kumar, V.; Jaiswal, M.K.; Chakarvarti, S.K.; Kumar, R. Modifications in physico-chemical properties of 100MeV oxygen ions irradiated polyimide Kapton-H polymer. Nucl. Instr. Meth. Phys. Res. B 2017, 406, 188-192. [CrossRef]
- Aarya, S.S.; Srivastava, A.K.; Mishra, M.; Wahab, M.A. Allotropic modification induced by Co60 radiation on the structural and optical properties of aromatic polymers. Adv. Mater. Res. 2011, 383-390, 3264-3271. [CrossRef]
- ‘Transparent polyimide film with ultraviolet (uv) blocking function, preparation and use thereof’, Patent number: WO2017071643A1.
- Pernigoni, L.; Grande, A.M. Advantages and challenges of novel materials for future space applications. Front. Space Technol. 2023, 4, 1253419. [CrossRef]
- Li, R.; Li, C.; He, S.; Di, M.; Yang, D. Radiation effect of keV protons on optical properties of aluminized Kapton film. Radiat. Phys. Chem. 2007, 76, 1200-1204. [CrossRef]
- Virk, H.S.; Chandi, P.S.; Srivastava, A.K. Physical and chemical response of 70MeV carbon ion irradiated Kapton-H polymer. Bull. Mater. Sci. 2001, 24(5), 529-534. [CrossRef]
- Ahmad, A.; Sughra, U.; Habib, M.K.; Imran, M. Contrast sensitivity improvement with yellow filter in low vision patients. IMJ 2017, 9(6), 402-405. [CrossRef]
- Kohmura, Y.; Murakami, S.; Aoki, K. Effect of yellow-tinted lenses on visual attributes related to sports activities. J. Hum. Kinetic. 2013, 36, 27-36. [CrossRef]
- Migahed, M.D.; Zidan, H.M. Influence of UV-irradiation on the structure and optical properties of polycarbonate films. Curr. Appl. Phys. 2006, 6, 91-96.
- Boscaino, R.; Vella, E.; Navarra, G. Absorption edge in silica glass. In Proceedings of the 2005 IEEE/LEOS Workshop on Fibers and Optical passive Components, Palermo, Italy, 22-24 June 2005. [CrossRef]
- El Ghazaly, M.; Salama, T.T.; Hosny, R.A. UV-Vis spectroscopy and chemical etching studies of CR-39 (PADC) exposed to ultraviolet radiation. J. Optoelectron. Adv. M. 2012, 6(9-10), 826-831.
- Klein, J.; Kampermann, L.; Mockenhaupt, B.; Behrens, M.; Strunk, J.; Bacher, G. Limitations of the Tauc plot method. Adv. Funct. Mater. 2023, 33, 2304523. [CrossRef]
- French, R.H..; Rodriguez-Parada, J.M.; Yang, M.K.; Derryberry, R.A.; Pfeiffenberger, N.T. Optical properties of polymeric materials for concentrator photovoltaic systems. Sol. Energy Mater. Sol. Cells 2011, 95, 2077-2086. [CrossRef]
- Raciti, R.; Bahariqushchi, R.; Summonte, C.; Aydinli, A.; Terrasi, A.; Mirabella, S. Optical bandgap of semiconductor nanostructures: Methods for experimental data analysis. J. Appl. Phys. 2017, 121, 234304. [CrossRef]
- Hussein, A.M.; Dannoun, E.M.A.; Aziz, S.B.; Brza, M.A.; Abdulwahid, R.T.; Hussen, S.E.; Rostam, S.; Mustafa, D.M.T.; Muhammad, D.S. Step toward the band gap identification in polystyrene based solid polymer nanocomposites integrated with tin titanate nanoparticles. Polymers 2020, 12, 2320. [CrossRef]
- Ando, S.; Matsuura, T.; Sasaki, S. Coloration of aromatic polyimides and electronic properties of their source materials. Polym. J. 1997, 29, 69-76. [CrossRef]
Figure 1.
Optical spectra of a Kapton film in the absorbance (a) and transmittance (b) modes.
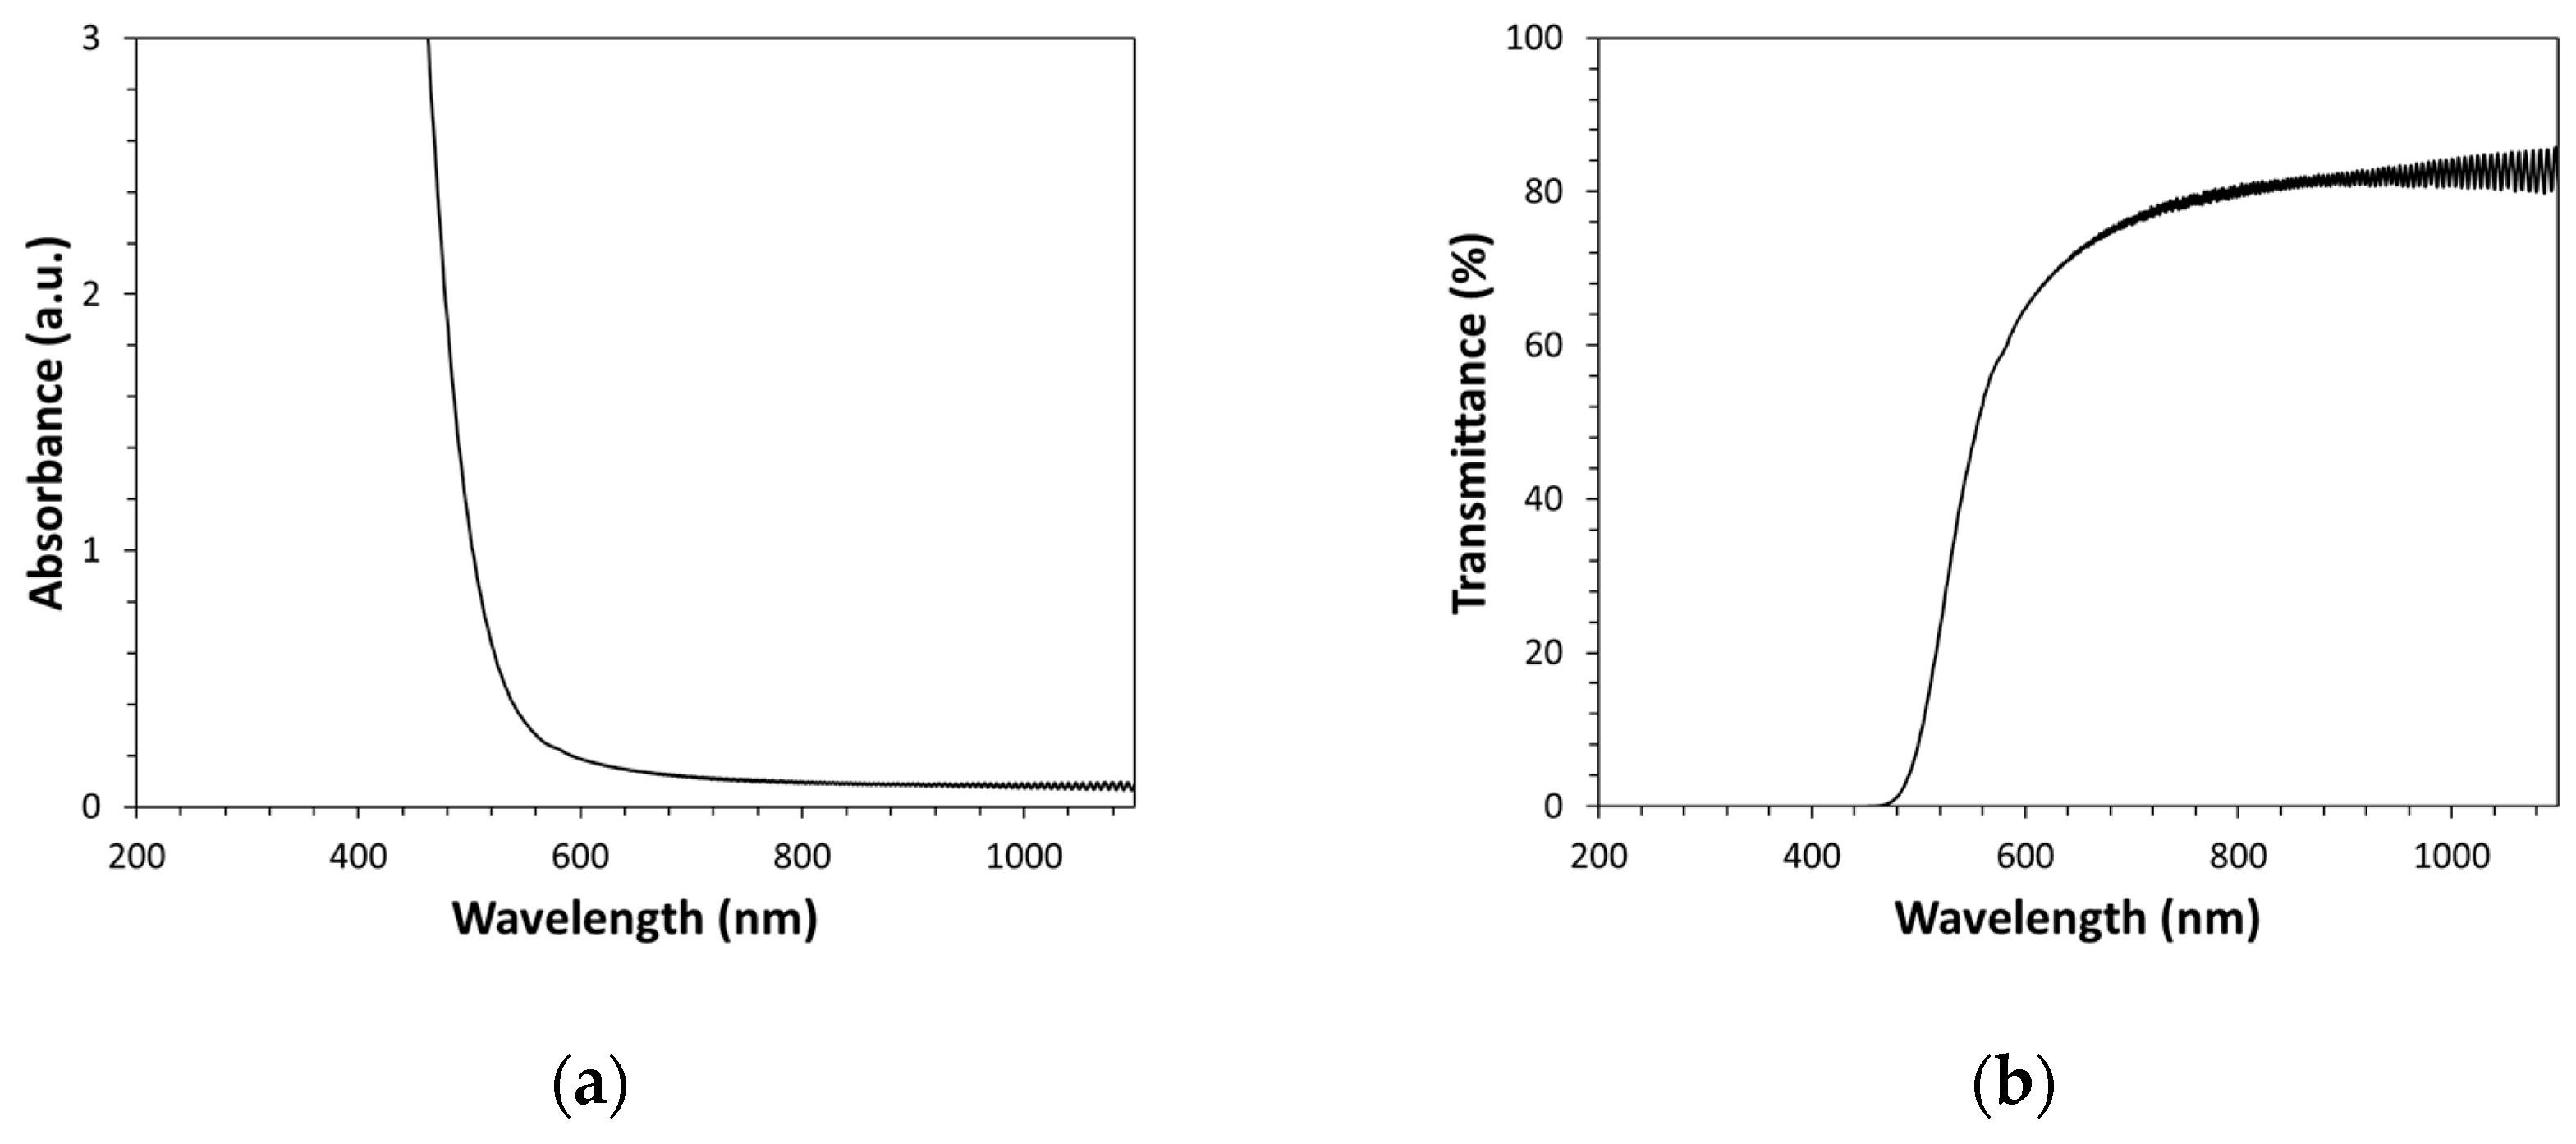
Figure 2.
Plot of the absorption coefficient vs. photon energy (Urbach energy plot) for the calculation of the Kapton EU.
Figure 2.
Plot of the absorption coefficient vs. photon energy (Urbach energy plot) for the calculation of the Kapton EU.
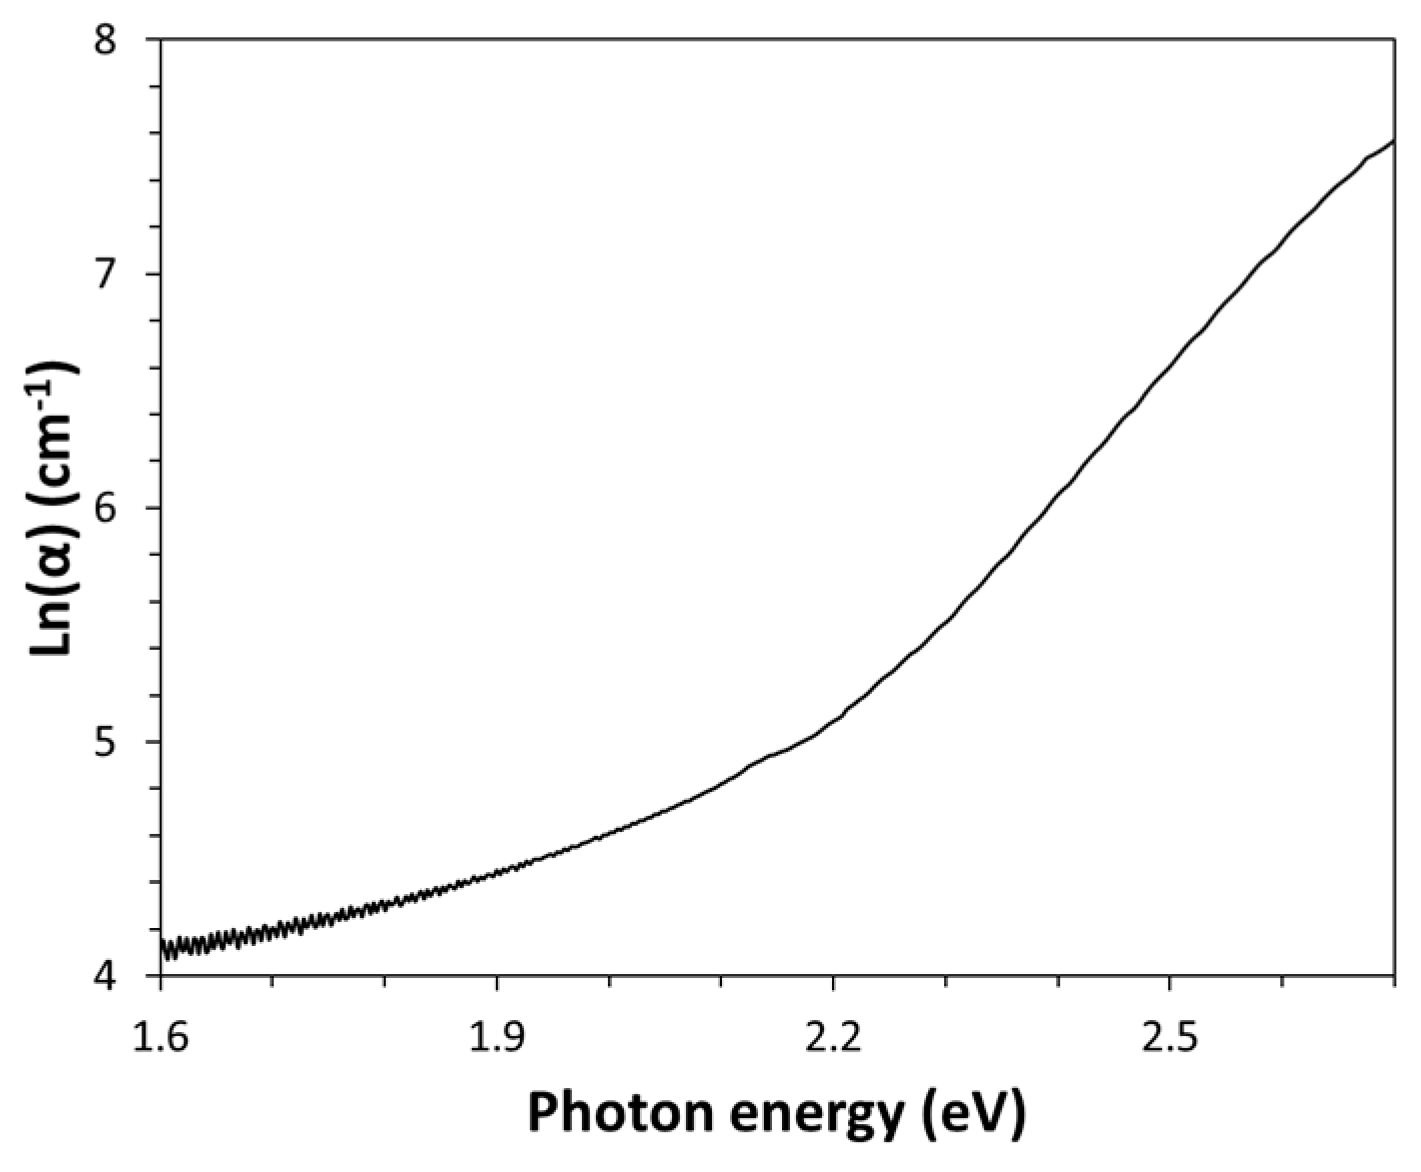
Figure 3.
Tauc plot for indirect (a) and direct (b) allowed transition models.
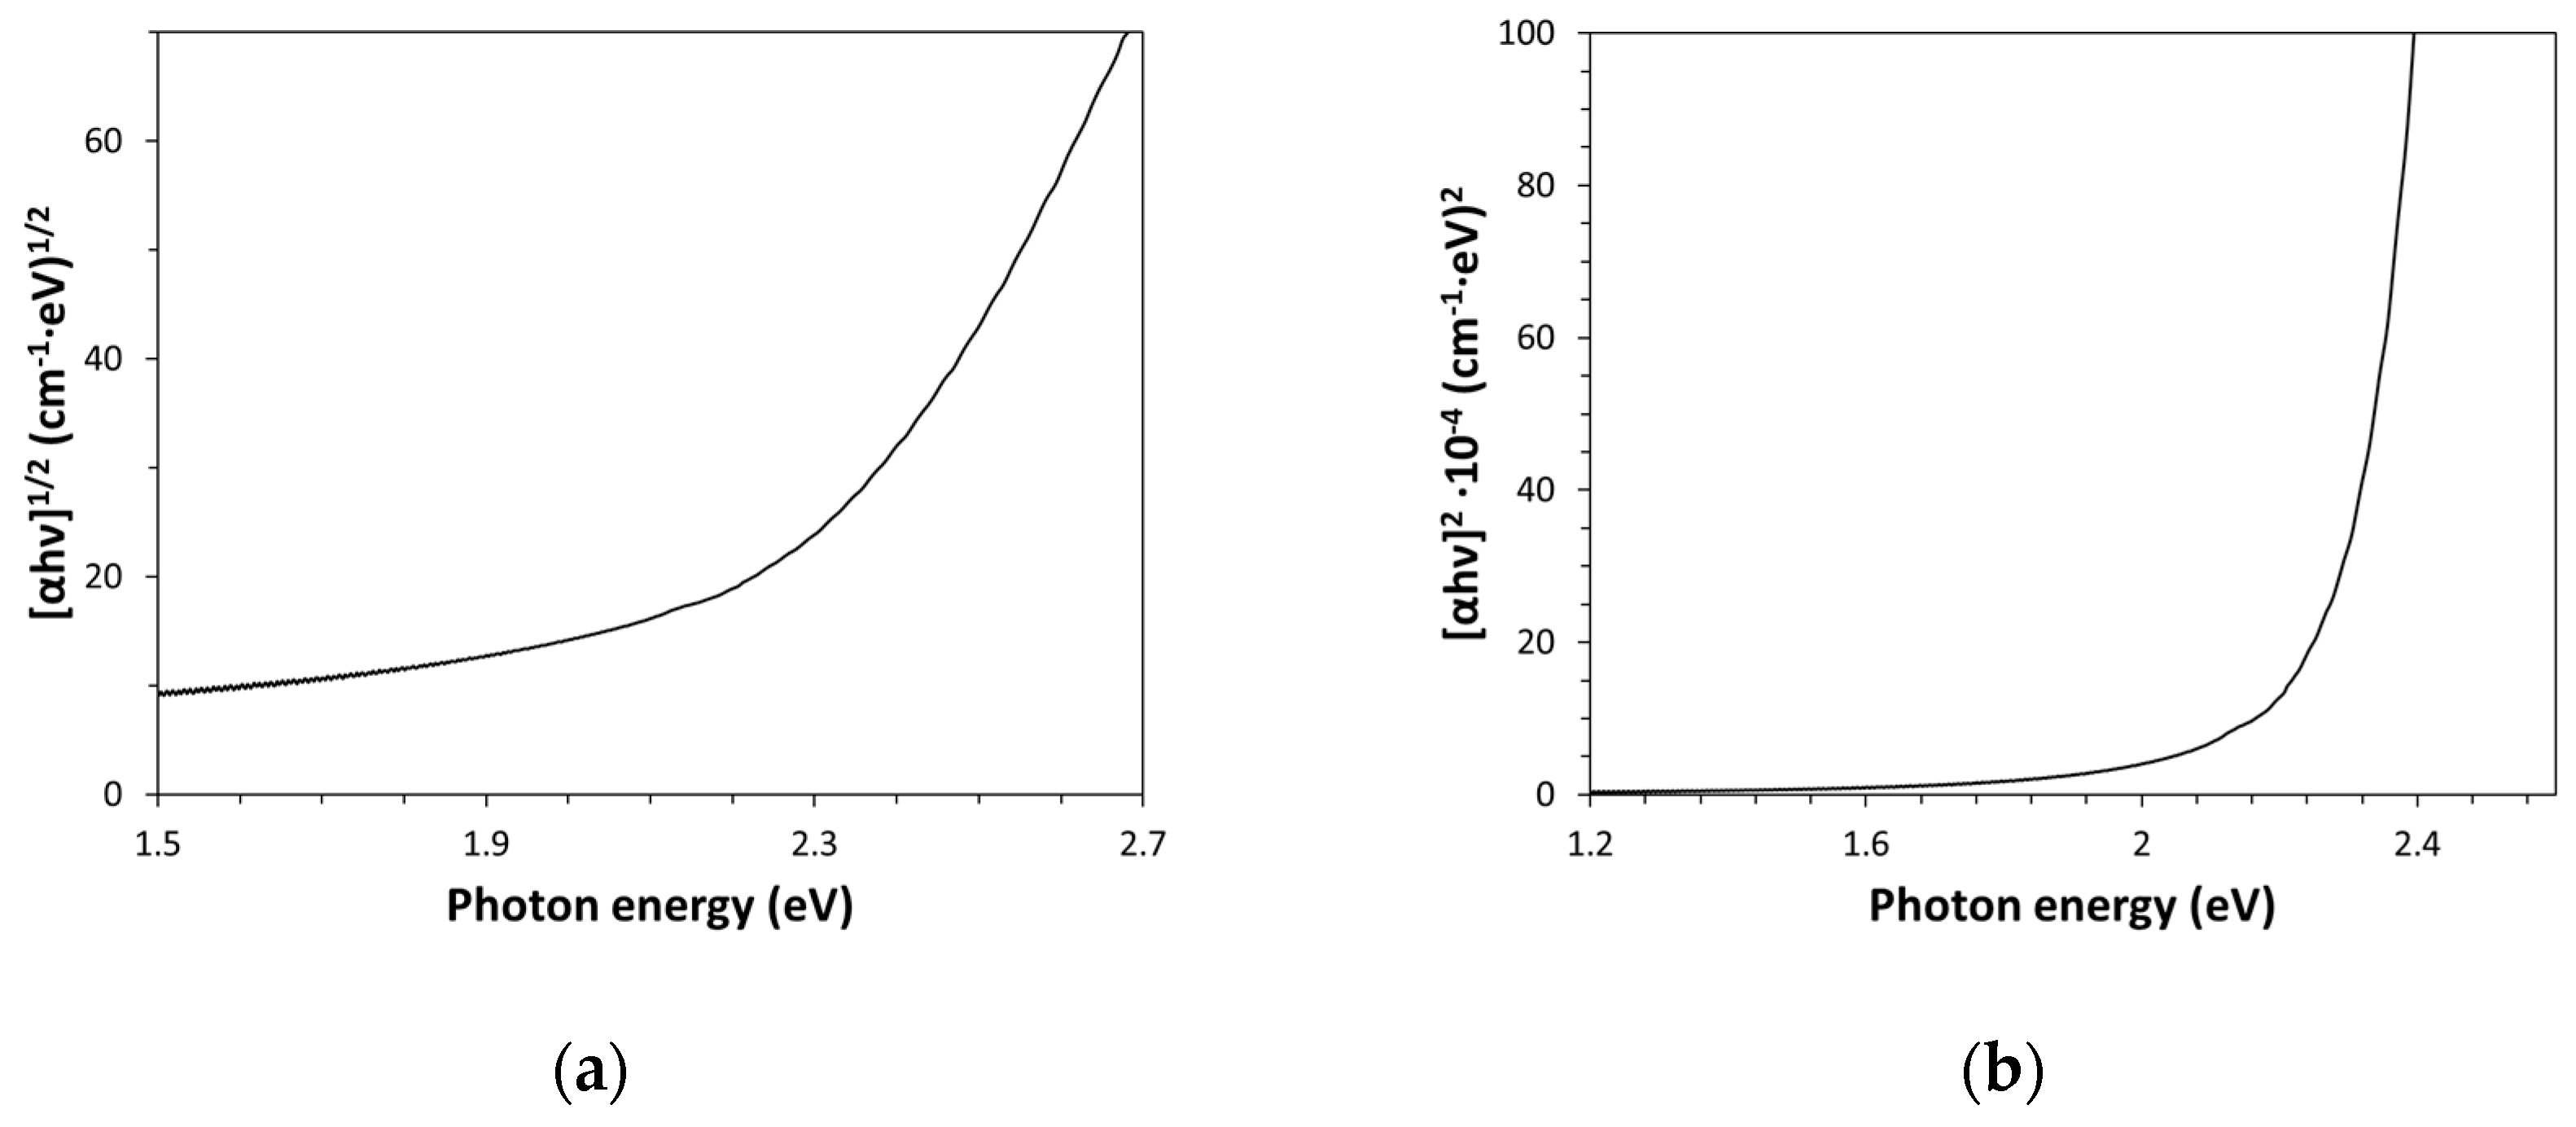
Figure 4.
Cody plot for the Kapton-H type.
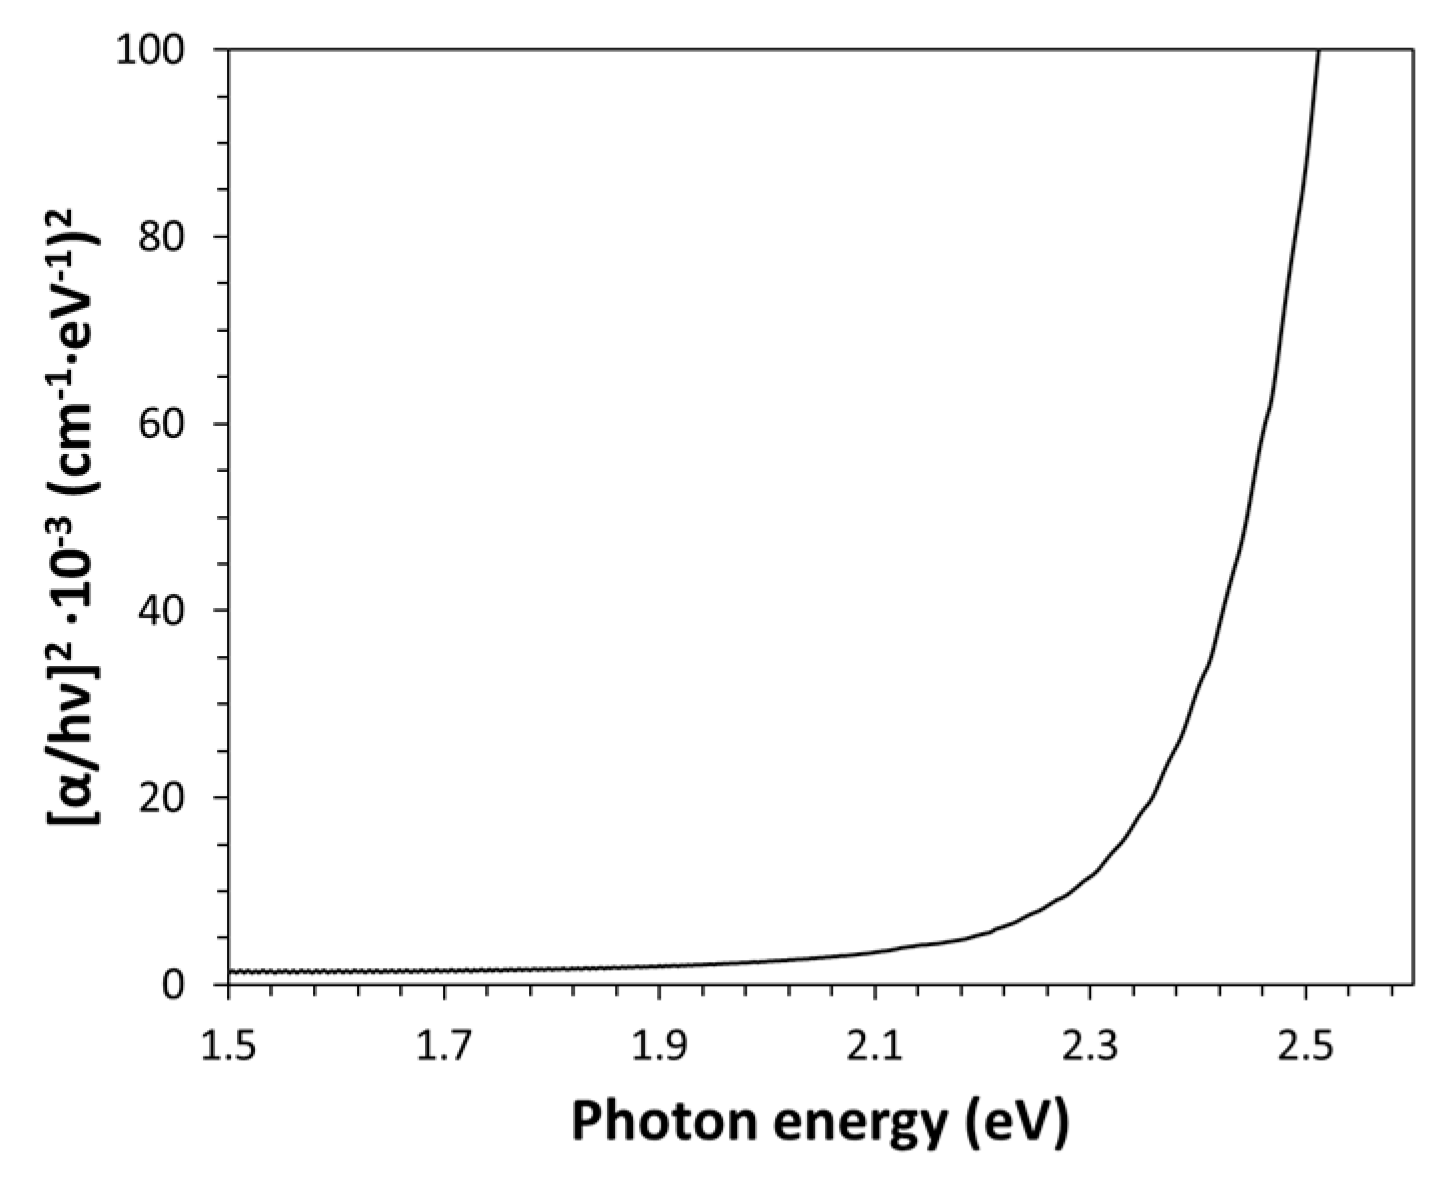
Figure 5.
Polyetherimide (PEI) transmittance spectrum (a) and linear fits of the Tauc plot (b) and Urbach plot (c).
Figure 5.
Polyetherimide (PEI) transmittance spectrum (a) and linear fits of the Tauc plot (b) and Urbach plot (c).
Disclaimer/Publisher’s Note: The statements, opinions and data contained in all publications are solely those of the individual author(s) and contributor(s) and not of MDPI and/or the editor(s). MDPI and/or the editor(s) disclaim responsibility for any injury to people or property resulting from any ideas, methods, instructions or products referred to in the content. |
© 2025 by the authors. Licensee MDPI, Basel, Switzerland. This article is an open access article distributed under the terms and conditions of the Creative Commons Attribution (CC BY) license (http://creativecommons.org/licenses/by/4.0/).
Copyright: This open access article is published under a Creative Commons CC BY 4.0 license, which permit the free download, distribution, and reuse, provided that the author and preprint are cited in any reuse.


