Submitted:
19 June 2025
Posted:
20 June 2025
You are already at the latest version
Abstract
The goal of this study was to develop an automated monitoring system based on Infrared thermography (IRT) for the detection of group-housed pig ears temperature. The aim in the first part of the study was to recognize pigs’ ears by using neural network analysis (SwinStar-YOLO). In the second part of the study, the goal was to automatically extract the maximum and average values of the temperature in the ear region using morphological image processing and a temperature matrix. Our dataset (3600 pictures, 10812 pig ears) was processed using 5-fold cross-validation before training the ear detection model. The model recognized pig’s ear with a precision of 93.74% related to threshold intersection over union (IoU). Correlation analysis of ear temperature extracted by artificial and the method proposed in this research, and the coefficients of determination maximum and average values of the temperature in the ear region were 0. 97 and 0. 88, respectively, for 400 pig ear samples. The method proposed in this research is feasible and reliable for automatic monitoring of ear temperature of pigs, and will be a powerful tool for early warning of pig health.
Keywords:
pig's ear temperature
; Infrared thermography
; image processing
; deep learning
; welfare
1. Introduction
In the process of large-scale pig production, body temperature monitoring is a very important part of ensuring the health of pigs[1]. When pigs are in postpartum paralysis, circulatory failure, specific poisons, or are near death, hypothermia can develop[2]. Infectious diseases and certain inflammatory processes in pigs will cause a rapid rise in body temperature, such as swine influenza, African swine fever, porcine infectious pleuropneumonia, and swine pneumonia[3]. Body temperature monitoring and analysis of pigs can effectively provide early warning of diseases, helping breeders to respond quickly and reduce the economic loss of pig production[4].
The traditional detection of body temperature in pigs is manual measurement of rectal temperature, which is time-consuming, laborious and costly. Many researchers have been exploring alternative methods to manual rectal temperature measurement[5]. Ear temperature correlates well with rectal temperature and is a reliable predictor of pig health. In the actual production process, ear temperature has been the focus of research in the early warning of pig diseases[6]. Radio Frequency Identification (RFID) and IRT are the two most common methods of ear temperature detection systems[7]. The temperature sensor in RFID system is large and easy to be chewed off by pigs, and it needs to pierce the ear of pigs, which can easily cause bacterial infection. Therefore, this method is likely to cause stress in pigs, affect the accuracy of temperature measurement, and is disadvantageous to pig welfare protection[8]. IRT is a non-invasive temperature measurement technology that prevents cross-infection between human and animal, does not stress pigs, and can detect body temperature more precisely[9]. It has been shown that the maximum and average ear skin temperatures of thermal infrared images of pigs are closely related to the rectal temperature of pigs[10,11,12].
Automatic extraction of pig ear skin temperature based on IRT has been of interest to researchers. Zhu et al. (2015) improved an adapted active shape model and combined RGB images and infrared thermal images of pigs to construct an ear detection algorithm with a detection accuracy of 84%[13]. Lu et al. (2018) extracted the maximum temperature of the ear based on SVM (Support Vector Machine) and the shape feature of pig ear, but the ear is prone to localization error[14]. Zhang et al.(2021)designed a kind of sow’s ear root recognition and body surface temperature detection algorithm based on non-point source thermal infrared image, the average relative error of the body temperature was only 0.076977%[15]. The image background of the above study is not complex, and only a single pig is detected, and the algorithm relies more on the differentiation between the background and the pig. With the development of deep learning, target detection algorithms are continuously optimized to obtain better generalization and robustness in animal target detection[16]. Xie et al. (2022) developed an infrared thermography and visible image fusion method for pig ear temperature detection based on YOLO V4. Good use of deep learning was made for modeling, and the detection accuracy reached 94.2%. However, the approach was captured by a handheld thermal imaging camera and the process was more complicated, and the algorithm was not very scalable, making it difficult to be efficiently reused in other pig production environments[17]. Based on the current research state, more study is required to realize the application of automated pig ear temperature monitoring based on IRT to actual pig production.
The frequent aggregation behavior of pigs and the complex background of the breeding environment can lead to mutual obscuration of the ear area, making it difficult to perform high-precision ear detection[18]. Image-based individual pig identification is still an unsolved difficulty and is not practical in the actual production of pig breeding[19]. It is not necessary to consider individual pig identification in the current practical production of infrared image-based pig health monitoring; it is more practical to determine whether there are diseased pigs in the herding pen first, and then human intervention. Based on the above research background, an automatic equipment was constructed in this study to realize the automatic detection of ear temperature of pigs in facility pig farms. Combining IRT with computer vision technology, an automatic and rapid extraction method of pig ear temperature is proposed.
2. Materials and Methods
2.1. Animal and Housing
This study was conducted at a commercial pig farm in Guangdong Province, China. The experimental subjects were 80-day-old weaned Yorkshire pigs with a body weight range of 25–35 kg. The pigs were group-housed in a pen measuring 2.88 m (L)×2.10 m (W)×2.04 m (H). A standard feeding schedule was maintained, with feed provided twice daily at 10:00 and 16:00, while water was available ad libitum. The housing conditions allowed for freedom of movement and continuous physical contact, which frequently resulted in postural overlap and occlusion of the pigs in the recorded images. The general housing environment and the infrared camera setup are illustrated in Figure 1.
2.2. Data Collection
A thermal imaging camera (FLIR A310, 320×240 P, FLIR Corporation, U.S.) was mounted on the roof. The 90° field of view lens (model: FLIR T197215 Close-up Lens) has been added to the built-in 25° lens of the thermal imaging camera. The acquired infrared images are shown in Figure 2. The parameters such as individual pig emissivity and camera distance (2m-2.6m) were calibrated and optimized according to Kun’s research method. The infrared camera was calibrated to 0.95 to reflect the body temperature of the pigs after strict calibration in the experimental farm environment.
The data were collected from July 2024, and a dataset of 4,000 thermal images was constructed based on the collected thermal images. 3,600 images were used for training and model selection, and 400 images were used to validate model performance. Pig ears were manually labeled using the LabelImg annotation tool (https://github.com/lzx1413/LabelImgTool, accessed on 27 August 2019), as shown in Figure 2. To avoid the interference of non-target regions with the target region segmentation and temperature extraction, the smallest outer rectangle containing the ear region was used as the labeling frame as much as possible.
2.3. Model Development
The Central Processing Unit (CPU) of the computer processing platform was Intel Xeon Gold 5218R, and the graphics processing unit (GPU) was Nvidia GeForce RTX 3090, and the memory was 64 GB. The programming language used for the experiment was Python 3.7. The program was run under the Pytorch framework in the Ubuntu20.04 system, and CUDA11.3 and cuDNN8.2.1 were used to accelerate training.
2.4. SwinStar-YOLO: Ears Detection with Enhanced YOLOv8
Pigs have irregular ear shapes due to individual differences and postural variations, as shown in Figure 3. The focus of the research in this section is pigs’ ears detection, which requires a real-time inference speed and acceptable accuracy. Since pixel-level accuracy is not required and image segmentation is not needed, the models of the YOLO series are suitable for this research.
2.4.1. SwinTransformer-Driven YOLOv8
YOLOv8 builds on previous YOLO models and introduces key improvements, including a new backbone network and loss function design, which enhance feature extraction and processing capabilities for more precise object detection [20]. The updated loss function accelerates convergence and improves model performance. These advances enable YOLOv8 to achieve better detection and localization accuracy. However, YOLOv8’s deeper architecture and increased parameters result in longer training times compared to earlier versions, which raises development costs and training cycles. Additionally, its complex network structure requires higher computational resources, limiting its applicability in resource-constrained environments. YOLOv8 also demands larger annotated datasets, increasing data collection and annotation costs [21].
Traditional Transformer models, while effective in object detection, are computationally expensive and not suitable for edge deployment [22,23]. To overcome these limitations, this study integrates SwinTransformer as the backbone feature extractor for YOLOv8. SwinTransformer is a hierarchical visual transformer based on shifted windows. By incorporating a hierarchical attention mechanism, SwinTransformer efficiently reduces computational complexity and improves feature extraction by dividing the image into smaller blocks, calculating self-attention within each.
The enhanced SwinTransformer model offers significant advantages for YOLOv8, notably in computational efficiency and feature extraction. By restricting self-attention to non-overlapping local windows, the model achieves a linear relationship between computational complexity and image size, optimizing processing efficiency. Additionally, the shifting of window partitions across self-attention layers facilitates cross-window interaction, improving contextual feature capture and detection accuracy. These enhancements establish SwinTransformer as a robust backbone for YOLOv8, enabling more efficient and precise object detection.
2.4.2. SwinTransformer-Driven YOLOv8
The model utilizes a SwinTransformer as its backbone to address the inherent limitations of conventional Transformer architectures, particularly the quadratic complexity associated with global self-attention. To this end, the input image is initially partitioned into small patches via a Patch Partition operation. Each patch is then embedded into a high-dimensional feature space using a linear embedding, thereby forming a sequence of tokens.
Within the SwinTransformer blocks, the traditional
multi-head self-attention (MSA) is replaced by a window-based multi-head
self-attention (W-MSA) mechanism. In this approach, the feature map is divided
into non-overlapping local windows, and self-attention is computed
independently within each window. This localized computation reduces the
complexity from o(n2) (where is the number of
tokens) to o(M2), with representing the
window size. Mathematically, the parameter count for the standard MSA and the
window-based MSA (W-MSA) can be expressed as:
where h, w and C denote the height, width, and channel dimensions of the feature map, respectively. To mitigate the loss of global context due to localized self-attention, a Shifted Windows Multi-Head Self-Attention (SW-MSA) mechanism is applied between successive layers. This strategy enables cross-window information exchange, thereby enhancing the model’s global representation capabilities without incurring significant computational overhead. Figure 4 shows the architecture of the Swin Transformer network.
2.4.3. SwinTransformer-Driven YOLOv8
To further boost the representational capacity of the network without dramatically increasing its depth or parameter count, StarNet blocks are incorporated immediately after the initial feature fusion stage. StarNet facilitates the mapping of input features to a high-dimensional nonlinear space. This mapping is achieved by recursively applying multiple star operation units, each functioning as a feature transformation layer. The star operation effectively aggregates information from different subspaces, thus yielding richer and more expressive feature representations. This lightweight yet powerful structure not only preserves computational efficiency but also significantly improves feature expression in complex detection scenarios. Figure 5 shows the StarNet Blocks structure of the network.
2.4.4. SwinTransformer-Driven YOLOv8
Accurate object detection necessitates effective handling of features at multiple scales. To this end, the improved YOLOv8 model employs a PAN-FPN (Path Aggregation Network–Feature Pyramid Network) architecture. Initially, the SwinTransformer extracts multi-scale feature maps through its hierarchical layered attention mechanism. These features are then fed into the FPN, which constructs a pyramid-like feature representation by progressively merging high-resolution, low-semantic information with low-resolution, high-semantic data.
The subsequent enhancement through PAN involves a bottom-up path that integrates the feature maps across different scales, thereby improving the overall feature representation. A C2f module is further introduced to fuse the feature maps from various levels, ensuring that both detailed local structures and the global context are simultaneously captured. Finally, the aggregated features are provided to an anchor-free detection head—optimized with a novel loss function—to predict target bounding boxes with high precision and robustness. The overall network model is shown in Figure 6.
2.5. Ears Extraction with Morphological Methods
Morphological image processing was used to segment the ears of pigs based on the ear regions detected by SwinStar-YOLO model. The aim is to eliminate noise of background image and extract the ear contour. The specific algorithm flow is as follows.
Input: thermal infrared image of pigs I
Step1. Input I to SwinStar-YOLO model to get several detection frames of pig ear.
Step2. Convert the representation of detection frames from ( x, y, w, h) to upper left corner coordinates ( x1, y1) and lower right corner coordinates ( x1’, y1’) , and crop the ear region image Iear from image I.
Step3. Convert Iear to grayscale image Ig.
Step4. Use the Ostu algorithm to binarize the image Ig to get the image Ios.
Step5. Perform open operation on image Ios to eliminate noise and get image Iop .
Step6. Using the small area filling method, get the connected area of image Iop and eliminate the internal voids to obtain image Ifinal;
Output: the binary image of pig ear Ifinal and the coordinates of the upper-left corner (xs1, ys1) and lower-right corner (xs1’, ys1’) of the region in I.
2.6. Automatic Extraction of Ear Temperature
The aim of temperature extraction is to get the maximum and average values of the temperature in the ear region based on based on the temperature matrix of the ear segmentation image and the original thermal infrared image. In group pen farming, the aggregation behavior of pigs causes the ears to often obscure each other, resulting in a different number of ears detected for each infrared image.
For the detected ear regions, the temperature matrix of the infrared thermogram is set to K, and the detected ear regions is set to
{(xs1,ys1),(xs1′,ys1′);(xs2,ys2),(xs2′,ys2′);(xs3,ys3),(xs3′,ys3′);⋯}, where (xs1,ys1) is the top-left coordinate of the ear region and (xs1’,ys1’) is the bottom-right coordinate of the ear region. Taking the detected ear region {(xs1,ys1), (xs1’,ys1’)} as an example, the specific algorithm flow is as follows.
Input: the binary image of pig ear Ifinal , the coordinates of Ifinal {(xs1,ys1), (xs1’,ys1’)}, and the original thermal infrared image temperature matrix K.
Step1. Calculate the actual coordinates {(xe1,ye1), (xe1’,ye1’)} in the original infrared image based on the coordinates of Ifinal {(xs1,ys1), (xs1’,ys1’)}.
Step2. Map the actual coordinates {(xe1,ye1), (xe1’,ye1’)} to the temperature matrix K, and extract the temperature matrix M of the ear region.
Step3. Iterate through each pixel of the binary image Ifinal, if the pixel value is 1, add the temperature corresponding to that point to the set of ear temperature M’, if not, discard the temperature value corresponding to that point.
Step4. Find out the average value and maximum value of the temperature set.
Output: The average value and maximum value of the temperature in the ear area.
3. Results and Discussion
3.1. Results of the Ears Detection Model Training
In this research, 3,600 images were labeled as the training and validation sets, and the model was trained through the 5-fold cross-validation method. The data are randomly divided into 5 parts, each with 720 images, and in each model training the training set has 2880 images and the validation set has 720 images. The training parameters of SwinStar-YOLO are set as shown in Table 1. The training results are shown in Table 2.
In Table 2, losstr is the average loss on the training set, lossval is the average loss on the validation set, and the number in parentheses is the iteration period. Lossval_min is the minimum loss value on the validation set, and Epochval is the number of iterations corresponding to this loss value.
Multiple training sessions revealed that SwinStar-YOLO experienced rapid convergence in the initial 20 epochs. After the 80th epoch, the rate of descent flattened considerably, becoming nearly horizontal. According to Table 2, during the 4th fold of cross-validation, the model achieved a minimum loss value of 1.3008 on the validation set at the 92nd epoch. The convergence of the loss function for this particular training run is illustrated in Figure 7. At this point, the model struck a favorable balance between performance and generalization capability. Therefore, the model obtained around the 93rd epoch was selected for subsequent experiments as the pig ear region detection model.
3.2. Performance of the Ears Detection Model
To validate the detection accuracy and speed of the SwinStar-YOLO-m target detection model for pig ear detection, 400 images from the test set were labeled for evaluation, and YOLOv5-m, YOLOv6-m YOLOv8-m and YOLOv8-l were trained for comparison experiments. In this research, the model performance is evaluated using Params, FLOPs, recall, F1 score, Map@0.5, Map@0.5:0.95, and Latency. Model training and testing were performed in the PyTorch deep learning environment. The performance of the four models on the test set is shown in Table 3.
The SwinStar-YOLO-m model demonstrated superior detection accuracy across all evaluated metrics. It achieved a Map@0.5 of 93.74% and a Map@0.5:0.95 of 69.38%, outperforming YOLOv8-l by approximately 2.79 percentage points on the latter stricter metric. The model also exhibited the highest recall at 89.66% and an F1-score of 90.04%, indicating its effectiveness in identifying a high proportion of positive instances while maintaining an optimal balance between precision and recall. These results collectively highlight SwinStar-YOLO-m’s robust capability in accurately localizing objects with high precision and minimizing false negatives.
In terms of model complexity and computational efficiency, SwinStar-YOLO-m presented a competitive profile. With 42 million parameters, it was more parameter-efficient than YOLOv6-m and comparable to YOLOv8-l. Furthermore, it recorded 112.5 billion FLOPs, a significant improvement over YOLOv6-m and YOLOv8-l, which had higher computational demands despite lower accuracy. The inference speed of SwinStar-YOLO-m was measured at 11.6ms, competitive with other models and well within the acceptable range for real-time applications. This comprehensive analysis positions SwinStar-YOLO-m as the most effective model for pig ear detection, offering superior accuracy without disproportionate increases in computational load or latency.
The detection results of SwinStar-YOLO are shown in Figure 8, and the detected ear is inside the detection box. The farming environment of pigs is complex, and the behaviors of lying, climbing, and gathering of pigs easily cause ear deformation and mutual obscuration. To automate body temperature detection and put it into production, it is necessary to ensure high detection accuracy. For this reason, the data set is labeled only for the obvious ear contour, so that the obscured and irregular ears are not detected, but it is very likely to detect all of the pigs’ ears with prolonged monitoring.
3.3. Performance of the Automatic Ear Temperature Extraction
The binary image of the ear contour is obtained by extracting the pixel points of the ear using the ear region segmentation method, as shown in Figure 9. To evaluate the performance of the automatic ear temperature extraction method and to verify whether the maximum and average values of the extracted ear temperatures are directly representative of manual statistics. 30 thermal infrared images were randomly selected from the test set, and the mean and maximum values of 60 pig ear contour temperatures were extracted manually using the infrared image processing software Flir Tools, and compared with the algorithm-derived ear temperature results of pigs. In order to reduce the subjective error in the manual extraction of ear contours, the ear contours were extracted by 4 persons, and the ear temperature was calculated separately and averaged as the true value. The formula for calculating the relative error of the temperature data of artificial and algorithm is:
where is the relative error, is the manually measured temperature as the true value, and is the algorithm-extracted temperature as the measured value.
The results are shown in Table 4. The maximum value of the ear temperature extracted by the algorithm is consistent with the manually extracted data, while the average value fluctuates slightly, but the relative error is within a reasonable range. Since the edge selection of the pig ear segmentation algorithm is slightly biased, there is also a bias in the average value of the corresponding temperature. The maximum ear temperature can always be included in the ear contour, so the algorithm value is basically the same as the manual value. The maximum relative error of the maximum temperature in the ear region extracted by the algorithm is 1. 85% and the average relative error value is 0. 02%; the maximum relative error of the average temperature in the ear region extracted by the al”orit’m is 2. 34% and the average relative error value is 0. 30%. It shows that the ear temperature of pigs extracted by the algorithm in this research has high accuracy and practicality.
To verify the practicability of the automatic ear temperature extraction algorithm, the correlation analysis between the manual-extracted and algorithm-extracted temperatures was performed, the results are shown in Figure 10. The correlation coefficients of the maximum temperature and the average temperature extracted by the algorithm were 0. 973 and 0. 880, with a positive relation. It shows the feasibility of the algorithm in this research to automatically extract the ear temperature based on the infrared thermal image of pigs.
4. Conclusions
In conclusion, our research successfully constructed an automatic ear temperature extraction framework for live pigs based on infrared thermography. The framework is based on SwinStar-YOLO and morphology for the extraction of pig ears from thermal infrared images. The maximum and average values of the temperature in the ear region are automatically extracted by combining the ear segmentation image and the temperature matrix. A SwinStar-YOLO detection model for thermal infrared images of pig ears was constructed, with an accuracy of 93.74% for ear detection and an average detection time of 11.6 ms for a single image. The experimental results showed that the ear temperature extracted from the framework of this research was highly correlated with the manually counted ear temperature, and the relative error was within the acceptable range. This research framework can realize the real-time extraction of pig ear temperature, which can provide technical support for automatic monitoring and early warning of pig body temperature.
Author Contributions
The authors’contributions are as follows: C.Z., D.Q., X.Z. and S.L. conceived the present study and explained the data. C.Z. and X.L. conducted the study, analyzed the data, and wrote the manuscript. X.W. and D.X. gave critical suggestions during the experiment and writing the manuscript. Z.C., X.W. and S.L. participated in the analysis and collected the data. All the authors revised the manuscript. All authors have read and agreed to the published version of the manuscript.
Funding
This research was funded by the Integrated Research Project of Kaili University (grant No. YTH-XM2025001), the Open Fund Project of the Micro-nano and Intelligent Manufacturing Engineering Research Centre of Ministry of Education (grant No. 2024WZG06), the Guizhou High-level Innovative Talent Training Project (Qianqianceng Rencai [2023] 203008), and the Specialized Fund for the Doctoral of Kaili University (grant No. BS20210201).
Institutional Review Board Statement
The trial complied with the regulations and guidelines of the South China Agricultural University Animal Care and Use Ethics Committee (SYxK2014-0136).
Informed Consent Statement
The pigs used in this research were purchased specifically for experimental purposes by our research team from a licensed commercial supplier. These animals were not owned by any private individual, and as such, there was no need to obtain informed consent from individual owners. All experiments involving these animals were conducted in accordance with institutional and national ethical guidelines for the care and use of animals in research. The study protocol was reviewed and approved by the South China Agricultural University Animal Care and Use Ethics Committee.
Data Availability Statement
All relevant data are included in this paper. The datasets generated during and/or analyzed during the current study are available from the corresponding author upon request.
Acknowledgments
The authors acknowledge the Wens Foodstuff Group Co., Ltd. for providing computational resources and support that have contributed to obtaining the research results reported in the present publication.
Conflicts of Interest
The authors declare no conflicts of interest.
References
- Reza M N, Ali M R, Kabir M S N, et al. Thermal imaging and computer vision technologies for the enhancement of pig husbandry: a review. Journal of Animal Science and Technology, 2024, 66(1): 31.
- Mluba H S, Atif O, Lee J, et al. Pattern Mining-Based pig behavior analysis for health and welfare monitoring. Sensors, 2024, 24(7): 2185.
- Serbessa, T.A.; Geleta, Y.G.; Terfa, I.O. Review on diseases and health management of poultry and swine. Int. Int. J. Avian Wildl. Biol. 2023, 7, 27–38. [Google Scholar] [CrossRef]
- Marić, K.; Gvozdanović, K.; Kušec, I.D.; Kušec, G.; Margeta, V. Smart Pig Farms: Integration and Application of Digital Technologies in Pig Production. Agriculture 2025, 15, 937. [Google Scholar] [CrossRef]
- Xiong, Y.; Li, G.; Willard, N.C.; Ellis, M.; Gates, R.S. Modeling Neonatal Piglet Rectal Temperature with Thermography and Machine Learning. J. Asabe 2023, 66, 193–204. [Google Scholar] [CrossRef]
- Reza M N, Ali M R, Haque M A, et al. A review of sound-based pig monitoring for enhanced precision production. Journal of Animal Science and Technology, 2025, 67(2): 277.
- Li Q, Nie S. Detection of ear root feature region in heterogeneous images based on pig head posture. Acad. J. Comput. Inf. Sci, 2023, 6: 20-32.
- Gómez, Y.; Stygar, A.H.; Boumans, I.J.M.M.; Bokkers, E.A.M.; Pedersen, L.J.; Niemi, J.K.; Pastell, M.; Manteca, X.; Llonch, P. A Systematic Review on Validated Precision Livestock Farming Technologies for Pig Production and Its Potential to Assess Animal Welfare. Front. Veter- Sci. 2021, 8. [Google Scholar] [CrossRef] [PubMed]
- Zhang, C.; Xiao, D.; Yang, Q.; Wen, Z.; Lv, L. Review: Application of Infrared Thermography in Livestock Monitoring. Trans. ASABE 2020, 63, 389–399. [Google Scholar] [CrossRef]
- Schmid, S.M.; Büscher, W.; Steinhoff-Wagner, J. Suitability of Different Thermometers for Measuring Body Core and Skin Temperatures in Suckling Piglets. Animals 2021, 11, 1004. [Google Scholar] [CrossRef] [PubMed]
- Soerensen, D.D.; Pedersen, L.J. Infrared skin temperature measurements for monitoring health in pigs: A review. Acta Vet. Scand. 2015, 57, 5. [Google Scholar] [CrossRef] [PubMed]
- Siewert, C.; Dänicke, S.; Kersten, S.; Brosig, B.; Rohweder, D.; Beyerbach, M.; Seifert, H. Difference method for analysing infrared images in pigs with elevated body temperatures. Z. Fur Med. Phys. 2014, 24, 6–15. [Google Scholar] [CrossRef] [PubMed]
- Zhu, W.X.; Liu, B.; Yang, J.J.; Ma, C. Pig ear area detection based on adapted active shape model. Transactions of the Chinese Society for Agricultural Machinery 2015, 46, 288–295. [Google Scholar]
- Lu, M.; He, J.; Chen, C.; Okinda, C.; Shen, M.; Liu, L.; Yao, W.; Norton, T.; Berckmans, D. An automatic ear base temperature extraction method for top view piglet thermal image. Comput. Electron. Agric. 2018, 155, 339–347. [Google Scholar] [CrossRef]
- Zhang, Z.; Wang, H.; Liu, T.; Wang, Y.; Zhang, H.; Yuan, F.; Yang, X.; Xu, S.; Meng, Y. Accurate detection method of pig's temperature based on non-point source thermal infrared image. CAAI Trans. Intell. Technol. 2021, 6, 312–323. [Google Scholar] [CrossRef]
- Wutke, M.; Heinrich, F.; Das, P.P.; Lange, A.; Gentz, M.; Traulsen, I.; Warns, F.K.; Schmitt, A.O.; Gültas, M. Detecting Animal Contacts—A Deep Learning-Based Pig Detection and Tracking Approach for the Quantification of Social Contacts. Sensors 2021, 21, 7512. [Google Scholar] [CrossRef] [PubMed]
- Wang, X.; Hu, F.; Yang, R.; Wang, K. An Infrared Temperature Correction Method for the Skin Temperature of Pigs in Infrared Images. Agriculture 2023, 13, 520. [Google Scholar] [CrossRef]
- Psota, E.T.; Mittek, M.; Pérez, L.C.; Schmidt, T.; Mote, B. Multi-Pig Part Detection and Association with a Fully-Convolutional Network. Sensors 2019, 19, 852. [Google Scholar] [CrossRef] [PubMed]
- Xu, P.; Zhang, Y.; Ji, M.; Guo, S.; Tang, Z.; Wang, X.; Guo, J.; Zhang, J.; Guan, Z. Advanced intelligent monitoring technologies for animals: A survey. Neurocomputing 2024, 585. [Google Scholar] [CrossRef]
- Hussain, M. YOLO-v1 to YOLO-v8, the Rise of YOLO and Its Complementary Nature toward Digital Manufacturing and Industrial Defect Detection. Machines 2023, 11, 677. [Google Scholar] [CrossRef]
- Liu, J.; Zhang, C.; Li, J. Using Anchor-Free Object Detectors to Detect Surface Defects. Processes 2024, 12, 2817. [Google Scholar] [CrossRef]
- Lee S I, Koo K, Lee J H, et al. Vision transformer models for mobile/edge devices: a survey. Multimedia Systems, 2024, 30(2): 109.
- Shah, S.; Tembhurne, J. Object detection using convolutional neural networks and transformer-based models: a review. J. Electr. Syst. Inf. Technol. 2023, 10, 1–35. [Google Scholar] [CrossRef]
Figure 1.
Animal and housing.
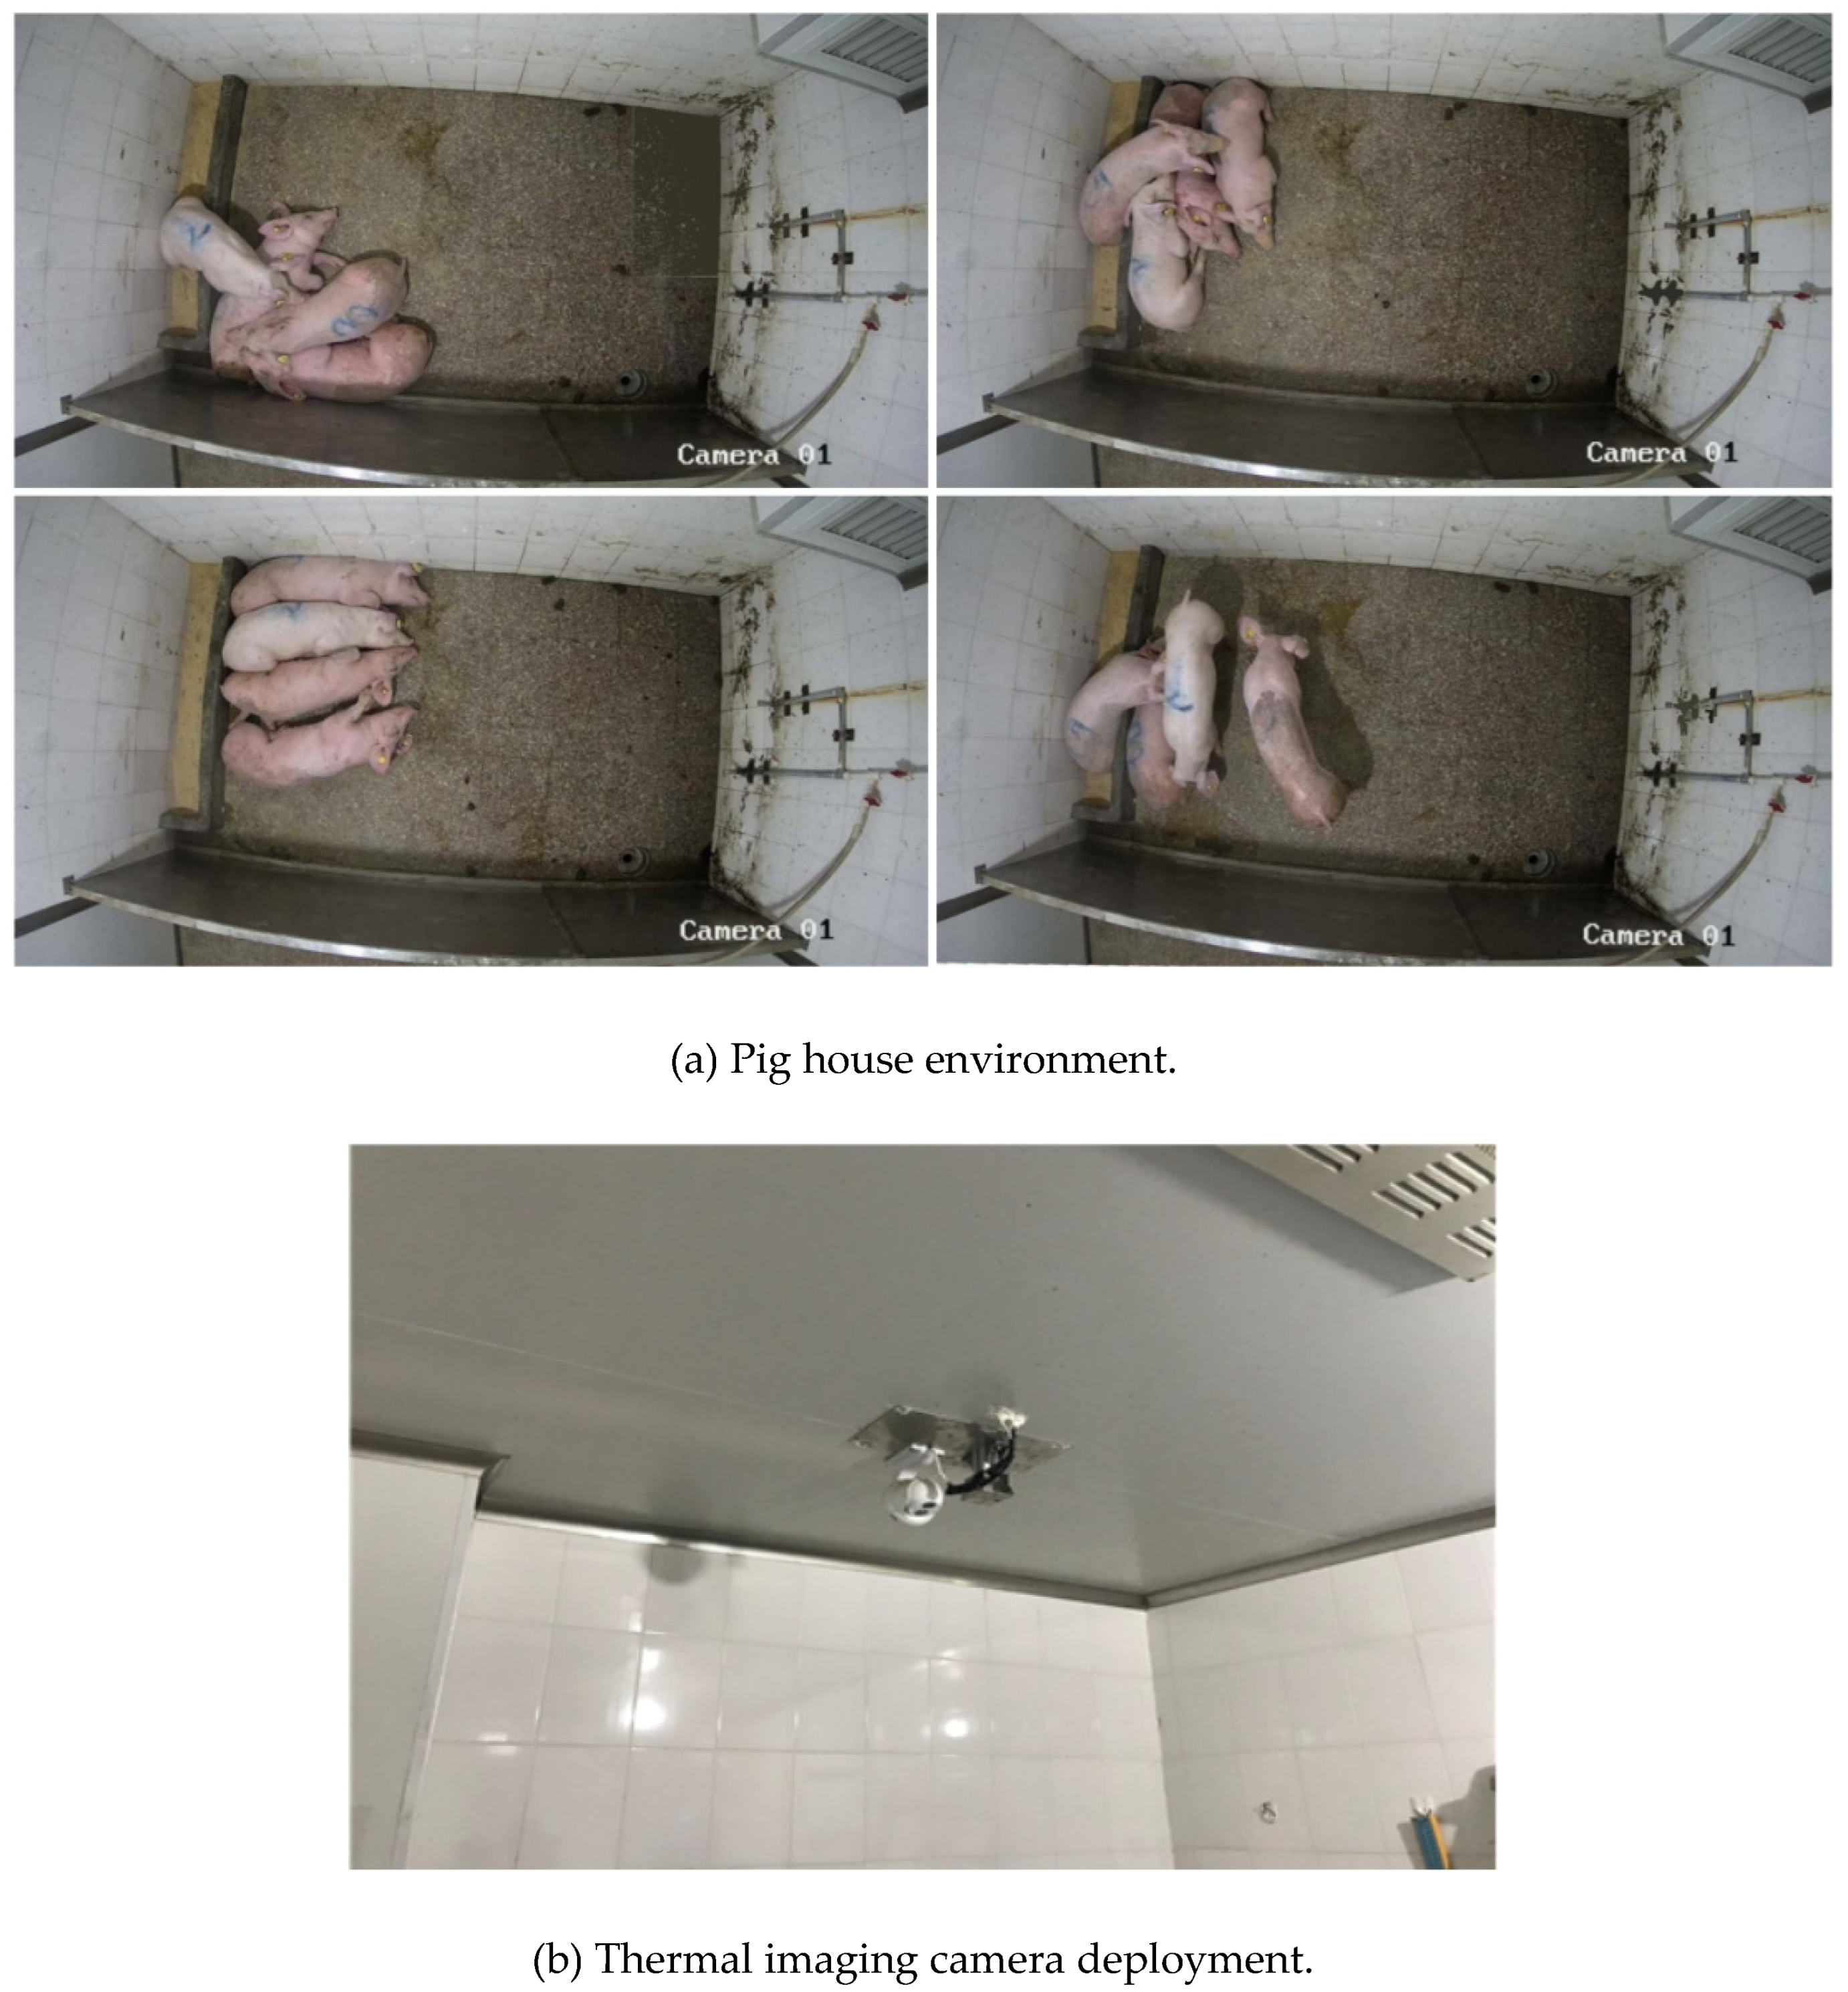
Figure 2.
Infrared thermal imaging data of pigs in pen.
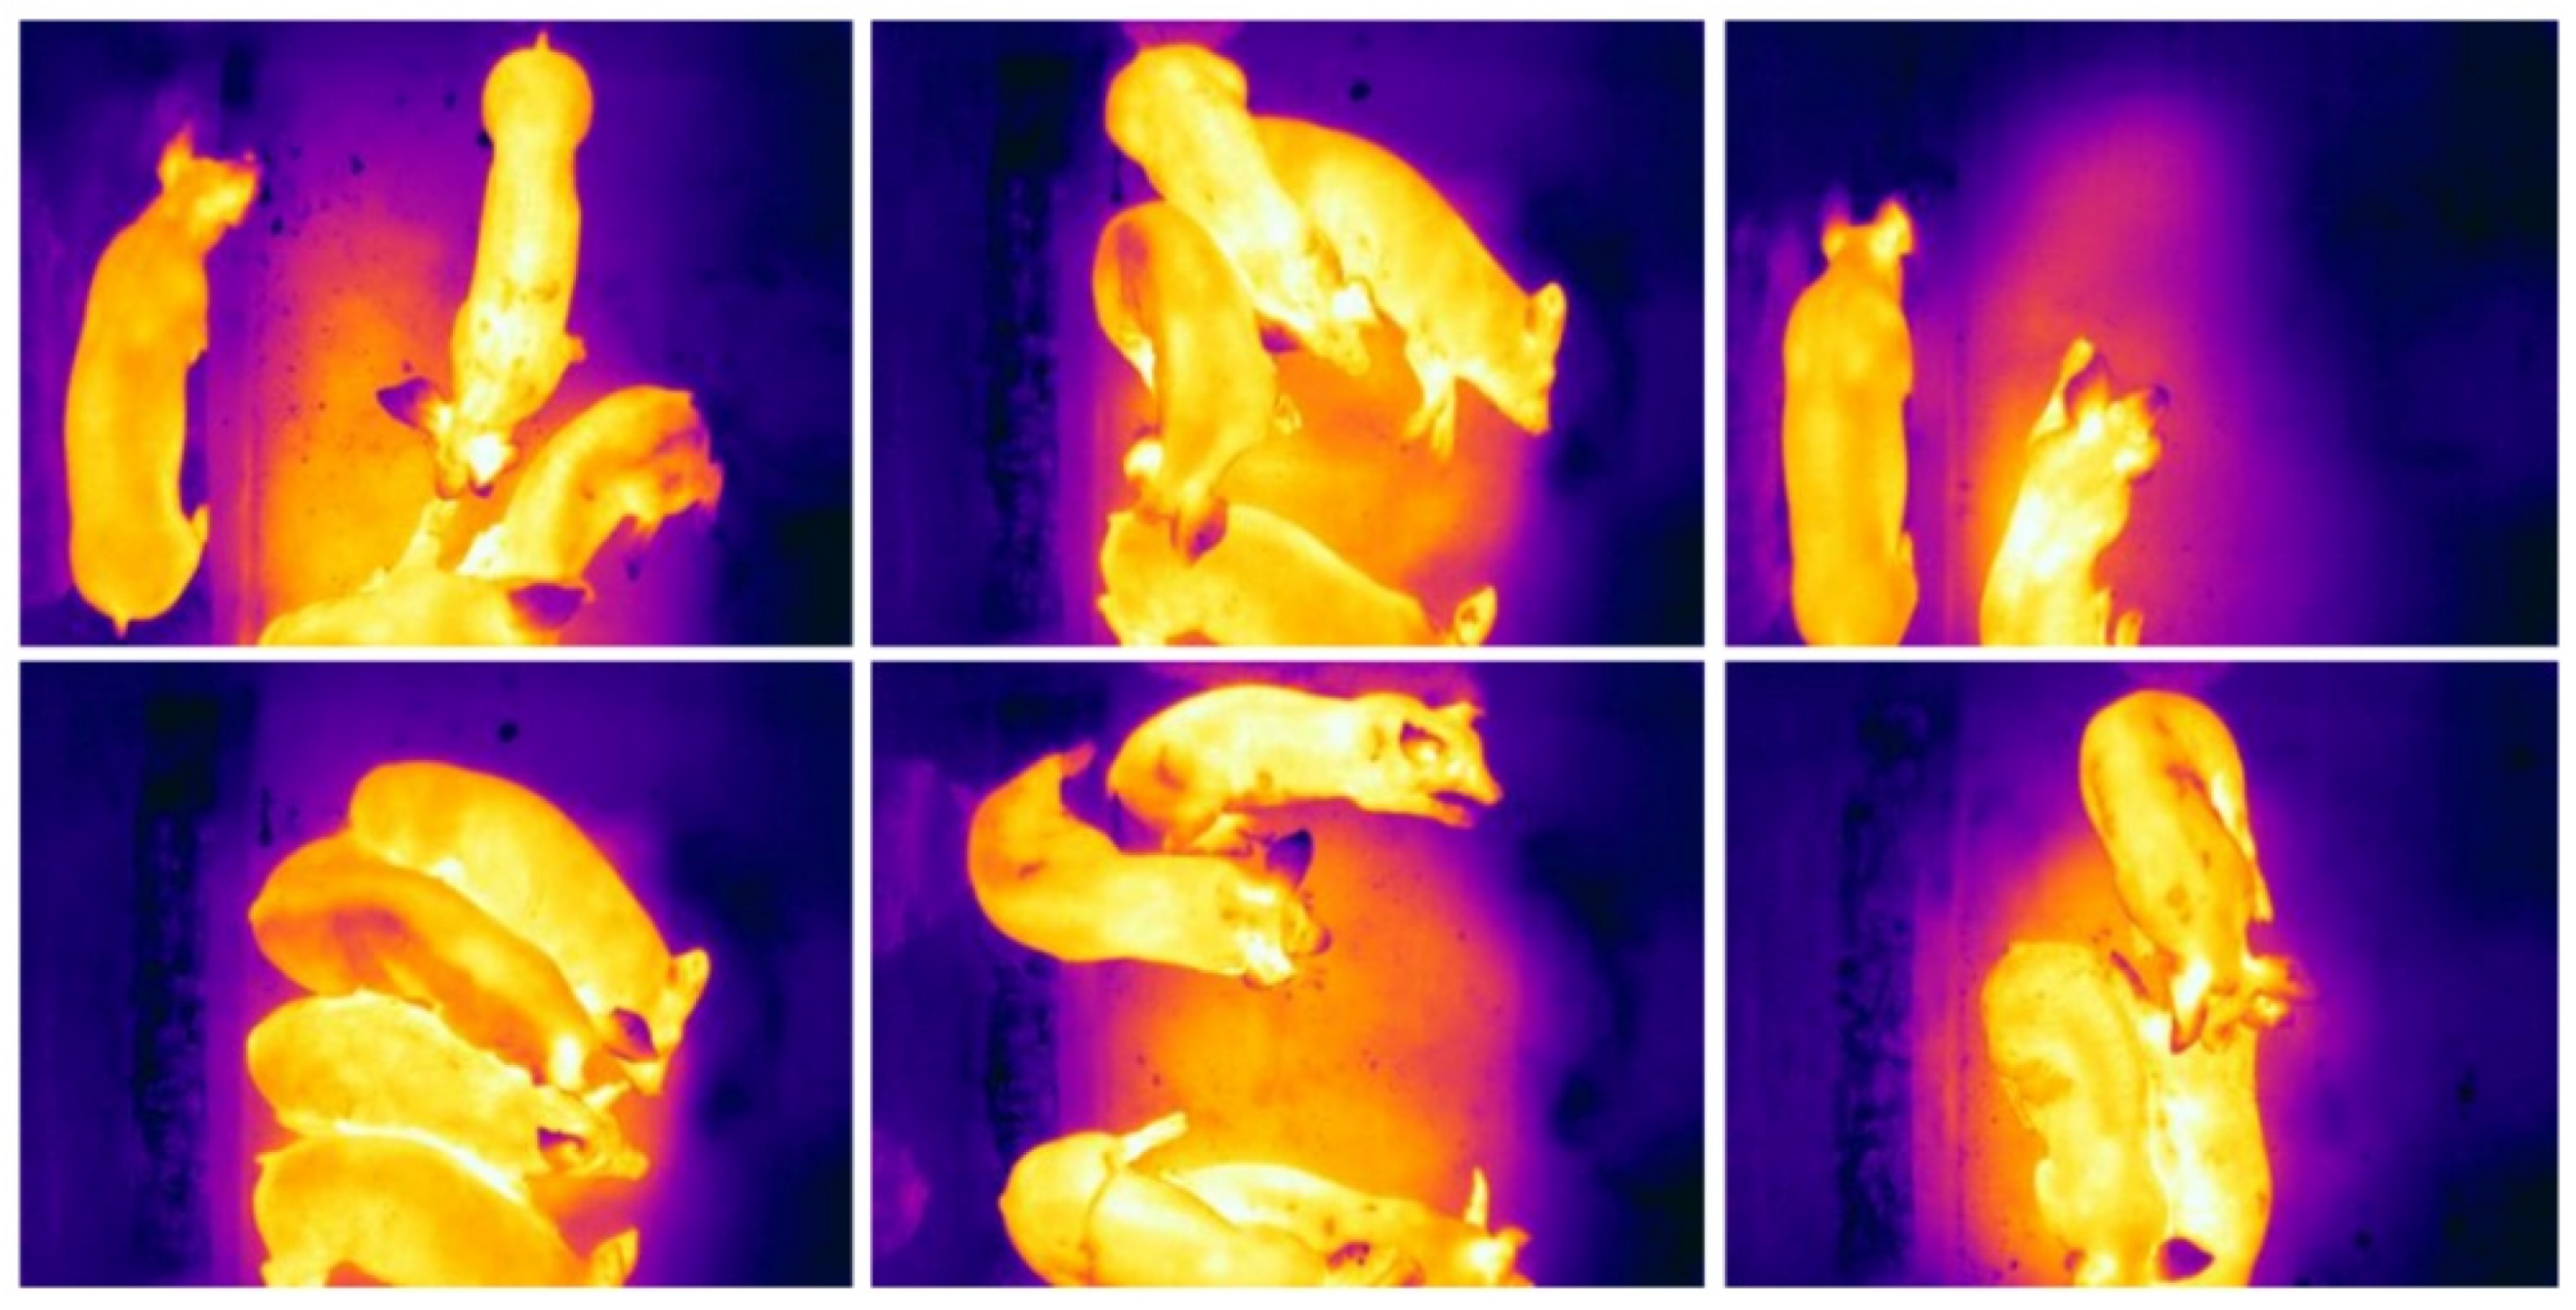
Figure 3.
Pigs’ear shape.
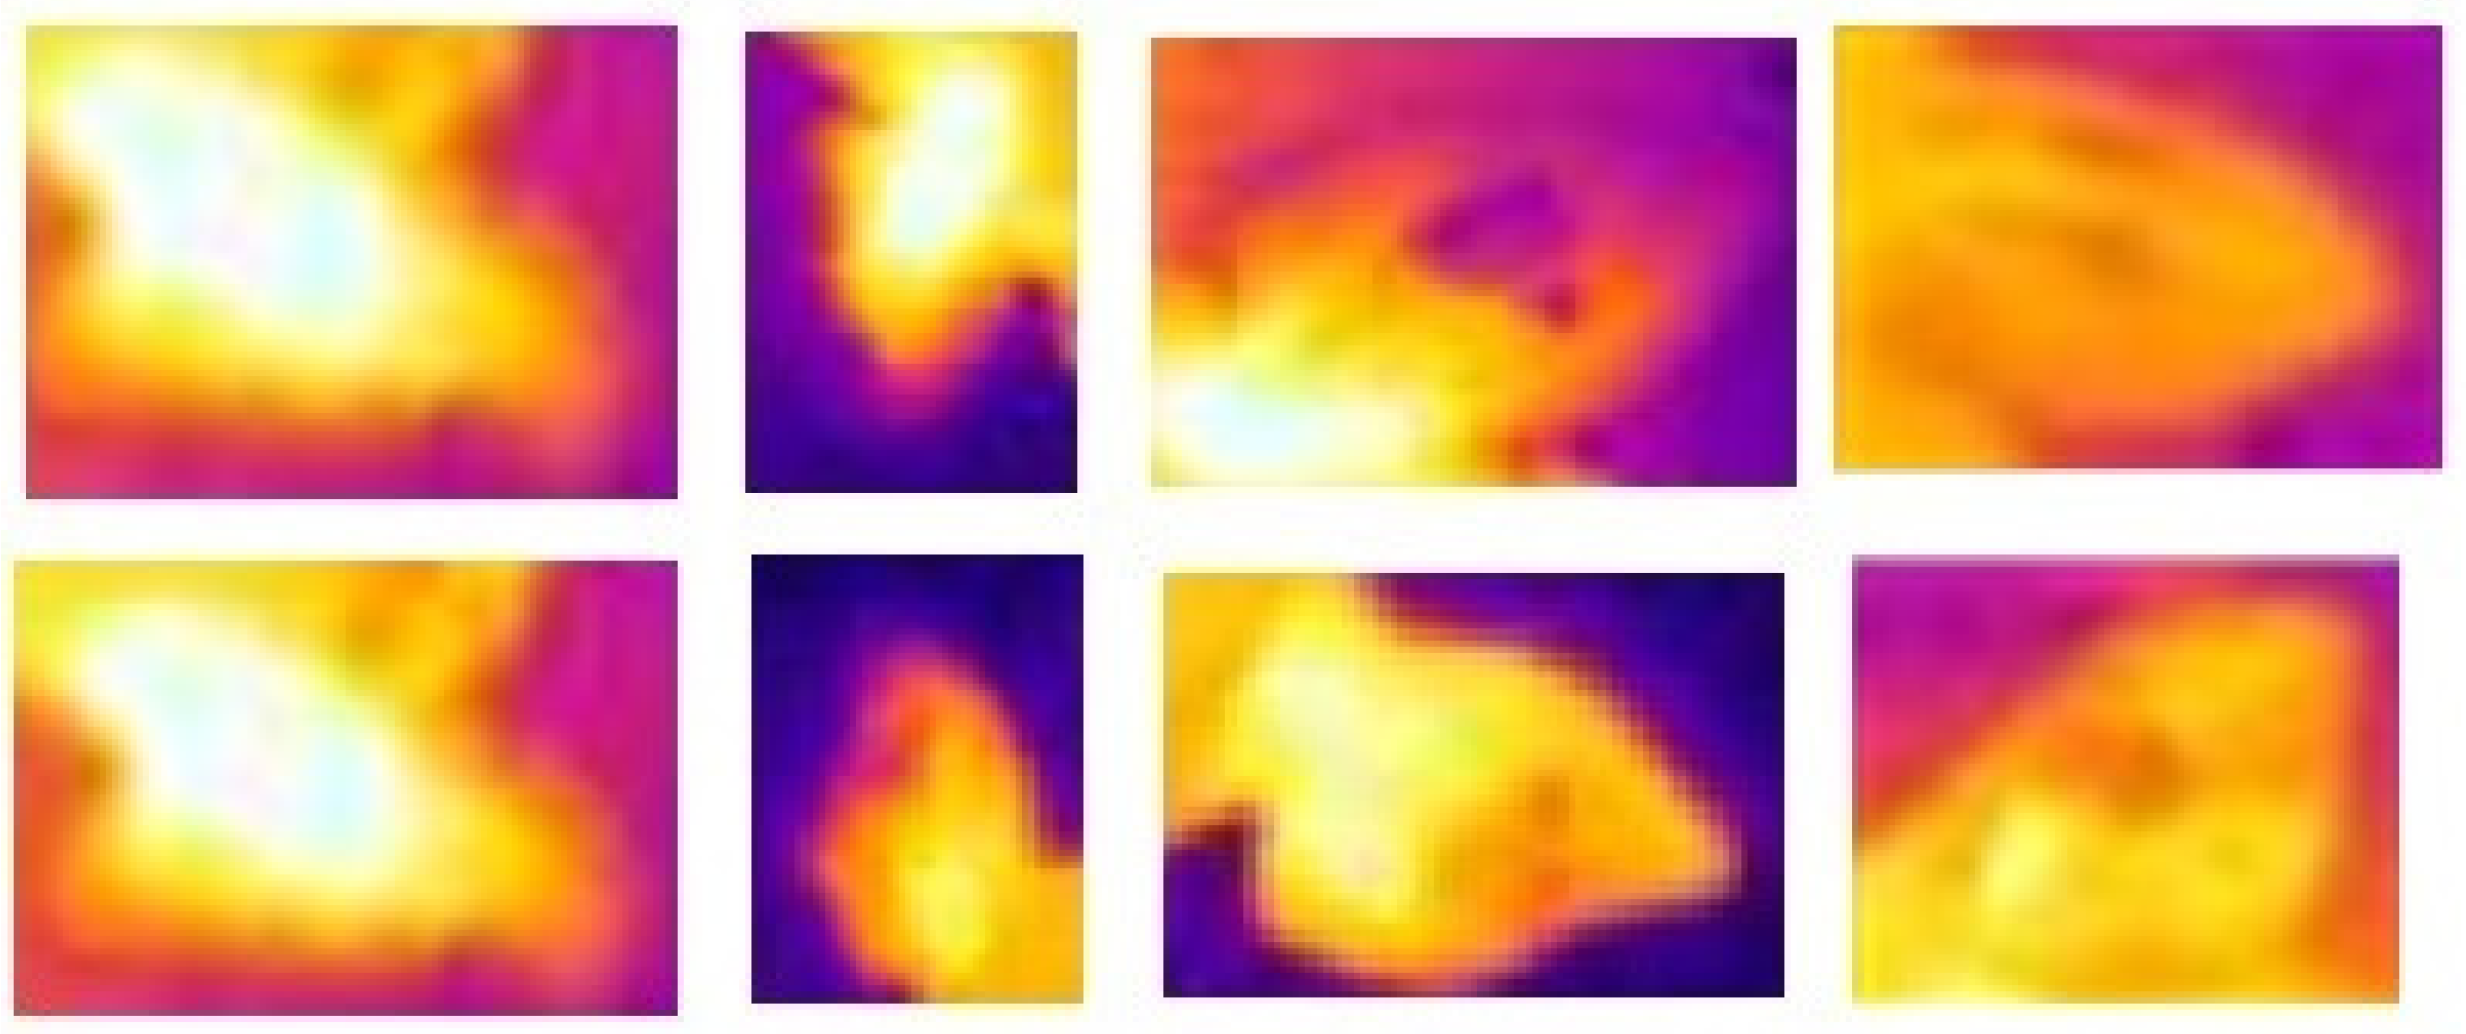
Figure 4.
SwinTransfomer network structure.
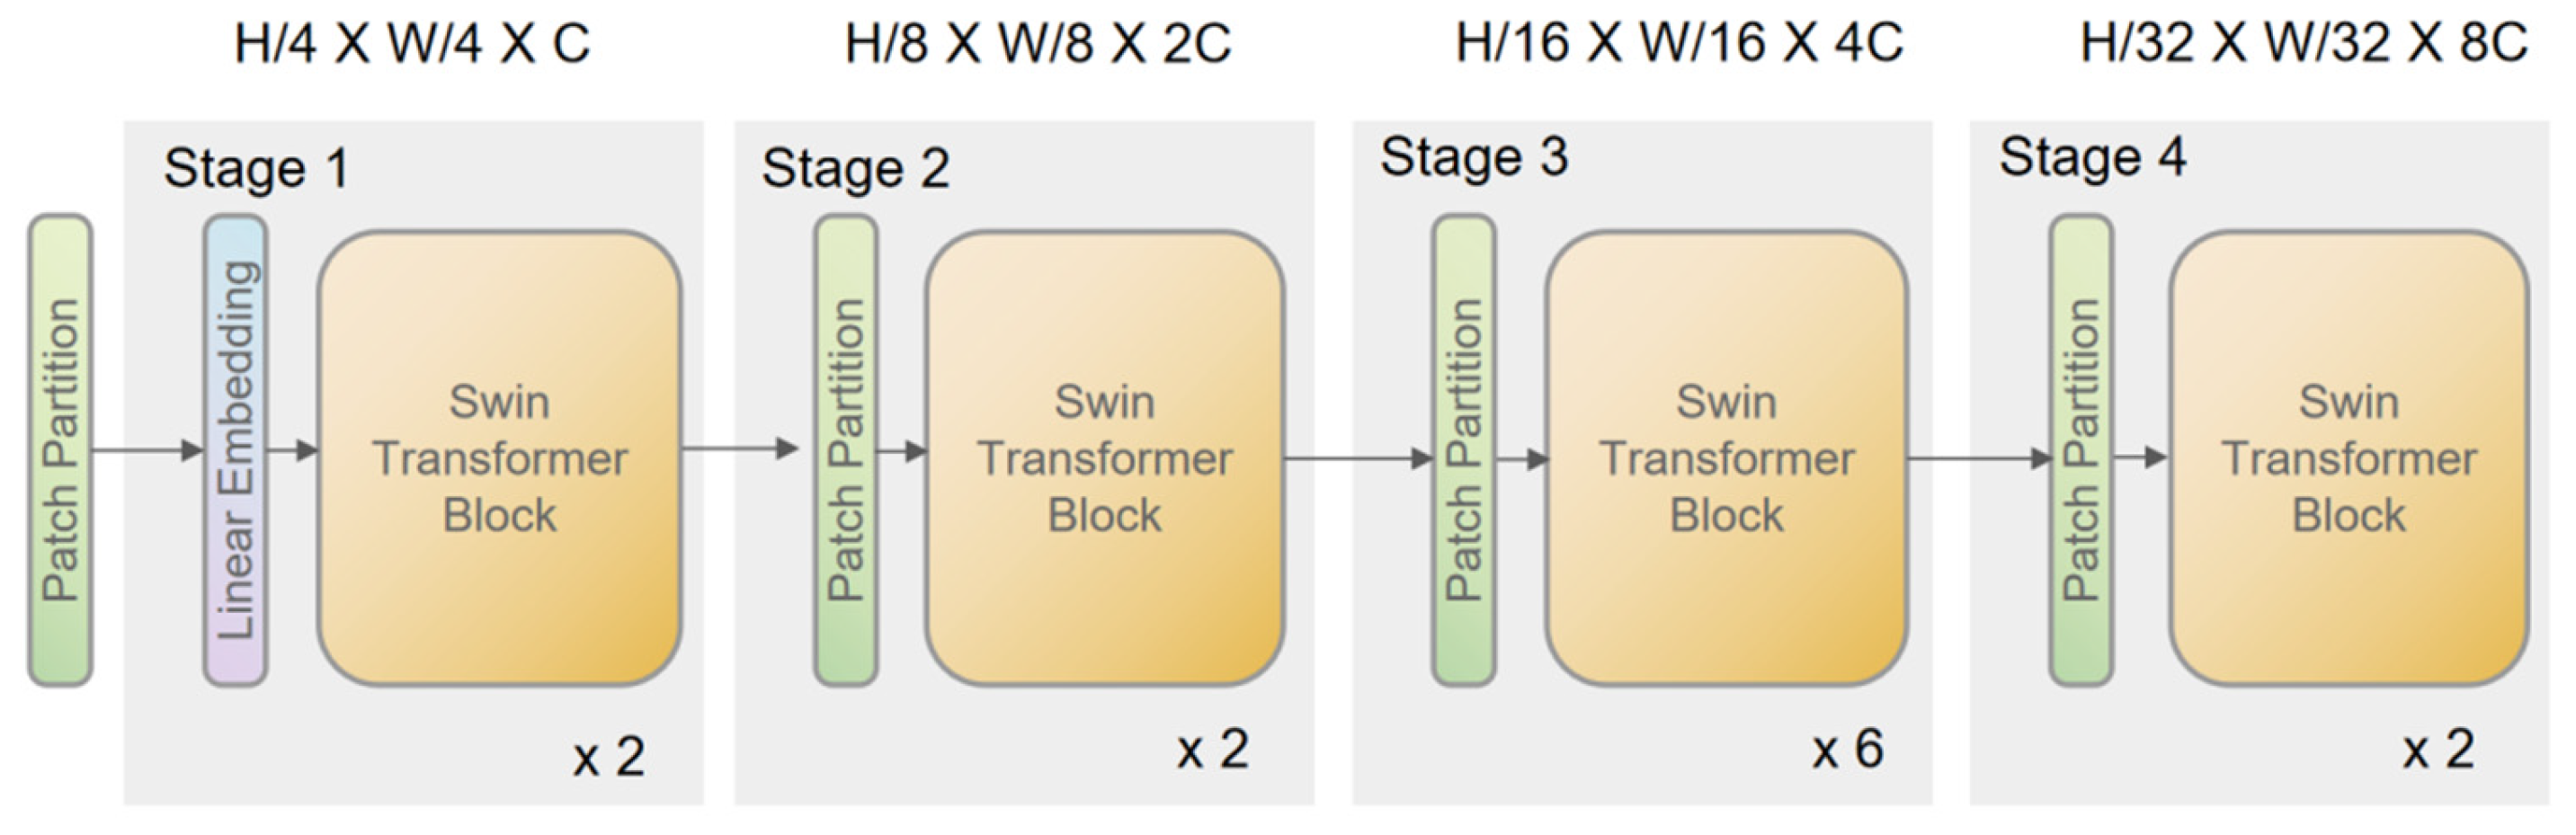
Figure 5.
Network structure of StarNet Blocks .
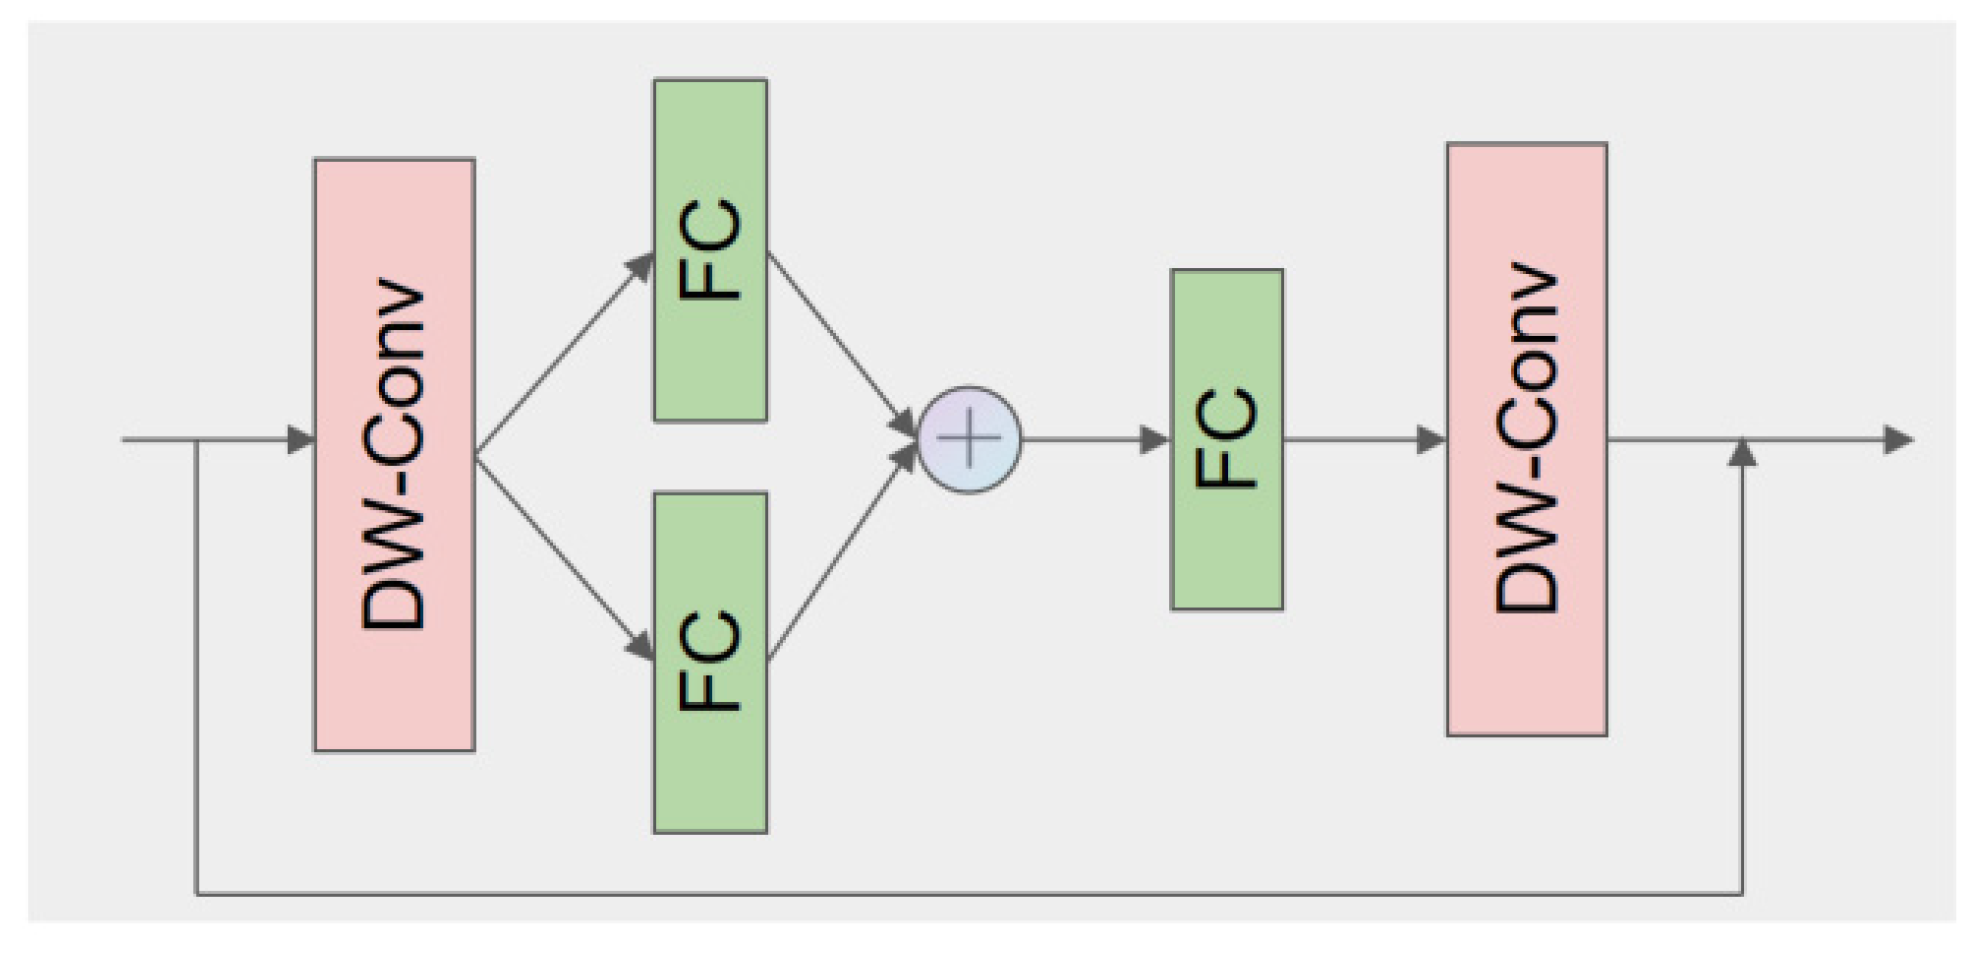
Figure 6.
SwinStar-YOLO network structure.
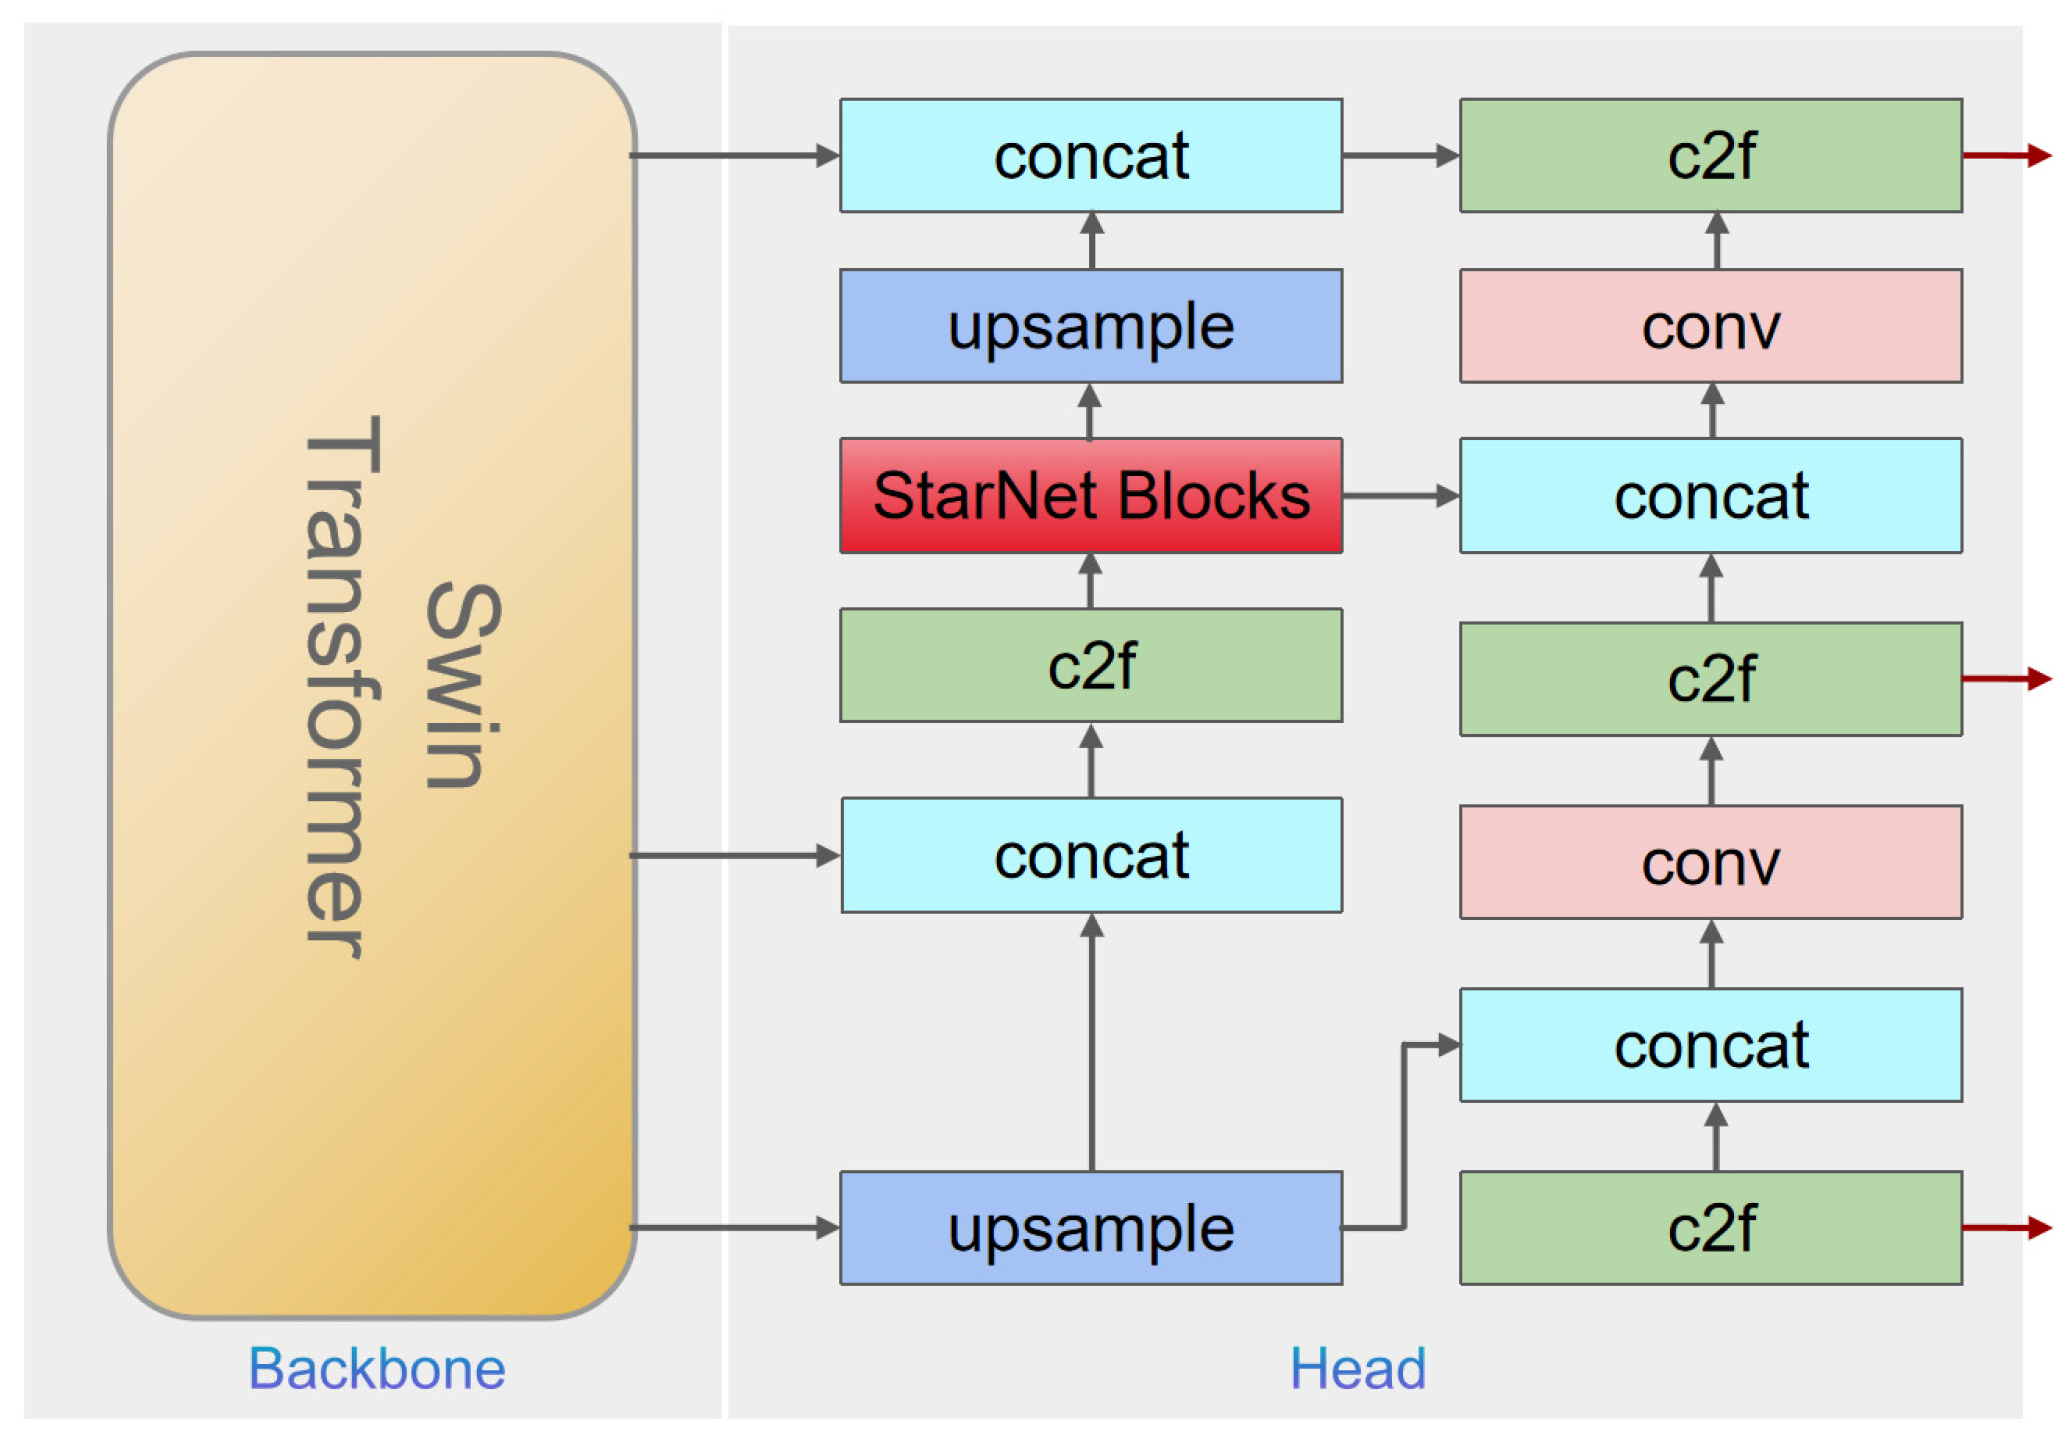
Figure 7.
SwinStar-YOLO variation curves of loss value.
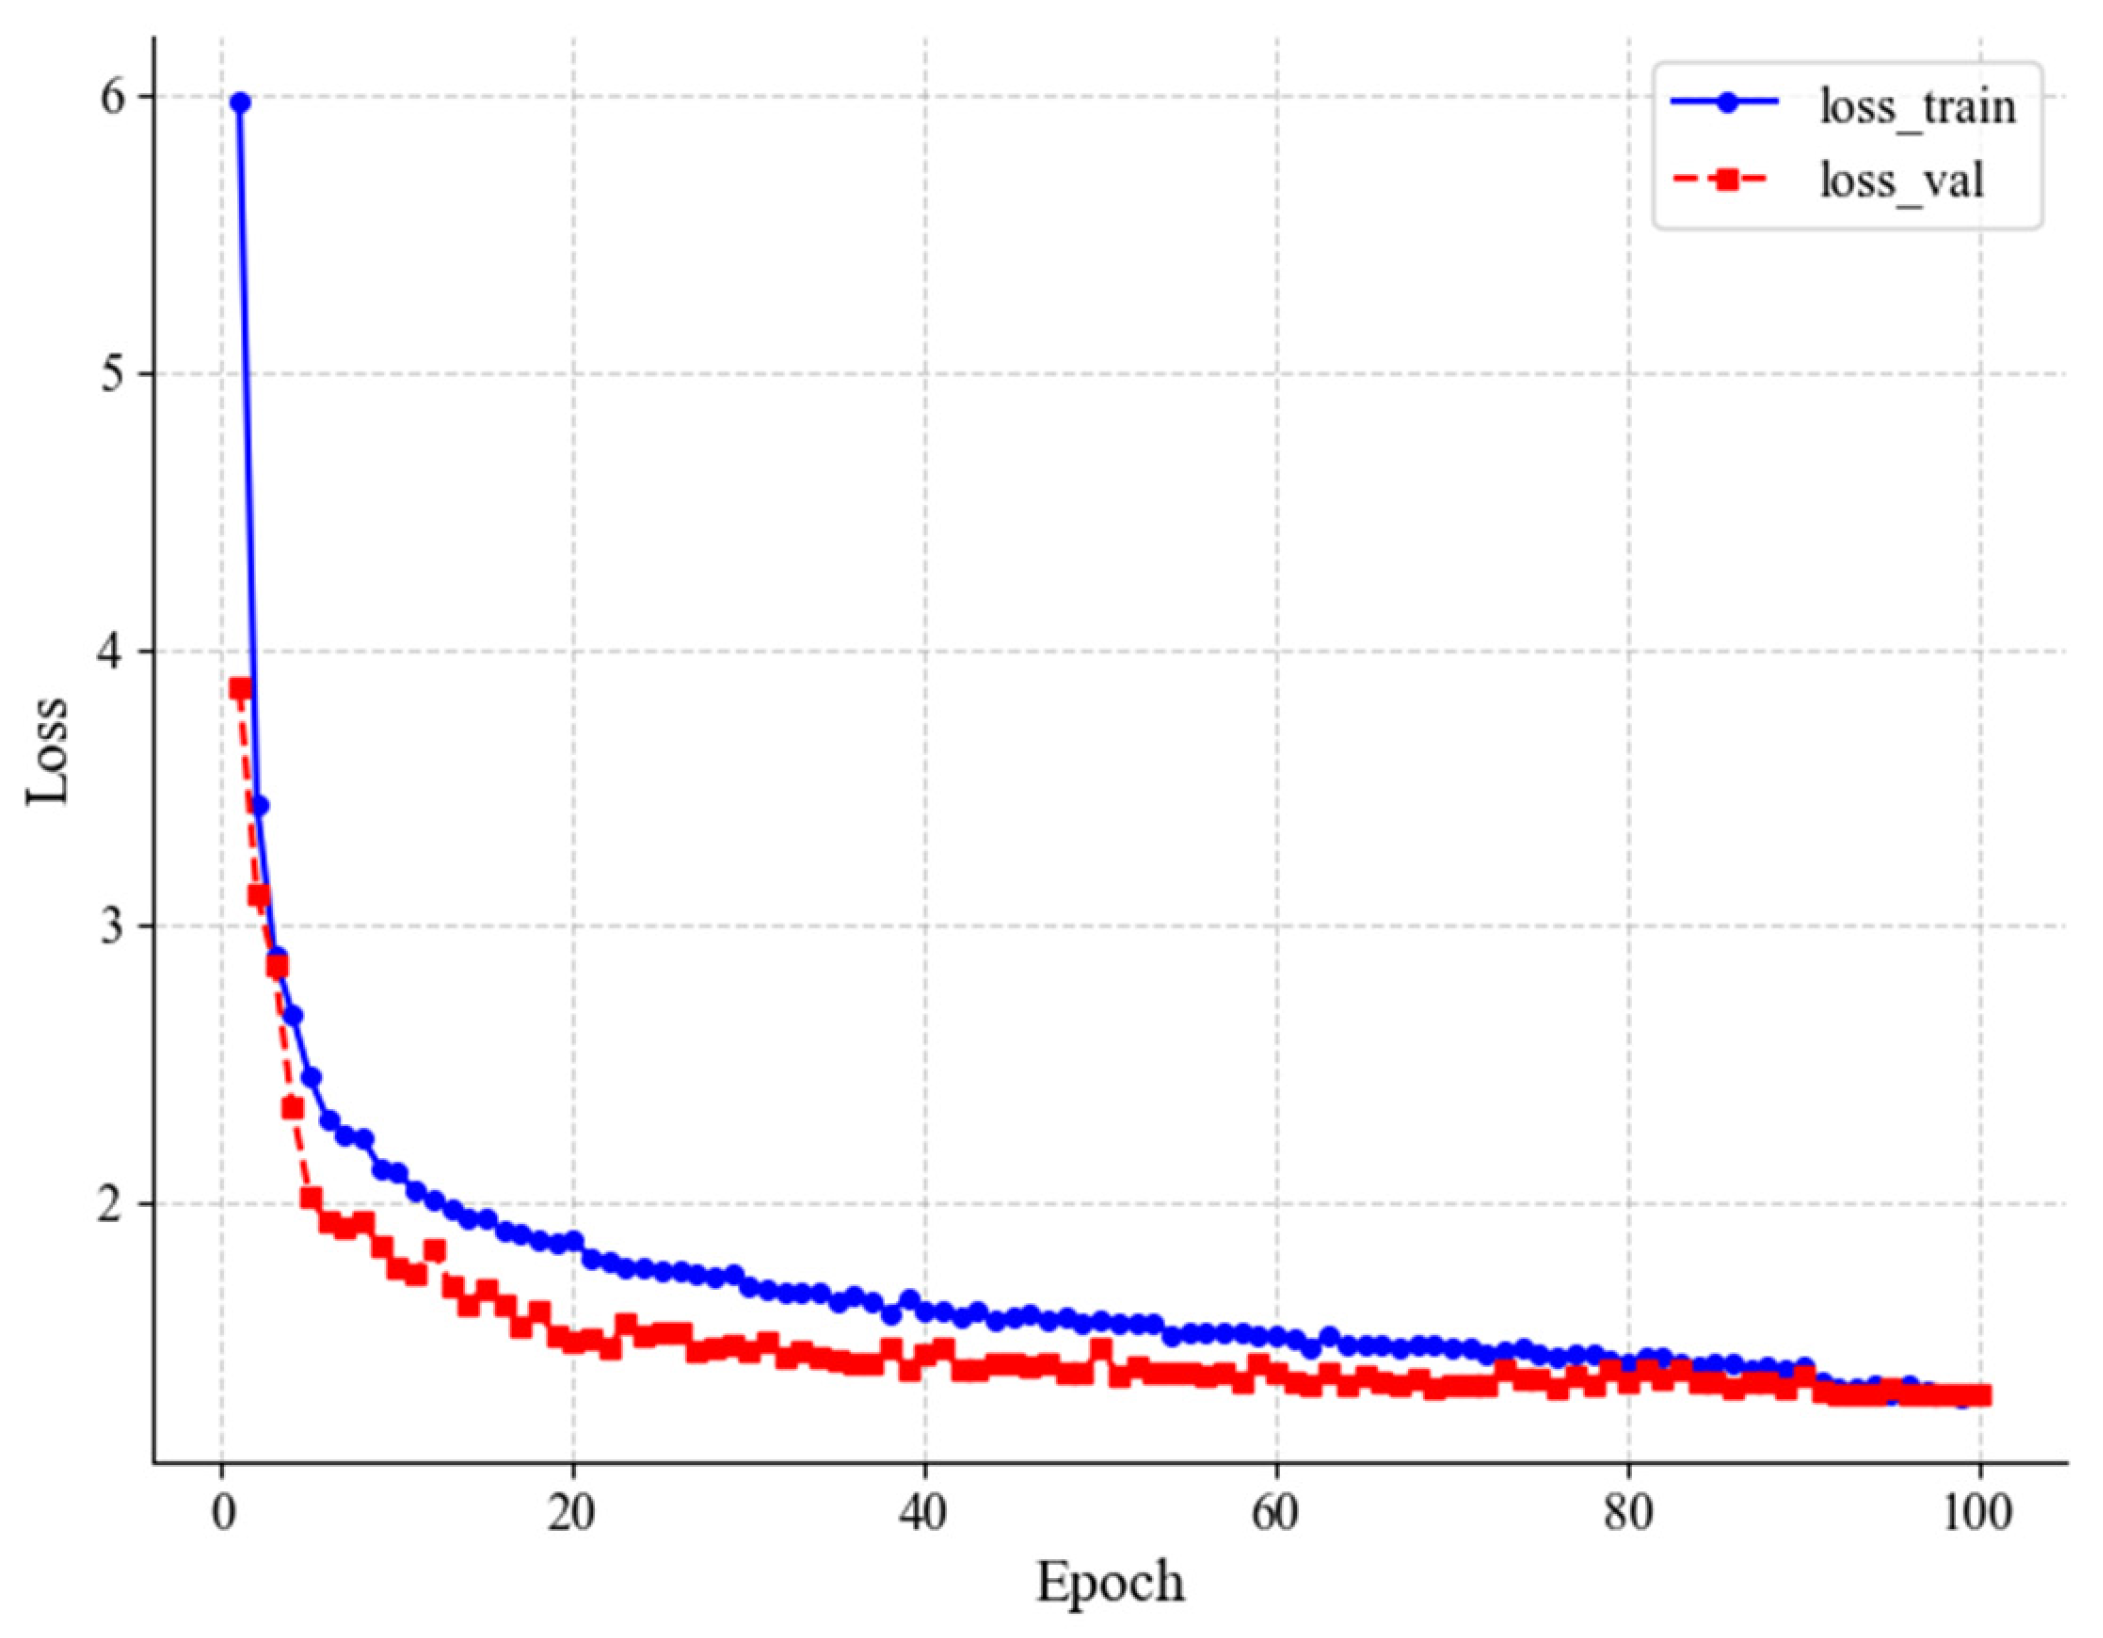
Figure 8.
Detection results of SwinStar-YOLO.

Figure 9.
Extraction of pig ear contour.
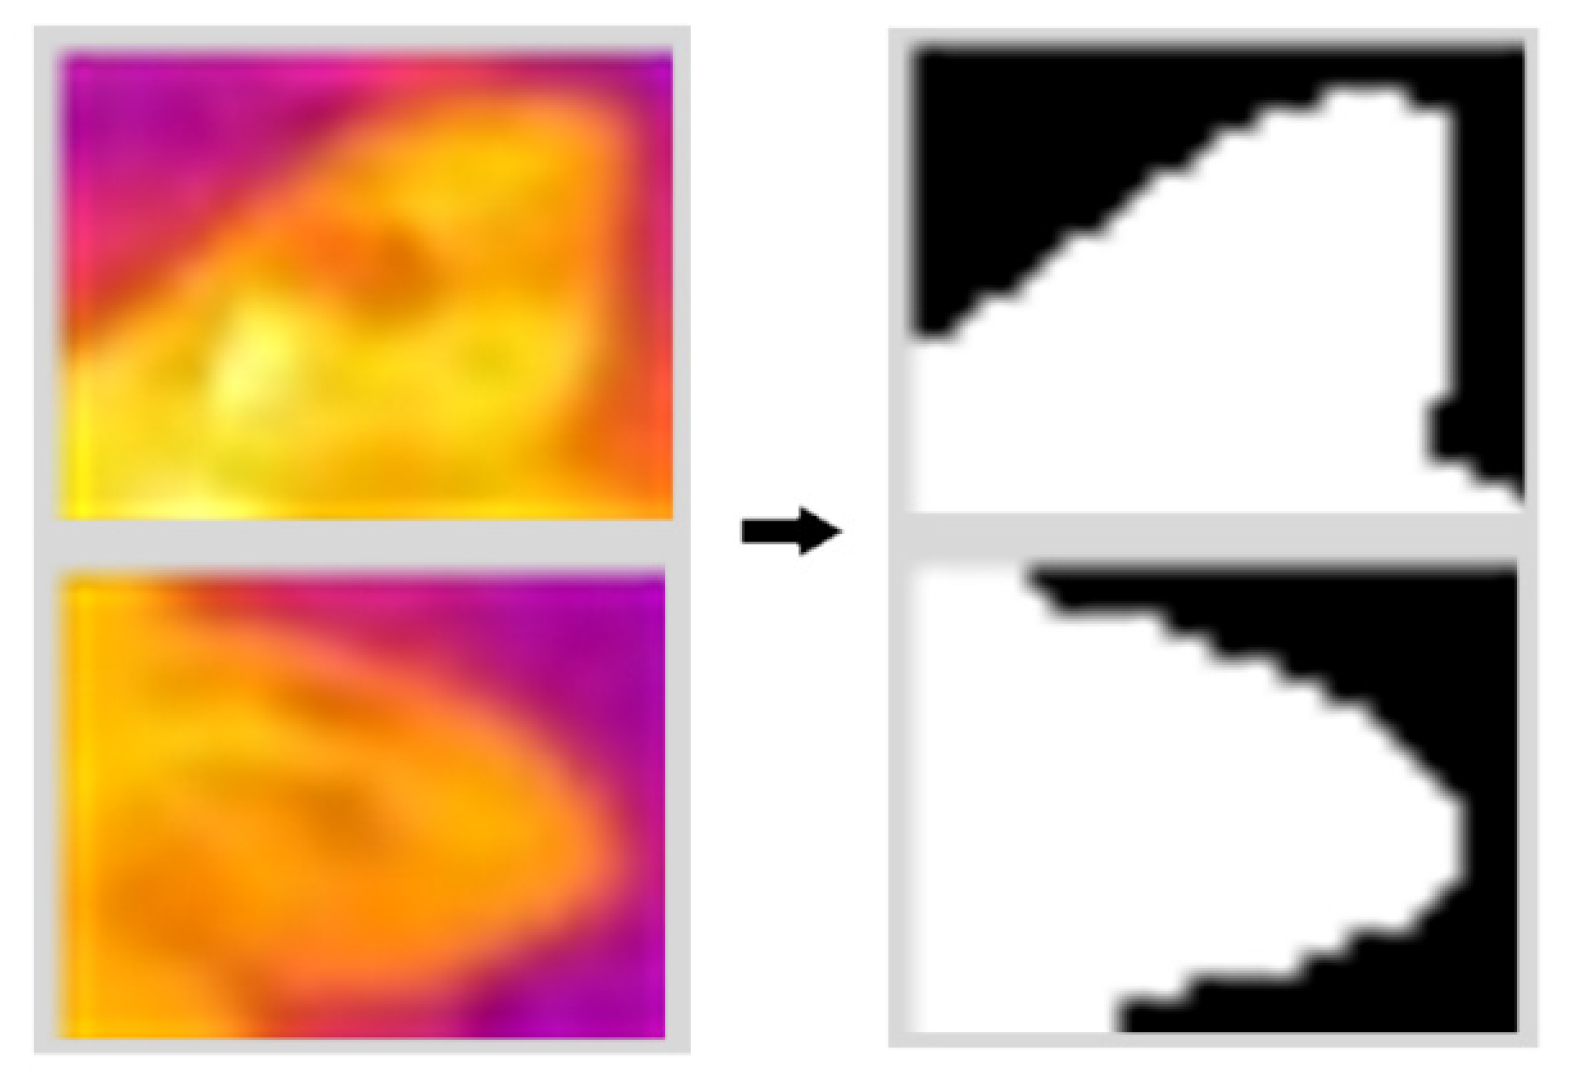
Figure 10.
The correlation analysis between the manual-extracted and algorithm-extracted tem-peratures: (a) Maximum temperature in the ear; (b) Average temperature in the ear.
Figure 10.
The correlation analysis between the manual-extracted and algorithm-extracted tem-peratures: (a) Maximum temperature in the ear; (b) Average temperature in the ear.
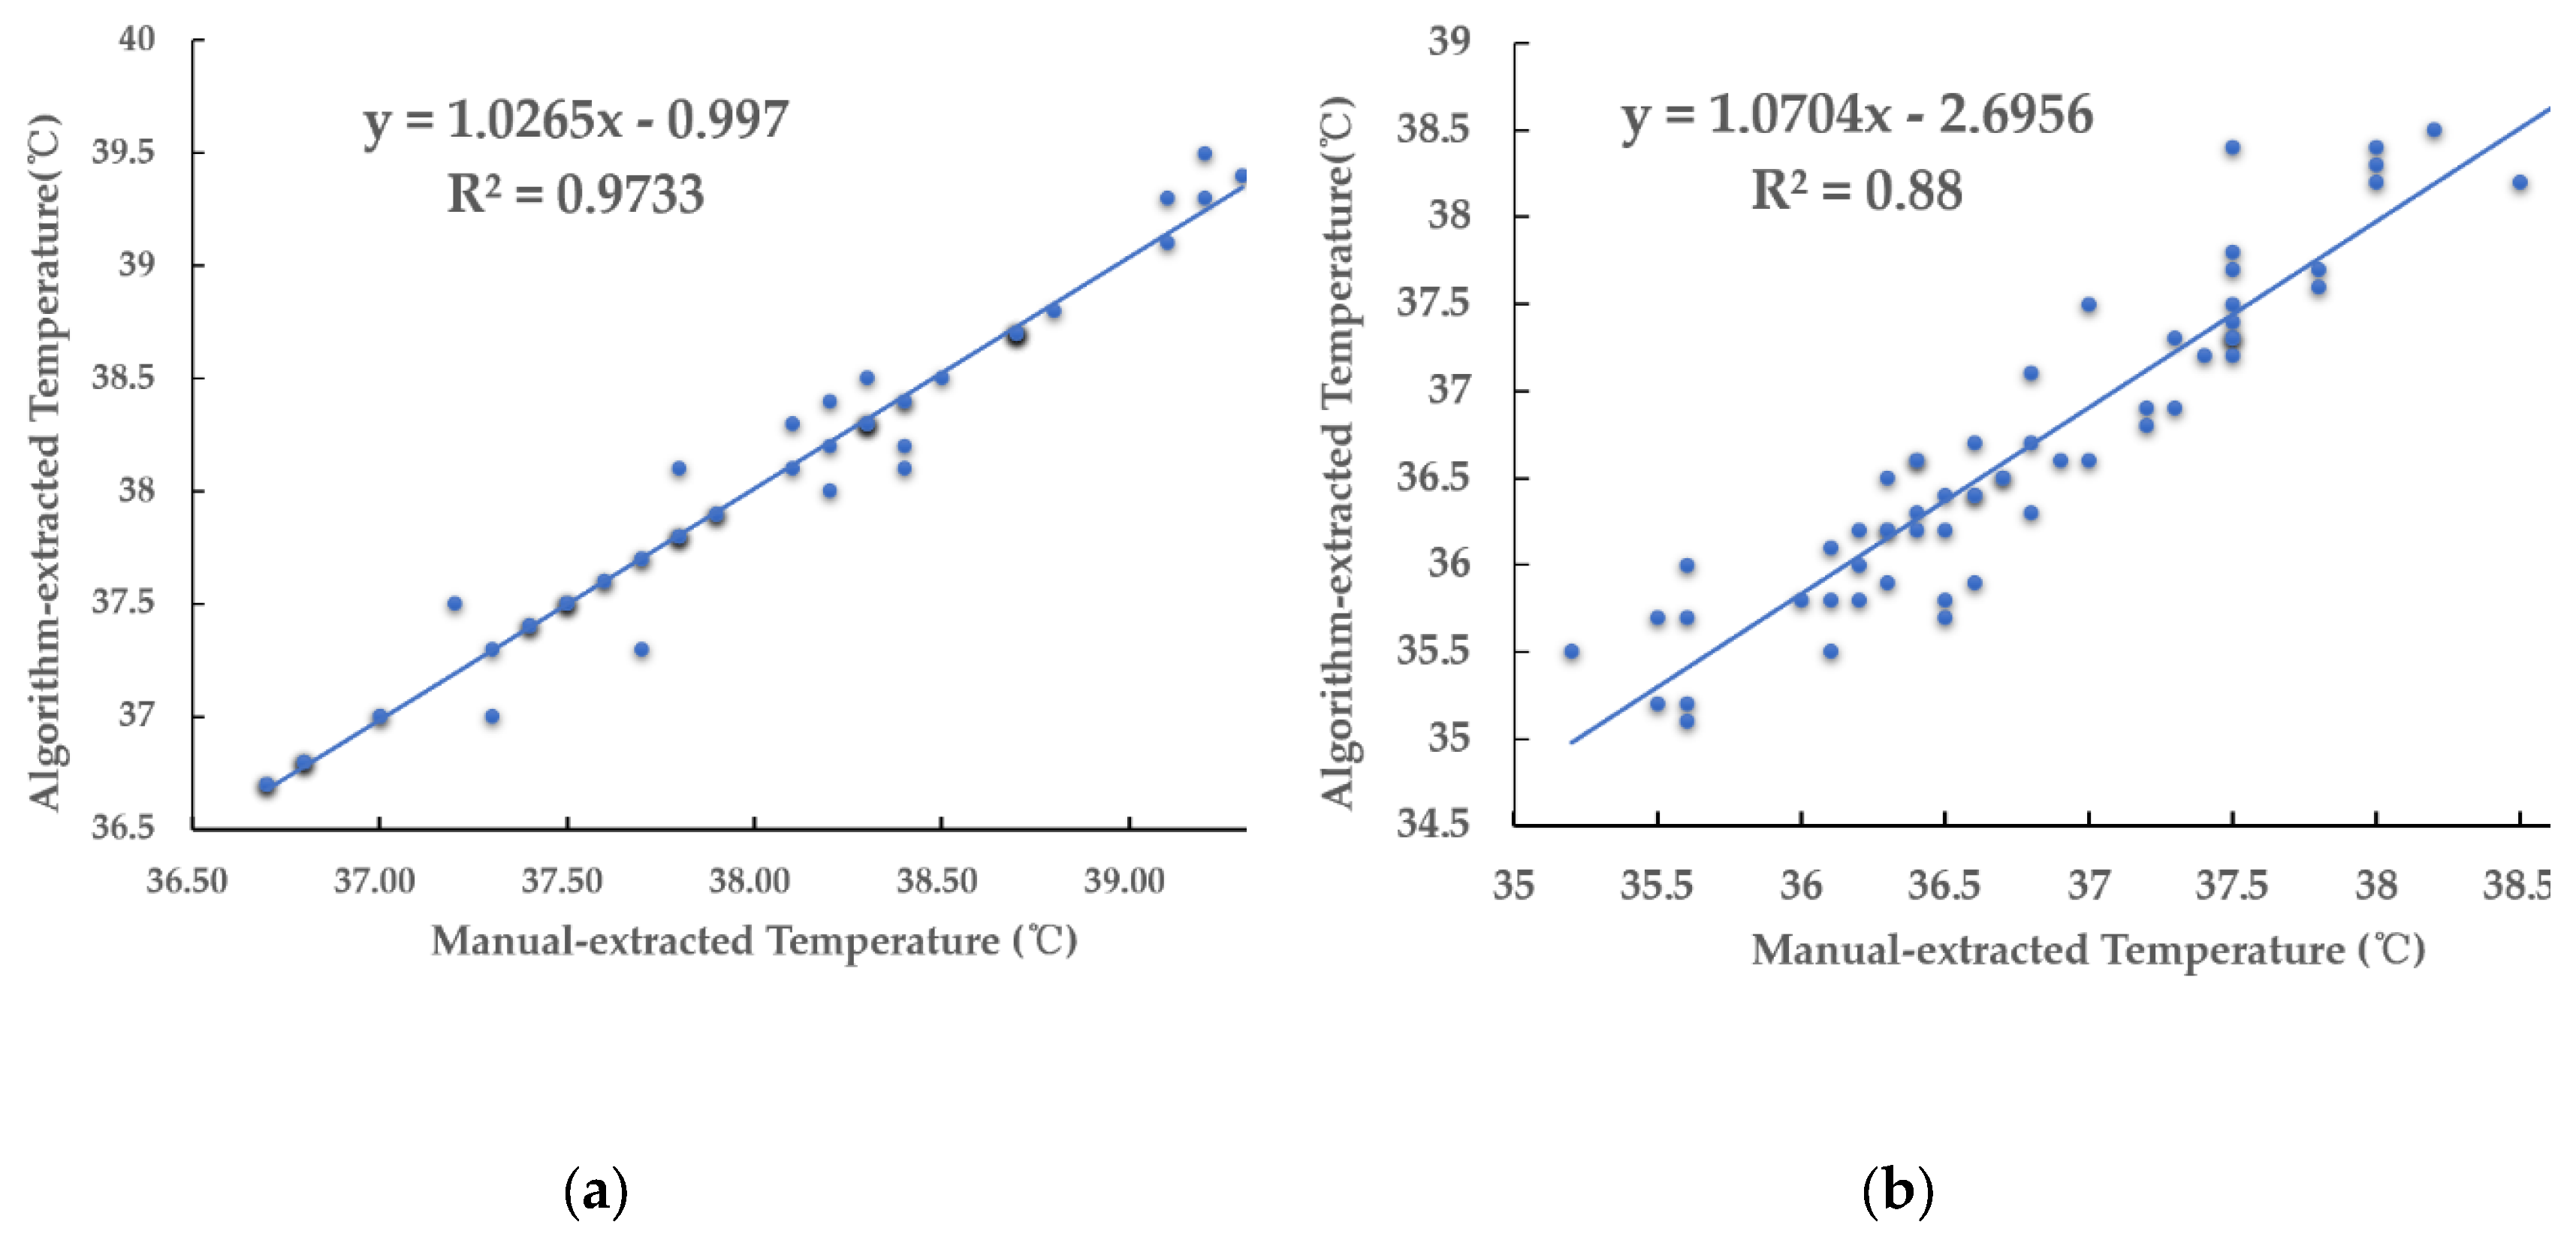

Table 1.
SwinStar-YOLO training parameter settings.
| Parameters | Values |
|---|---|
| initial learning rate | 0.01 |
| optimizer weight decay | 0.0005 |
| momentum | 0.937 |
| Close_mosaic | 10 |
| epochs | 100 |
| batch-size | 32 |
Table 2.
Training results of pig ear detection model.
| Losstr(10) | Lossval(10) | losstr(50) | Lossval(50) | losstr(90) | Lossval(90) | Lossval_min | Epochval |
|---|---|---|---|---|---|---|---|
| 2.1025 | 1.7647 | 1.5760 | 1.4681 | 1.4022 | 1.3755 | 1.3080 | 92 |
| 2.2470 | 2.6962 | 1.6126 | 1.4313 | 1.4267 | 1.3405 | 1.3088 | 91 |
| 2.0575 | 1.8134 | 1.6511 | 1.4920 | 1.3510 | 1.3219 | 1.3042 | 88 |
| 2.0651 | 1.7510 | 1.5161 | 1.41011 | 1.3902 | 1.3511 | 1.3008 | 92 |
| 2.1003 | 1.9810 | 1.52381 | 1.45901 | 1.4001 | 1.3412 | 1.3124 | 88 |
Table 3.
Comparative results of SwinStar-YOLO against other large-scale object detection models..
| Model | Params(M) | FLOPs(G) | recall/% | F1-score | Map@0.5/% | Map@0.5:0.95/% | Latency(ms) |
|---|---|---|---|---|---|---|---|
| YOLOv5-m | 25.1 | 64.6 | 81.97 | 81.98 | 89.89 | 61.07 | 9.5 |
| YOLOv6-m | 52.0 | 161.3 | 82.13 | 81.87 | 89.88 | 61.44 | 11.8 |
| YOLOv8-m | 25.9 | 78.9 | 85.48 | 85.25 | 90.03 | 64.87 | 9.7 |
| YOLOv8-l | 43.6 | 165 | 87.81 | 87.90 | 92.13 | 66.59 | 15.3 |
| SwinStar-YOLO-m(Ours) | 42 | 112.5 | 89.66 | 90.04 | 93.74 | 69.38 | 11.6 |
Table 4.
Results of ear temperature extraction.
| Parameters | Talg | Tmanu |
|---|---|---|
| Maximum temperature/℃ | 37.94 | 37.93 |
| Average temperature/℃ | 36.70 | 36.81 |
| δmax/% | 0.02 | |
| δmean /% | 0.30 | |
Disclaimer/Publisher’s Note: The statements, opinions and data contained in all publications are solely those of the individual author(s) and contributor(s) and not of MDPI and/or the editor(s). MDPI and/or the editor(s) disclaim responsibility for any injury to people or property resulting from any ideas, methods, instructions or products referred to in the content. |
© 2025 by the authors. Licensee MDPI, Basel, Switzerland. This article is an open access article distributed under the terms and conditions of the Creative Commons Attribution (CC BY) license (http://creativecommons.org/licenses/by/4.0/).
Copyright: This open access article is published under a Creative Commons CC BY 4.0 license, which permit the free download, distribution, and reuse, provided that the author and preprint are cited in any reuse.


