
Submitted:
02 December 2024
Posted:
03 December 2024
You are already at the latest version
Abstract
The stable physiological structure and rich vascular network of pig ears more easily form distinct thermal characteristics, representing pig body temperature. Using thermal infrared imaging to identify pig ears offers a feasible approach to analyzing individual pig health status. Based on this background, a dataset comprising 23,189 thermal infrared images of pig ears (TIRPigEar) was established. The TIRPigEar dataset was obtained through a pig house health inspection robot equipped with an infrared thermal imaging device, with post-processing conducted via manual annotation. By labeling pig ear targets within these images, a total of 69,567 labeled files were generated, which can be directly used for training pig ear detection models and enabling the analysis of pig temperature information by integrating the corresponding thermal imaging data. To validate the dataset's utility, it was evaluated across various object detection algorithms. Experimental results show that the dataset achieves the highest precision, recall, and mAP50 on the YOLOv9m model, reaching 97.35%, 98.1%, and 98.6%, respectively. Overall, the TIRPigEar dataset demonstrates optimal performance when applied to the YOLOv9m algorithm. Utilizing thermal infrared imaging technology to detect pig ear information provides a non-contact, rapid, and effective method. Establishing the TIRPigEar dataset is highly significant, as it allows for a valuable resource for AI and precision livestock farming researchers to validate and improve their algorithms. This dataset will support many researchers in advancing precision livestock farming by enabling more accurate and timely pig-ear temperature analysis.
Keywords:
Thermal Infrared imaging
; Pig Health Monitoring
; Deep Learning for Object Detection
; Precision Livestock Farming
1. Introduction
Health management in pig farms is crucial for modern livestock production, and infrared thermography offers a non-contact monitoring method for accurate swine health assessment. By enabling real-time health status monitoring, infrared thermography facilitates early interventions in response to abnormalities, thereby mitigating potential risks. However, publicly available datasets for infrared thermographic applications in swine health monitoring are limited, which hinders researchers in computer science from performing swine health analysis and applications based on open datasets.
Nie, et al. [1] applied deep learning algorithms to recognize pig facial expressions to assess pigs’ emotions, health status, and intentions, achieving a mean Average Precision (mAP) of 89.4%. Pu and Liu [2] proposed an improved YOLOv5 network for pig detection, reaching 1.6% higher detection accuracy than the baseline model in detecting feeding pigs. Ma, et al. [3] developed a lightweight pig face recognition method, demonstrating high detection accuracy on small datasets and the potential to generate large-scale unannotated pig face data. Wang, et al. [4] introduced a method for detecting dropped ear tags in breeding pigs, with a detection accuracy of 90.02% and a speed of 25.33 frames per second (fps), achieving real-time, accurate monitoring. However, the datasets used in these studies were not publicly released.
Esper, et al. [5] introduced a pig carcass cutting dataset comprising RGB images, depth data, and camera intrinsic matrices for meat processing automation applications. Wang, et al. [6] developed a dataset containing 2,300 annotated infrared images of group-housed pigs for instance segmentation, reaching a segmentation accuracy of 97.9%. Shao, et al. [7] established a dataset of 3,200 images covering four pig postures, achieving an application accuracy of 92.45%. Bergamini, et al. [8] observed approximately six million pigs and provided annotations for various behavioral patterns, including five individual behaviors, forming a large dataset for pig detection, tracking, and behavior analysis. Most existing datasets primarily consist of RGB images; however, infrared thermography (IRT), a non-invasive temperature measurement technique, can eliminate stress caused by direct contact with thermometers [9]. There is currently no available dataset specifically for pig ear recognition in infrared thermography.
Infrared thermal imaging enables precise temperature detection. Fan, et al. [10] utilized infrared thermography for high-throughput plant phenotyping. Gadhwal, et al. [11] extracted the canopy temperature of maize from thermal images, with a measurement error under 2°C. Dang, et al. [12] used UAV-based infrared thermal imaging to monitor the temperature of drip-irrigated cotton, achieving a minimum temperature error of 2.78°C. Zhang, et al. [13] reconstructed a 3D chicken model from RGB-Depth-Thermal maps, offering enhanced feather damage assessment compared to 2D thermal infrared or color images, thereby providing a reference for poultry farming research. IRT imaging is also suitable for early disease detection, respiratory health monitoring, vaccination evaluation, temperature monitoring, and estrus detection in pigs [14]. However, high-quality publicly available infrared thermal image datasets for swine and accurate temperature measurement methods for pigs are still lacking.
Given these gaps, this study establishes an infrared thermal image dataset focused on pig ear recognition and temperature measurement. The processes of data collection, cleaning, and annotation for the TIRPigEar dataset are discussed in detail, as well as the dataset's performance across different deep learning models. The primary contributions of this study include the following:
1. Establishing and publicly releasing an infrared thermal imaging dataset of pig ears with temperature information.
2. Validating the dataset’s effectiveness through training with state-of-the-art deep learning models.
3. Enabling research on swine temperature distribution and anomaly detection to facilitate early intervention.
2. Materials and Methods
This section describes in detail the data collection of gestating sows in individual stalls using a swine health inspection robot and an infrared thermal imaging camera, as well as the training and evaluation of different target detection models.
The experiments were conducted at the Guanghui Core Breeding Farm, a flagship pig-breeding facility of the Tieqi Lishi Group, located in Santai County, Mianyang, Sichuan Province, China. Tieqi Lishi Group, a national leader in agricultural industrialization, produces three million high-quality piglets annually, making the Guanghui farm an ideal site for obtaining extensive swine samples. The study’s subjects were 150 gestating Large White sows kept in individual stalls with dimensions of 220 cm (length), 75 cm (width), and 106 cm (height). The health inspection robot moved steadily between two rows of stalls at a speed of 0.1 m/s, capturing thermal images of pig ears with an infrared thermal camera to form the final dataset.
Data collection was performed using a health inspection robot, previously proven effective in pig farms (Figure 1). Designed and manufactured by the Information Technology Research Center of the Beijing Academy of Agriculture and Forestry Sciences(NERCITA), this robot significantly reduces the cost of manual data collection while providing high operational stability [15]. During the robot’s autonomous patrol, the thermal imaging camera captured images at a frequency of one frame per second. The specifications for the patrol robot and the thermal imaging camera are presented in Table 1.
2.1. Experimental Method
Thermal infrared images were captured at various angles in the indoor environment of a pig farm using a health inspection robot. Based on the robot’s movement angles and the pigs' activities, three viewing angles were established for data collection, as illustrated in Figure 2. The robot’s lifting mechanism allowed the infrared thermal camera to move parallel to the longitudinal axis, maintaining a perpendicular distance of 60 cm from the sow stalls. During data collection, external factors such as ambient temperature, lighting, humidity, and target occlusion in the pig farm were considered to capture samples across diverse environmental conditions.
Ear image data was collected through the camera mounted on the health inspection robot and then filtered to yield a high-quality thermal infrared image dataset. This dataset was subsequently used to train target detection models to develop different pig ear detection algorithms. Once trained, these detection models were deployed on the health inspection robot to predict and automatically extract pig ear regions from real-time thermal images collected during patrols. The workflow for the health inspection robot’s data collection and analysis process is shown in Figure 3.
Due to the robot’s dynamic movement, camera shake and distortion might occur. Therefore, after completing the thermal infrared image collection, we manually verified the images to exclude invalid images, such as those with fast-moving pigs or large occlusions. The final dataset, filtered for quality, provides reliable, valuable data for research. The entire collection, conducted from April to June 2023, resulted in 23,189 images. The annotated dataset file size is 11.6 GB, with a compressed size of 7.71 GB.
2.2. Experimental Algorithm
We conducted thermal infrared pig ear detection experiments using mainstream single-stage target detection networks. Specifically, the thermal infrared pig ear detection models varied in size according to network width and depth, and included models from the YOLOV5, YOLOV6, YOLOV7, YOLOV8, RT-DETR, YOLOV9, YOLOV10, and YOLOV11 series. Comparative parameters of these models are presented in Table 2.
2.3. Training Environment and Evaluation Metrics
The pig ear detection algorithm was trained and tested on a Linux (version 5.8.12) server running a deep learning framework configured on Ubuntu 18.04, with support for CUDA 12.1, Anaconda3, and Python 3.8.18. All experiments were conducted without pretrained weights, setting the number of epochs to 200, batch size to 16, and workers to 8. The input image size was 640×640, the optimizer was set to SGD (Stochastic Gradient Descent), and the initial and decay learning rates were both set to 0.01.
The evaluation of the pig ear detection models was performed across six dimensions: loss function, precision (P), recall (R), mAP50, parameters, and latency, assessing model accuracy and complexity during training, validation, and testing phases. Precision (P) reflects the proportion of true pig ear samples among the predicted positive pig ear regions:
where TP denotes the number of correctly predicted pig ear samples, and FP denotes the number of samples incorrectly predicted as pig ears.
Recall (R) represents the proportion of correctly predicted pig ear samples among all actual pig ear samples:
where FN is the number of false negatives, representing missed pig ear samples.
The mean Average Precision (mAP) indicates the average precision (AP) over the P-R curve area. The mAP can be calculated as follows:
where N is the number of classes; here, N is 1. In this study, mAP50 represents the mean AP at an IoU threshold above 0.5.
The loss function provides an optimization objective for model training. Minimizing this function enhances model prediction accuracy. Parameters denote the total number of trainable parameters (such as weights and biases), measuring model complexity. Latency measures the time required for a single forward inference, reflecting the model's inference speed.
2.4. Dataset establishment
This section details how TIRPigEar dataset was established including the collection samples, annotation and labeling information, data storage locations, and data value.
2.4.1. Data Environment
Due to the use of a pig health inspection robot capable of flexible movement and adjustable collection height, this dataset includes images taken from various viewpoints, enriching the diversity of the data. Each pig stall contains only one pig, and most images captured by the robot contain a single pig, enhancing the dataset’s utility for individual pig assessment.
2.4.2. Annotations and Labels
Pig ear data were annotated using the open-source tool LabelImg, employing rectangular bounding boxes, and saved in three formats: Pascal VOC, COCO, and YOLO. Each format meets the requirements of various object detection algorithms, with the structure illustrated in Figure 5.
2.4.3. Data Organization
Thermal infrared pig ear images from the nine data collection rounds are stored in nine separate folders. After data cleaning and annotation, each folder retains between 2,000 to 3,000 images, with folder structure as shown in Figure 6. The numerical suffix in each folder name indicates the distribution of image counts across the nine rounds.
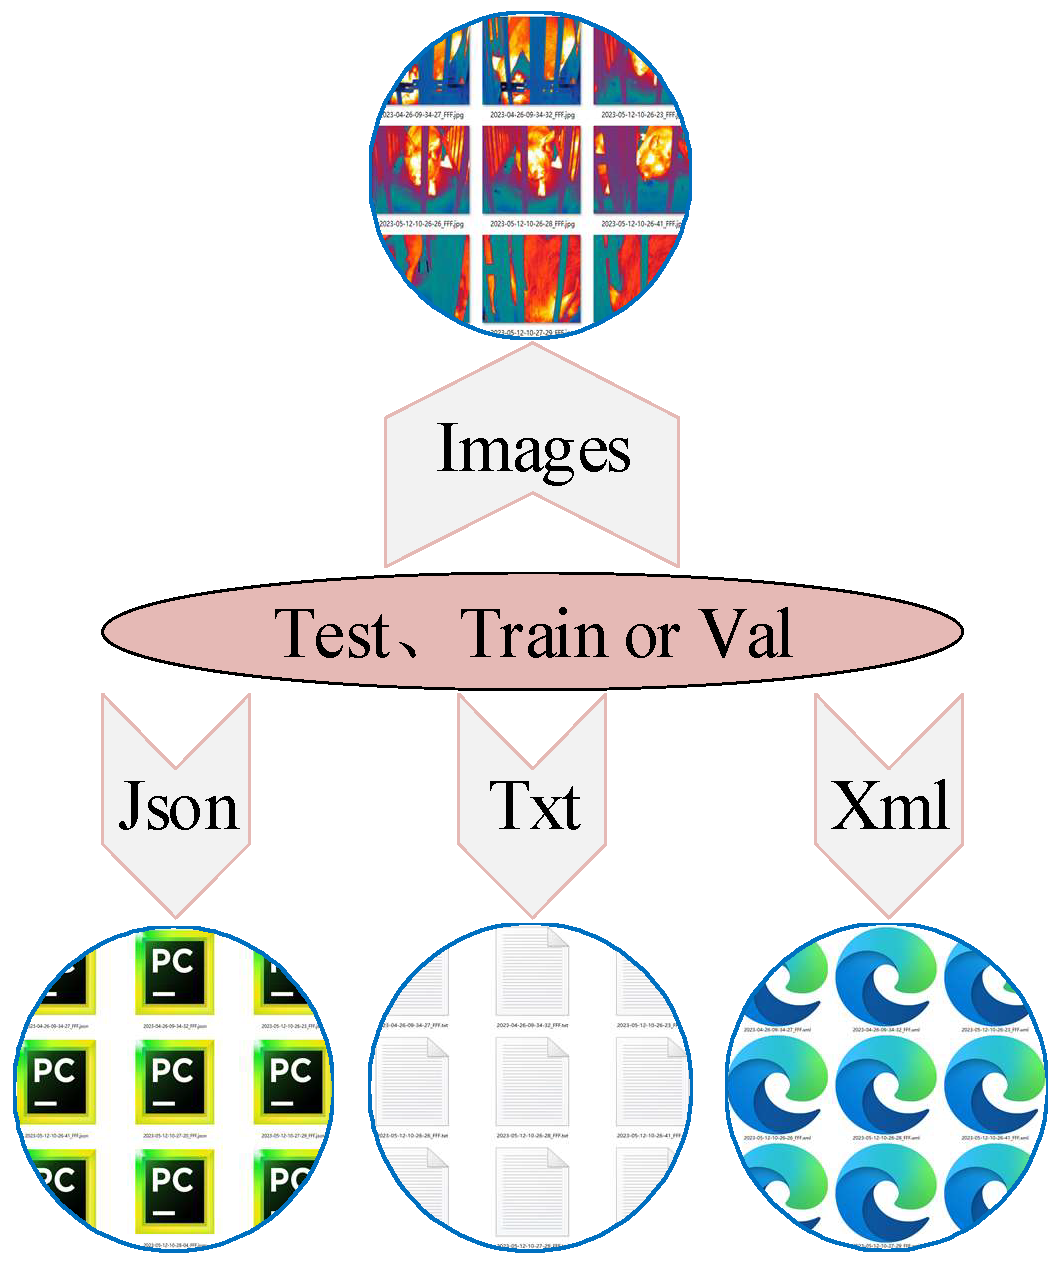
The images and corresponding labels in each folder were randomly divided into training, validation, and test sets at a ratio of 8:1:1. Each set folder contains Pascal VOC, COCO, and YOLO format labels, making them compatible with different detection tasks. The internal structure of each training, validation, and test set folder is consistent, as illustrated in Figure 7.

Figure 4 shows thermal infrared images of pigs captured in their natural environment. These images, focusing primarily on the pig’s head, can support research on temperature distribution of pig heads, health status, etc.
Figure 4.
Examples of thermal infrared images of pigs in the dataset.
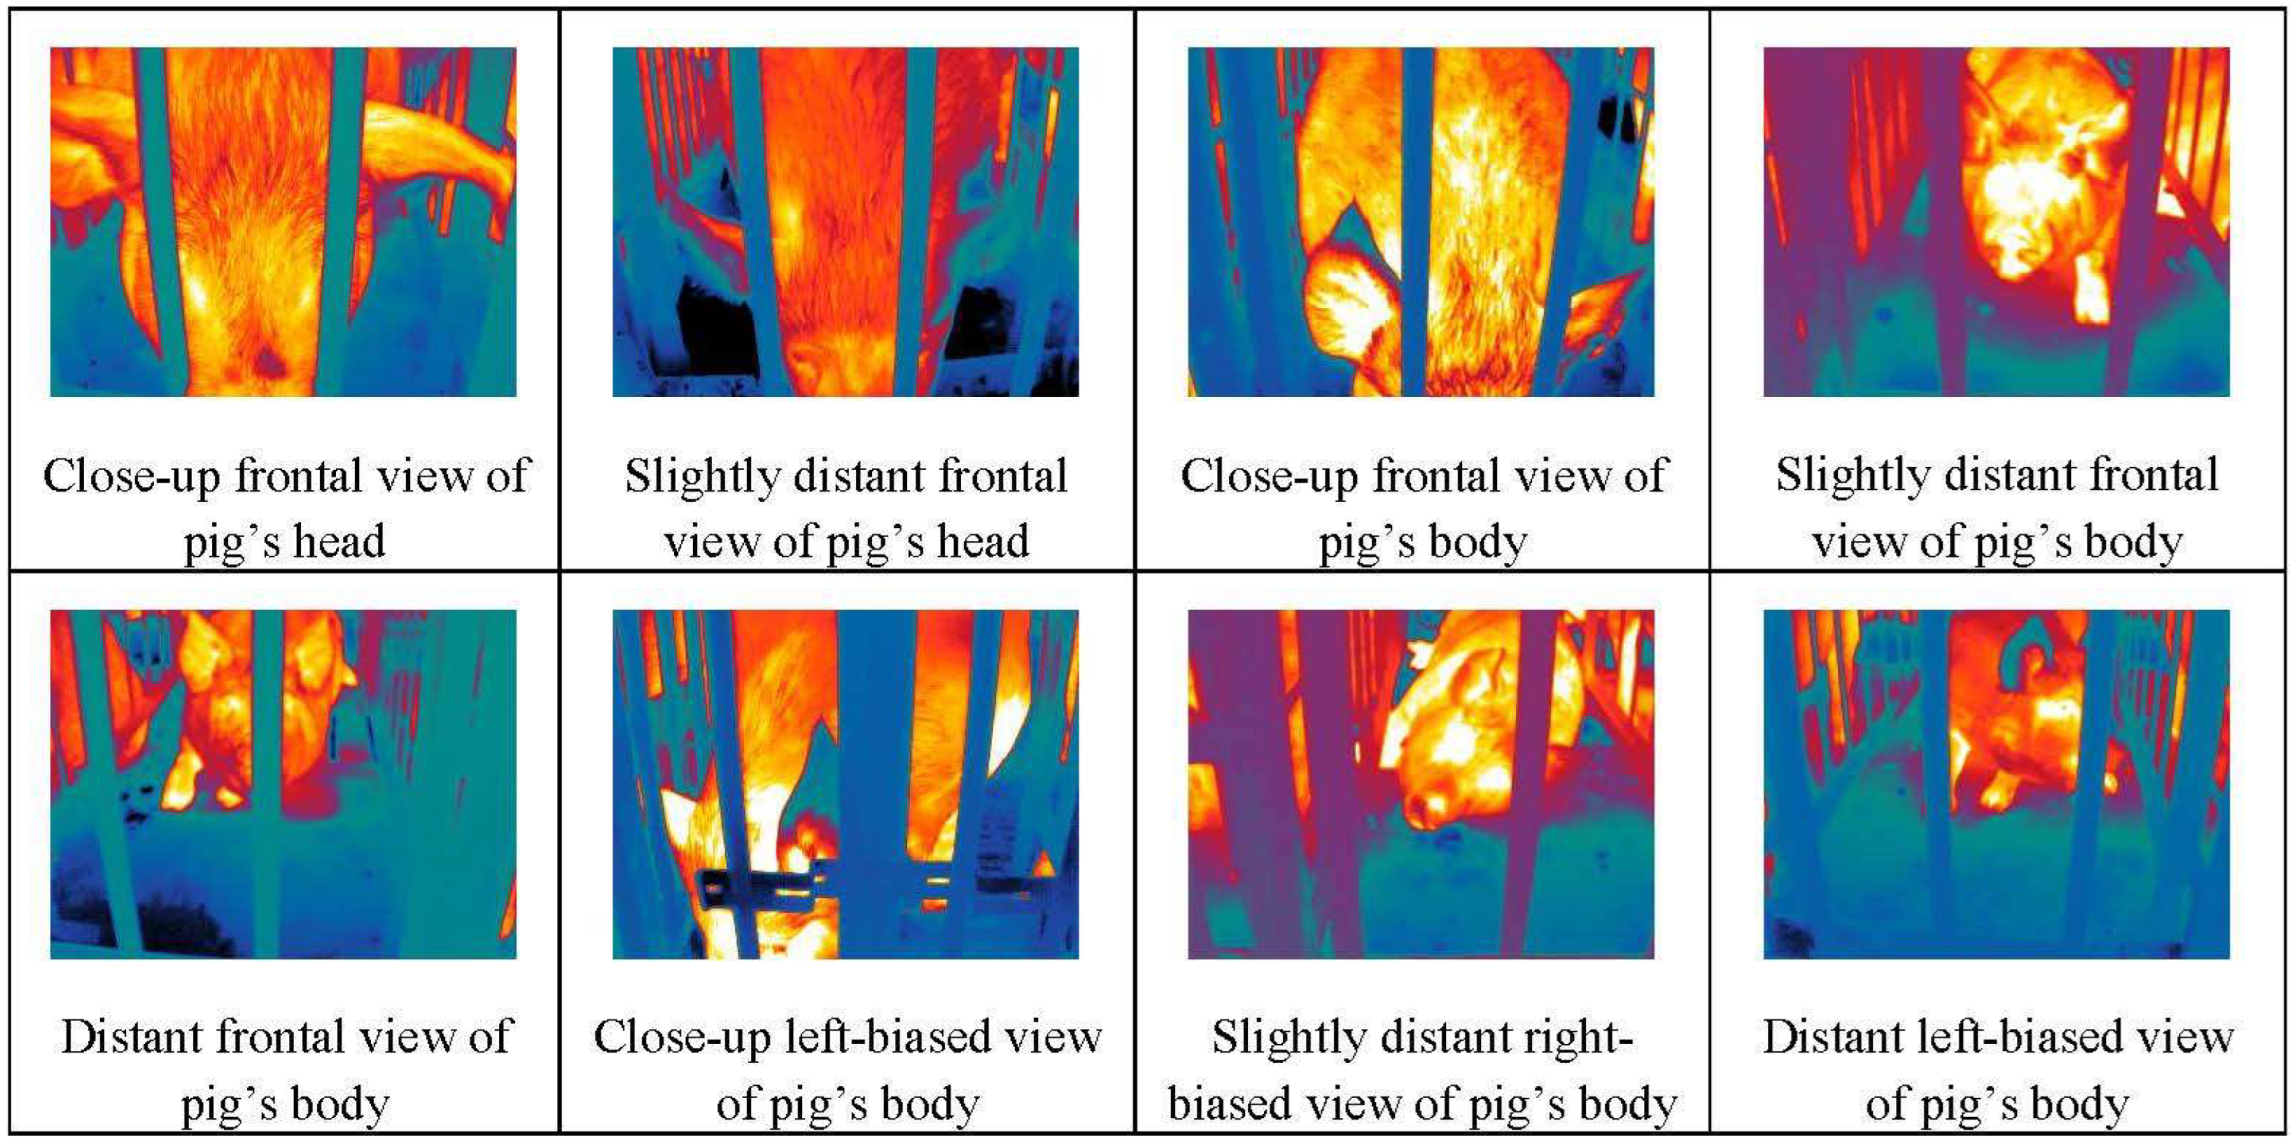
Figure 5.
Composition of Pascal VOC, COCO, and YOLO datasets. Pascal VOC labels are saved as .xml files, COCO labels as .json files and YOLO labels as .txt files.
Figure 5.
Composition of Pascal VOC, COCO, and YOLO datasets. Pascal VOC labels are saved as .xml files, COCO labels as .json files and YOLO labels as .txt files.
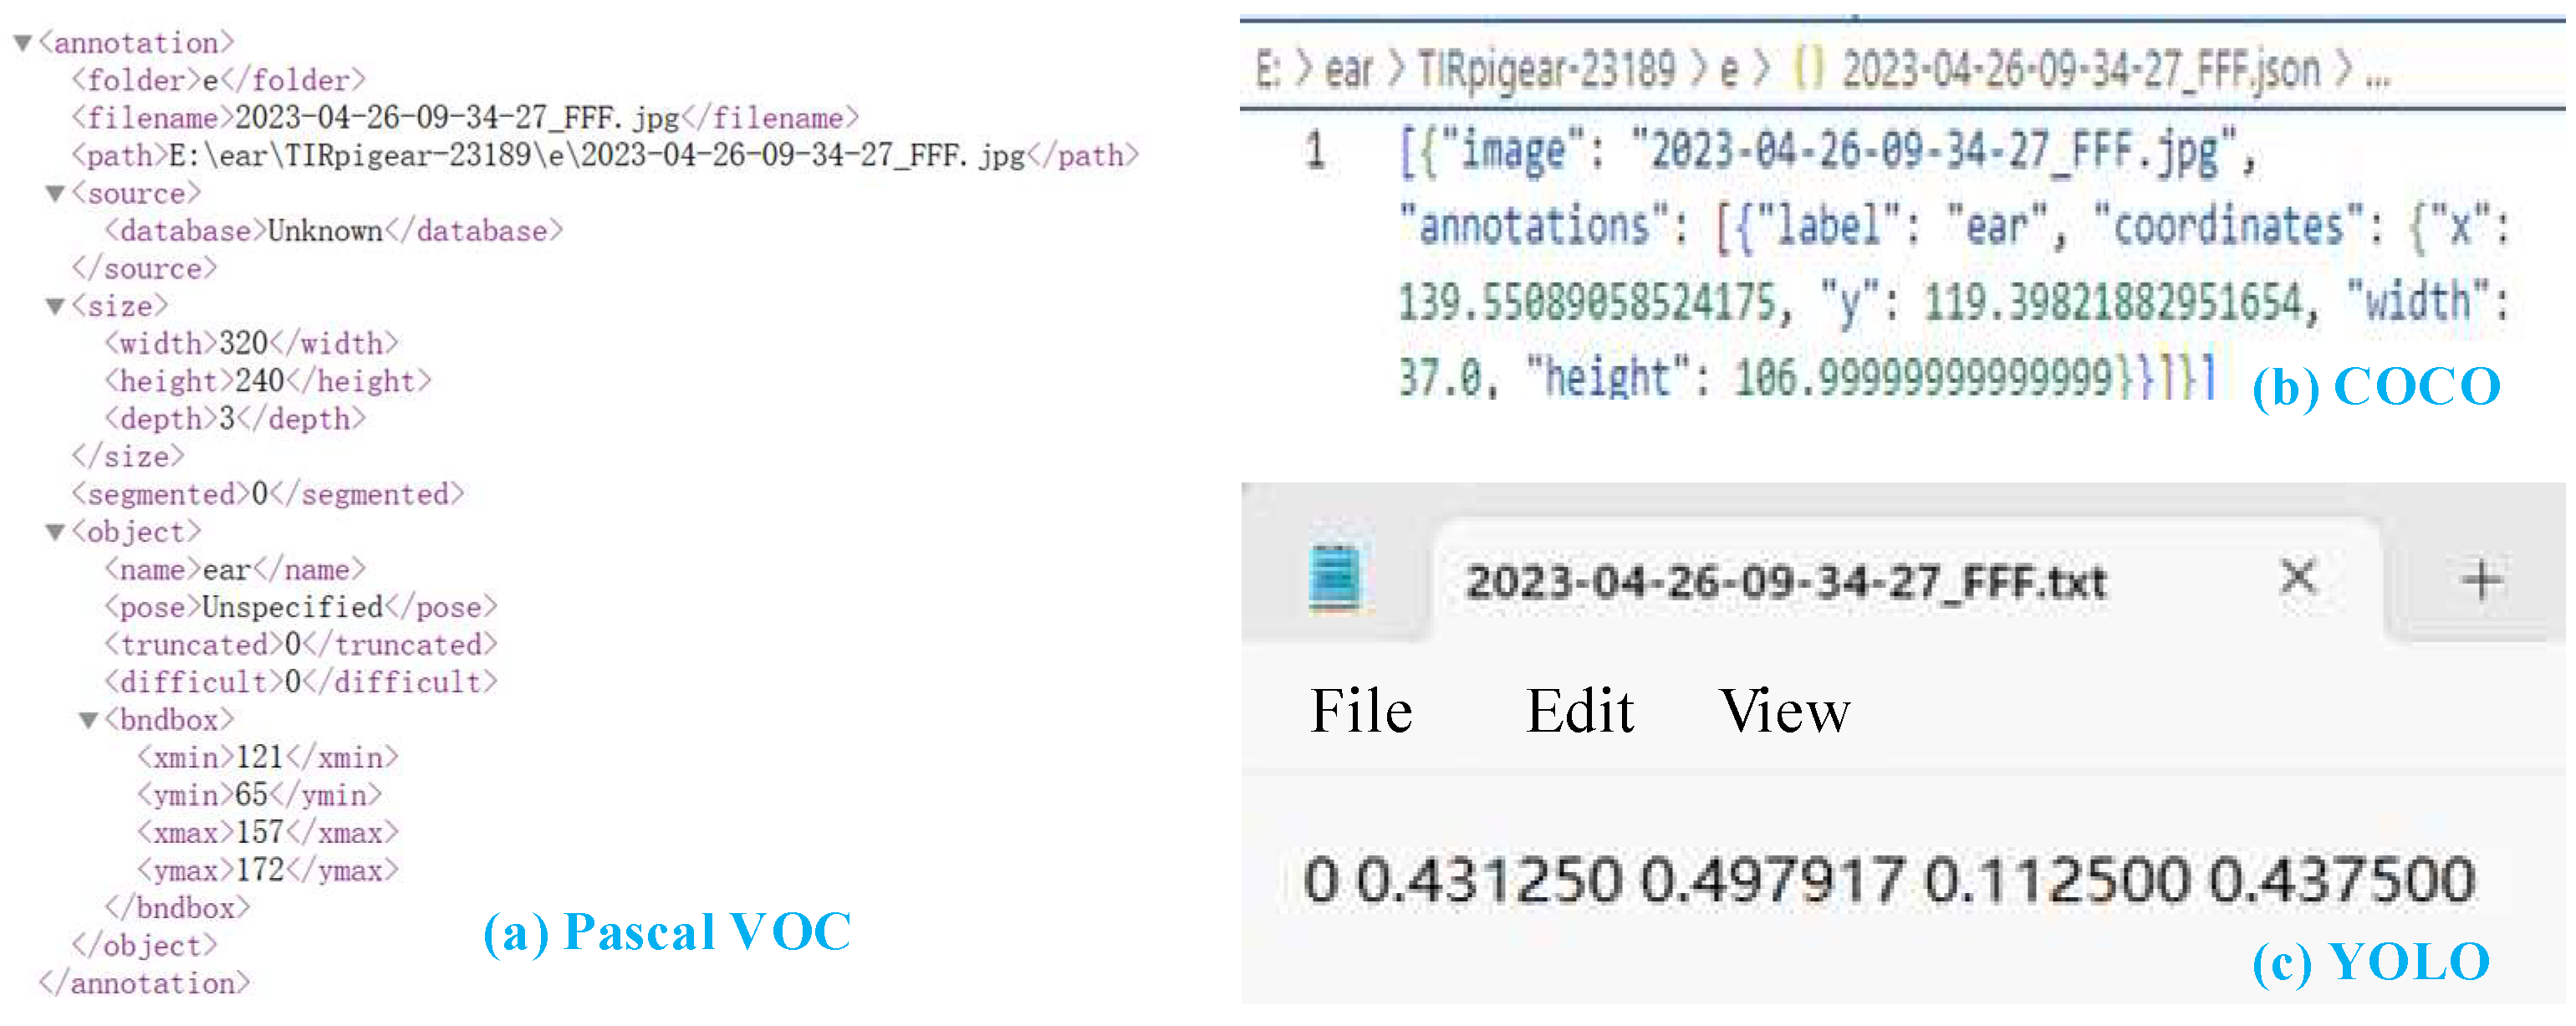
Figure 6.
Dataset structure.
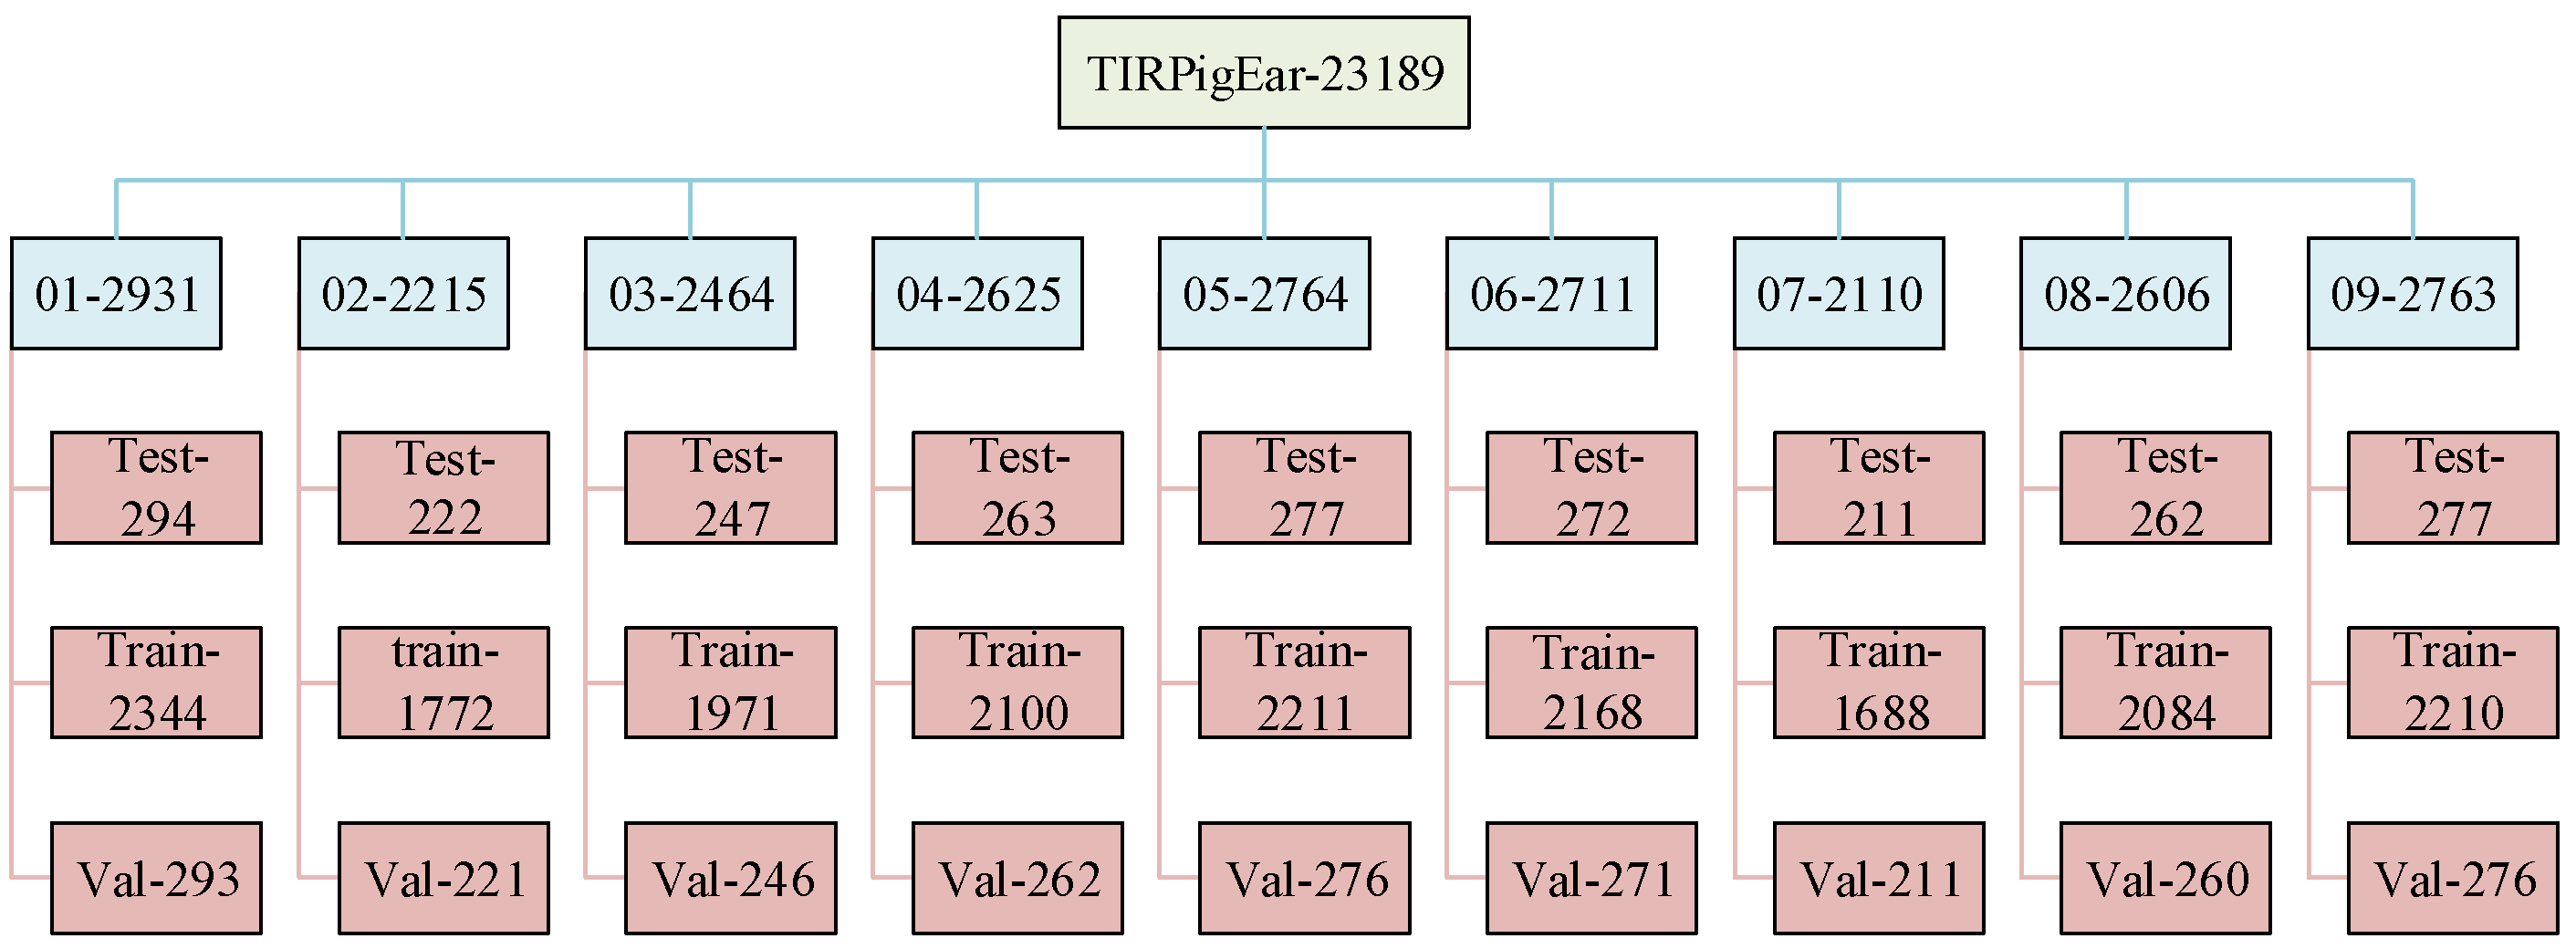
Figure 7.
Internal structure of training, validation, and test set folders.
2.4.4. Value of the Data
·This dataset is valuable for monitoring and analyzing pig health in pig farms, particularly in applications of thermal infrared (TIR) pig ear recognition using deep learning convolutional neural networks.
·The thin structure and rich vascular network of the pig ear make it ideal for thermal infrared imaging, as ear temperature data can be quickly extracted to detect potential health issues in pigs.
·The pig ear’s thermal distribution, combined with information from traditional ear tags or electronic identification, provides insights into individual pig status, aiding farms in early intervention and environmental regulation.
Details about the TIRPigEar dataset are presented in Table 3.
The TIRPigEar dataset also supports using FLIR Tools analysis software for determining pig ear temperatures, which can provide body temperature estimations. The FLIR Tools software can be downloaded for image temperature analysis, image interpretation, and report generation at the above direct URL. The FLIR IP Config software for configuring and diagnosing FLIR network cameras and IP devices is available at the above direct URL.
The steps for determining pig ear temperature information using FLIR Tools are as follows:
Step 1. Configure the thermal imaging camera using FLIR IP Config software to capture and process thermal infrared images of pigs.
Step 2. Use deep learning algorithms to identify pig ear regions, generating bounding box text data.
Step 3. Import the captured TIR images and pig ear bounding box text data into FLIR Tools.
Step 4. FLIR Tools computes and displays temperature data for the pig ear region, including maximum, minimum, and average temperatures.
Step 5. Use regression analysis to establish a linear or nonlinear model between pig ear temperature and body temperature.
Step 7. Based on the model and pig ear temperature distribution, estimate the pig’s body temperature.
Step 7. Export measurement results as a CSV report for further analysis.
The temperature data of pig ear regions calculated with FLIR Tools are pixel-level temperature values, offering a potential way for higher temperature detection accuracy.
3. Results and Discussion
This section analyzes various object detection algorithms for pig ear detection, highlighting the TIRPigEar dataset's adaptability. We compare the accuracy, parameter sizes, and latency of models like RT-DETR and YOLO series to assess deployment potential on edge devices. Loss, precision, recall, and mAP50 evaluations follow, with visualizations confirming TIRPigEar's robustness for real-world applications.
3.1. Comparison of Detection Performance of Different Algorithms
Considering the speed and efficiency advantages of single-stage object detection algorithms when deployed on resource-constrained edge devices, this study employs mainstream single-stage object detection algorithms for training and testing the pig ear detection model. By testing various detection algorithms on the same dataset, the superior quality and outstanding performance of the proposed dataset can be demonstrated. The object detection algorithms used in the experiments include the RT-DETR model [24], the YOLO series of models [25], specifically YOLOv5 [26], YOLOv6 [27], YOLOv7 [28], YOLOv8 [29], YOLOv9 [30], YOLOv10 [31], and YOLOv11 [32].
A total of 2,931 thermal infrared images from the TIRPigEar dataset (comprising 2,344 training images, 293 validation images, and 294 test images) are selected to validate the detection performance of the provided dataset across different algorithms. Figure 8 illustrates the distribution of the dataset used during the pig ear detection training process, with the coordinates represented as normalized values. It can be observed that the distribution of the center points of the bounding boxes for pig ear targets in the dataset is relatively uniform. Additionally, the widths and heights of the bounding boxes follow a linearly decreasing distribution pattern, indicating a uniformity in the shape characteristics of the pig ear.
As shown in the left part of Figure 9, it is evident that YOLOv7 exhibits relatively lower mean average precision (mAP) compared to other methods across varying parameter counts. Within the range of 10-35M, YOLOv9 demonstrates superior average precision compared to other algorithms. Additionally, YOLOv5 shows efficient parameter utilization, and it can be observed that variations in parameter counts do not significantly affect the precision of YOLOv5. When different methods achieve an identical mAP50 of 98%, YOLOv10 has eight times fewer parameters than YOLOv8. As depicted in the right part of Figure 9, under similar performance conditions, YOLOv9 reduces latency by 28.85% compared to YOLOv5, while YOLOv10 reduces latency by 30.21% compared to RT-DETR. YOLOv5n has the smallest number of parameters at 1.76M, with a corresponding mAP50 of 98.2%. YOLOv11-n exhibits the least latency at 1.6 ms, with a mAP50 of 97.7%.
Table 4 presents the detection performance of various algorithms in the pig ear detection task. As the model size, parameters, and computation decrease, inference speed increases, and resource consumption lessens. Among these models, YOLOv5n, YOLOv8n, YOLOv9t, YOLOv10n, and YOLOv11n demonstrate faster inference speeds with lower resource consumption. In contrast, YOLOv5x, YOLOv8x, and YOLOv9e show poorer performance across these three key metrics. Additionally, models with higher Precision, Recall, and mAP50 scores include YOLOv5n, YOLOv9s, YOLOv9m, and YOLOv9e. Therefore, YOLOv5n may serve as an initial choice for deploying pig ear detection models on mobile or embedded devices.
Figure 10, Figure 11, Figure 12, Figure 13 and Figure 14 illustrate the changes in loss values and precision during the training of the RT-DETR and YOLO series pig ear detection models. In terms of loss curves, the YOLOv9 series models exhibit higher loss values, stabilizing below 15. The models with lower loss values are the YOLOv5 and YOLOv7 series models, where the loss value of YOLOv5 stabilizes below 0.2, and that of YOLOv7 stabilizes below 0.04. The model loss reflects the degree of difference between the predicted results for pig ears and the actual ear labels; a lower loss value indicates better performance in recognizing pig ears. However, excessively low loss values may indicate potential overfitting of the model.
Regarding changes in precision, most models maintain a pig ear detection precision of over 90%. However, the precision of the YOLOv6 series models for pig ear detection falls below 80%, indicating that the YOLOv6 series lacks strong classification capabilities for pig ears. This also suggests that the TIRPigEar dataset may not be suitable for application within the YOLOv6 series models.
Overall, as the number of training epochs increases, the loss values of various algorithms gradually decrease and stabilize, while precision gradually improves and stabilizes. When employing the YOLOv7 model for pig ear recognition, the lowest loss value reached is as low as 0.023. In contrast, when utilizing the YOLOv9m model for pig ear recognition, the highest precision achieved is 97.35%.
The detection performance of each model is comprehensively evaluated using Recall and mAP50 (mean Average Precision at Intersection over Union of 0.5), as depicted in Figure 15 to Figure 22. Notably, the recall curve of YOLOv7x exhibits significant fluctuations during the first 50 epochs, with its mAP50 curve also showing multiple substantial variations. This indicates some instability in the performance of the YOLOv7x model during pig ear detection. Conversely, the recall rate of the YOLOv6 series models remains consistently low, ultimately stabilizing at around 80%. The observation of a relatively high mAP50 value in the YOLOv6 series models, combined with the results shown in Figure 11, suggests that these models possess poor generalization capabilities.
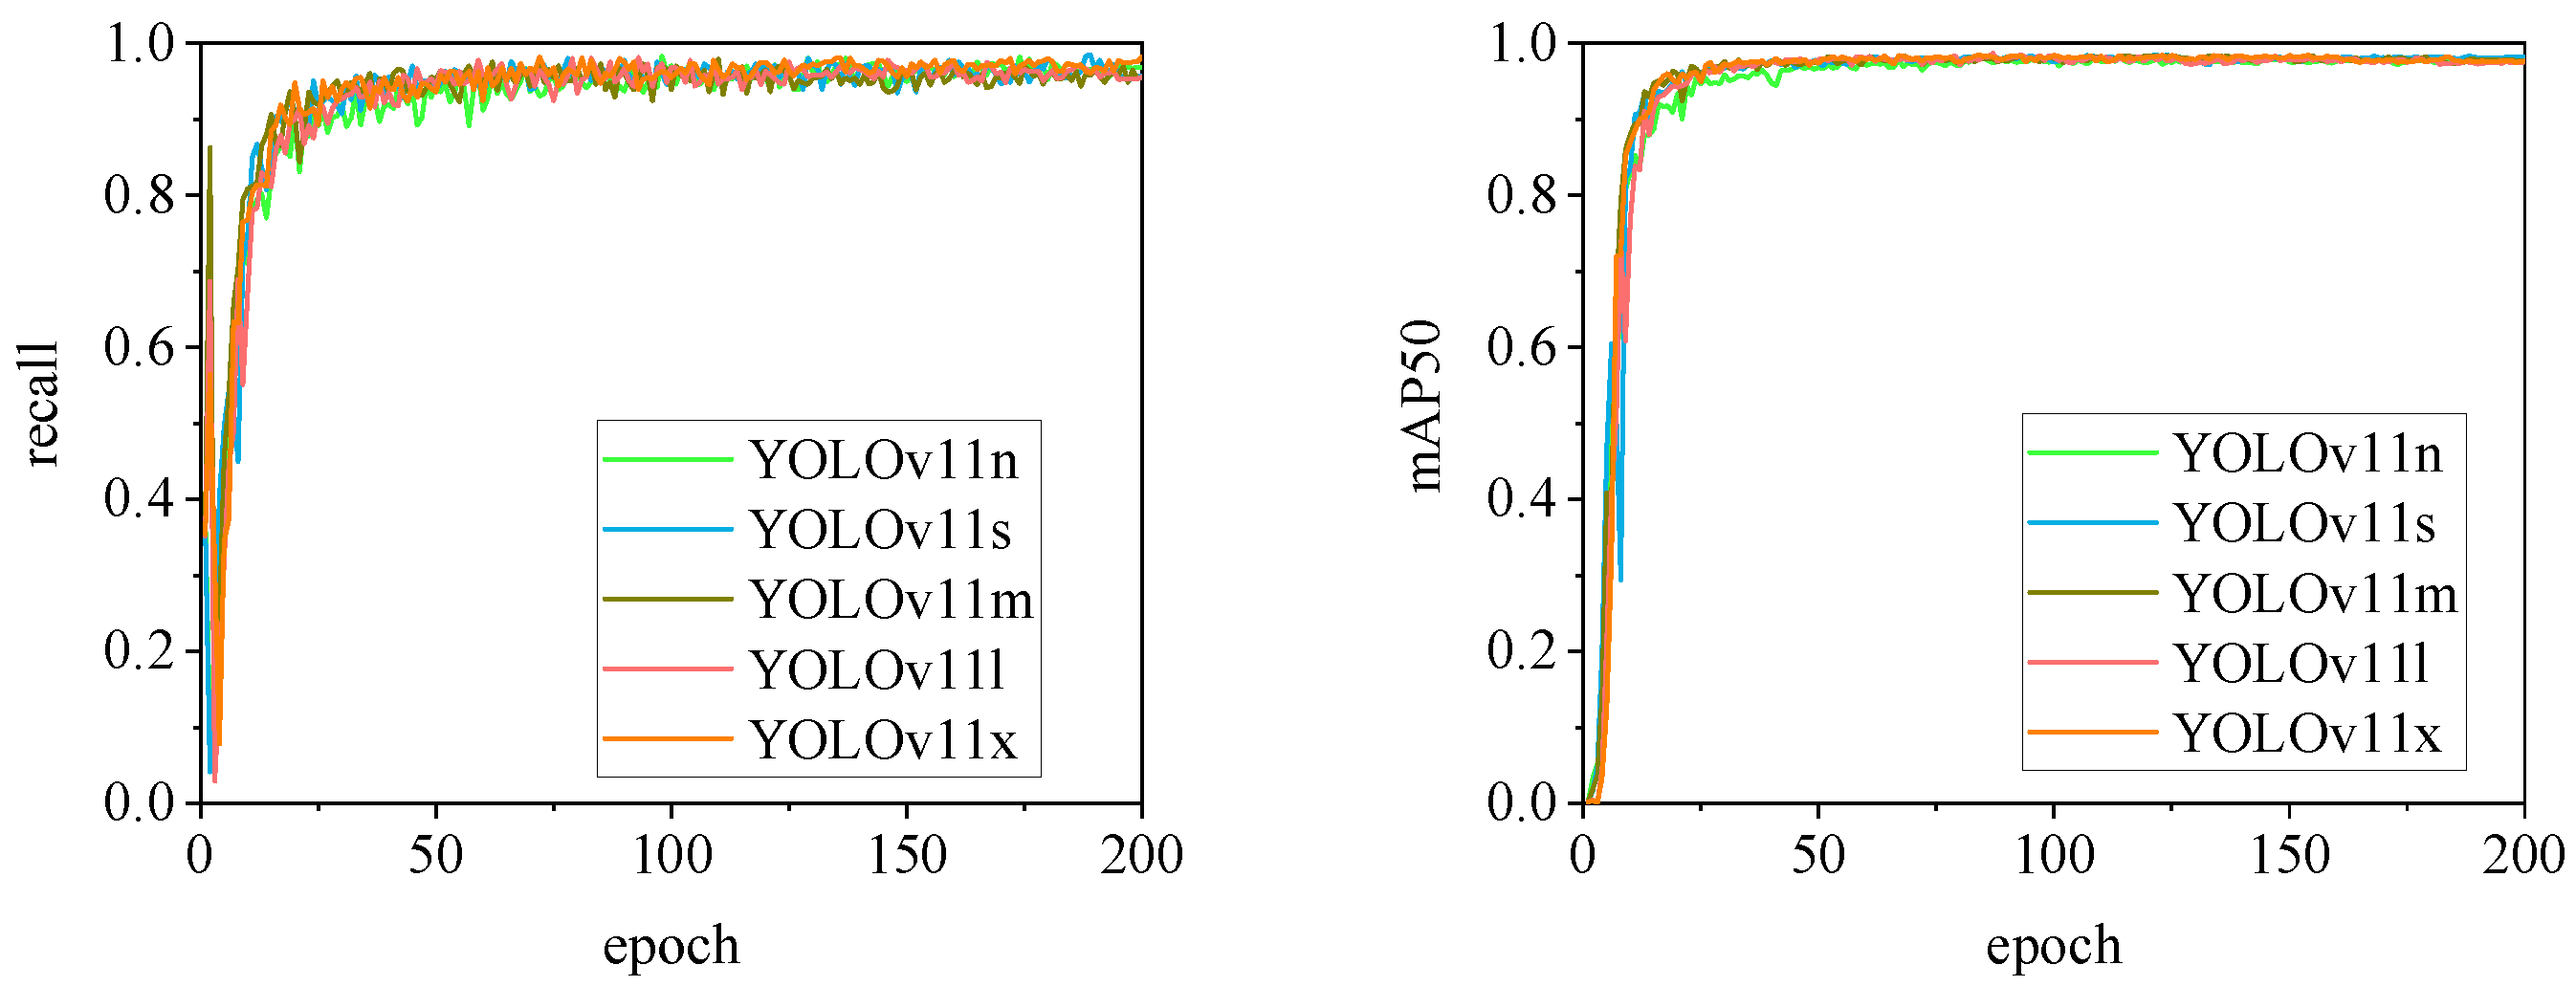
In contrast, all models, excluding YOLOv7x and the YOLOv6 series, demonstrate high recall rates and mAP50 values. Among all tested models, YOLOv11s achieves the highest recall rate at 98.5%, while YOLOv11l records the highest mAP50 at 98.7%. YOLOv9m also performs well, with a recall rate of 98.1% and a mAP50 of 98.6%, indicating superior overall performance. The TIRPigEar dataset exhibits high accuracy across most object detection models, showcasing strong capabilities in recognizing pig ear targets. Overall, the TIRPigEar dataset is of high quality and is adaptable to various object detection algorithms.
Figure 15.
Recall and mAP50 variation curves for the YOLOv5 series models.
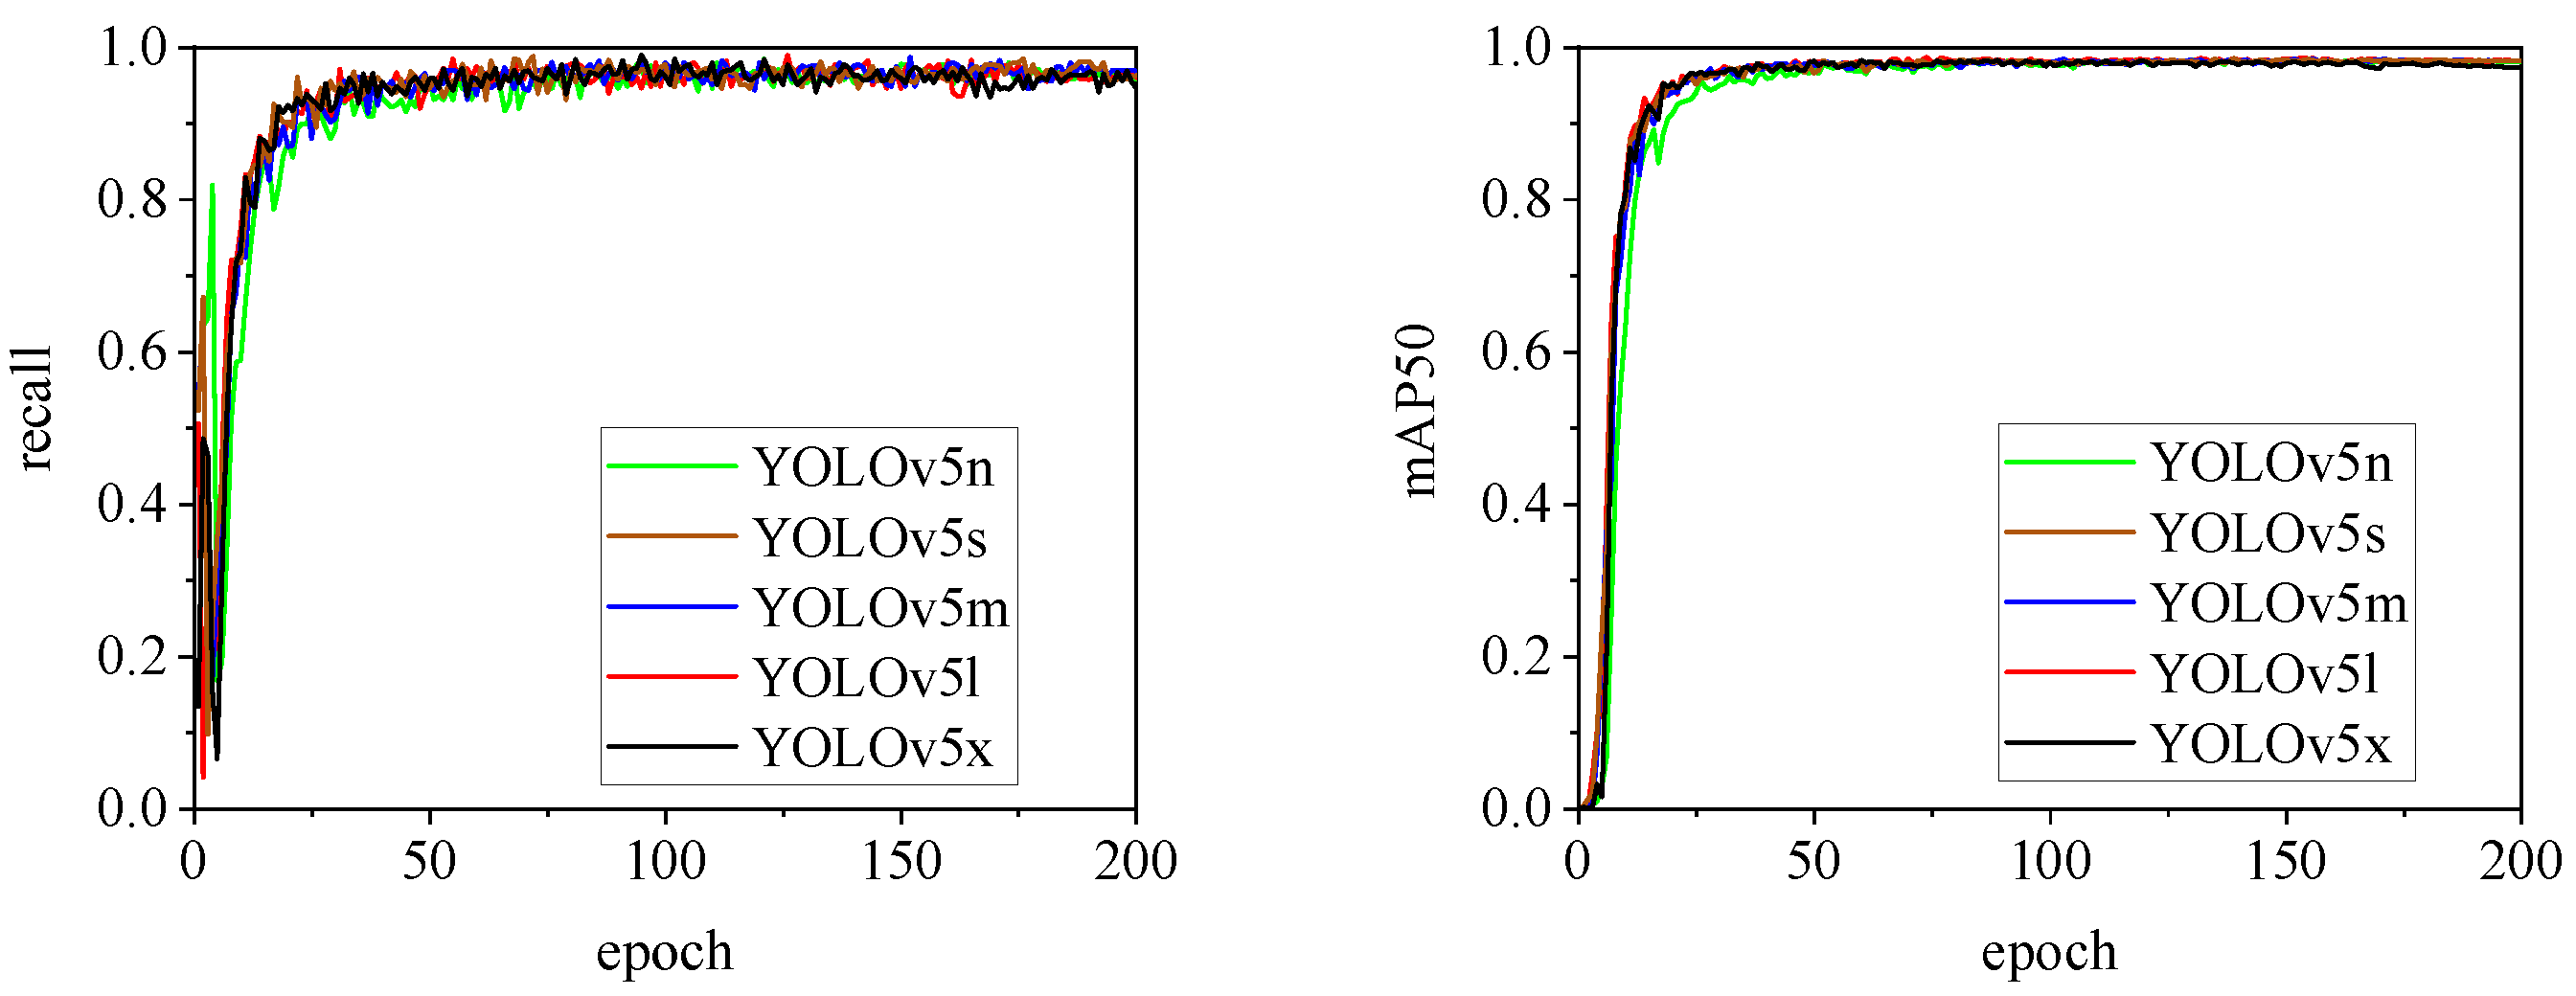
Figure 16.
Recall and mAP50 variation curves for the YOLOv6 series models.
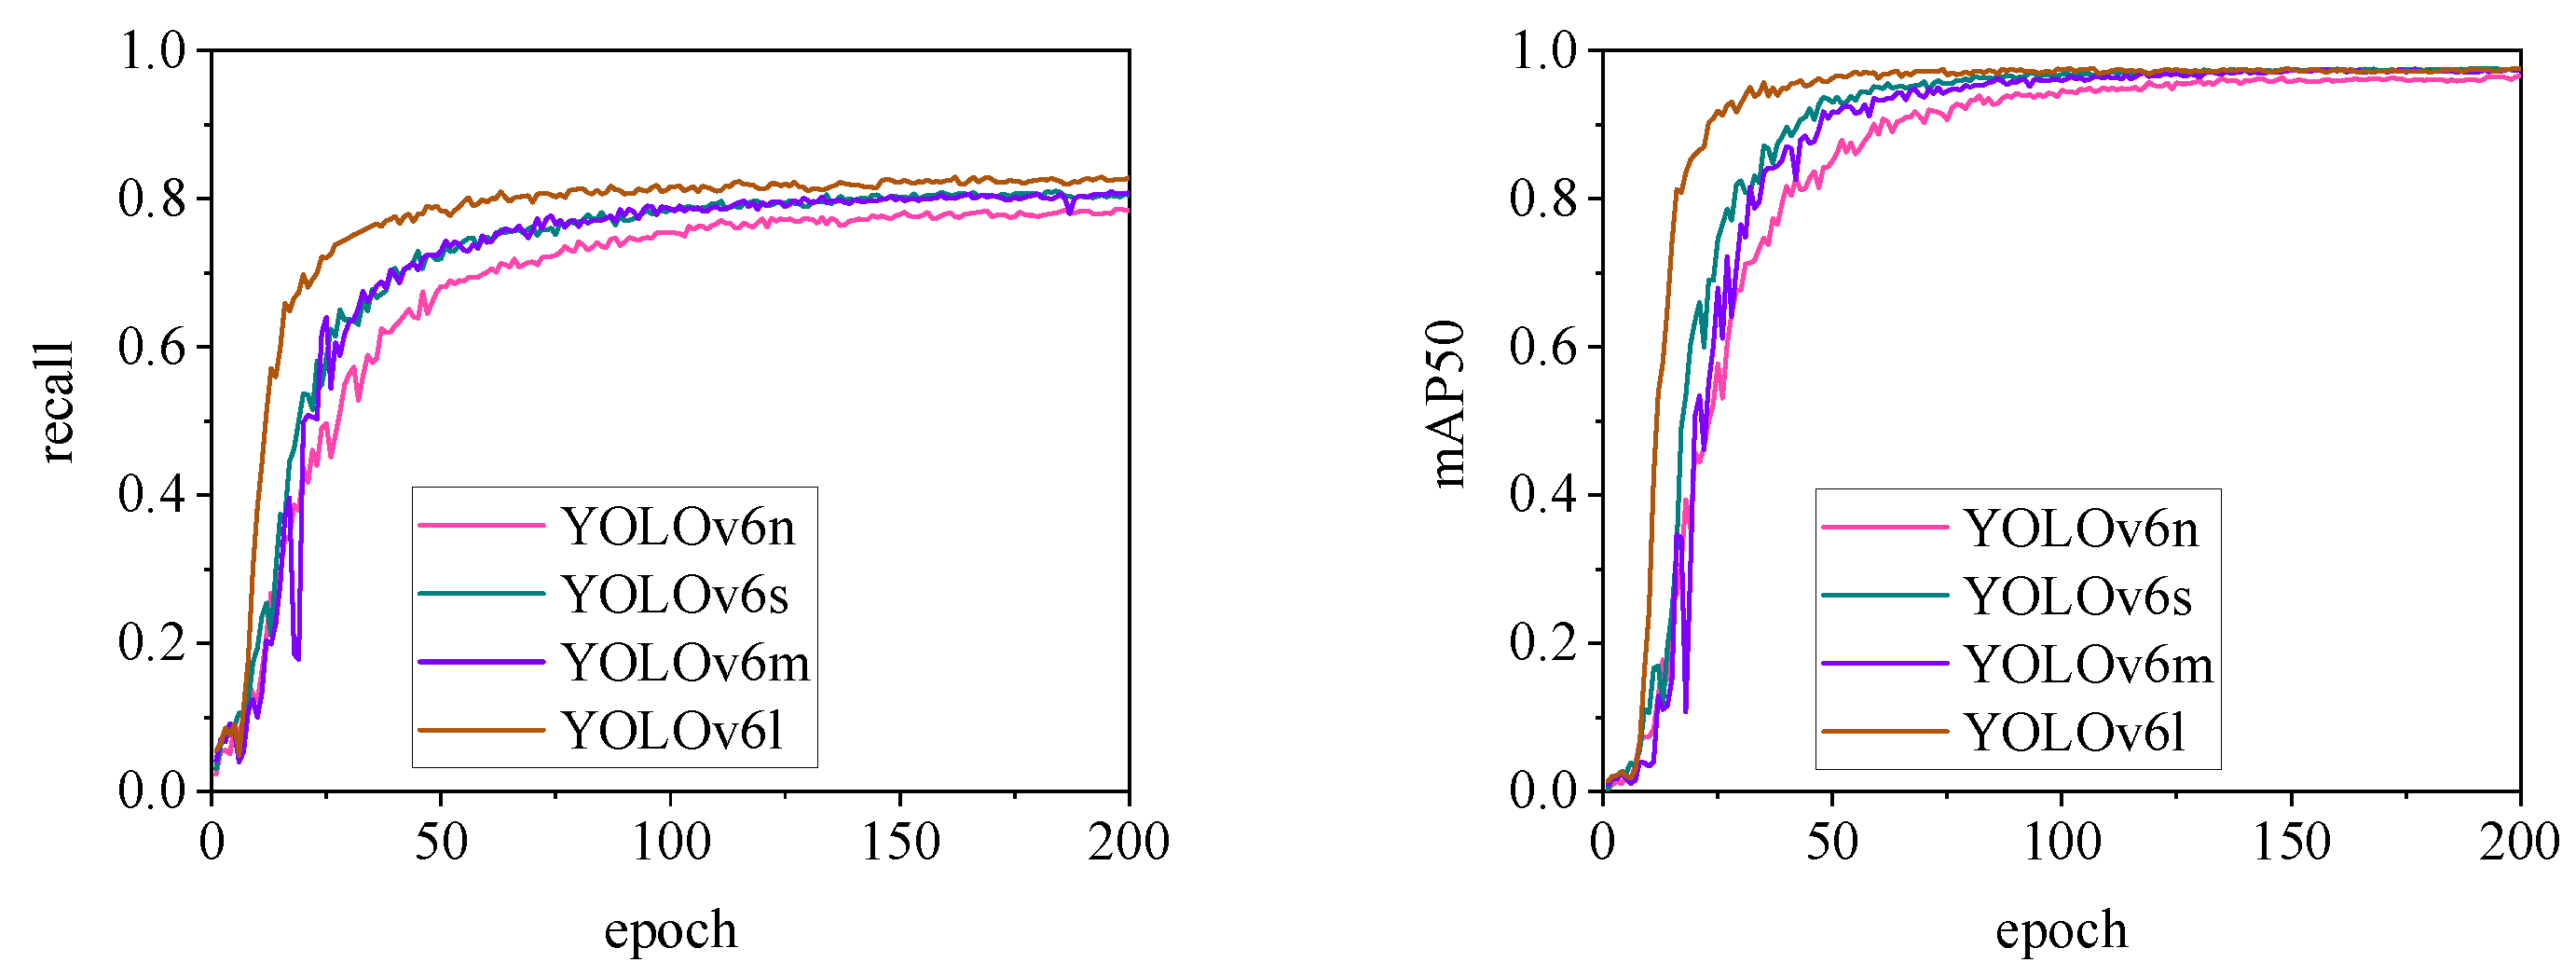
Figure 17.
Recall and mAP50 variation curves for the YOLOv7 series models.
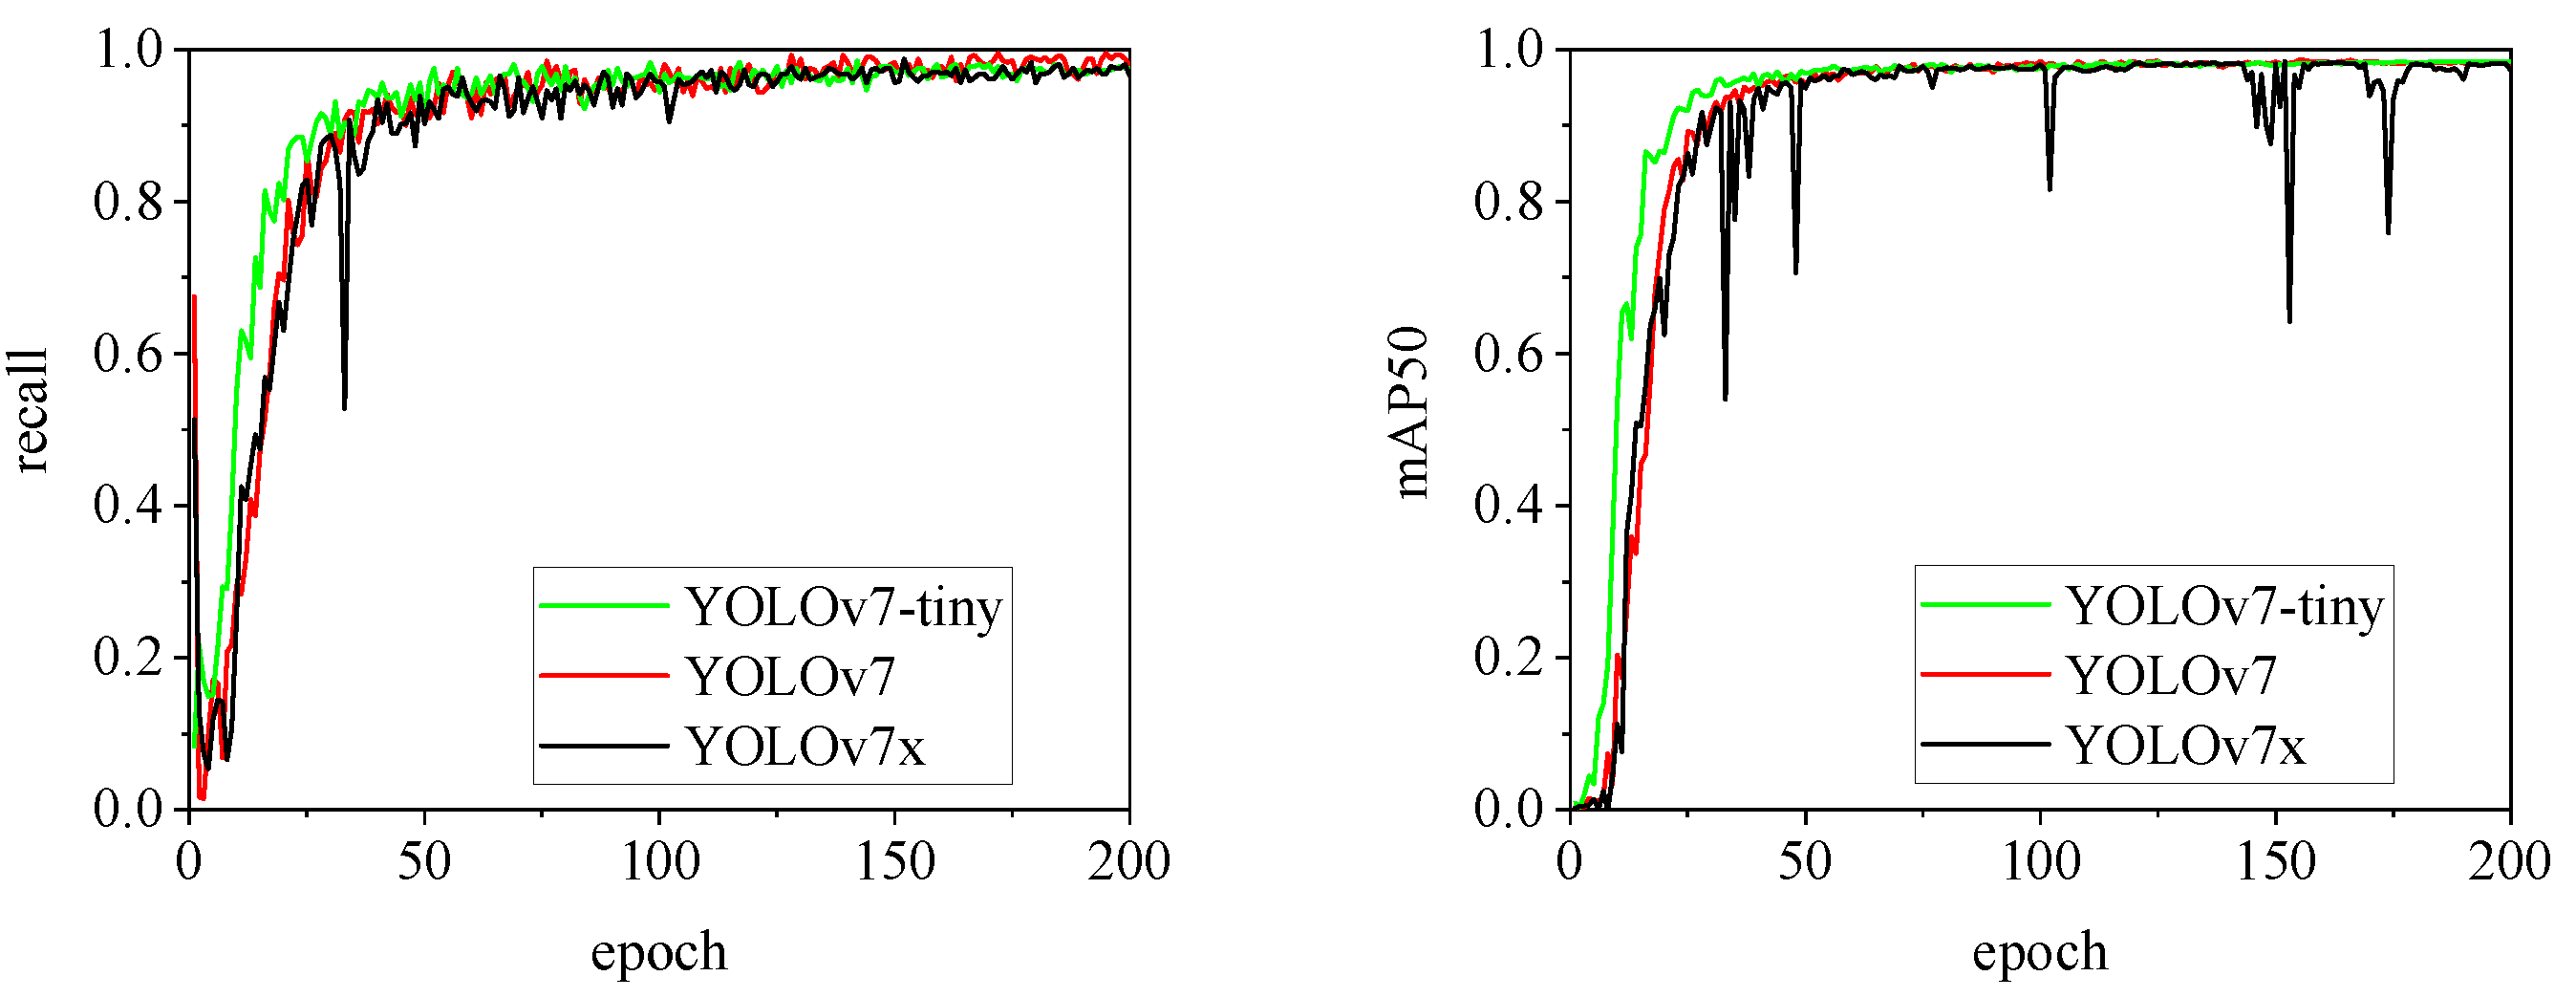
Figure 18.
Recall and mAP50 variation curves for the YOLOv8 series models.
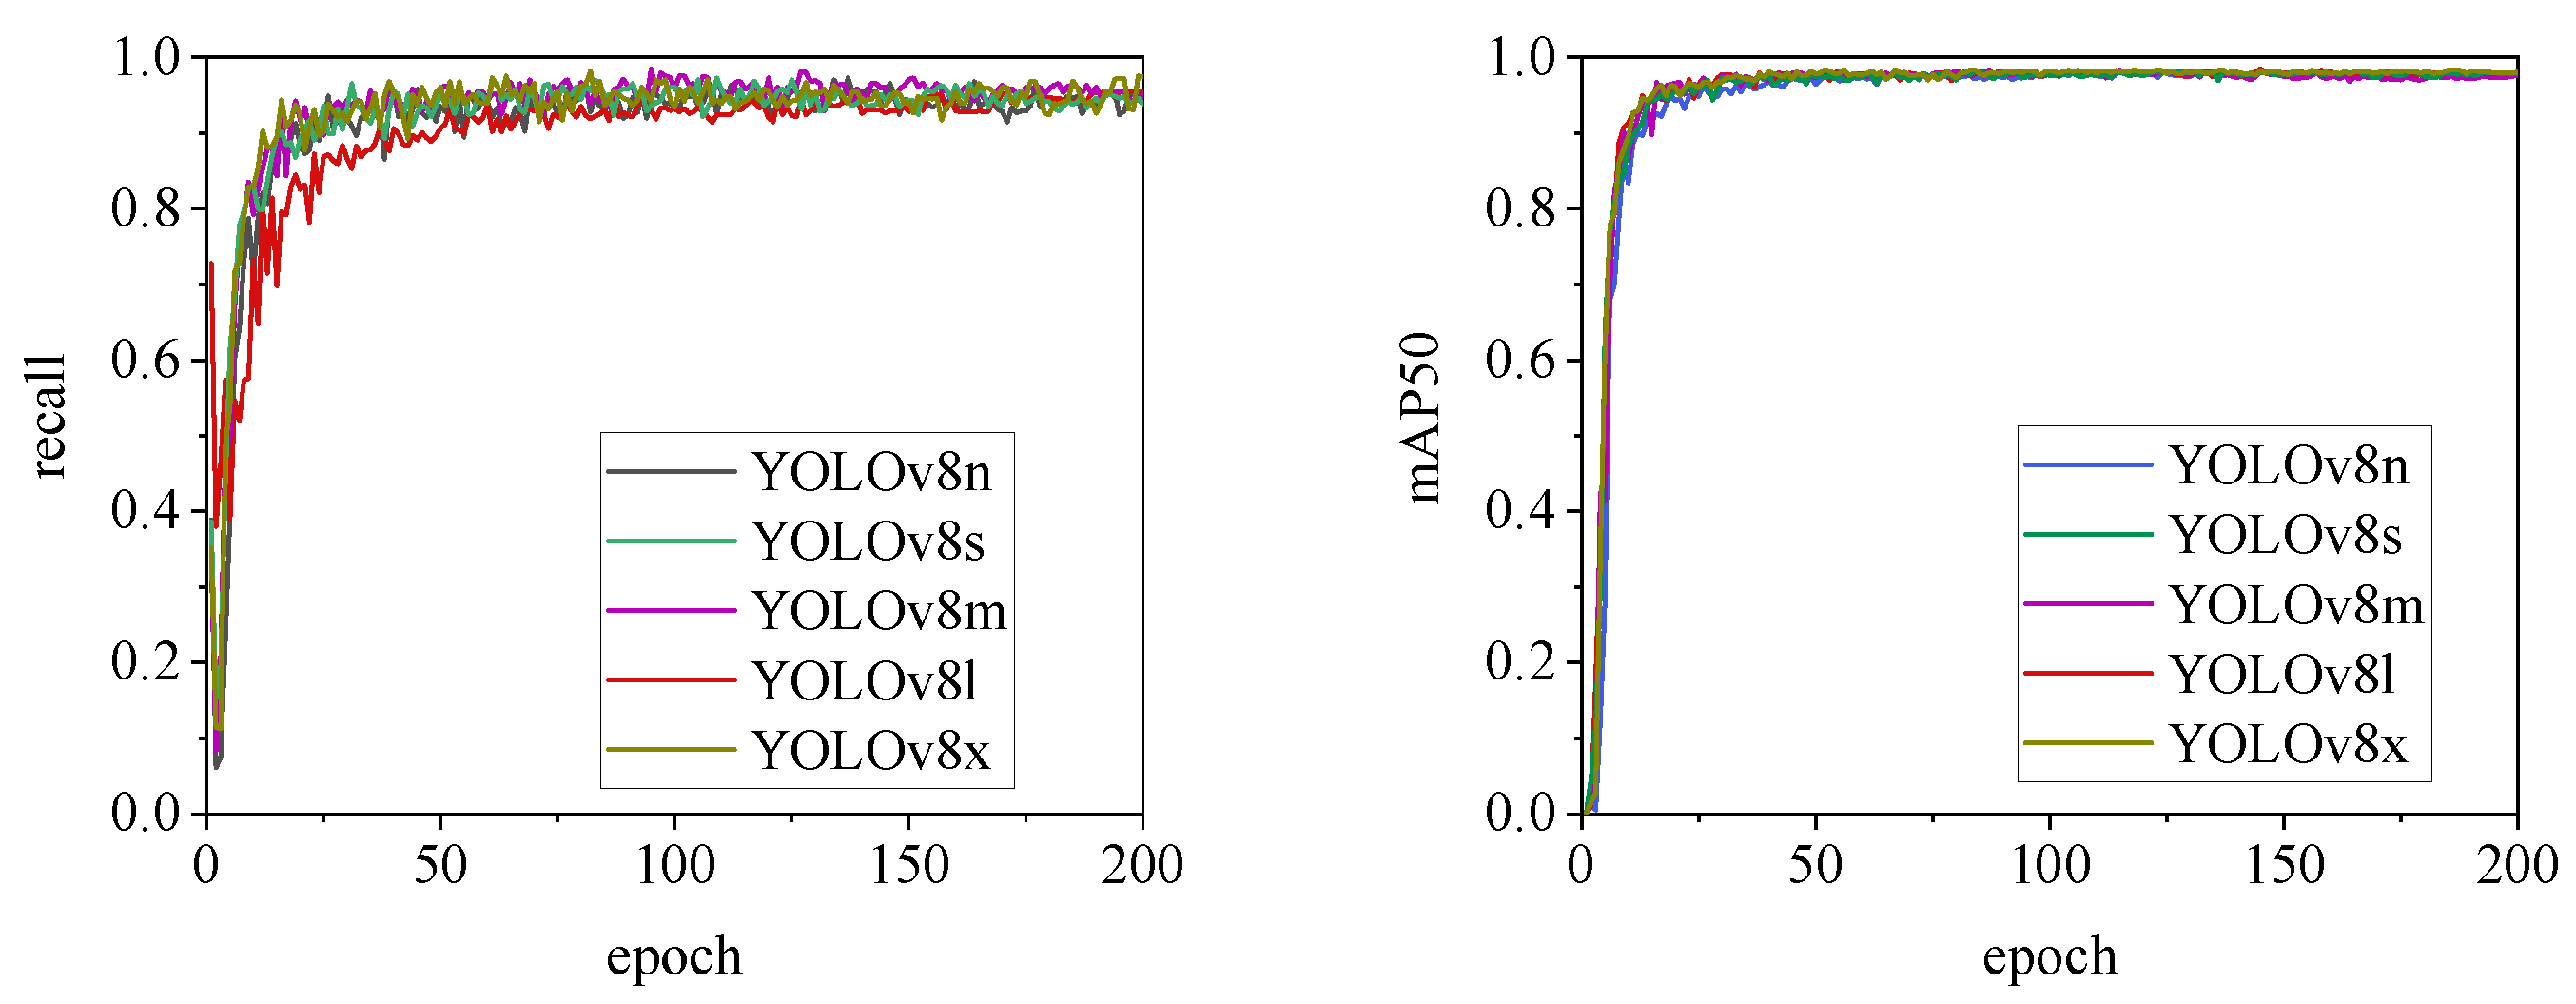
Figure 19.
Recall and mAP50 variation curves for the RTDETR series models.
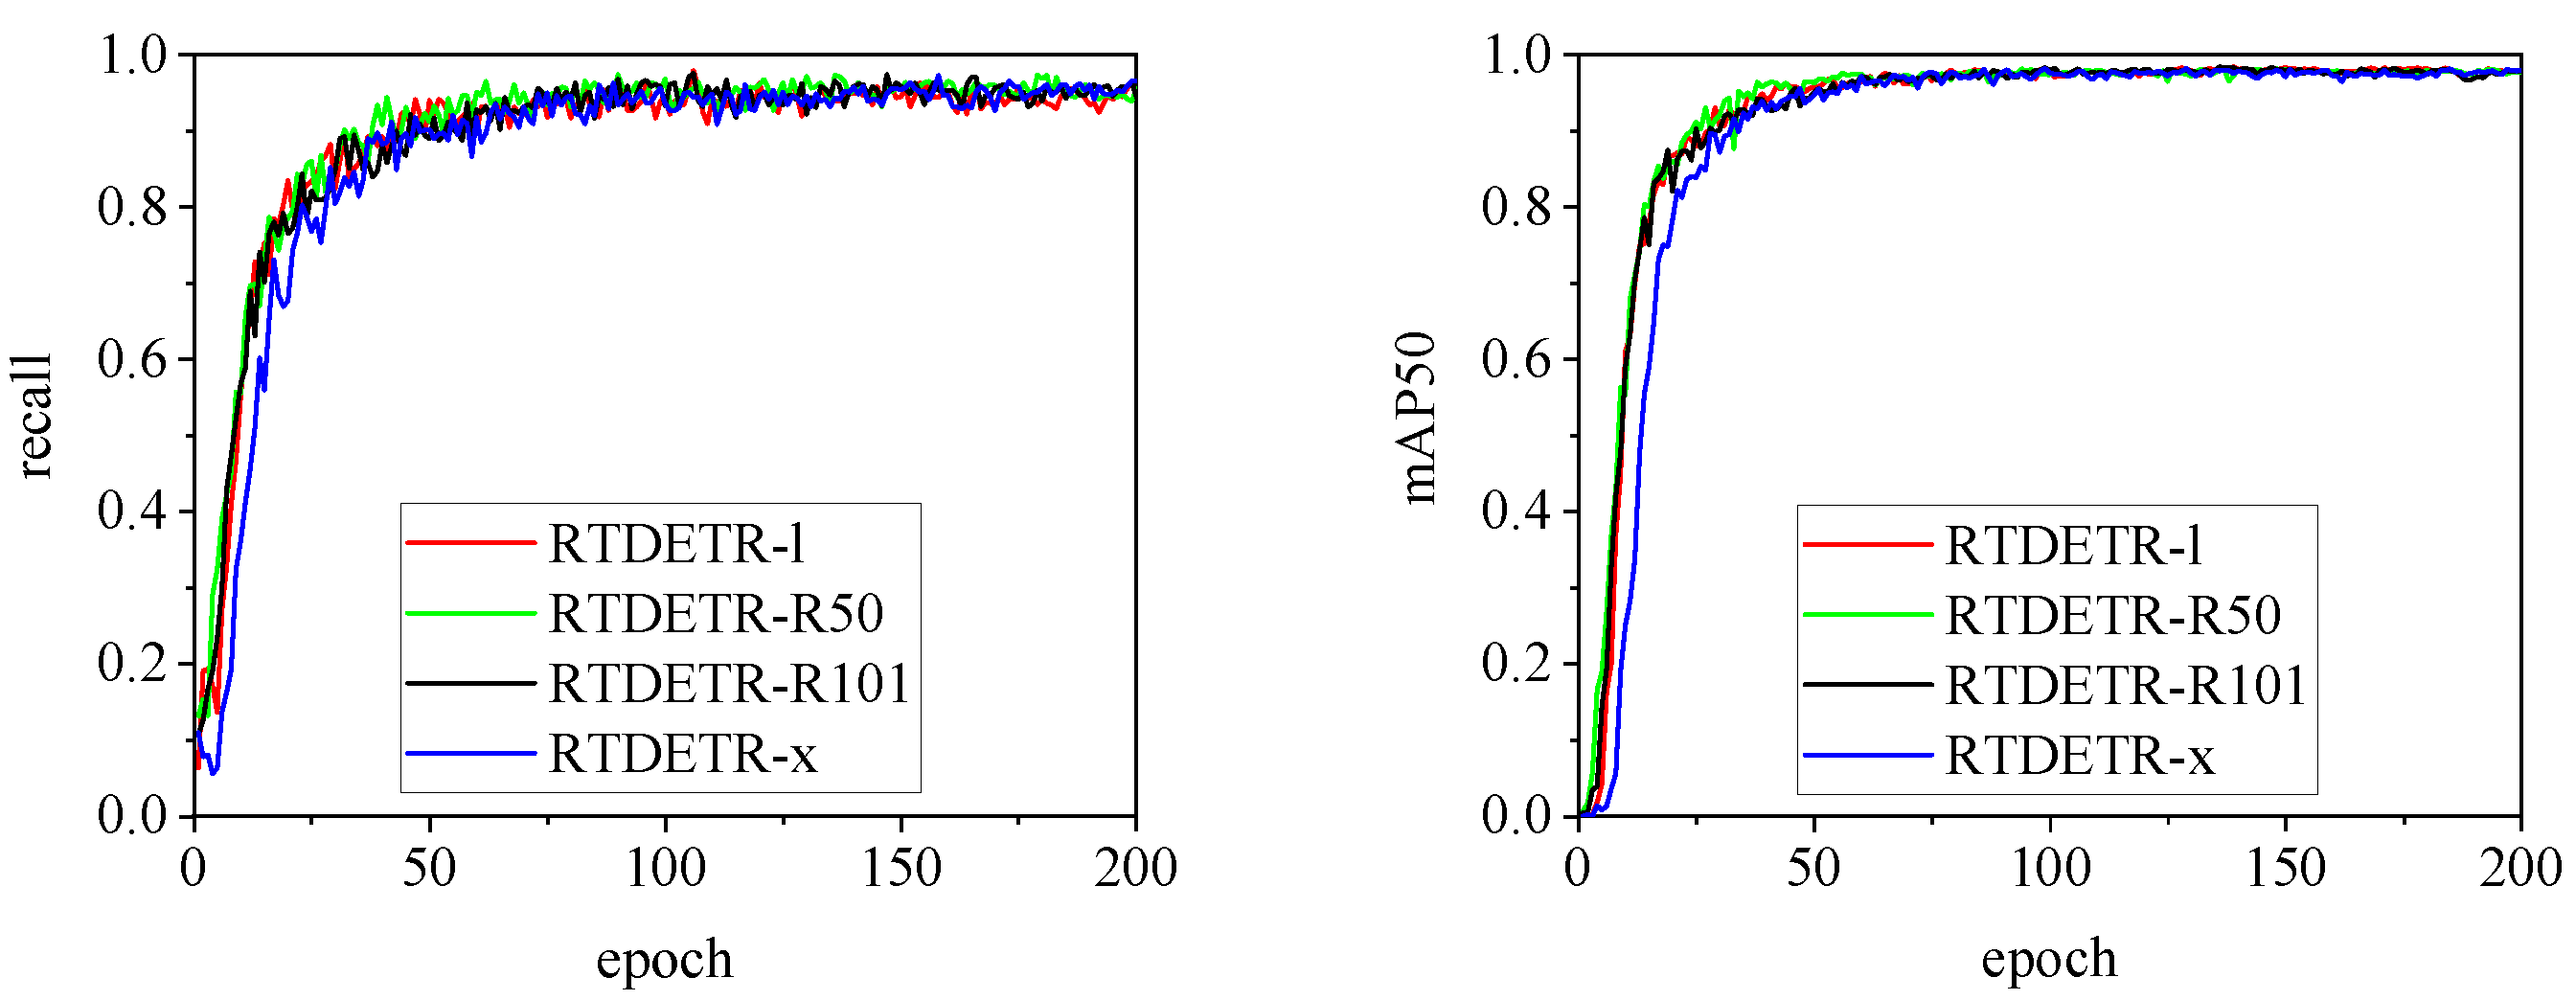
Figure 20.
Recall and mAP50 variation curves for the YOLOv9 series models.
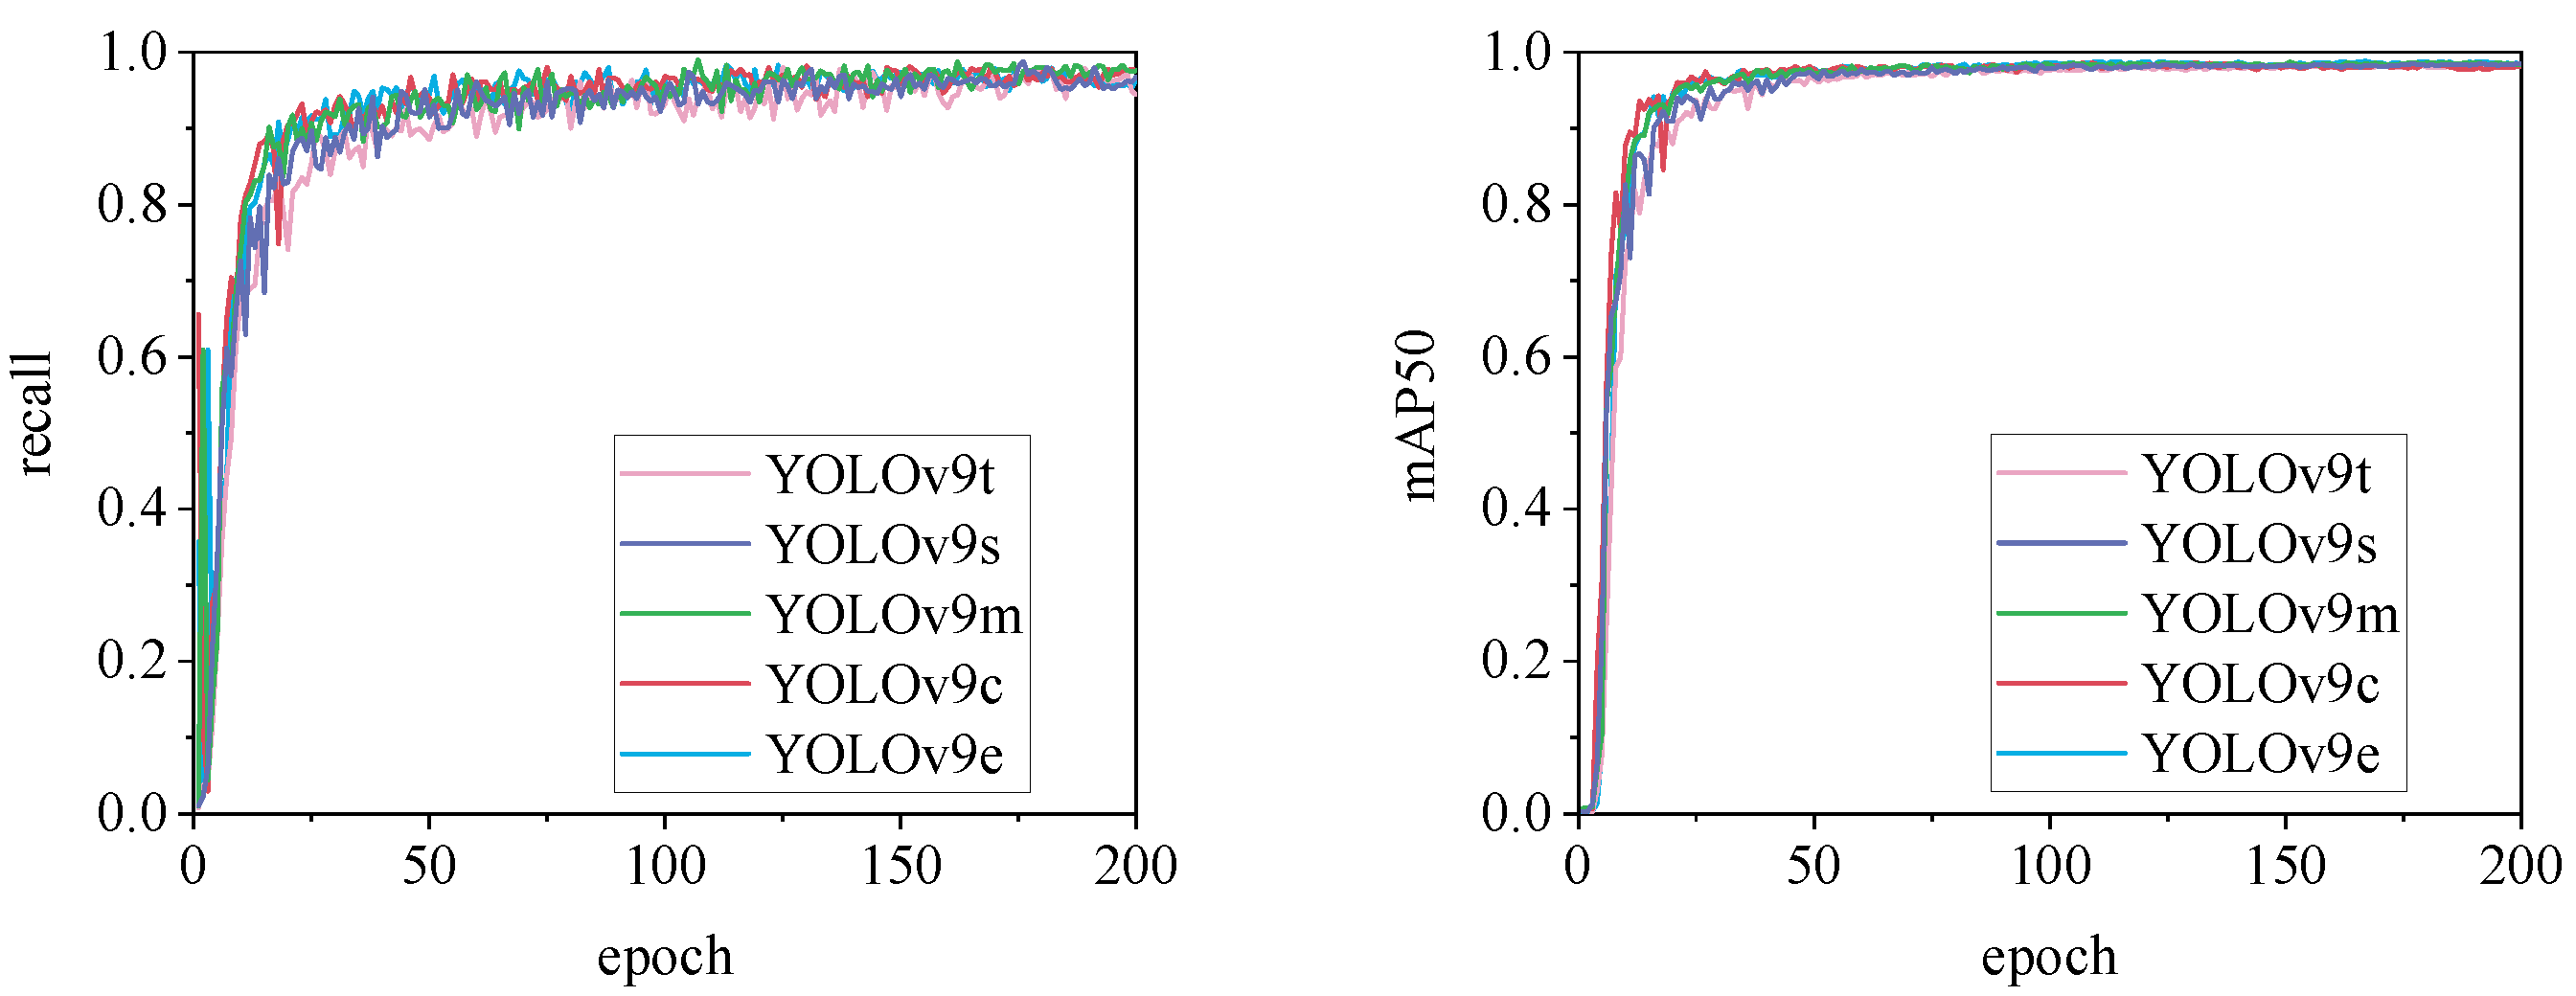
Figure 21.
Recall and mAP50 variation curves for the YOLOv10 series models.
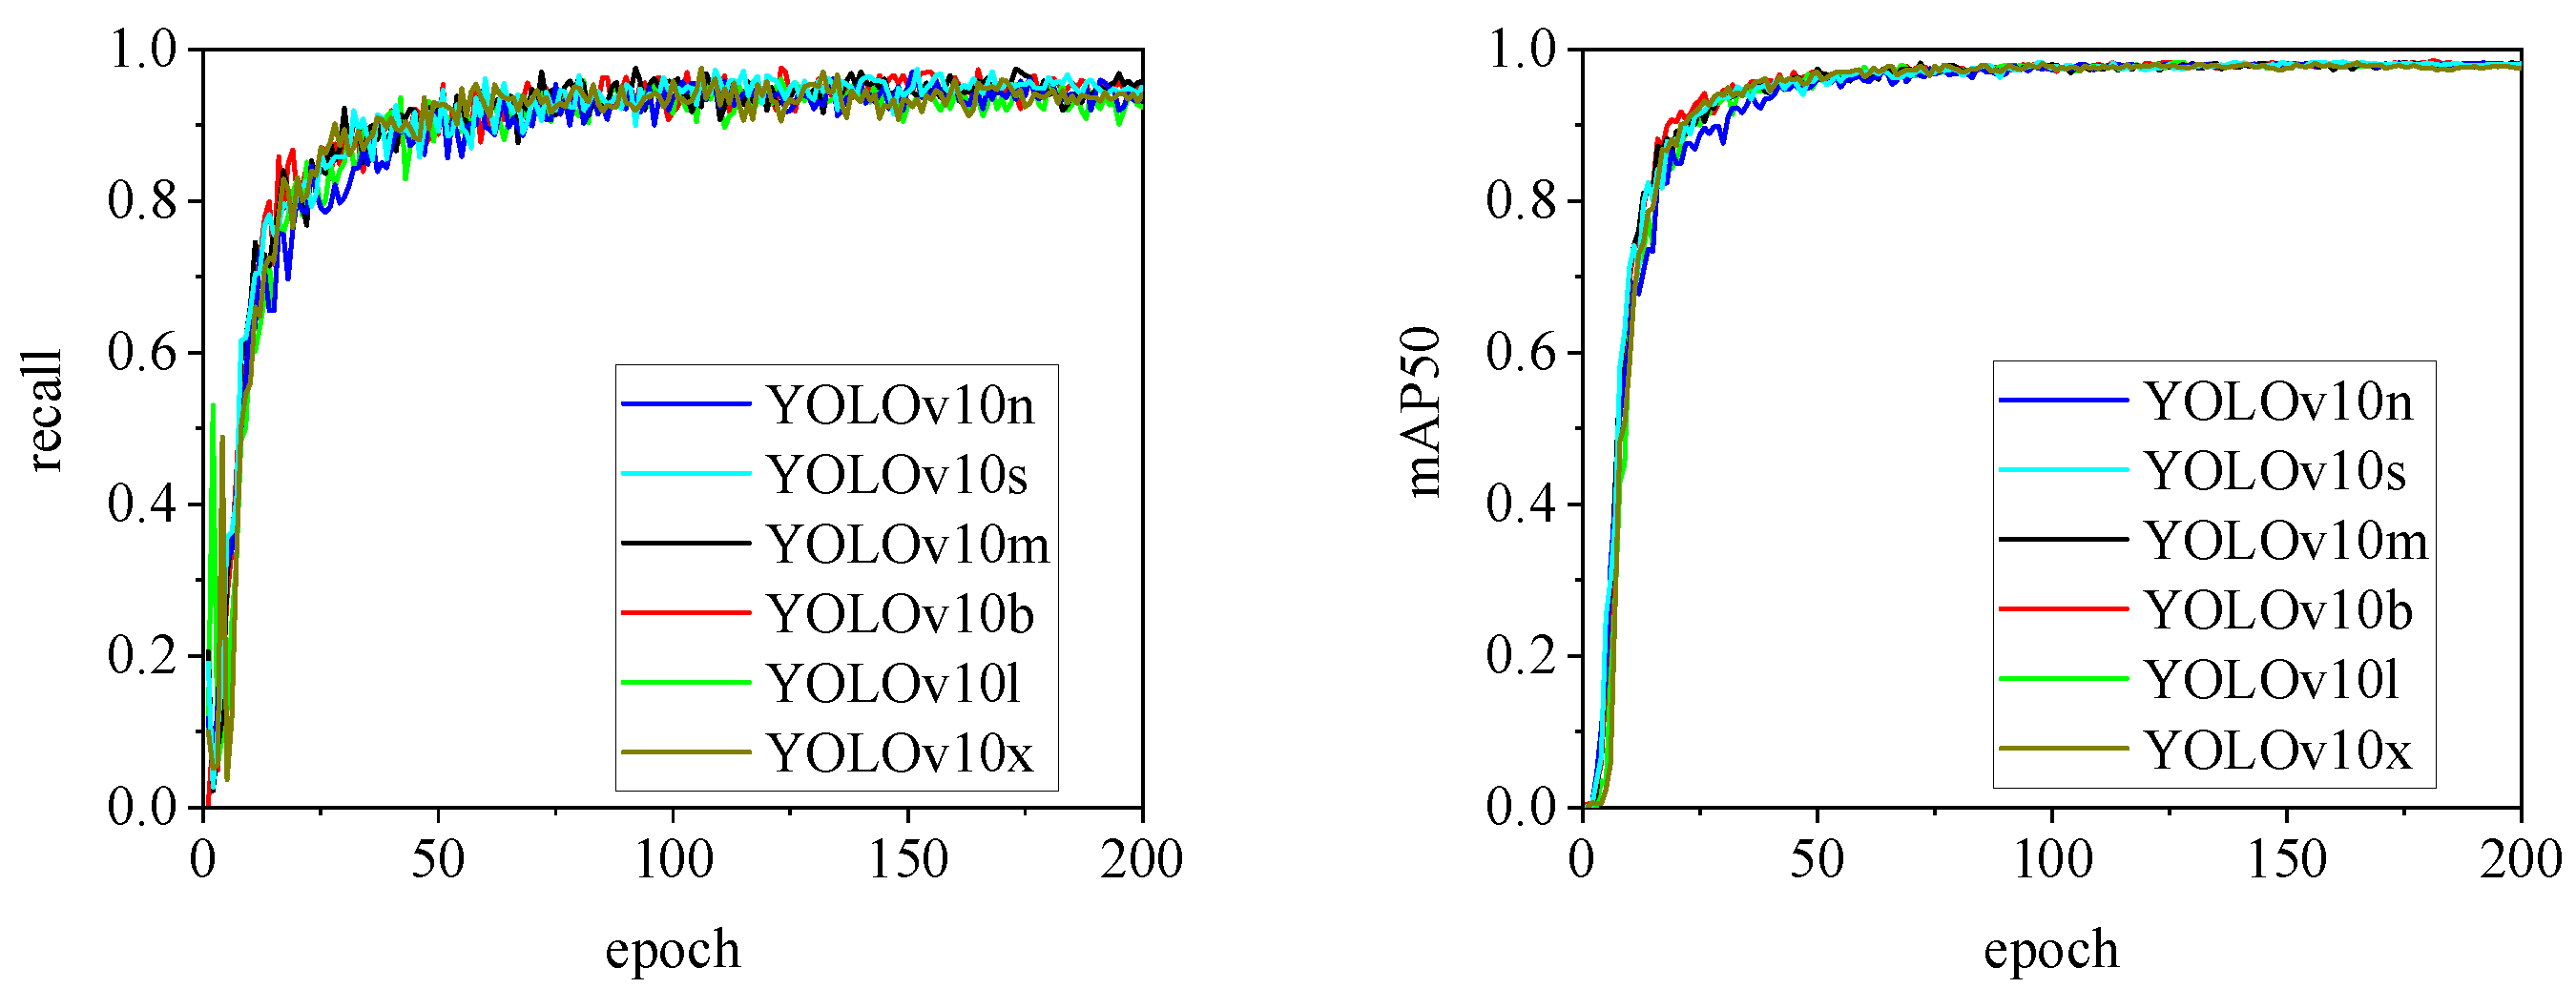
Figure 22.
Recall and mAP50 variation curves for the YOLOv11 series models.
3.2. Visualization Analysis of Pig Ear Detection
To address the interpretability limitations of deep learning algorithms, we performed visualization analysis on inference results of various infrared pig ear detection models using the test dataset. Figure 23 to Figure 30 show the performance of different target detection algorithms on infrared images of pig ears, with results examined under medium, close, and long-range image conditions.
Figure 23.
Pig ear detection results of the YOLOv5 series algorithms.
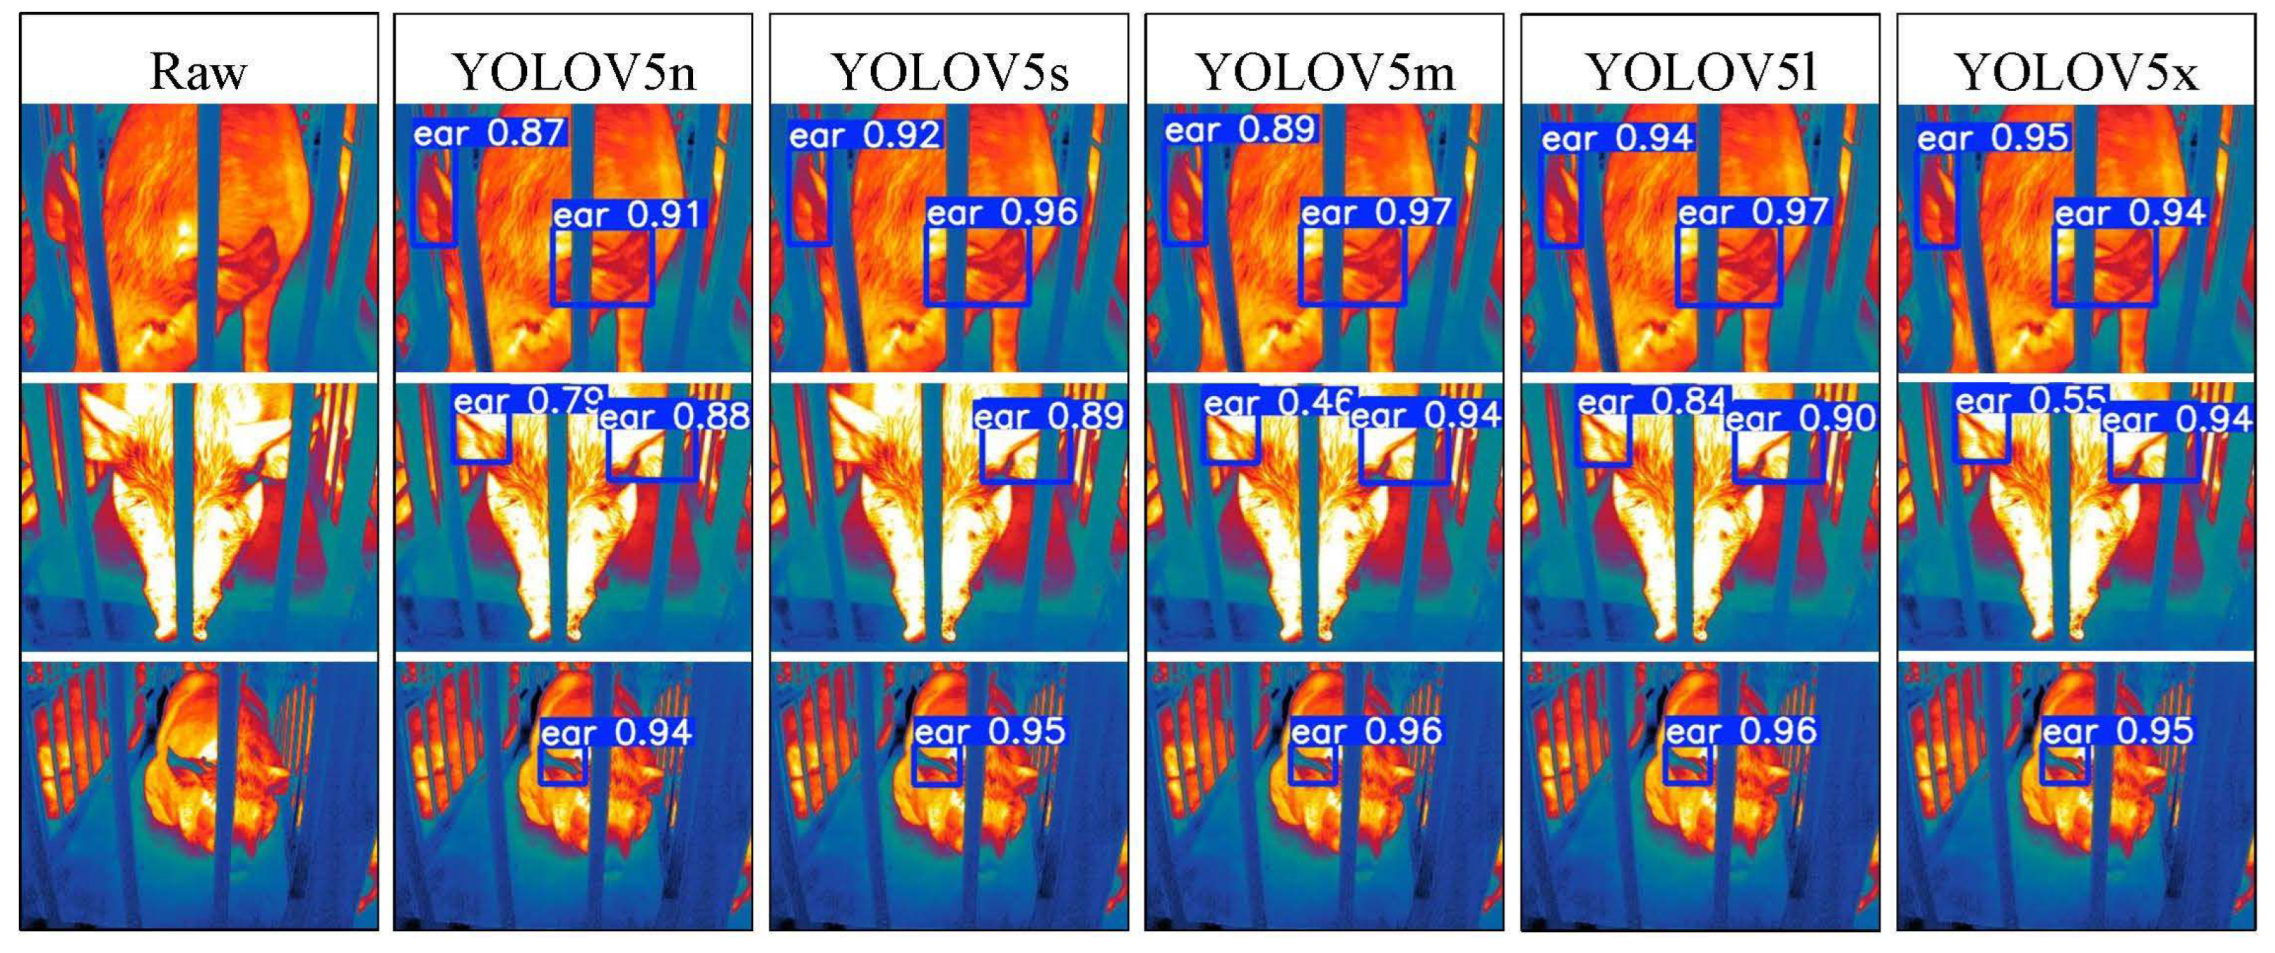
Figure 24.
Pig ear detection results of the YOLOv6 series algorithms.
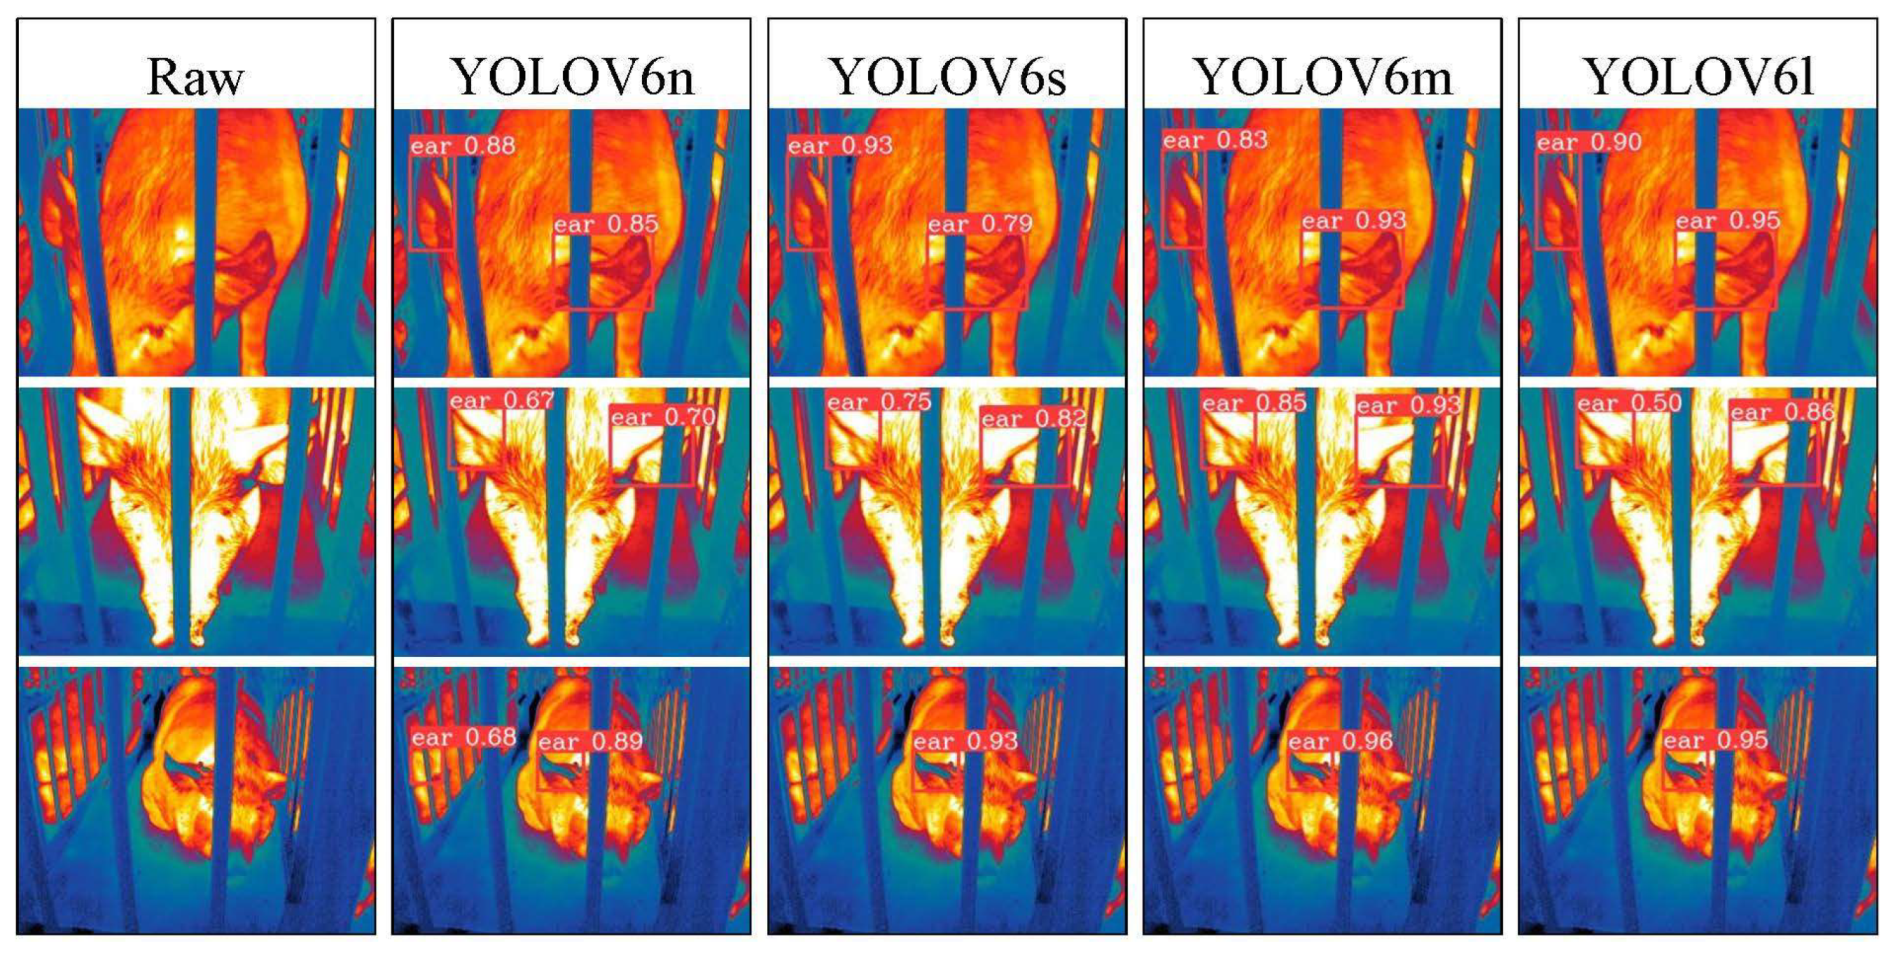
Figure 25.
Pig ear detection results of the YOLOv7 series algorithms.
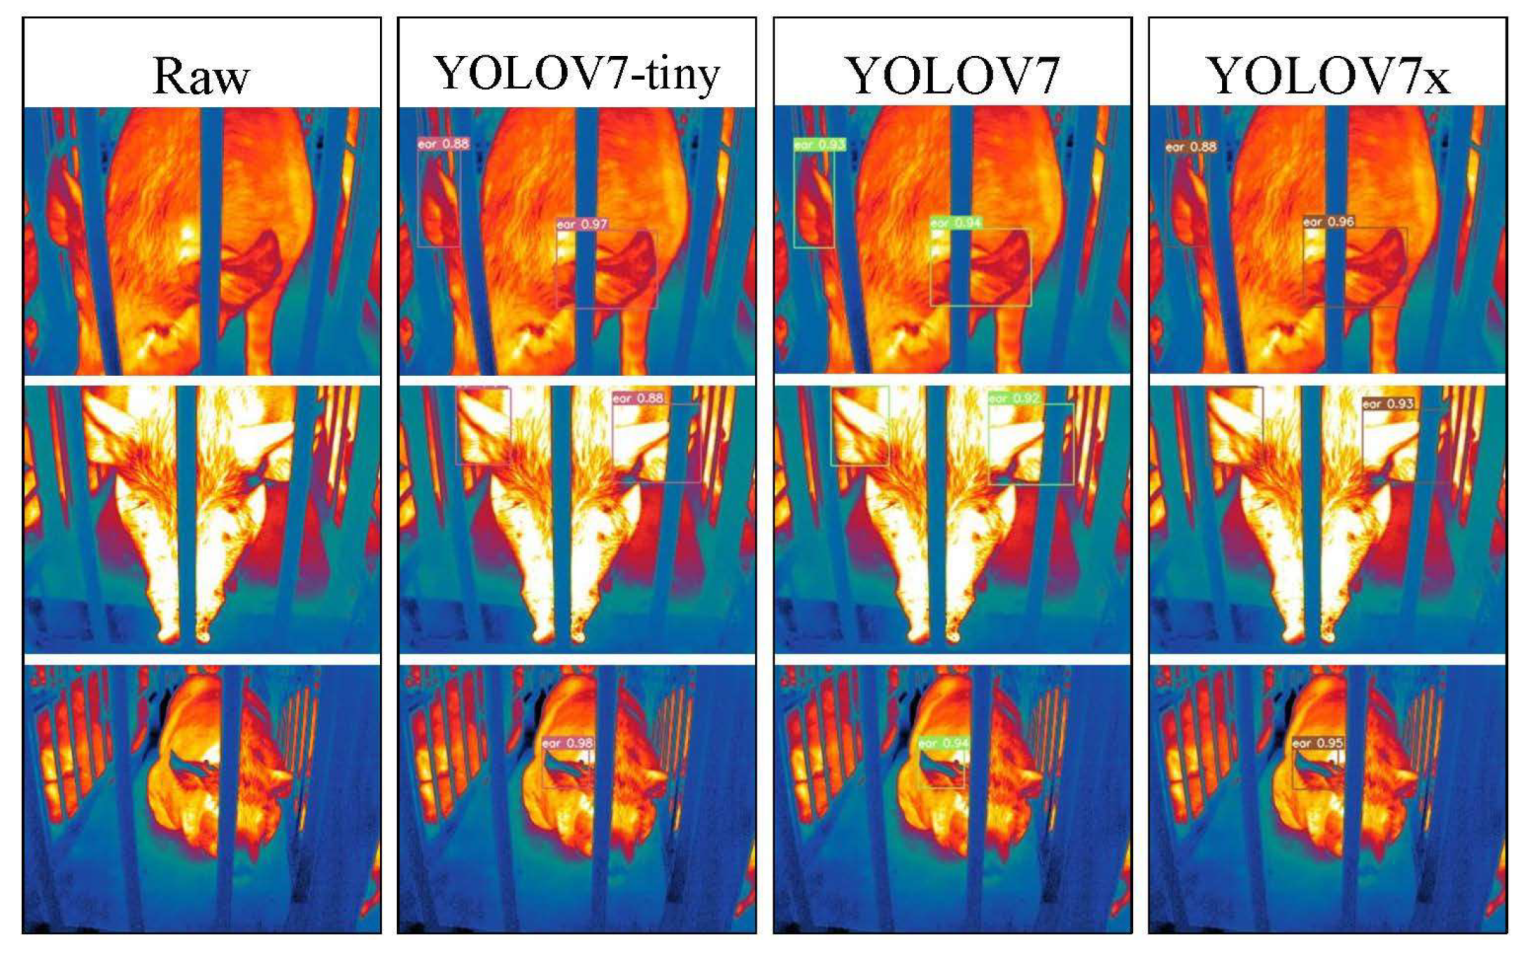
Figure 26.
Pig ear detection results of the YOLOv8 series algorithms.
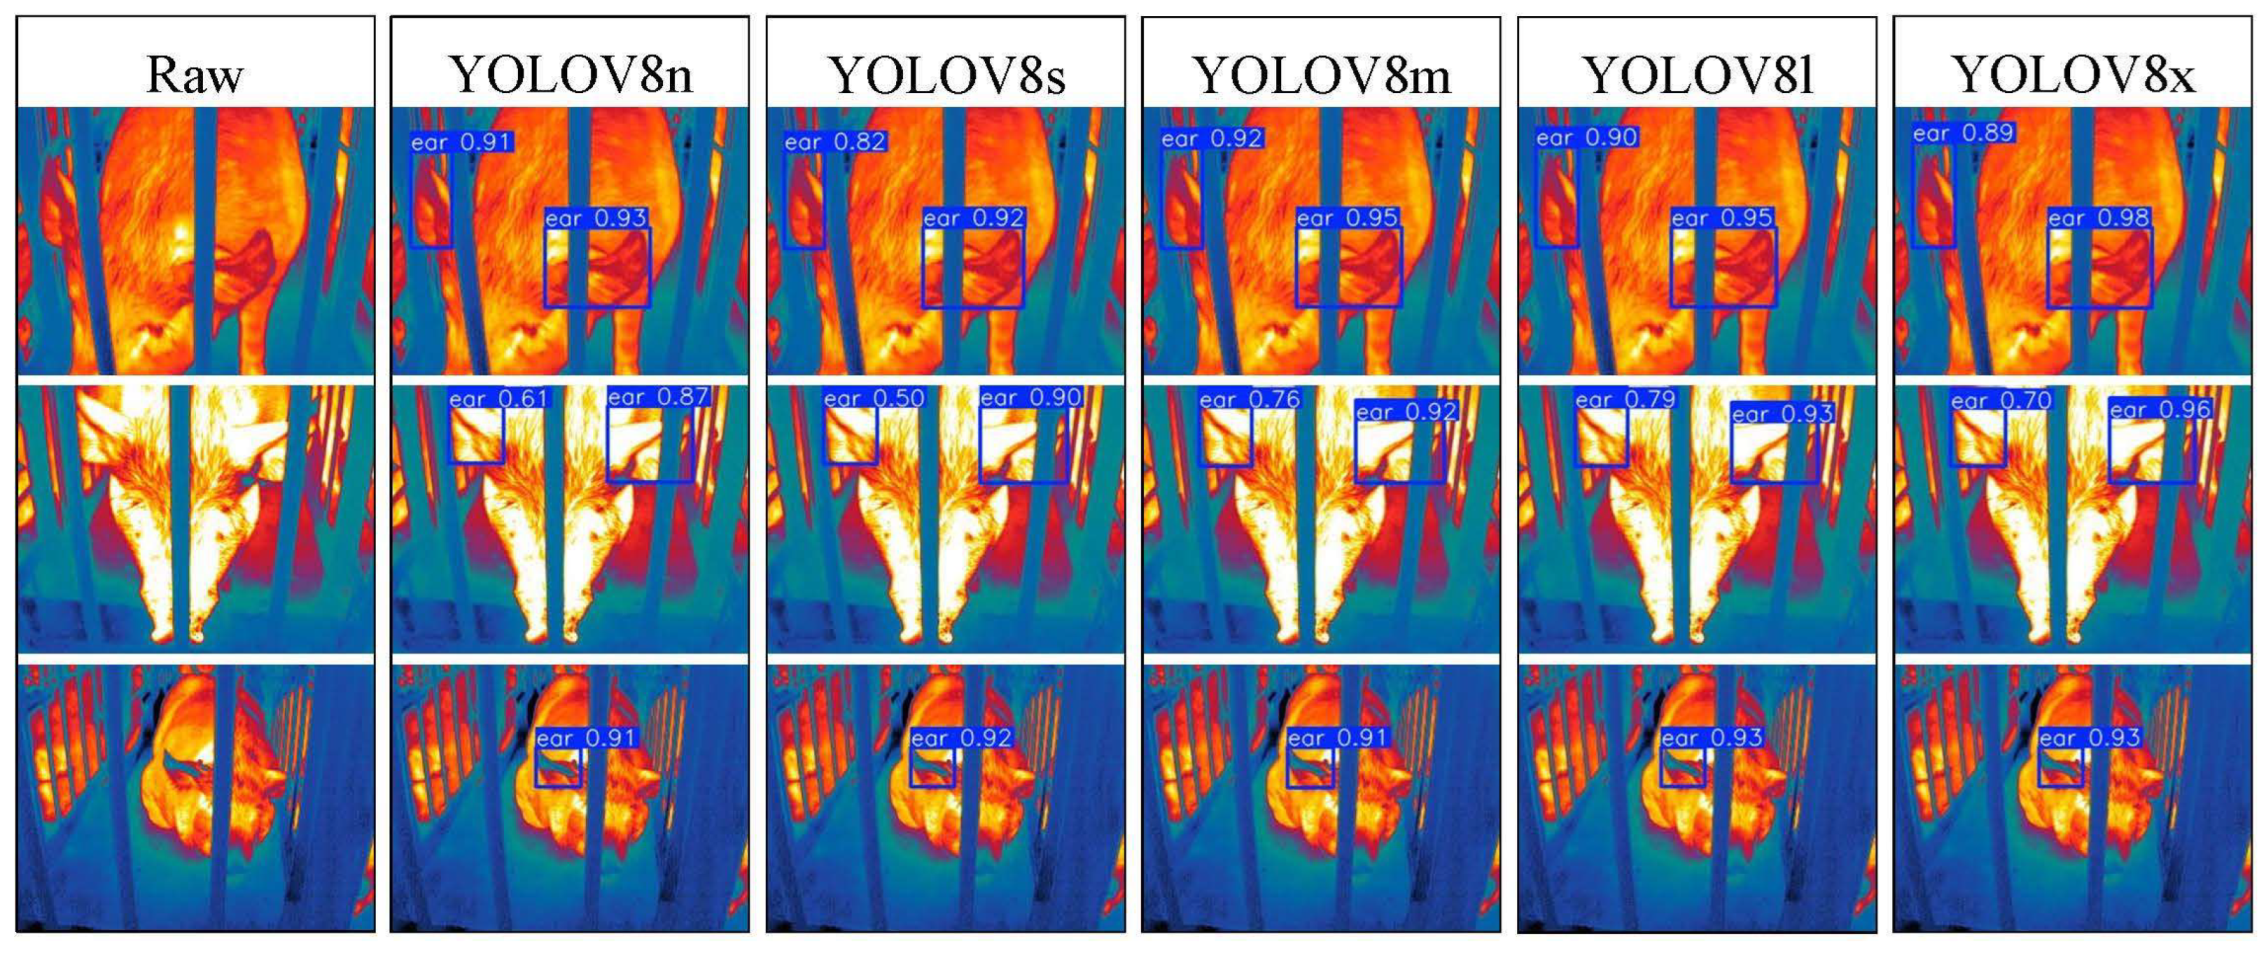
Figure 27.
Pig ear detection results of the RT-DETR series algorithms.
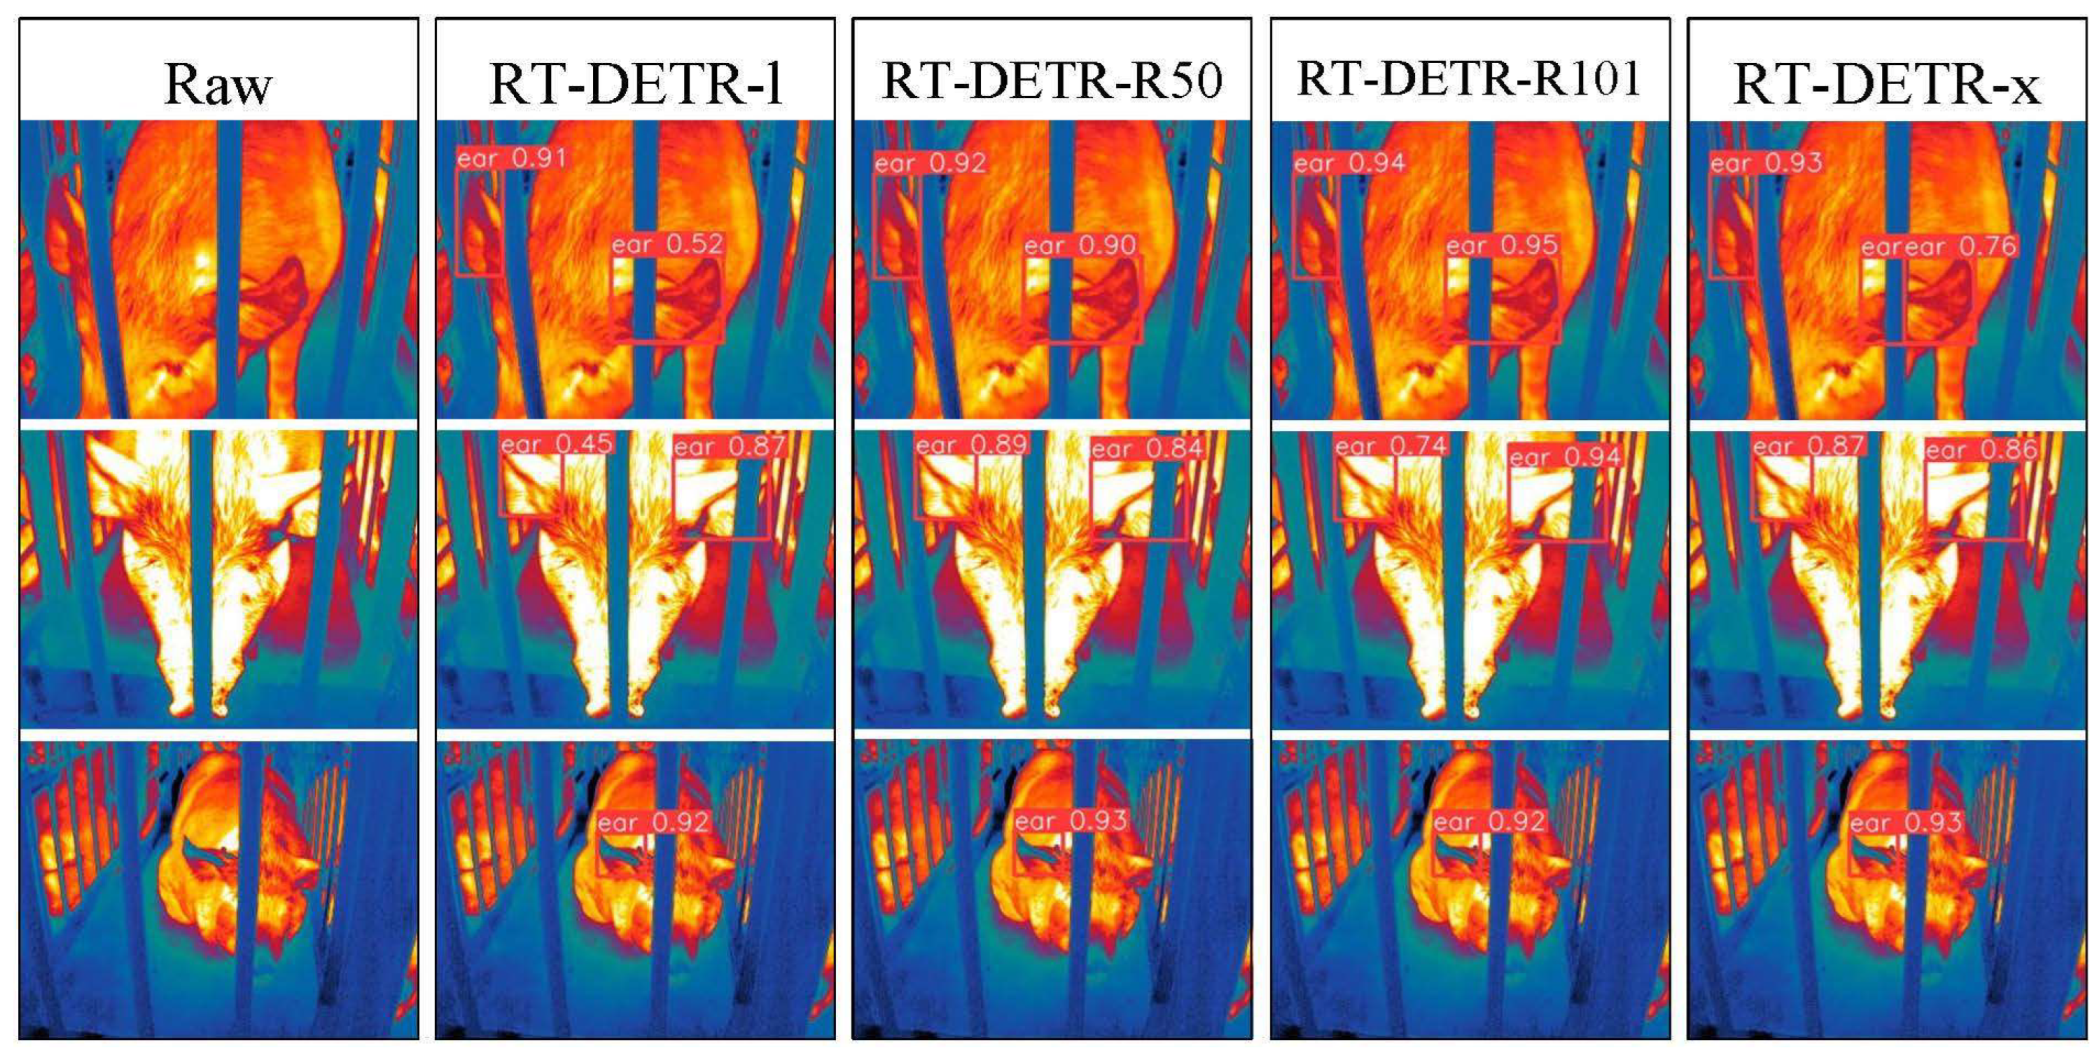
Figure 28.
Pig ear detection results of the YOLOv9 series algorithms.
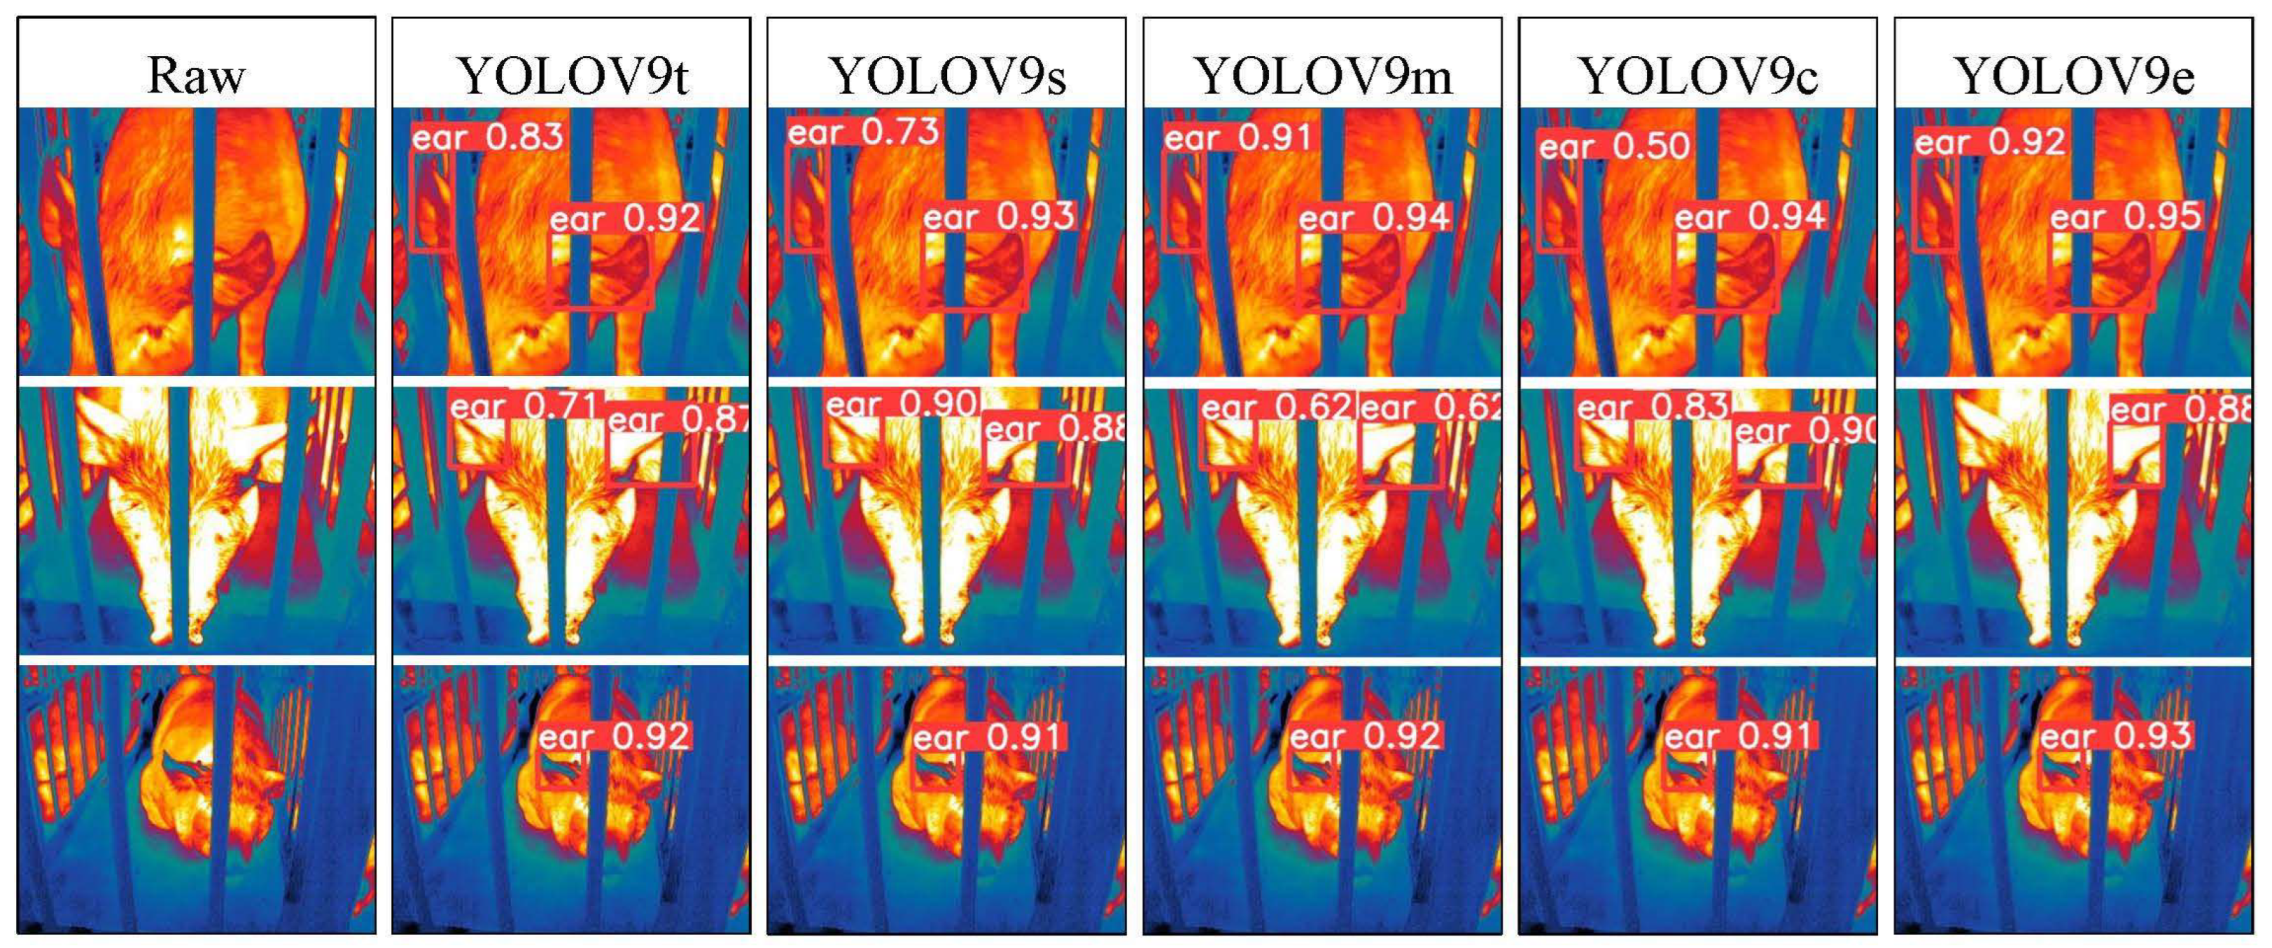
Figure 29.
Pig ear detection results of the YOLOv10 series algorithms.
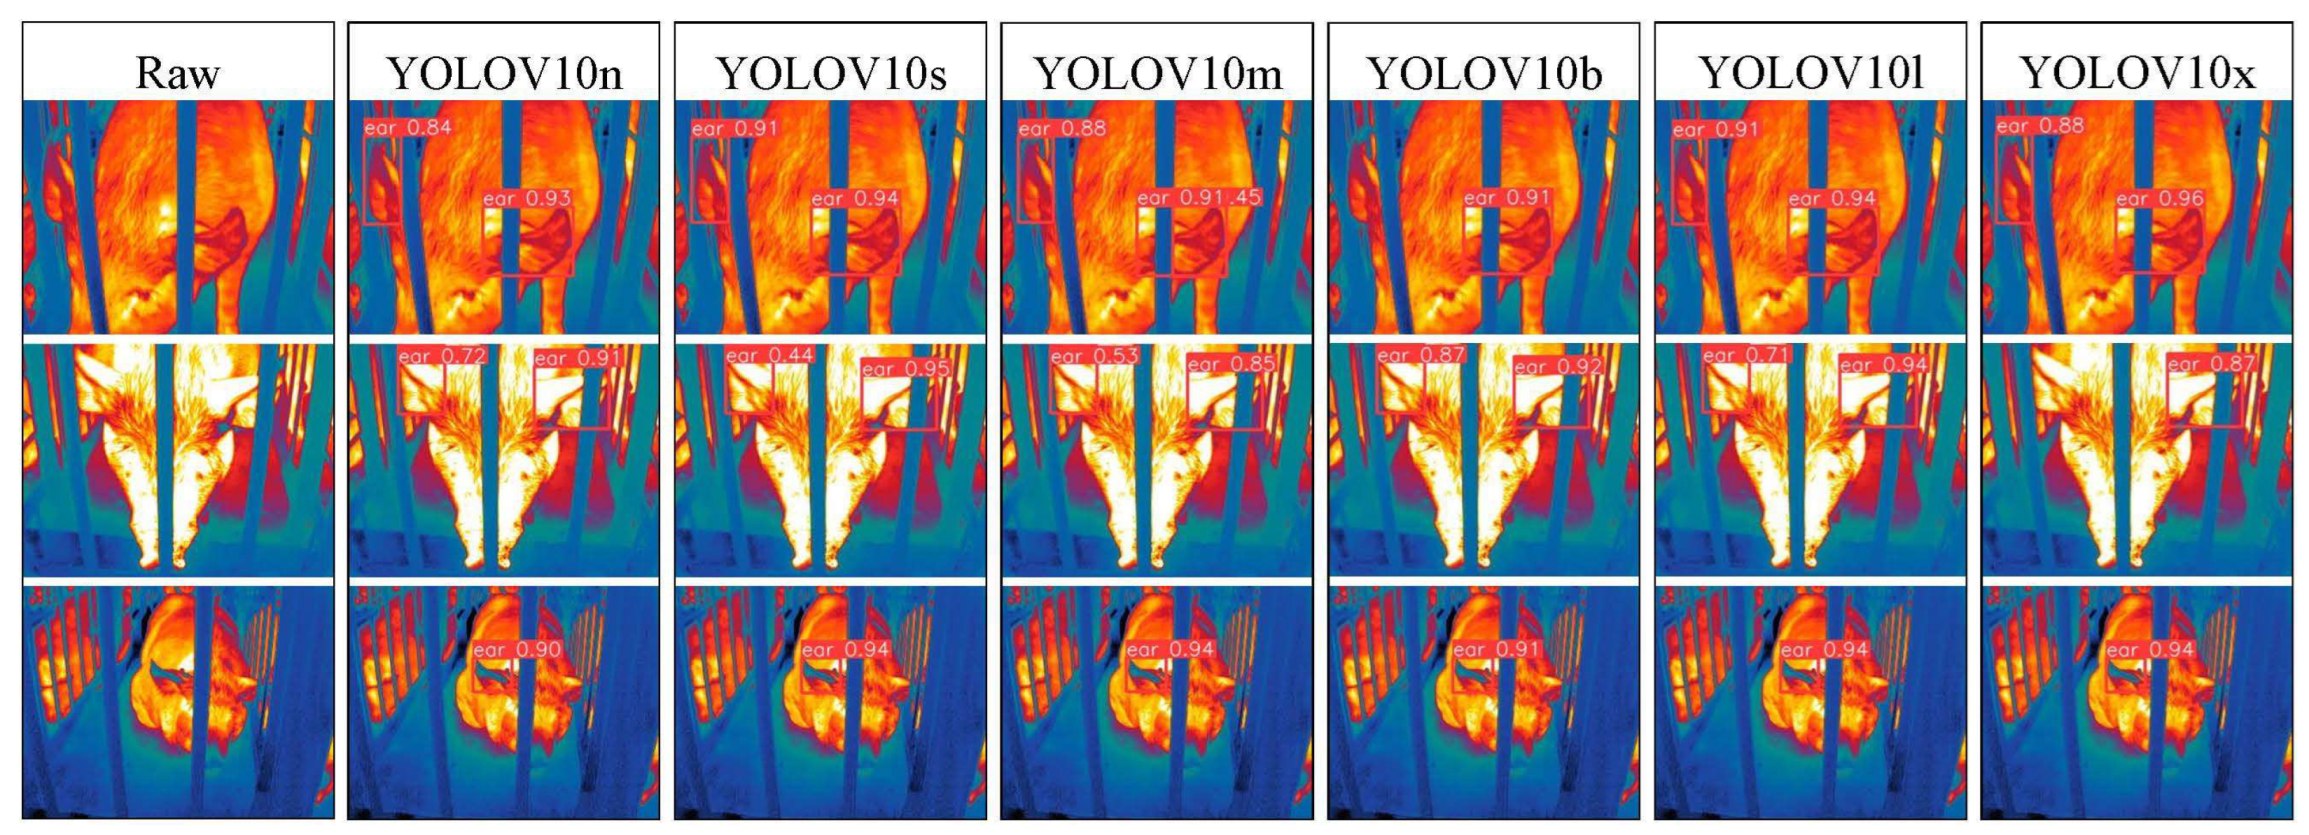
Figure 30.
Pig ear detection results of the YOLOv11 series algorithms.
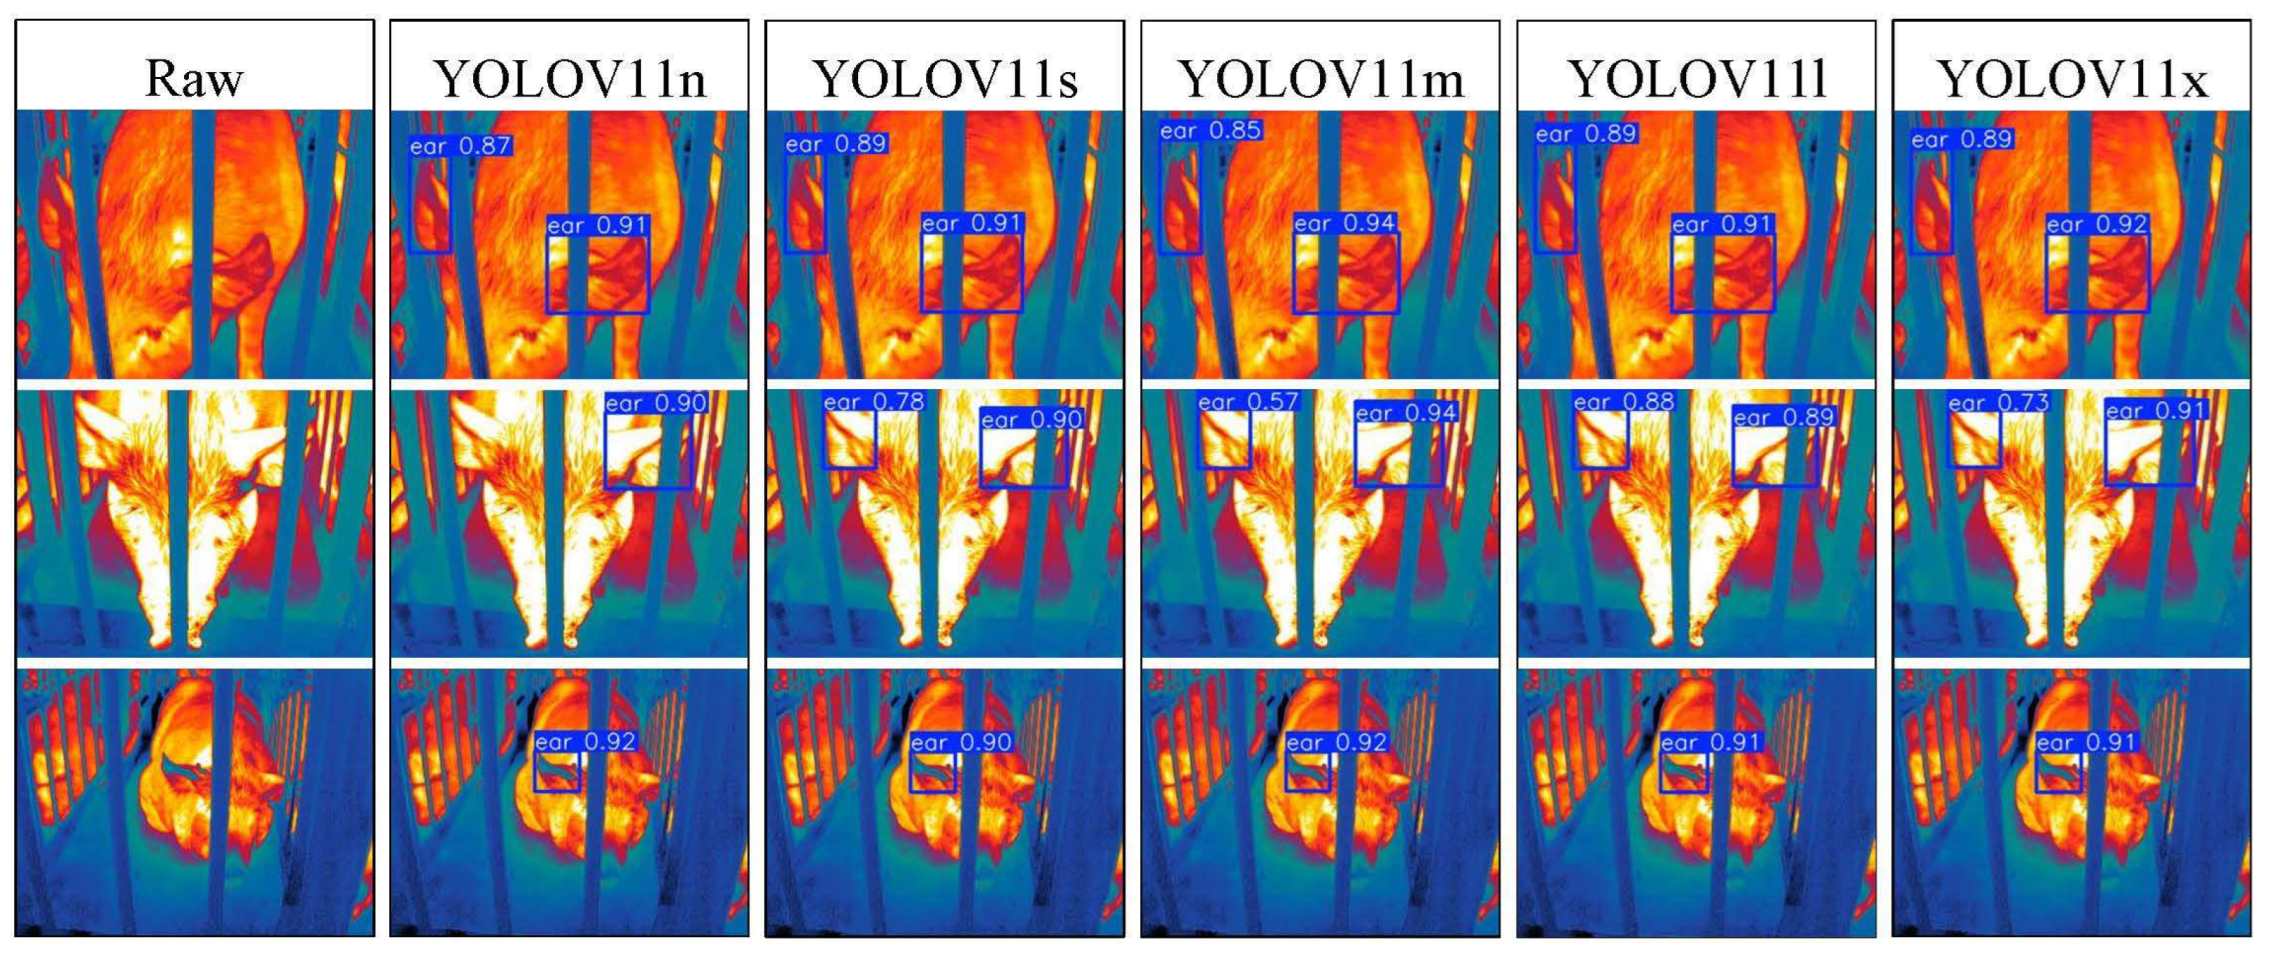
Among the detection results across all images, the YOLOv5 series algorithms achieved a maximum confidence score of 0.97 and a minimum of 0.55 in detecting pig ears. The YOLOv6 series had a maximum confidence of 0.96 and a minimum of 0.67. The YOLOv7 series showed a maximum confidence of 0.98 and a minimum of 0.88. For the YOLOv8 series, the maximum and minimum detection confidence scores were 0.98 and 0.61, respectively. The RT-DETR series achieved a maximum confidence of 0.95 and a minimum of 0.45, while the YOLOv9 series had a range from 0.95 to 0.5. The YOLOv10 series showed a maximum confidence of 0.96 and a minimum of 0.44, and the YOLOv11 series displayed a maximum confidence of 0.94 and a minimum of 0.57. These results indicate that all algorithms accurately identified pig ear targets, with most algorithms achieving detection confidence above 0.9.
In medium-range images, the YOLOv8x algorithm achieved the highest pig ear detection confidence at 0.98, while the YOLOv10b algorithm exhibited missed detections. For close-range images, the YOLOv8x algorithm had the highest detection confidence of 0.96, though missed detections were observed with the YOLOv5s, YOLOv9e, YOLOv10b, and YOLOv11n algorithms. In long-range images, the YOLOv7-tiny algorithm achieved the highest detection confidence of 0.98, while the YOLOv6n algorithm exhibited false positives, with a false detection confidence score of 0.67. These findings demonstrate that the TIRPigEar dataset supports high-precision detection performance across various object detection algorithms and includes images with differing detection difficulties. This highlights the diverse advantages of the TIRPigEar dataset, including images captured from varying angles, distances, and environmental conditions. The results confirm the high quality of this dataset, showing that models trained on the TIRPigEar dataset are capable of adapting to the complex field environments of practical livestock farms, facilitating model deployment and application.
4. Conclusions
The thermal distribution of pig ears can reflect health-related issues, and monitoring abnormal ear temperatures is crucial for timely intervention and environmental management in livestock farming. In this study, we developed a new dataset, TIRPigEar, for pig ear detection using thermal infrared imaging technology to address the limitations of existing infrared thermal imaging datasets. The TIRPigEar dataset includes 23,189 thermal infrared images of pig ears, each annotated in Pascal VOC, COCO, and YOLO formats. Through data collection, cleaning, and annotation, this dataset serves as a high-quality foundational resource for future research. Following the dataset construction, pig ear detection experiments were conducted using different object detection algorithms, with results showing the best performance on the YOLOv9m model. The YOLOv9m-based pig ear detection model achieved a maximum accuracy of 97.35%, a recall rate of 98.1%, and a mAP50 of 98.6%. These findings demonstrate the high quality of this thermal infrared pig ear dataset, offering new avenues for swine health monitoring.
6. Limitations
The current methods do not yet provide an ideal level of accuracy in reflecting pig body temperature. This limitation may stem from various factors, including environmental influences, constraints of measurement devices, or algorithmic shortcomings. Consequently, further research should focus on improving temperature measurement accuracy to better reflect the actual physiological state of the pigs.
While ear temperature can serve as an indicator of a pig’s health status, the correlation between its distribution characteristics and the pig's overall health requires further investigation. Current studies may not fully account for the physiological mechanisms behind changes in ear temperature. Therefore, developing a more comprehensive health assessment model calls for improvements and extensions to existing research methods.
Author Contributions
Conceptualization, Weihong Ma and Xingmeng Wang; methodology, Madonna Benjamin; software, Lepeng Song; validation, Xingmeng Wang and Madonna Benjamin; formal analysis, Weihong Ma; investigation, Weihong Ma; resources, Weihong Ma; data curation, Xingmeng Wang; writing—original draft preparation, Weihong Ma; writing—review and editing, Xingmeng Wang and Lepeng Song; visualization, Simon X. Yang; supervision, Qifeng Li; project administration, Simon X. Yang; funding acquisition, Qifeng Li. All authors have read and agreed to the published version of the manuscript.
Funding
This work was supported by the National Science and Technology Major Project of China (2022ZD0115702).
Institutional Review Board Statement
This study does not involve human subjects, and the collection and experimentation with pig thermal infrared images were conducted using non-contact, non-stressful methods. Therefore, no ethical or moral concerns are associated with this research.
Informed Consent Statement
Written informed consent was obtained from Sichuan Tieqi Lishi Company, represented by Mr. Wang Sen, for the involvement of his pigs in this study.
Data Availability Statement
Direct URL to the Data: https://github.com/maweihong/TIRPigEar
Conflicts of Interest
The authors declare no conflicts of interest.
References
- Nie, L.L.; Li, B.G.; Du, Y.H.; Jiao, F.; Song, X.Y.; Liu, Z.Y. Deep learning strategies with CReToNeXt-YOLOv5 for advanced pig face emotion detection. Sci. Rep. 2024, 14. [Google Scholar] [CrossRef] [PubMed]
- Pu, S.H.; Liu, Z.H. TR-YOLO: A pig detection network based on YOLO V5n by combining self attention mechanism and large convolutional kernel. J. Intell. Fuzzy Syst. 2024, 46, 5263–5273. [Google Scholar] [CrossRef]
- Ma, R.H.; Ali, H.; Chung, S.Y.; Kim, S.C.; Kim, H. A Lightweight Pig Face Recognition Method Based on Automatic Detection and Knowledge Distillation. Appl. Sci.-Basel 2024, 14. [Google Scholar] [CrossRef]
- Wang, F.; Fu, X.L.; Duan, W.J.; Wang, B.Y.; Li, H.H. The Detection of Ear Tag Dropout in Breeding Pigs Using a Fused Attention Mechanism in a Complex Environment. AGRICULTURE-BASEL 2024, 14. [Google Scholar] [CrossRef]
- Esper, I.D.; Cordova-Lopez, L.E.; Romanov, D.; Alvseike, O.; From, P.J.; Mason, A. Pigs: A stepwise RGB-D novel pig carcass cutting dataset. Data Brief 2022, 41. [Google Scholar] [CrossRef]
- Wang, G.; Ma, Y.; Huang, J.; Fan, F.; Li, H.; Li, Z.P. Instance segmentation of pigs in infrared images based on INPC model. INFRARED PHYSICS & TECHNOLOGY 2024, 141. [Google Scholar] [CrossRef]
- Shao, H.M.; Pu, J.Y.; Mu, J. Pig-Posture Recognition Based on Computer Vision: Dataset and Exploration. Anim. 2021, 11. [Google Scholar] [CrossRef] [PubMed]
- Bergamini, L.; Pini, S.; Simoni, A.; Vezzani, R.; Calderara, S.; D'Eath, R.B.; Fisher, R.B. Extracting Accurate Long-term Behavior Changes from a Large Pig Dataset. In Proceedings of the VISAPP: PROCEEDINGS OF THE 16TH INTERNATIONAL JOINT CONFERENCE ON COMPUTER VISION, IMAGING AND COMPUTER GRAPHICS THEORY AND APPLICATIONS - VOL. 5: VISAPP, 2021; pp. 524-533.
- Cai, Z.J.; Cui, J.L.; Yuan, H.B.; Cheng, M. Application and research progress of infrared thermography in temperature measurement of livestock and poultry animals: A review. Comput. Electron. Agric. 2023, 205. [Google Scholar] [CrossRef]
- Fan, M.; Stamford, J.; Lawson, T. Using Infrared Thermography for High-Throughput Plant Phenotyping. Methods in molecular biology (Clifton, N.J.) 2024, 2790, 317–332. [Google Scholar] [CrossRef]
- Gadhwal, M.; Sharda, A.; Sangha, H.S.; Van der Merwe, D. Spatial corn canopy temperature extraction: How focal length and sUAS flying altitude influence thermal infrared sensing accuracy. Comput. Electron. Agric. 2023, 209. [Google Scholar] [CrossRef]
- Dang, X.; Lin, X.; He, Z.; Chen, Y.; Ci, B.; Ma, X.; Guo, C.; He, Y.; Liu, Y.; Ma, F. Extraction and accuracy evaluation of cotton canopy temperature under drip irrigation based on uav thermal infrared remote sensing. Xinjiang Agricultural Sciences 2024, 61, 565–575. [Google Scholar]
- Zhang, X.M.; Zhang, Y.N.; Geng, J.F.; Pan, J.M.; Huang, X.Y.; Rao, X.Q. Feather Damage Monitoring System Using RGB-Depth-Thermal Model for Chickens. Anim. 2023, 13. [Google Scholar] [CrossRef] [PubMed]
- Reza, M.N.; Ali, M.R.; Samsuzzaman; Kabir, M.S.N.; Karim, M.R.; Ahmed, S.; Kyoung, H.; Kim, G.; Chung, S.O. Thermal imaging and computer vision technologies for the enhancement of pig husbandry: a review. J. Anim. Sci. Technol. 2024, 66, 31–56. [Google Scholar] [CrossRef]
- Hui, H.; Xianglong, X.; Qifeng, L.; Hongfeng, G.; Rong, W.; Ruixiang, J.; Zhiyu, R.; Rui, M.; Mingyu, L.; Yuhang, G.; et al. Pig-ear detection from the thermal infrared image based on improved YOLOv8n. Intell. Rob. 2024, 4, 20–38. [Google Scholar] [CrossRef]
- Wang, C.Y.; Liao, H.Y.M.; Wu, Y.H.; Chen, P.Y.; Hsieh, J.W.; Yeh, I.H.; Ieee Comp, S.O.C. CSPNet: A New Backbone that can Enhance Learning Capability of CNN. In Proceedings of the 2020 IEEE/CVF CONFERENCE ON COMPUTER VISION AND PATTERN RECOGNITION WORKSHOPS (CVPRW 2020); 2020; pp. 1571–1580. [Google Scholar]
- He, K.M.; Zhang, X.Y.; Ren, S.Q.; Sun, J. Spatial Pyramid Pooling in Deep Convolutional Networks for Visual Recognition. IEEE Trans. Pattern Anal. Mach. Intell. 2015, 37, 1904–1916. [Google Scholar] [CrossRef]
- Lin, T.Y.; Dollár, P.; Girshick, R.; He, K.M.; Hariharan, B.; Belongie, S.; Ieee. Feature Pyramid Networks for Object Detection. In Proceedings of the 30TH IEEE CONFERENCE ON COMPUTER VISION AND PATTERN RECOGNITION (CVPR 2017), 2017; pp. 936-944.
- Liu, S.; Qi, L.; Qin, H.; Shi, J.; Jia, J. Path Aggregation Network for Instance Segmentation. Arxiv 2018, arXiv:1803.01534. [Google Scholar] [CrossRef]
- Ding, X.H.; Zhang, X.Y.; Ma, N.N.; Han, J.G.; Ding, G.G.; Sun, J.; Ieee Comp, S.O.C. RepVGG: Making VGG-style ConvNets Great Again. In Proceedings of the 2021 IEEE/CVF CONFERENCE ON COMPUTER VISION AND PATTERN RECOGNITION, CVPR 2021; 2021; pp. 13728–13737. [Google Scholar]
- Ge, Z.; Liu, S.; Wang, F.; Li, Z.; Sun, J. YOLOX: Exceeding YOLO Series in 2021. Arxiv 2021, arXiv:2107.08430. [Google Scholar] [CrossRef]
- Tian, Z.; Shen, C.H.; Chen, H.; He, T. FCOS: A Simple and Strong Anchor-Free Object Detector. IEEE Trans. Pattern Anal. Mach. Intell. 2022, 44, 1922–1933. [Google Scholar] [CrossRef] [PubMed]
- Zhang, X.D.; Zeng, H.; Guo, S.; Zhang, L. Efficient Long-Range Attention Network for Image Super-Resolution. In Proceedings of the COMPUTER VISION - ECCV 2022, PT XVII; 2022; pp. 649–667. [Google Scholar]
- Zhao, Y.; Lv, W.; Xu, S.; Wei, J.; Wang, G.; Dang, Q.; Liu, Y.; Chen, J. DETRs Beat YOLOs on Real-time Object Detection. Arxiv 2024, arXiv:2304.08069. [Google Scholar] [CrossRef]
- Hussain, M. YOLO-v1 to YOLO-v8, the Rise of YOLO and Its Complementary Nature toward Digital Manufacturing and Industrial Defect Detection. MACHINES 2023, 11. [Google Scholar] [CrossRef]
- Terven, J.R.; Esparza, D.M.C. A Comprehensive Review of YOLO: From YOLOv1 to YOLOv8 and Beyond. ArXiv 2023. abs/2304.00501. [Google Scholar] [CrossRef]
- Li, C.; Li, L.; Jiang, H.; Weng, K.; Geng, Y.; Li, L.; Ke, Z.; Li, Q.; Cheng, M.; Nie, W.; et al. YOLOv6: A Single-Stage Object Detection Framework for Industrial Applications. Arxiv 2022, arXiv:2209.02976. [Google Scholar] [CrossRef]
- Wang, C.-Y.; Bochkovskiy, A.; Mark Liao, H.-Y. YOLOv7: Trainable bag-of-freebies sets new state-of-the-art for real-time object detectors. Arxiv 2022, arXiv:2207.02696. [Google Scholar] [CrossRef]
- Varghese, R.; S, M. YOLOv8: A Novel Object Detection Algorithm with Enhanced Performance and Robustness. In Proceedings of the 2024 International Conference on Advances in Data Engineering and Intelligent Computing Systems (ADICS), 18-19 April 2024, 2024; pp. 1-6.
- Wang, C.-Y.; Yeh, I.H.; Liao, H.-Y.M. YOLOv9: Learning What You Want to Learn Using Programmable Gradient Information. Arxiv 2024, arXiv:2402.13616. [Google Scholar] [CrossRef]
- Wang, A.; Chen, H.; Liu, L.; Chen, K.; Lin, Z.; Han, J.; Ding, G. YOLOv10: Real-Time End-to-End Object Detection. Arxiv 2024, arXiv:2405.14458. [Google Scholar] [CrossRef]
- Ultralytics. Ultralytics YOLOv11. 2024.
Figure 1.
Health Inspection Robot for Pig Farms. 1: Lifting Mechanism for Health Inspection; 2: Information Acquisition and Control Unit; 3: Mobile Platform; 4: Image Acquisition Component - Infrared Thermal Imager.
Figure 1.
Health Inspection Robot for Pig Farms. 1: Lifting Mechanism for Health Inspection; 2: Information Acquisition and Control Unit; 3: Mobile Platform; 4: Image Acquisition Component - Infrared Thermal Imager.
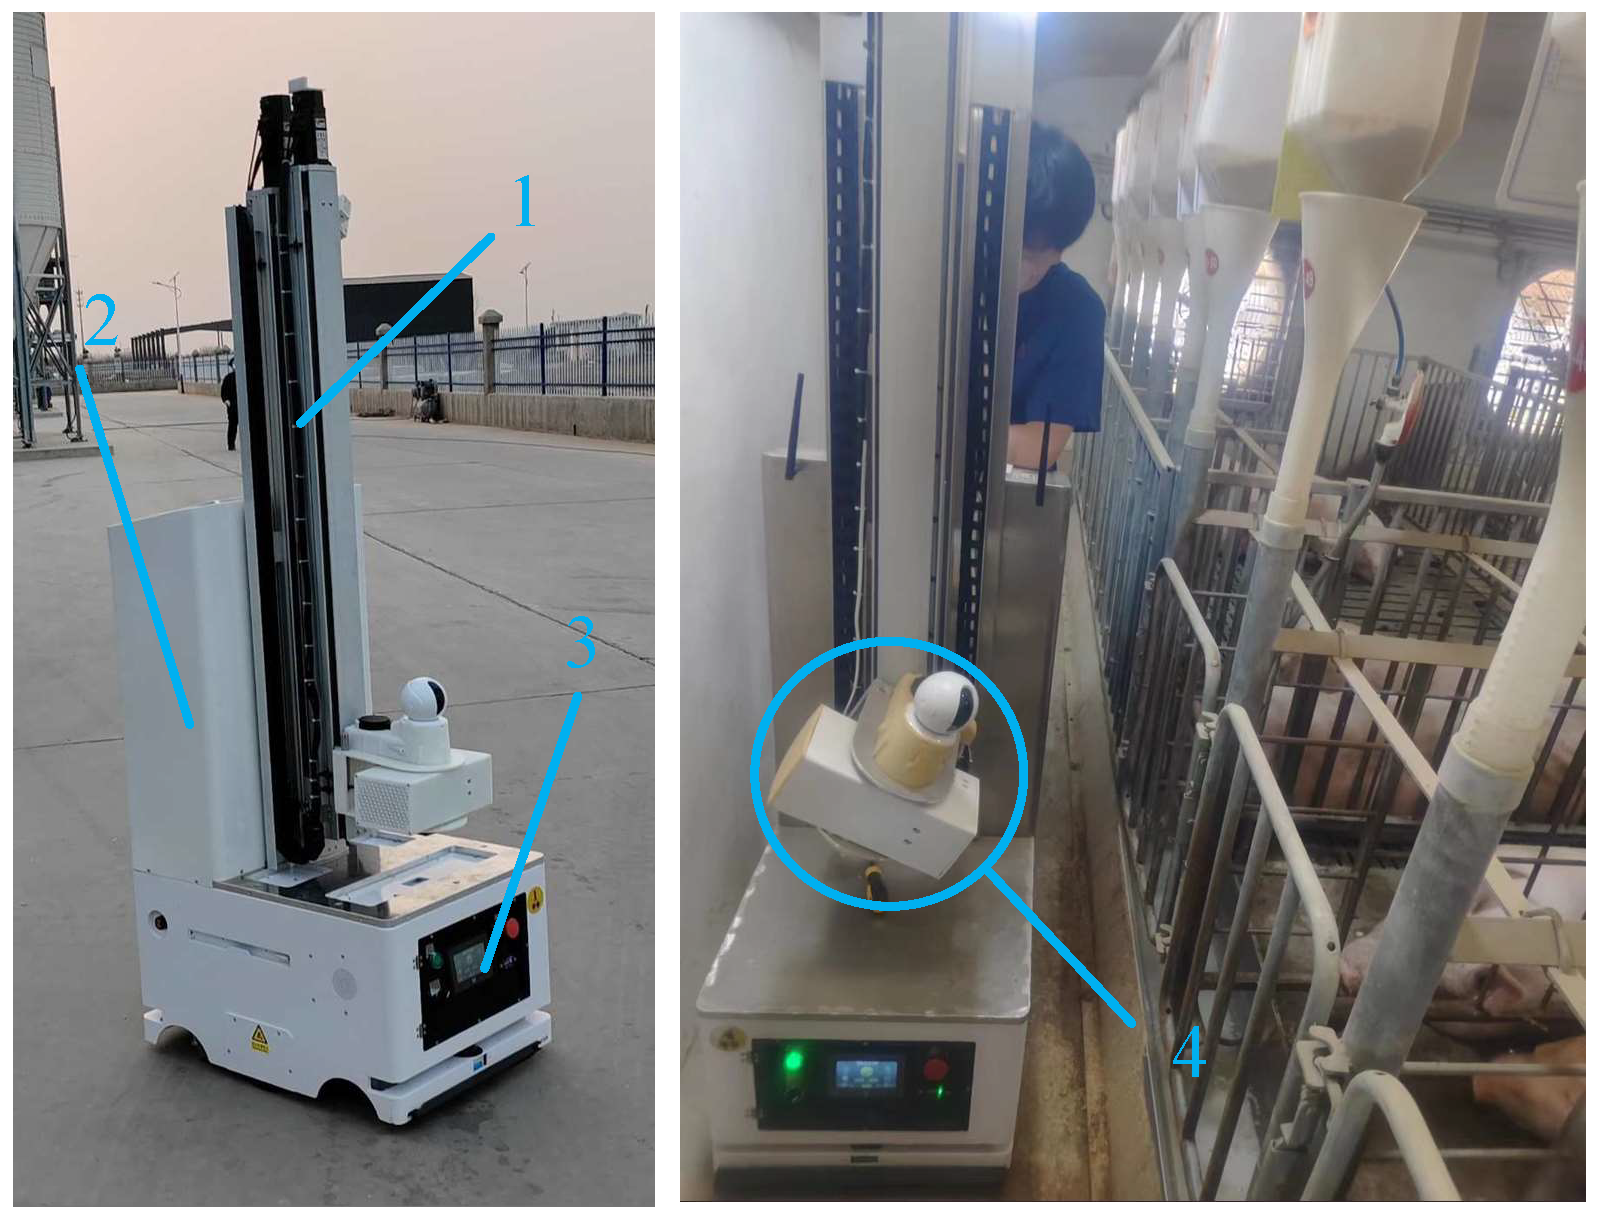
Figure 2.
Illustration of Thermal Infrared Imaging for Pig Ear Data Collection. The camera’s capture angle was set within 90°, with minor angle adjustments to ensure full coverage of the pigs’ head.
Figure 2.
Illustration of Thermal Infrared Imaging for Pig Ear Data Collection. The camera’s capture angle was set within 90°, with minor angle adjustments to ensure full coverage of the pigs’ head.
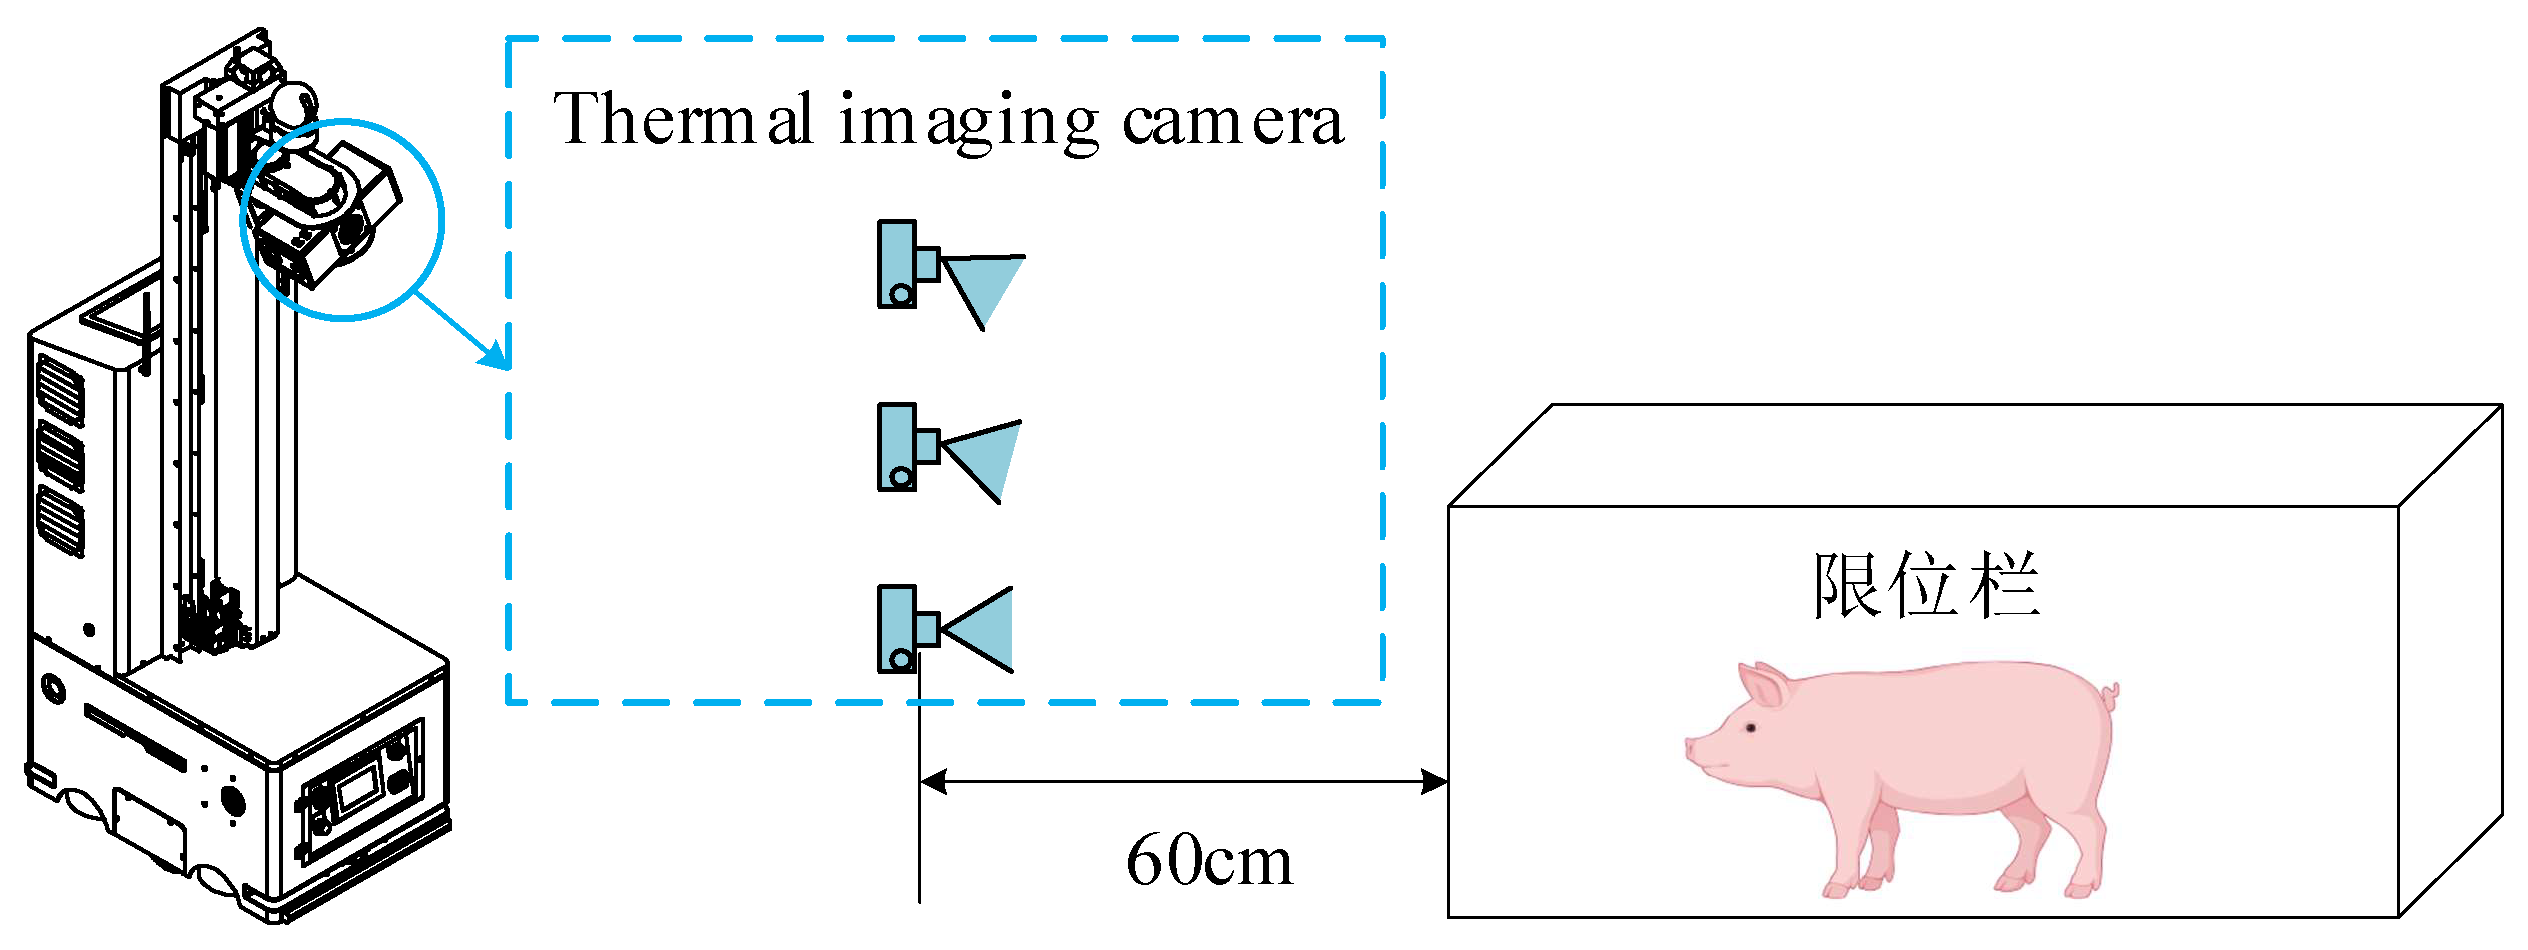
Figure 3.
Data Collection Workflow for the Dataset.
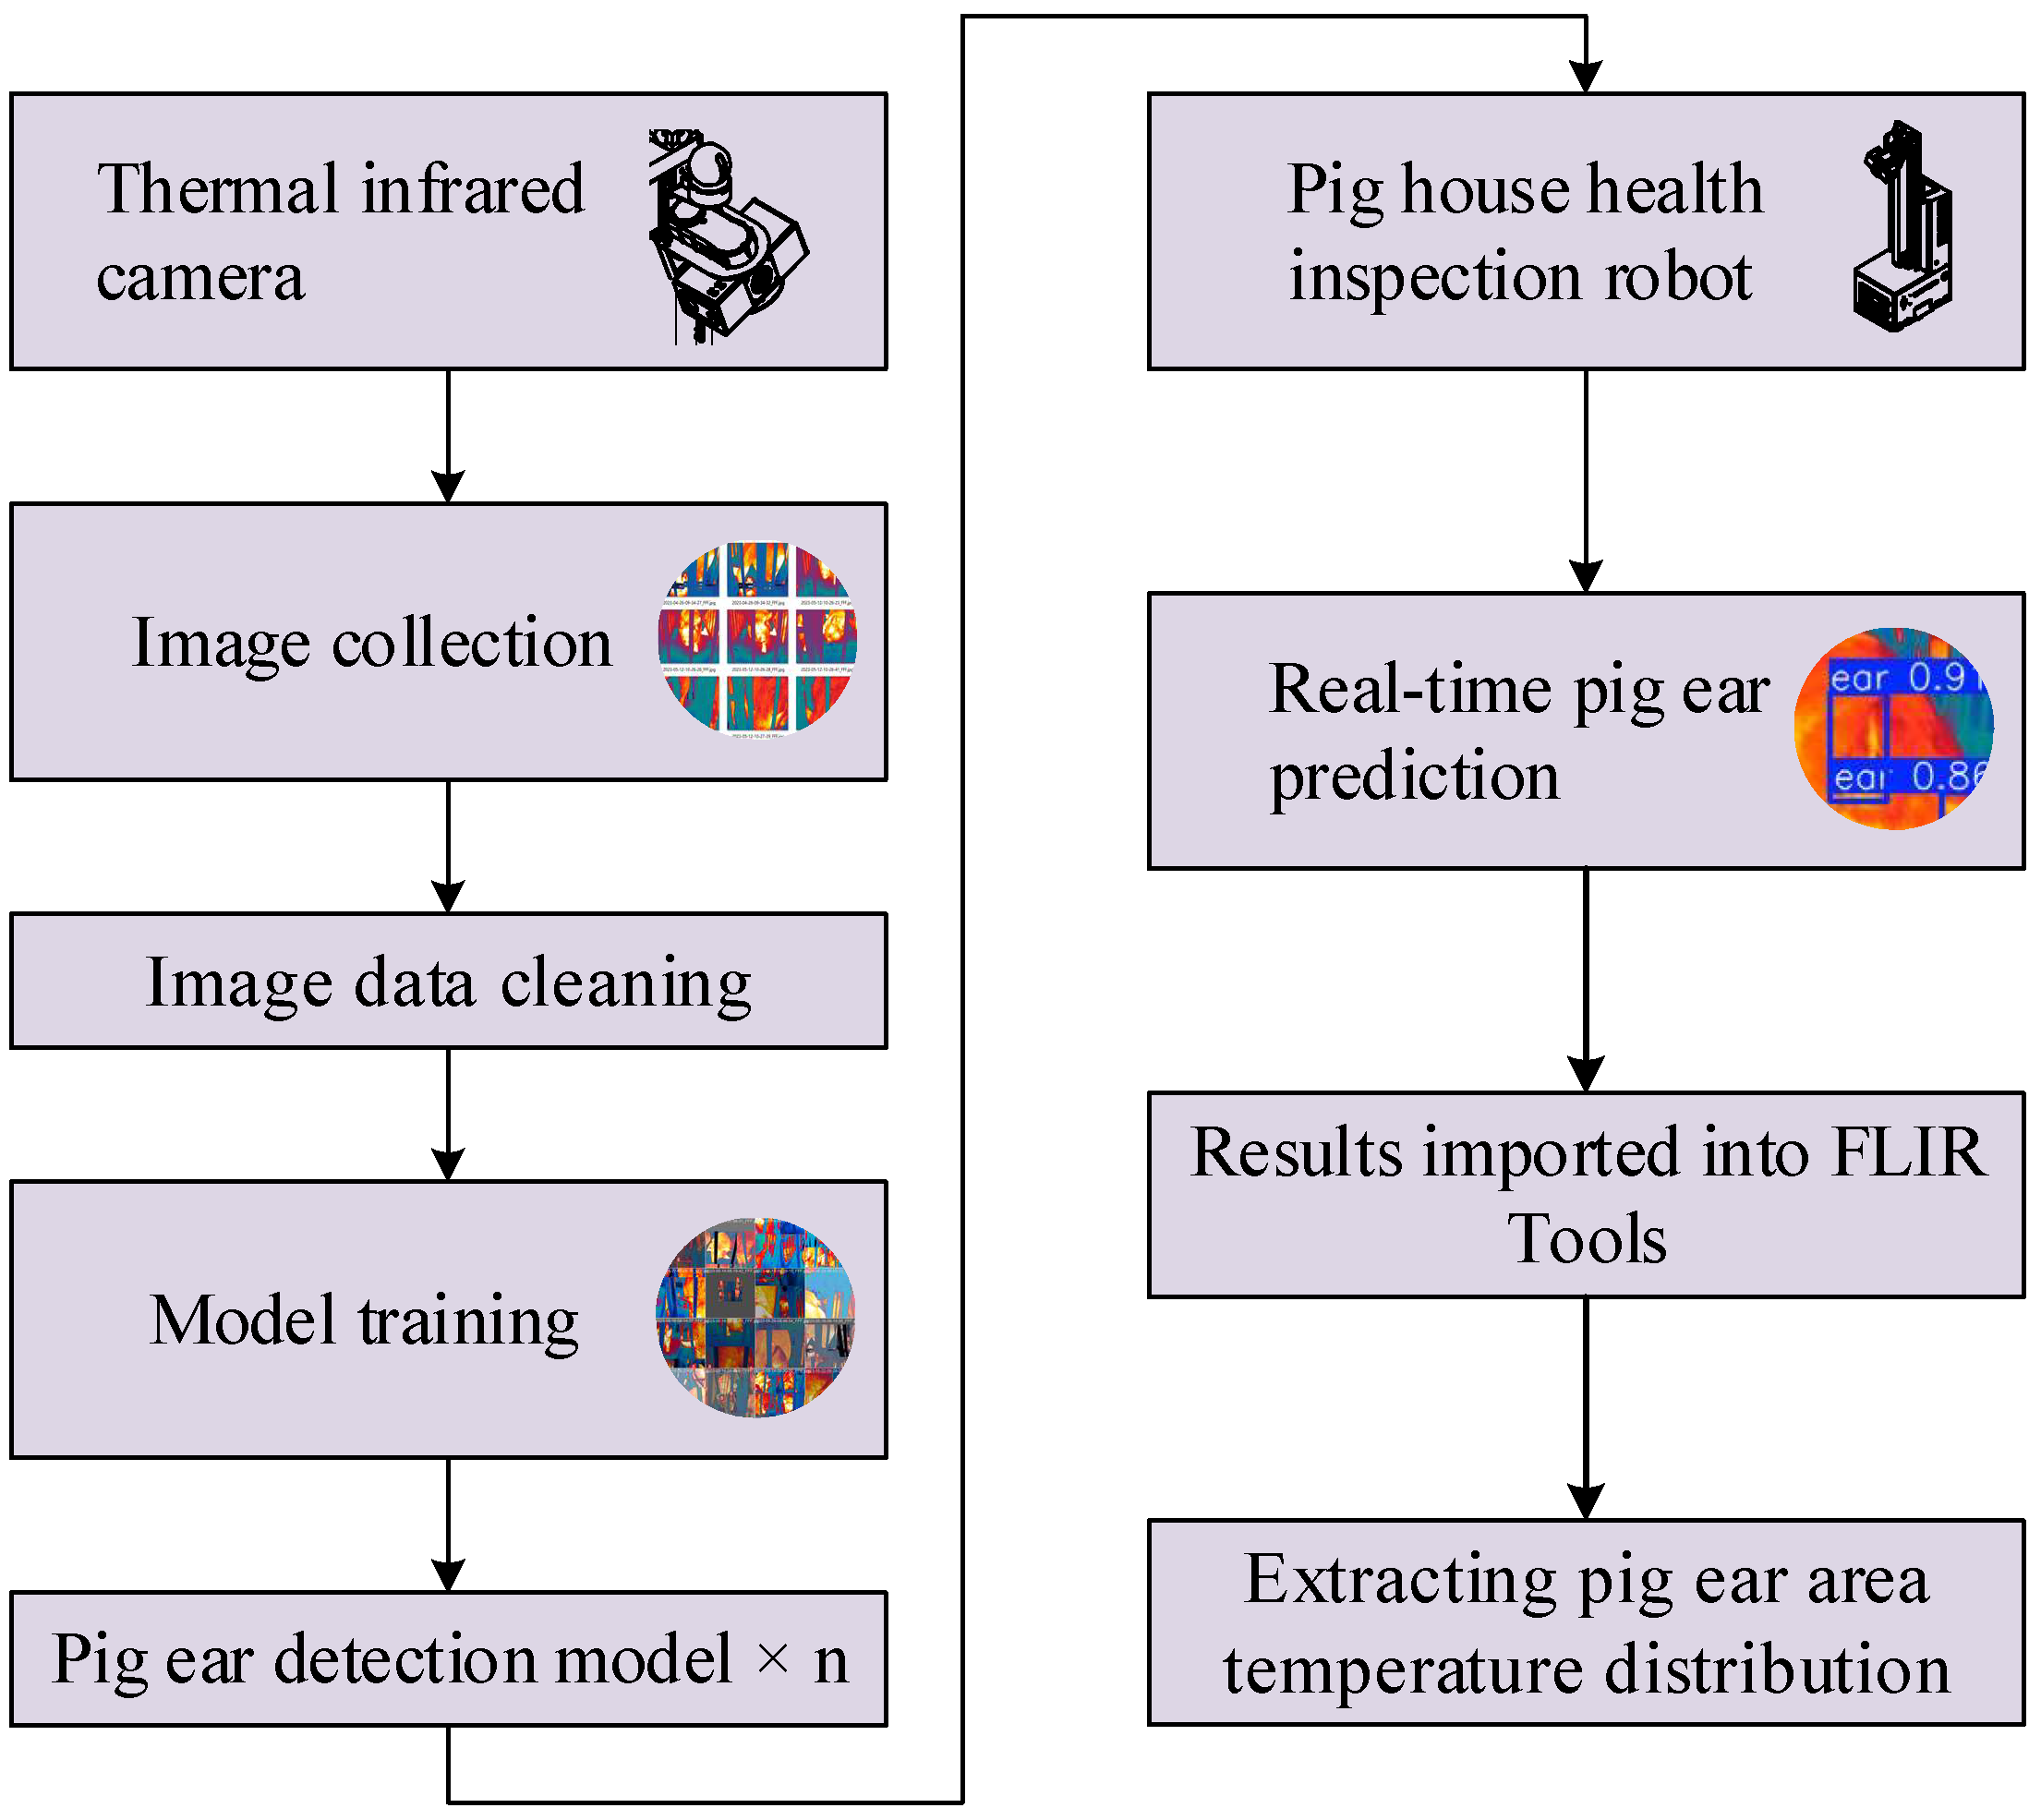
Figure 8.
Quality Assessment of the Pig Ear Detection Dataset. (x, y) represents the center coordinates of the bounding box; width indicates the bounding box width; height represents the bounding box height.
Figure 8.
Quality Assessment of the Pig Ear Detection Dataset. (x, y) represents the center coordinates of the bounding box; width indicates the bounding box width; height represents the bounding box height.
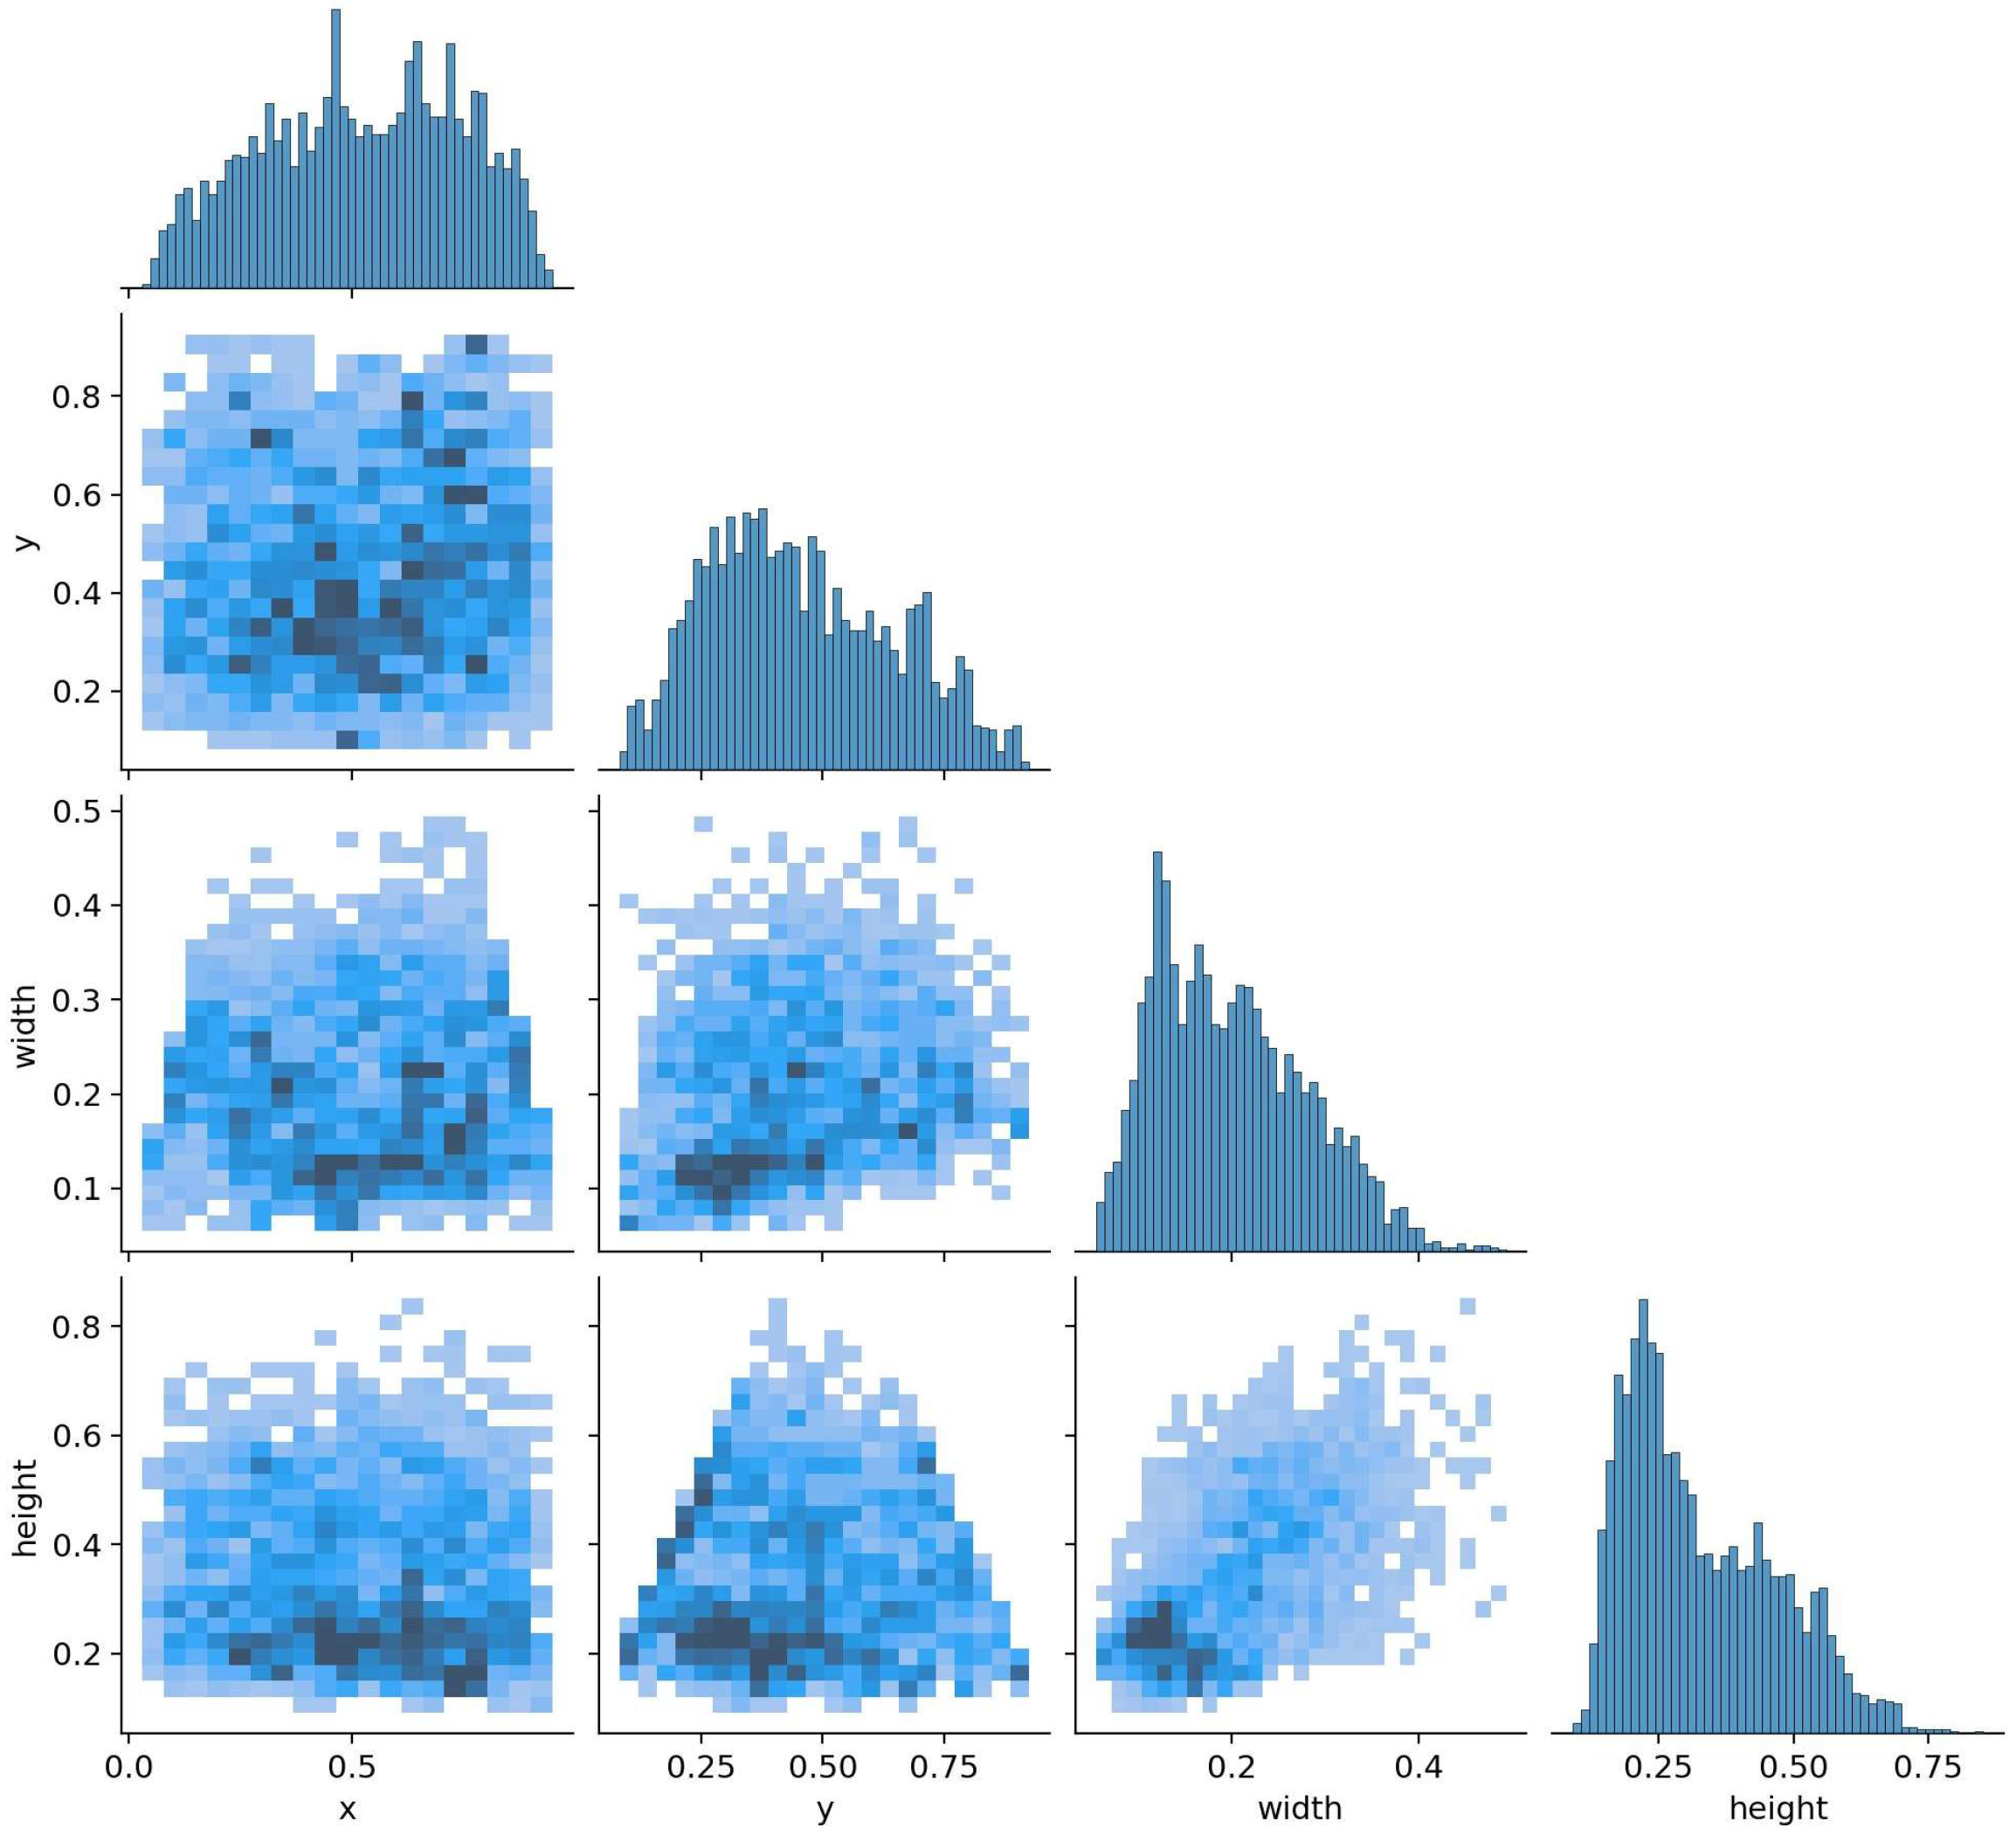
Figure 9.
Comparison of Accuracy vs. Parameter Size (left) and Latency vs. Accuracy (right) Using Different Methods on the Pig Ear Detection Dataset.
Figure 9.
Comparison of Accuracy vs. Parameter Size (left) and Latency vs. Accuracy (right) Using Different Methods on the Pig Ear Detection Dataset.
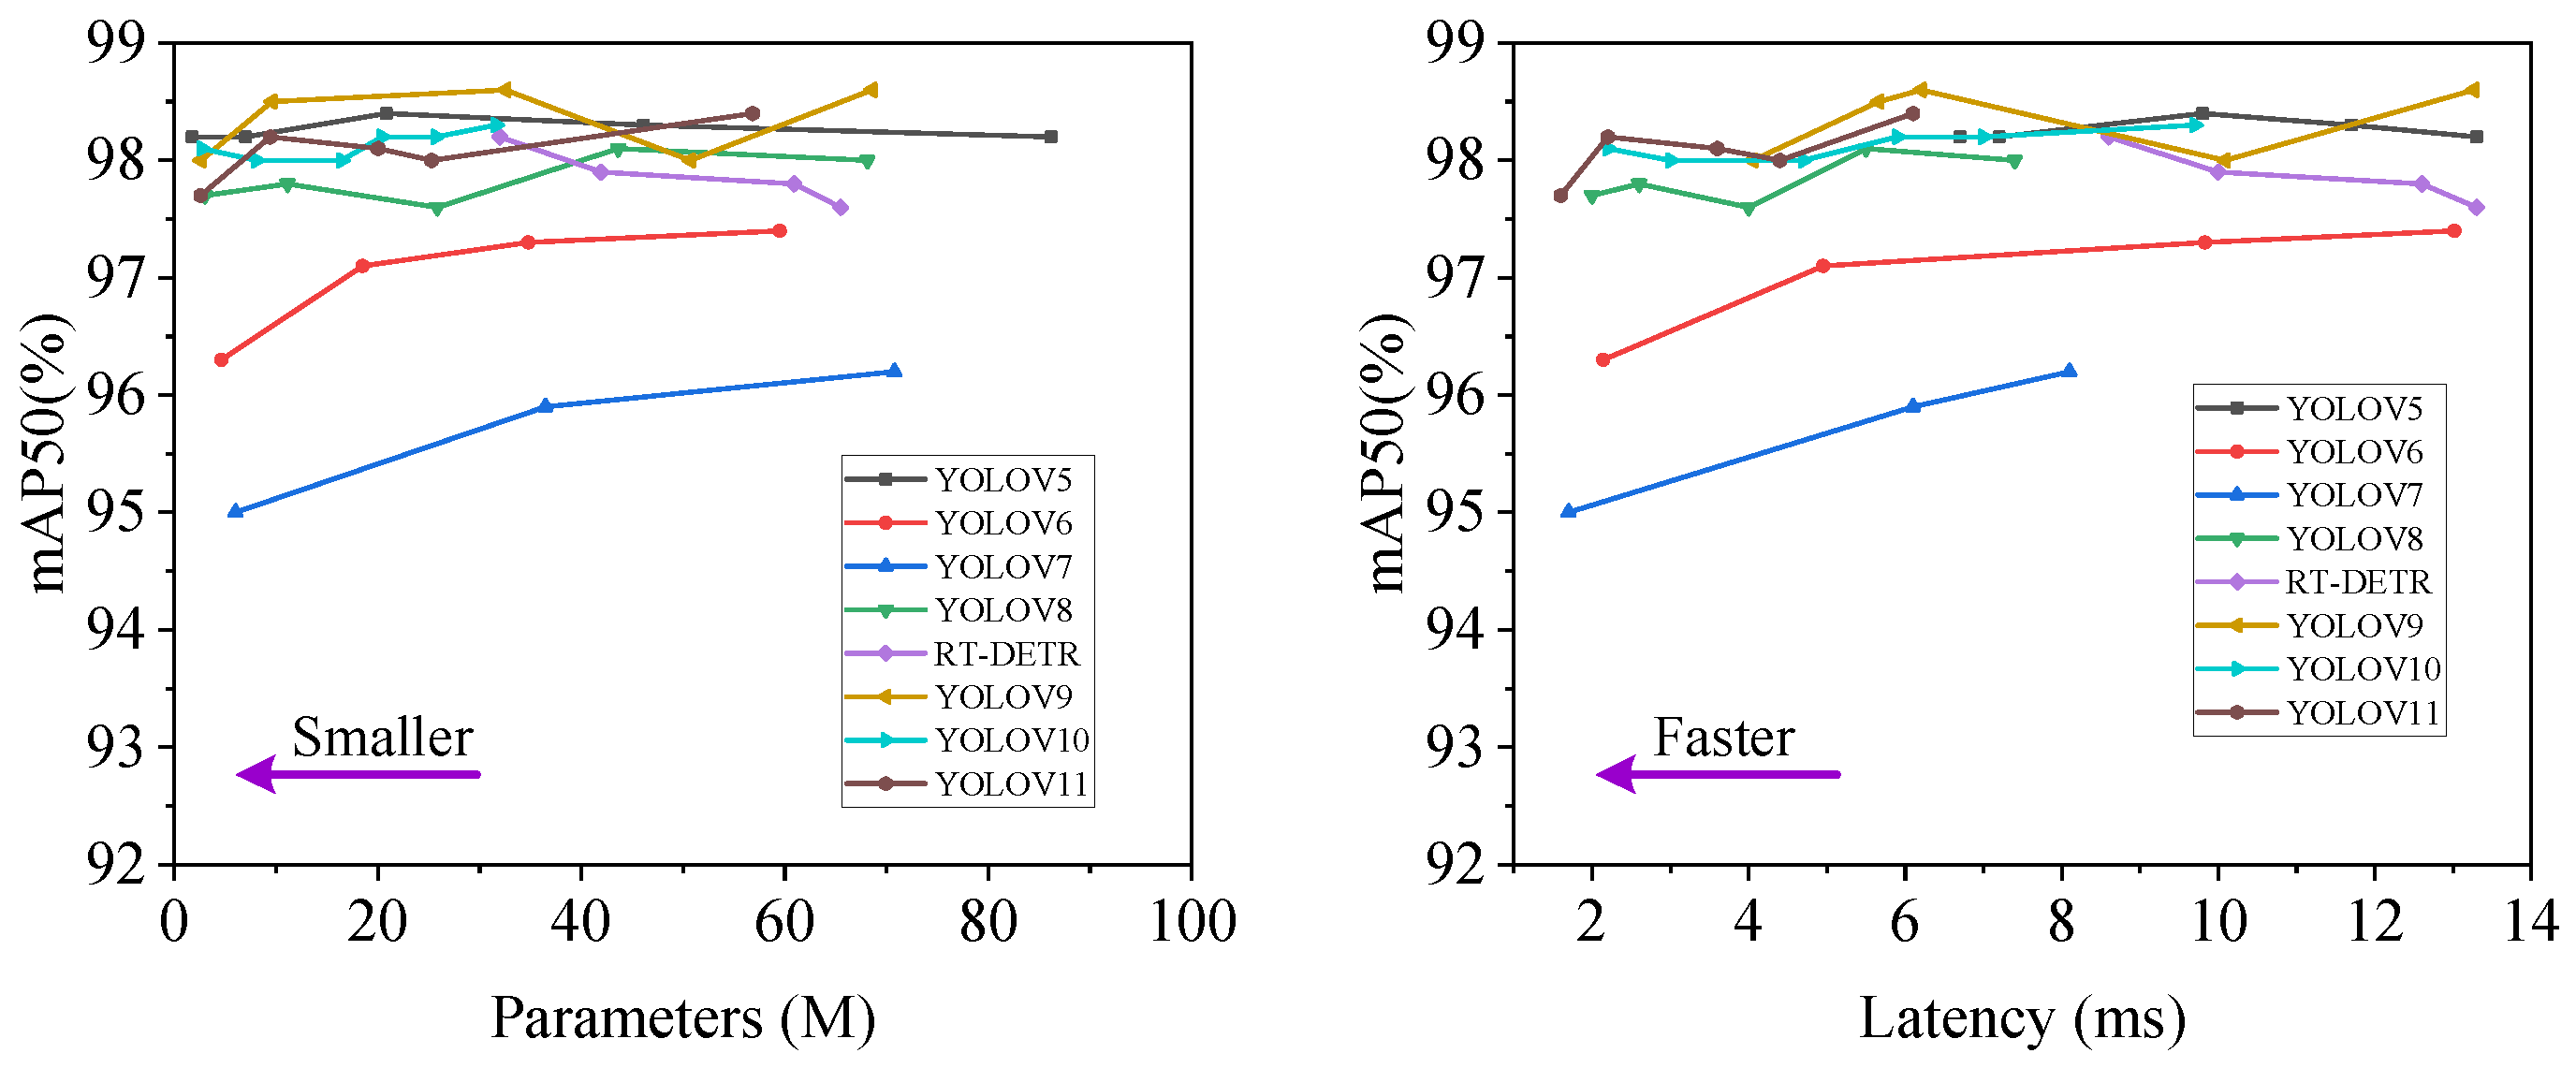
Figure 10.
Variations in loss values and precision for the RT-DETR and YOLOv5 pig ear detection models.
Figure 10.
Variations in loss values and precision for the RT-DETR and YOLOv5 pig ear detection models.
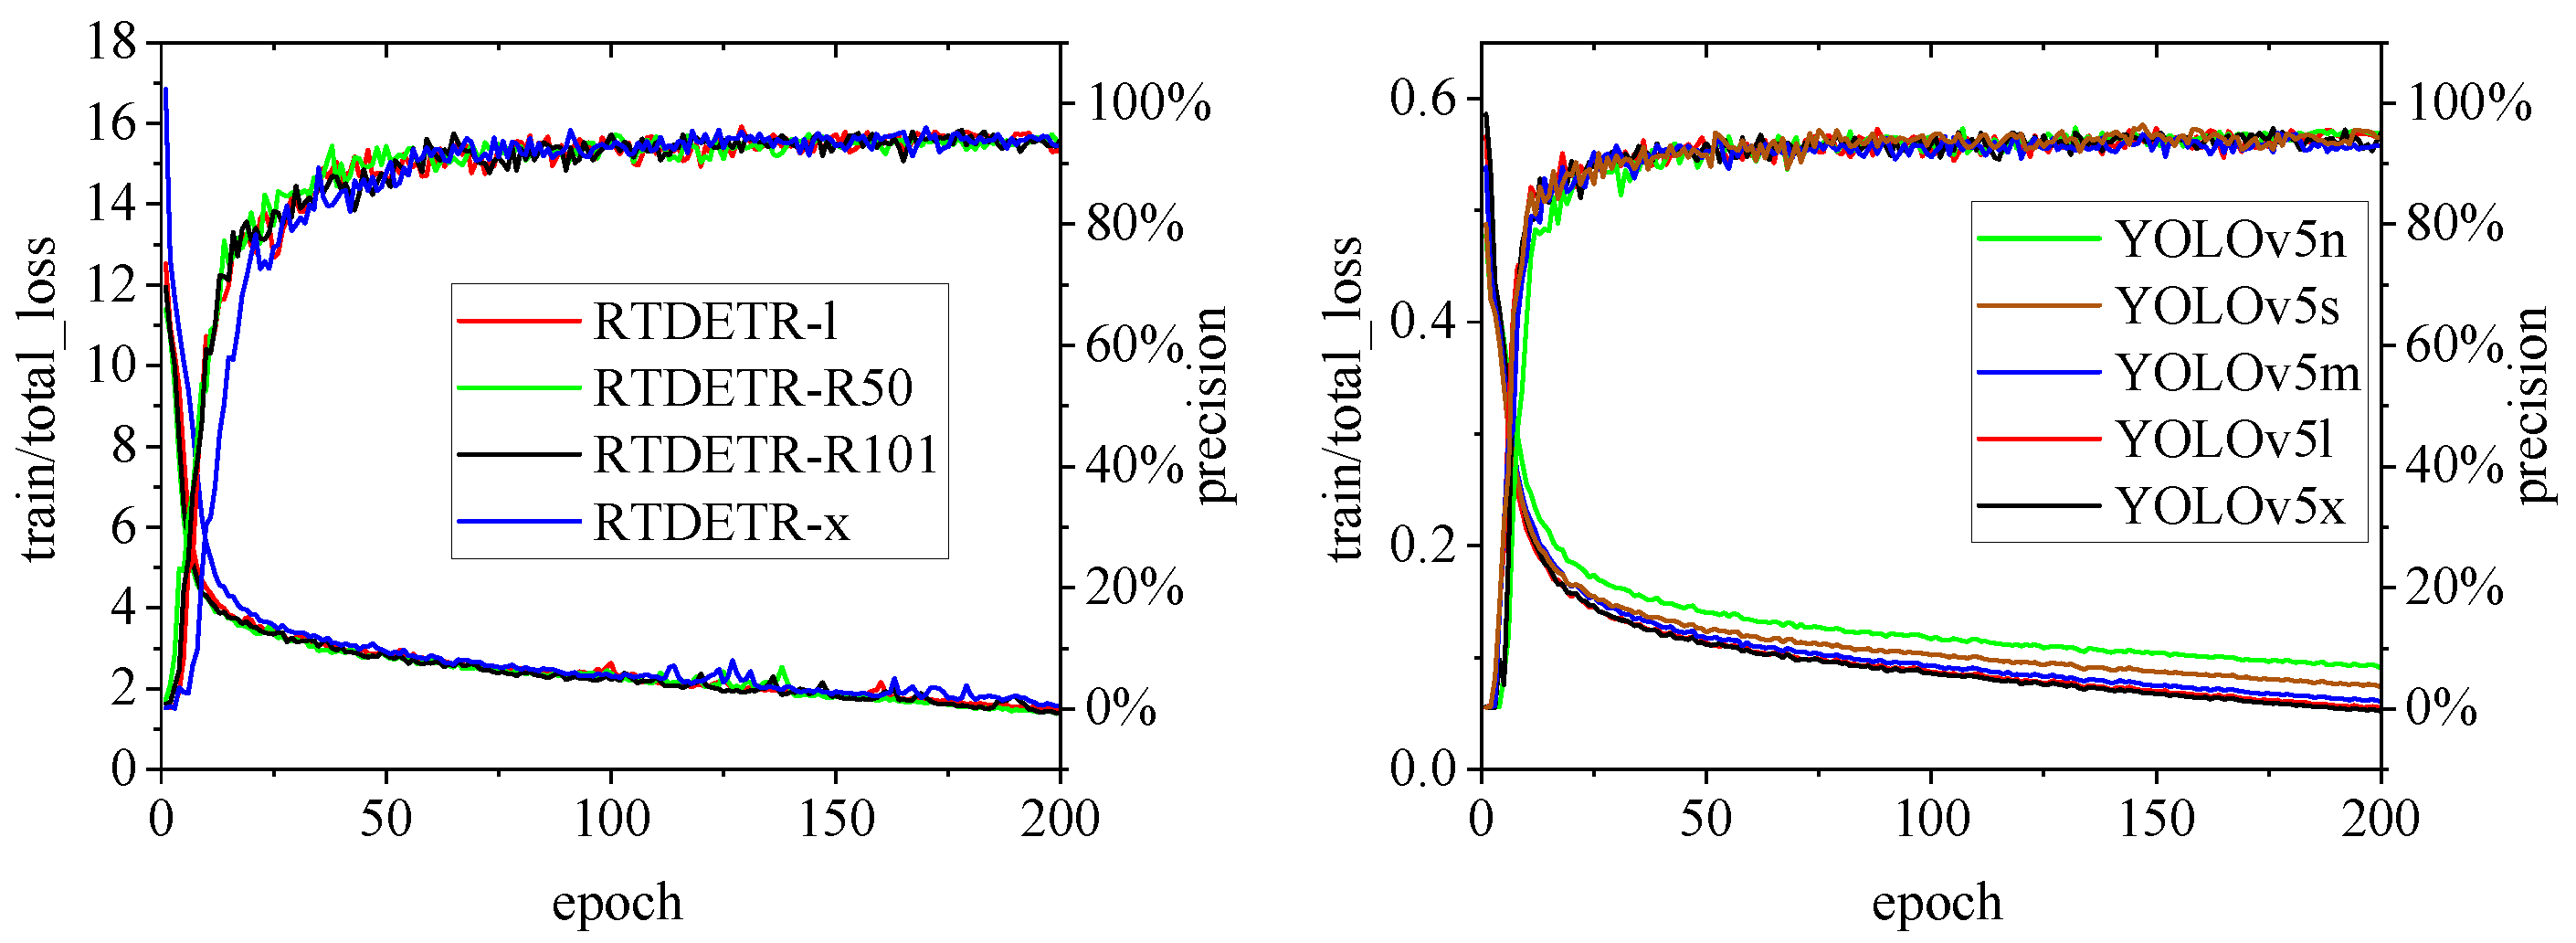
Figure 11.
Variations in loss values and precision for the YOLOv6 and YOLOv7 pig ear detection models.
Figure 11.
Variations in loss values and precision for the YOLOv6 and YOLOv7 pig ear detection models.
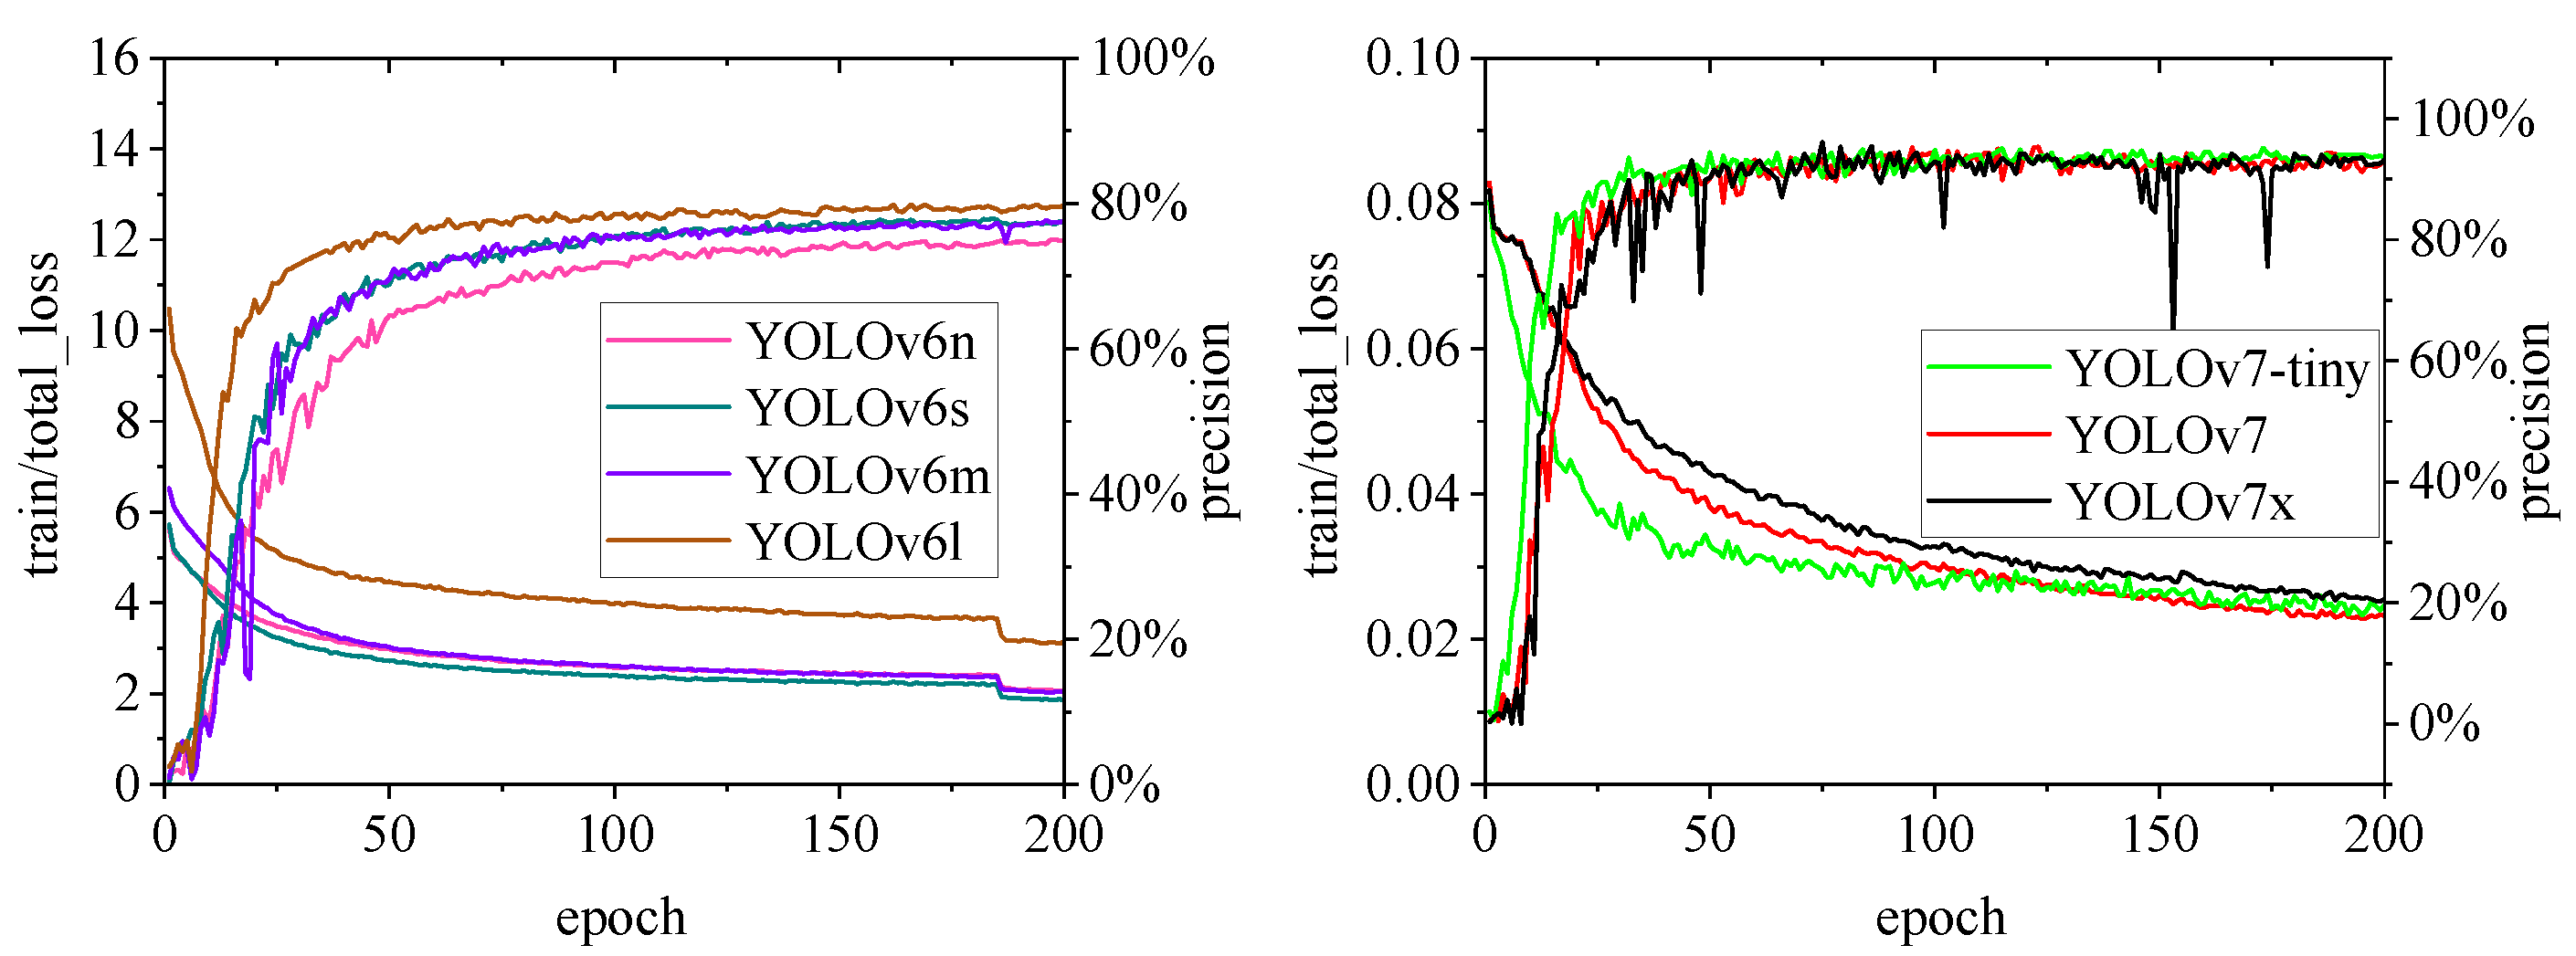
Figure 12.
Variations in loss values and precision for the YOLOv8 and YOLOv9 pig ear detection models.
Figure 12.
Variations in loss values and precision for the YOLOv8 and YOLOv9 pig ear detection models.
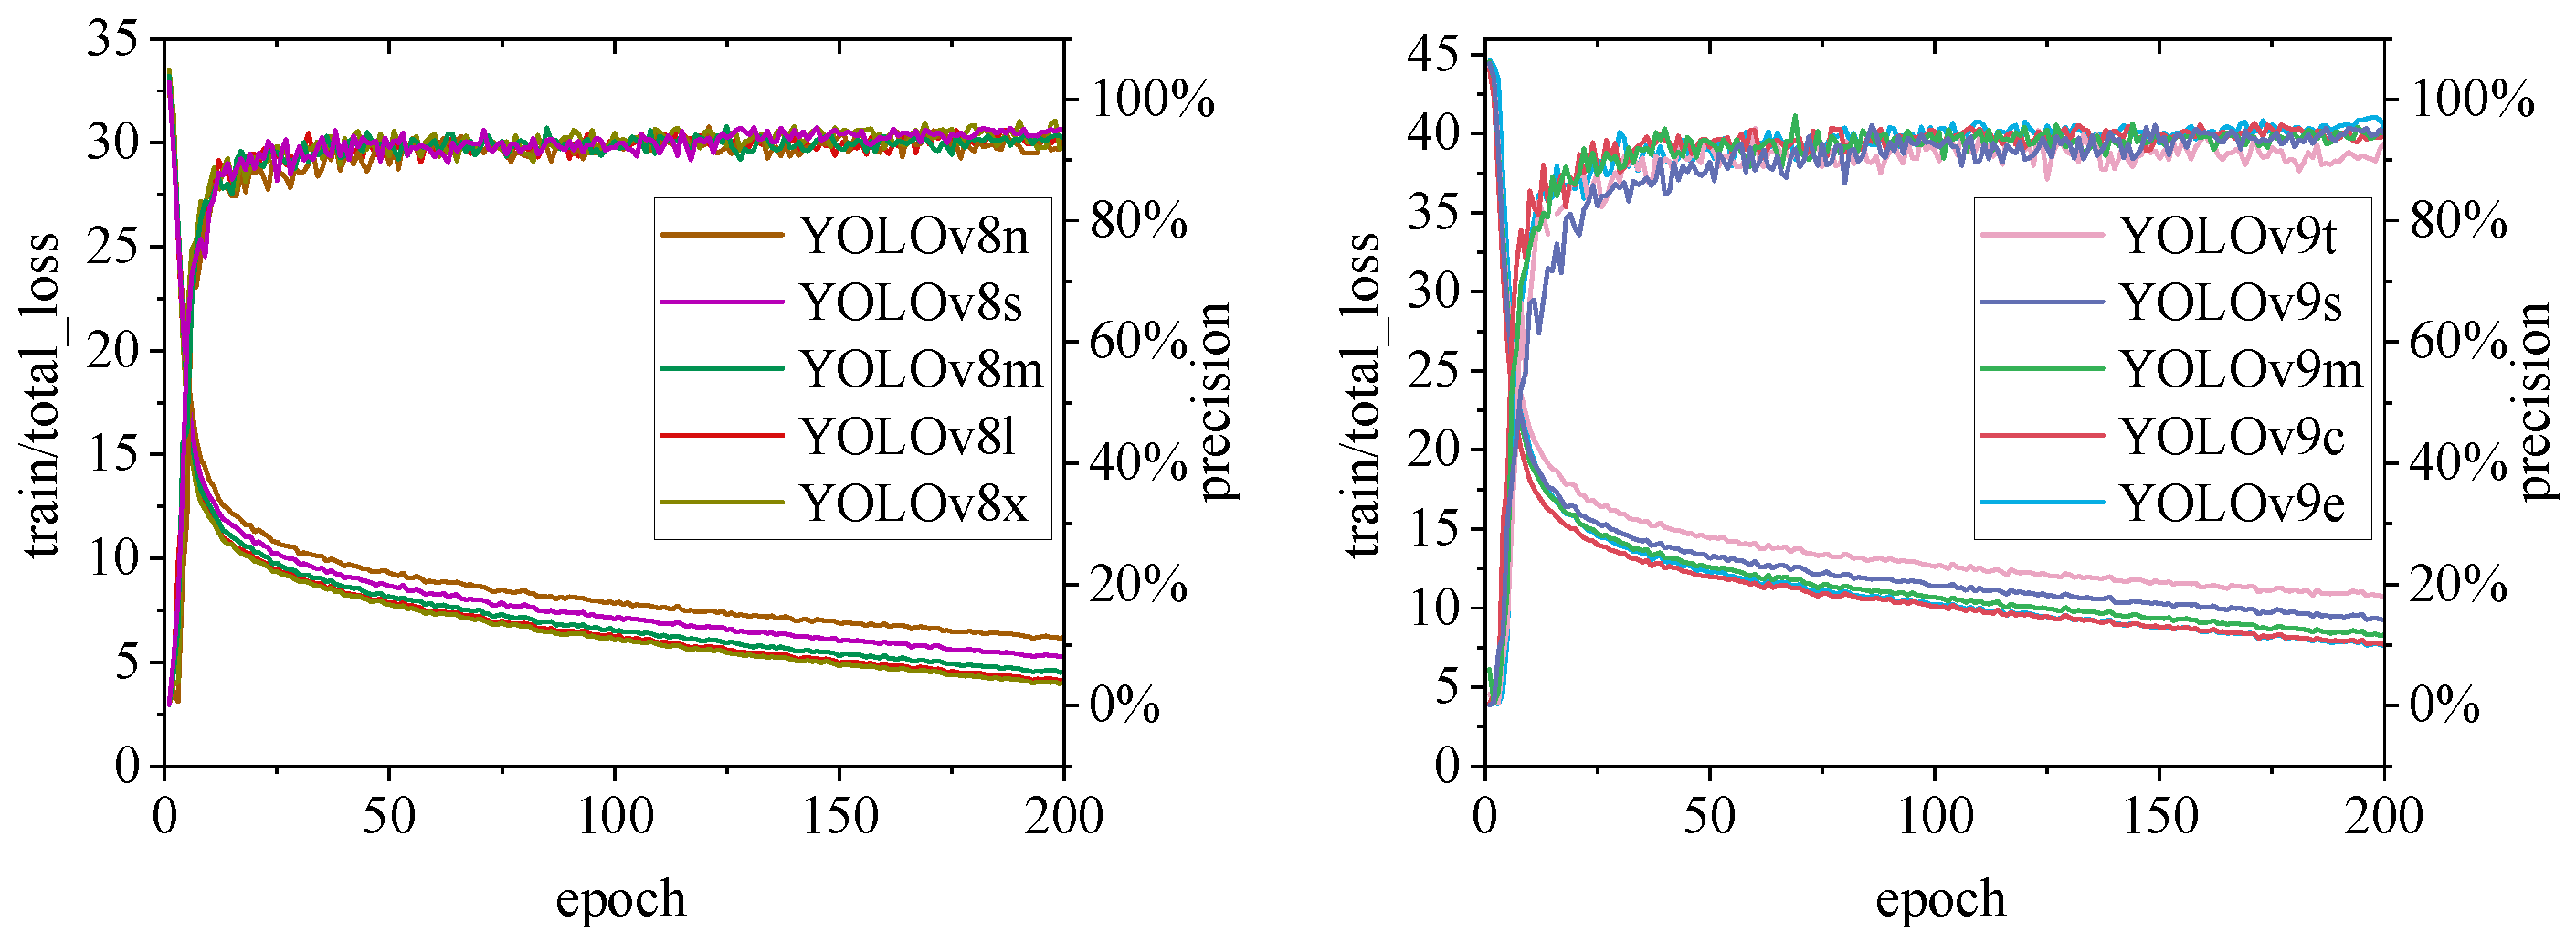
Figure 13.
Variations in loss values and precision for the YOLOv10 pig ear detection model.
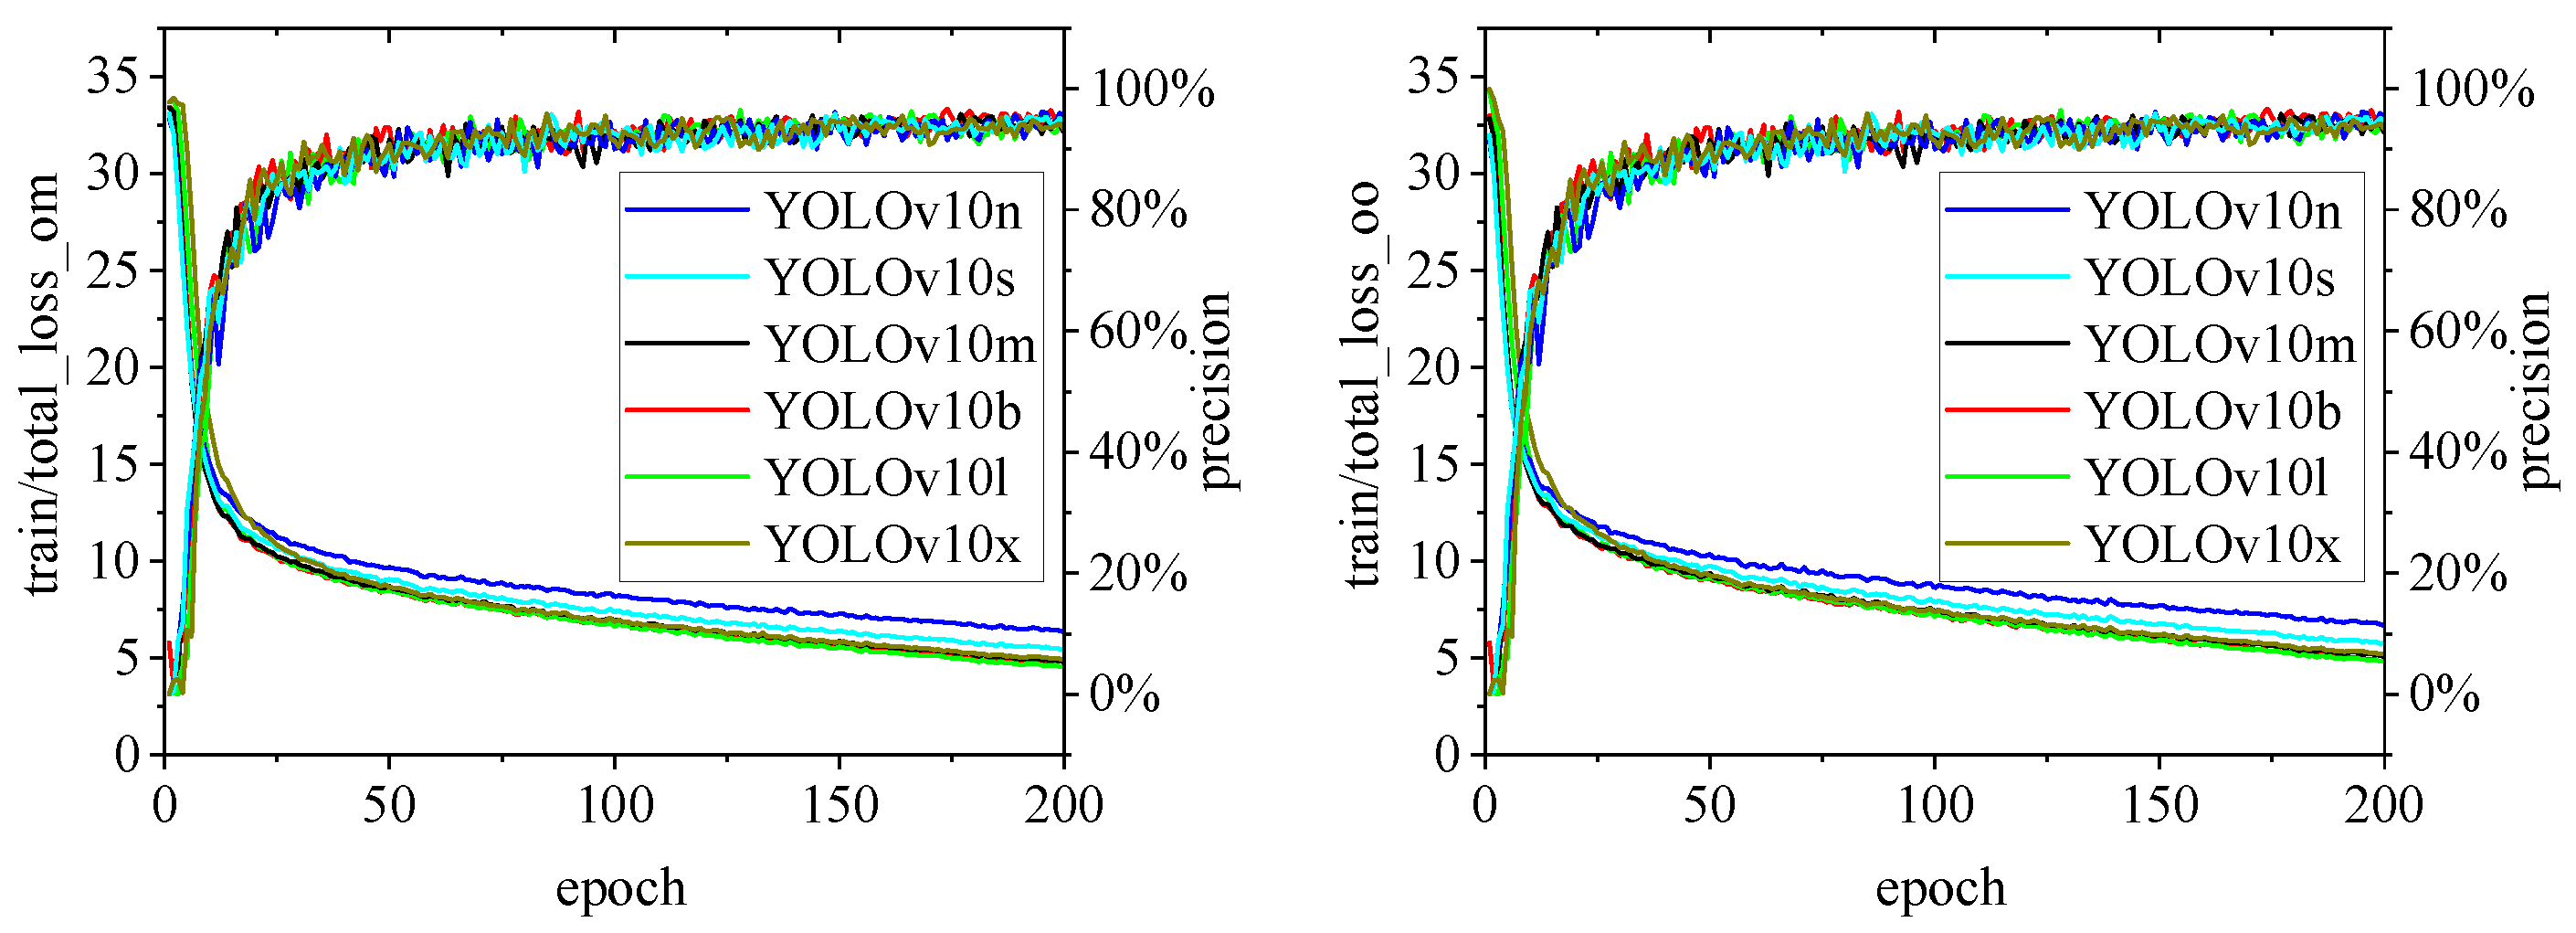
Figure 14.
Variations in loss values and precision for the YOLOv11 pig ear detection model.
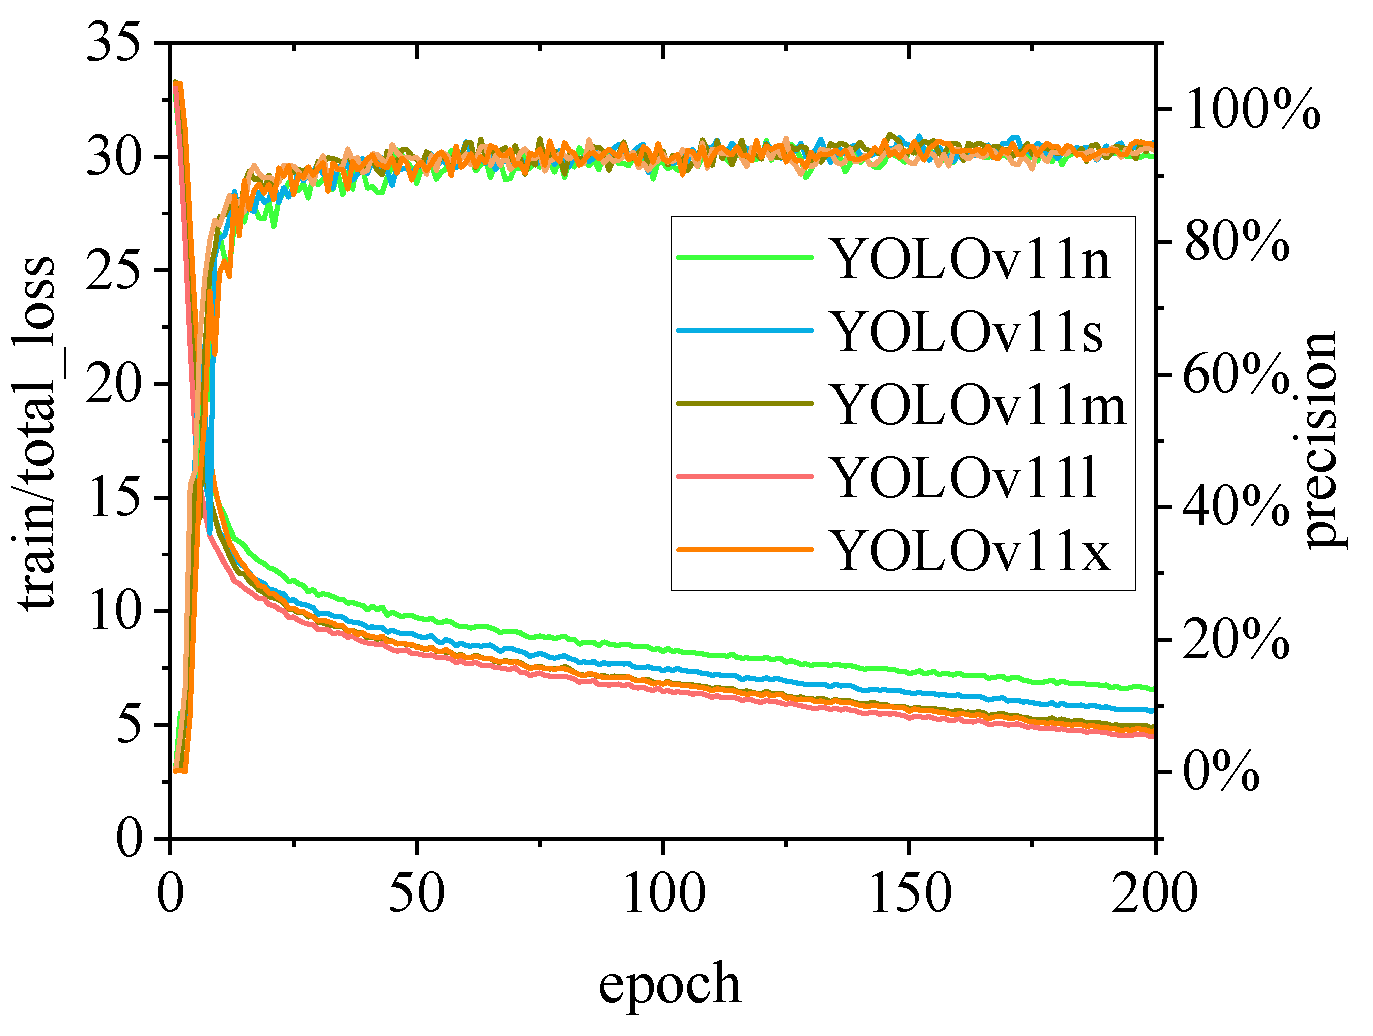

Table 1.
Specifications of Experimental Apparatus.
| Device No. | Category | Description |
|---|---|---|
| 1 Health Inspection Robot | Navigation Mode | Manual/Automatic Magnetic Navigation |
| Cruise Speed | Ten-level speed adjustment: 3–30 m/min | |
| Control System | Industrial PC, Windows 10 x64, WiFi+4G connectivity | |
| Lifting Device Dimensions | 820 mm × 600 mm × [adjustable height: 514–2519 mm] | |
| 2 Infrared Thermal Imager | Camera Manufacturer | FLIR Systems |
| Camera Model | FLIR A300 9Hz | |
| Resolution | 320 × 240 pixels | |
| Field of View (FOV) | Expanded from 25° to 90° |
Table 2.
Comparison of Pig Ear Detection Models by Series.
| Model | Developer | Release Year | Backbone Highlights | Neck Highlights | Head Highlights |
|---|---|---|---|---|---|
| YOLOV5 | Ultralytics | 2020 | C3 module, SPPF module | FPN;PAN | Coupled-Head; Anchor-based |
| YOLOv6 | Meituan | 2022 | RepVGG or CSPStackRep. | Rep-PAN | Decoupled-Head; Anchor-Free |
| YOLOV7 | Chien-Yao Wang et al. | 2022 | E-ELAN | E-ELAN | Auxiliary head; Anchor-Base |
| YOLOv8 | Ultralytics | 2023 | C2f | PAFPN | Decoupled-Head; Anchor-Free |
| RT-DETR | Baidu | 2023 | Backbone | Hybrid encoder | Decoder |
| YOLOv9 | Chien-Yao Wang et al. | 2024 | PGI | GELAN | Decoupled-Head; Anchor-free |
| YOLOv10 | Tsinghua University | 2024 | CIB | CIB | Nms-free; Anchor-free |
| YOLOv11 | Ultralytics | 2024 | C3k2, C2PSA | C3k2 | Decoupled-Head; Anchor-Free |
* YOLOV5 utilizes the C3 module, which leverages Cross Stage Partial (CSP) architecture [16], and the SPPF module based on Spatial Pyramid Pooling (SPP) [17]. It also incorporates the FPN structure (Feature Pyramid Network, [18]) and the PAN structure (Path Aggregation Network, [19]). YOLOV6 includes RepVGG [20] and CSPStackRep, built on the CSP framework [16], while the Rep-PAN component integrates RepVGG and CSP modules. It also features a Decoupled-Head [21] and Anchor-Free design [22]. YOLOV7 introduces E-ELAN (Extended Efficient Layer Aggregation Networks), which builds on ELAN [23] concepts, and RepConvN based on RepConv [20]. YOLOV9 incorporates PGI (Programmable Gradient Information), consisting of a main branch, auxiliary reversible branch, and multi-level auxiliary information, while GELAN (Generalized Efficient Layer Aggregation Network) combines elements from YOLOV5’s C3 module and YOLOV8’s C2f module. Finally, YOLOV10 employs CIB (Compact Inverted Block).
Table 3.
TIRPigEar Dataset Information.
| Subject | Dataset of thermal infrared images of pigs. |
| Field | Deep learning-based object detection, pig ear recognition, temperature monitoring, health analysis. |
| Data Format | Thermal infrared images, “.xml” labeled data, “.txt” annotated data, “.json” annotated data. |
| Data Type | Thermal infrared image. |
| Data Collection | Thermal infrared images were collected using a pig health inspection robot equipped with infrared thermal imaging in a swine farm. The image resolution is 320x240, with a total of 23,189 images and a compressed dataset size of 7.71 GB. |
| Collection Location | Country: China; City: Mianyang, Sichuan; Institution: TQLS Guanghui Core Breeding Farm. |
| Data Accessibility |
Repository: TIRPigEar Direct URL: https://github.com/maweihong/TIRPigEar |
Table 4.
Comprison test results of different models.
| Subject | Model Size (MB) |
Parameters (M) |
Computation (GFLOPs) |
Precision (%) |
Recall (%) |
mAP50 (%) |
|---|---|---|---|---|---|---|
| RT-DETR-l | 66.2 | 32.0 | 103.4 | 92.8 | 94.7 | 98.2 |
| RT-DETR-ResNet50 | 86.0 | 41.9 | 125.6 | 93.5 | 95.5 | 97.9 |
| RT-DETR-ResNet101 | 124.2 | 60.9 | 186.2 | 92.6 | 94.6 | 97.8 |
| RT-DETR-x | 135.4 | 65.5 | 222.5 | 94.0 | 94.9 | 97.6 |
| YOLOv5n | 3.9 | 1.8 | 4.1 | 95.4 | 95.9 | 98.2 |
| YOLOv5s | 14.4 | 7.0 | 15.8 | 94.5 | 96.3 | 98.2 |
| YOLOv5m | 42.2 | 20.6 | 47.9 | 93.3 | 96.6 | 98.4 |
| YOLOv5l | 92.8 | 46.1 | 107.6 | 94.7 | 96.6 | 98.3 |
| YOLOv5x | 173.1 | 86.2 | 203.8 | 94.5 | 96.1 | 98.2 |
| YOLOv6n | 9.95 | 4.7 | 11.4 | 75.0 | 78.4 | 96.6 |
| YOLOv6s | 38.7 | 18.5 | 45.3 | 78.0 | 97.5 | 80.5 |
| YOLOv6m | 72.5 | 34.9 | 85.8 | 77.7 | 97.3 | 80.8 |
| YOLOv6l | 114 | 59.6 | 150.7 | 79.8 | 97.6 | 82.8 |
| YOLOv7-tiny | 12.3 | 6.0 | 13.0 | 95.8 | 95.1 | 95.0 |
| YOLOv7 | 74.8 | 36.5 | 103.2 | 94.8 | 95.3 | 95.9 |
| YOLOv7x | 142.1 | 70.8 | 188.0 | 92.9 | 96.5 | 96.2 |
| YOLOv8n | 6.3 | 3.0 | 8.2 | 92.3 | 93.6 | 97.7 |
| YOLOv8s | 22.5 | 11.1 | 28.6 | 94.8 | 95.4 | 97. 8 |
| YOLOv8m | 52.1 | 25.8 | 78.9 | 91.4 | 96.6 | 97.6 |
| YOLOv8l | 87.7 | 43.6 | 165.2 | 92.3 | 96.6 | 98.1 |
| YOLOv8x | 136.7 | 68.1 | 257.8 | 91.9 | 97.5 | 98.0 |
| YOLOv9t | 6.1 | 2.6 | 10.7 | 90.2 | 96.7 | 98.0 |
| YOLOv9s | 20.3 | 9.6 | 38.7 | 92.2 | 97.8 | 98.5 |
| YOLOv9m | 66.2 | 32.6 | 130.7 | 92.8 | 98.1 | 98.6 |
| YOLOv9c | 102.8 | 50.7 | 236.6 | 95.0 | 96.1 | 98.0 |
| YOLOv9e | 140.0 | 68.5 | 240.7 | 97.0 | 95.6 | 98.6 |
| YOLOv10n | 5.8 | 2.7 | 8.2 | 93.5 | 94.6 | 98.1 |
| YOLOv10s | 16.6 | 8.0 | 24.4 | 93.7 | 95.0 | 98.0 |
| YOLOv10m | 33.5 | 16.5 | 63.4 | 92.4 | 95.3 | 98.0 |
| YOLOv10b | 41.5 | 20.4 | 97.9 | 94.3 | 93. 4 | 98.2 |
| YOLOv10l | 52.2 | 25.7 | 126.3 | 93.6 | 93.7 | 98.2 |
| YOLOv10x | 64.1 | 31.6 | 169.8 | 93.4 | 95.6 | 98.3 |
| YOLOv11n | 5.5 | 2.6 | 6.3 | 93.8 | 96.6 | 97. 7 |
| YOLOv11s | 19.2 | 9.4 | 21.5 | 94.6 | 95.4 | 98.2 |
| YOLOv11m | 40.5 | 20.0 | 68.0 | 94.9 | 95.3 | 98.1 |
| YOLOv11l | 51.2 | 25.3 | 86.6 | 92.7 | 96.3 | 98.0 |
| YOLOv11x | 114.4 | 56.8 | 194.4 | 92.6 | 97.6 | 98.4 |
Disclaimer/Publisher’s Note: The statements, opinions and data contained in all publications are solely those of the individual author(s) and contributor(s) and not of MDPI and/or the editor(s). MDPI and/or the editor(s) disclaim responsibility for any injury to people or property resulting from any ideas, methods, instructions or products referred to in the content. |
© 2024 by the authors. Licensee MDPI, Basel, Switzerland. This article is an open access article distributed under the terms and conditions of the Creative Commons Attribution (CC BY) license (http://creativecommons.org/licenses/by/4.0/).
Copyright: This open access article is published under a Creative Commons CC BY 4.0 license, which permit the free download, distribution, and reuse, provided that the author and preprint are cited in any reuse.


