
Submitted:
20 July 2023
Posted:
21 July 2023
You are already at the latest version
Abstract
The utilization of Pig Emotion Recognition (PER) driven by Artificial Intelligence (AI) promises to mitigate labor costs and alleviate stress among domestic pigs, thereby minimizing the need for consistent human intervention. Nevertheless, this research acknowledges the inherent limitations within the raw PER datasets, which often include irrelevant porcine features, hence impeding genuine progress in real-world evaluations. A significant proportion of PER datasets derive from sequential pig imagery obtained from video recordings, and a common pitfall in these studies is the unregulated shuffling of data. This lack of control can result in the overlap of data samples between training and testing groups, thereby yielding skewed experimental evaluations. To address these challenges, this paper introduces a novel solution in the form of the Semi-Shuffle-Pig Detector (SSPD) for PER datasets, with the intent to facilitate a less biased experimental output. By applying the SSPD, we can ensure that all testing data samples remain distinct from the training datasets, and any superfluous information from raw images is systematically discarded. This optimized method enhances the true performance of classification, providing unbiased experimental evaluations. Notably, our approach has led to a remarkable improvement in the Isolation After Feeding (IAF) metric by 20.2\% and achieved higher accuracy in segregating IAF and Paired After Feeding (PAF) classifications exceeding 92\%. This methodology, thereby, ensures the preservation of pertinent data within the PER system and eliminates potential biases in experimental evaluations. Consequently, it elevates the accuracy and reliability of real-world PER applications, resulting in a tangible positive impact on both pig welfare management and food safety standards.
Keywords:
Pig emotion recognition (PER)
; convolution neural network (CNN)
; Xception
; ResNet
; deep neural network
; domestic livestock
; pigs
1. Introduction
Pork occupies a significant niche in the global diet, with countless swine bred annually as per the United States Department of Agriculture (USDA). An omnipresent research topic in the meat industry is pig welfare, which often comes with the onus of a considerable human workforce due to the exhaustive nature of monitoring welfare conditions [1]. However, the prevalent demand for enhanced pork productivity and quality underscores the need for a shift in traditional practices [2] [3].
Our paramount goal revolves around amplifying the accuracy of emotion recognition in pigs - a pursuit carrying significant implications for animal welfare through early stress detection and preventive measures. In response to this pressing need, the advent of the Pig Emotion Recognition (PER) system, leveraging cutting-edge deep learning algorithms and neural networks, heralds a transformative era in animal husbandry. The PER system serves as a viable and scalable alternative for the farming industry, capable of detecting pig emotions without the need for human observers [4]. Its integration in livestock management could significantly reduce workforce expenses and time, while outperforming human efficiency in terms of accuracy.
Breakthroughs in deep neural networks, such as Visual Geometry Group (VGG) [5], Inception [6], ResNet [7], MobileNet [8], and Xception [9], have spurred dramatic advancements in sectors like healthcare and traffic infrastructure [10] [11]. Now, these formidable convolution neural networks (CNNs) are set to revolutionize automated agricultural machinery, overcoming the pitfalls of traditional methods, such as laborious tasks and subjective judgments [12]. Prior research on facial emotion recognition accentuates the essential role of substantial, well-preprocessed datasets for optimized performance, even with the most advanced architectures [13] [15] [16].
However, the journey to a robust PER system requires a hefty investment of time and effort to collate high-quality data samples. Collaboration between deep learning scientists and agricultural research institutes often lies at the core of this data collection process. To sculpt a reliable and efficient PER system, both an exhaustive dataset and a top-tier deep neural network are crucial. The acquisition of a PER dataset is an indispensable first step, followed by its meticulous management for training avant-garde neural networks, thus elevating the PER system’s performance and accuracy. Furthermore, most datasets are extremely unbalanced. obtaining a balanced PER dataset is rare, and removing some data samples from the major group of classification could waste the potential trainable data samples.
A thorough dataset analysis necessitates the elimination of superfluous video frames, background pixels, and unrelated subjects to maximize neural network performance. It is vital to navigate the challenges of sequential images, which may identically display due to limited animal mobility in confined spaces. Random shuffling of the dataset between training and testing groups can be a pitfall, leading to skewed experimental results and unreliable classification in real-world scenarios. By addressing these insights and optimizing content for search engines, the potential impact of deep neural networks on large-scale livestock management crystallizes, marking a shift towards more efficient and reliable agricultural solutions [13].
Pig datasets obtained from animal experimental facilities, industrial pig farming facilities, and academic research institutions often comprise unprocessed video clips with features irrelevant to pig emotions. Moreover, these samples typically do not present the pig in an unoccupied space, given their limited mobility. Our unique contribution lies in the strategic application of methods to a PER dataset, particularly in the context of sequentially generated images from video clips. This partitioning application is especially challenging due to the sequential data nature, but our semi-shuffle method provides an effective antidote. Though shuffling sequential images and dividing them into training and testing groups can adequately train and test the PER model, the pre-trained PER model might falter in real-life scenarios due to shared training and testing dataset samples. This paper underscores the need for a partition that the model has yet to encounter, better simulating real-world deployment scenarios. The cross-validation is the method to resample the data samples for training or testing datasets [14]. It is an applicable tool to check if the accuracy is misrepresenting in practical performance. However, randomly shuffling the time-sequential captured images can still render almost perfect performance. Some shuffled images share the training and testing data group and cause biased interpretation.
To mitigate this issue, we propose the Semi-Shuffling and Pig Detector (SSPD)-PER dataset, intended to produce less biased experimental results. Our pioneering contributions to these preprocessing techniques encompass:
- The SSPD-PER addresses sequentially generated images from video clips and prevents testing sample sharing with the PER model during training, thereby enhancing objective evaluation.
- The SSPD-PER discards a significant number of irrelevant pixels before training the Xception model, allowing focus on the pig region in an image and training the PER model with only pertinent information.
- The Xception architecture, known for its lightweight design and competitive results, can be trained with the SSPD-PER dataset, potentially outperforming existing simple-CNN architectures [13].
Implementing the SSPD-PER resulted in improved accuracy in the isolation-after-feeding class and revealed the true f1-score, indicating the need for further dataset classification management. Collectively, our proposed preprocessing techniques, coupled with the Xception architecture, pave the path for a more accurate and reliable PER model in real-world applications.
The rest of the paper is organized as follows. Section 2 compares with other pig-related approaches. Section 3 explains our proposed preprocessing techniques by semi-shuffling techniques and pig detector before training the Xception architecture. Section 4 has the experimental results. Section 5 shows discussion. Finally, Section 6 summarizes our proposed methods.
2. Related Work
A notable body of research within the realm of pig welfare underscores the confluence of various aspects such as pig weight, pig tag number identification, symptoms of stress, and social status. Such contributions offer a vantage point into the wellbeing of pigs, serving as a cornerstone in improving their living conditions. Critical engagement with these research findings propels the discourse on pig welfare, enabling a better understanding of the emotional states of these animals, an underappreciated yet pivotal area of study.
Recent work elucidates the nuanced interplay of social dynamics among pigs, spotlighting the quintessential role of comprehending these interactions in gauging overall pig welfare [17]. Discomfort and stress are immediate by-products of surgical procedures, notably the castration of male pigs, demanding immediate attention for welfare improvement [18] [19]. With a pivot towards technology, implantable telemetric devices have emerged as instrumental tools to monitor pig emotions by tracking heart rate, blood pressure, and receptor variation [20]. The increasing attention animal and agricultural scientists devote to understanding animal emotional expressions continues to gain momentum. The research conducted by Lezama Garcia et al. [21] underscores the relationship between facial expressions, combined poses, and the welfare of domestic animals such as pigs. Close inspection of animal facial expressions and body poses can furnish invaluable insights into their emotional states, thereby enhancing post-surgical treatment and food safety standards. Building on this premise, innovative technologies like convolutional neural networks (CNNs) and machine learning algorithms have been employed to detect pig curvature and estimate pig weight and emotional valence [22]. Additionally, advanced architectures such as the ResNet 50 neural network and CNN-LSTM have been applied to detect and track pigs, measure the valence of emotional situations in pigs through vocal frequency, and sequentially monitor and detect aggressive behaviors in pigs. [23] Neethirajan [24] highlighted that postures of eyes, ears, and snout could help determine negative emotions in pigs using YOLO architectures combined with RCNN. Briefer et al. [25] employed high and low frequencies to identify negative and positive valence in pigs, using a ResNet 50 neural network, which includes CNNs. Hansen et al. [26] showed that frontal images display the eyelid region, and heat maps provide a deep convolutional neural network to determine if pig stress levels are increasing, thereby degrading overall pig welfare.
Hakansson et al. [27] utilized CNN-LSTM to sequentially monitor and detect aggressive pig behaviors, such as biting, allowing farmers to intervene before the situation worsens. Imfeld-Mueller et al. [28] measured the high vocal frequency to measure the valence of emotional situation for pigs. Capuani et al. [29] and applied a CNN with a extreme randomized tree (ERT) classifier to discern positive and negative emotions in swine vocalization through machine learning. Wang et al. [30] employed a lightweight CNN-based model for early warning in sow oestrus sound monitoring. Ocepek et al.[31] used the YOLOv4 model, while Xu et al. [32] applied ResNet 50 for pig face recognition. Ocepek et al. also applied the Mask R-CNN to remove irrelevant segments from pig images. However, the pre-trained mask R-CNN does not include the pig’s classification, and the authors only trained with 533 "pig-like" images and tested with 50 "pig-like" testing samples. Their approach is unreliable for extracting the pig segmentation as Megadetector v3, which is trained with millions of trainable samples. Removing all irrelevant pixels is the key to standardizing our PER dataset, as our trainable model primarily focuses on the relevant information. Removing the complete all extraneous information may improve the accuracy further. However, our methods significantly reduce a massive portion of extraneous pixels before entering the model’s training procedure. The extraneous pixels account for more than 80% of an image. Without using the Megadetector, the huge portion of extraneous pixels will cause the model mainly focus on extraneous information and misrepresent the performance in the end. The small portion of the extraneous pixels will not affect the model performance significantly.
Concurrent advancements, such as the application of the YOLOv4 model and Mask R-CNN, have revolutionized pig face recognition and image processing. Notwithstanding, the pre-trained Mask R-CNN, when tested under certain conditions, failed to include pig classification, thereby rendering the approach unreliable for extracting pig segmentation. Removing the remained extraneous information completely may improve the accuracy further. However, our methods significantly reduce huge portion of extraneous pixels before entering the model’s training process. Ahn et al. [33] exploited the tiny YOLOv4 model to view pigs from a top-view camera. Low et al. [34] tested CNN-LSTM with a ResNet50 back-boned model for full-body pig detection from a top-view camera. Colaco et al. [35] [36] used the PER dataset containing thermal images, instead of colored or gray-scaled images, and trained their proposed depth-wise separable designed architecture. These studies demonstrate the wide array of techniques employed in pig emotion recognition, emphasizing the importance of understanding and monitoring pig welfare.
By harnessing an array of techniques in pig emotion recognition, we witness the burgeoning importance of understanding and monitoring pig welfare. In recent years, researchers have charted impressive progress in improving pig welfare conditions. Central to these strides are in-depth studies focusing on pig facial expressions, body poses, social relationships, and feeding intervals. Our proposed recognition system seeks to continue this trend, aiming to improve pig welfare through accurate recognition and monitoring of pig emotions. This endeavor draws on diverse methodologies and architectures gleaned from the extant literature. Key among these considerations is the impact of feeding intervals and the manipulation behavior of pen mates on pig behavior [17,21,22,23,24,25,27,31,35,36]. Restrictive feeding can lead to increased aggression in pigs, resulting in antagonistic social behavior when interacting with other pigs. To develop solutions and animal welfare monitoring platforms that address aggression and tail biting, it is essential to understand the impact of feeding intervals and manipulation behavior of pen mates. Abnormal behavior in pigs may be attributed to the redirection of the pig’s exploitative behavior, such as the ability to interact with pen mates when grouped or kept in isolation.By comprehending the effects of feeding intervals and access to socializing conditions on pig behavior, we propose four specific treatments: isolation after feeding (IAF), isolation before feeding (IBF), paired after feeding (PAF), and paired before feeding (PBF). These treatments are designed to spotlight how different feeding and socializing conditions shape pigs’ emotions and behavior. By unraveling the intricacies of pig behavior under varied conditions, we aim to enable researchers and farmers to cultivate optimal environments that uphold pig welfare and mitigate negative emotional experiences. This pursuit underscores the importance of continued research and engagement with innovative technologies in the sphere of pig welfare.
3. SSPD-PER System
From Figure 1, PER dataset contain a collection of images or video clips used for recognizing and categorizing pig emotions. SSPD-PER consists of a video-to-frame converter, semi-shuffling split, pig detector, and PER system for emotion classification. The video-to-frame converter converts all given video clips into images, and the frame rate is 10 frames per 1 second. The semi-shuffle means shuffling the training and validating groups, but the testing data group shall not be mixed with the training nor validating data groups. The pig detector finds the pig in the image and removes irrelevant images. The PER system contains a deep neural network that classifies the pig’s emotions after the training. With these major component, the SSPD-PER generates the appropriate evaluation from all sequentially captured images from video clip.
3.1. PER Dataset
The video clips of the PER dataset was recorded in the Department of Animal Sciences, Wageningen University and Research, Netherlands. The PER dataset is generated by recording video clips of pigs in various environments and situations. These classifications can indirectly interpret the pig’s emotions as the most positive and negative emotional states. To illustrate, IBF is considered the most stressed emotion state, while PAF is the most positive emotion. Each classification is related to pig emotion indirectly, as these labels are usually determined based on a combination of factors, including pig behaviors, physiological markers, and sometimes environmental conditions. The PER dataset is used to train machine learning models, as the Xception model, to recognize and classify pig emotions based on visual input.
The PER dataset consists of IAF, IBF, PAF, and PBF. The IAF has 153 video clips containing two images, and the IBF has 59 clips. The PAF has 94 video clips, including one pig photo, and the PBF includes 24 video clips. All the video clips display the pig’s behavior from 45 degrees of side and top view. Each clip’s length ranges from 1 second to 8 minutes. The video’s resolution size varies from 620 pixels to 1,920 pixels. Neethirajan’s team previously labeled the 4 classifications. The isolation and pair are visually distinguishable, but after and before feeding classifications are visually indistinguishable. The total size of the video clips is 332 GB, while our computer hardware capacity is 1 TB.
The PER dataset from Figure 2 displays how the generated images from video clips are similar to neighboring images. If an image is similar to a neighboring image, the structural similarity index measure’s (SSIM) value displays a value more than 0.8, which is 80% similarity. But, when the two images are different, the SSIM value displays as 0.1442, which is 14.42%. Figure 2 demonstrates how general images are mostly similar to next images from video clips. Almost all neighboring images are similar and will generate more than 80% of the SSIM’s value. The SSIM can remove neighboring images when two images are similar to each other. However, our PER dataset has the nature of sequential images, and SSIM removes a vast majority of trainable images. Besides, even after applying the SSIM, the fully-shuffling method still mixes with groups of trainable and testing data samples, and the model still generates biased experimental results. Therefore, semi-shuffling the PER dataset is necessary to test with completely different testing images from training samples.
3.2. SSPD-PER: Semi-Shuffling System
Shuffling and splitting data samples between training and validating groups is commonly conducted unless the obtained dataset is already divided into train and test groups. The shuffling method randomly mixes the images before splitting them into training and testing data groups depending on the split ratio percentage and initial random seed. As our initial data set does not explicitly separate the training and testing datasets, we initially split them into a 90 to 10 ratio. The split ratio of 90 to 10 potentially boosts the accuracy due to a lack of testing samples to evaluate. Increasing up to 30% of the testing samples’ split ratio can have more testing samples and can assess the generalization of the overall PER dataset to have a less biased evaluation. Thus, we split them into 70 to 30 percent to examine the pre-trained PER model’s robustness after generating experimental results with the 90 to 10 percent ratio.
From Figure 3, the fully-shuffled technique means randomly mixing the data samples within the training, validating, and testing datasets. However, sharing the training and validating data samples with the testing data group can produce biased results. Since a pig often does not move in a pen, the generated images are almost identical to neighboring pictures when the video clip is converted into sequential photos. Some images from the testing dataset are almost identical to data samples from training and validating data groups. Enabling fully-shuffling data samples in training, validating, and testing datasets produce a biased experimental evaluation. The pre-trained PER model is already familiar with testing images and performs well on them, a part of the training data samples. In contrast, the model’s performance can be degraded with completely different data samples from the training dataset.
To prevent sharing the testing data samples with the PER model, the semi-shuffling from Figure 4 initially does not mix with training and testing data groups but is only divided into training and testing data groups. Then, the data samples from the training data group were split into training and validation groups with random shuffling. Thus, the semi-shuffling method produces an unbiased experimental result from testing, as the pre-trained PER model is unfamiliar with the images from the testing dataset.
3.3. SSPD-PER: Pig Detector
From Figure 5, the pig detector searches and locates pigs before removing the irrelevant pig pixels. The pig detector is comprised of MegaDetector V3, an animal-detecting model trained with Caltech camera traps (CCT) [37], SnapShot Serengeti [38], and Idaho camera traps [39]. MegaDetector [40] is based on the structures of Inception-Resnet V2 and faster region-based convolutional neural network (RCNN) architectures. Caltech camera traps have more than 243,100 images. SnapShot Serengeti has more than 2.65 million, and Idaho camera traps have more than 1.5 million. Since these are large datasets, their combined dataset can generate the reliability of the MegaDetector model.
However, from Figure 6, the initial pig detector only searches and display the bounding box within the pig in an image rather than extracting a pig from an image. The outputs show red bounding boxes within the pig and the percentage of animal confidence. While investigating the Megadetector V3’s implementation, we see the tensor graph generated by loading the model from a local file path. The default value of the threshold of the confidence percentage is 85%. Megadetector V3 only has an animal classification. Thus, when the Megadetector V3 sees a pig in an image, it perceives the pig as an animal.
The outputs of Megadetector V3 consist of classification, bounding box coordinates, and confidence score. From Figure 7, instead of displaying bounding boxes, the percentage of confidence percentages, and animal classification, we modify and implement the Megadetector V3 system after we comprehend where the bounding box, confidence, and classification before displaying the bounding box. Once the video frames enter our pig detector system, it calls the model to generate the tensor graph, which contains the trained parameters of the pre-trained Megadetector V3 model. The Megadetector V3 model produces bounding box coordinates, confidence scores, and tagged classifications. Then, it collects the group of box coordinates, scores of confidence, and classification based on the input image. Finally, our pig detector practically crops and extracts pig parts in an image after locating pigs in a snapshot. Therefore, we modified the original Megadetector V3 and exploited the outputs for our data preprocessor as Figure 5.
3.4. SSPD-PER: PER Model
After the pig detector removes the most undesirable pixels from input images, the automated recognition classifies IAF, IBF, PAF, and PBF from preprocessed pig images. Xception architecture [9], which stands for extreme architecture, is a deep CNN architecture that was proposed by François Chollet, the creator of Keras library, in 2017. Xception is based on the principles of the Inception architecture. Still, it modifies the structure of the Inception modules based on the hypothesis that cross-channel correlations and spatial correlation can be mapped entirely separately. This idea is incorporated into Xception by using depthwise separable convolutions instead of standard convolutions, which allows for a more efficient use of model parameters. In simpler terms, Xception treats each channel in an input separately before mixing up outputs in the next layer, leading to more efficient learning. Therefore, we apply Xception, as our proposed architecture, to classify the pig’s emotions. From our previous research [13], the Xception architecture shows enhanced accuracy than VGG [5], Inception [6], and MobileNet [8]. ResNet show improved accuracy than Xception architecture, but the Xception architecture requires fewer parameters than ResNet [7]. Our loss function to train the Xception’s classifications is cross-entropy loss [41], and it is widely used for categorizing emotions from pig images. The cross-entropy loss function is expressed as
where is the error distance, the P as probability of a true label, and the as probability from the PER model’s prediction. The desired output P is generally 0 or 1, while is a real number ranging between 0 and 1. means that i is a subset of the entire classifications. Once the input x image of i class enters the PER model, the model predicts the image and produces . The summation will display the overall error distance from different classifications based on the input’s true label P and predicted label .
4. Experimental Analysis
This experimental session describes how poorly managed data samples can perfectly perform the test without representing practical evaluation. The performance may be different from raw and preprocessed data samples. The range of resized images from video clips is from pixels to pixels per image. We initially trained and tested with a sized images to reduce computation from the massive PER dataset and observe the performance. We witness that the f1-score reached 99% even though the data sample is too small to recognize the pig emotion. Then, we expanded the size of an image as pixels and increased the 10 frames per second to collect the pig emotion images as we presume richer information than . Yet, the f1-score is 98% as it is less accurate than experimental result with pixels sized images.
4.1. Experimental Conditions
From our hardware specifications, we have intel® Core(TM) i5-10600K CPU @ 4.10GHz(12 CPUs), 4.1 GHz, and our RAM size is 32 GB. Our GPU specification is NVIDIA GeForce RTX 2070 Super. We set the epoch as 150, and the batch size is 64 due to our hardware’s capacity limitation. The optimization is Adam [42] with a learning rate of , and the activation function uses as the rectified linear unit (ReLU) [43]. The L2-regularization [44] is , and the epsilon of the Adam optimizer is . The number of patience is 50 as the training session stops when validating loss does not show any improvement 50 times.
Wang et al. [45] suggested f1-score to evaluate the highly unbalanced dataset distribution that affects the conventional model’s classification test. Some model evaluations could be considered crucial for even a small number of incorrect classifications. The equations describes as follows:
where P, , , R, , and are precision, true positive, false positive, recall, false negative, and f1-score, respectively. The precision value is produced when the true positive is divided by the true positive, which is added by the false positive. The recall comes from the true positive value divided by the true positive added by the false negative.
Figure 8 displays the performance of the results after training the simple CNN or Xception architectures. The numbers after the percentage number of each tile mean how the pre-trained architecture correctly identifies testing samples. To illustrate, from Figure 8(a), when one of the tiles displays after the percentage number, the pre-trained architecture correctly identified 16277 out of 16422 testing samples. The percentage shows how the PER pre-trained model can accurately classify one single classification without mistakenly classifying the wrong pig emotions. Table 1 summarizes experimental results from Figure 8(a) to Figure 8(g)
From Figure 8(a), the simple CNN architecture is trained and tested with the unprocessed dataset without cropping. We initially resized all the images into pixels, as the original image size is too huge to train with a vast-sized PER data set. We also wished to capture the small size of the pig’s face in an image and inspect the result. The groups of training, validating, and testing datasets are fully shuffled and commenced the training and testing with unprocessed pig photos. The split ratio of training and testing was 90 to 10. As a result, the f1-score from Table 1 is 99.55%. From Figure 8(b), the simple CNN architecture is trained and tested with the unprocessed pig photos, and each image is pixels. The split ratio of training and testing is 70 to 30. All training, validating, and testing data groups are fully mixed, and the f1-score from Table 1 is 99.5021%. From Figure 8(c), we increase the 10 frames per second to expand the number of samples in the PER dataset, and the size of the input width and height of the image is expanded 224 pixels. We change from the simple CNN architecture to Xception architecture to improve the accuracy further. The PER dataset mix all samples within training, validating, and testing datasets so the Xception model can get familiar with the testing samples similar to training data samples. The f1-score shows 98.45% of from Table 1 regardless of expanding the size of PER dataset and choosing the best architecture.
We initially train and test with a pixels sized images to reduce the unnecessary computation due to the massive in the whole PER dataset. We witnessed that the f1-score reached 99% even though the data sample is too small to recognize the pig emotion. Then, we expanded the size of image as pixels and increased the 10 frames per second to collect the pig emotional images. In spite of expanding the size of a image, the f1-score is 98% and reduced from our previous experimental tests with pixels sized images. The pixels sized images has more rich information than pixels sized images and potentially improve the performance of the PER’s performance.
From Figure 8(d), after mixing the samples within training and validating datasets. On the other hand, testing data was split but not randomly mixed with pig images from the training or validating data group. We trained the Xception architecture with the semi-shuffled PER dataset. As a result, the f1-score from Table 1 has been significantly reduced to 74.21%. Therefore, we discover that the semi-shuffled PER dataset significantly affects the Xception architecture since the testing images are completely different from training and validating dataset groups. From Figure 8(e), we increased the size of the image to pixels but reduced the number of frames. We reduced the number of frames to be captured so that the neighboring images become less identical. The f1-score is still over 97.83% from Figure 8(e) and Table 1. From Figure 8(f), we disable sharing the data images from the testing dataset, so the pre-trained Xception architecture cannot be familiar with the new data samples from the testing dataset. After applying semi-shuffled on the PER dataset, the f1-score significantly reduced to 59.56% from Table 1.
From Figure 8(g), we apply semi-shuffle into the PER dataset and enable the pig detector before training the Xception architecture. The f1-score from Table 1 shows the worst performance as 15.0215%. Yet, our pre-trained Xception architecture has more correct samples than semi-shuffling without enabling a pig detector. On the other hand, the IBF and PBF results showed unsatisfactory performance, and the results from the PAF showed a minimal decrease. Some single pigs in images contain the PAF or PBF, which causes the pre-trained model is being confused. The pig detector may not perform perfectly, but it can refine the pig photos faster than manual preprocessing. Although the f1-score degrades by 84.5%, we can unveil the true performance and generate unbiased experiment evaluations, and the IAF shows 20.2% improvement from Figure 8(f) and Figure 8(g). From Figure 8(g), the IAF and PAF are 92.9% and 94.7% respectively. Thus, we can claim that the model can clearly distinguish the IAF and PAF. The PAF and PBF have two pigs in an image, while IAF and IBF have only one pig in an image. In other words, our model perceives either one or two pigs in an image and proceeds to be trained. The classifications of before and after feeding can be improved with further research. The reason for the low accuracy of Xception with IBF classification is that the after-feeding and before-feeding classifications are hardly distinguishable with human eyes.
5. Discusssion
In our study, we found that sequential shuffling of training and testing data derived from video clips may obstruct an accurate evaluation. Our experimental results elucidate the linkage between the performance of emotion classification and the refinement process within our Semi-Shuffle Pig Detector - Pig Emotion Recognition (SSPD-PER) system. While the classification of isolated and paired instances becomes more discernible, the delineation between ’after’ and ’before’ feeding remains nebulous throughout our SSPD-PER system’s process. We recognize that the classification of Isolation After Feeding (IAF), Isolation Before Feeding (IBF), Paired After Feeding (PAF), and Paired Before Feeding (PBF) does not provide a direct measure of pig emotions. However, in the existing classifications, PAF represents the most positive emotion, while IBF indicates the most negative. To advance real-time pig welfare, further research into the reliability of pig feeding conditions is indispensable.
Concerning the practical applicability of our classifier, our primary goal is to enhance the precision of emotion recognition in pigs. These advance holds substantial implications for animal welfare, facilitating the identification and mitigation of stress and distress without time constraints. Moreover, the pig husbandry industry requires production efficiency, also without time limitations. As global pork demand increases, the conventional approach of hiring additional farmworkers may not suffice to meet production goals. Hence, our research underscores the necessity of innovative solutions like ours for sustainable and humane growth.
5.1. Enhancing Objectivity: The Role of Semi-Shuffling in Reducing Bias in Experimental Outcomes
The semi-shuffling technique is a method used in machine learning and statistics to reduce bias in the results. The technique is particularly useful in situations where the data may have some inherent order or structure that could potentially introduce bias into the analysis.
Data Shuffling: In a typical machine learning process, data is often shuffled before it’s split into training and test sets. This is done to ensure that the model is not influenced by any potential order in the data. For example, if you’re working with a time series dataset and you don’t shuffle the data, your model might simply learn to predict the future based on the past, which is not what you want if you’re trying to identify underlying patterns or relationships in the data.
Semi-Shuffling: However, in some cases, completely shuffling the data might not be ideal. For example, if you’re working with time series data, completely shuffling the data would destroy the temporal relationships in the data, which could be important for your analysis. This is where the semi-shuffling technique comes in. Instead of completely shuffling the data, you only shuffle it within certain windows or blocks. This allows you to maintain the overall structure of the data while still introducing some randomness to reduce bias.
The semi-shuffling technique contributes to less biased results by ensuring that the model is not overly influenced by any potential order or structure in the data. By introducing some randomness into the data, the technique helps to ensure that the model is learning to identify true underlying patterns or relationships, rather than simply memorizing the order of the data.
It’s important to note that while the semi-shuffling technique can help to reduce bias, it’s not a silver bullet. It’s just one tool in a larger toolbox of techniques for reducing bias in machine learning and statistical analysis. Other techniques might include things like cross-validation, regularization, and feature selection, among others.
5.2. SSPD-PER Method’s Promising Impact on Pig Well-being and the Challenges of its Real-world Implementation
The SSPD-PER method is poised to significantly enhance pig welfare in real-world settings by providing a more nuanced understanding of pig emotions. In leveraging deep learning technology, the SSPD-PER can reliably detect and interpret pig emotions, thereby allowing for timely identification of distress or discomfort in pigs. This ability not only aids in improving the animals’ well-being but also aids farmers in optimizing their livestock management practices, leading to increased productivity and improved animal welfare standards.
Implementing the SSPD-PER method could serve as a revolutionary tool in early disease detection and stress management, improving the pigs’ quality of life. An accurate understanding of animal emotions could inform and influence farmers’ decisions regarding feeding times, living conditions, and social interactions among the animals, thereby enabling more humane and considerate treatment.
However, several challenges may arise during the implementation of the SSPD-PER method in field settings. Firstly, the quality of data inputs is paramount for the successful application of this method. The video footage must be clear and free of environmental noise to ensure accurate recognition of pig emotions. Achieving this quality consistently in diverse farm settings might prove challenging due to varying lighting conditions, possible obstruction of camera view, or pig movements.
Secondly, the system’s effective integration into current farm management practices may be another hurdle. Farmers and livestock managers would need training to understand the data generated by the SSPD-PER method and apply it to their day-to-day decision-making. They may need to adapt to new technology, which can take time and resources.
Lastly, there are technical considerations tied to the processing power required to run sophisticated algorithms, the requirement of stable internet connectivity for cloud-based analysis, and the potential for high initial setup costs. Addressing these challenges would be critical to making this advanced technology widely accessible and effective in enhancing pig welfare across diverse farming operations. Future research could focus on optimizing the SSPD-PER system for more seamless integration into existing farming operations and making it more accessible for different scales of farming enterprises.
5.3. Deciphering Relevance: Criteria for Eliminating Extraneous Elements in Video Data Analysis
The criteria used for determining irrelevant video frames, extraneous background pixels, and unrelated subjects in our study are based on multiple factors, primarily focused on the relevancy to pig emotion recognition.
Irrelevant Video Frames: Frames were deemed irrelevant if they did not contain any information useful for understanding pig emotions. For instance, frames where pigs are not visible, or their emotional indicators, such as facial expressions or body postures, are obstructed or not discernible were classified as irrelevant. Similarly, frames where pigs are asleep or inactive might not contribute much towards emotion recognition and thus could be categorized as irrelevant.
Extraneous Background Pixels: Pixels were deemed extraneous if they belonged to the background or objects within the environment that do not contribute to pig emotion recognition. This includes elements such as the pig pen structure, feeding apparatus, or any other non-pig related objects in the frame. The goal here is to focus the machine learning algorithm’s attention on the pigs and their emotions, minimizing noise or distraction from irrelevant elements in the environment.
Unrelated Subjects: Any object or entity within the frame that is not the pig whose emotions are being monitored is considered an unrelated subject. This could include other animals, farm personnel, or any moving or stationary object in the background that could potentially distract from or interfere with the accurate recognition of pig emotions.
The criteria for determining irrelevance in each of these cases are defined based on the specific task at hand, i.e., emotion recognition in pigs, and the unique attributes of the data, including the specific conditions of the farm environment, the pigs’ behavior, and the quality and angle of the video footage. These parameters can be fine-tuned and adapted as needed to suit different situations or requirements.
5.4. Outshining Competition: Benchmarking the Xception Architecture’s Competitive Edge in Lightweight Design
The Xception architecture, renowned for its lightweight design, has proven to be highly competitive in various applications. By leveraging depth-wise separable convolutions, Xception promotes efficiency and reduces computational complexity, enabling faster, more efficient training and deployment even on less powerful hardware.
When compared to other architectures, Xception’s unique advantages come to the fore. For example, traditional architectures like VGG and AlexNet, while powerful, are comparatively heavier, requiring more computational resources and often leading to longer training times. On the other hand, newer architectures like ResNet and Inception, while they do address some of these challenges, they may not match the efficiency and compactness offered by Xception.
Furthermore, Xception’s design fundamentally differs from other models, allowing it to capture more complex patterns. While most architectures use standard convolutions, Xception replaces them with depth-wise separable convolutions, which allows it to capture spatial and channel-wise information separately. This distinction enables Xception to model more complex interactions with fewer parameters, enhancing its performance on a wide range of tasks.
However, it’s also important to mention that the choice of architecture depends on the specific task and the available data. For tasks involving more complex data or demanding higher accuracy, more powerful, albeit resource-intensive models like EfficientNet or Vision Transformer may be more appropriate. Conversely, for tasks requiring real-time performance or deployment on edge devices, lightweight models like MobileNet or Xception would be more suitable.
Looking ahead, future research could explore hybrid models that combine the strengths of various architectures or investigate more efficient architectures using techniques like neural architecture search. In the realm of animal emotion recognition, specifically, there is much potential for experimenting with novel architectures that can capture temporal patterns in behavior, which is a crucial aspect of emotion.
5.5. Translating Theory into Practice: Unveiling the Real-World Impact and Challenges of Novel Methods in Pig Welfare Enhancement
This research is poised to fundamentally reshape the landscape of livestock welfare, specifically regarding pigs, by employing the innovative Semi-Shuffling and Pig Detector (SSPD) method within the Pig Emotion Recognition (PER) system. The practical implications are far-reaching and multidimensional.
Foremost, the enhanced accuracy in recognizing and interpreting pig emotions, enabled by the SSPD-PER method, lays a solid foundation for improved pig welfare. By more accurately interpreting pig emotions, farmers and animal welfare specialists will be able to better identify signs of distress, pain, or discomfort in pigs. This early detection and intervention can prevent chronic stress and its related health issues, leading to better physical health and quality of life for the animals.
In addition, by understanding the emotional states of pigs, we can create more harmonious living environments that cater to their emotional and social needs, thus reducing the likelihood of aggressive behavior and fostering healthier social dynamics. This not only improves the animals’ overall welfare but also potentially increases productivity within the industry, as stress and poor health can negatively impact growth and reproduction.
Implementing the SSPD-PER method does, however, present potential challenges. One such challenge is the need for substantial investment in technology, infrastructure, and training. As the SSPD-PER method employs advanced machine learning algorithms and neural networks, it requires both the hardware capable of running these systems and personnel with the necessary technical knowledge to operate and maintain them.
Furthermore, as with any AI-based system, there may be ethical considerations and regulatory requirements to be met. Transparency in how data is collected, stored, and utilized will be essential, and safeguards should be in place to ensure privacy and ethical use of the technology.
Lastly, while the SSPD-PER system has shown promise in research settings, real-world applications often present unforeseen challenges, such as environmental variations, diverse pig behaviors, and operational difficulties in larger scale farms. Continuous refinement and optimization of the SSPD-PER method will be crucial in navigating these potential issues and ensuring its successful implementation in the field. While challenges are inherent in any new technology deployment, the potential benefits to pig welfare, agricultural efficiency, and productivity offered by the SSPD-PER method merit careful consideration and exploration.
6. Conclusion
In closing, our research underscores the substantial impact of incorporating semi-shuffles and pig detection in enhancing the performance of pig emotion recognition (PER) systems, bringing the true classification capabilities into sharp relief. A cornerstone in building a resilient PER system hinge on the meticulous examination of each data sample by researchers specializing in pig behavior, ensuring that pig images are devoid of extraneous content or inaccuracies in labeling. Utilizing suboptimal strategies in handling the PER dataset can precipitate skewed outcomes, with falsely ideal performances often deceiving researchers. Despite the observed dip in performance between after-feeding and before-feeding conditions, our system showcased substantial advancements in classifying Isolation After Feeding (IAF) and Paired After Feeding (PAF) categories. These insights shed light on the arenas that necessitate further exploration and meticulous management.
Looking ahead, the adoption of these methodologies to other livestock species, such as cattle and poultry, presents an intriguing avenue for future research. It may necessitate the tailoring of our current techniques to account for unique behaviors and emotional cues specific to different animal species. Furthermore, advancements in machine learning and artificial intelligence can be leveraged to refine the PER system’s accuracy, offering potential areas of exploration in the broader field of animal emotion recognition. The cardinal aim of our experimental findings is to unveil misrepresented evaluations, thereby underscoring the indispensability of accurate preprocessing of pig related datasets. In this way, we hope to facilitate a shift in understanding, from misconceptions to a more nuanced view of the realities in animal emotion recognition research.
Author Contributions
Writing-original draft, J.H.K., A.P., S.J.C. and S.N; Writing-review & editing, S.N and D.S.H.
Funding
This work was supported by the Basic Science Research Program through the National Research Foundation of Korea (NRF) Funded by the Ministry of Education under Grant 2021R1A6A1A03043144.
Conflicts of Interest
The authors declare no conflict of interest.
References
- Kittawornrat, A.; Zimmerman, J.J. Toward a better understanding of pig behavior and pig welfare. Animal Health Research Reviews 2011, 12, 25–32. [Google Scholar] [CrossRef] [PubMed]
- Oh, S.-H.; See, M. Pork preference for consumers in China, Japan and South Korea. Asian-Australasian journal of animal sciences 2012, 25, 143. [Google Scholar] [CrossRef]
- Sinclair, M.; Fryer, C.; Phillips, C.J. The benefits of improving animal welfare from the perspective of livestock stakeholders across Asia. Animals 2019, 9, 123. [Google Scholar] [CrossRef] [PubMed]
- Zhang, L.; Gray, H.; Ye, X.; Collins, L.; Allinson, N. Automatic individual pig detection and tracking in pig farms. Sensors 2019, 19, 1188. [Google Scholar] [CrossRef] [PubMed]
- Simonyan, K.; Zisserman, A. Very deep convolutional networks for large-scale image recognition. arXiv arXiv:1409.1556, 2014.
- Szegedy, C.; Liu, W.; Jia, Y.; Sermanet, P.; Reed, S.; Anguelov, D.; Erhan, D.; Vanhoucke, V.; Rabinovich, A. In Going deeper with convolutions. In Proceedings of the IEEE conference on computer vision and pattern recognition; 2015; pp. 1–9. [Google Scholar]
- He, K.; Zhang, X.; Ren, S.; Sun, J. In Deep residual learning for image recognition. In Proceedings of the IEEE conference on computer vision and pattern recognition; 2016; pp. 770–778. [Google Scholar]
- Howard, A.G.; Zhu, M.; Chen, B.; Kalenichenko, D.; Wang, W.; Weyand, T.; Andreetto, M.; Adam, H. Mobilenets: Efficient convolutional neural networks for mobile vision applications. arXiv 2017, arXiv:1704.04861 2017. [Google Scholar]
- Chollet, F. In Xception: Deep learning with depthwise separable convolutions. In Proceedings of the IEEE conference on computer vision and pattern recognition; 2017; pp. 1251–1258. [Google Scholar]
- Miotto, R.; Wang, F.; Wang, S.; Jiang, X.; Dudley, J.T. Deep learning for healthcare: review, opportunities and challenges. Briefings in bioinformatics 2018, 19(6), 1236–1246. [Google Scholar] [CrossRef]
- Lv, Y.; Duan, Y.; Kang, W.; Li, Z.; Wang, F.-Y. Traffic flow prediction with big data: a deep learning approach. IEEE Transactions on Intelligent Transportation Systems 2014, 16(2), 865–873. [Google Scholar] [CrossRef]
- Neethirajan, S. Affective State Recognition in Livestock—Artificial Intelligence Approaches. Animals 2022, 12(6), 759. [Google Scholar] [CrossRef]
- Kim, J.H.; Poulose, A.; Han, D.S. The Extensive Usage of the Facial Image Threshing Machine for Facial Emotion Recognition Performance. Sensors 2021, 21(6), 2026. [Google Scholar] [CrossRef] [PubMed]
- Berrar, D. Cross-Validation. 2019.
- Kim, J.H.; Han, D.S. In Data Augmentation & Merging Dataset for Facial Emotion Recognition. In Proceedings of the Symposium of the 1st Korea Artificial Intelligence Conference, Jeju, Korea; 2020; pp. 12–16. [Google Scholar]
- Kim, J.H.; Poulose, A.; Han, D.S. In Facial Image Threshing Machine for Collecting Facial Emotion Recognition Dataset. In Proceedings of the Symposium of the Korean Institute of communications and Information Sciences (KICS) Fall Conference; 2020; pp. 67–68. [Google Scholar]
- Wutke, M.; Heinrich, F.; Das, P.P.; Lange, A.; Gentz, M.; Traulsen, I.; Warns, F.K.; Schmitt, A.O.; Gültas, M. Detecting Animal Contacts—A Deep Learning-Based Pig Detection and Tracking Approach for the Quantification of Social Contacts. Sensors 2021, 21(22), 7512. [Google Scholar] [CrossRef] [PubMed]
- Mota-Rojas, D.; Orihuela, A.; Martínez-Burnes, J.; Gómez, J.; Mora-Medina, P.; Alavez, B.; Ramírez, L.; González-Lozano, M. Neurological modulation of facial expressions in pigs and implications for production. Journal of Animal Behaviour and Biometeorology 2020, 8(4), 232–243. [Google Scholar] [CrossRef]
- Di Giminiani, P.; Brierley, V.L.; Scollo, A.; Gottardo, F.; Malcolm, E.M.; Edwards, S.A.; Leach, M.C. The assessment of facial expressions in piglets undergoing tail docking and castration: toward the development of the piglet grimace scale. Frontiers in veterinary science 2016, 3, 100. [Google Scholar] [CrossRef] [PubMed]
- Krause, A.; Puppe, B.; Langbein, J. Coping style modifies general and affective autonomic reactions of domestic pigs in different behavioral contexts. Frontiers in behavioral neuroscience 2017, 11, 103. [Google Scholar] [CrossRef] [PubMed]
- Lezama-García, K.; Orihuela, A.; Olmos-Hernández, A.; Reyes-Long, S.; Mota-Rojas, D. Facial expressions and emotions in domestic animals. CABI Reviews 2019, (2019), 1–12. [Google Scholar] [CrossRef]
- Jun, K.; Kim, S.J.; Ji, H.W. Estimating pig weights from images without constraint on posture and illumination. Computers and Electronics in Agriculture 2018, 153, 169–176. [Google Scholar] [CrossRef]
- Zhang, L.; Gray, H.; Ye, X.; Collins, L.; Allinson, N. Automatic individual pig detection and tracking in pig farms. Sensors 2019, 19(5), 1188. [Google Scholar] [CrossRef]
- Neethirajan, S. Happy cow or thinking pig? Wur wolf—facial coding platform for measuring emotions in farm animals. AI 2021, 2(3), 342–354. [Google Scholar] [CrossRef]
- Briefer, E.F.; Sypherd, C.C.-R.; Linhart, P.; Leliveld, L.M.; Padilla de la Torre, M.; Read, E.R.; Guérin, C.; Deiss, V.; Monestier, C.; Rasmussen, J.H. Classification of pig calls produced from birth to slaughter according to their emotional valence and context of production. Scientific Reports 2022, 12(1), 3409. [Google Scholar] [CrossRef] [PubMed]
- Hansen, M.F.; Baxter, E.M.; Rutherford, K.M.; Futro, A.; Smith, M.L.; Smith, L.N. Towards Facial Expression Recognition for On-Farm Welfare Assessment in Pigs. Agriculture 2021, 11(9), 847. [Google Scholar] [CrossRef]
- Hakansson, F.; Jensen, D.B. Automatic monitoring and detection of tail-biting behavior in groups of pigs using video-based deep learning methods. Frontiers in Veterinary Science 2022, 9. [Google Scholar] [CrossRef] [PubMed]
- Imfeld-Mueller, S.; Van Wezemael, L.; Stauffacher, M.; Gygax, L.; Hillmann, E. Do pigs distinguish between situations of different emotional valences during anticipation? Applied Animal Behaviour Science 2011, 131((3-4)), 86–93. [Google Scholar] [CrossRef]
- Capuani, F.M. Discerning Positive And Negative Emotions In Swine Vocalisations Through Machine Learning. Tilburg University.
- Wang, Y.; Li, S.; Zhang, H.; Liu, T. A lightweight CNN-based model for early warning in sow oestrus sound monitoring. Ecological Informatics 2022, 72, 101863. [Google Scholar] [CrossRef]
- Ocepek, M.; Žnidar, A.; Lavrič, M.; Škorjanc, D.; Andersen, I.L. DigiPig: First developments of an automated monitoring system for body, head and tail detection in intensive pig farming. Agriculture 2021, 12(1), 2. [Google Scholar] [CrossRef]
- Xu, S.; He, Q.; Tao, S.; Chen, H.; Chai, Y.; Zheng, W. Pig Face Recognition Based on Trapezoid Normalized Pixel Difference Feature and Trimmed Mean Attention Mechanism. IEEE Transactions on Instrumentation and Measurement 2022. [CrossRef]
- Son, S.; Ahn, H.; Baek, H.; Yu, S.; Suh, Y.; Lee, S.; Chung, Y.; Park, D. StaticPigDet: Accuracy Improvement of Static Camera-Based Pig Monitoring Using Background and Facility Information. Sensors 2022, 22(21), 8315. [Google Scholar] [CrossRef] [PubMed]
- Low, B.E.; Cho, Y.; Lee, B.; Yi, M.Y. Playing Behavior Classification of Group-Housed Pigs Using a Deep CNN-LSTM Network. Sustainability 2022, 14(23), 16181. [Google Scholar] [CrossRef]
- Colaco, S.J.; Kim, J.H.; Poulose, A.; Neethirajan, S.; Han, D.S. DISubNet: Depthwise Separable Inception Subnetwork for Pig Treatment Classification Using Thermal Data. Animals 2023, 13(7), 1184. [Google Scholar] [CrossRef] [PubMed]
- Colaco, S.J.; Kim, J.H.; Poulose, A.; Van, Z.S.; Neethirajan, S.; Han, D.S. In Pig Treatment Classification on Thermal Image Data using Deep Learning. In Proceedings of the 2022 Thirteenth International Conference on Ubiquitous and Future Networks (ICUFN); IEEE, 2022; pp. 8–11. [Google Scholar]
- Beery, S.; Van Horn, G.; Perona, P. In Recognition in terra incognita. In Proceedings of the European conference on computer vision (ECCV); 2018; pp. 456–473. [Google Scholar]
- Swanson, A.; Kosmala, M.; Lintott, C.; Simpson, R.; Smith, A.; Packer, C. Snapshot Serengeti, high-frequency annotated camera trap images of 40 mammalian species in an African savanna. Scientific data 2015, 2(1), 1–14. [Google Scholar] [CrossRef]
- Jacobs, C.E.; Ausband, D.E. An evaluation of camera trap performance–What are we missing and does deployment height matter? Remote Sensing in Ecology and Conservation 2018, 4(4), 352–360. [Google Scholar] [CrossRef]
- Beery, S.; Morris, D.; Yang, S. Efficient pipeline for camera trap image review. arXiv 2019, arXiv:1907.06772 2019. [Google Scholar]
- Bruch, S.; Wang, X.; Bendersky, M.; Najork, M. In An analysis of the softmax cross entropy loss for learning-to-rank with binary relevance. In Proceedings of the 2019 ACM SIGIR International Conference on Theory of Information Retrieval; 2019; pp. 75–78. [Google Scholar]
- Kingma, D.P.; Ba, J. Adam: A method for stochastic optimization. arXiv 2014, arXiv:1412.6980 2014. [Google Scholar]
- Agarap, A.F. Deep learning using rectified linear units (relu). arXiv 2018, arXiv:1803.08375 2018. [Google Scholar]
- Van Laarhoven, T. L2 regularization versus batch and weight normalization. arXiv 2017, arXiv:1706.05350, 2017. [Google Scholar]
- Wang, R.; Li, J. In Bayes test of precision, recall, and f1 measure for comparison of two natural language processing models. In Proceedings of the 57th Annual Meeting of the Association for Computational Linguistics; 2019; pp. 4135–4145. [Google Scholar]
Figure 1.
Proposed PER approach.
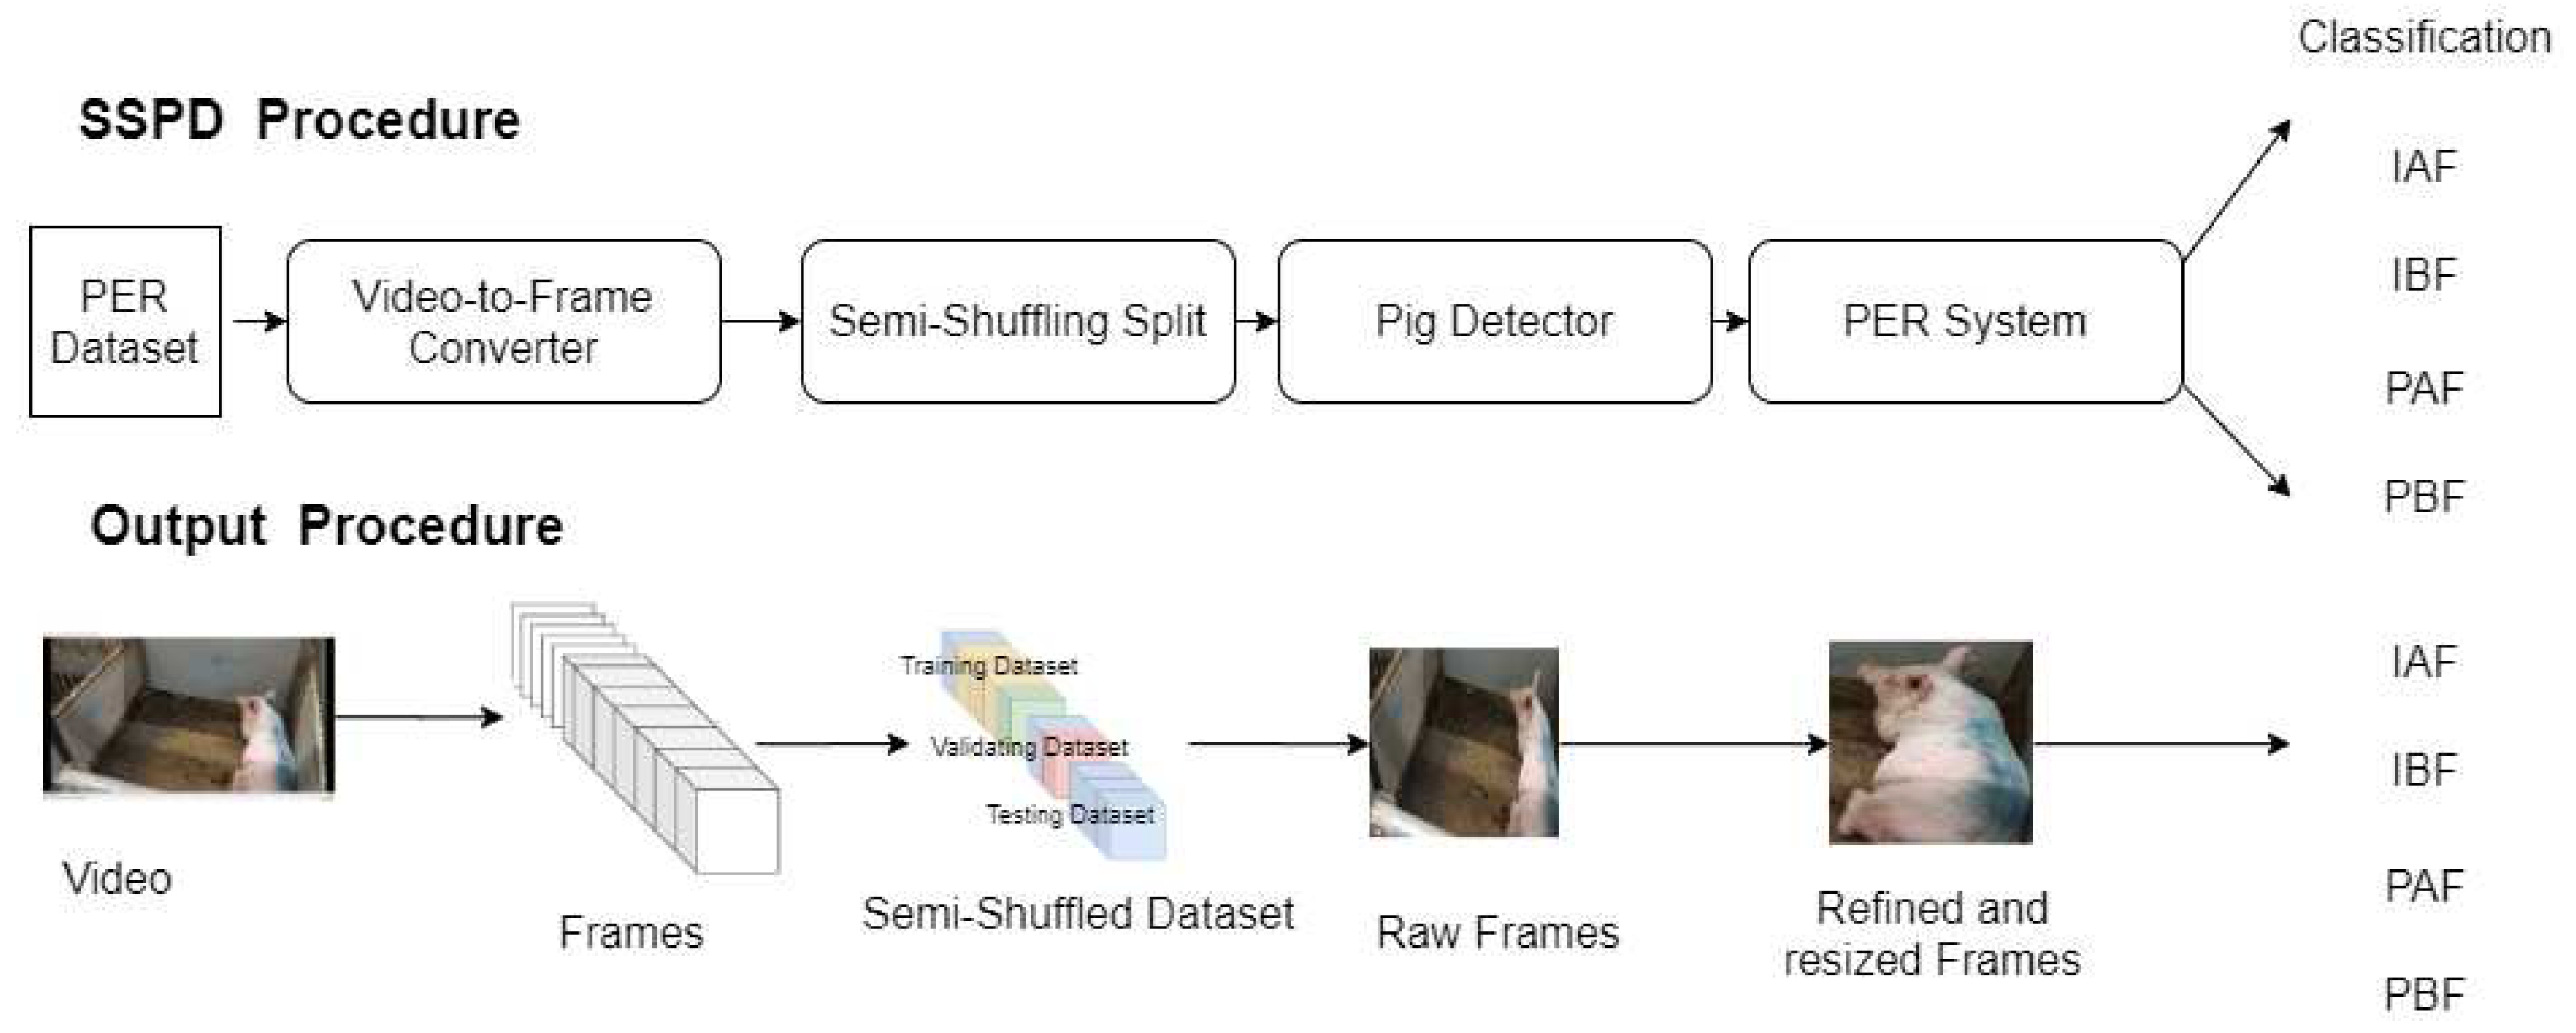
Figure 2.
SSIM algorithm evaluates the similarity of the neighboring pig’s images from PER dataset.
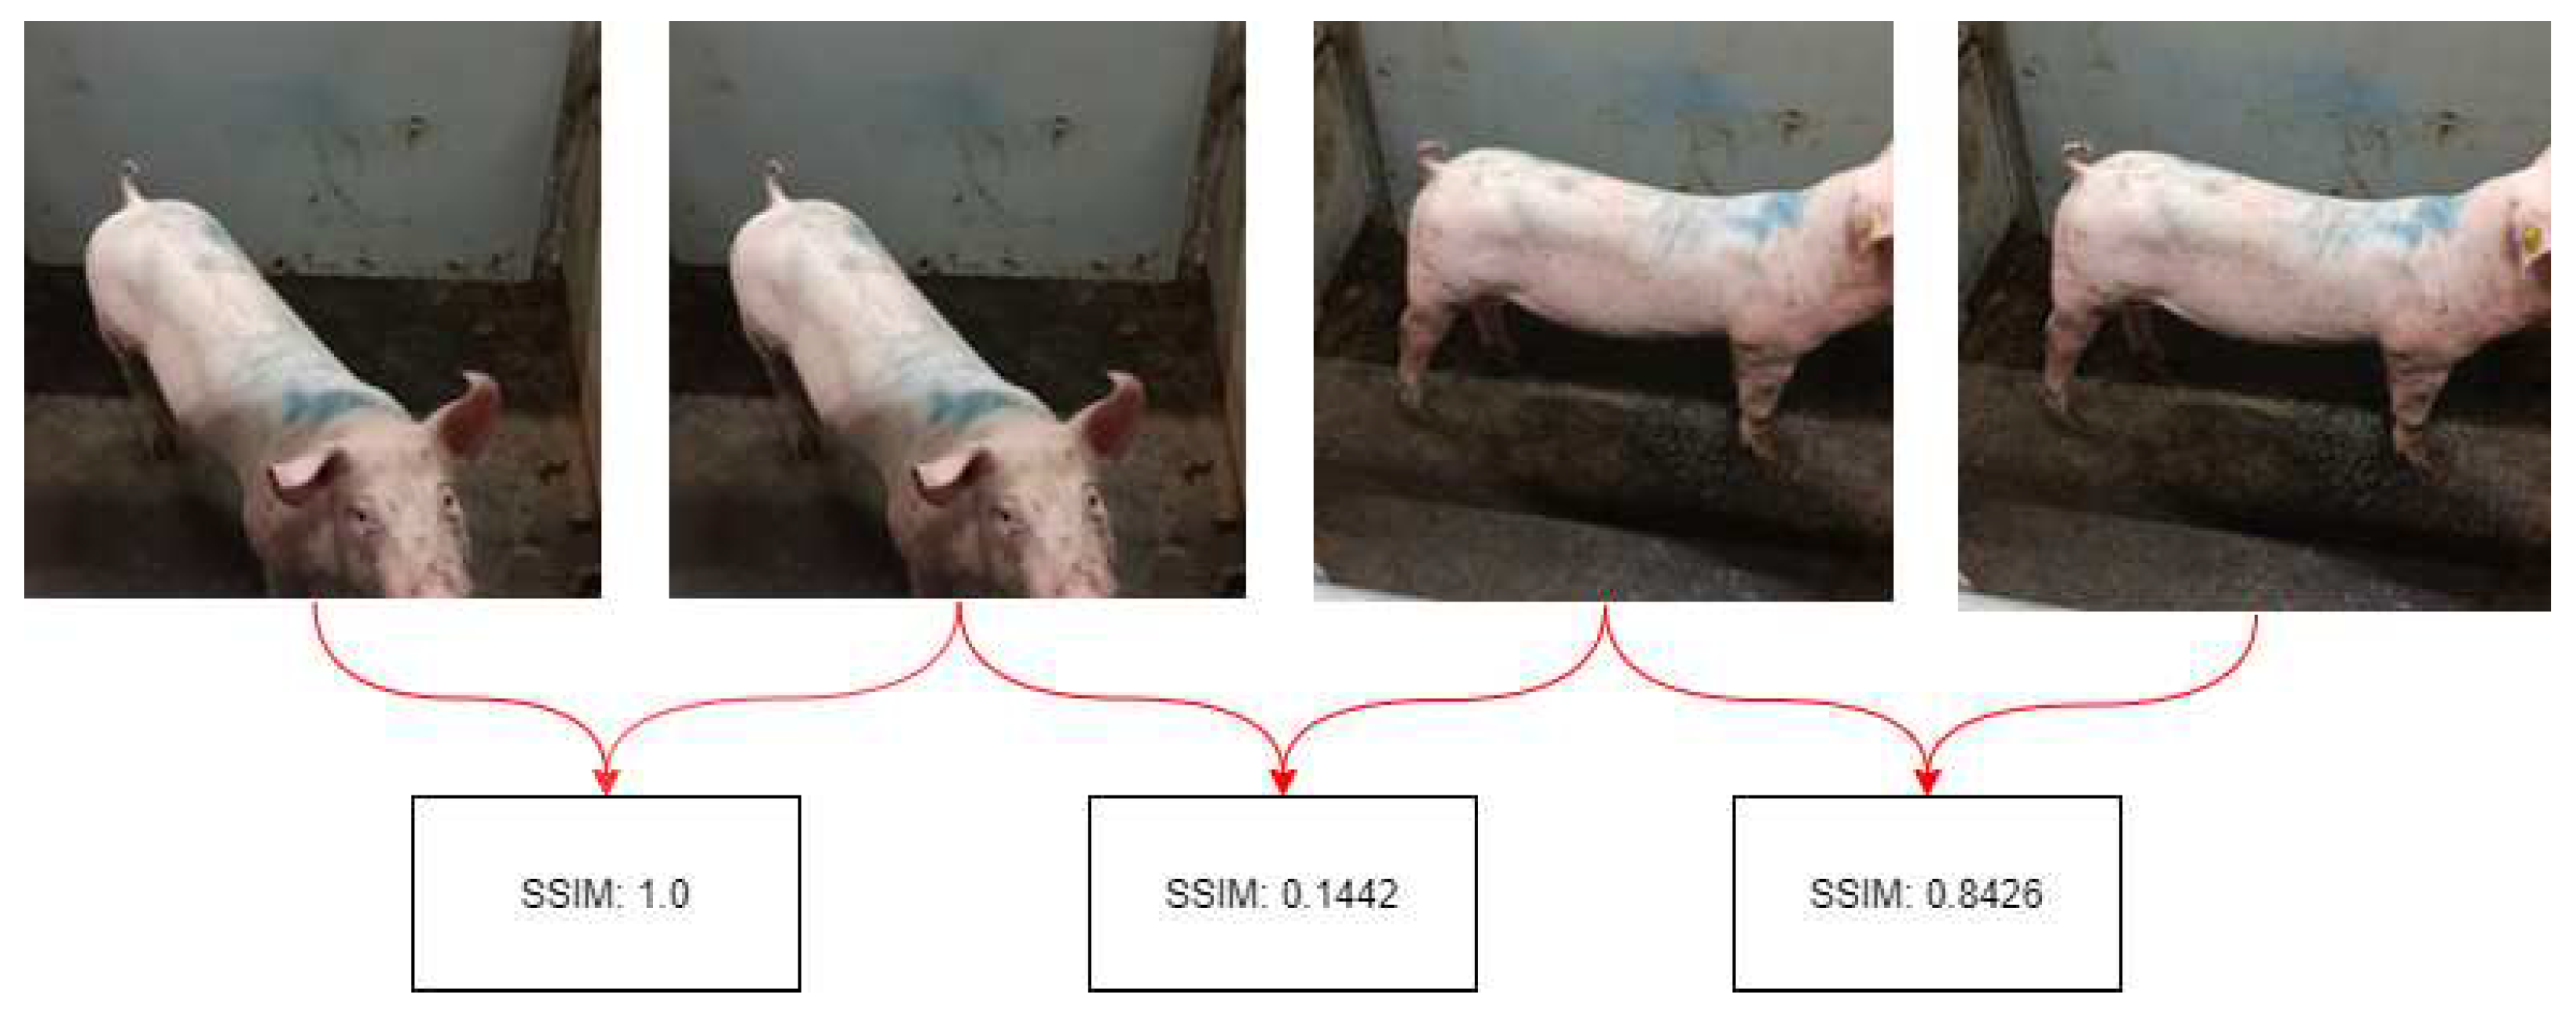
Figure 3.
Fully-shuffling system splits training, validating and testing data groups.
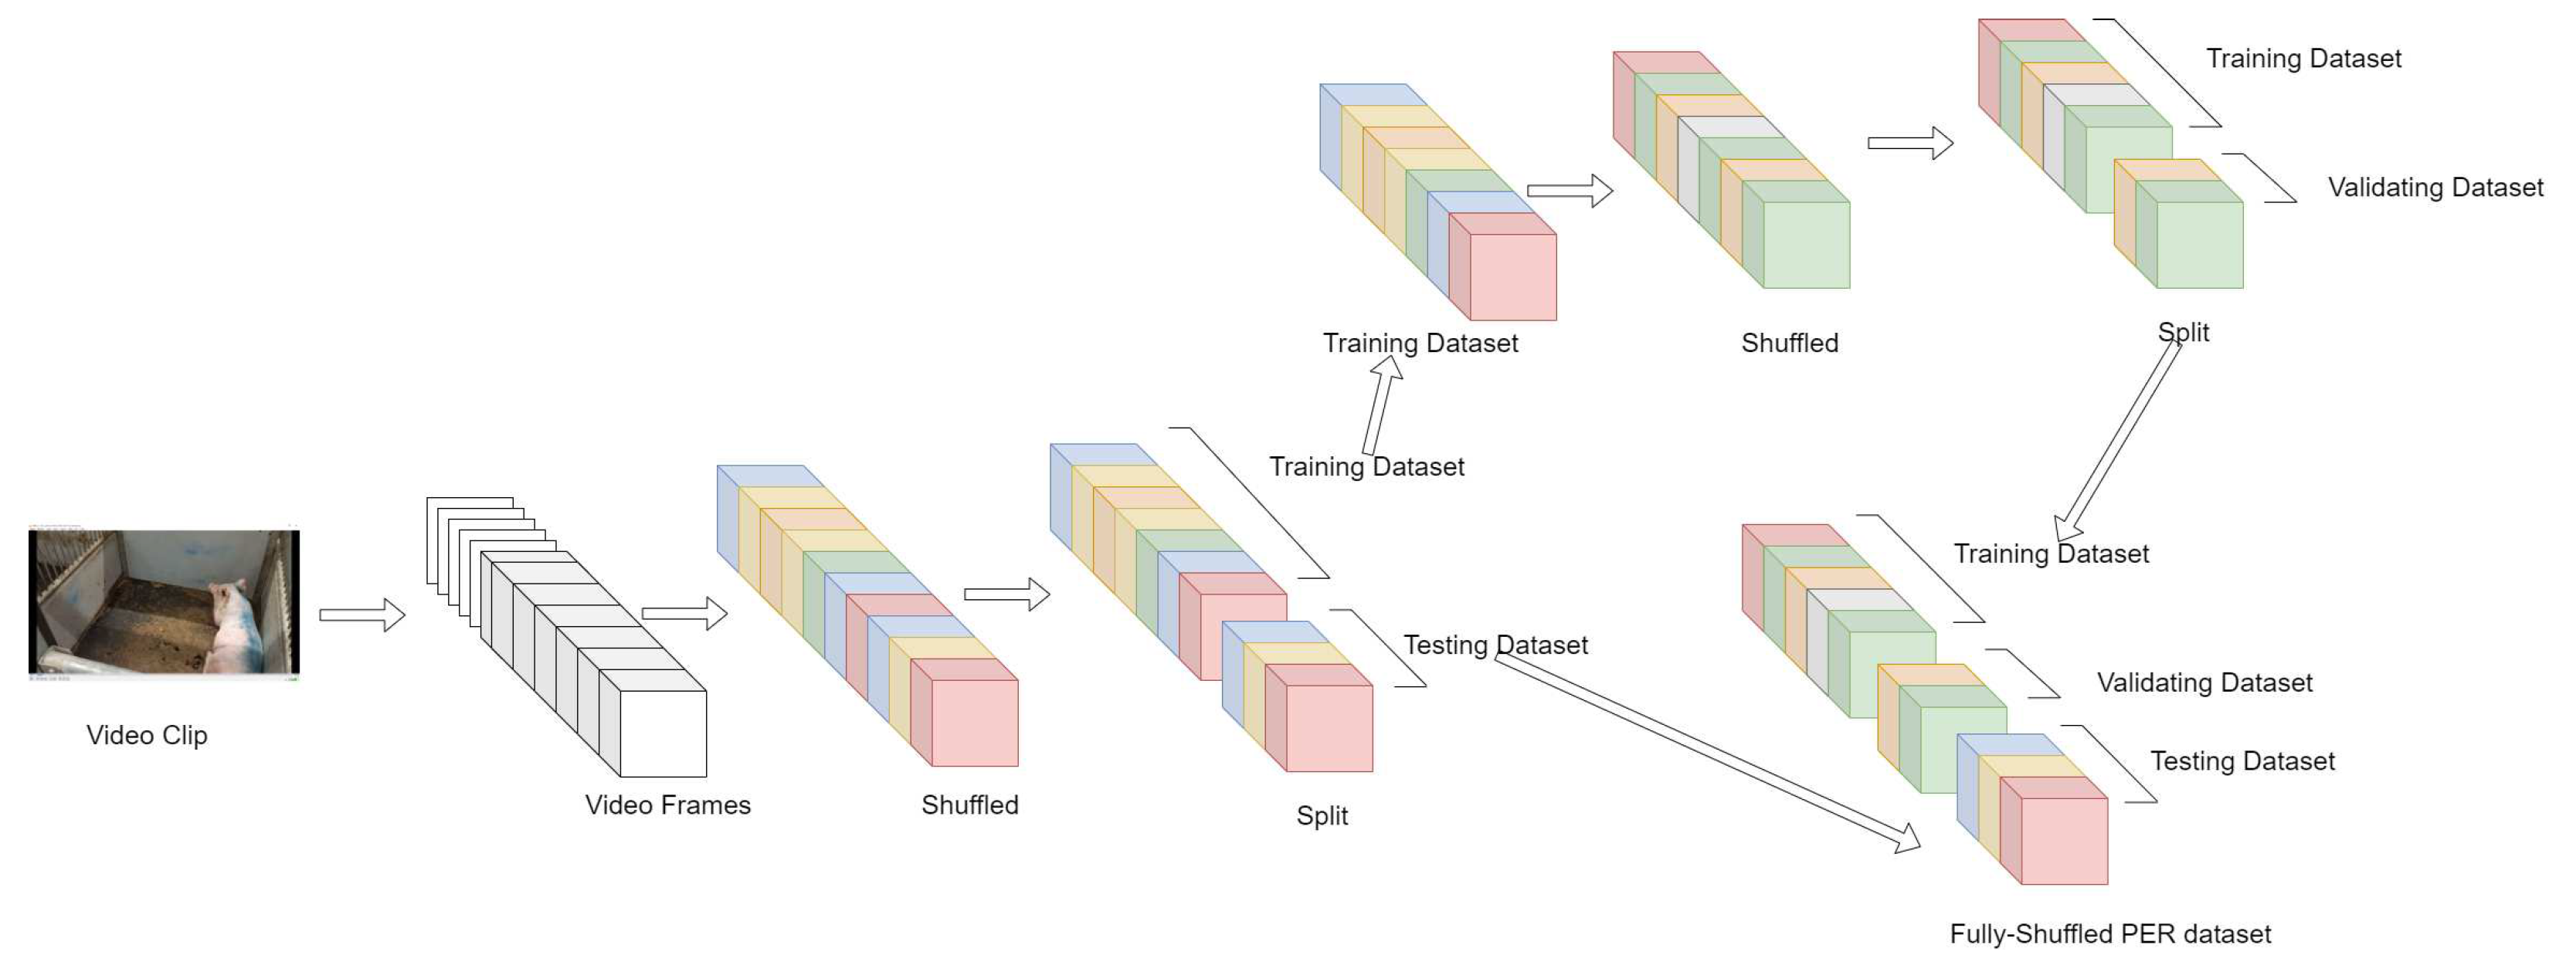
Figure 4.
Semi-shuffling system splits training, validating and testing data groups.
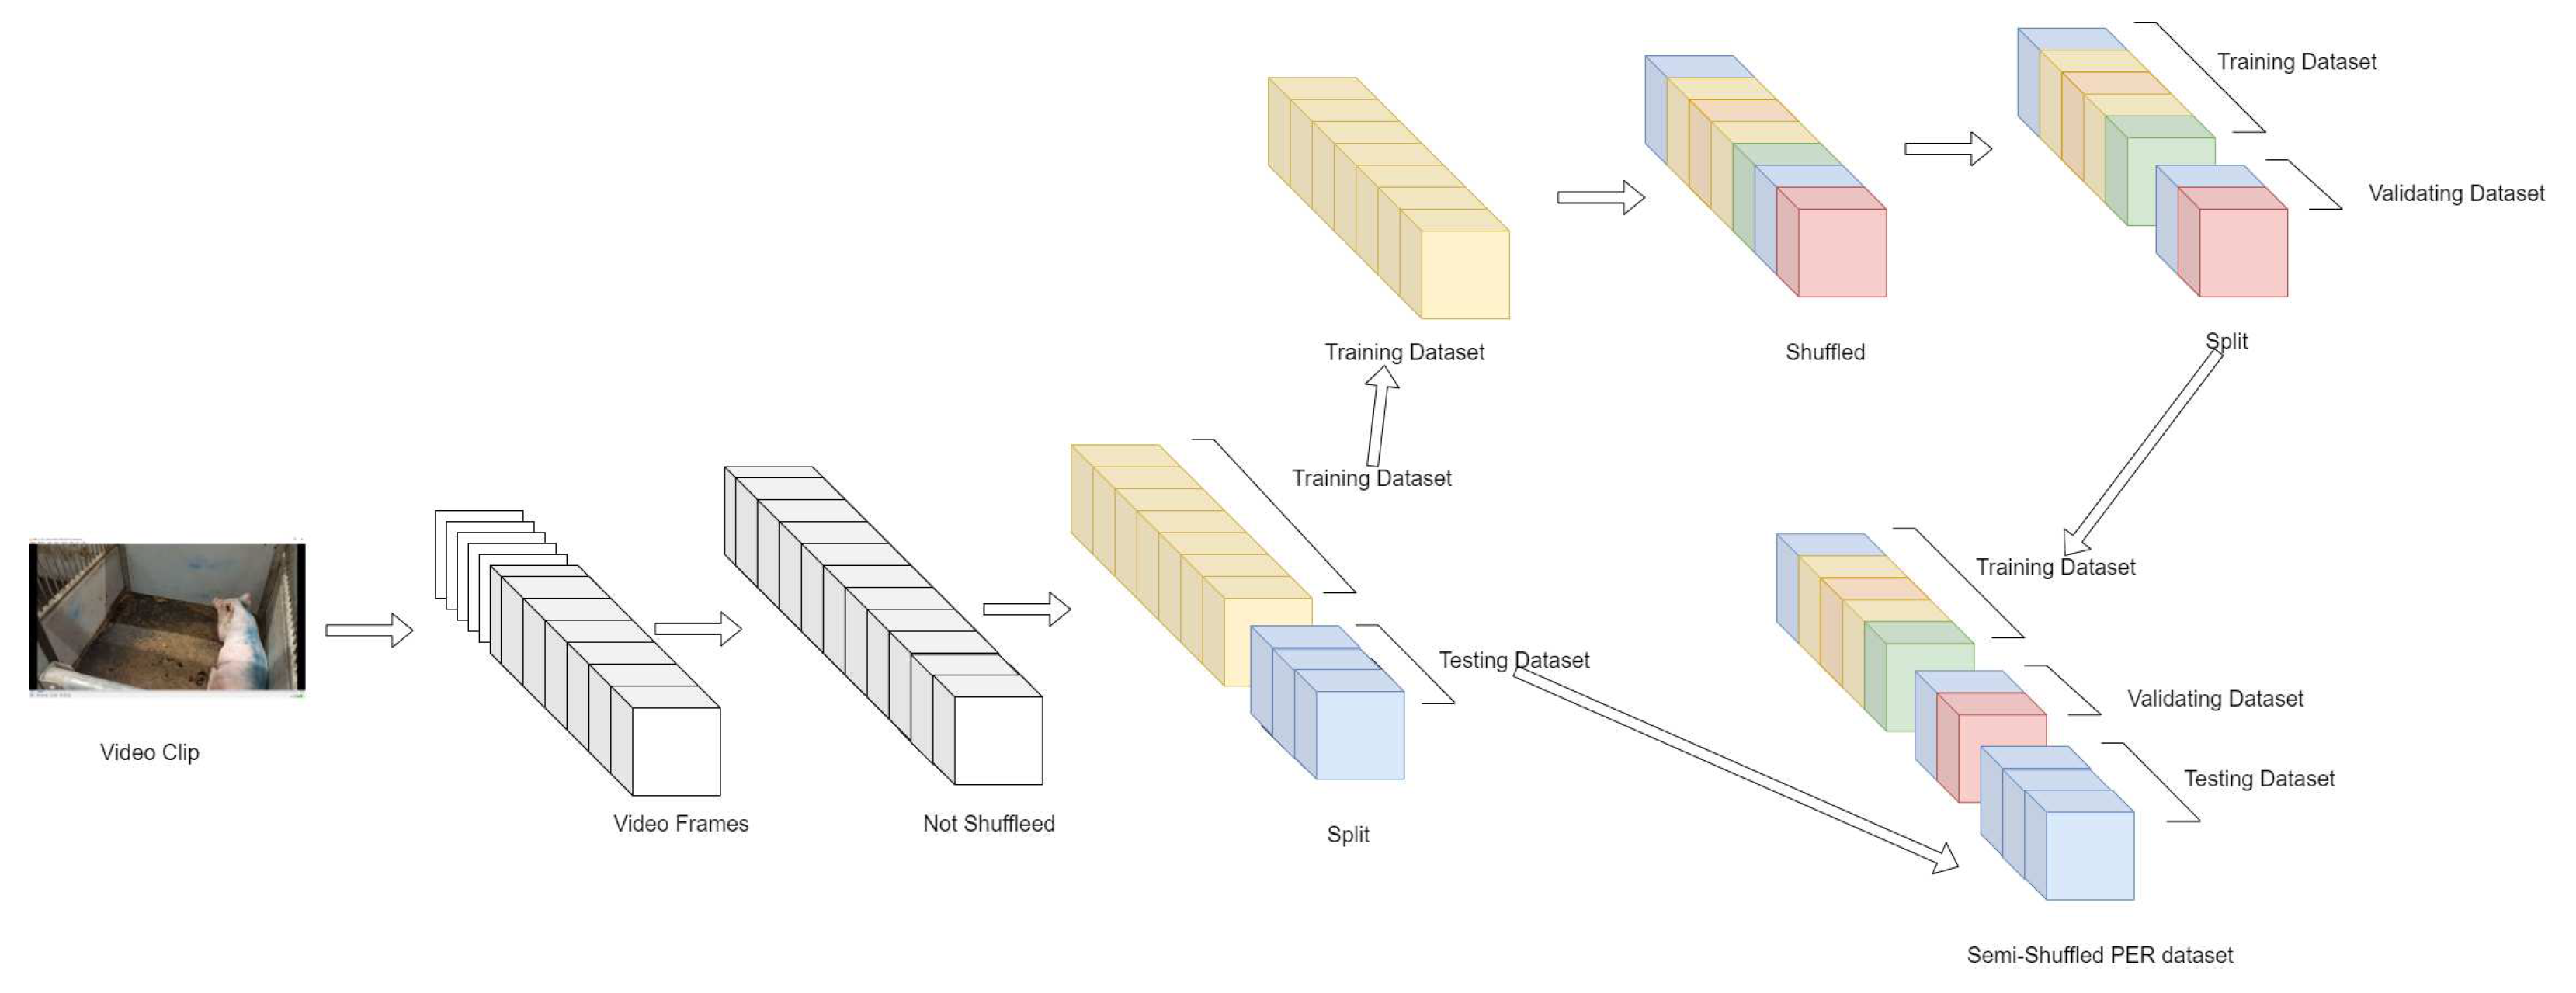
Figure 5.
Megadetector V3 can mostly discard the unimportant background region after we modify the original Megadetector V3 system.
Figure 5.
Megadetector V3 can mostly discard the unimportant background region after we modify the original Megadetector V3 system.
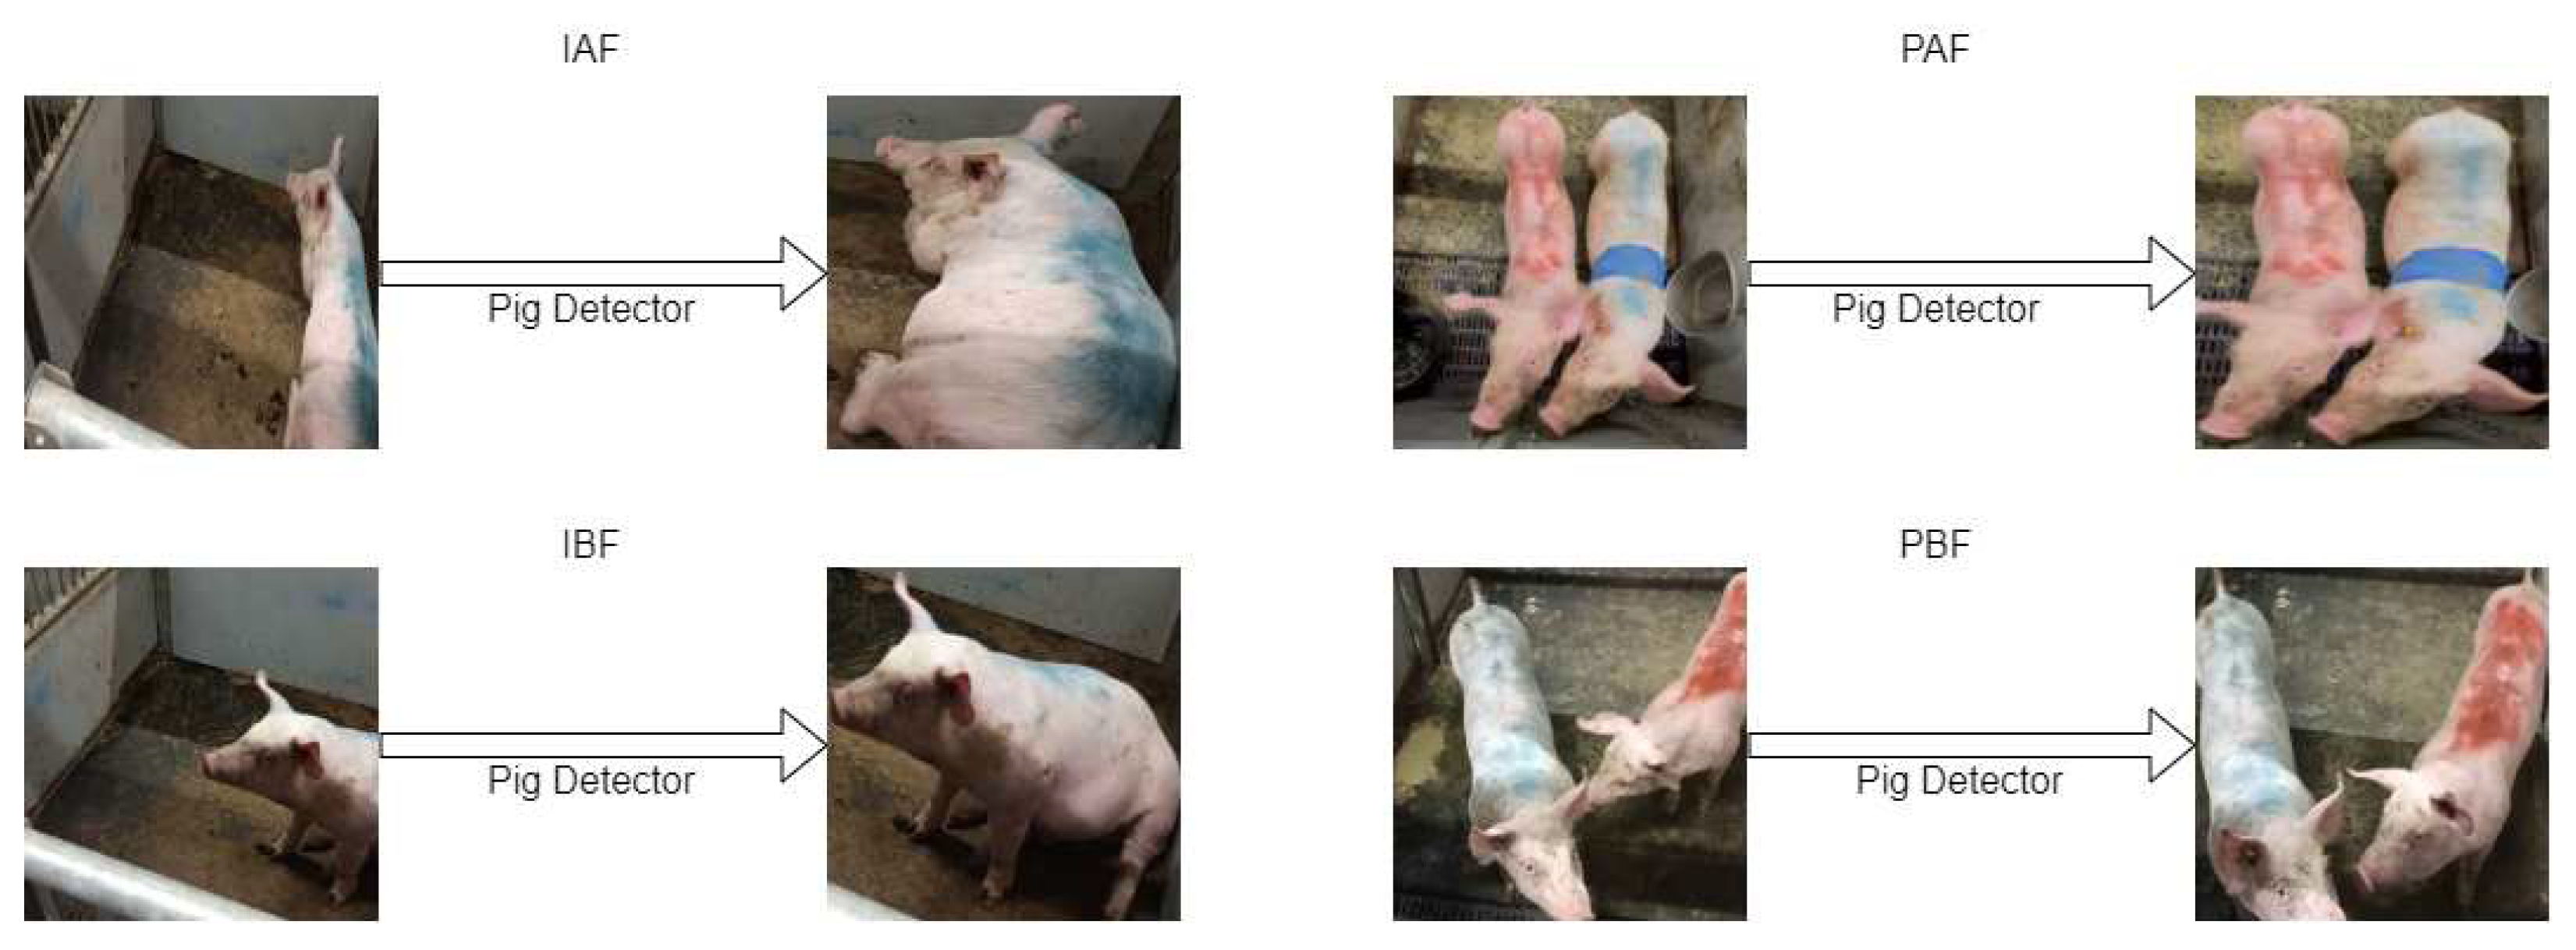
Figure 6.
MegaDetector V3 can locate and draw the bounding box on pig regions in an image. But this Megadetector cannot discard the insignificant background region without the modification.
Figure 6.
MegaDetector V3 can locate and draw the bounding box on pig regions in an image. But this Megadetector cannot discard the insignificant background region without the modification.
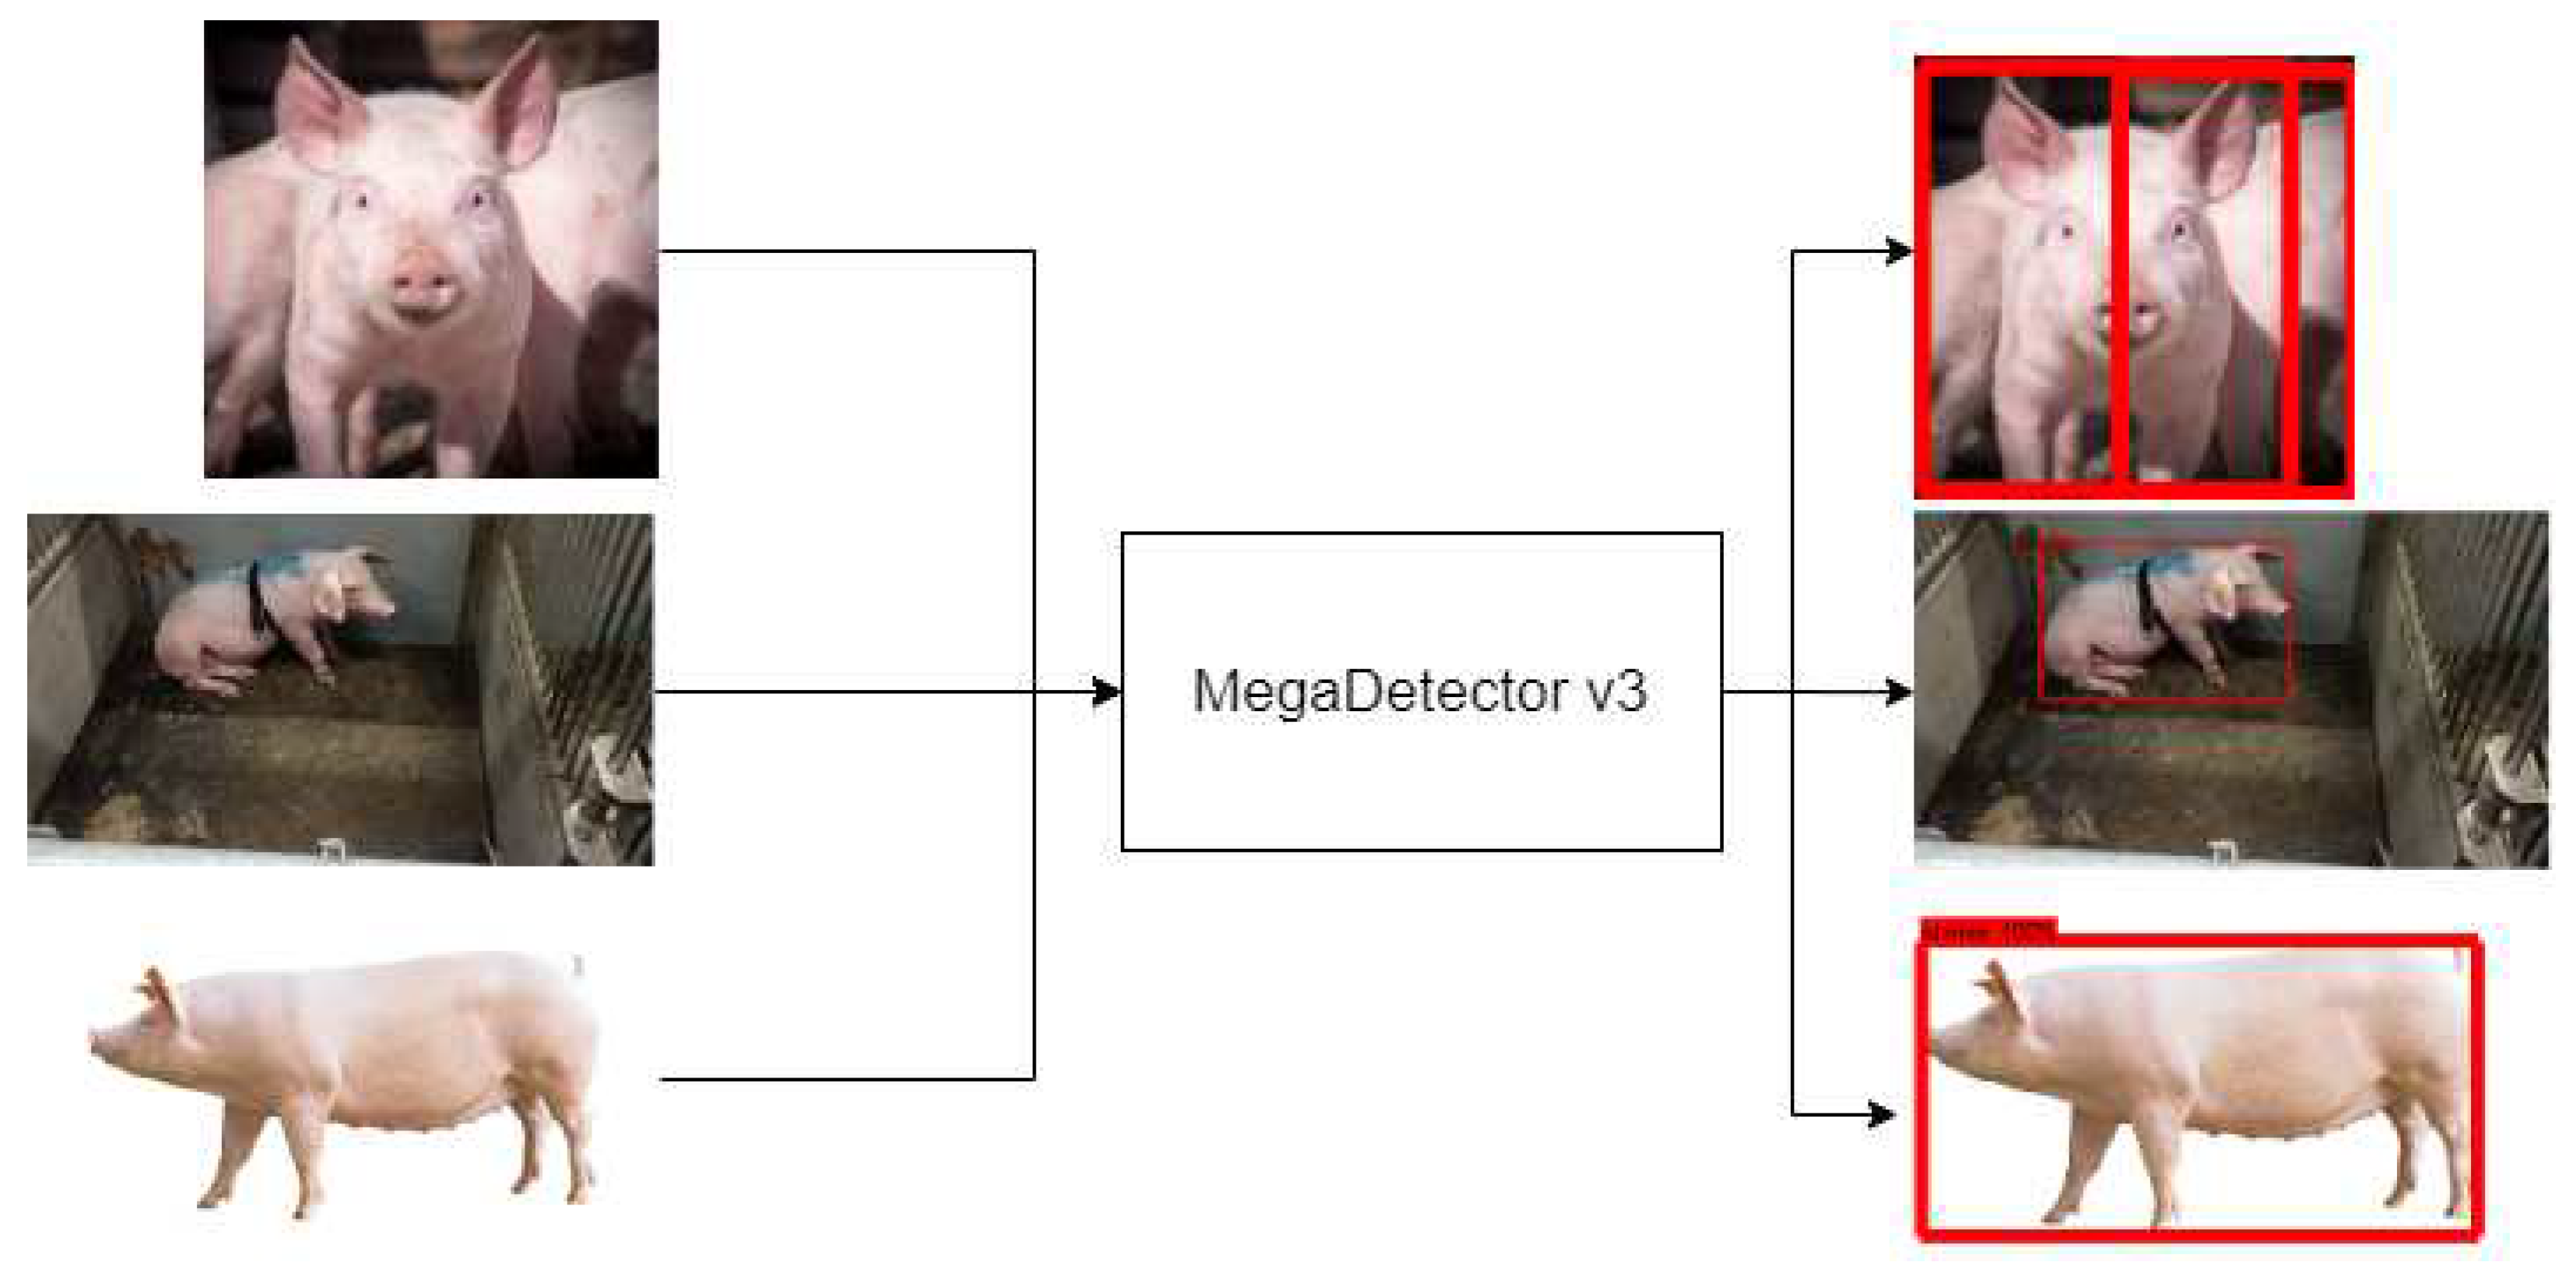
Figure 7.
The structural design of Megadetector V3 demonstrates how we modify the megadetector V3 to create our pig detector.
Figure 7.
The structural design of Megadetector V3 demonstrates how we modify the megadetector V3 to create our pig detector.
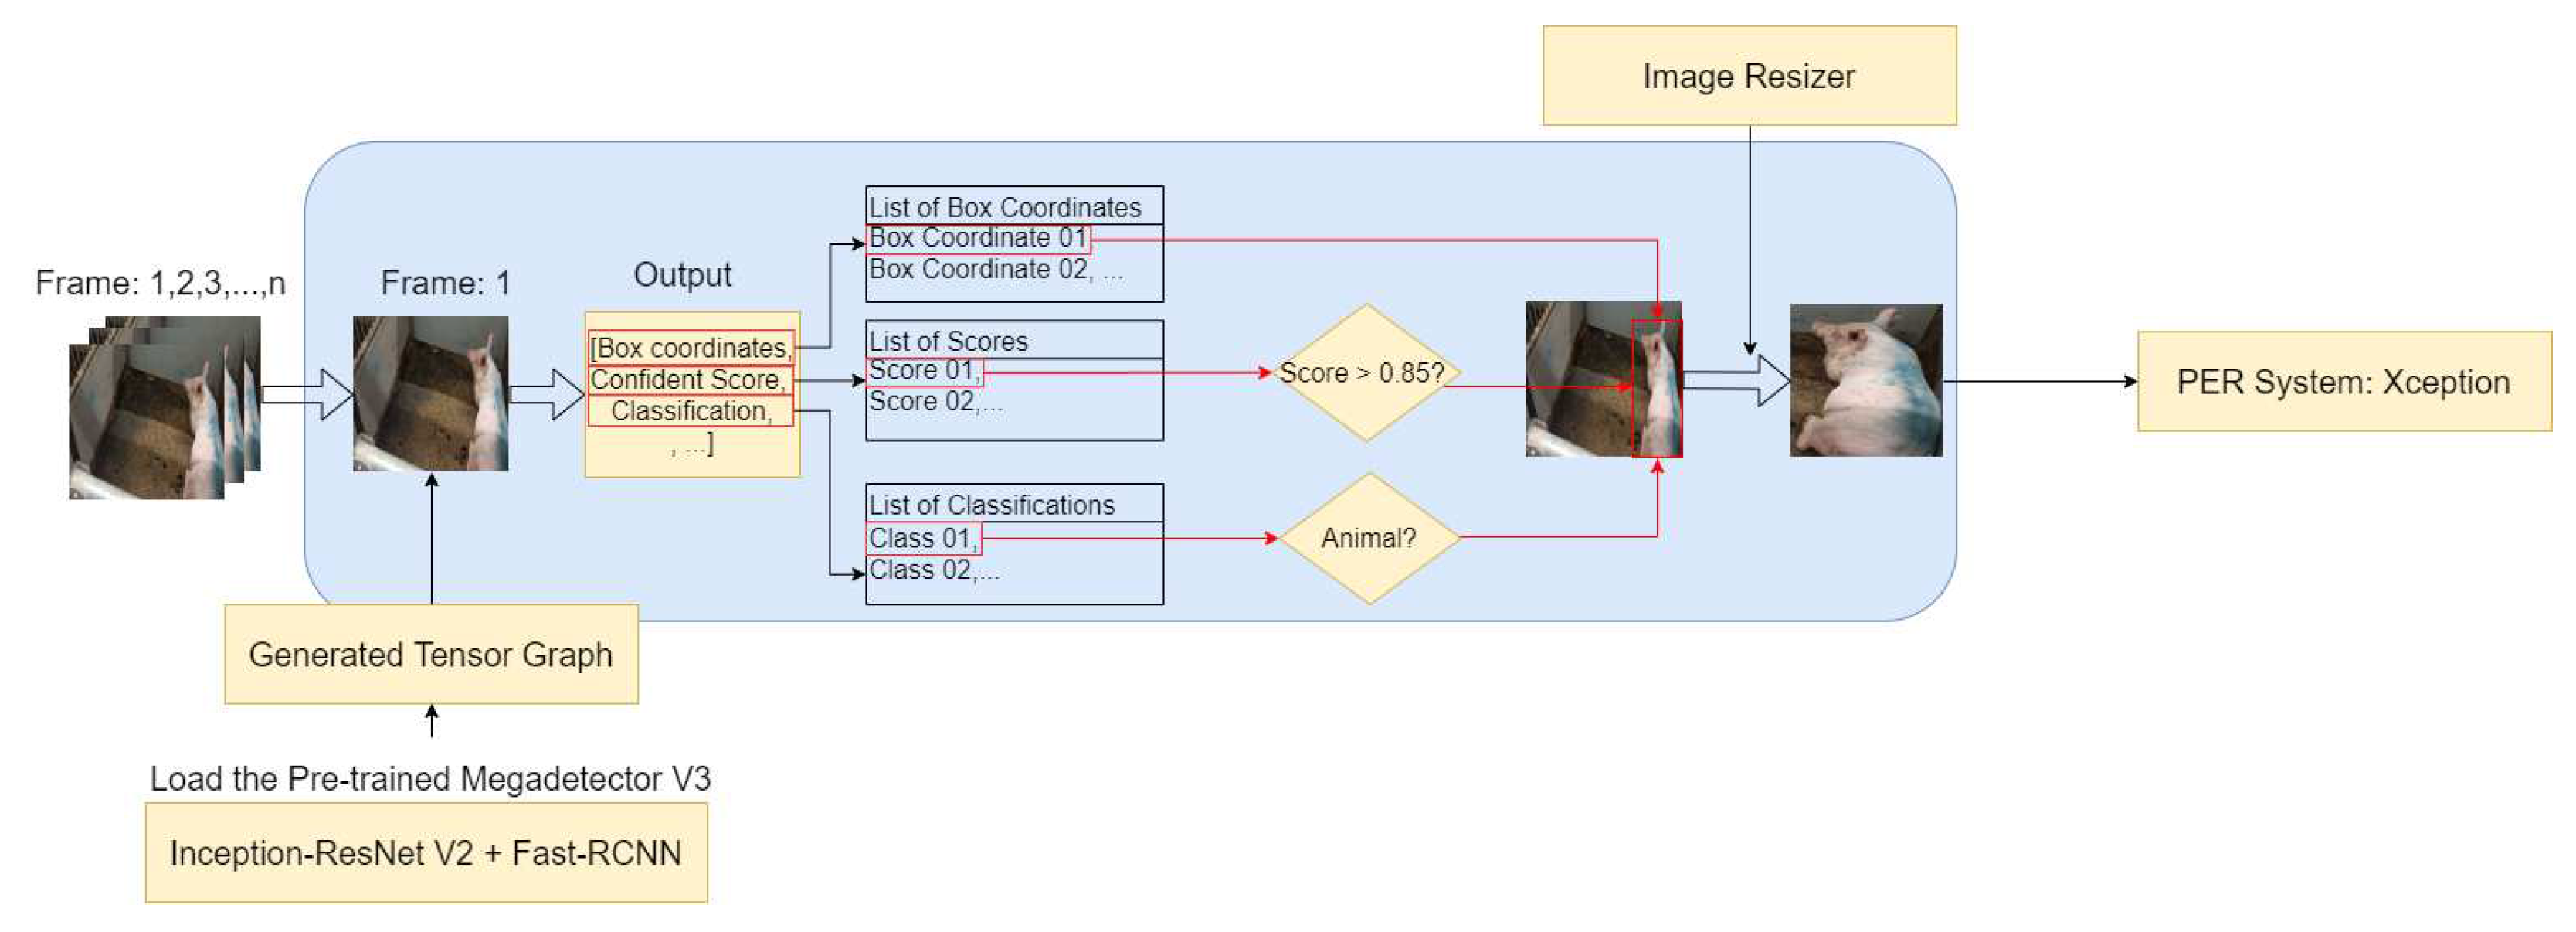
Figure 8.
The confusion matrix results of different approaches with PER dataset. (a) Raw image based approach 90:10. (b) Raw image based approach 70:30. (c) Raw image with expanded numbers of dataset (Xception). (d) Raw image with expanded of semi-shuffled dataset (Xception). (e) Fully-shuffled raw images with 256 pixels sized and 1 FPS. (f) Semi-shuffled raw images with 256 pixels sized and 1 FPS. (g) Semi-shuffled pig detected images with 256 pixels sized and 1 FPS.
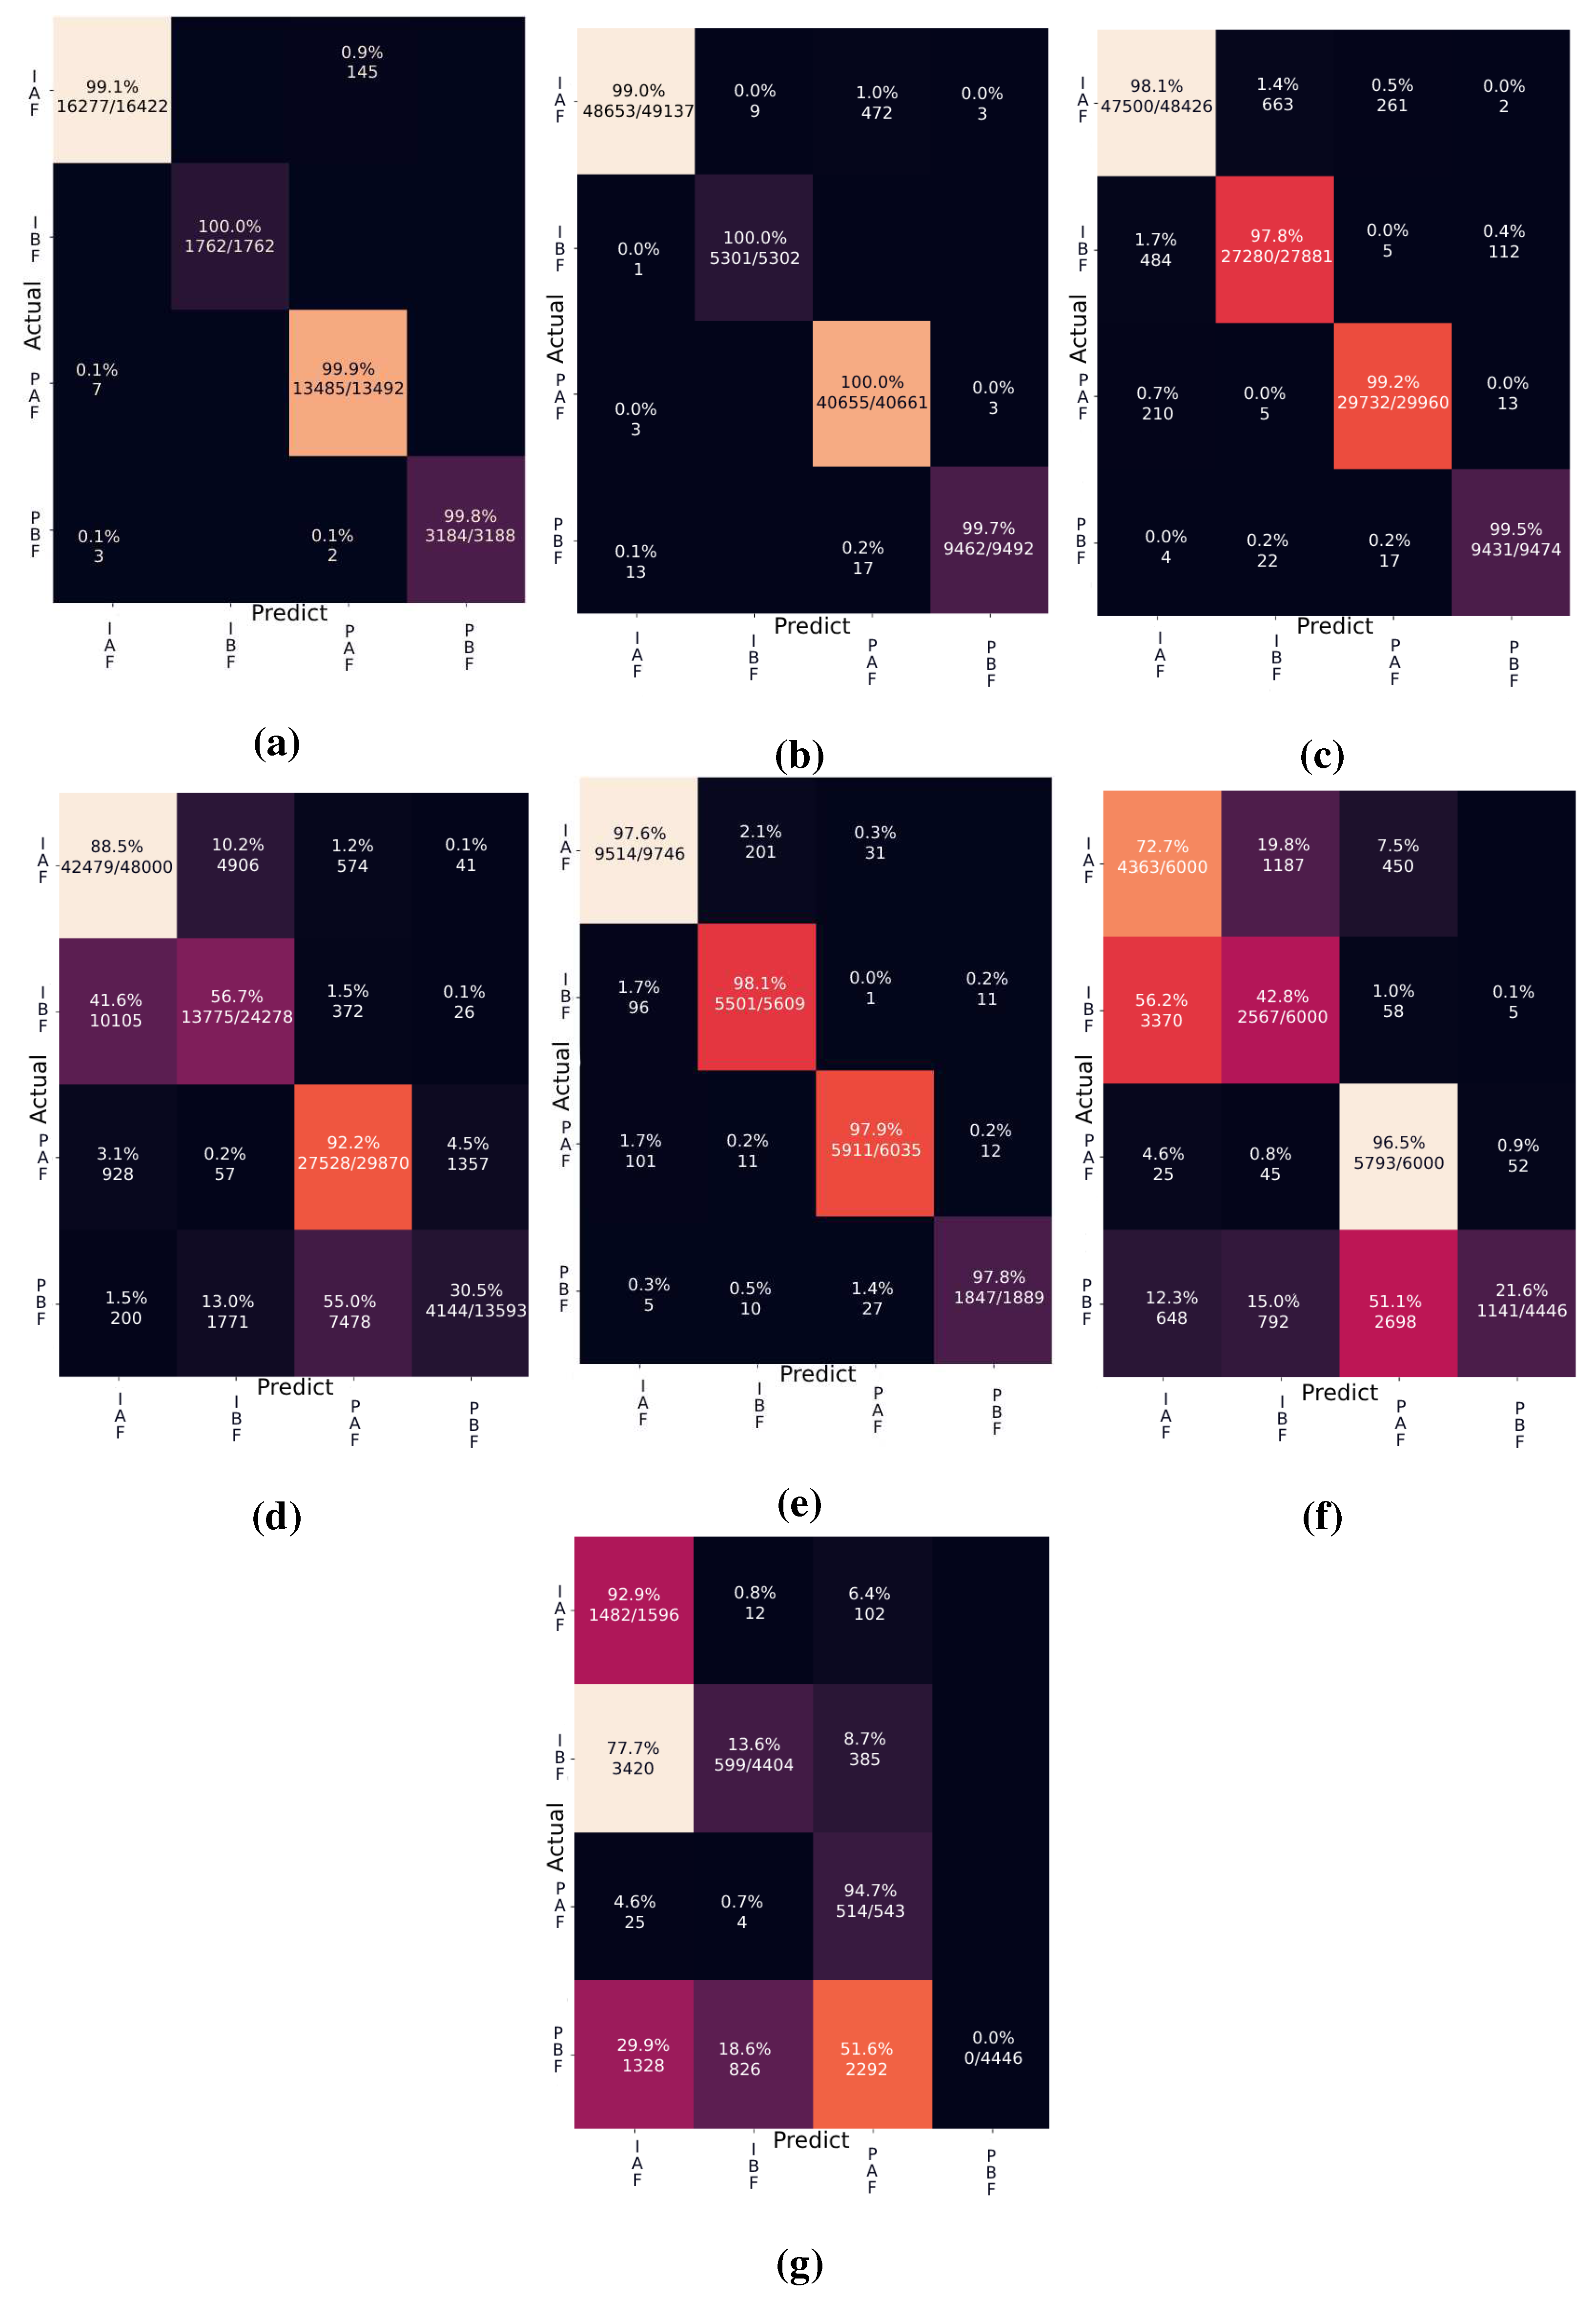

Table 1.
The summary of experimental result from Figure 8.
Table 1.
The summary of experimental result from Figure 8.
| The PER Dataset | |||||
| Approach | Accuracy (%) | Precision (%) | Recall (%) | f1-Score (%) | Real-time fidelity |
| Raw image based approach 90:10 from Figure 8(a) | 99.55 | 99.55 | 99.55 | 99.55 | False |
| Raw image based approach 70:30 from Figure 8(b) | 99.53 | 99.51 | 99.50 | 99.50 | False |
| Raw image with expanded numbers of dataset (Xception) from Figure 8(c) | 98.45 | 98.45 | 98.45 | 98.45 | False |
| Raw image with expanded of semi-shuffled dataset (Xception) from Figure 8(d) | 75.97 | 75.39 | 75.97 | 74.21 | False |
| Fully-shuffled raw images with 256 pixels sized and 1 FPS from Figure 8(e) | 97.83 | 97,84 | 97.83 | 97.83 | False |
| Semi-shuffled raw images with 256 pixels sized and 1 FPS from Figure 8(f) | 59.56 | 65.85 | 55.91 | 59.56 | False |
| Semi-shuffled pig detected images with 256 pixels sized and 1 FPS from Figure 8(g) | 23.61 | 20.87 | 23.61 | 15.02 | True |
Disclaimer/Publisher’s Note: The statements, opinions and data contained in all publications are solely those of the individual author(s) and contributor(s) and not of MDPI and/or the editor(s). MDPI and/or the editor(s) disclaim responsibility for any injury to people or property resulting from any ideas, methods, instructions or products referred to in the content. |
© 2023 by the authors. Licensee MDPI, Basel, Switzerland. This article is an open access article distributed under the terms and conditions of the Creative Commons Attribution (CC BY) license (http://creativecommons.org/licenses/by/4.0/).
Copyright: This open access article is published under a Creative Commons CC BY 4.0 license, which permit the free download, distribution, and reuse, provided that the author and preprint are cited in any reuse.


