Submitted:
08 June 2025
Posted:
10 June 2025
You are already at the latest version
Abstract
In the livestock industry, maintaining the health of animals is very important, and the use of technology has greatly helped this. One of the existing challenges has been that most of the available sensors and electronic processing devices are designed to fit the human body, and the use of these devices for livestock faces limitations due to the difference in the structure of the body and skin of animals and humans. Reliable solutions tailored for animal husbandry can be achieved by modifying the physical and software structure of existing devices. In this article, we have presented the current situation, by reviewing the research done and the existing technology in the field of animal husbandry. The aim is to obtain comprehensive parameters for monitoring livestock health by leveraging available information and exploring new methods based on the Internet of Things (IOT), Artificial Neural Networks (ANN), and Artificial Intelligence (AI). We take a proactive approach by utilizing available technologies based on sound-based diagnostic techniques. Initially, we propose utilizing piezoelectricity and amplifying received sound using a diaphragm attached to a collar. Subsequently, we discuss the results of relevant tests that can be conducted using the phonocardiography system. For the next phase of research and designing a more advanced livestock health monitoring system, we suggest employing an ultrasonic system to measure heart rate and blood pressure for the next phase of research and designing a more advanced livestock health monitoring system. This system, coupled with a piezoelectric system to make electric energy from the pulse of the veins, could be subcutaneously implanted for continuous monitoring.
Keywords:
Animal health
; Smart collar
; Livestock farming and AI
; Modern animal husbandry
; Livestock health technology
1. Introduction
Ever since humans discovered the power of agriculture and animal husbandry, there has always been a continuous progression. This progress has been reliant on monitoring the health of livestock and preventing diseases. With the ever-increasing population and human need for food, it becomes imperative to pay more attention than ever to the health and safety of the livestock farming industry. This ensures profitability for farmers, prevents migration of farmers to urban areas, and fosters appreciation for the valuable and beautiful animals known as livestock.
With appreciation and respect for all the services rendered by farmers, veterinarians, engineers, and researchers over the years, we aim to shed light on a small part of this history. Then, we will propose innovative methods that we hope will attract the attention of scholars and enthusiasts in this field. With mutual assistance, we hope to have a significant impact on the advancement of the livestock health monitoring industry.
2. Experimental Background
Numerous diverse systems have been introduced for monitoring livestock health, making it impractical to cover all of them in a single article. Therefore, we will focus solely on the wireless sensor system on the cow collar, as the neck collar, due to its minimal discomfort for the animal, is the most widely used tool for livestock.
The best items that can be used for detecting animal health include: body temperature, pulse or heart rate, respiration, feeding behavior, estrus detection, resting time, and sounds produced by the animal.
To remotely diagnose and systemically address some of these aspects, systems have been developed, and extensive research has been conducted to obtain newer, more confident, and higher-quality methods. Here, we distinguish and introduce the most important of them:
2.1. Existing Systems:
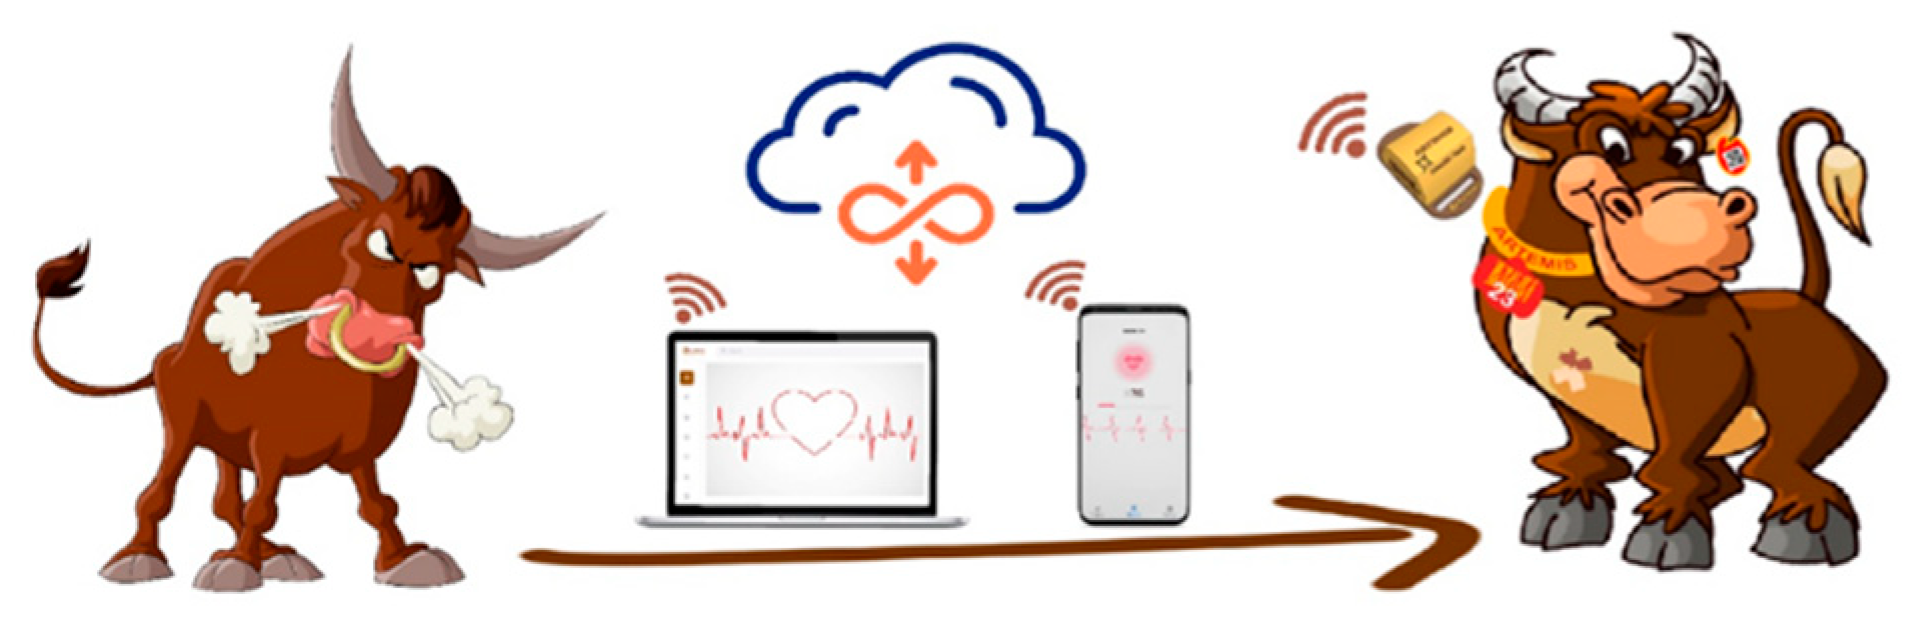
Devices designed for cattle collar usage, utilizing temperature and accelerometer sensors, have been able to provide valuable information about livestock health, including body temperature, feeding time, rumination, and cow resting time. Some of the above companies are: 1. www.gea.com 2. www.afimilk.com 3. www.allflex.co 4. www.artemishealth.io/ (Figure 1)
2.2. Theoretical Foundations:
All the heart rate sensor modules available in the market are designed to be used on the human body, which work based on the light radiation and reflection system. Due to the difference in the structure of the skin of animals compared to humans, the use of these sensors for each type of animal requires special research and testing. To overcome this challenge, we looked for a different or complementary method, and extensive research is being done, some of the most important articles on this topic.
The main research in this article is related to the detection of pulse and heart rate because it is one of the most important factors for identifying diseases in livestock.
- Indonesian University research on the use of a heart rate sensor on a cow's neck collar. [2]
- An article that reported about 72-75% accuracy in 15 cow samples. [4]
Abnormalities that cause a change in the animal's heart rate may include:
Based on the conducted research and considering the need for a reliable method for systemic monitoring of livestock heart rates, a definitive method for obtaining a cow's pulse from the collar has not yet been introduced, given the requirement for the most convenient and wearable device for animals.
Abnormalities that may cause changes in livestock heart rate include: cardiomyopathy, heart disease, therapeutic conditions, perfusion disorders, blood diseases, fever, respiratory diseases, infectious diseases, kidney problems, metabolic disorders, stress and anxiety, esophageal obstruction during food ingestion, swallowing of indigestible pieces, etc.
3. Examination of Desirable Situation:
Among the factors that should be considered to achieve the desirable state in the livestock community are precise treatment scheduling, reduction of veterinary expenses, increased productivity, and enhancement of cattle health and safety through obtaining comprehensive and accurate information using digital tools and online communications.
One of the best tools traditionally used in livestock farming is the collar, and we aim to gather more information from the sensor box attached to it. Currently, we have succeeded in utilizing temperature sensors, accelerometers, GPS trackers, thermometers, pedometers, gas sensors, and sound sensors. If we can devise a method for detecting heartbeat on the neck of the cattle, completing our livestock health monitoring module will lead to significant advancements in livestock breeding. (Figure 8)
Currently, with the available technology, sensors and amplifiers, we have the ability to receive the sound of the animal's heart from the stomach, but placing the sensor box on the stomach of the animal for a long time is not normal and may be impossible. For this reason, we have tried to find a way to take the animal's pulse from the cow's neck.
4. Applicable Theory:
Thomas was working on a project that detected whether water was flowing in a pipe with several piezoelectric sensors. Out of curiosity, he stuck the sensor to his finger, and to his surprise, all the values his microcontroller was spitting out were very noise-free versions of his heart rate. He found this to be a much simpler solution to measuring heart rate. (Figure 9)
History of heart sound processing through electrical voltage:
Awareness of the sounds produced by the heart dates back to Robert Hooke (1703-1635), who wrote:
"It may also be possible to discover the internal movements and actions of bodies—whether animal, vegetable, or mineral. The sound they make". (Figure 10)
Common sensors for measuring human heart rate are made of optical system. The sensor shines light on the skin and measures its reflection with a light detector. The oxygen in hemoglobin has a special property, that is, it can absorb a certain amount of green light. The more oxygen in the blood, the redder the blood, which increases the rate of light absorption and reduces reflection. As blood is pumped through the finger veins, the amount of reflected light changes, creating an oscillating waveform. By measuring this wave, we can read the heartbeat. (Figure 11)
Conceptual Model:
Fortunately, with the available capabilities, we can listen to the sound of cardiac stimuli from the cattle using a sound sensor instead of using an optical pulse sensor. With this method, the thickness of the animal's skin is no longer a challenge for us because we are using frequency instead of light. Amplifying and directing sound is feasible for us, and if necessary, we can also utilize ultrasonic assistance.
The only remaining need is to amplify the received sound. One of the methods for sound amplification is software-based, which is quite suitable for our purpose but not enough.
The complementary method and the main idea to amplify the received sound involve using a sound diaphragm embedded in the bottom part of the sensor box, which will be placed on the collar to capture the sound of the animal's body. (Figure 12)
This diaphragm chamber is connected to the animal's body like a stethoscope, it receives the sound of the animal's body and transmits it to the piezoelectric through a tube. (Figure 13)
In the next part of the circuit, the received sound will be converted into electric waves and ready for processing. The received sound will be in the form of frequency, after processing we will be able to obtain systolic and diastolic and draw the corresponding diagrams. (Figure 14)
For using the acoustic wave sensitive sensor in veterinary related projects, microphones are available for animal health and livestock research. One of the most famous microphones sensitive to sound waves for livestock is the Electret microphone. Features of this microphone: suitable dimensions for connecting to the diaphragm designed to optimally absorb the internal sounds of the animal's body, high sensitivity to sound waves, ideal for recording animal sounds.
Modules used in the desired device:
circuit schematic:
Circuit PCB and circuit connection diagram are designed and produced. The raw data received from the animal will be sent to the hub server by the Wi-Fi system and will be processed and stored in the cloud. The processed information will be converted into the necessary diagrams and will be sent to the local system or to their mobile phones. When necessary, the required alarms can be sent in the form of SMS, email, notification and even through social networks. (Figure 21)
Device box prototyping by 3D printing:
The 3D design of the sensor box is prepared and produced according to the dimensions and needs of the electronic components as well as the animal's body, using 3D printing technology. (Figure 22)
Neck collar design for the device:
A collar was needed for the manufactured device and a leather strap was used for testing. (Figure 23)
To get the information that can be used from the blood system of the cattle, the image below shows the blood vessels of the cow. (Figure 24)
As shown in the picture, the best access to the vein is in the neck area. There are two areas in the neck of animals where the vein, trachea and esophagus can be accessed. One is close to the animal's feet and is very close to the heart, and the other is close to the head and mouth, which is very good for listening to the sounds related to the animal itself, feeding and breathing. Choosing the best area for collar belt design will be determined after future tests. (Figure 25)
When designing the collar, we must determine the optimal way to place the sensor in the best position. The mode where the sensor is placed exactly in the desired place and on the vein and at the same time creates the least possible pressure for the cattle. (Figure 26)
The processing of received sounds requires energy, and because our device supplies its energy from the battery, we are facing energy limitations, and the design of energy consumption should be optimized and the minimum processing should be done in the microcontroller. For this reason, we will send the received raw frequency to the processing center or server through the Wi-Fi system so that the processing, analysis and storage tasks are done there, and then it is displayed to the user for review.
Also, to increase battery life, a flexible solar panel can be used on the door of the sensor compartment and even on the length of the collar strap. (Figure 27)
5. Challenges Ahead:
Foreseeable challenges in this field encompass constraints and issues that may arise during operations in agricultural settings with external animals. Factors such as environmental noise, animal movements, and resistance to wearable devices can be anticipated factors. Properly designed collars tailored to the animal's body minimize animal resistance. The presence of a diaphragm renders the sound sensor polarized, filters environmental sounds to a large extent, and captures body sounds more clearly.
The most significant challenge ahead lies not in external noises but rather in various internal achieved sounds of the animal's body! These may include respiratory sounds, sounds produced by the cow, eating noises, rumination, and so forth.
This scenario has both pros and cons:
- -
- The advantage lies in the fact that with the same sensor, we can obtain a wealth of information in various scenarios. For example: sounds related to cardiac and vascular problems, respiratory issues, digestive problems, unusual sounds indicating animal distress, unpredictable sounds occurring during unusual events, and so on.
- -
- The downside of the challenge is receiving different sounds of livestock bodies. It is necessary to filter the received sound first using sound processing software systems and specific algorithms and also, by using artificial neural networks and AI technology to recognize the frequency associated with each movement. After sound filtration and categorization of frequencies related to the heart, lungs, etc., we will be able to use the received information to detect livestock health.
Optimal Use of Received Information:
Considering the previous steps that have led to obtaining segmented sound information from livestock, we now have several sets of different and valuable frequency data. For example:
- Sounds related to the heart and blood vessels
- Sounds related to the respiratory system
- Sounds related to the digestive system
- Sounds produced by the animal itself
- Environmental abnormal sounds
Each of these subcategories can represent a group of important information after processing. For example, in the case of sounds related to digestion, we can record feeding time, rumination, and resting time for the animal. Also, signs of discomfort during swallowing and even obstruction of the airway or esophagus can be detected by the received sounds. Similarly, other items can provide a lot of information, and ultimately, hundreds of cases that are recordable and processable can be identified.
Furthermore, it is possible to personalize health information for each individual animal by processing and storing the received data from each animal in the initial minutes of connection and considering a specific data file for each animal, synchronized with the moods and physical characteristics of that particular animal. From now on, we can compare the animal's information with the data stored for that animal, and in case of any interference, quickly become aware of changes in the animal's condition. Of course, in case of stability, after comparing the above conditions with the stored data for all animals and system confirmation, if there is no discrepancy, the animal's health indicator will move to the stable phase.
For example: a cow's heart rate in a general state is 60, but perhaps a cow's normal heart rate in that specific cow is 58. In our initial connection, we observe the number 58. If the received number is not significantly different from the general norm, we consider a heart rate of 58 as the health range for this animal. Based on this algorithm, other items such as temperature, respiration, etc., will also be manageable.
6. Discussion:
In previous research, good and promising results have been obtained from listening and receiving the cow's pulse using a stethoscope to amplify the sound received in the cow's back. (Figure 28)
In order to be able to use this method, it is necessary that the above system is located on the animal's body all the time and has the best possible performance considering the comfort of the animal. The oldest and best wearable device is the collar, and we are trying to use the phenocardiography system on the neck of the animal in the initial stage.
In the next step, by using and relying on the previous research that is listed under this paragraph, the necessary research and tests will be carried out to reach a more advanced product by upgrading the above systems and changing the required parameters from human models to the system. It can be used subcutaneously in livestock, to achieve a significant improvement for livestock monitoring and permanent micro controller charging through the piezoelectric nanogenerator mechanism.
- Automatic heart rate detection during sleep using on-chip audio recordings from a wireless acoustic sensor [9]
7. Results:
Nowadays, smart veterinary stethoscopes have found a great place in the field of cardiology and disease diagnosis due to their ability to increase the sound (up to 17 times). These stethoscopes have sensors that amplify the sounds received through the diaphragm and provide a clear sound to the listener. (Figure 35)
To obtain the best area of the animal's body for listening to the heartbeat and installing the device, as well as processing and ensuring the correctness of the proposed design, a simple test can be performed by phonocardiography. To do that, we only need a normal headset, a veterinary stethoscope, and a mobile phone. By connecting the diaphragm part of the stethoscope to the headset microphone, we can store the received sound in a mobile phone for processing and performing the necessary tests through machine learning and AI. (Figure 36)
Furthermore, it is possible to personalize health information for each animal by using machine learning and processing and storing the received data from each animal in the initial minutes of connection and considering a specific data file for each animal, synchronized with that particular animal's moods and physical characteristics. From now on, we can compare the animal's information with the data stored for the same animal, and in case of any interference, quickly become aware of changes in the animal's condition. Of course, in case of stability, after comparing the above conditions with the stored data for all animals and system confirmation, if there is no discrepancy, the animal's health indicator will move to the stable phase.
For example: a cow's heart rate in a general state is 60, but perhaps a cow's normal heart rate in that specific cow is 58. In our initial connection, we observe the number 58. If the received number is not different from the general norm, we consider a heart rate of 58 as the health range for this animal. Based on this algorithm, other items such as temperature, respiration, etc., will also be manageable via machine learning.
To evaluate the cardiac health of the subject cow, an audio recording of the heart sound was captured using a stethoscope and processed using digital signal processing techniques. (Figure 37)
Raw recorded audio:
The raw signal was first filtered using a high-pass filter (cutoff: 40 Hz) to eliminate low-frequency background noise, followed by a low-pass filter (cutoff: 150 Hz) to remove high-frequency disturbances by software program and The resulting signal was then normalized to enhance the audibility of the heartbeat components via The code below:
# Download the output file
files.download(output_filename)
# Install necessary libraries
!pip install librosa matplotlib numpy scipy
# Import libraries
import numpy as np
import librosa
import matplotlib.pyplot as plt
from scipy.signal import spectrogram
# Load the filtered audio file
filtered_audio_path = “heartbeat_filtered.wav” # Name of the filtered file
y, sr = librosa.load(filtered_audio_path, sr=None)
# Plot the waveform
plt.figure(figsize=(12, 6))
plt.plot(y)
plt.title(‘Waveform of Filtered Heartbeat Sound’)
plt.xlabel(‘Samples’)
plt.ylabel(‘Amplitude’)
plt.grid()
plt.show()
Recorded sound processed by intelligent software:
Time-Domain Analysis
The following code displays the filtered and normalized heart sound waveform in the output:
# Calculate and plot the spectrogram
frequencies, times, Sxx = spectrogram(y, fs=sr)
plt.figure(figsize=(12, 6))
plt.pcolormesh(times, frequencies, 10 * np.log10(Sxx), shading=’gouraud’)
plt.colorbar(label=’Intensity (dB)’)
plt.ylabel(‘Frequency (Hz)’)
plt.xlabel(‘Time (s)’)
plt.title(‘Spectrogram of Filtered Heartbeat Sound’)
plt.ylim(0, 500) # Limit frequency for better visibility (you can change this)
plt.grid()
plt.show()
Each beat shows distinct peaks associated with the S1 (“lub”) and S2 (“dub”) components. The amplitude of these peaks suggests the presence of a relatively strong cardiac signal, further supported by the RMS value. (Figure 38)
Frequency-Domain Analysis
The spectrogram of the processed signal displays how the signal energy is distributed across frequencies and time. As expected, most of the signal power is concentrated in the 50–150 Hz range, where the mechanical sounds of heart valves typically reside. Guide lines have been added at 60 Hz and 120 Hz to emphasize the key frequency bands. (Figure 39)
Feature Extraction and Quantitative Assessment
A set of audio features was extracted from the processed signal via this code:
import numpy as np
import pandas as pd
import librosa
# Load the filtered audio file
filtered_audio_path = “heartbeat_filtered.wav” # Name of the filtered file
y, sr = librosa.load(filtered_audio_path, sr=None)
# Calculate heart rate frequency
def calculate_heartbeat_frequency(y, sr):
onset_env = librosa.onset.onset_strength(y=y, sr=sr)
peaks = librosa.onset.onset_detect(onset_envelope=onset_env, sr=sr)
bpm_times = librosa.frames_to_time(peaks, sr=sr)
heart_rate = 60 / np.diff(bpm_times)
return heart_rate
# Calculate RMS
rms_value = np.sqrt(np.mean(y**2))
# Calculate heart rate frequency
heartbeat_frequencies = calculate_heartbeat_frequency(y, sr)
# s1: Mean heart rate frequency
s1 = np.mean(heartbeat_frequencies)
# s2: Standard deviation of heart rate frequency
s2 = np.std(heartbeat_frequencies)
# Prepare data for the table
data = {
‘Feature’: [‘Heart Rate (BPM)’, ‘RMS’, ‘s1 (Mean Heart Rate)’, ‘s2 (Standard Deviation)’],
‘Value’: [np.mean(heartbeat_frequencies), rms_value, s1, s2]
}
# Create DataFrame
df = pd.DataFrame(data)
# Health analysis of the cow based on values
health_analysis = “”
heart_rate = np.mean(heartbeat_frequencies)
rms_threshold = 0.01 # Set RMS threshold (you can change this)
# Health analysis based on mean heart rate frequency
if heart_rate < 60:
health_analysis += “The cow has a low heart rate (below 60 BPM), which may indicate lethargy or underlying health issues.\n”
elif heart_rate > 80:
health_analysis += “The cow has a high heart rate (above 80 BPM), which could suggest stress or health concerns such as fever or dehydration.\n”
else:
health_analysis += “The heart rate is within the normal range (60-80 BPM), suggesting the cow is likely healthy.\n”
# Health analysis based on RMS
if rms_value < rms_threshold:
health_analysis += “The RMS value is low, indicating weak heart function or potential health challenges that need to be addressed.\n”
else:
health_analysis += “The RMS value is acceptable, suggesting good heart amplitude and functionality.\n”
# s1 and s2 analysis
if s2 > 10: # You can apply a new threshold value
health_analysis += “High variability in heart rate (s2) indicates possible stress or health issues that need monitoring.\n”
else:
health_analysis += “Low variability (s2) suggests stable heart rhythm, indicating better health status.\n”
# Add health analysis to DataFrame
health_analysis_df = pd.DataFrame({‘Feature’: [‘Health Analysis’], ‘Value’: [health_analysis]})
df = pd.concat([df, health_analysis_df], ignore_index=True)
# Display the table
print(“Tables and analysis of audio features:”)
print(df)
# Save the table as a CSV file
output_table = “heartbeat_analysis_results.csv”
df.to_csv(output_table, index=False)
print(f”\nThe analysis table has been saved as {output_table}.”)
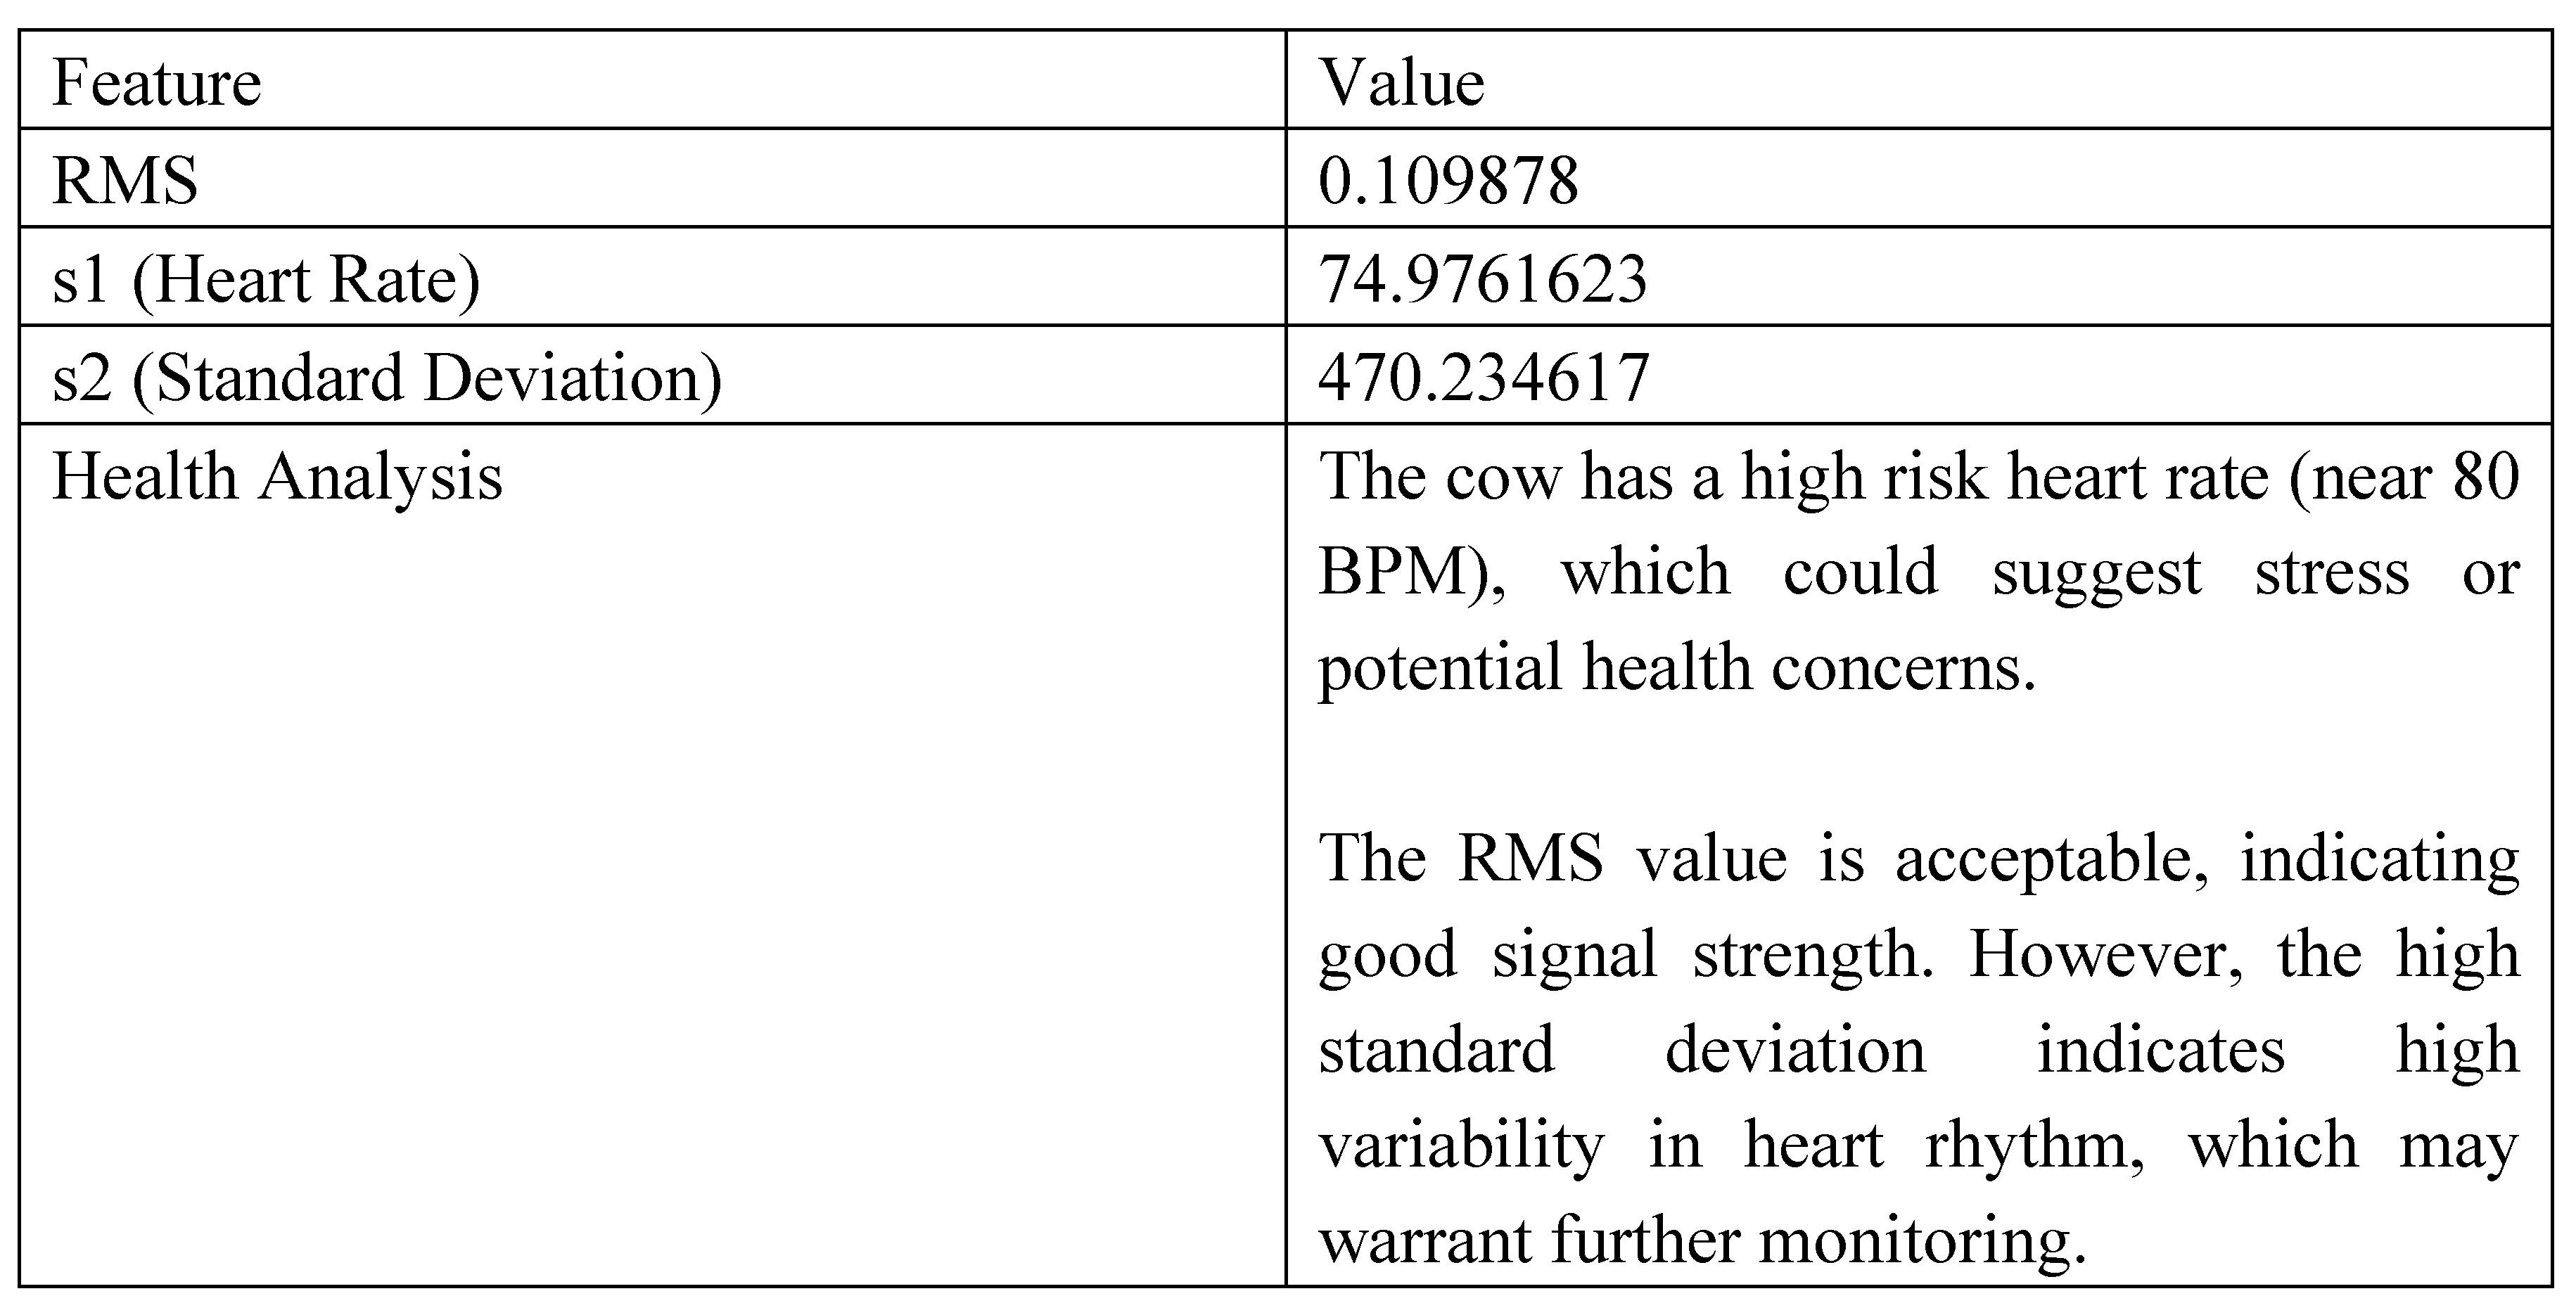
The average heart rate was calculated based on onset peak detection using the onset envelope. The RMS value represents the signal’s energy, while the standard deviation (s2) reflects the variability of the detected beats. (Figure 40)
Health Interpretation
Finally, a report text and interpretation of the animal's health will be sent to the farmer through the following code:
import numpy as np
import pandas as pd
import librosa
# Load the filtered audio file
filtered_audio_path = "heartbeat_filtered.wav" # Name of the filtered file
y, sr = librosa.load(filtered_audio_path, sr=None)
# Function to calculate heart rate frequency
def calculate_heartbeat_frequency(y, sr):
onset_env = librosa.onset.onset_strength(y=y, sr=sr) # Calculate onset strength
peaks = librosa.onset.onset_detect(onset_envelope=onset_env, sr=sr) # Detect peaks
bpm_times = librosa.frames_to_time(peaks, sr=sr) # Convert frames to time
heart_rate = 60 / np.diff(bpm_times) # Calculate heart rate in BPM
return heart_rate
# Calculate RMS value
rms_value = np.sqrt(np.mean(y**2))
# Calculate heart rate frequencies
heartbeat_frequencies = calculate_heartbeat_frequency(y, sr)
# s1: Mean heart rate
s1 = np.mean(heartbeat_frequencies)
# s2: Standard deviation of heart rate
s2 = np.std(heartbeat_frequencies)
# Prepare data for the table
data = {
'Feature': ['Heart Rate (BPM)', 'RMS', 's1 (Mean Heart Rate)', 's2 (Standard Deviation)'],
'Value': [np.mean(heartbeat_frequencies), rms_value, s1, s2]
}
# Create DataFrame
df = pd.DataFrame(data)
# Health analysis based on values
health_analysis = ""
heart_rate = np.mean(heartbeat_frequencies)
rms_threshold = 0.01 # Set RMS threshold (can be adjusted)
# Health analysis based on mean heart rate
if heart_rate < 60:
health_analysis += "The cow has a low heart rate (below 60 BPM), indicating lethargy or underlying health issues. Immediate medical checkup is recommended.\n"
elif heart_rate > 80:
health_analysis += "The cow has a high heart rate (above 80 BPM), suggesting stress or health concerns such as fever or dehydration. Monitoring should be increased to identify the cause of this condition.\n"
else:
health_analysis += "The heart rate is within the normal range (60-80 BPM), suggesting the cow is likely healthy. Regular monitoring is still recommended to ensure continued health.\n"
# Health analysis based on RMS
if rms_value < rms_threshold:
health_analysis += "The RMS value is low, indicating weak heart function or potential health challenges. Veterinary advice is strongly suggested to investigate this condition further.\n"
else:
health_analysis += "The RMS value is acceptable, suggesting good heart amplitude and functionality. It indicates that the cow has a healthy heart at this moment.\n"
# s1 and s2 analysis
if s2 > 10: # You can apply a new threshold value
health_analysis += "High variability in heart rate (s2) indicates possible stress or health issues. Continuous monitoring and possible interventions may be required.\n"
else:
health_analysis += "Low variability (s2) suggests a stable heart rhythm, indicating better health status and lower stress levels in the cow.\n"
# Additional explanations on acceptable ranges
health_analysis += "\nAcceptable values and implications for cow health:\n"
health_analysis += "1. Heart Rate (BPM):\n"
health_analysis += " - Normal Range: 60-80 BPM (Healthy)\n"
health_analysis += " - Below 60 BPM: Possible lethargy or health issues.\n"
health_analysis += " - Above 80 BPM: Possible stress, fever, or dehydration.\n"
health_analysis += "\n2. RMS Value:\n"
health_analysis += " - Acceptable: Greater than 0.01 (Indicates good heart function)\n"
health_analysis += " - Low: Less than 0.01 (May indicate weak heart function)\n"
health_analysis += "\n3. Standard Deviation (s2):\n"
health_analysis += " - Low (<= 10): Indicates stable heart rhythm (Better health)\n"
health_analysis += " - High (> 10): Indicates variability (Possible stress or health issues)\n"
# Add health analysis to DataFrame
health_analysis_df = pd.DataFrame({'Feature': ['Health Analysis'], 'Value': [health_analysis]})
df = pd.concat([df, health_analysis_df], ignore_index=True)
# Display the table
print("Audio Feature Analysis and Health Assessment:")
print(df)
# Detailed health assessment explanation
detailed_explanation = """
Final report output:
Detailed Health Assessment:
The heart rate was near the above up range (60–80 BPM), which may suggest stress, fever, or dehydration.
The RMS value was sufficiently high (> 0.01), indicating strong signal amplitude and suggesting no immediate cardiac weakness.
However, the high variability (s2 > 10) in beat intervals points to potential irregularities in rhythm, which may require further investigation.
The analysis of the cow's heart rate and RMS values provides valuable insights into its health condition. Here’s a breakdown of the findings:
-
**Heart Rate (BPM)**: The average heart rate is a critical indicator of the cow's overall health.
- -
- A heart rate within the normal range (60-80 BPM) suggests that the cow is healthy and does not exhibit signs of distress.
- -
- A heart rate below 60 BPM may indicate lethargy, which could stem from various underlying health issues such as infections or anemia. If observed, a veterinary checkup is essential to rule out serious conditions.
- -
- Conversely, a heart rate above 80 BPM can suggest stress, fever, or dehydration. This may require closer monitoring and possible intervention to address the underlying cause.
-
**RMS Value**: The Root Mean Square (RMS) value reflects the amplitude of the heart's electrical signal.
- -
- An acceptable RMS value (greater than 0.01) indicates that the heart is functioning well, with strong contractions and efficient blood flow.
- -
- A low RMS value could signal weak heart function, necessitating further veterinary assessment to identify potential health challenges.
-
**Standard Deviation (s2)**: This metric indicates the variability of the heart rate.
- -
- A low standard deviation (≤ 10) suggests a stable heart rhythm, which is generally associated with good health and low stress levels.
- -
- A high standard deviation (> 10) indicates significant variability in heart rate, which may be a sign of stress or health issues requiring ongoing observation and possibly medical intervention.
End of the test and report section.
The strategy of using artificial intelligence technologies, artificial neural networks, and machine learning to perform the above steps as well as how to use the Internet of Things to transfer information, and also the results of the tests will be gradually added to this part of the article.
8. Needs and Future Research:
The effective use of online pulse detection sensor systems can significantly assist in improving the health care system for livestock in farms. This system provides farmers with the ability to monitor the health status of cattle more accurately and hygienically, ultimately leading to increased production efficiency and reduced farming costs. A wireless collar system with sensors for temperature, humidity, accelerometer, pulse, etc., along with a central data processing system, has been developed and is ready for use. Our main research focuses on prototyping a diaphragm and sensor housing compatible with the sensors needed to capture the internal body sounds of animals such as heartbeat, respiration, nutrition, etc. Furthermore, the use of artificial intelligence (AI) and artificial neural networks (ANN) for processing received sounds for monitoring livestock health through livestock body sounds and the use of Internet of Things (IoT) technology for data integration will be employed.
If necessary, the possibility of integrating ultrasonic and electrocardiogram systems are available. To upgrade the system, we can utilize ultrasonic systems to construct a microcontroller for monitoring heart rate and blood pressure, as well as piezoelectric devices for charging the module from energy received from vein vibrations. The subcutaneous module will be placed near the main neck vein of the animal for optimal use.
Achieving these goals has required months of effort and research by engineers and farmers, as well as the assistance and collaboration of veterinarians, to reach a good level of awareness. Now, for faster progress and to enhance the quality of processing data received from sensors, a more detailed examination of farmers' needs, identification of suitable body areas for monitoring different types of animals, and the detection and separation of sounds related to the heart, respiratory system, digestive system, etc., are necessary. Collaborating with specialists, farmers, veterinarians, and universities for professional sound processing and the construction of subcutaneous modules is invaluable and essential to us.
9. Conclusions:
This article aims to present a novel and efficient solution in the field of livestock health care using wireless sensor technologies, IOT, artificial intelligence(AI), and artificial neural networks (ANN). In existing collar-based systems, temperature and accelerometer sensors have been used for monitoring cattle health, and efforts to obtain heart rate information to complement this system are ongoing.
The use of light-based sensors for receiving pulse information from animals has been somewhat successful, but it has not yet reached the required quality due to the thickness of animal skins. In this article, sound detection and processing technology is considered instead of light for receiving information related to animal health. Initial experiments indicate a high probability of achieving a novel system for upgrading health monitoring systems. A system that provides the ability to improve the health and productivity of cattle and provides farmers with an effective tool for optimal farming management.
Wider collaboration with scientific and research centers, as well as closer communication with livestock health companies, universities, and researchers in the field of animal husbandry and veterinary medicine internationally, will greatly assist in improving experiments and accelerating research progress.
| 1 | |
| 2 |
References
- Kunja Bihari, Meerina Patro, kumar pattnayak, Satyasopan Mahato. Cattle health monitoring system using Arduino and LabVIEW for early detection of diseases. Revis Bionatura 2022; 7 (3) 30.
- Create an IoT-based Smart Collar Digital Tool, Lecturers and Students of ASEAN’s Best Private University Help Increase Cattle Growth Productivity at CV Sapi Sport. https://teknokrat.ac.id/create-an-iot-based-smart-collar-digital-tool-lecturers-and-students-of-aseans-best-private-university-help-increase-cattle-growth-productivity-at-cv-sapi-sport.
- Yan Cui, Mengjie Zhang, Jun Li,Hailing Luo, Xiaoshuan Zhang, Zetian Fu. Wearable Stress Monitoring System Based on IoT Multi-Sensor Platform for Living Sheep Transportation. Electronics 2019, 8(4), 441; [CrossRef]
- Wei Tang, Amin Biglari, Ryan Ebarb, Tee Pickett, Samuel Smallidge, Marcy Ward. Remote Monitoring of CATtle’s Heart Rate, Temperature, and Daily Steps with Smart Sprinkler System. https://link.springer.com/chapter/10.1007/978-3-031-50327-6_8.
- IoT-Enabled Cattle Health and Location Monitoring System. January 2021. DOI:10.33564/IJEAST.2021.v05i09.042. https://www.researchgate.net/publication/352379751_IOT_-_LIVESTOCK_MONITORING_AND_MANAGEMENT_SYSTEM.
- A wearable photoplethysmography sensor for non-invasive equine heart rate monitoring. October 2023, 100264. https://www.sciencedirect.com/science/article/pii/S2772375523000941?ref=pdf_download&fr=RR-2&rr=85ea69c36add8ec3.
- Deployment of Wireless Sensor Network and IoT Platform to Implement an Intelligent Animal Monitoring System. Sustainability 2022, 14(10), 6249; [CrossRef]
- Classifying Chewing and Rumination in Dairy Cows Using Sound Signals and Machine Learning. Animals 2023, 13(18), 2874; [CrossRef]
- Automatic Heart Rate Detection during Sleep Using Tracheal Audio Recordings from Wireless Acoustic Sensor. Diagnostics 2023, 13(18), 2914; [CrossRef]
- Wearable Ultrasound Patch Monitors Blood Pressure Nature Biomedical Engineering volume 2, pages687–695 (2018) https://directorsblog.nih.gov/2018/11/01/wearable-ultrasound-patch-monitors-blood-pressure/.
- Preliminary comparison of respiratory signals using acceleration on neck https://www.researchgate.net/figure/a-Schematic-of-measurement-setup-b-Sensor-with-a-neck-lanyard-Red-circle-indicates-the_fig2_341624337.
- Wearable sensor detects heartbeat and allows voice control of remote devices. https://newatlas.com/heart-acoustic-sensor-monitor/46506/.
- Pregnancy detection and monitoring in cattle via combined foetus electrocardiogram and phonocardiogram signal processing. BMC Veterinary Research volume 8, Article number: 164 (2012) https://bmcvetres.biomedcentral.com/articles/10.1186/1746-6148-8-164.
- Heart Rate Detection using a Piezoelectric Ceramic Sensor. Revis Bionatura 2022; 7 (3) 30. https://scholar.google.com/scholar?q=Heart+Rate+Detection+using+a+Piezoelectric+Ceramic+Sensor&hl=en&as_sdt=0&as_vis=1&oi=scholart.
- Azimi, Sara and Abolhosni, Mohammad Mahdi, 1400, Development of a piezoelectric nanogenerator based on polyvinylidene fluoride to start a heart pacemaker, National Polymer Conference of Iran, Tabriz, https://civilica.com/doc/1349474.
Figure 1.
Smart collars.
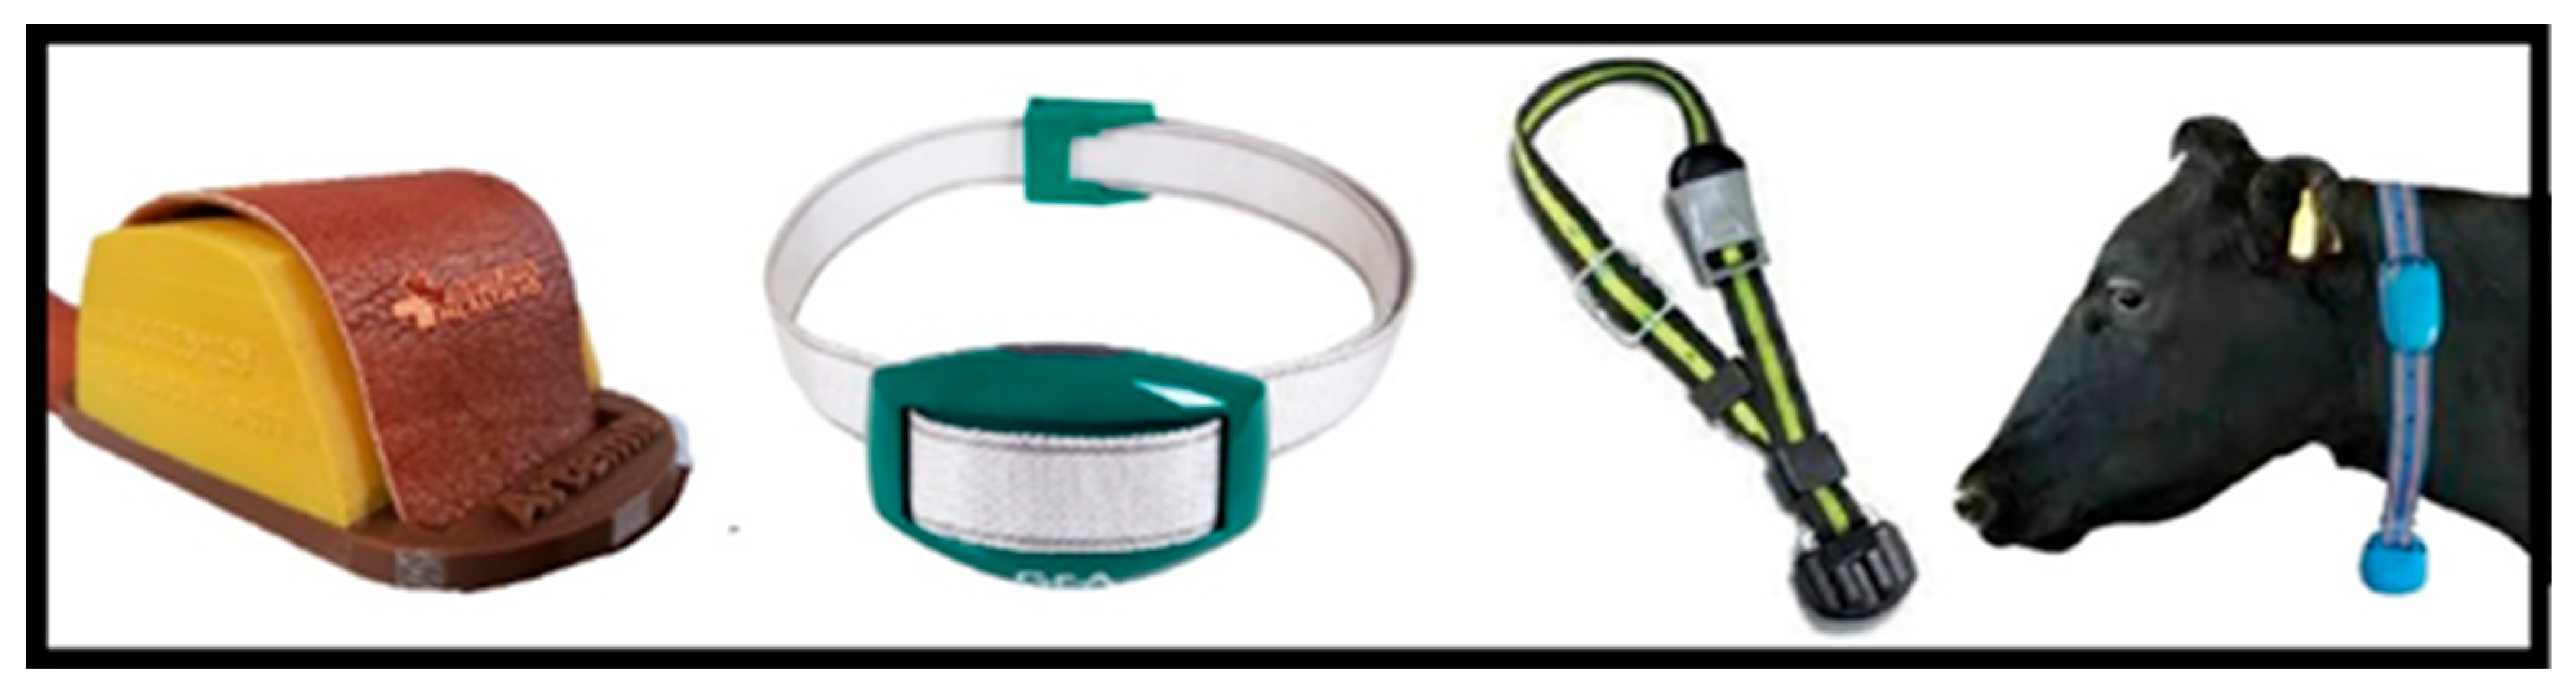
Figure 2.
Getting pulse from the behind of the ear.
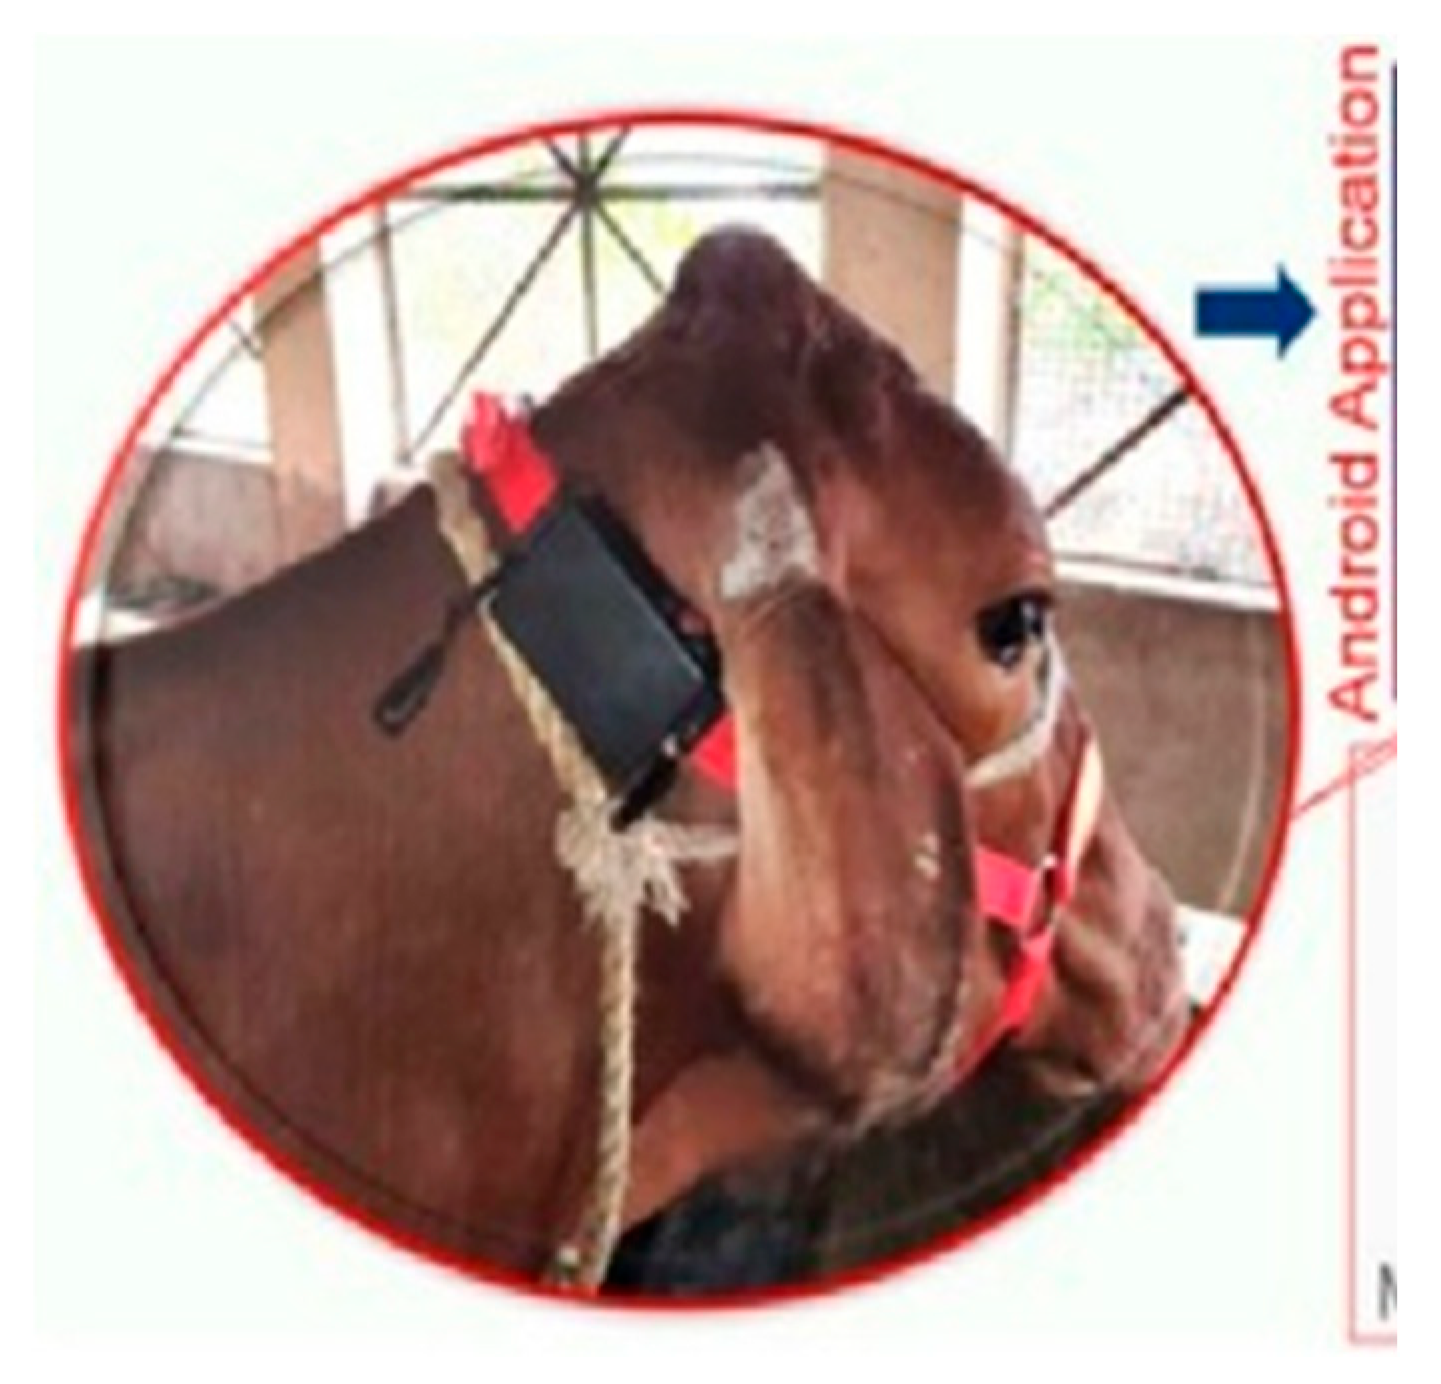
Figure 3.
Taking a beating from the sheep.
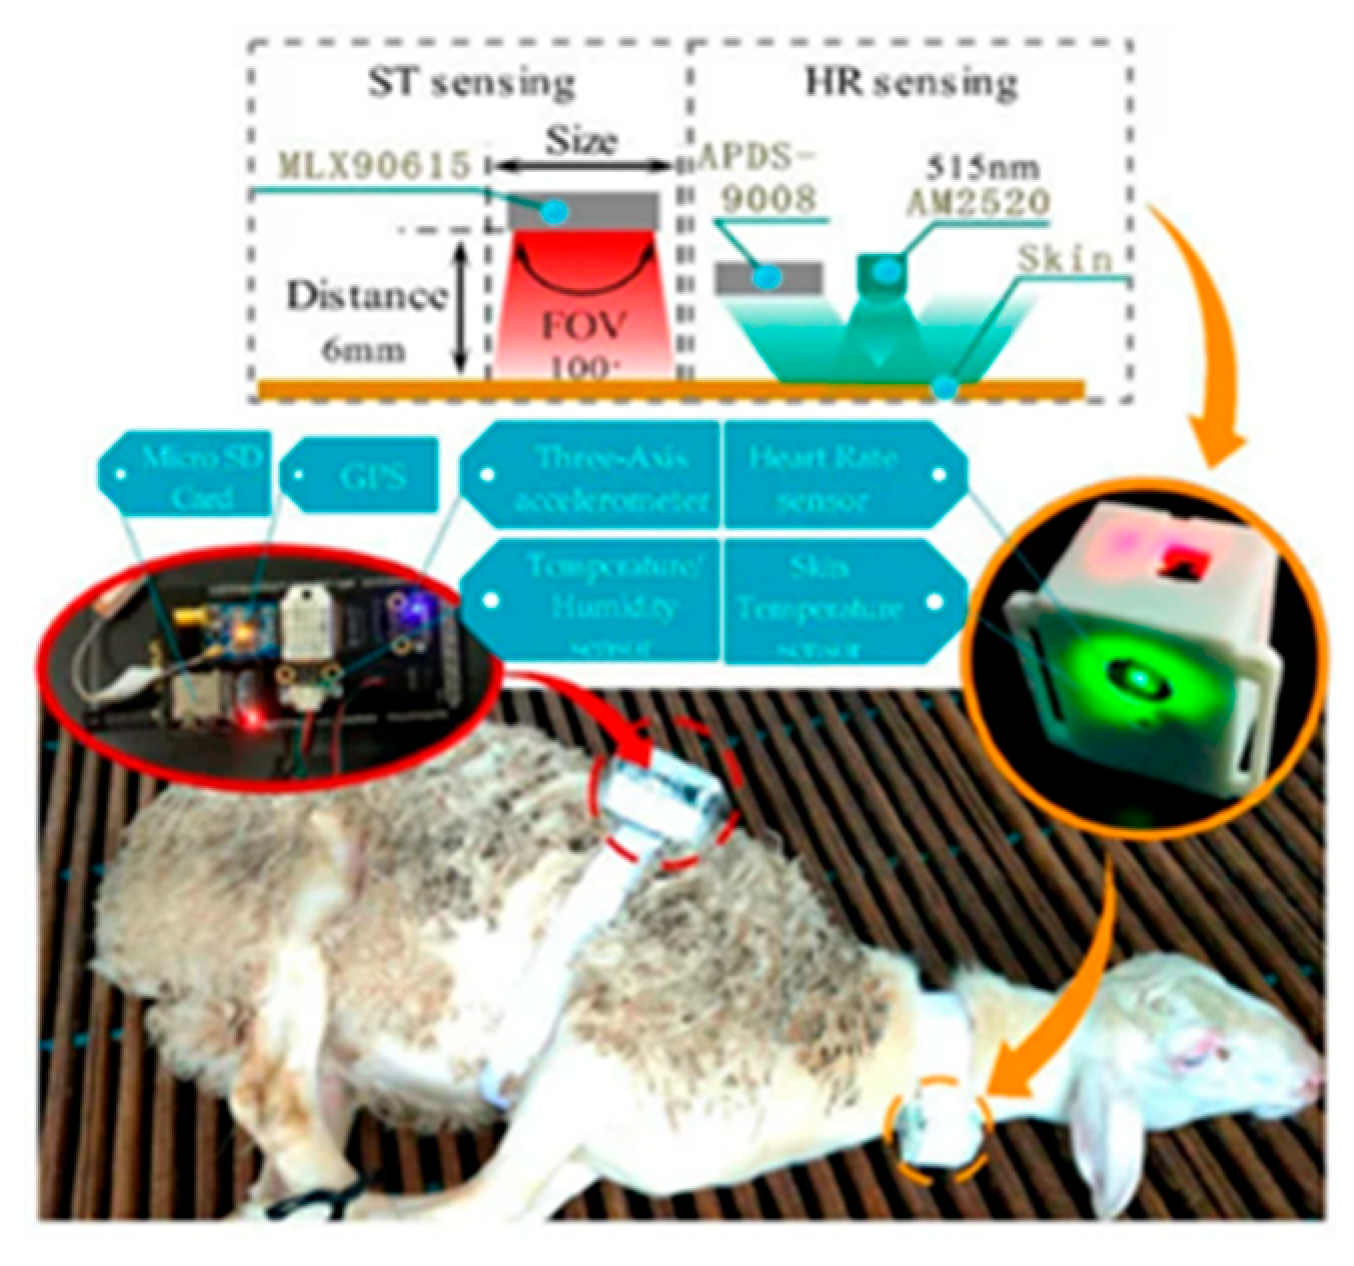
Figure 4.
Integration of electrode and pulse.
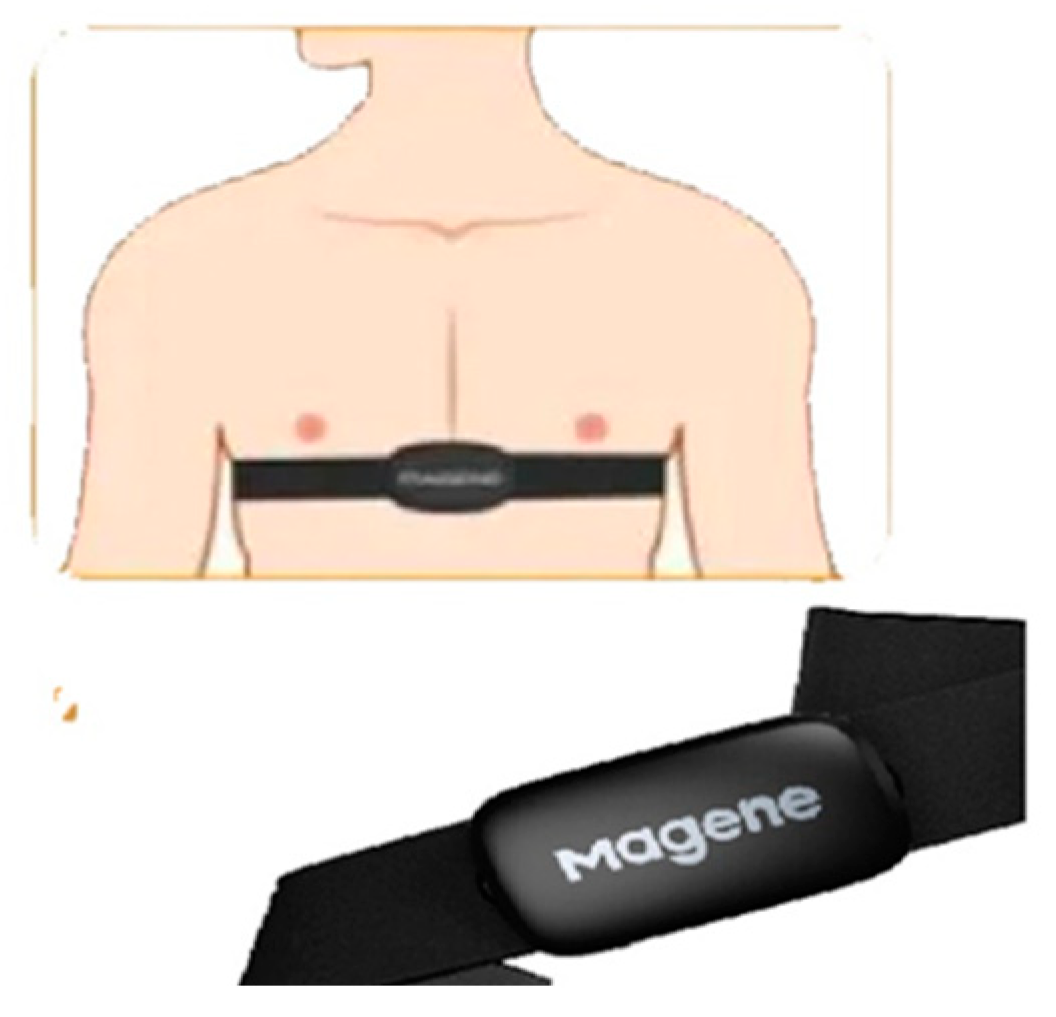
Figure 5.
Getting a pulse from the tail.
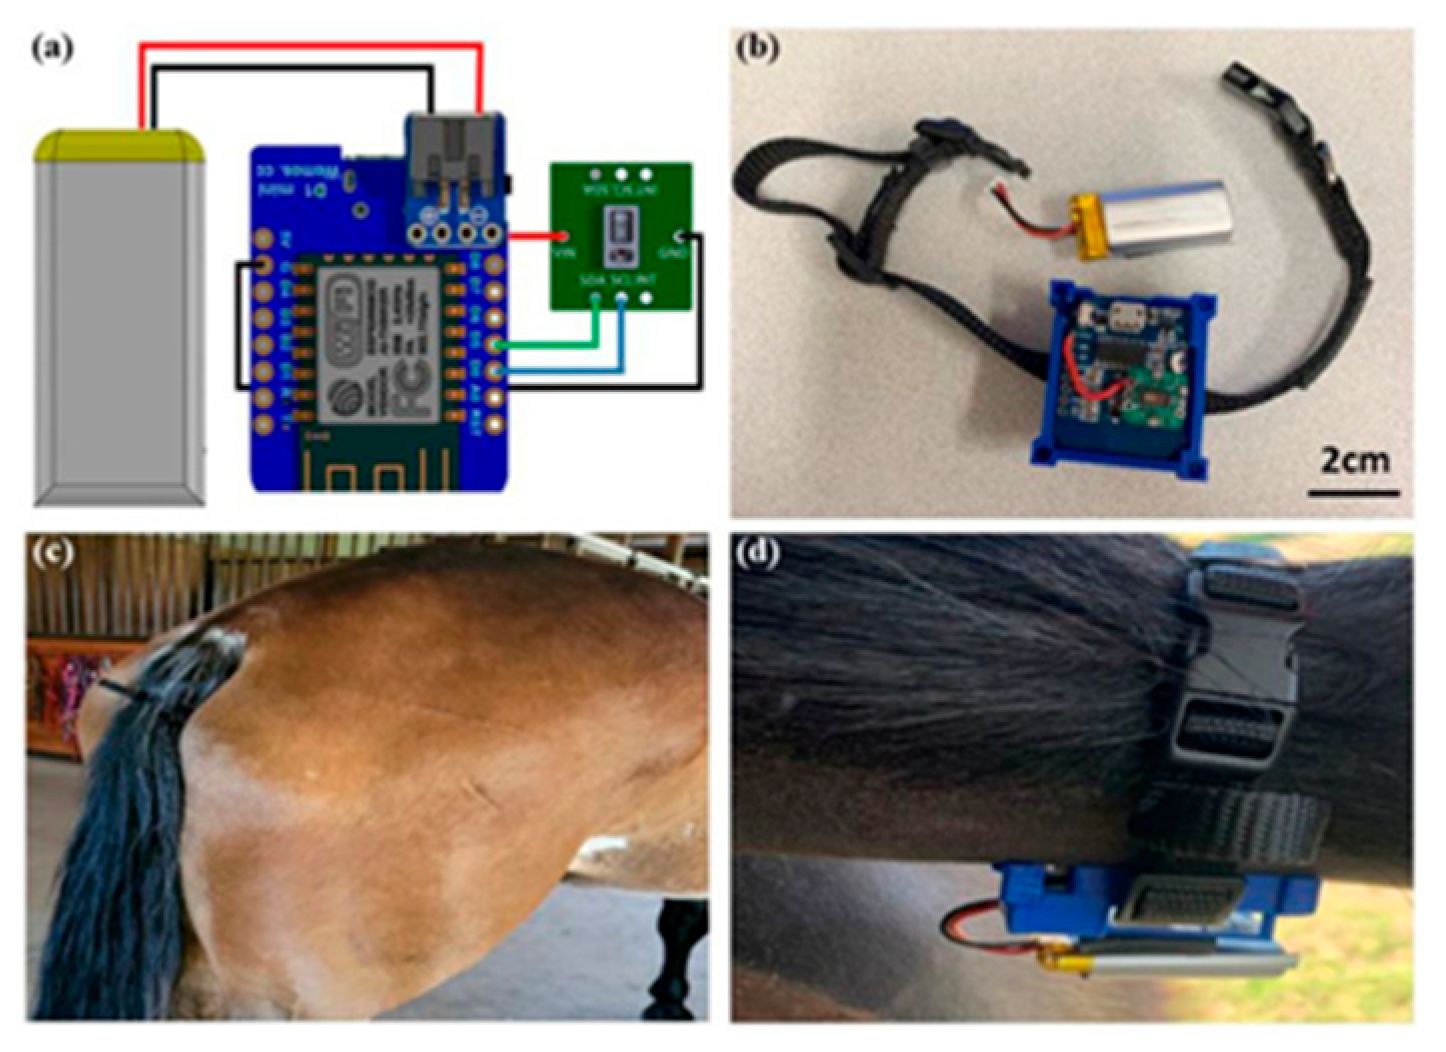
Figure 6.
Intelligent Animal Monitoring System by using stethoscope.
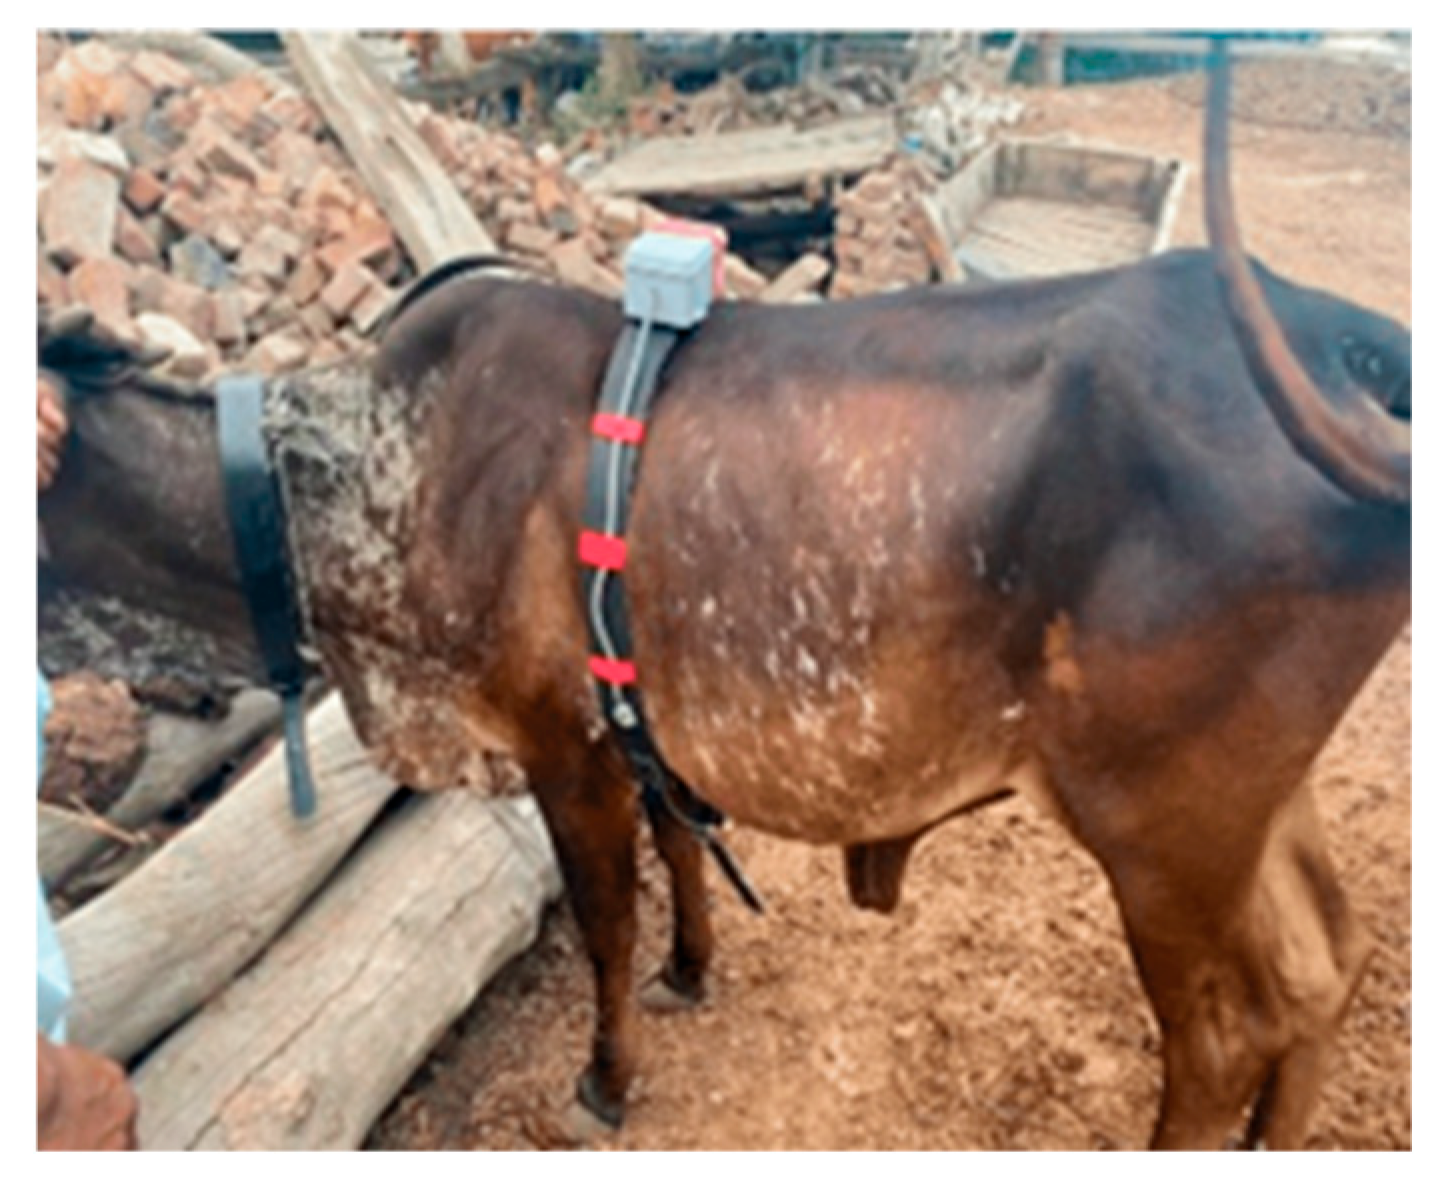
Figure 7.
Classifying Chewing and Rumination in Dairy Cows Using Sound Signals.
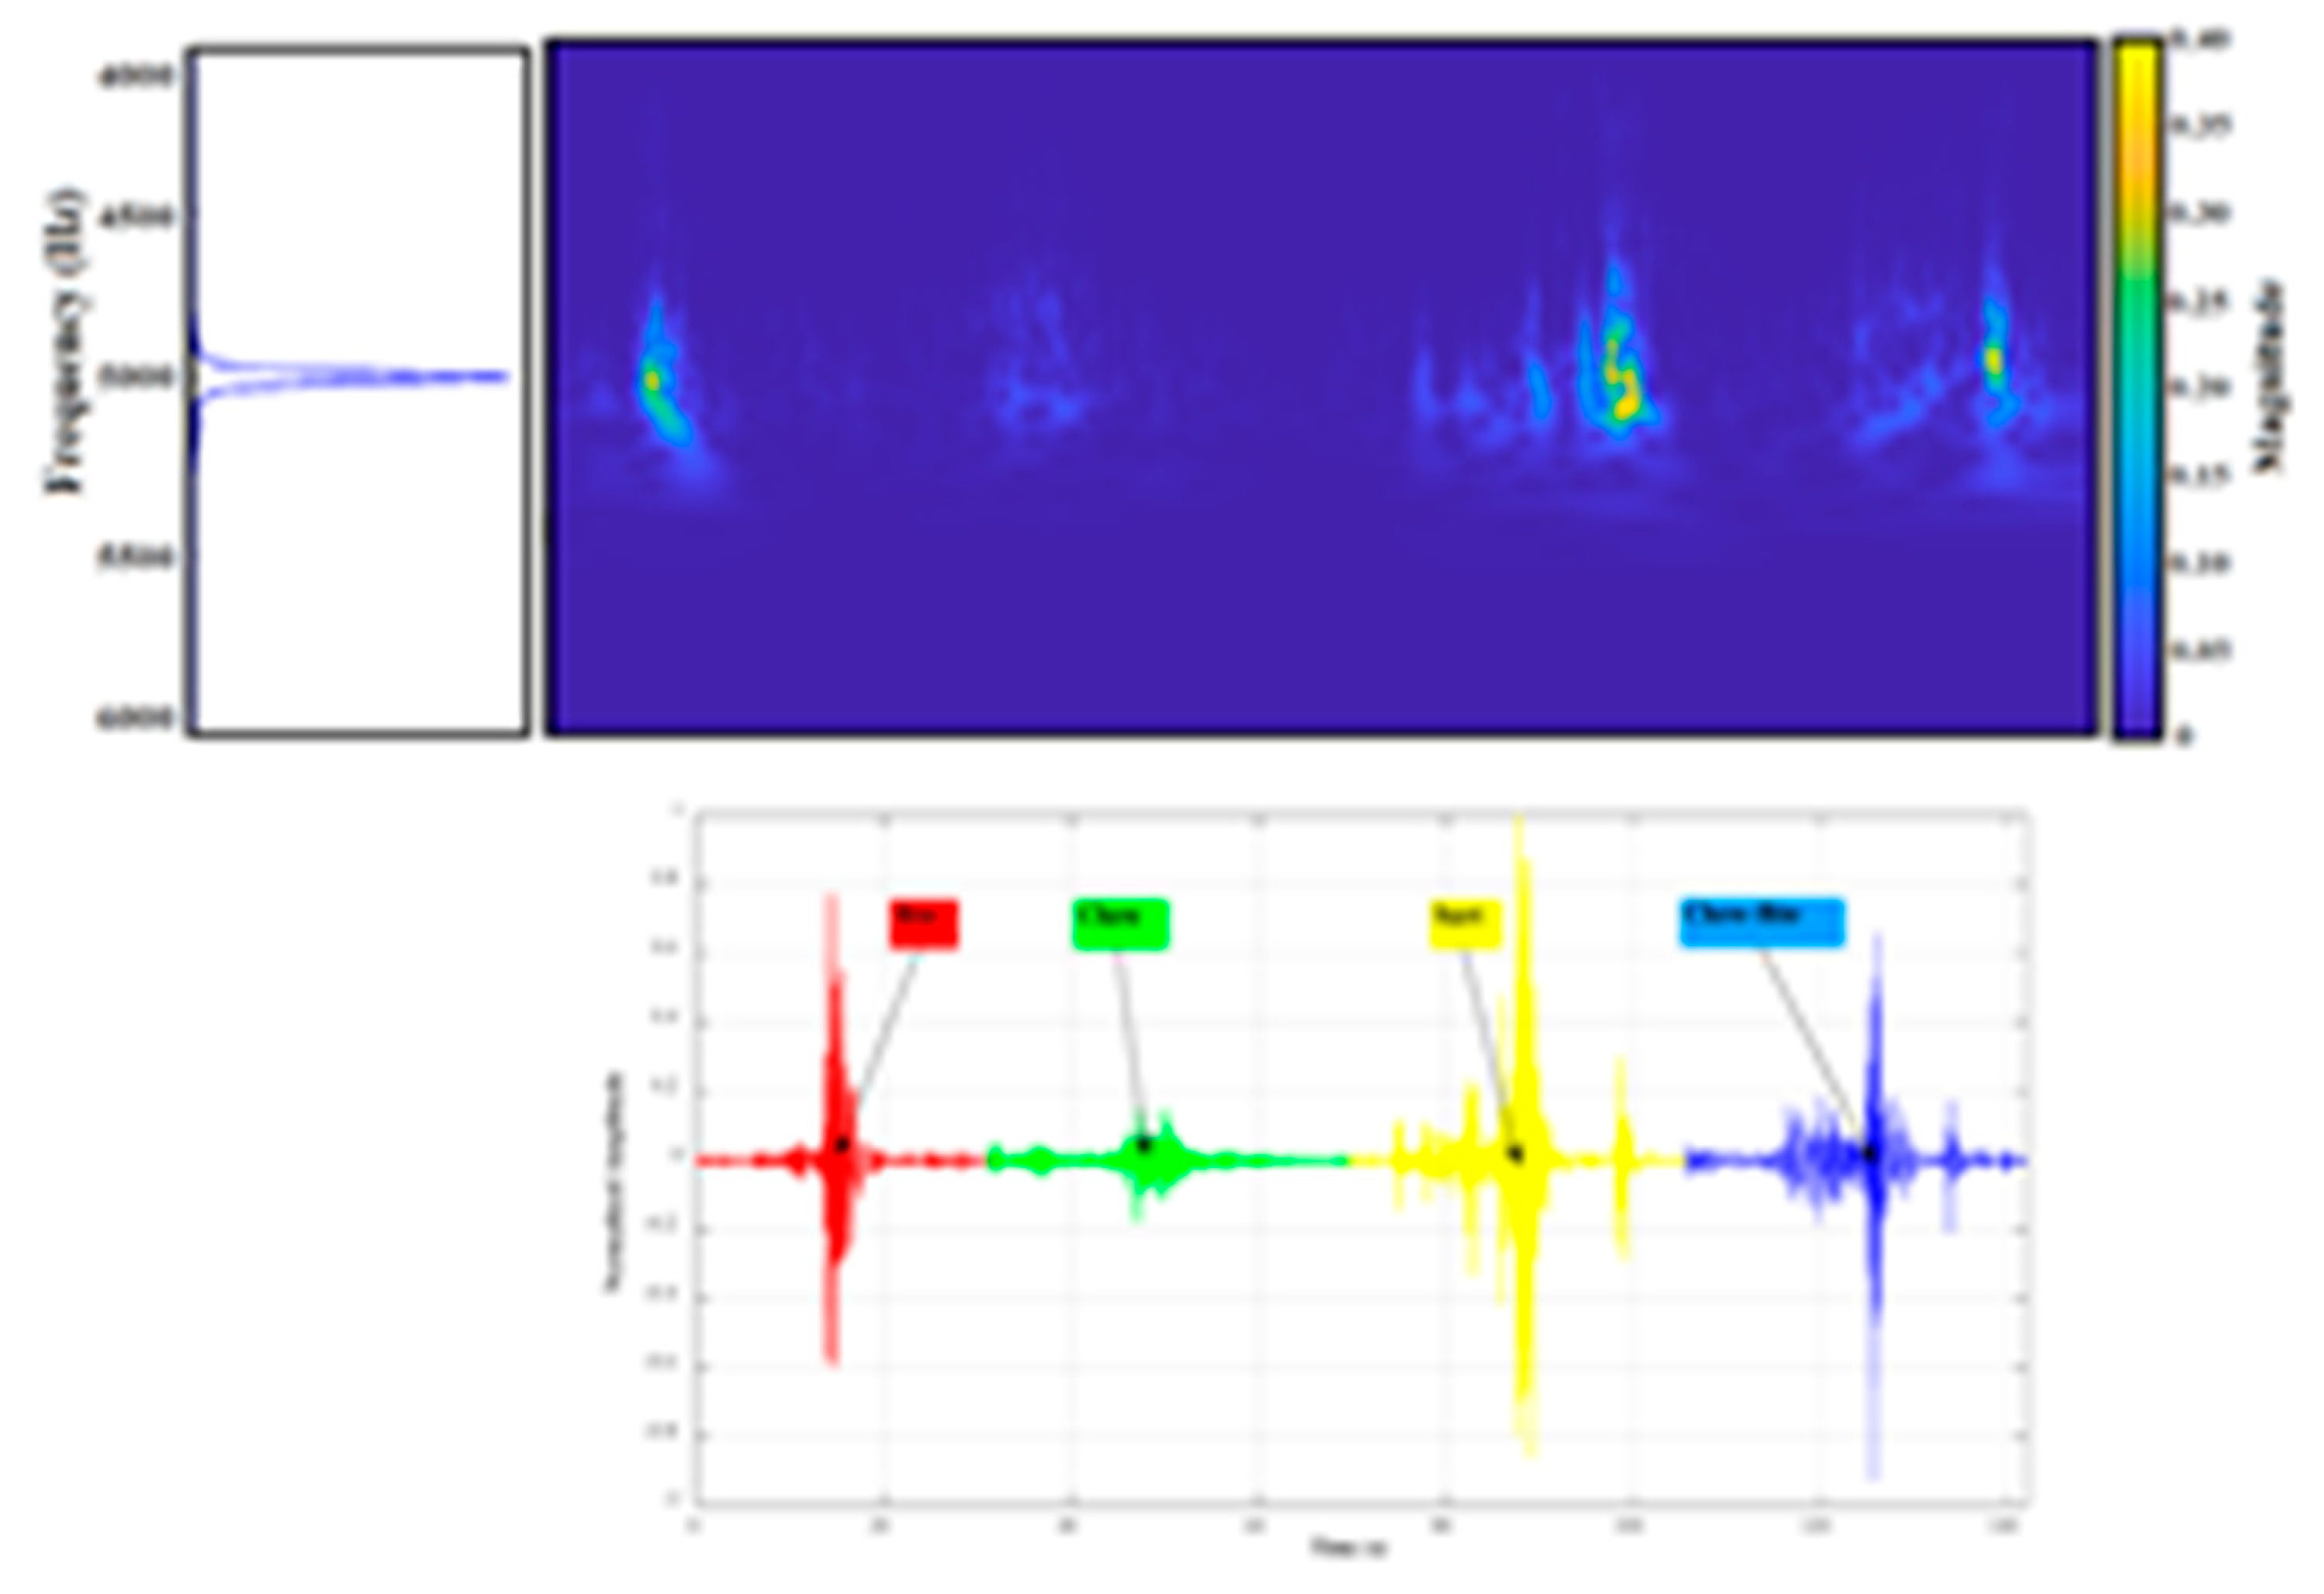
Figure 8.
IOT-Enabled Cattle Health and Location Monitoring System.
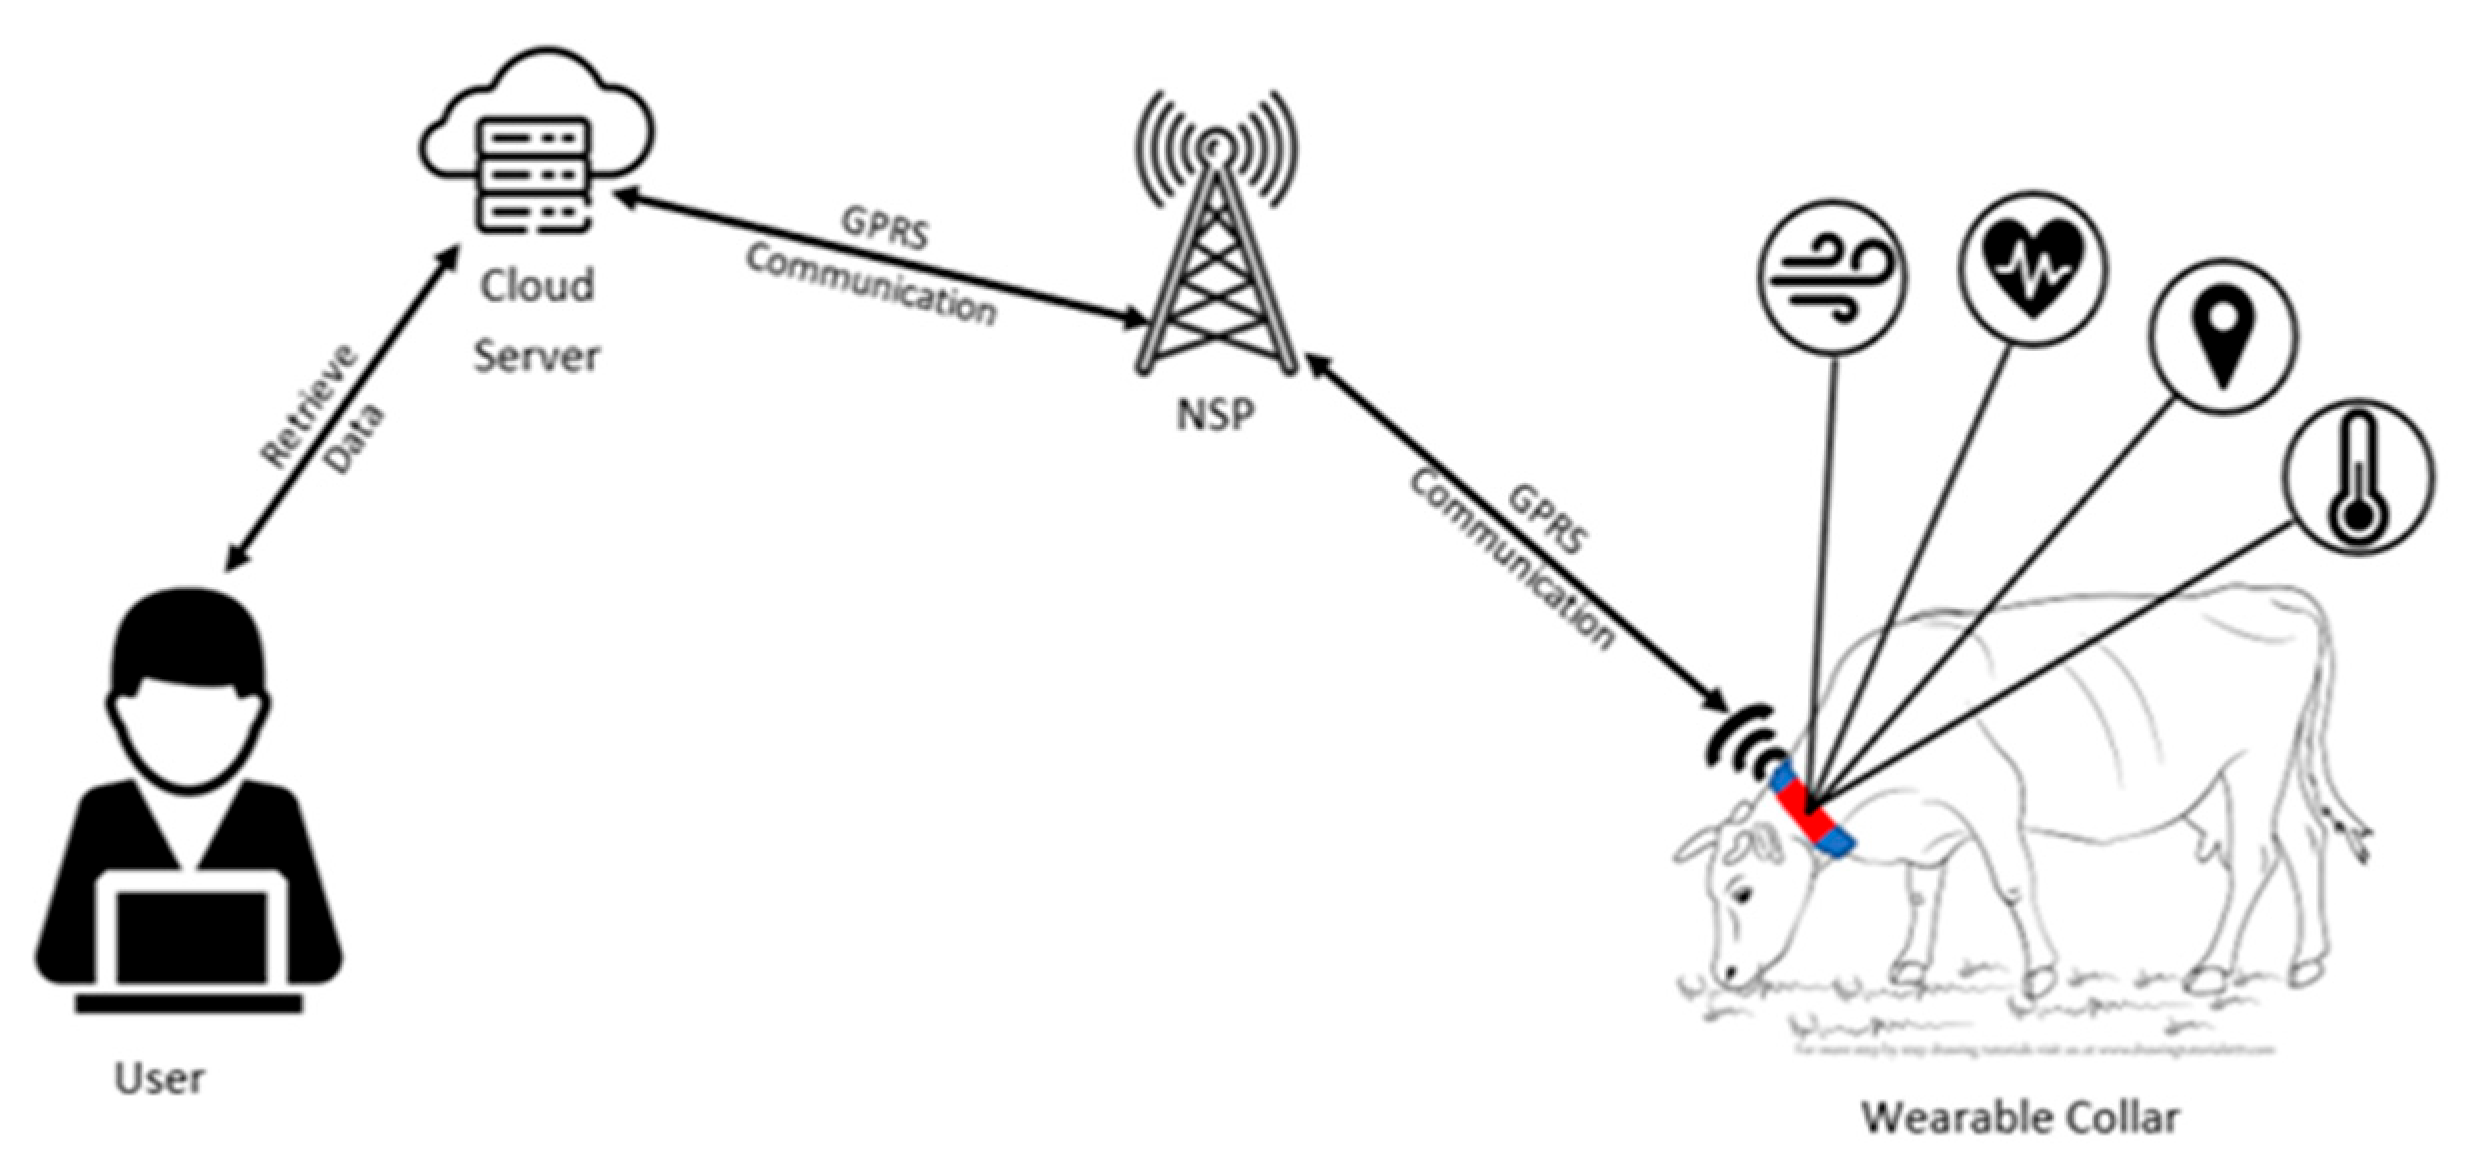
Figure 9.
Measuring HEART RATE with PIEZO.
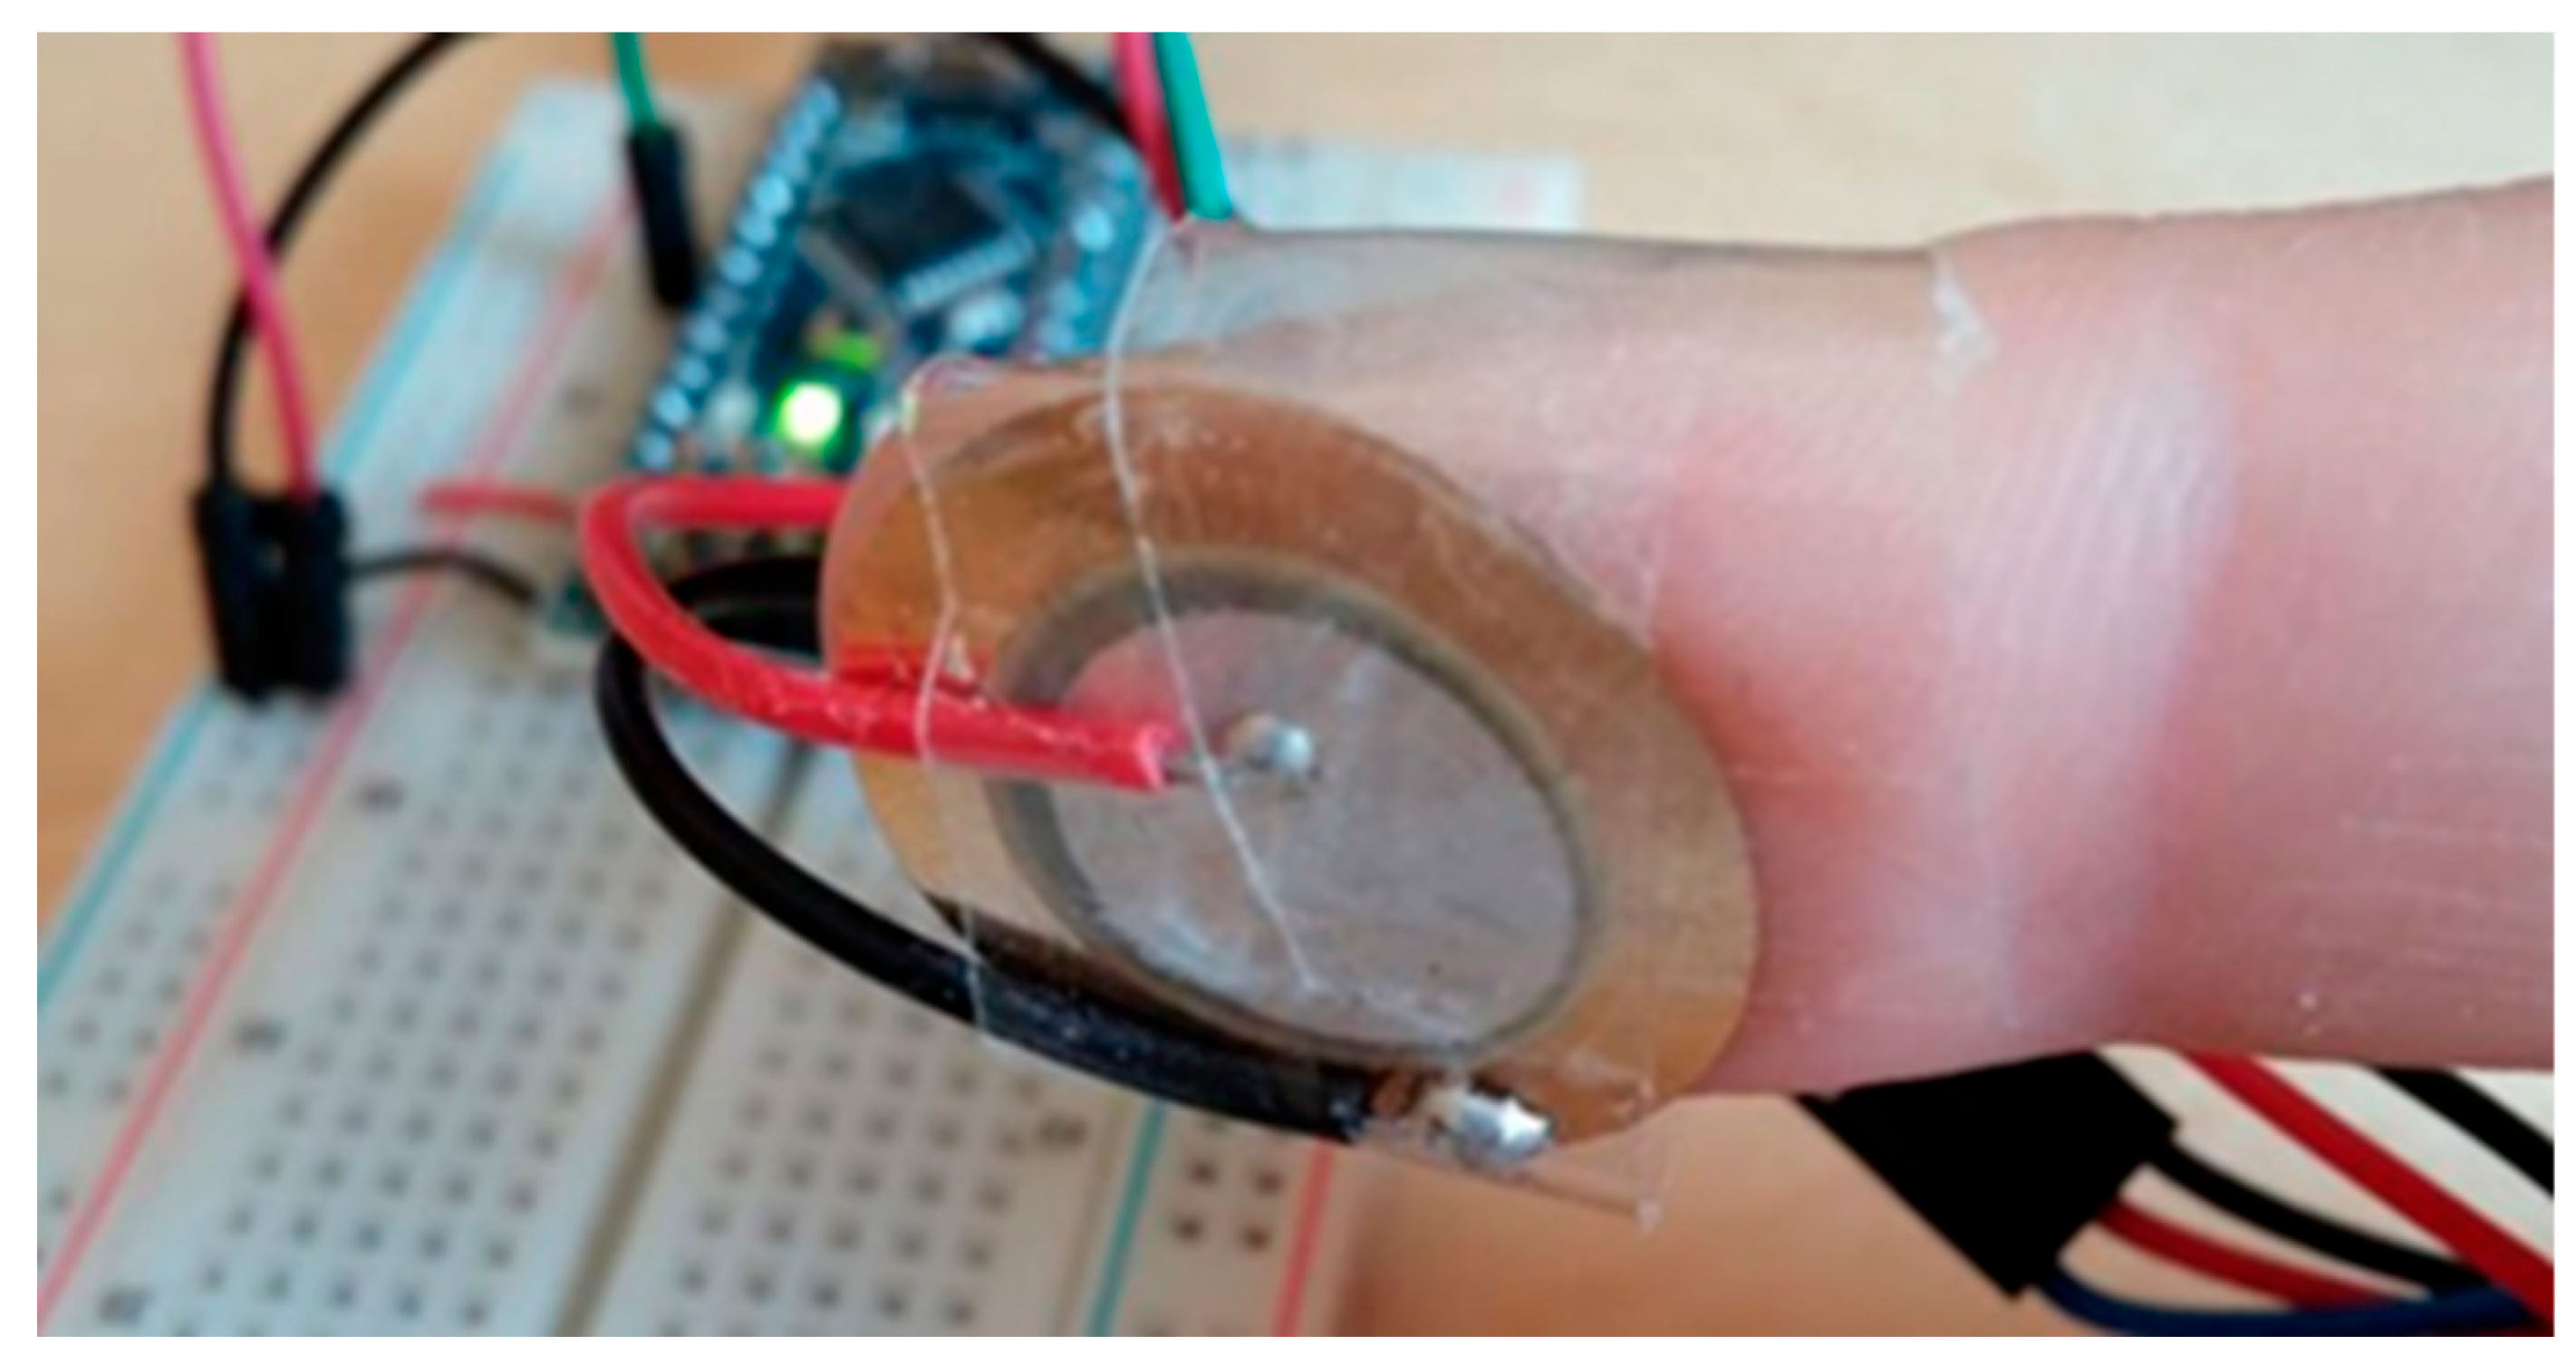
Figure 10.
Phonocardiogram.
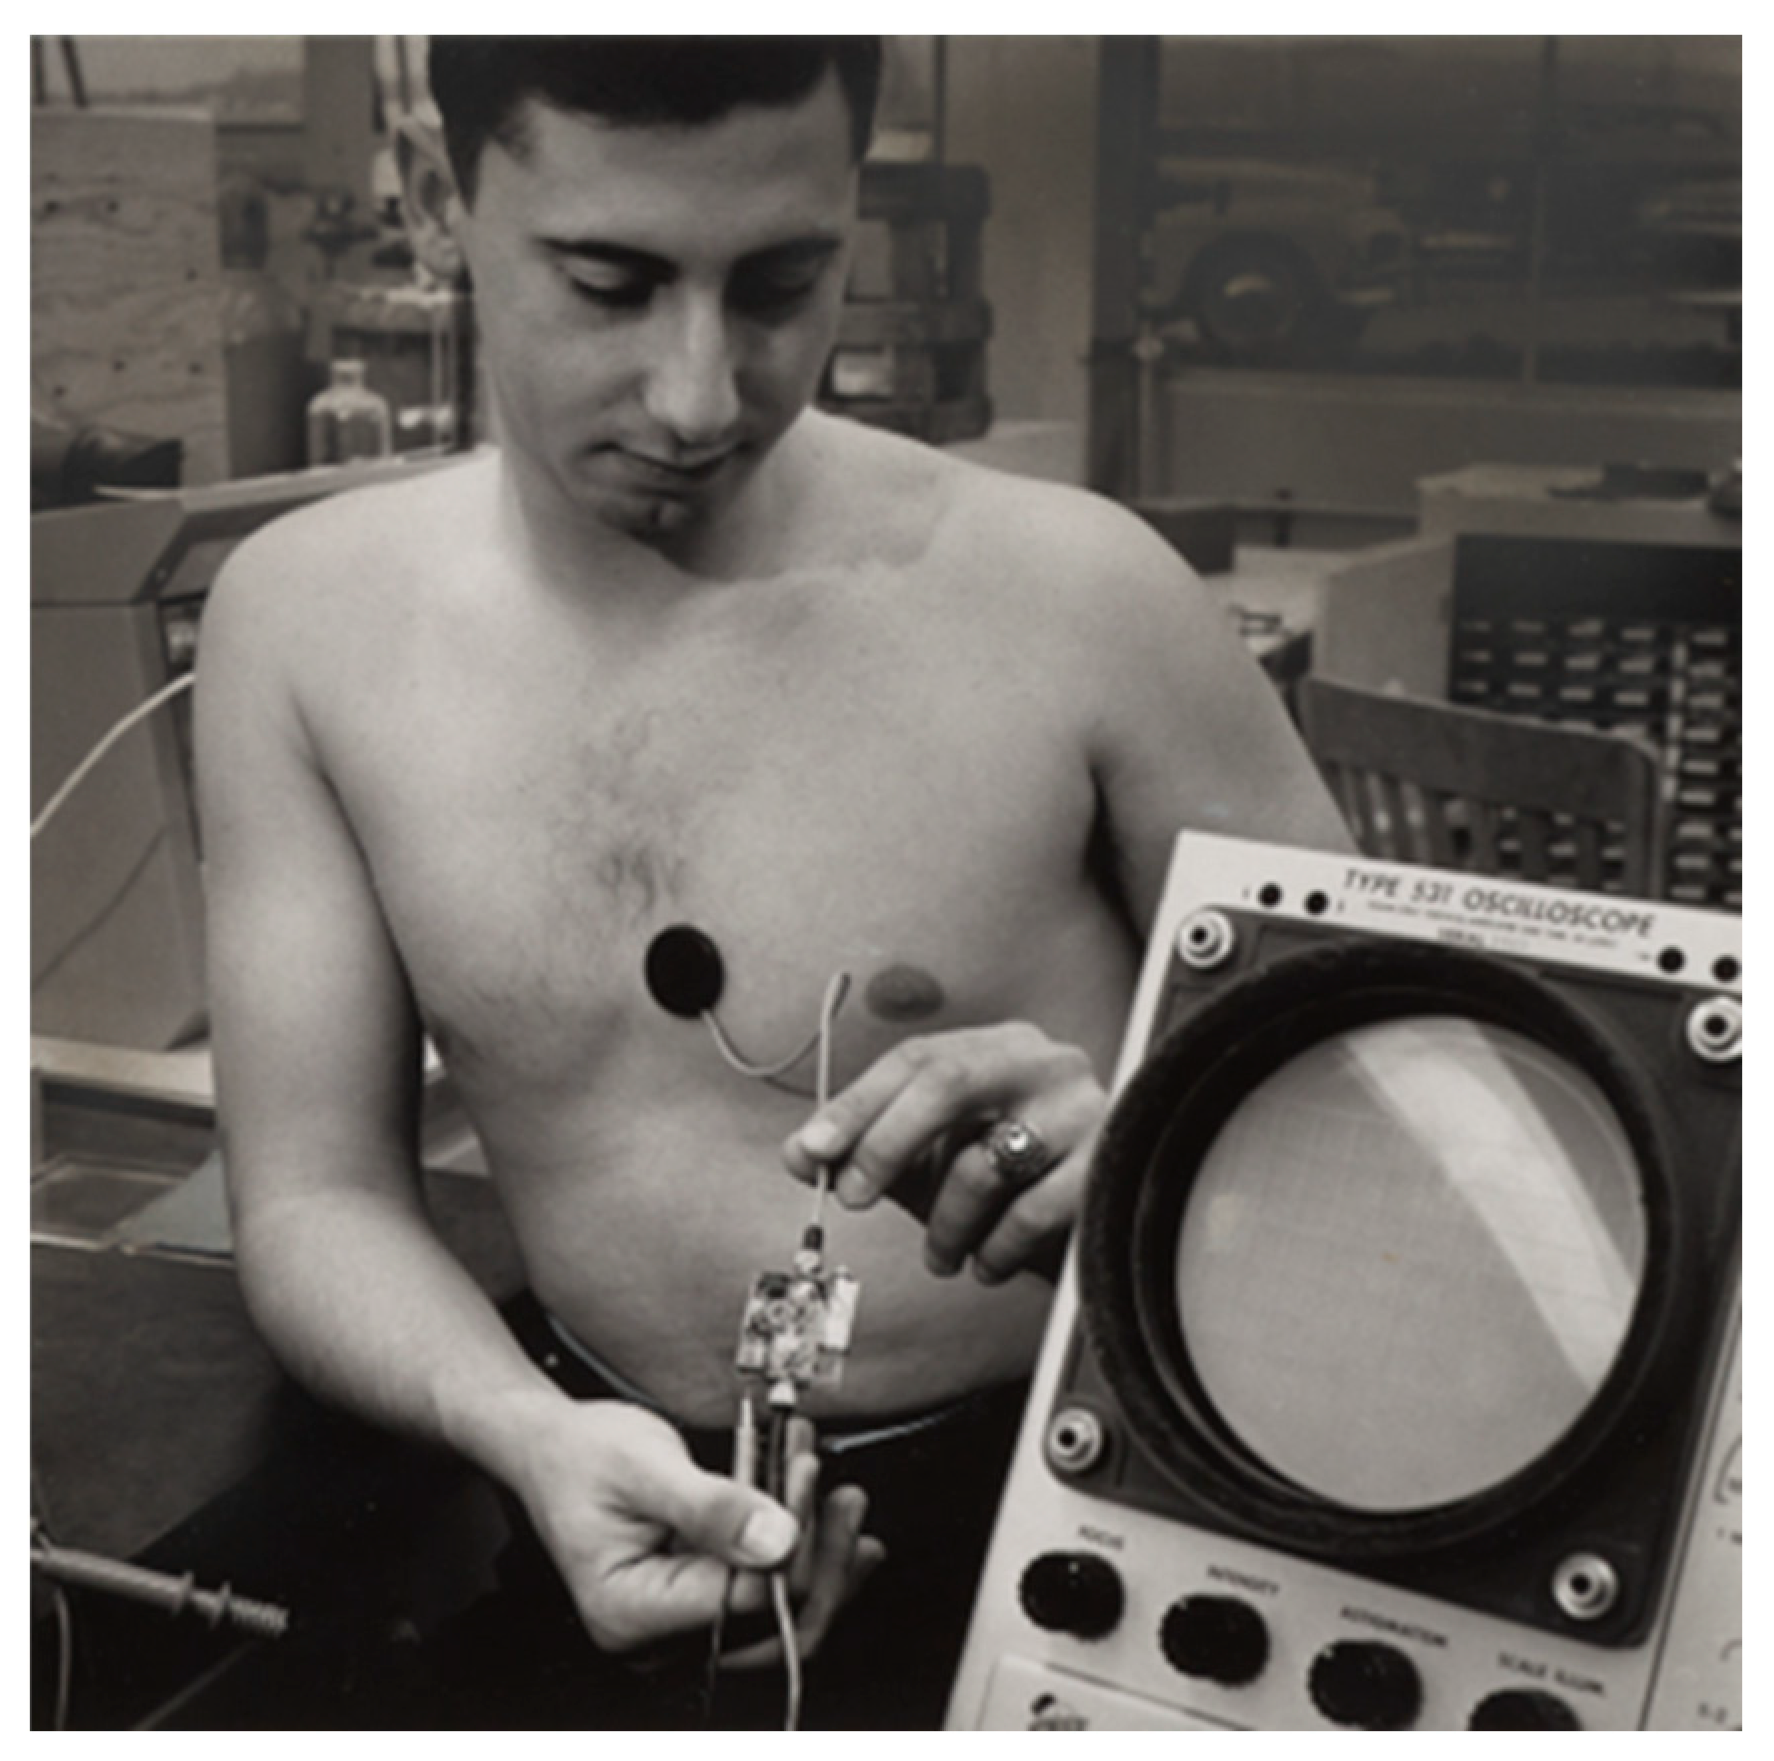
Figure 11.
Photoplethysmogram .
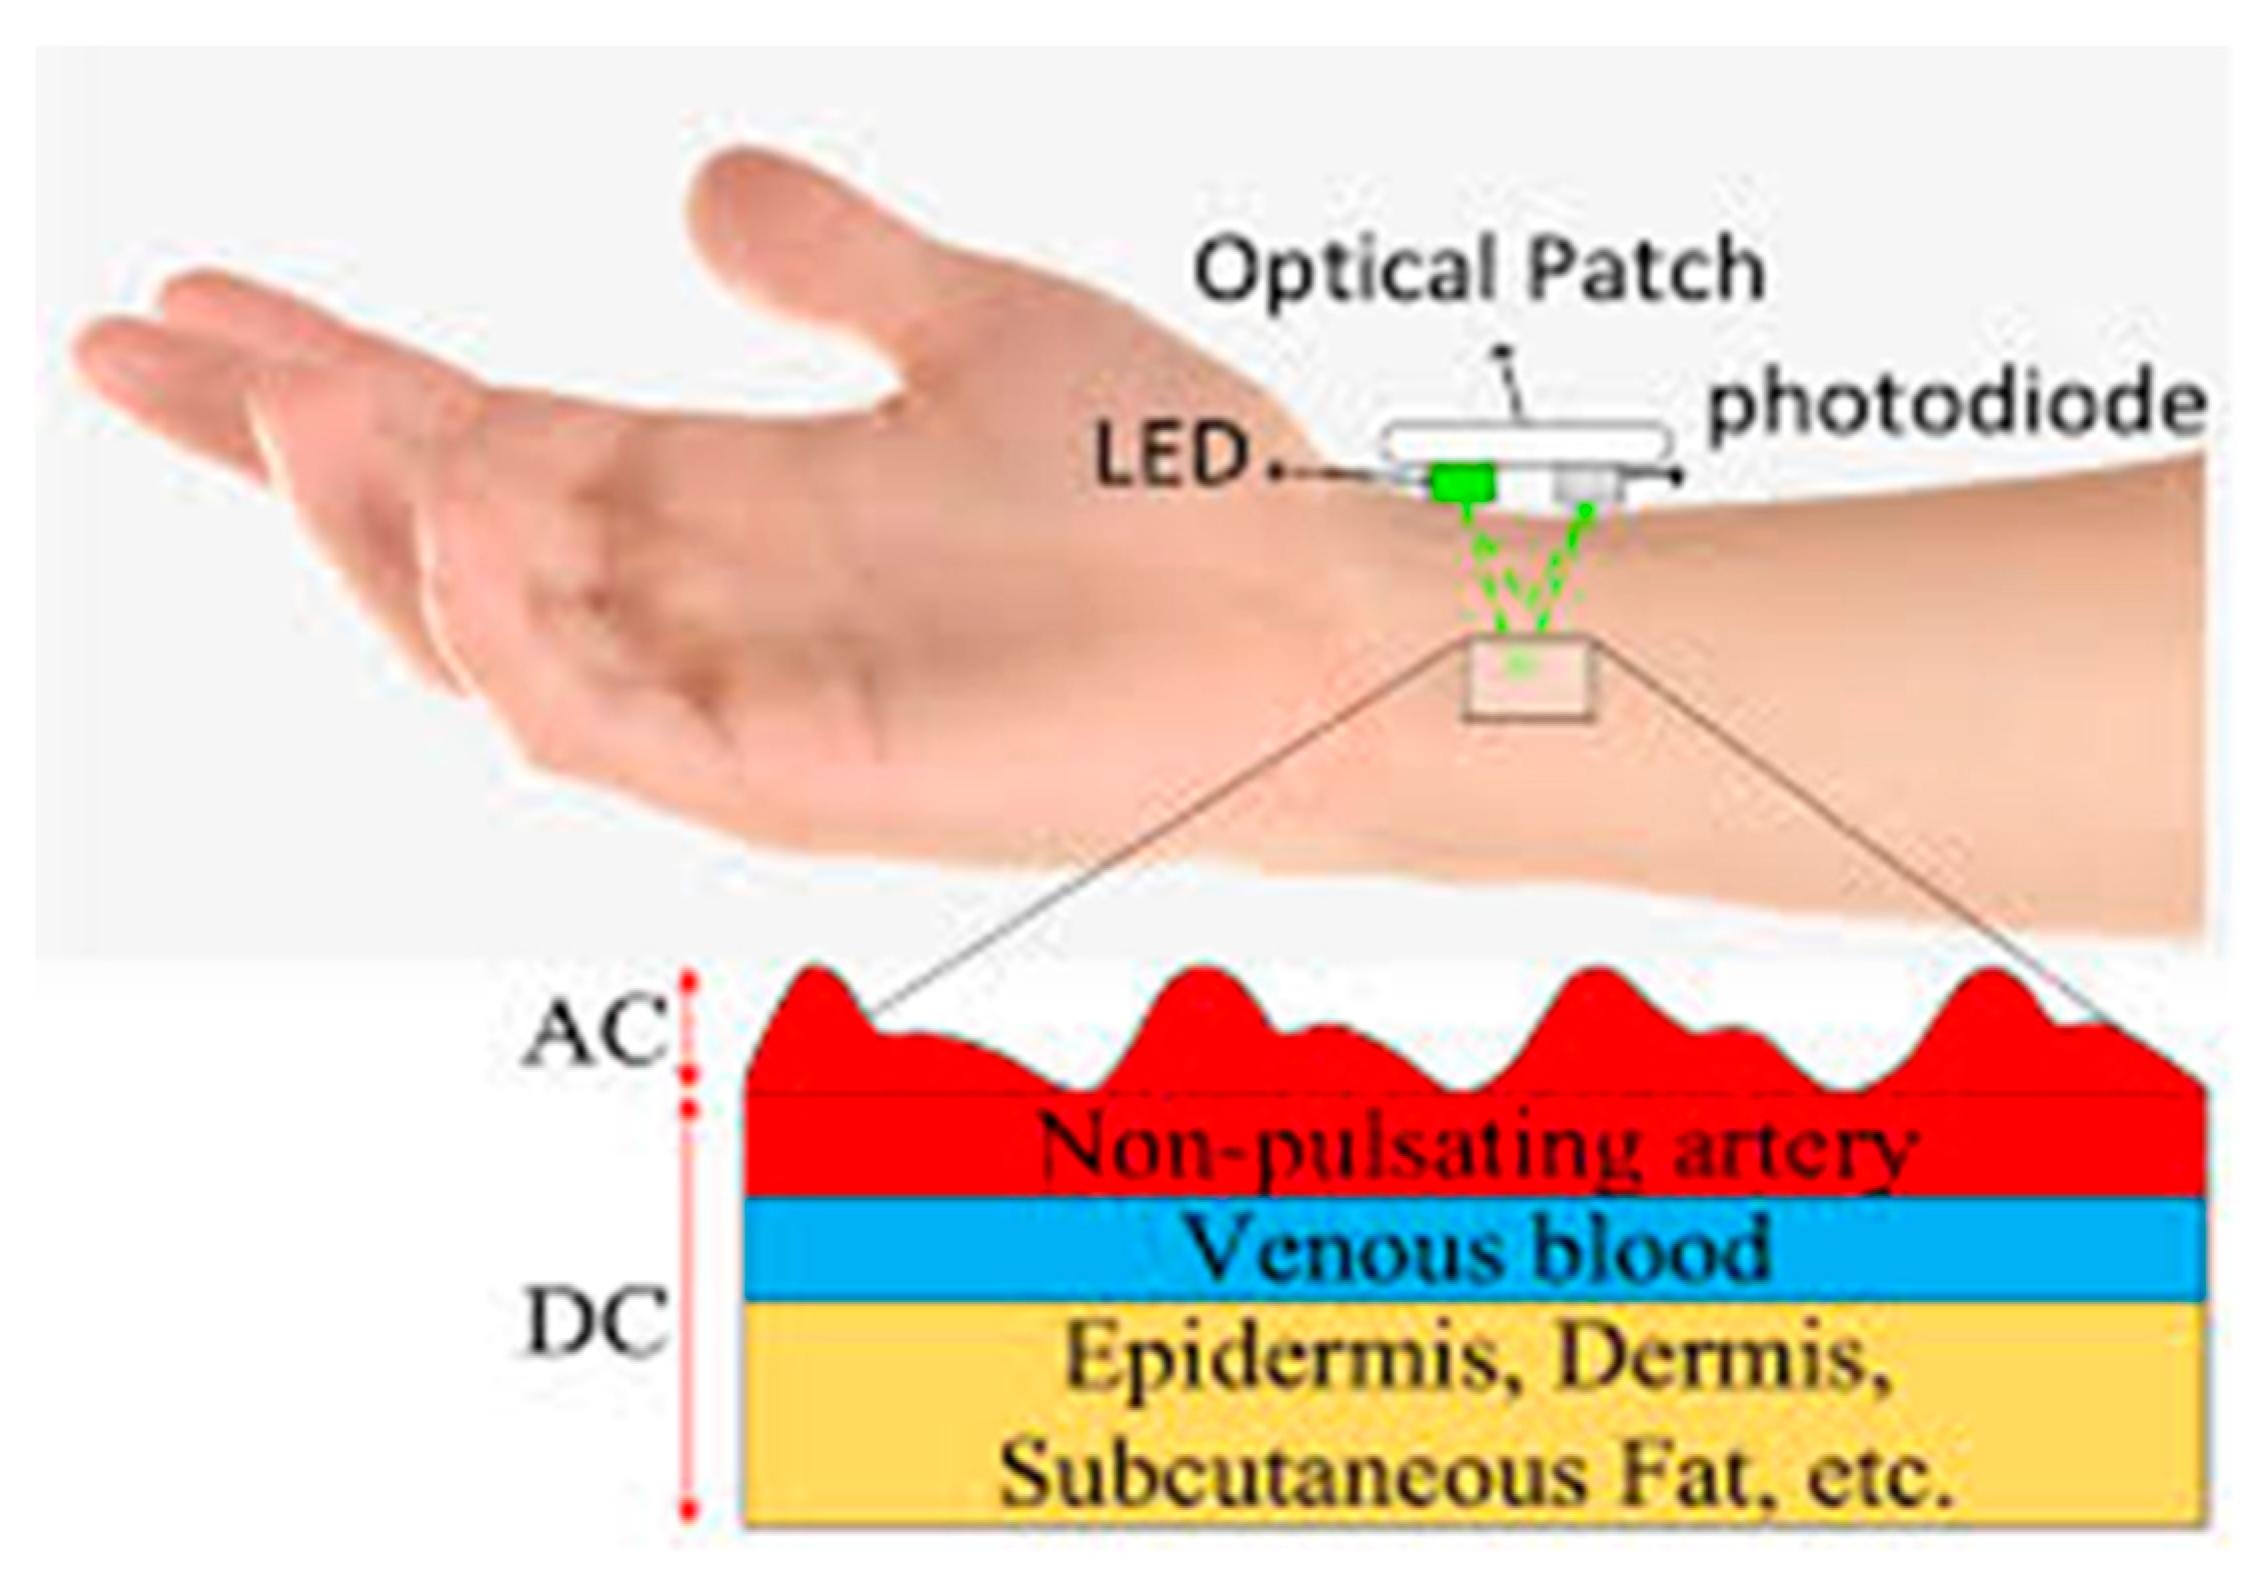
Figure 12.
The part below the device that connects to the animal's body.
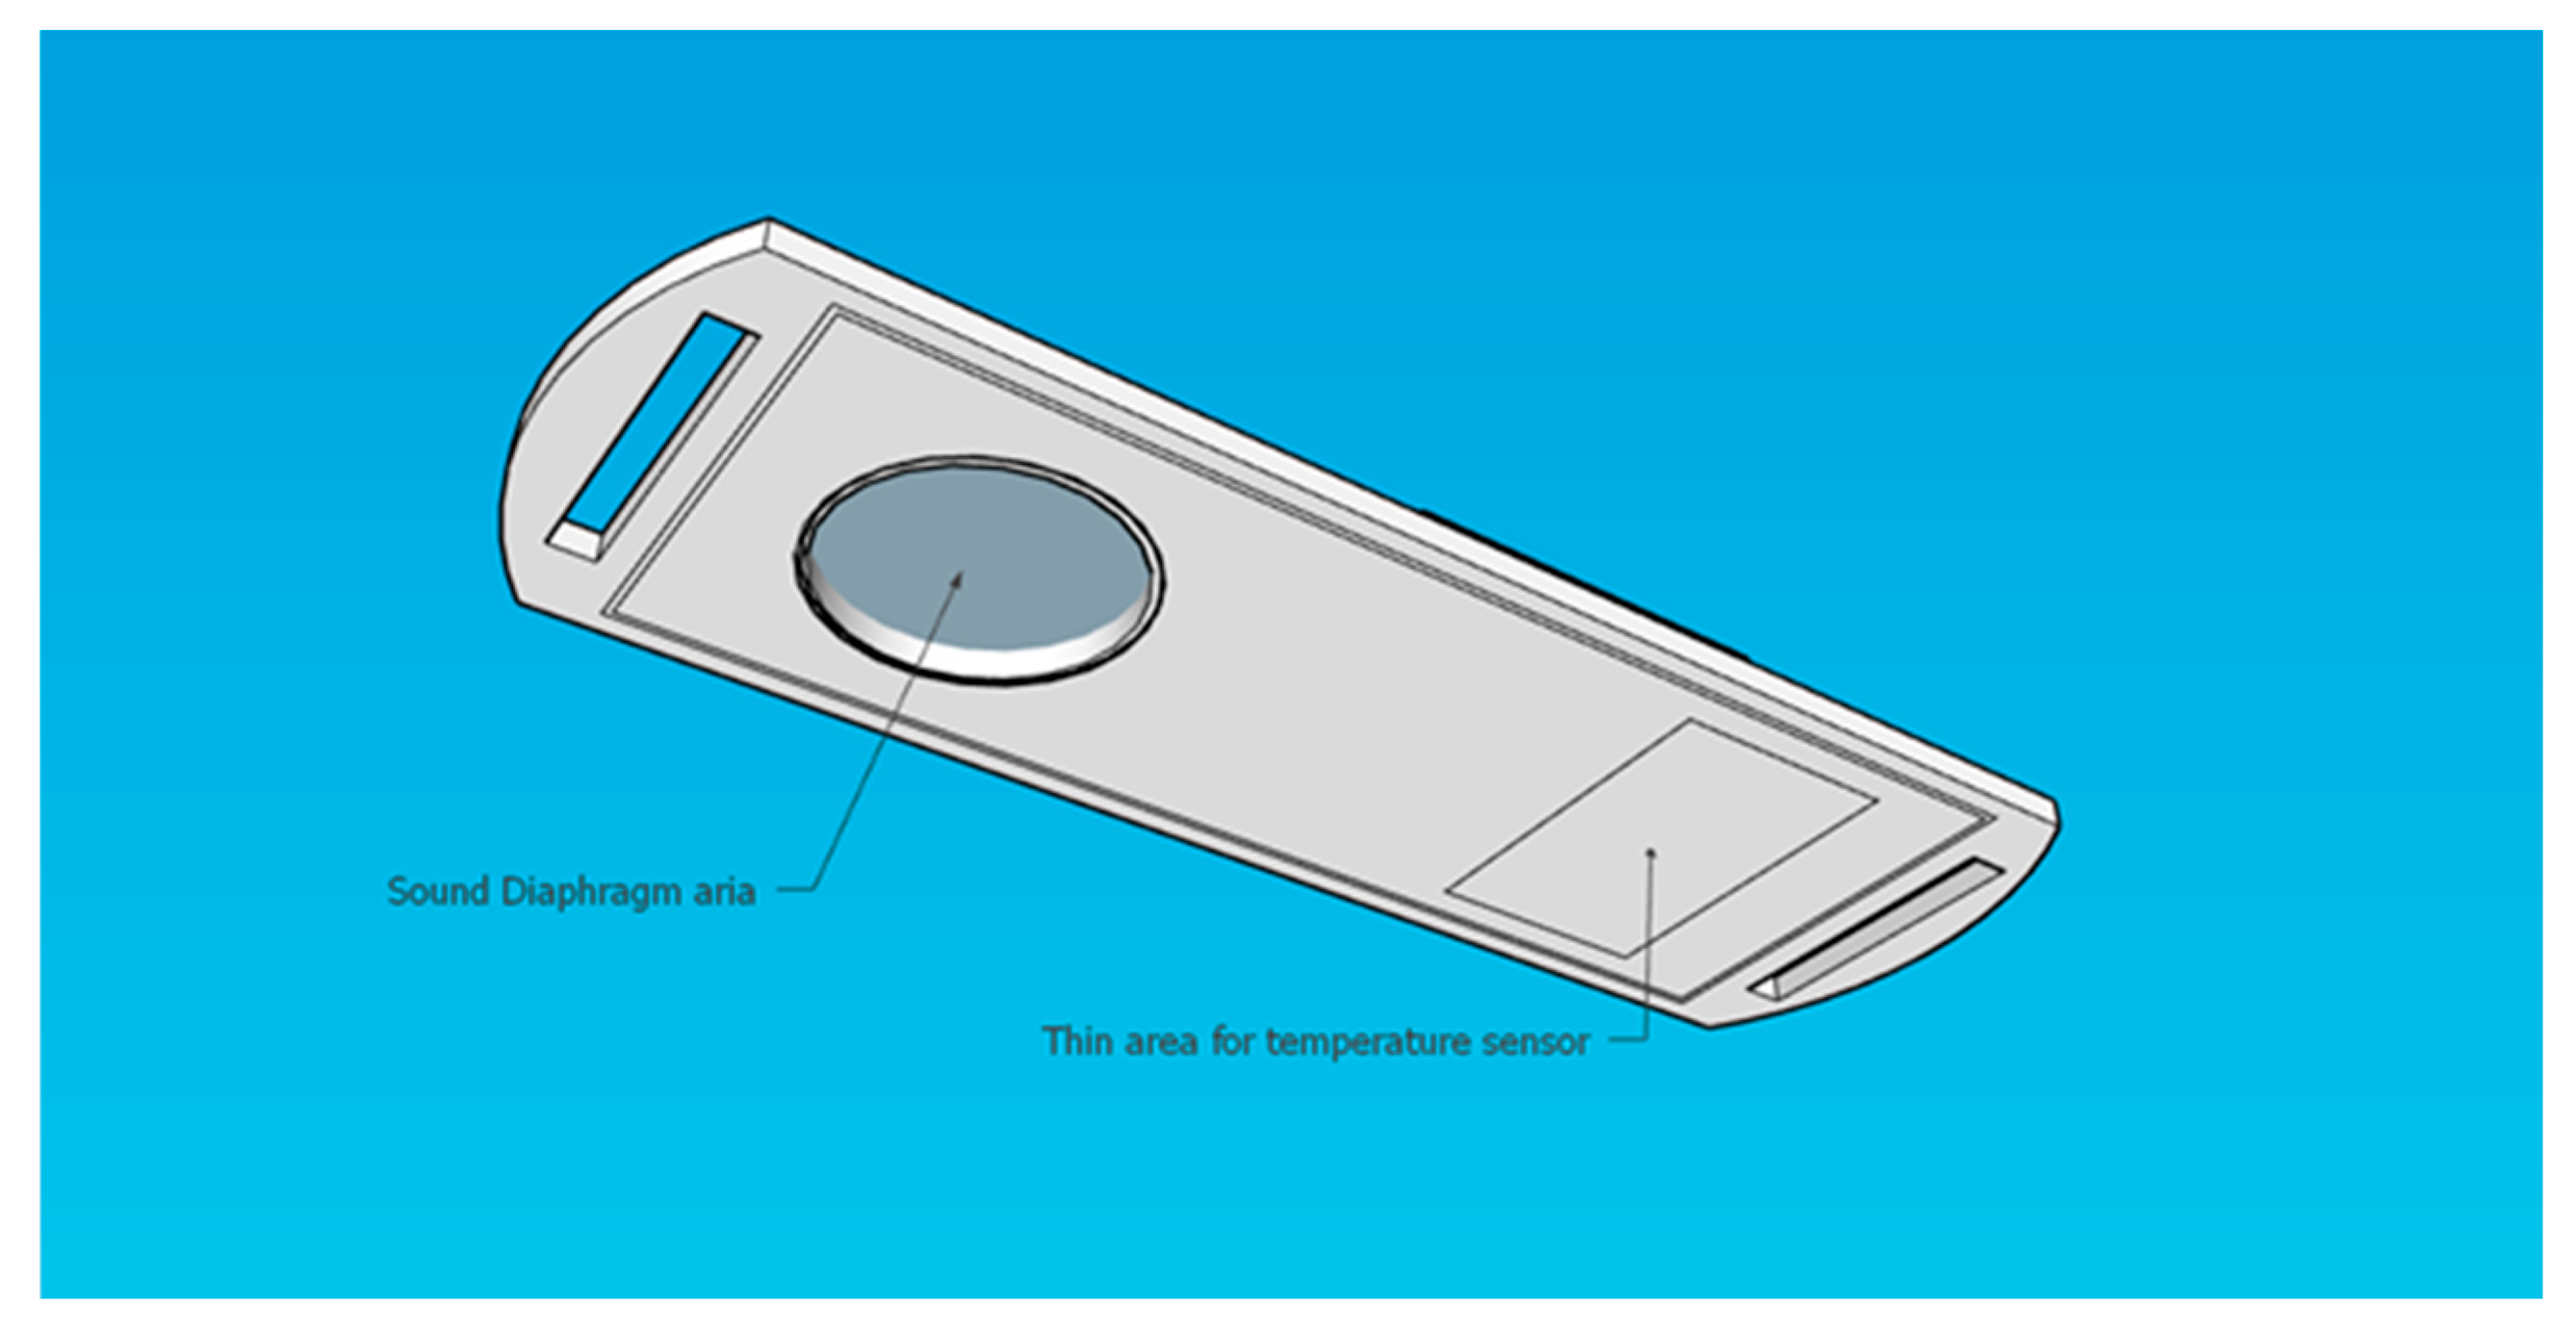
Figure 13.
The internal view of the device and how the sound is transmitted from the diaphragm to the piezo.
Figure 13.
The internal view of the device and how the sound is transmitted from the diaphragm to the piezo.
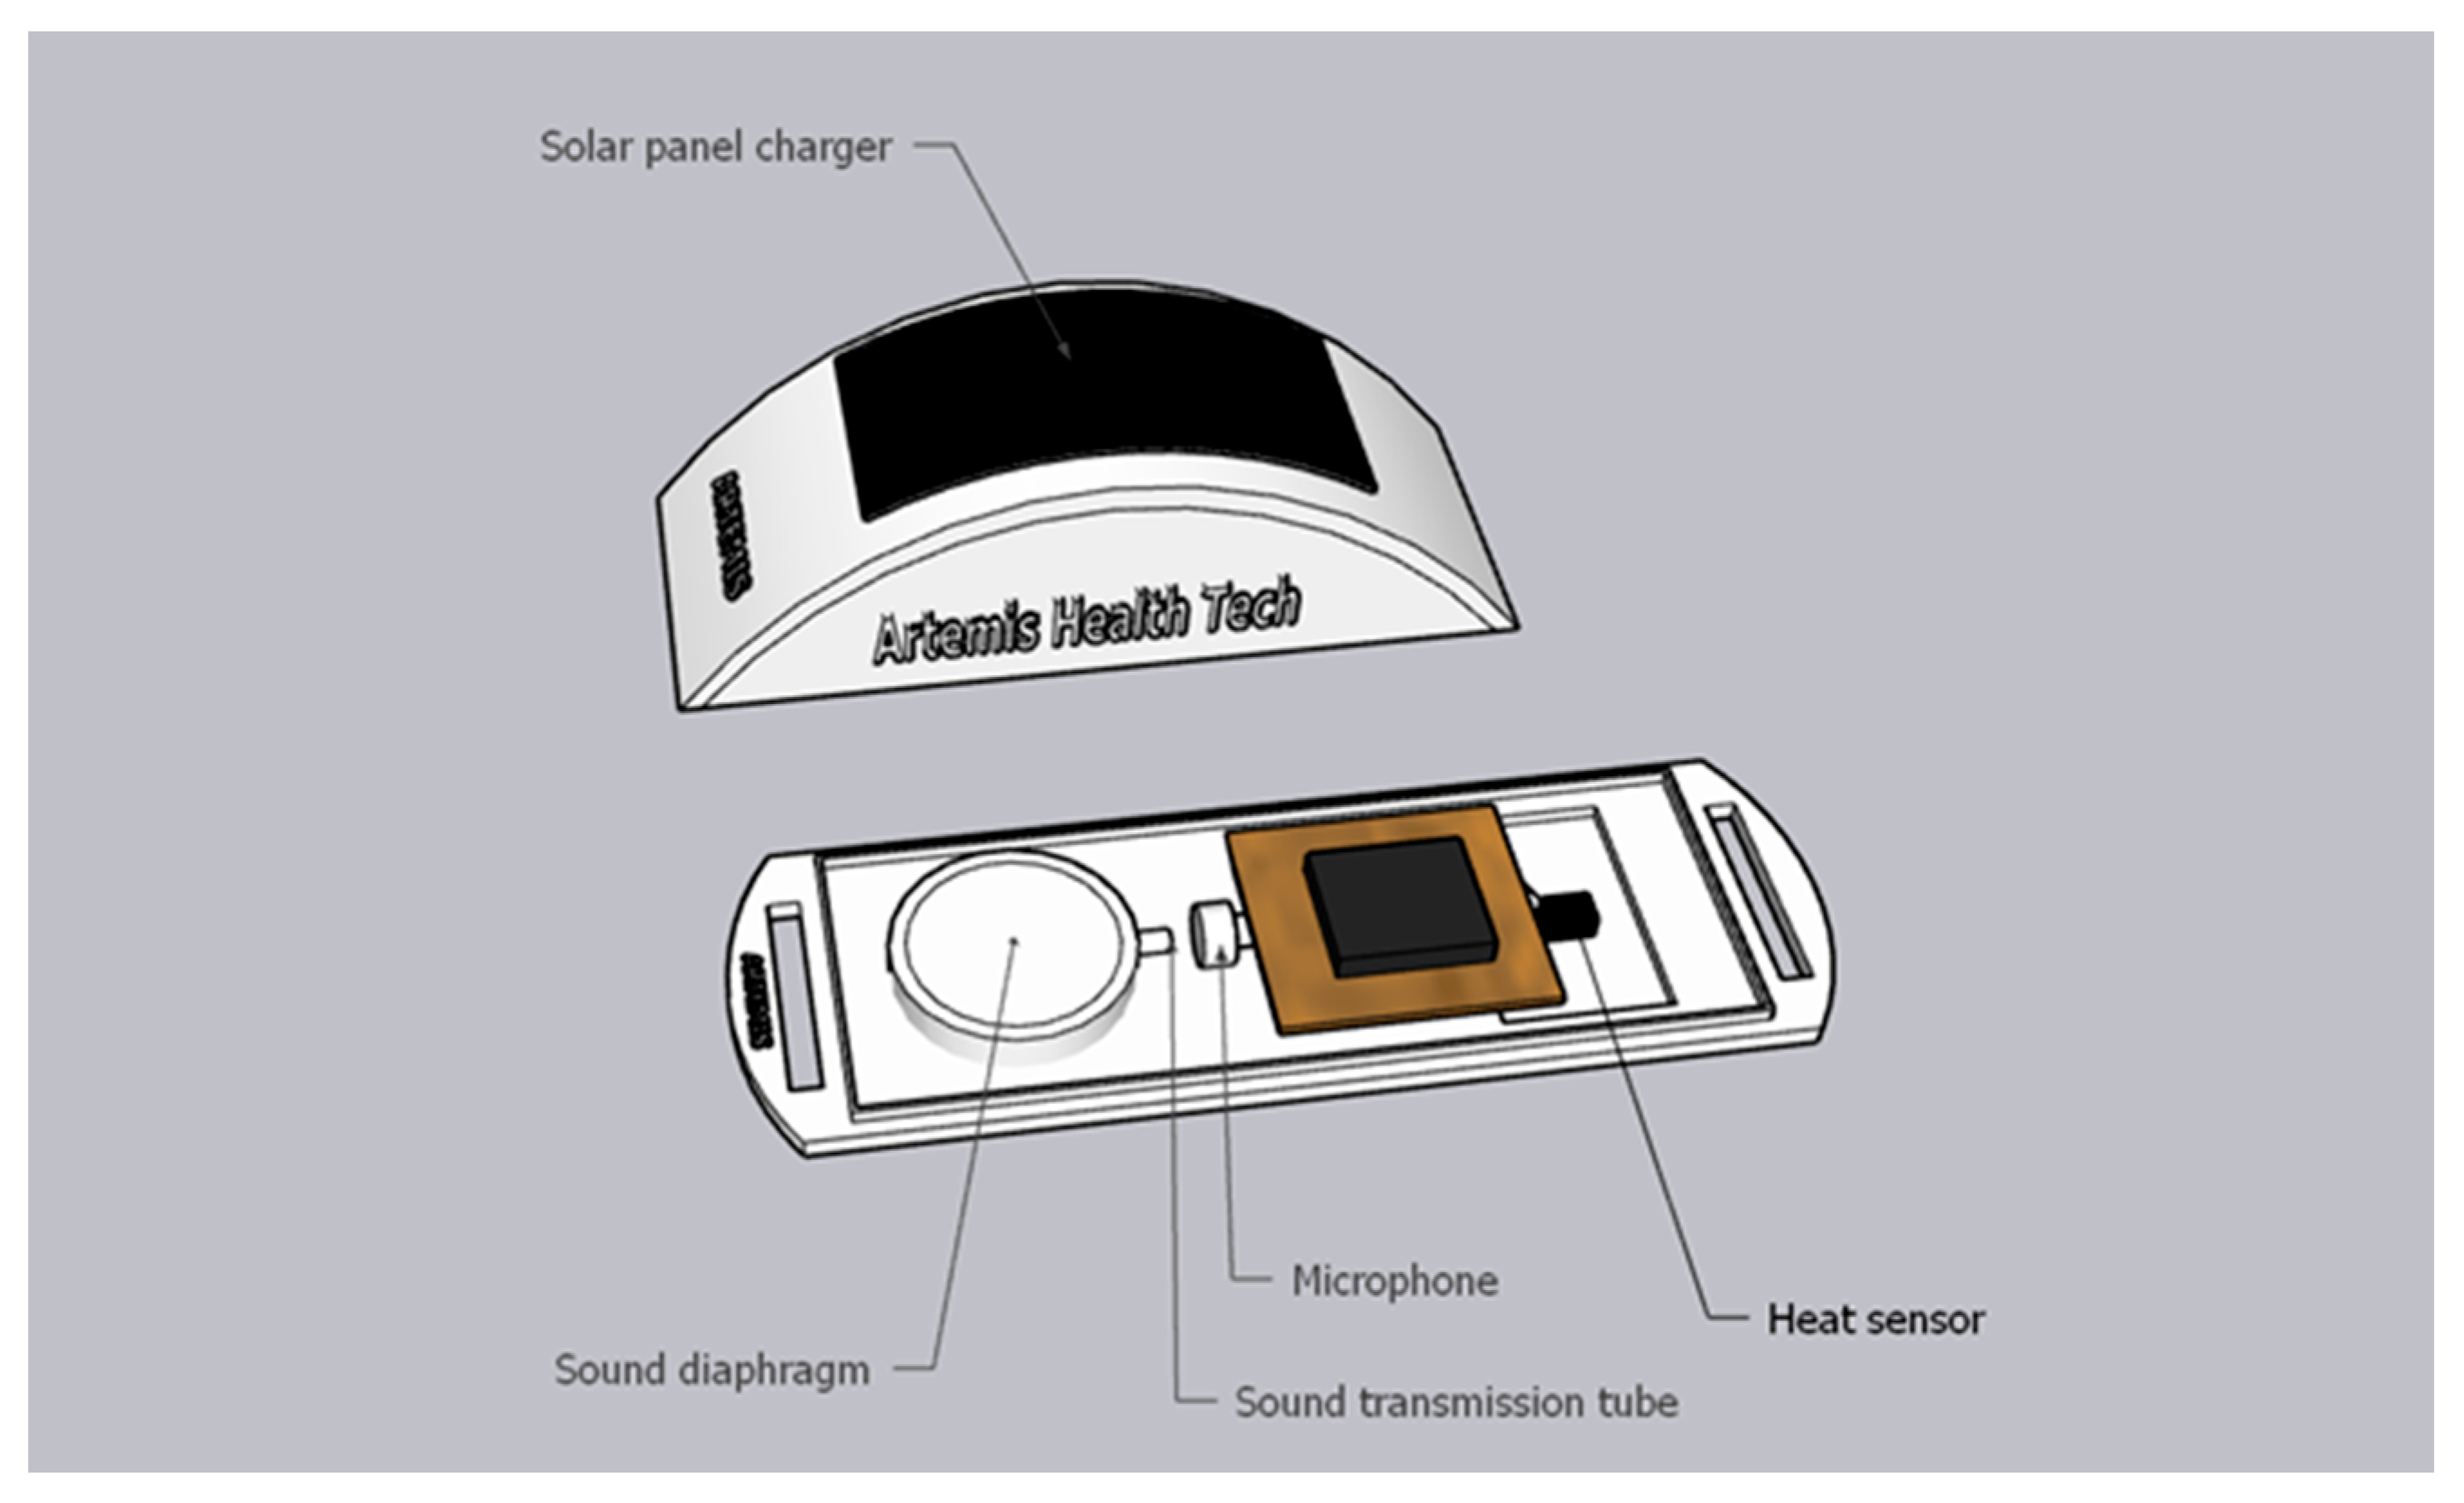
Figure 14.
Detect heartbeat via piezoelectric.
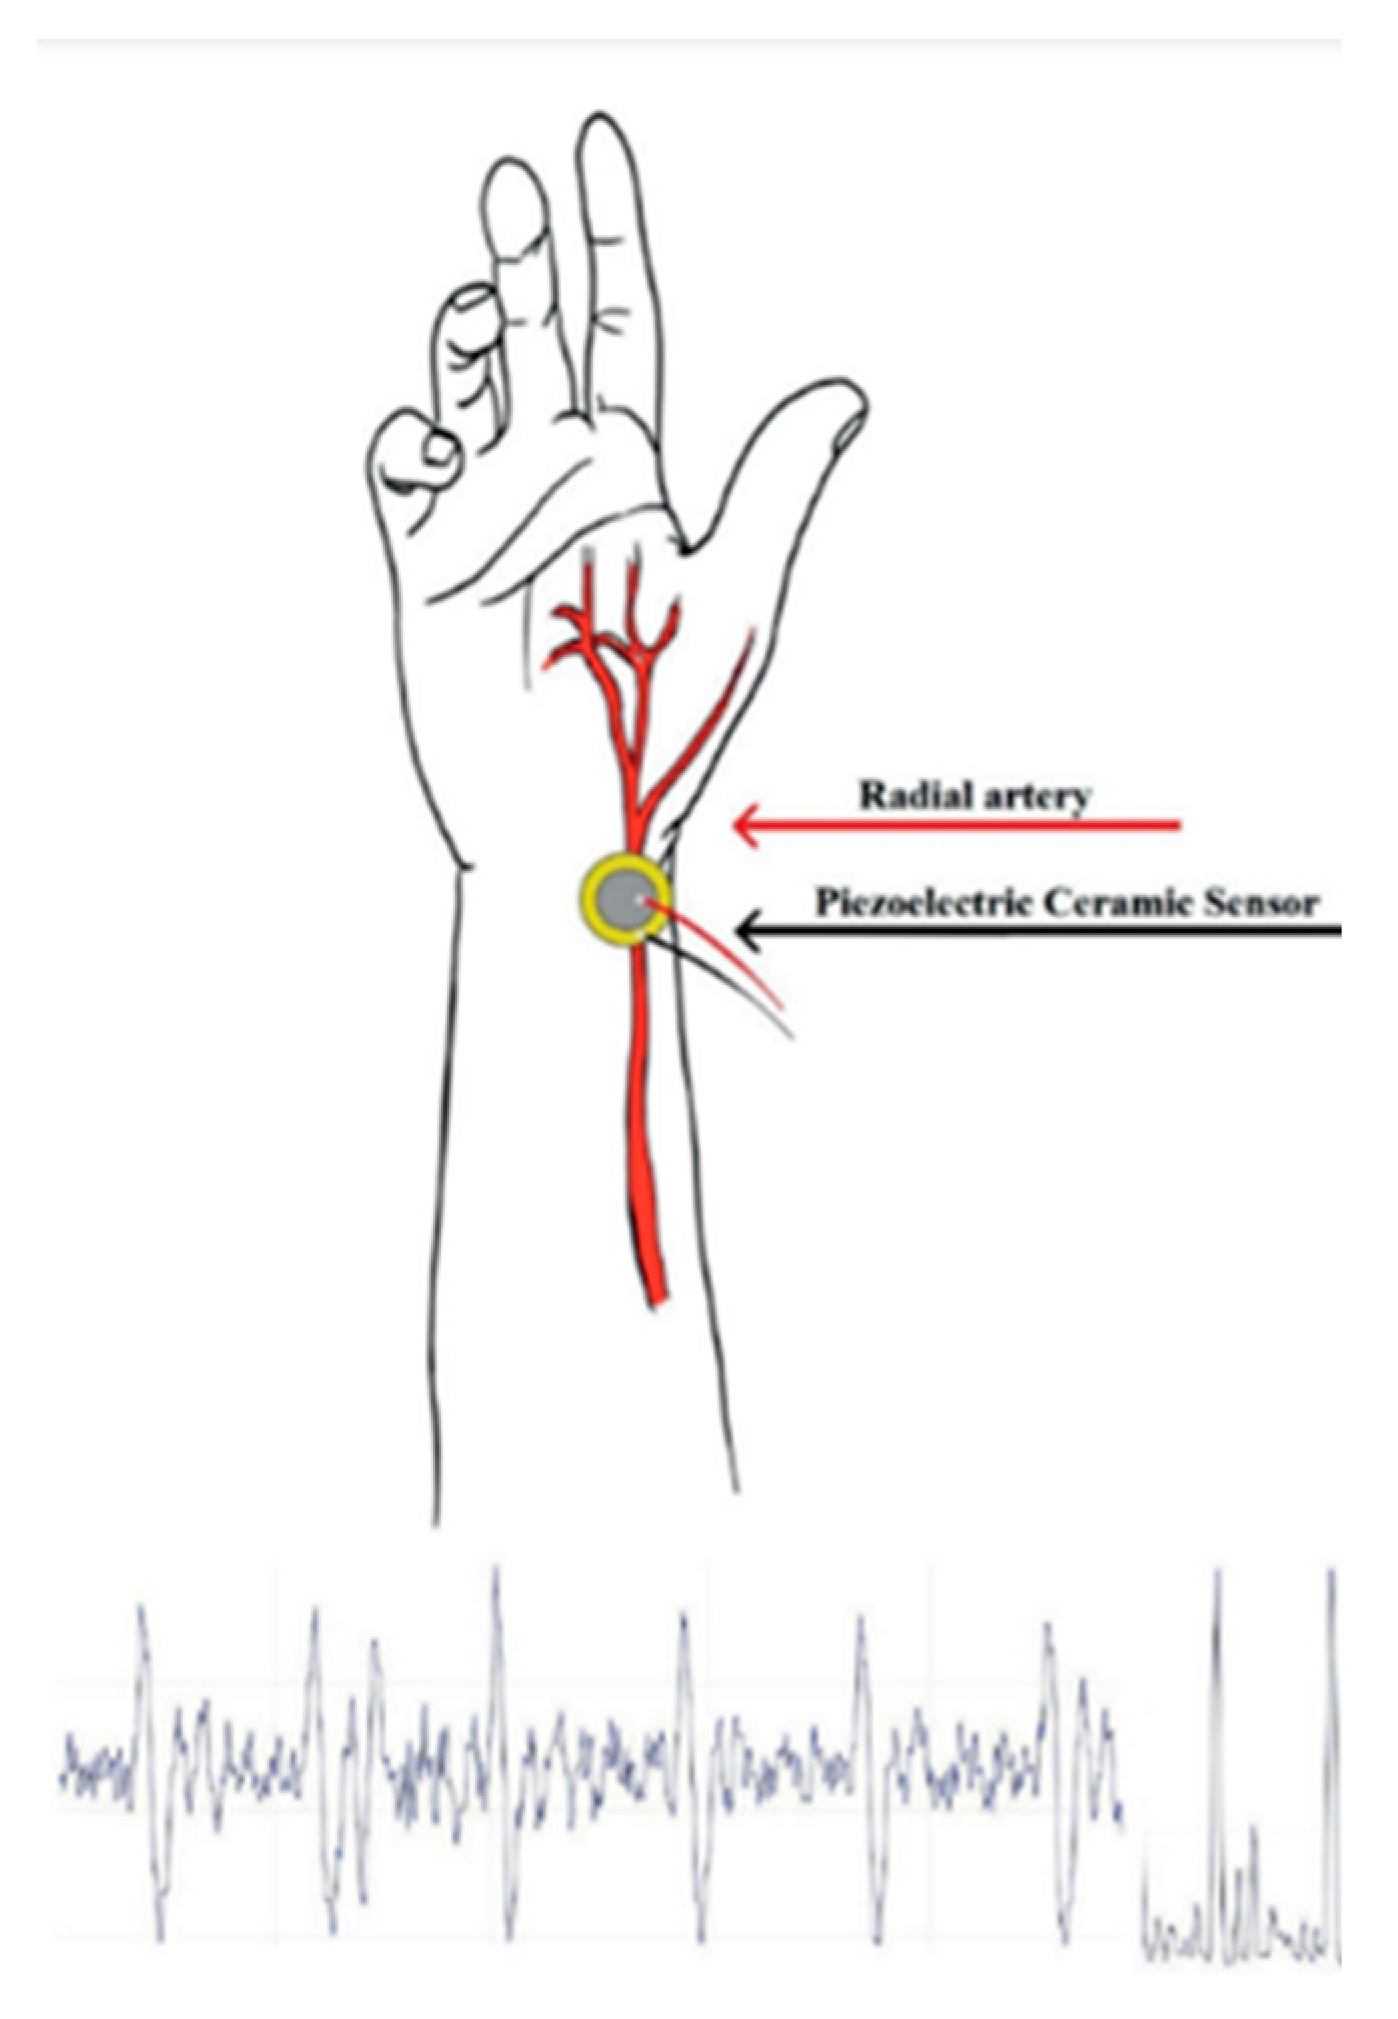
Figure 15.
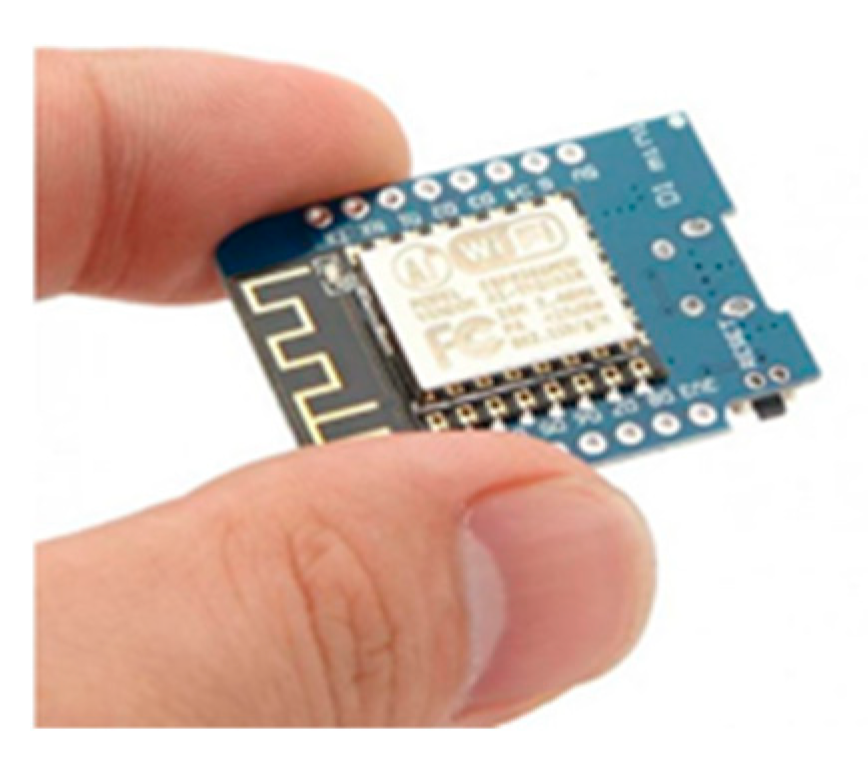
Figure 16.
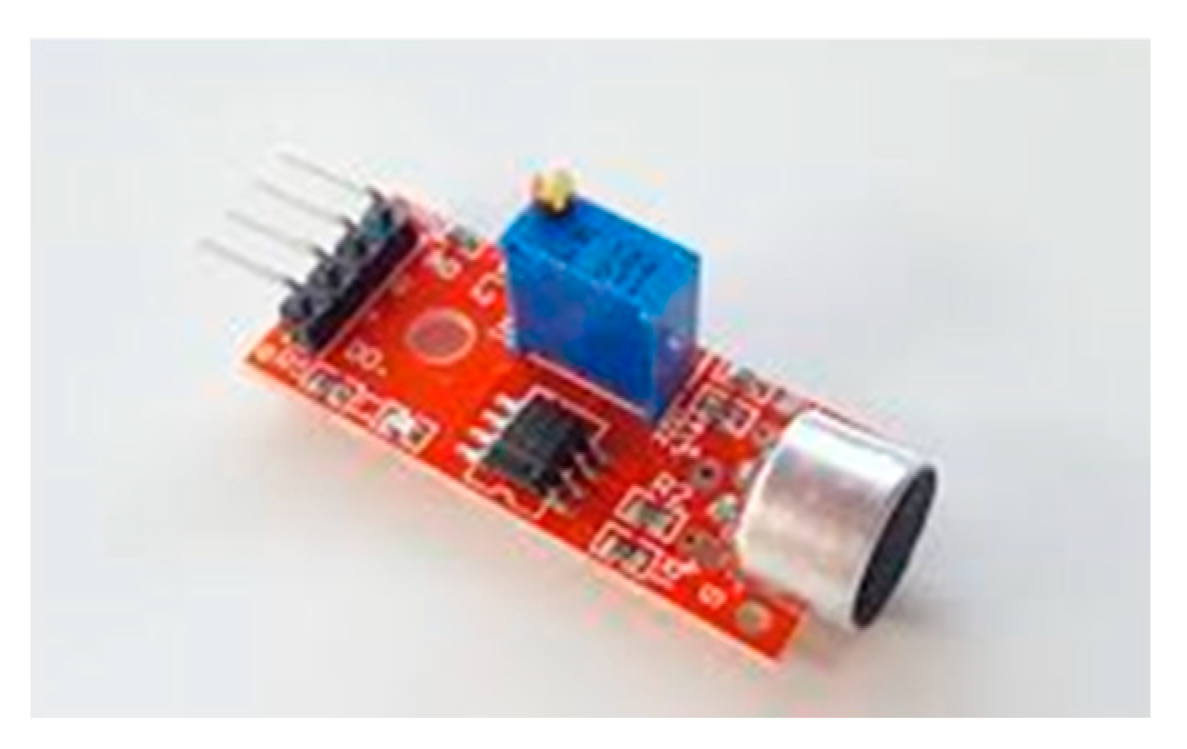
Figure 17.
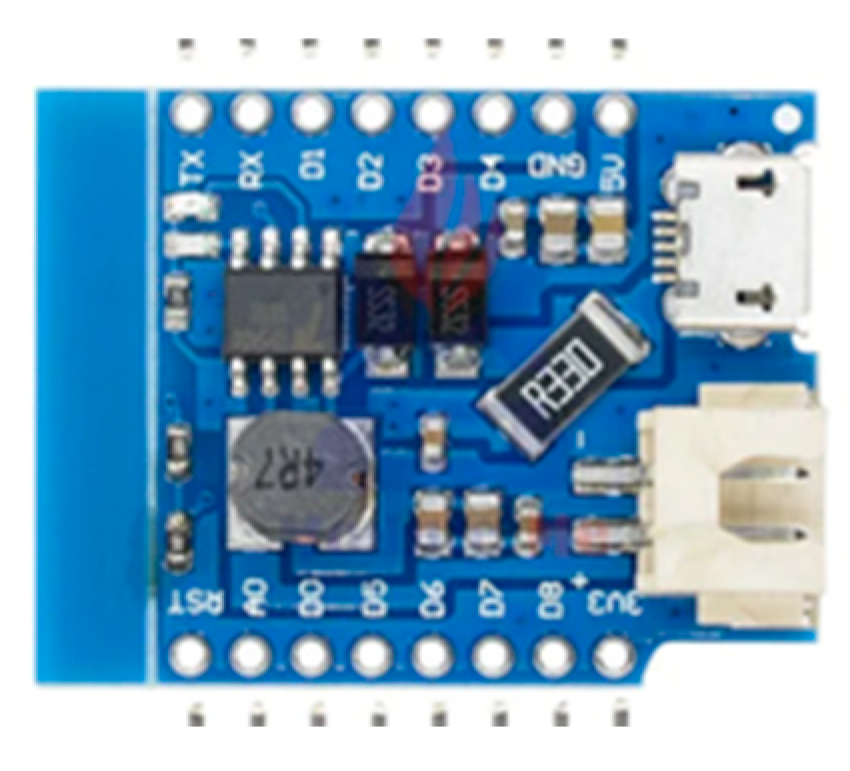
Figure 18.
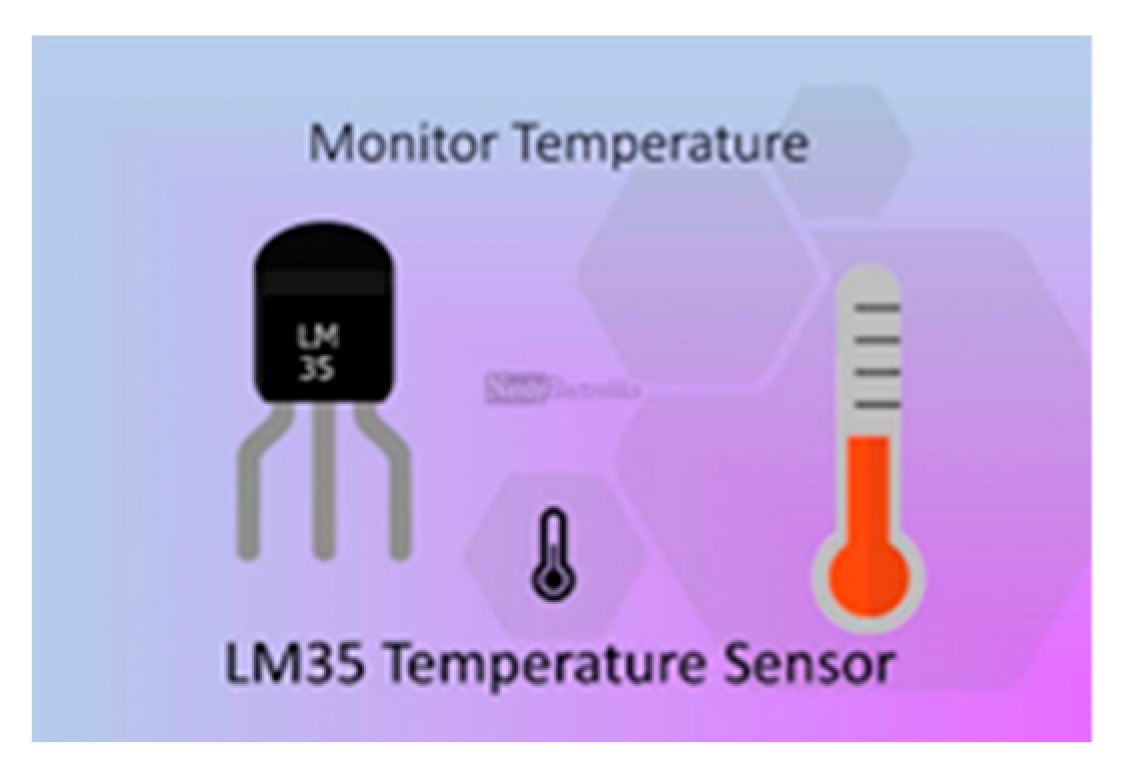
Figure 19.
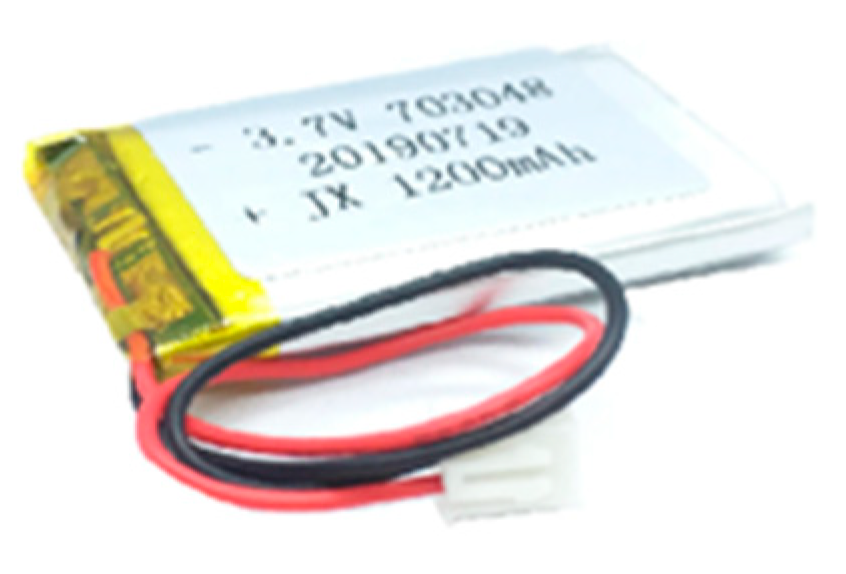
Figure 20.
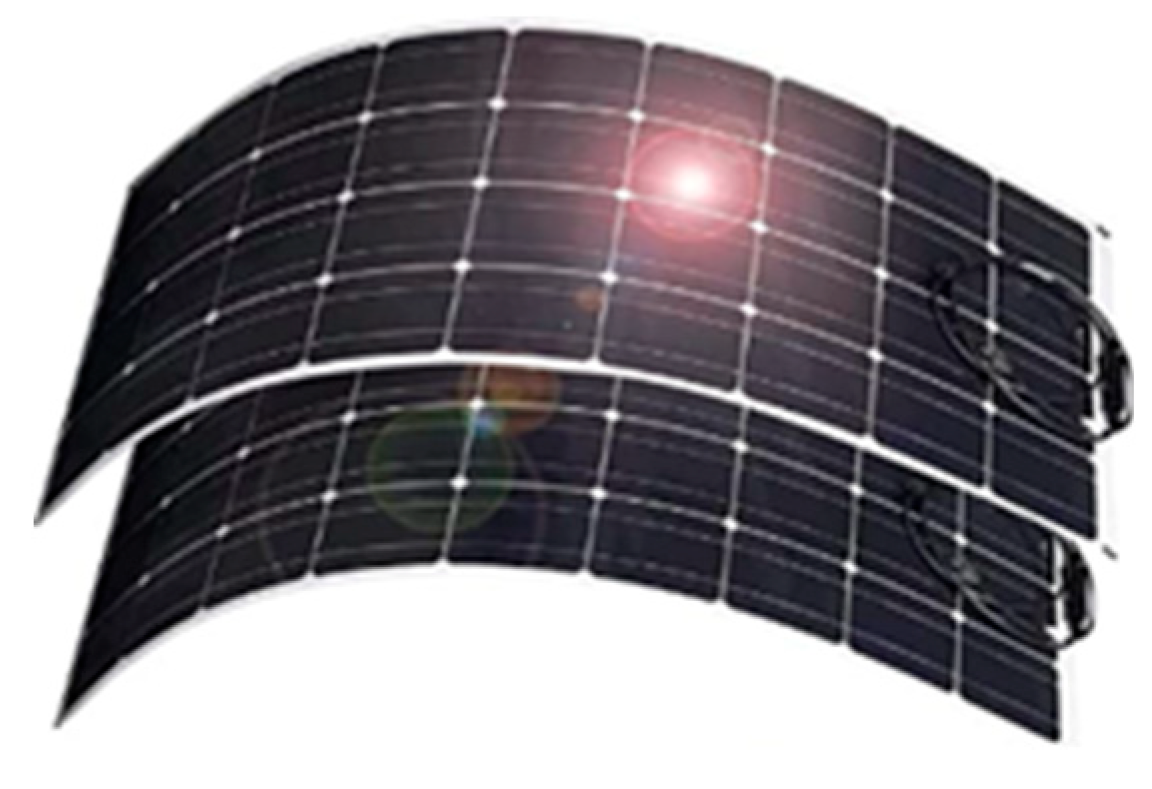
Figure 21.
circuit schematic.
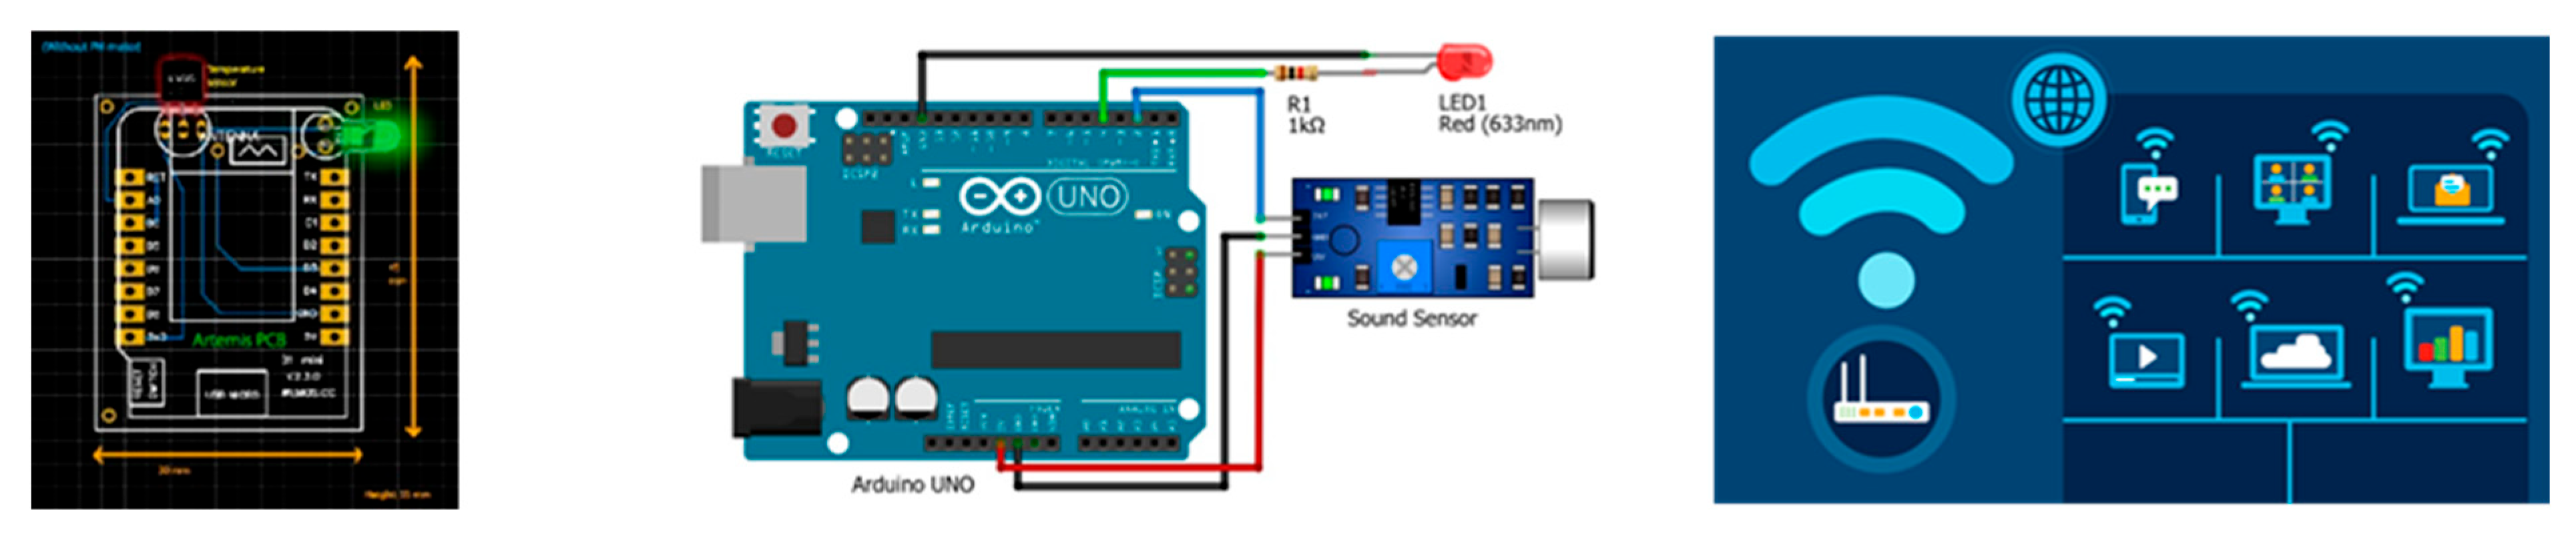
Figure 22.
3D design of the sensor box.
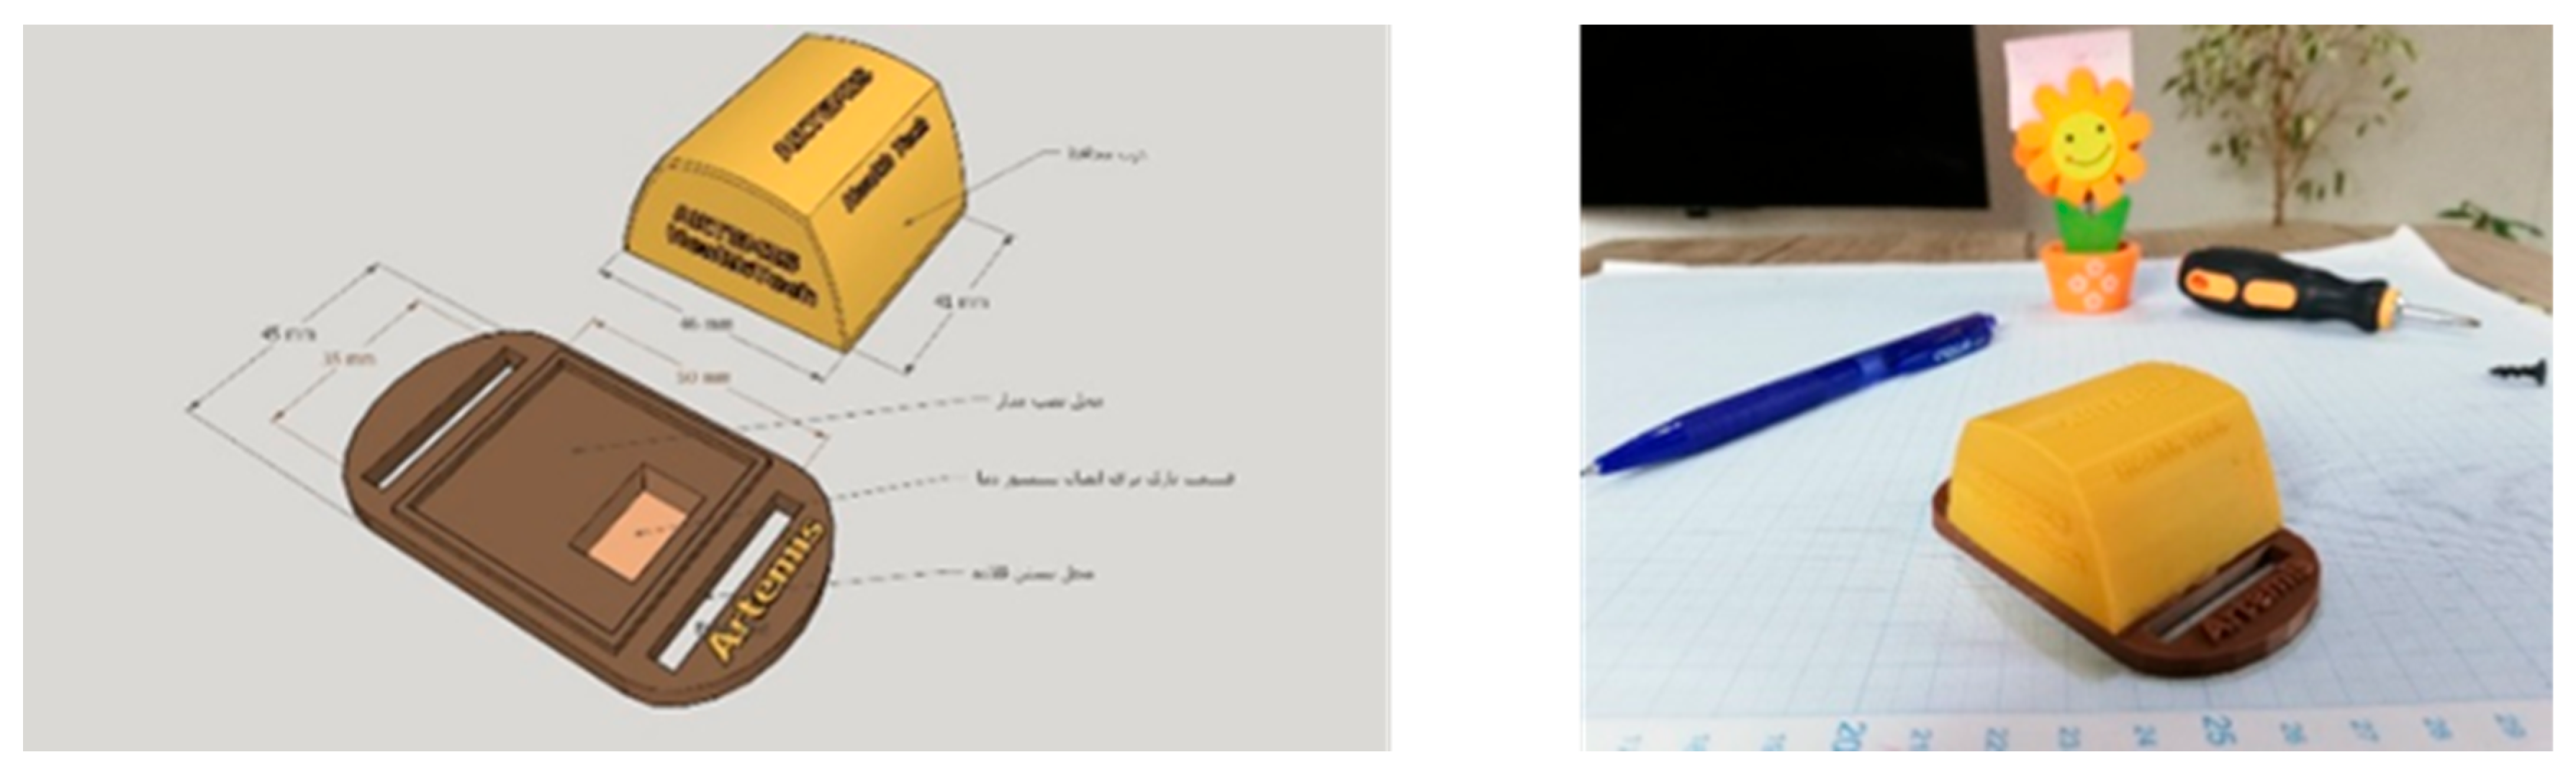
Figure 23.
Neck collar.
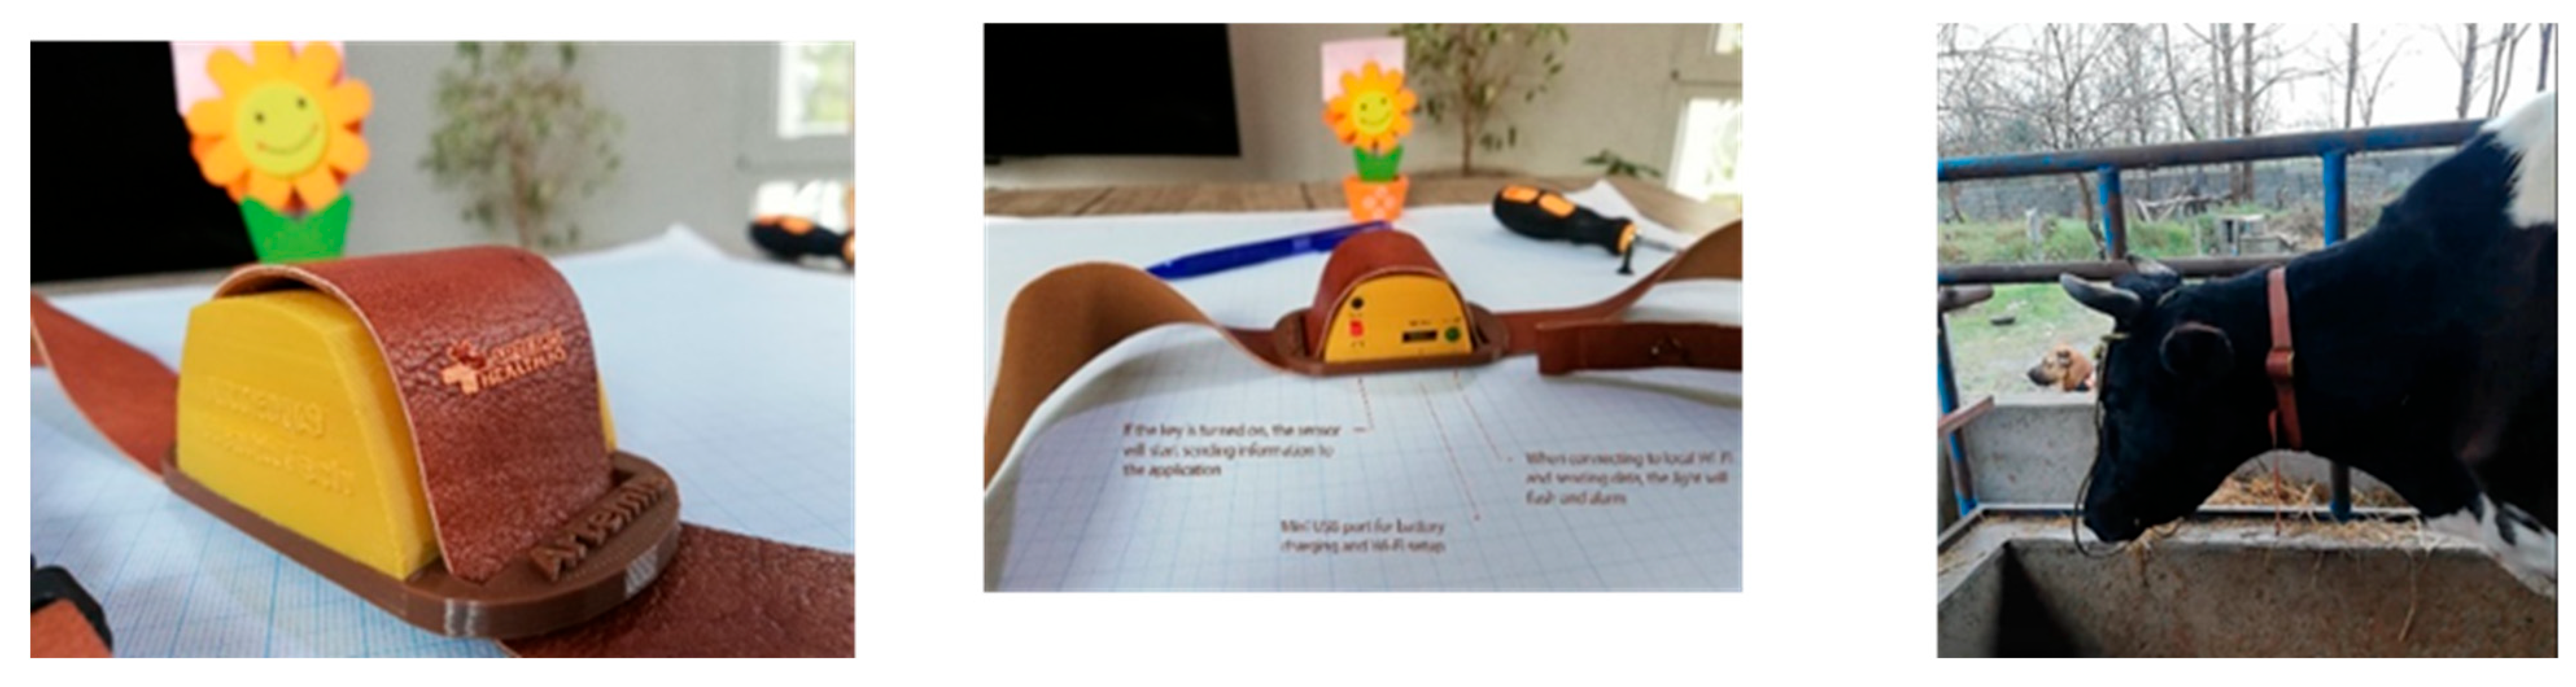
Figure 24.
blood system of the cattle1.
Figure 24.
blood system of the cattle1.
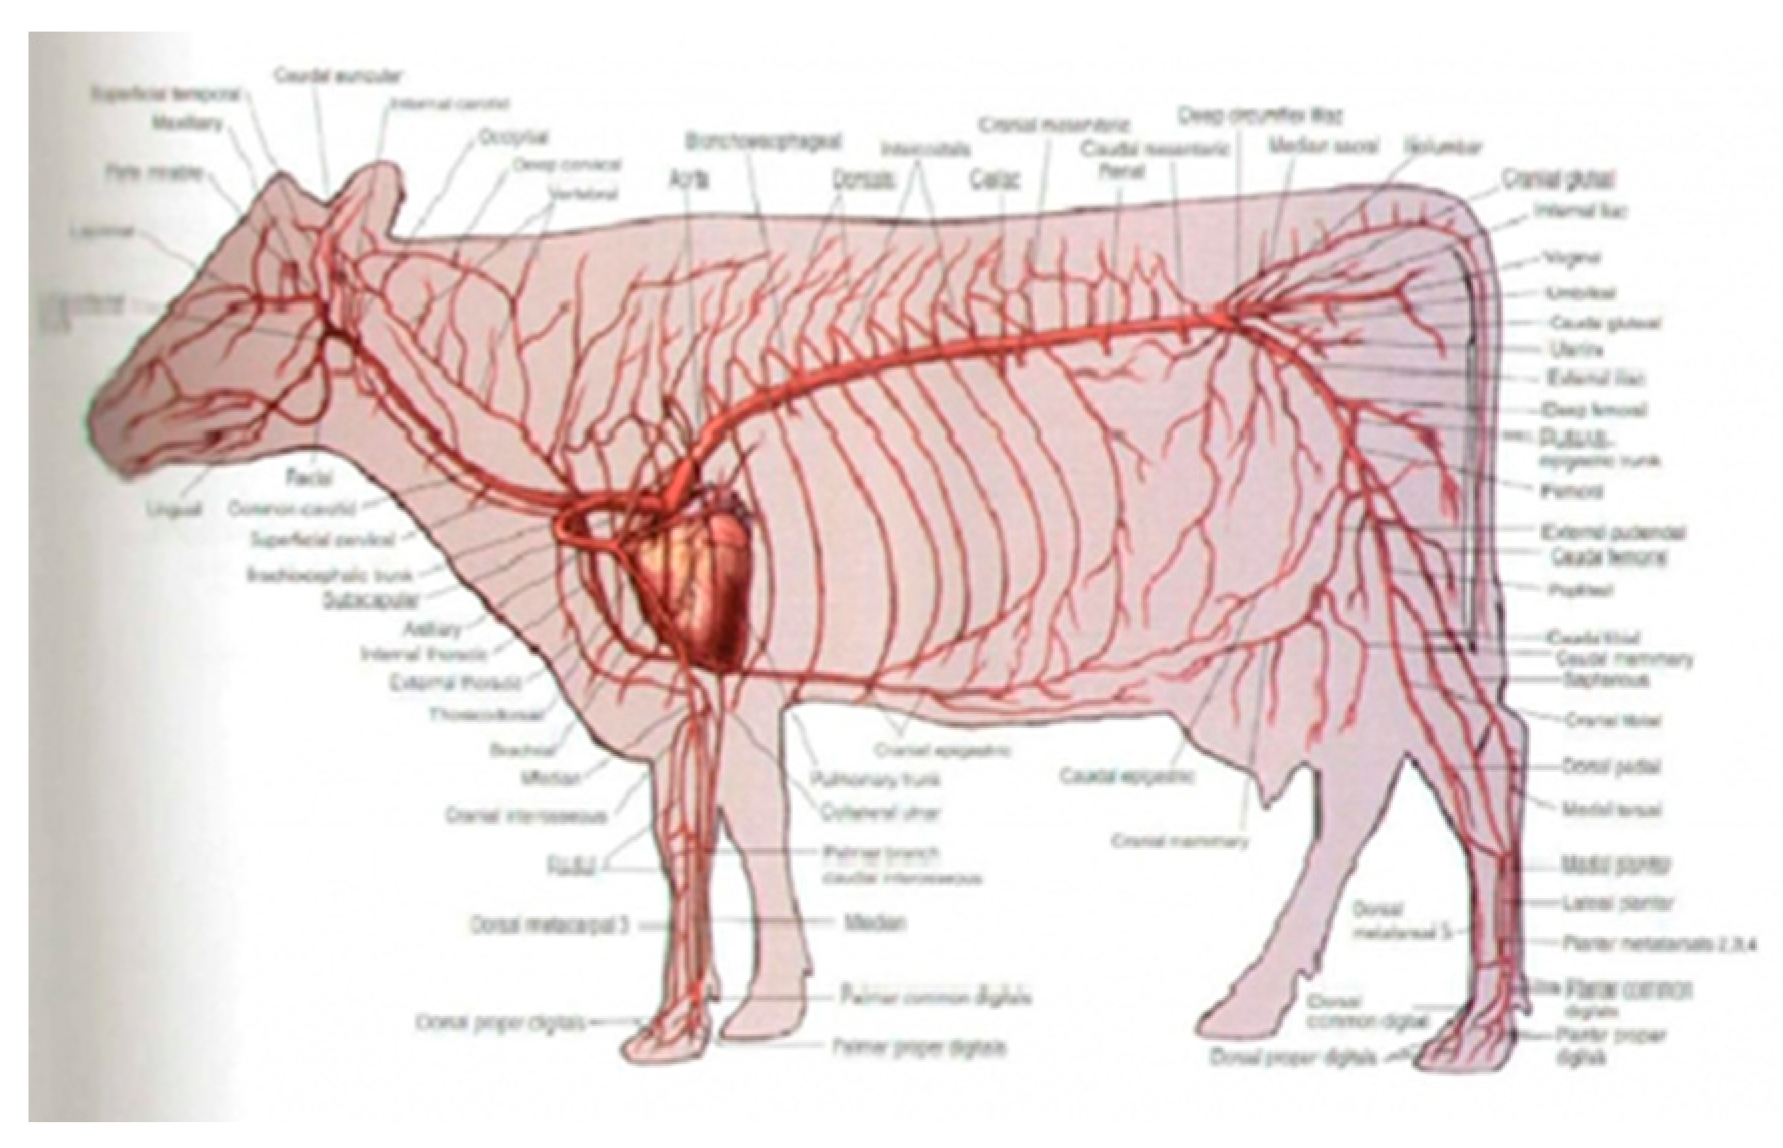
Figure 25.
The best area for sense heartbeat 2.
Figure 25.
The best area for sense heartbeat 2.
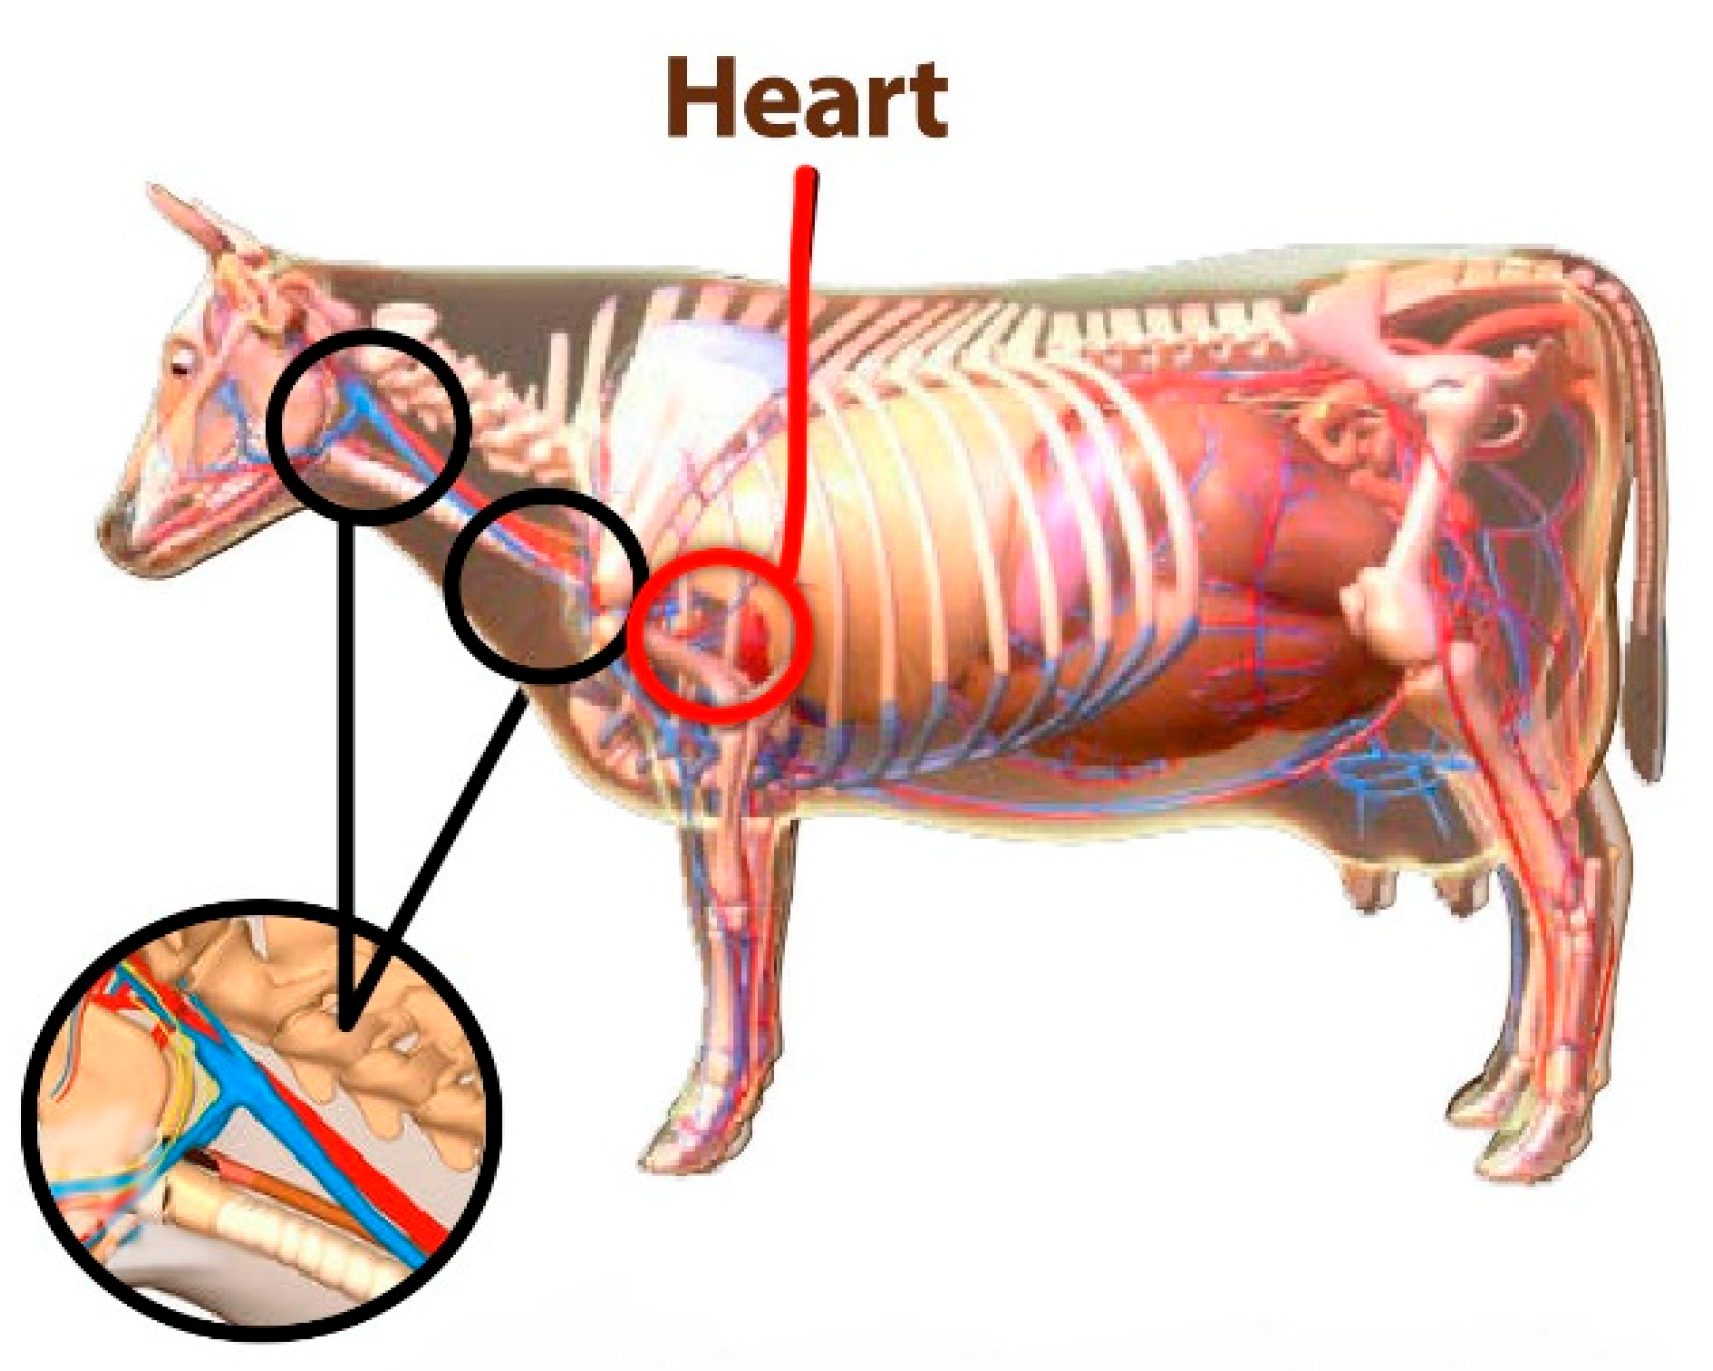
Figure 26.
collar on neck2.
Figure 26.
collar on neck2.
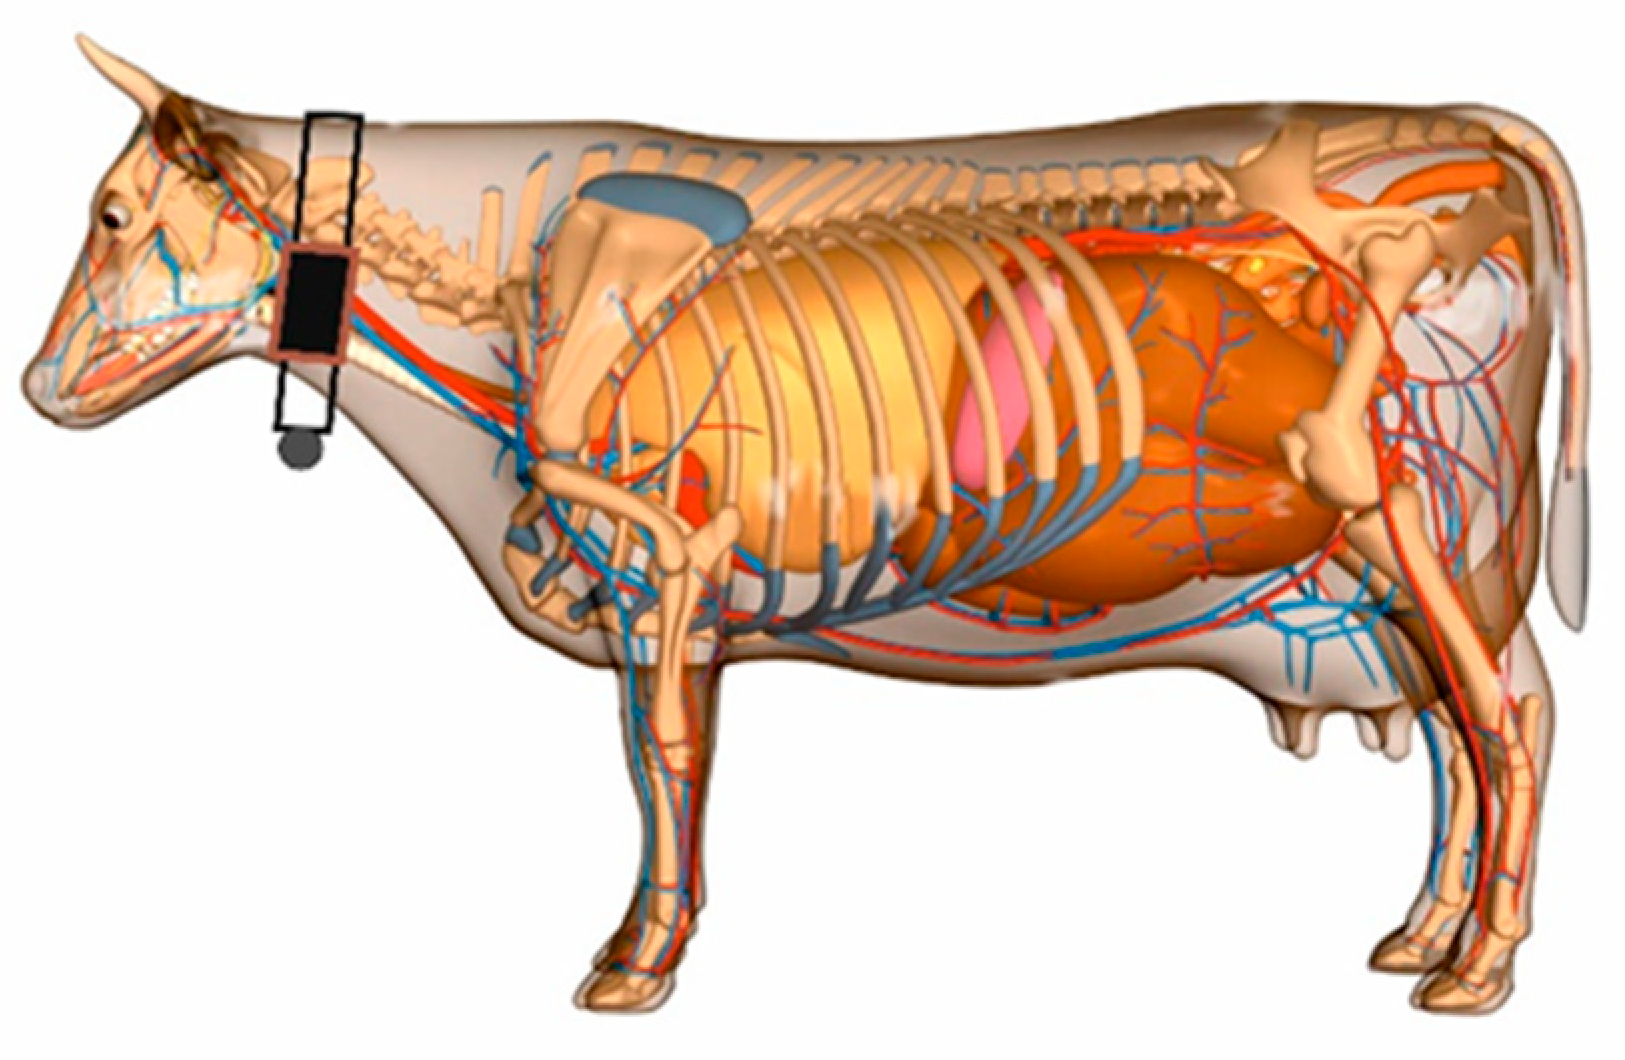
Figure 27.
Placed solar on the Protective cover of the sensor box.
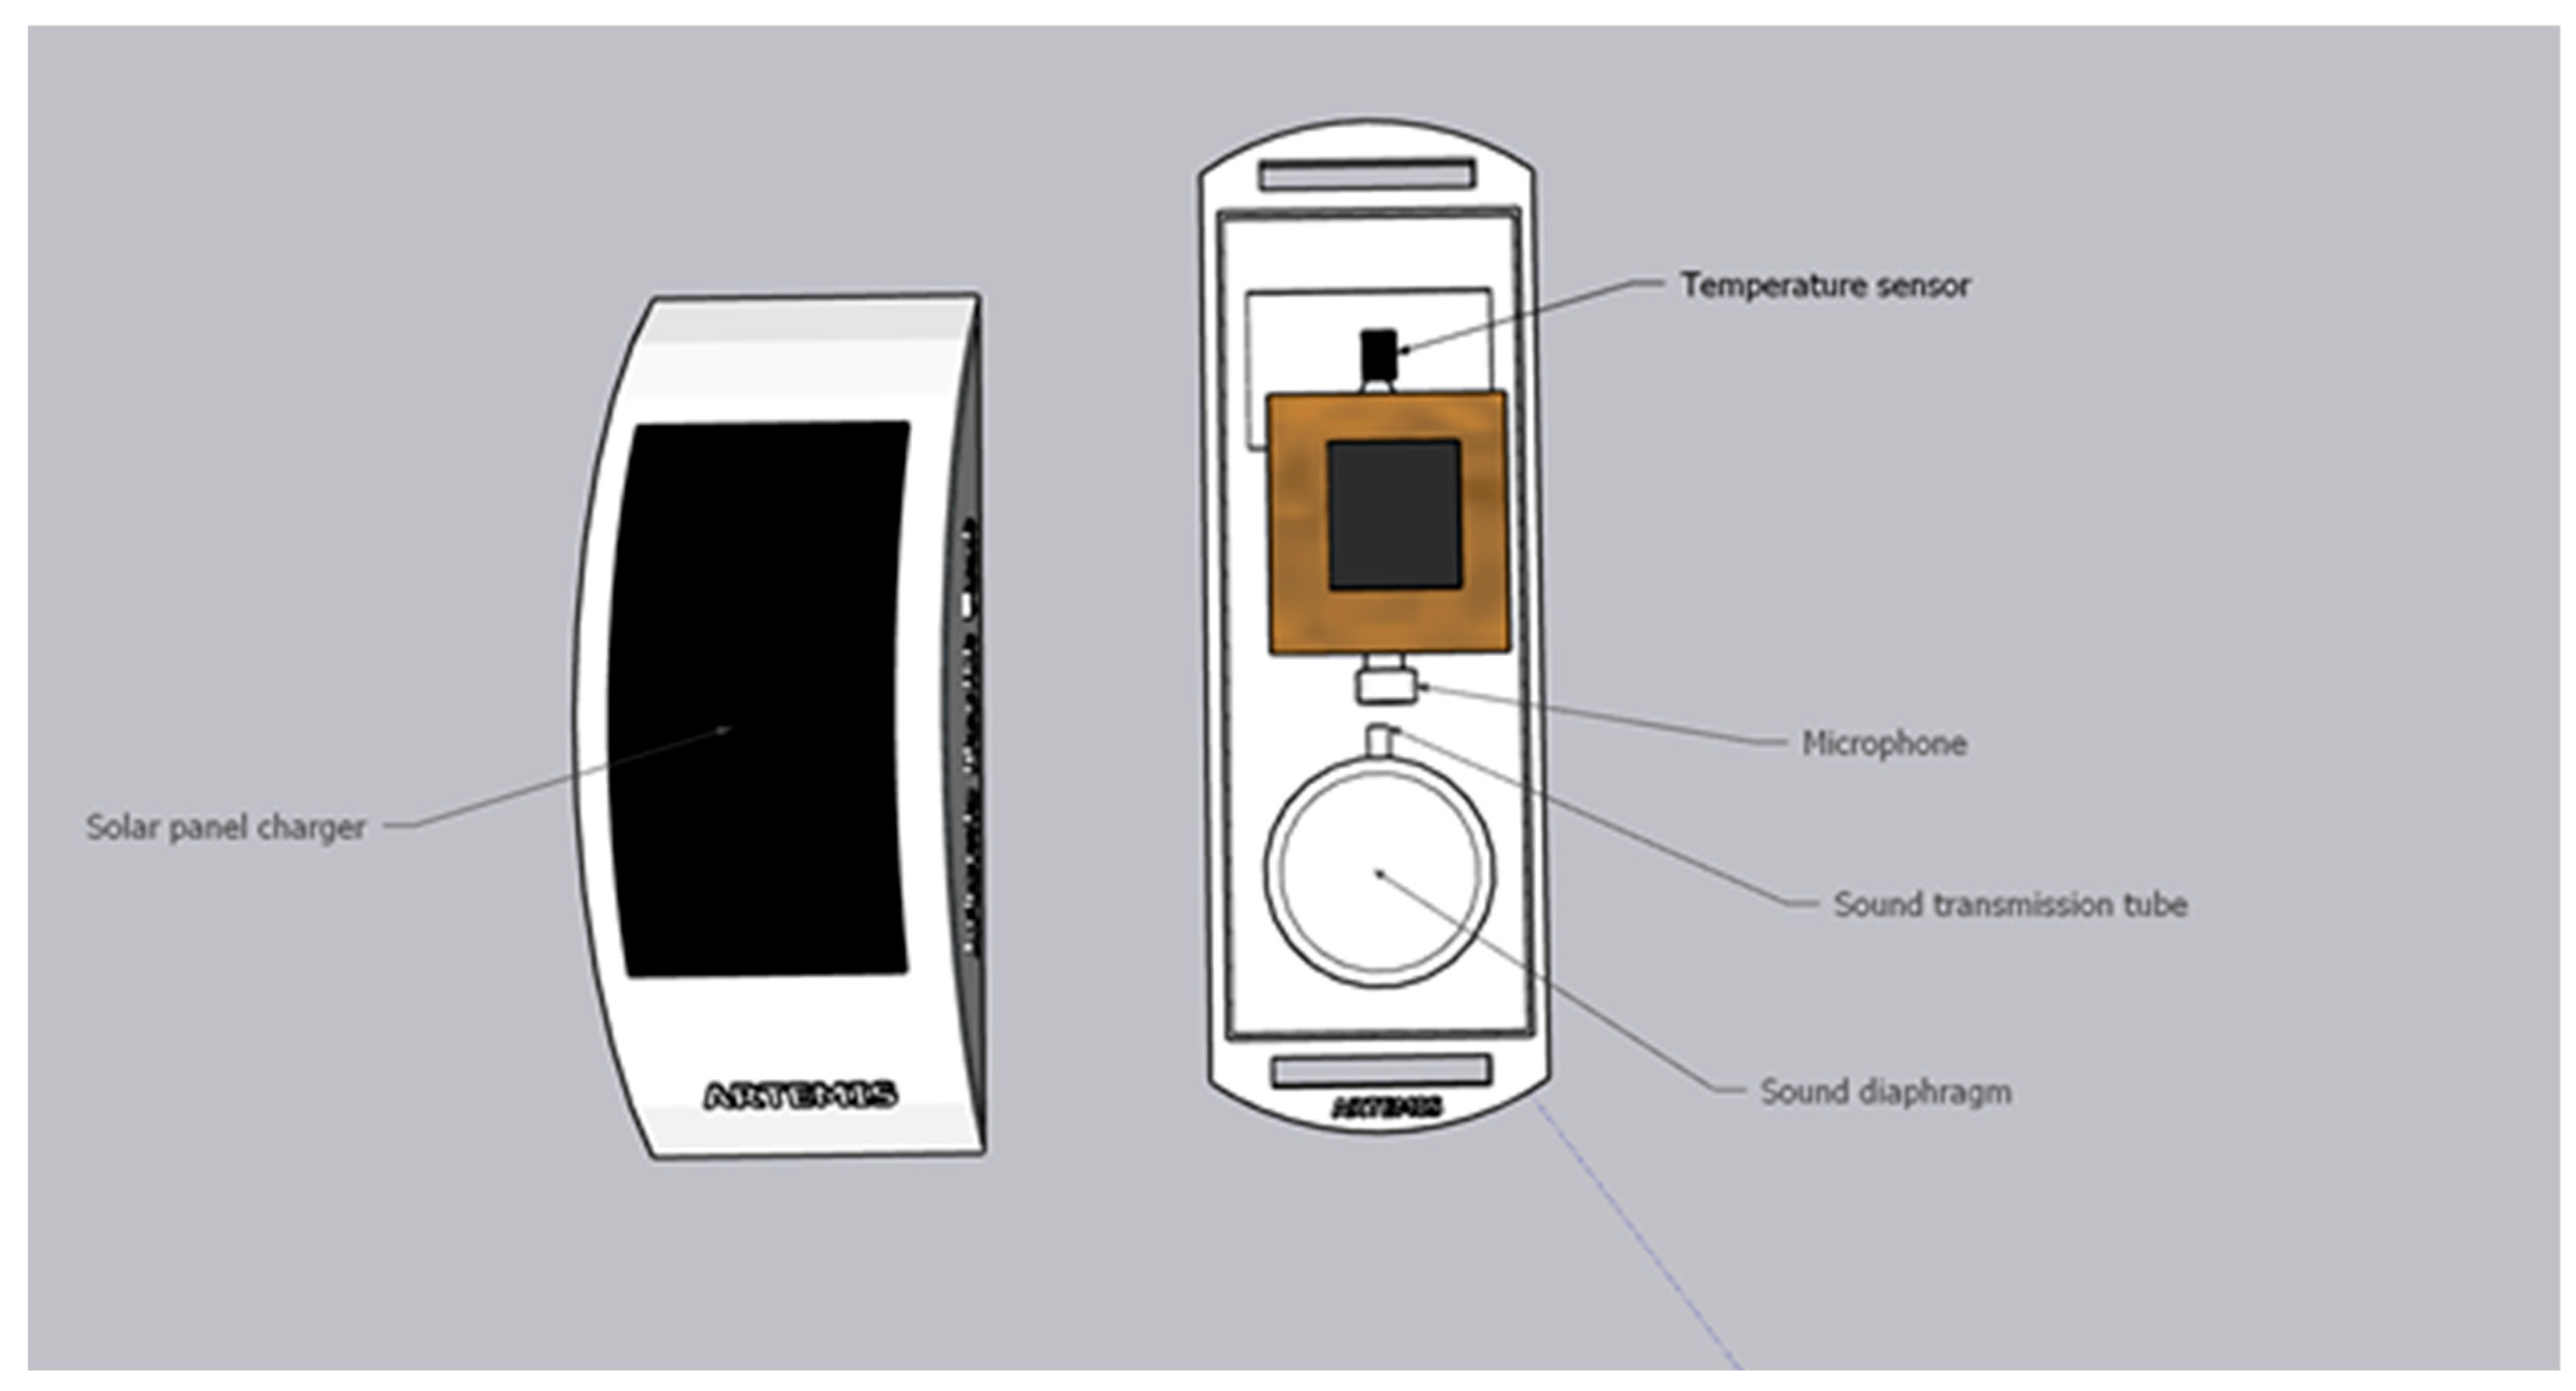
Figure 28.
Getting a beat from the cow's back.
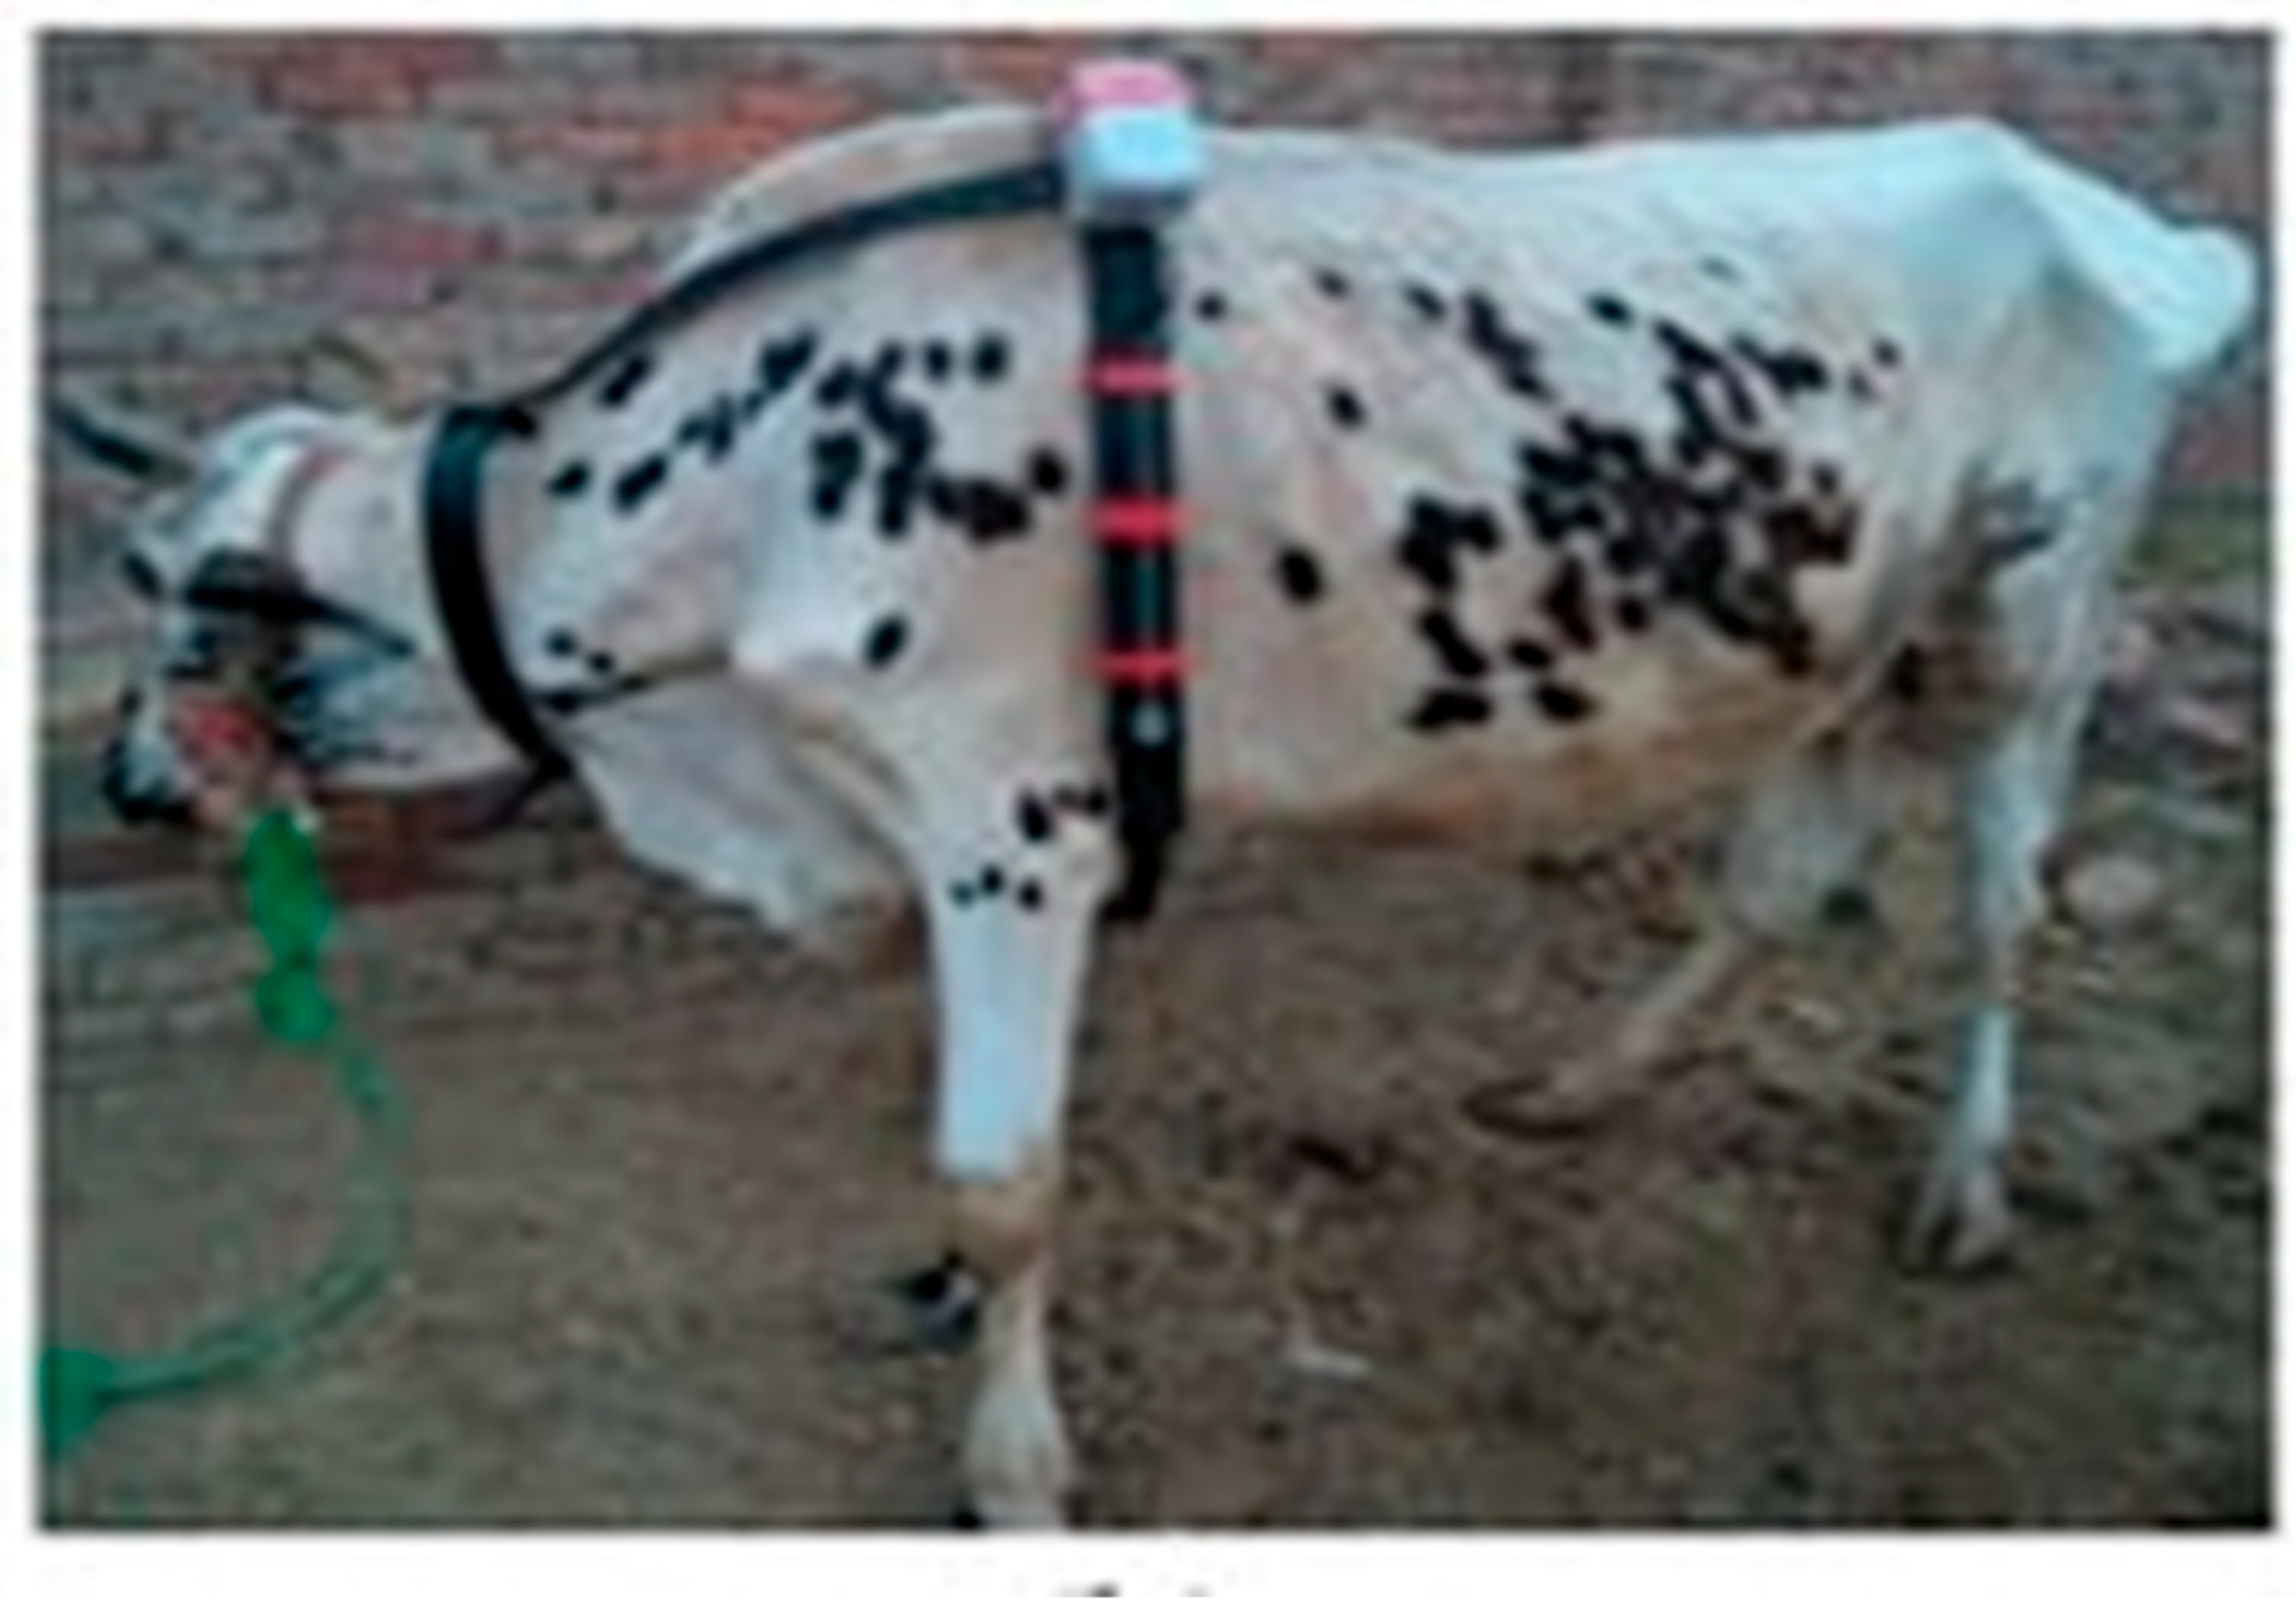
Figure 29.
Wearable Ultrasound Patch Monitors Blood Pressure.
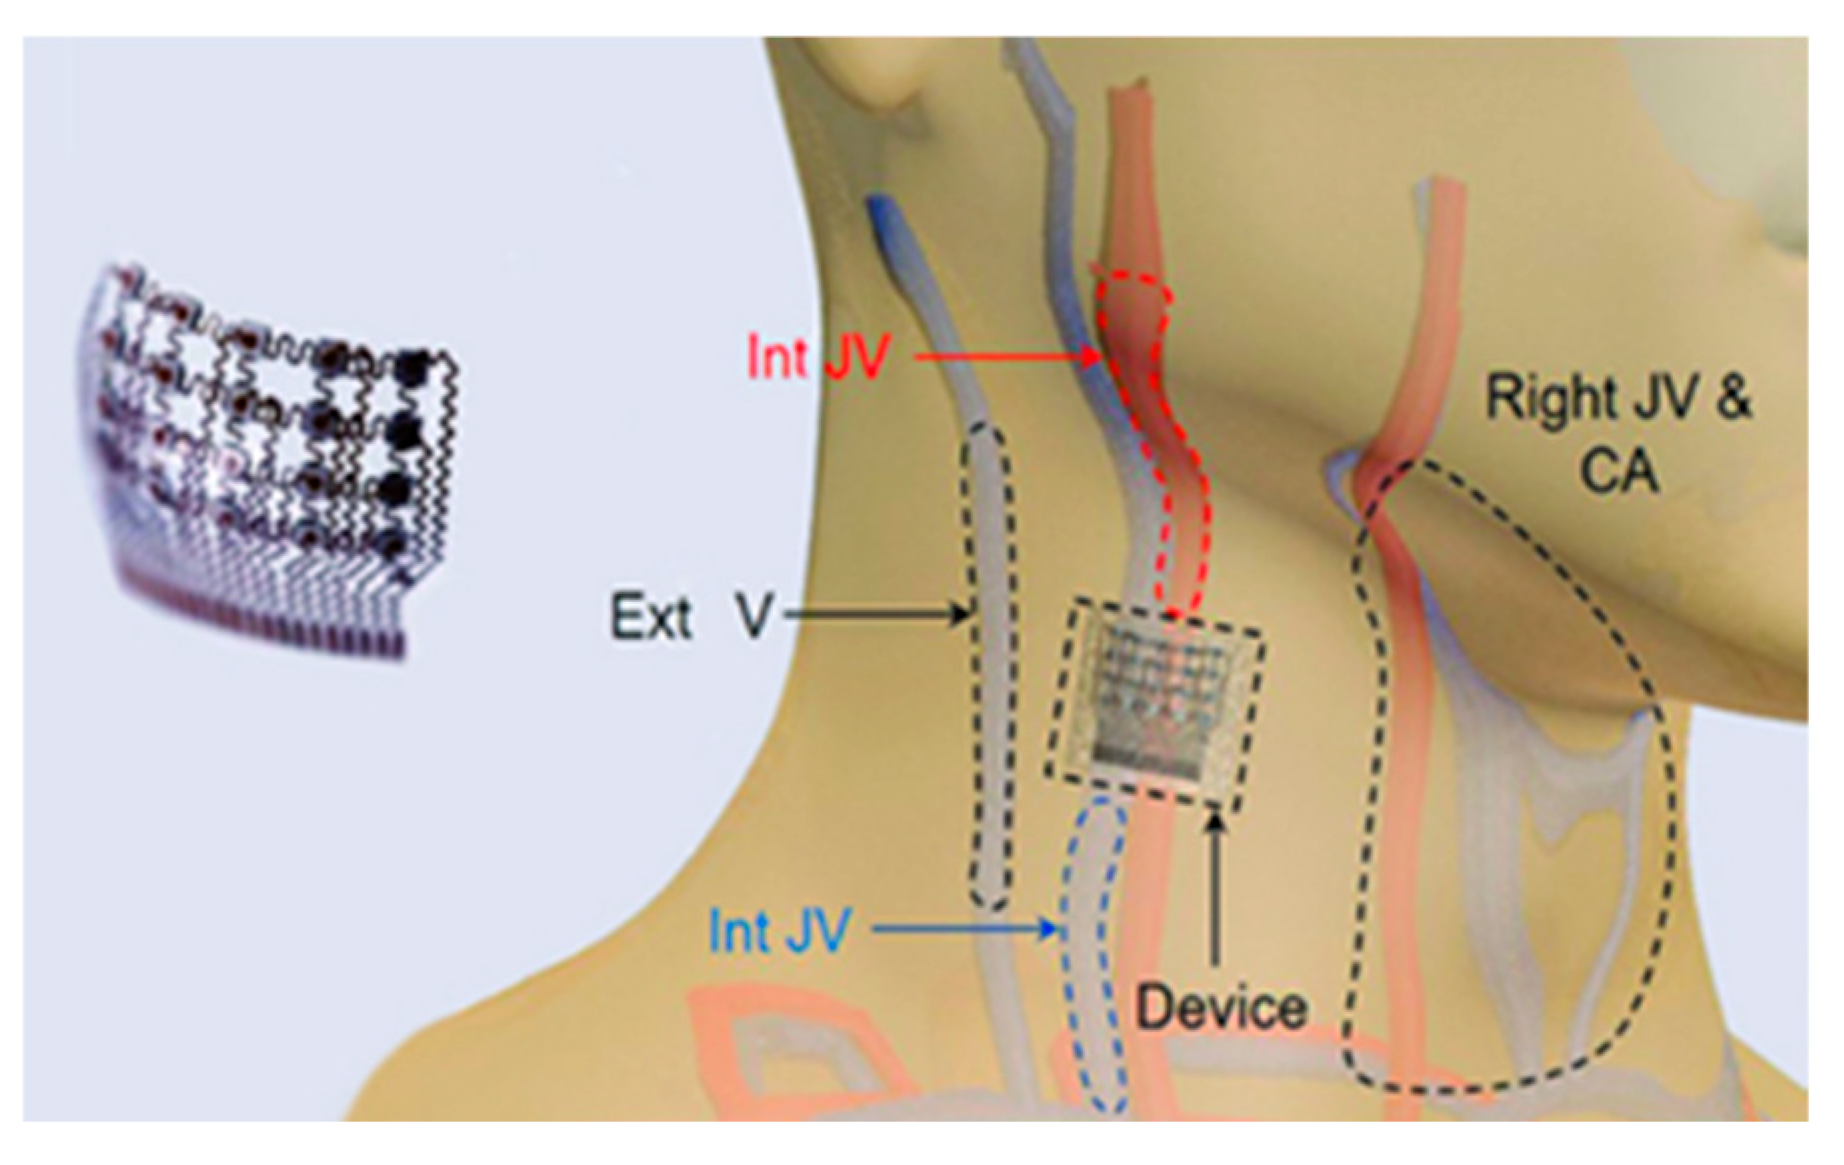
Figure 30.
Wearable sensor detects heartbeat.
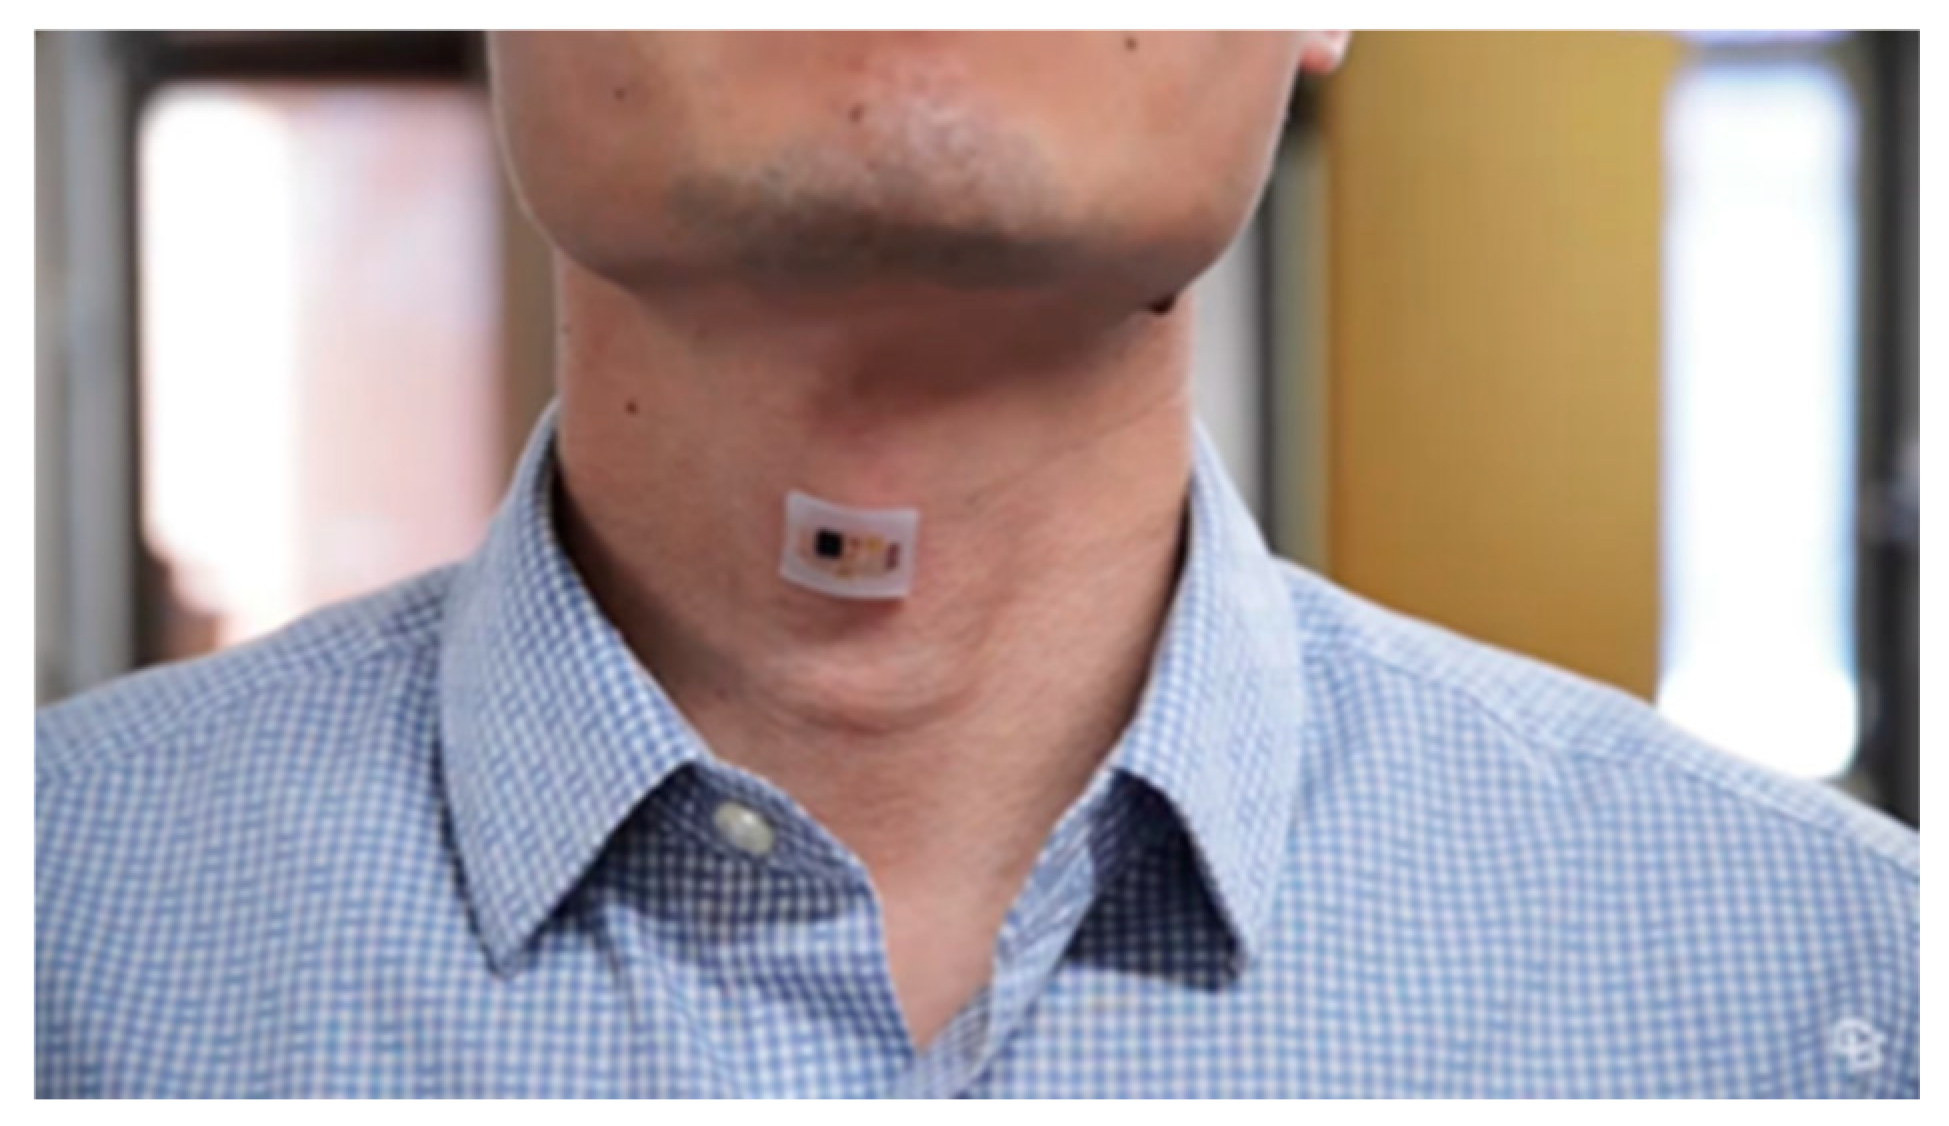
Figure 31.
Preliminary comparison of respiratory signals using acceleration on neck.
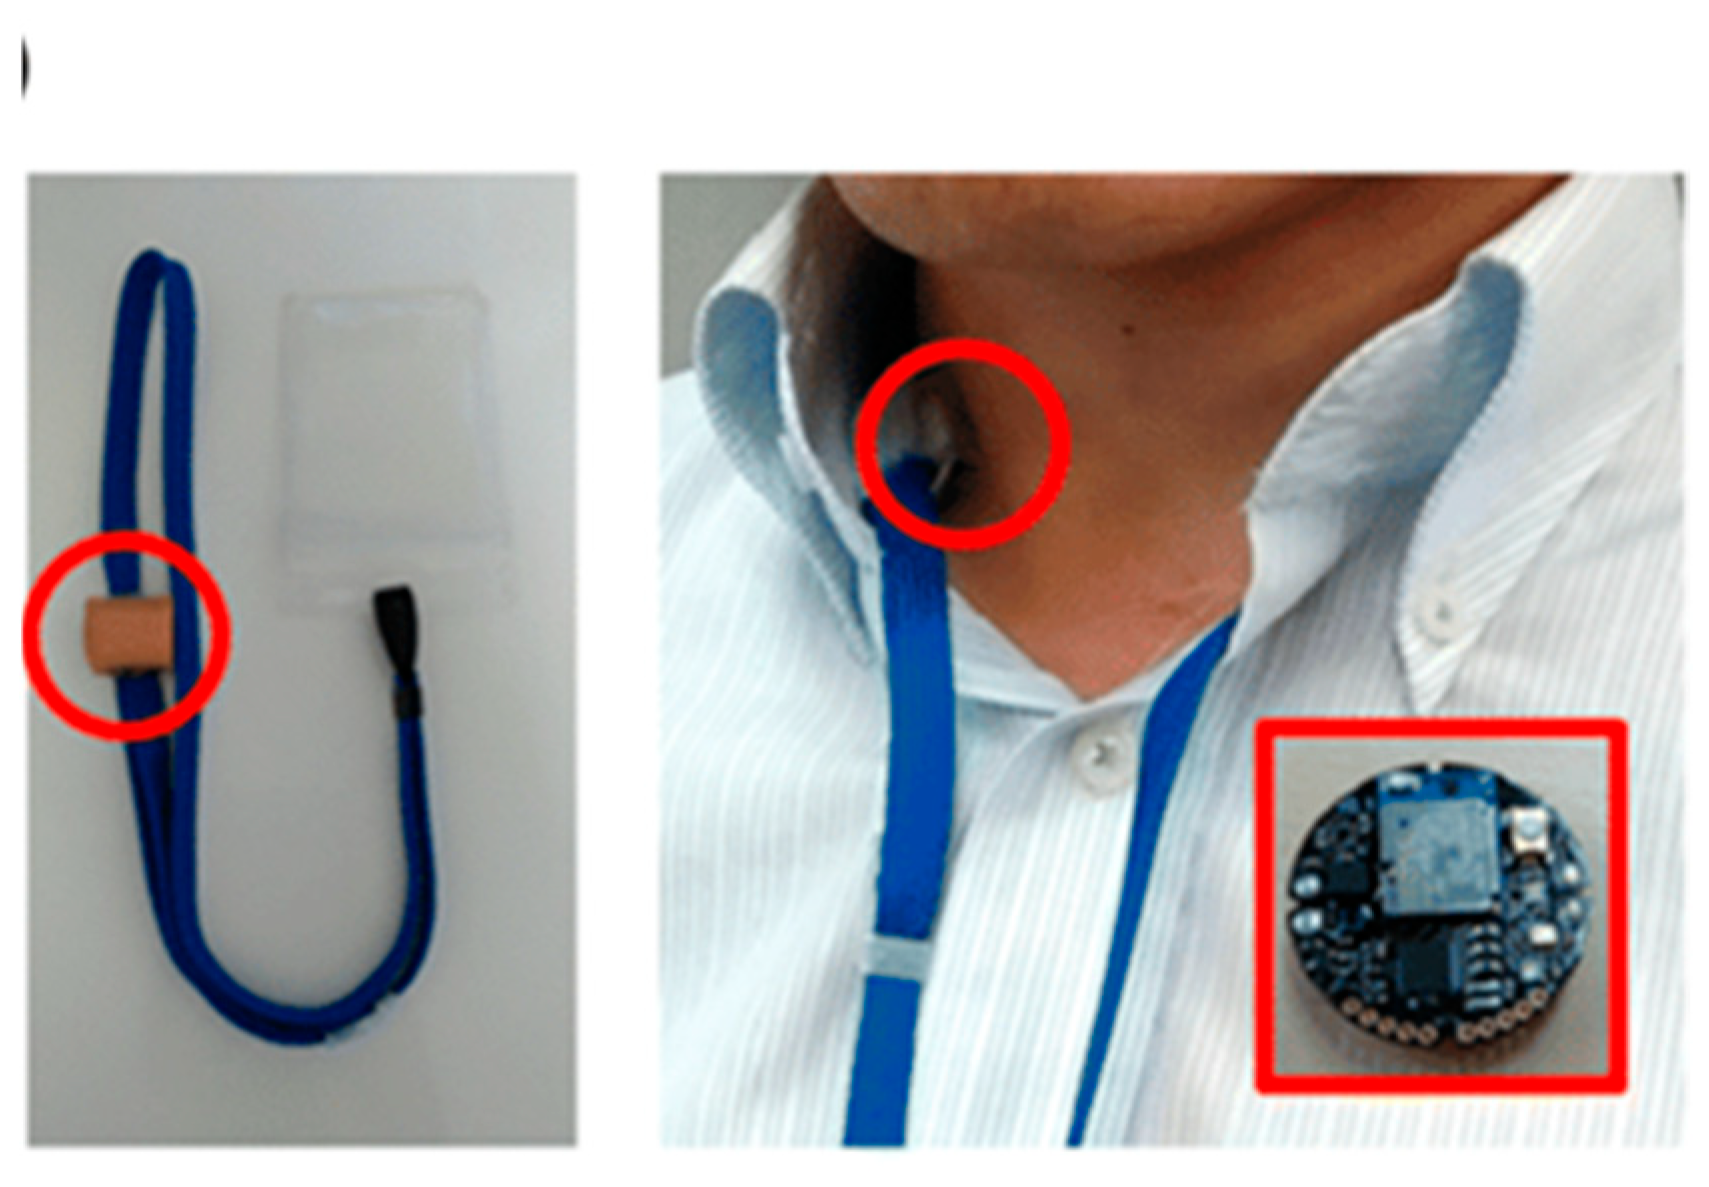
Figure 32.
Pregnancy monitoring in cattle via.
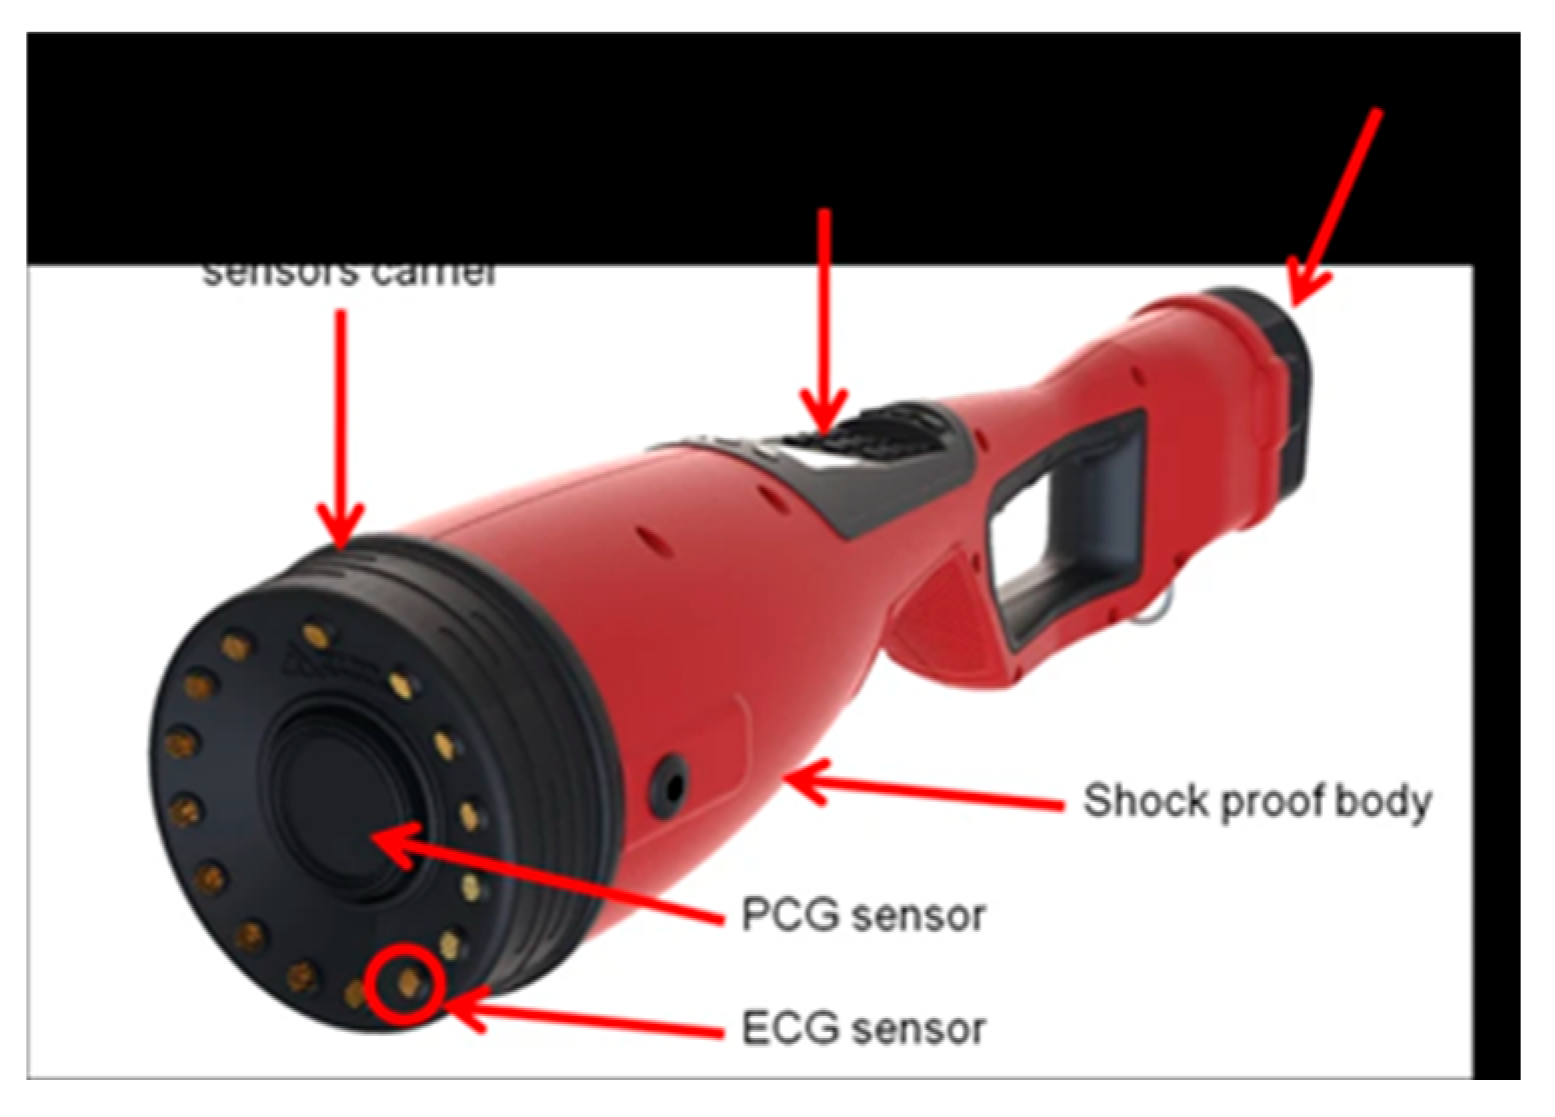
Figure 33.
Heart Rate Detection using Piezoelectric.
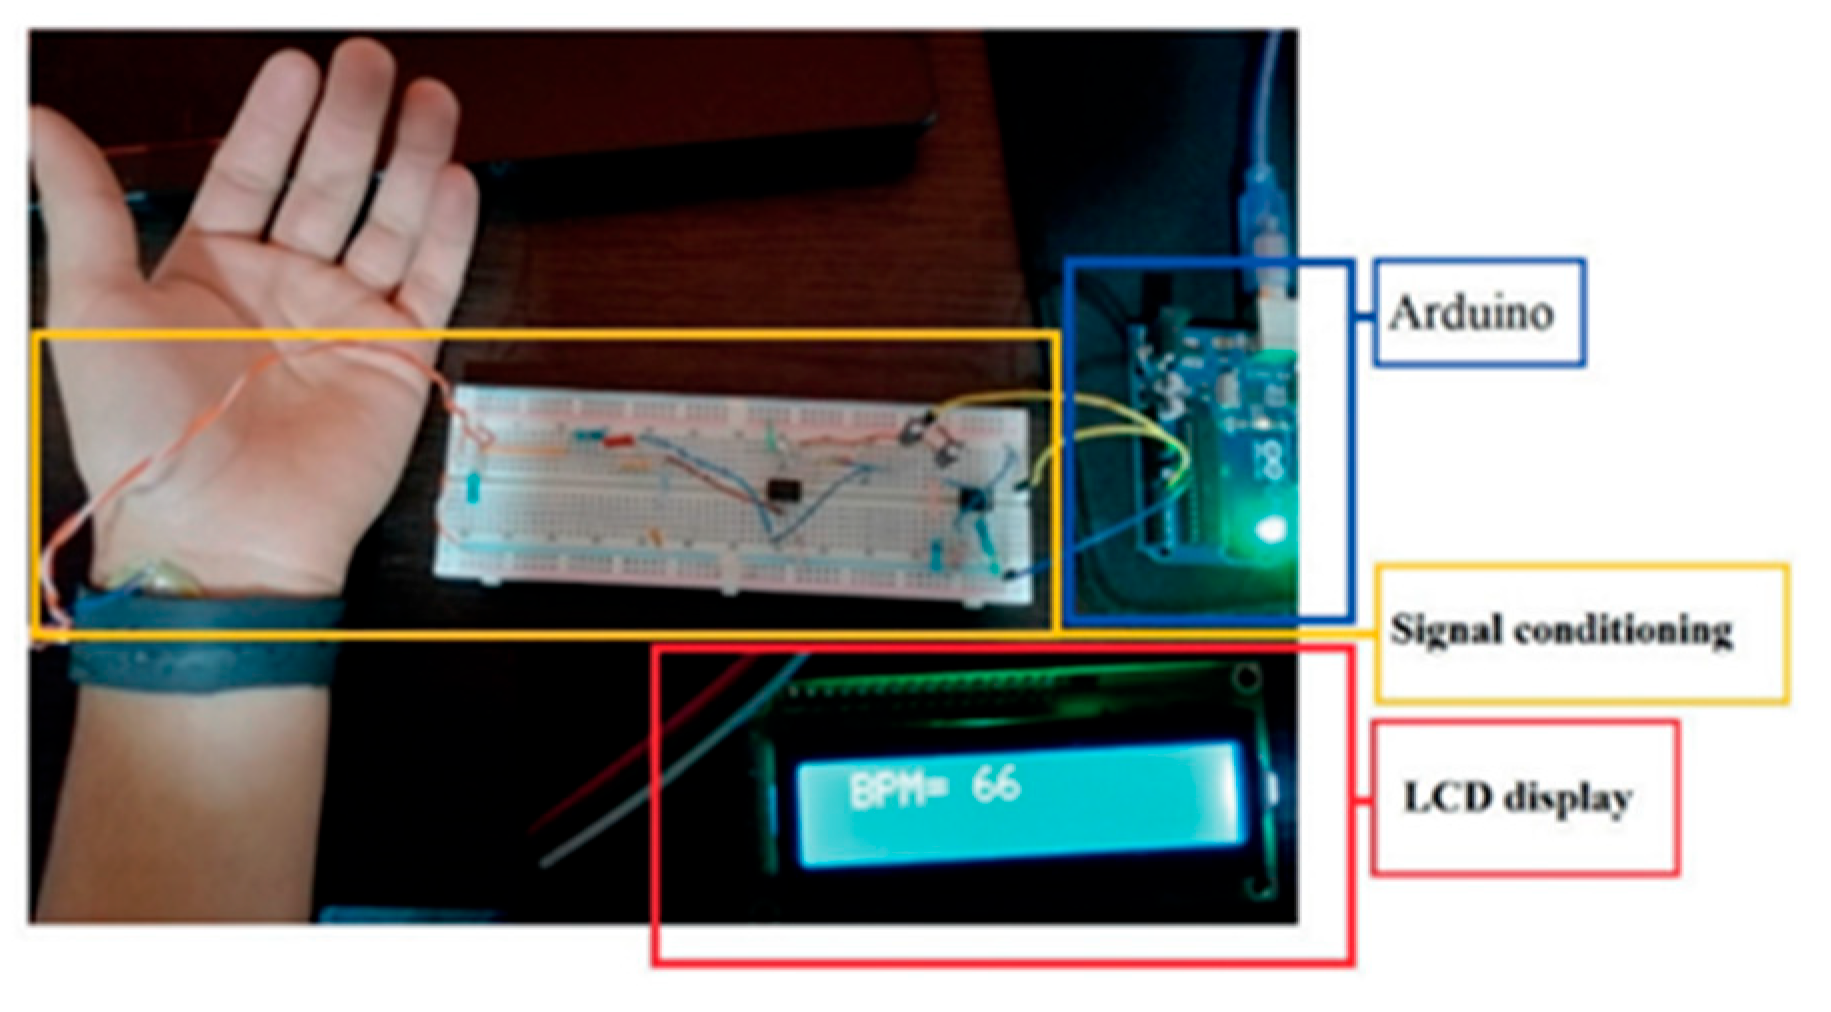
Figure 34.
piezoelectric nanogenerator.
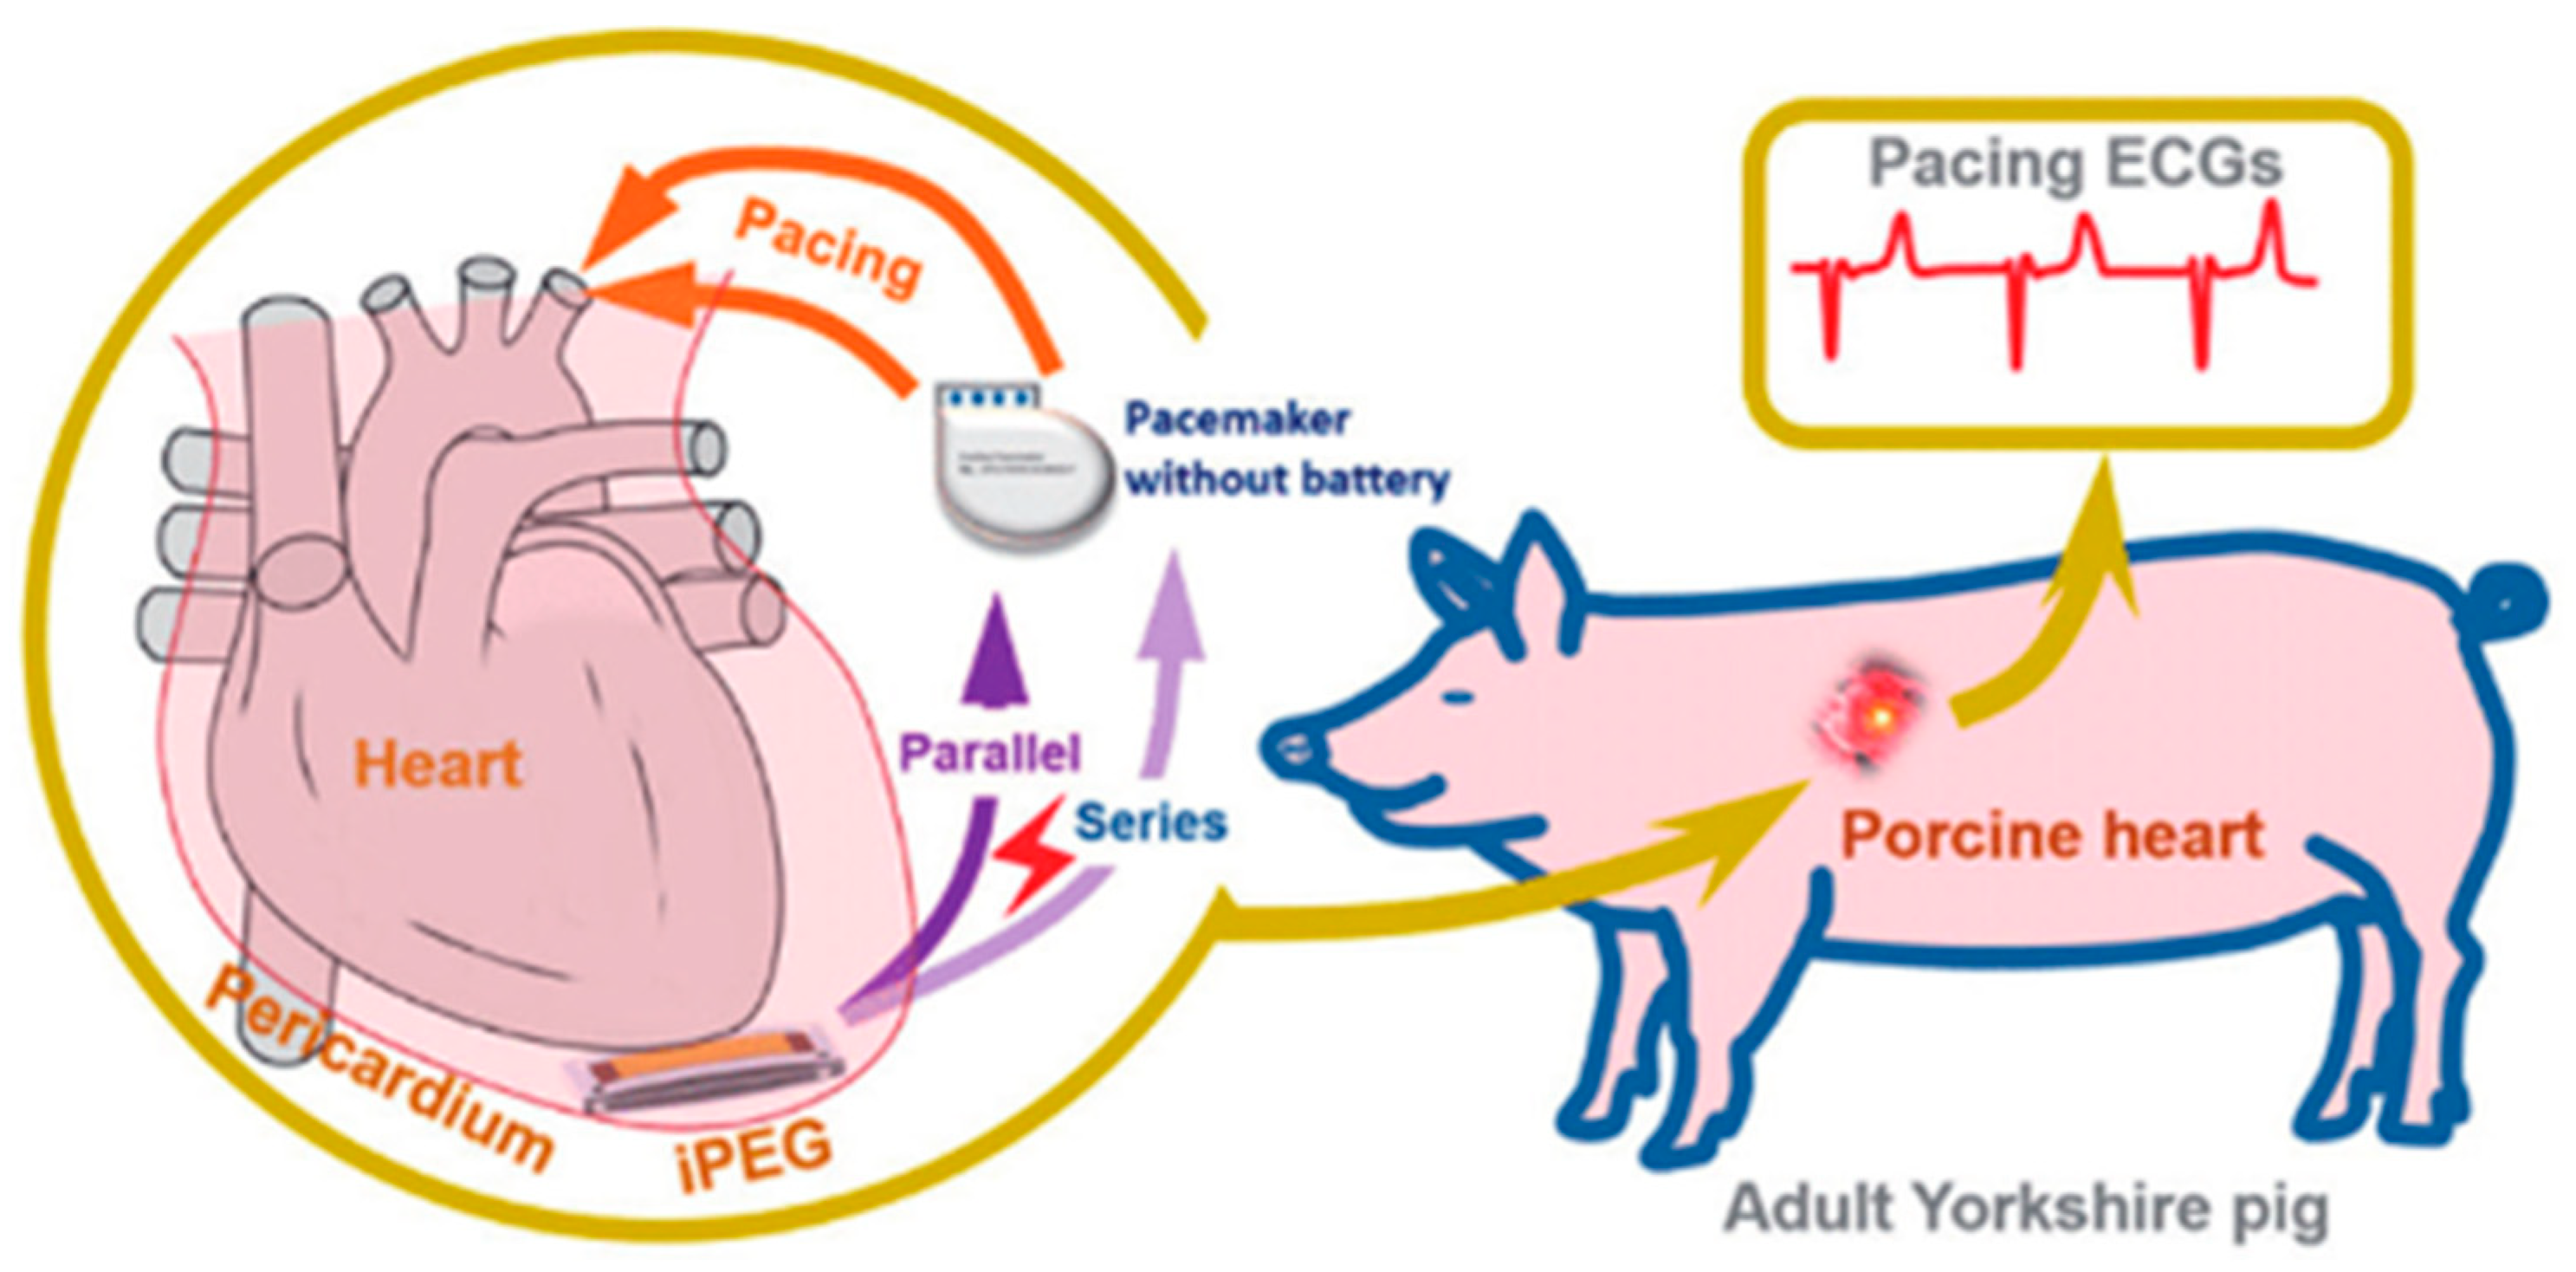
Figure 35.
Smart digital Stethoscope.
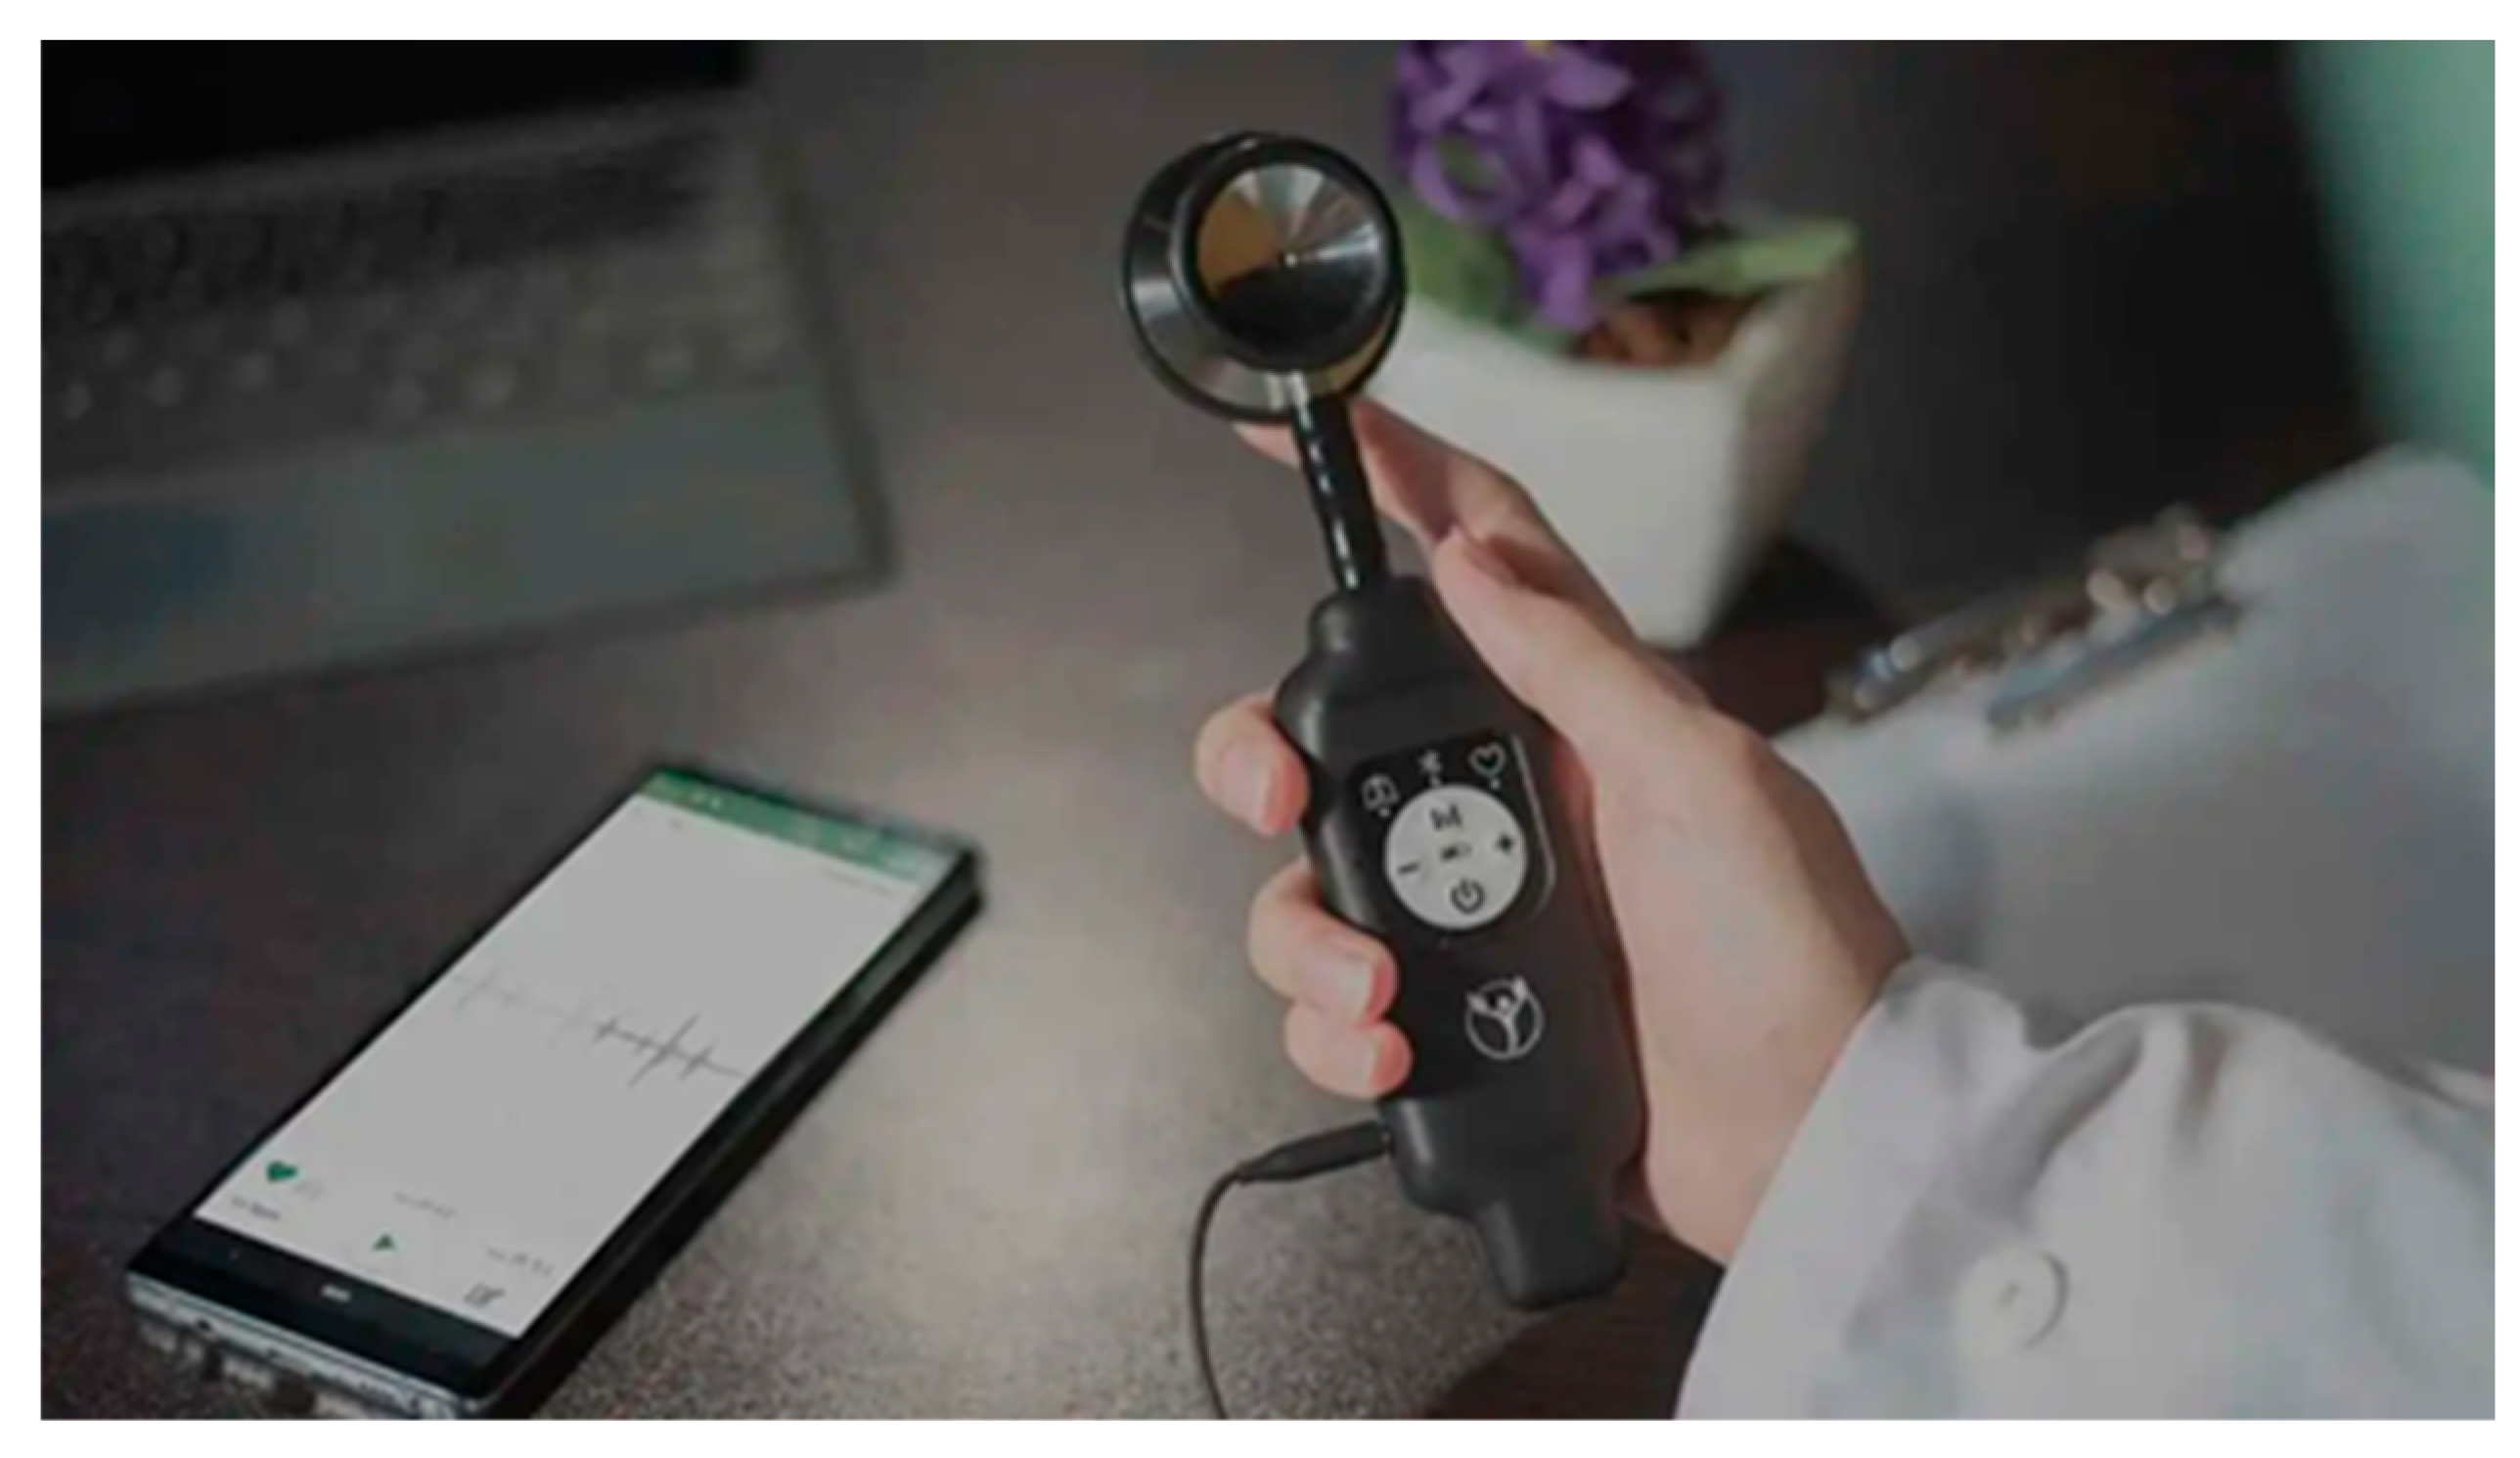
Figure 36.
Phonocardiography.
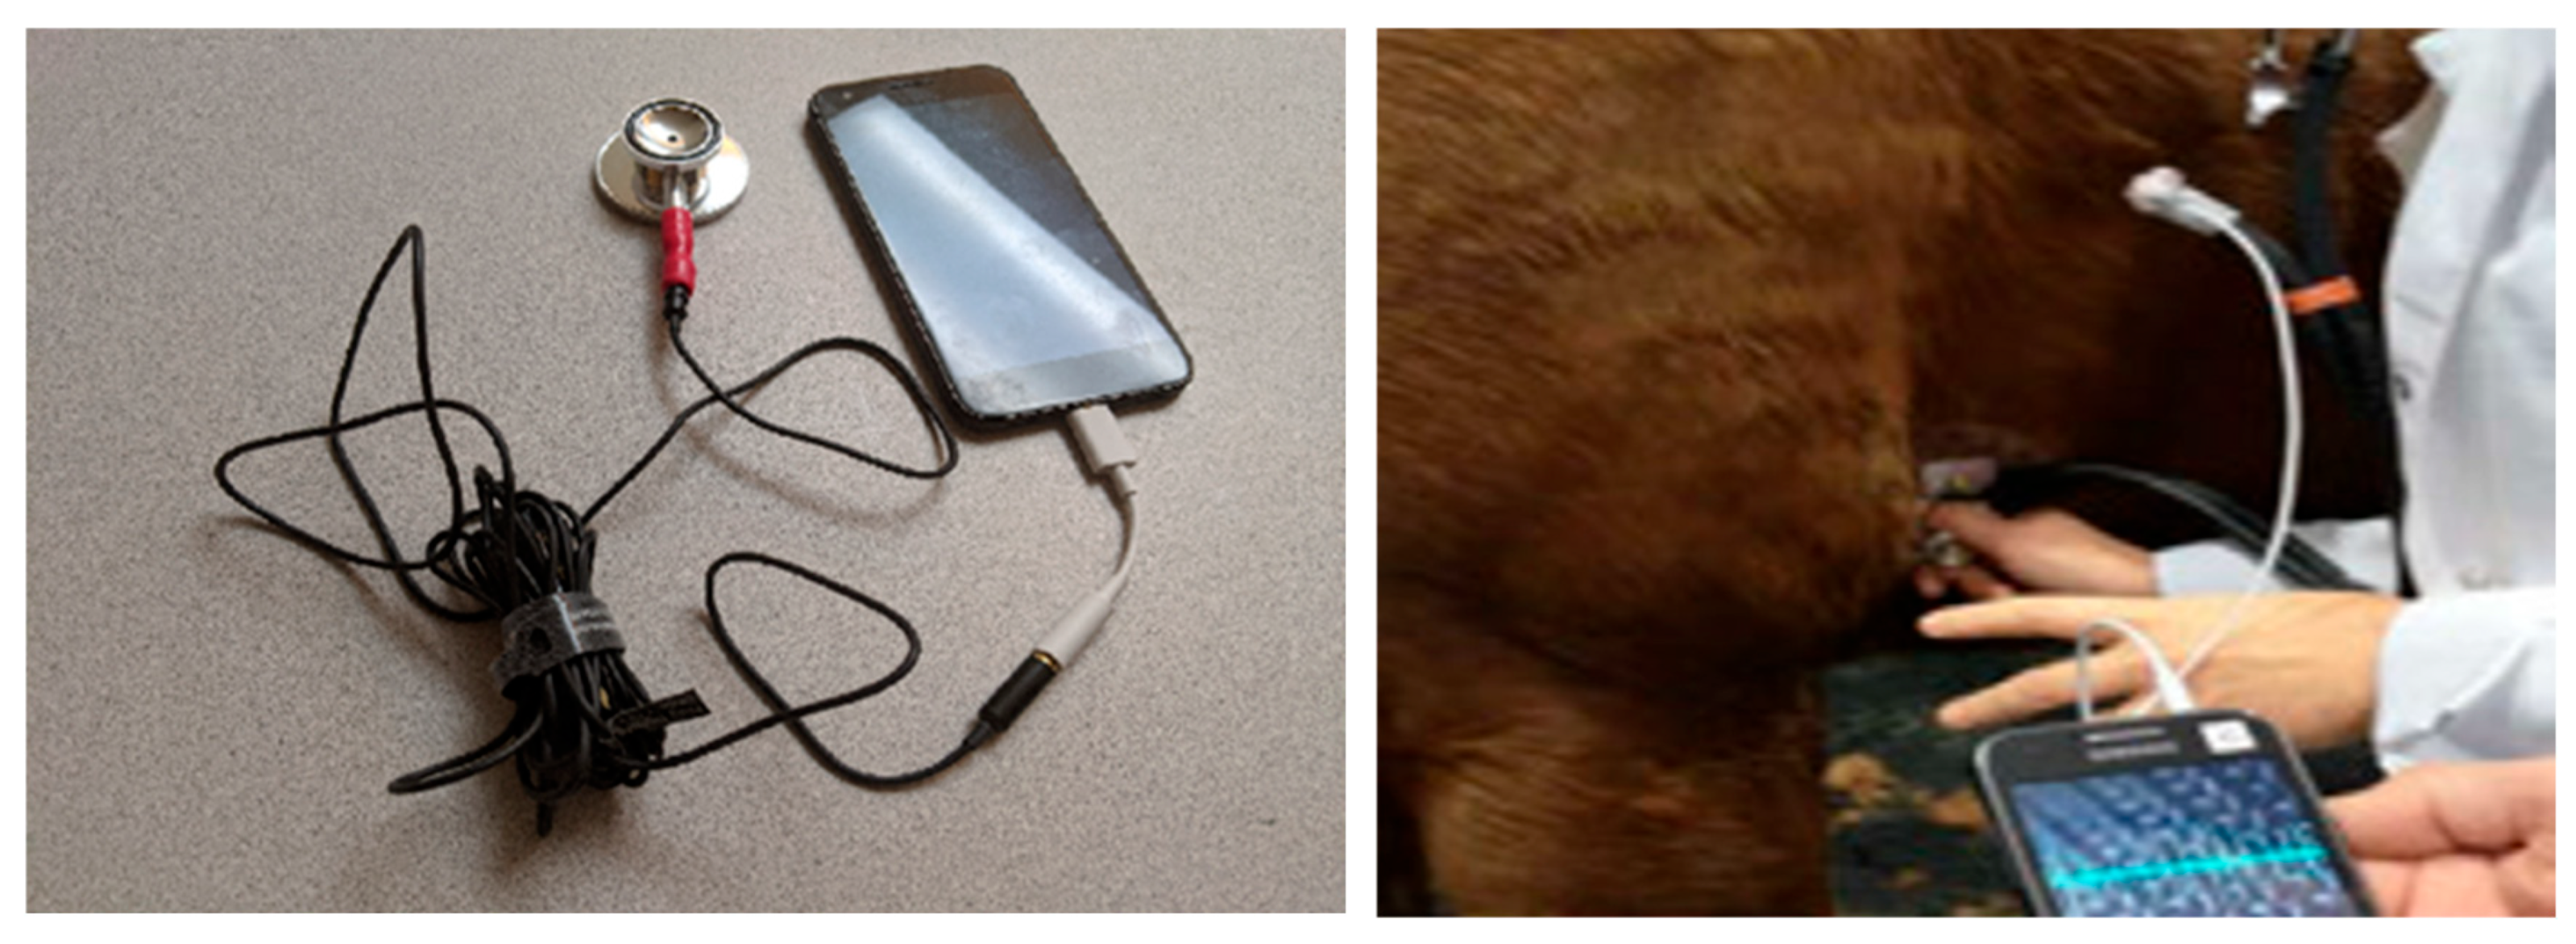
Figure 37.
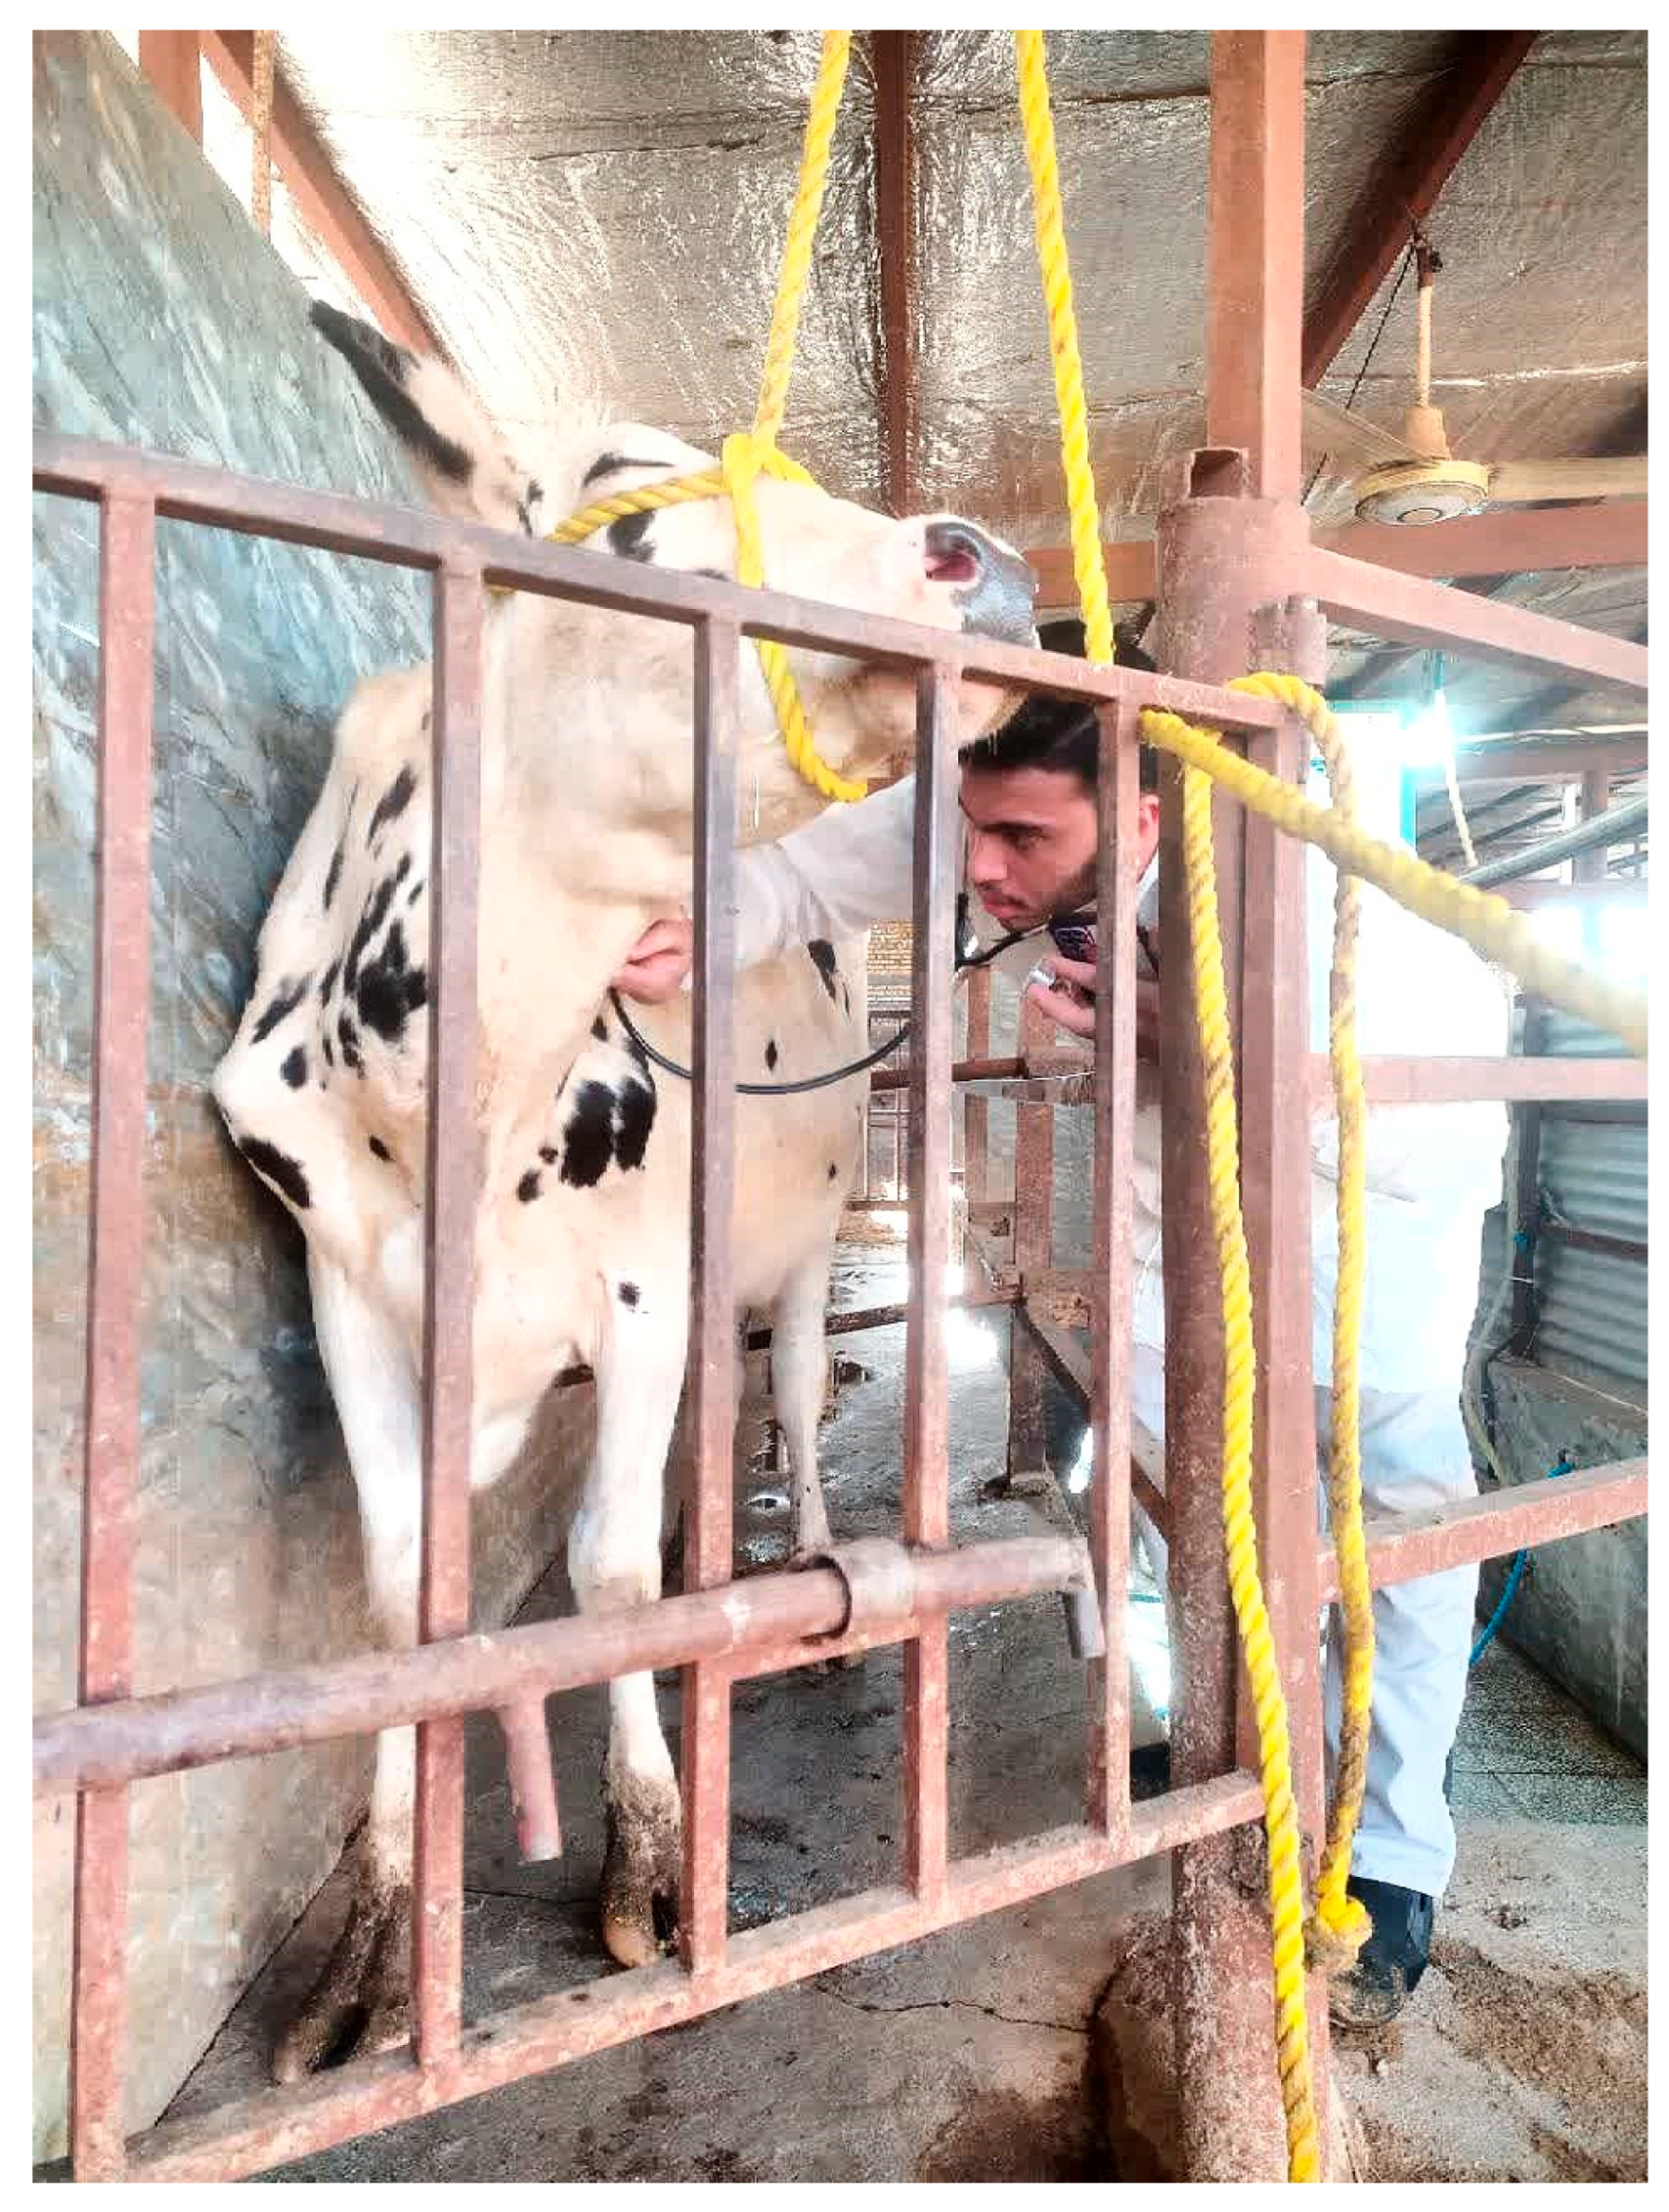
Figure 38.
Waveform of the Heartbeat Signal.
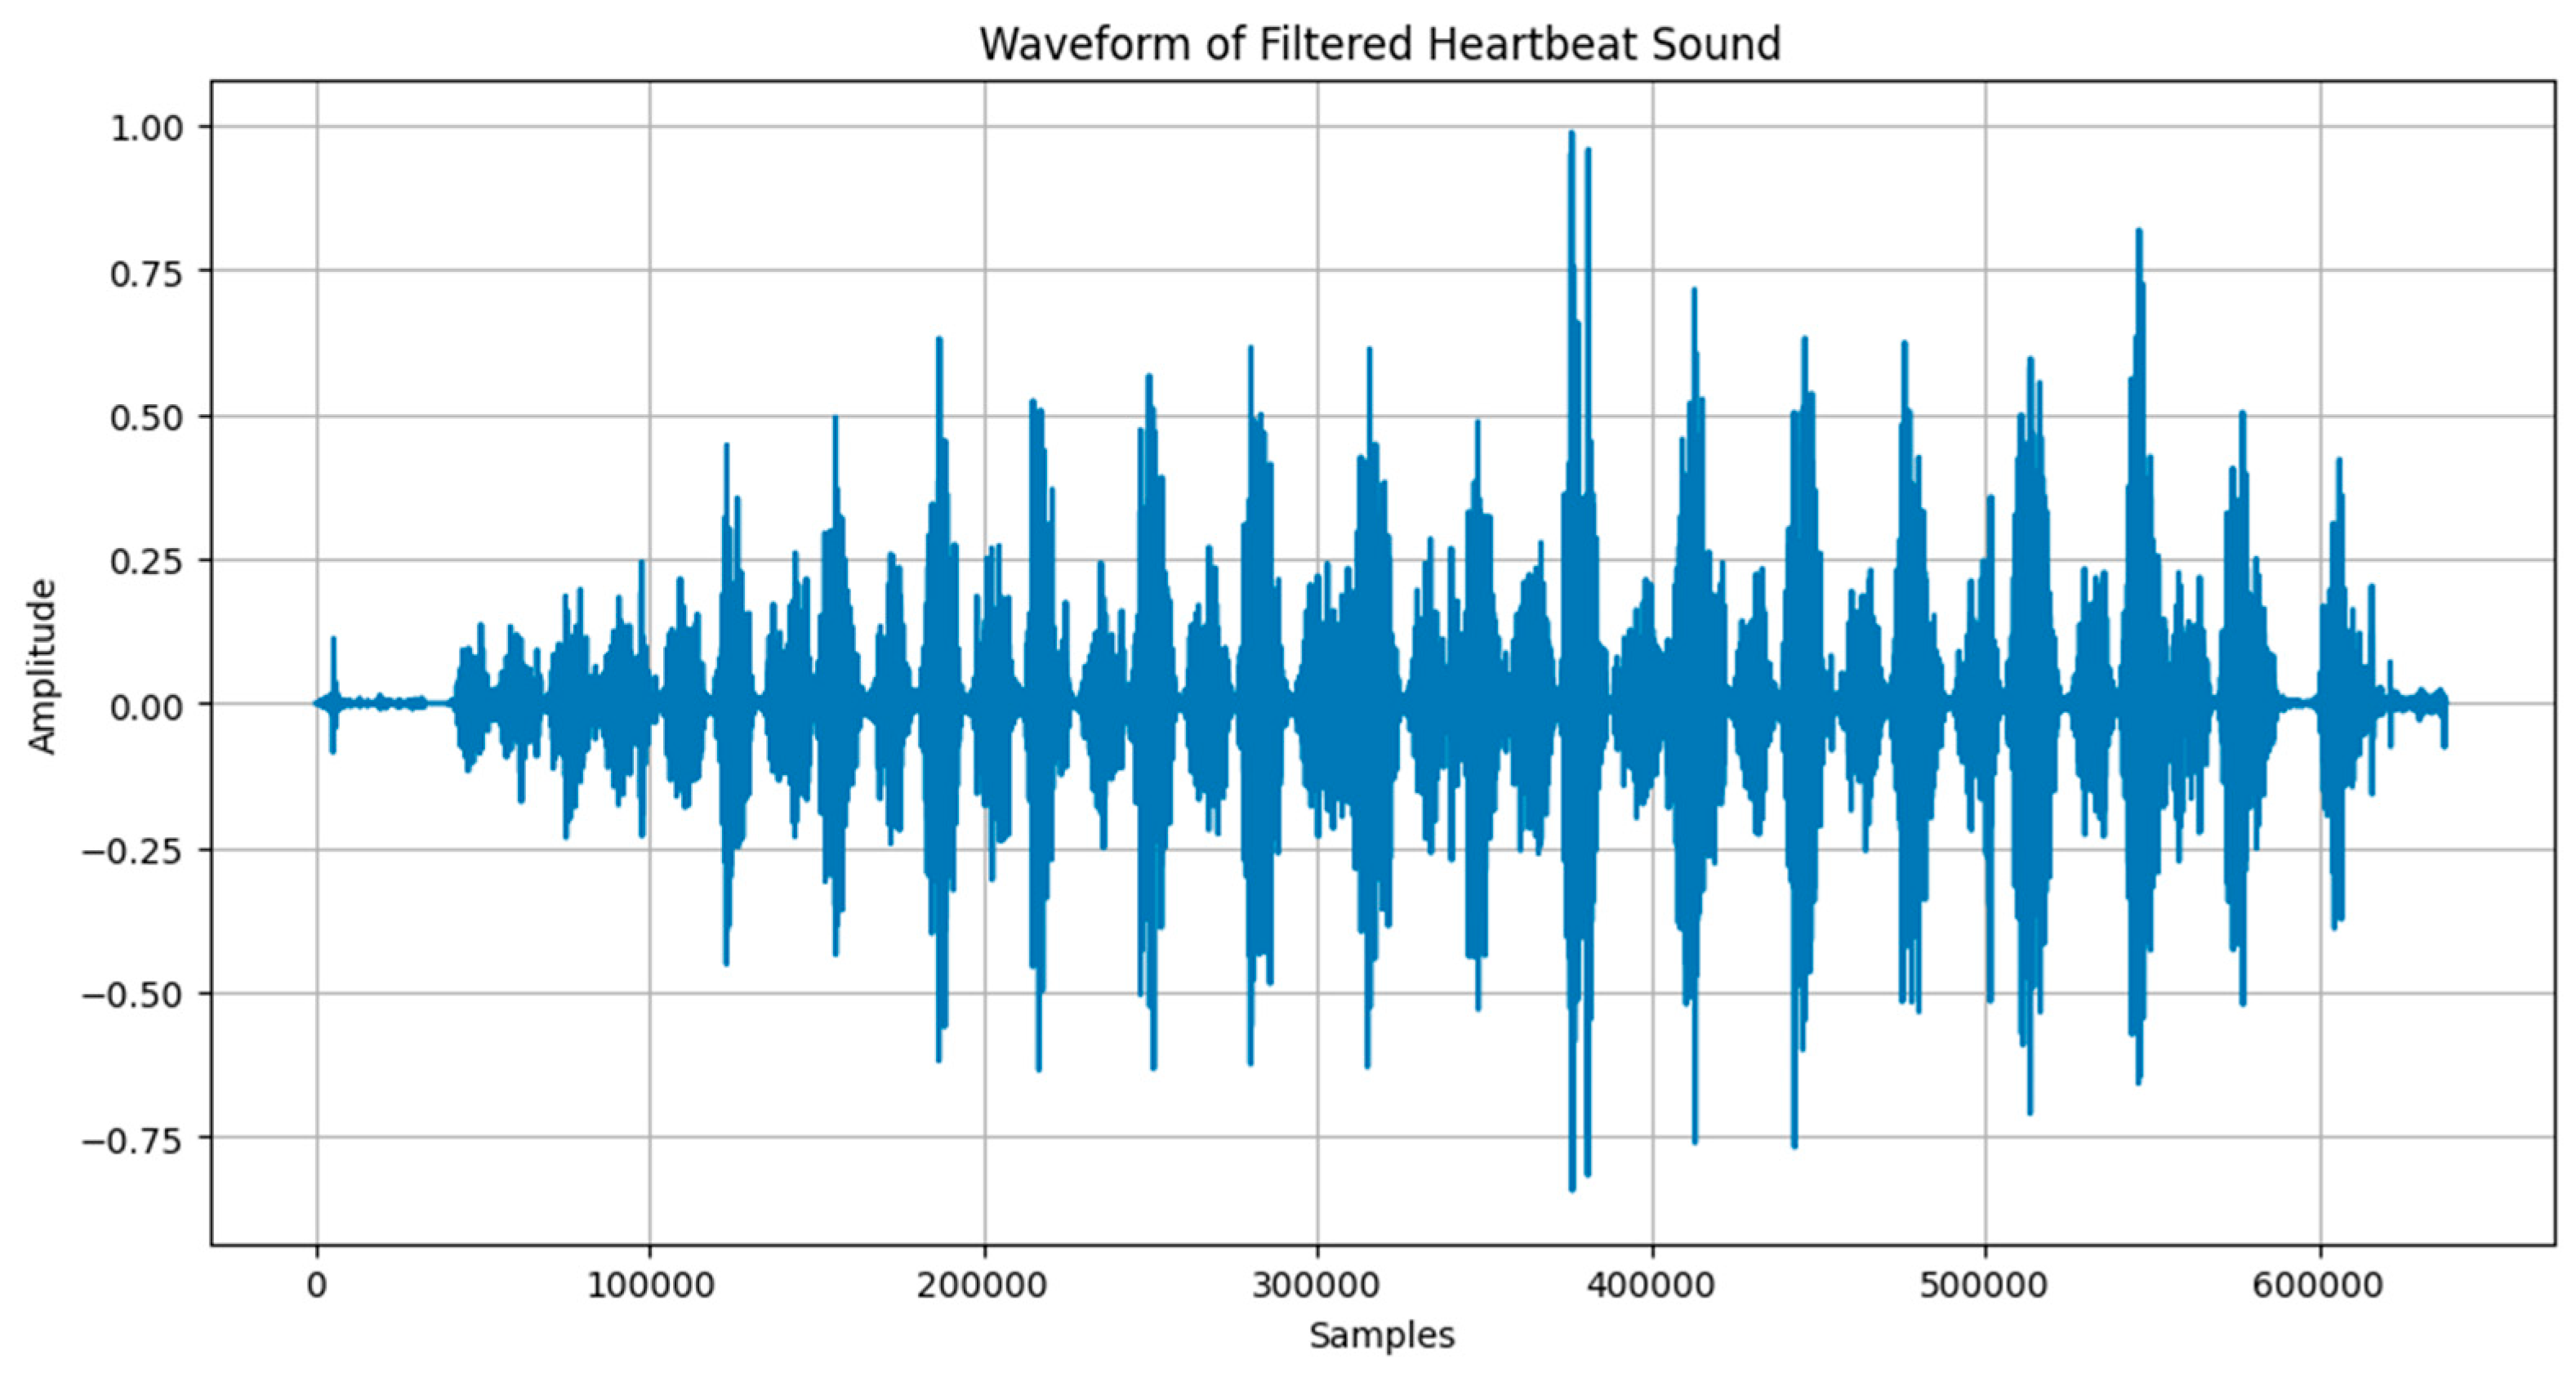
Figure 39.
Spectrogram of the Heartbeat Signal.
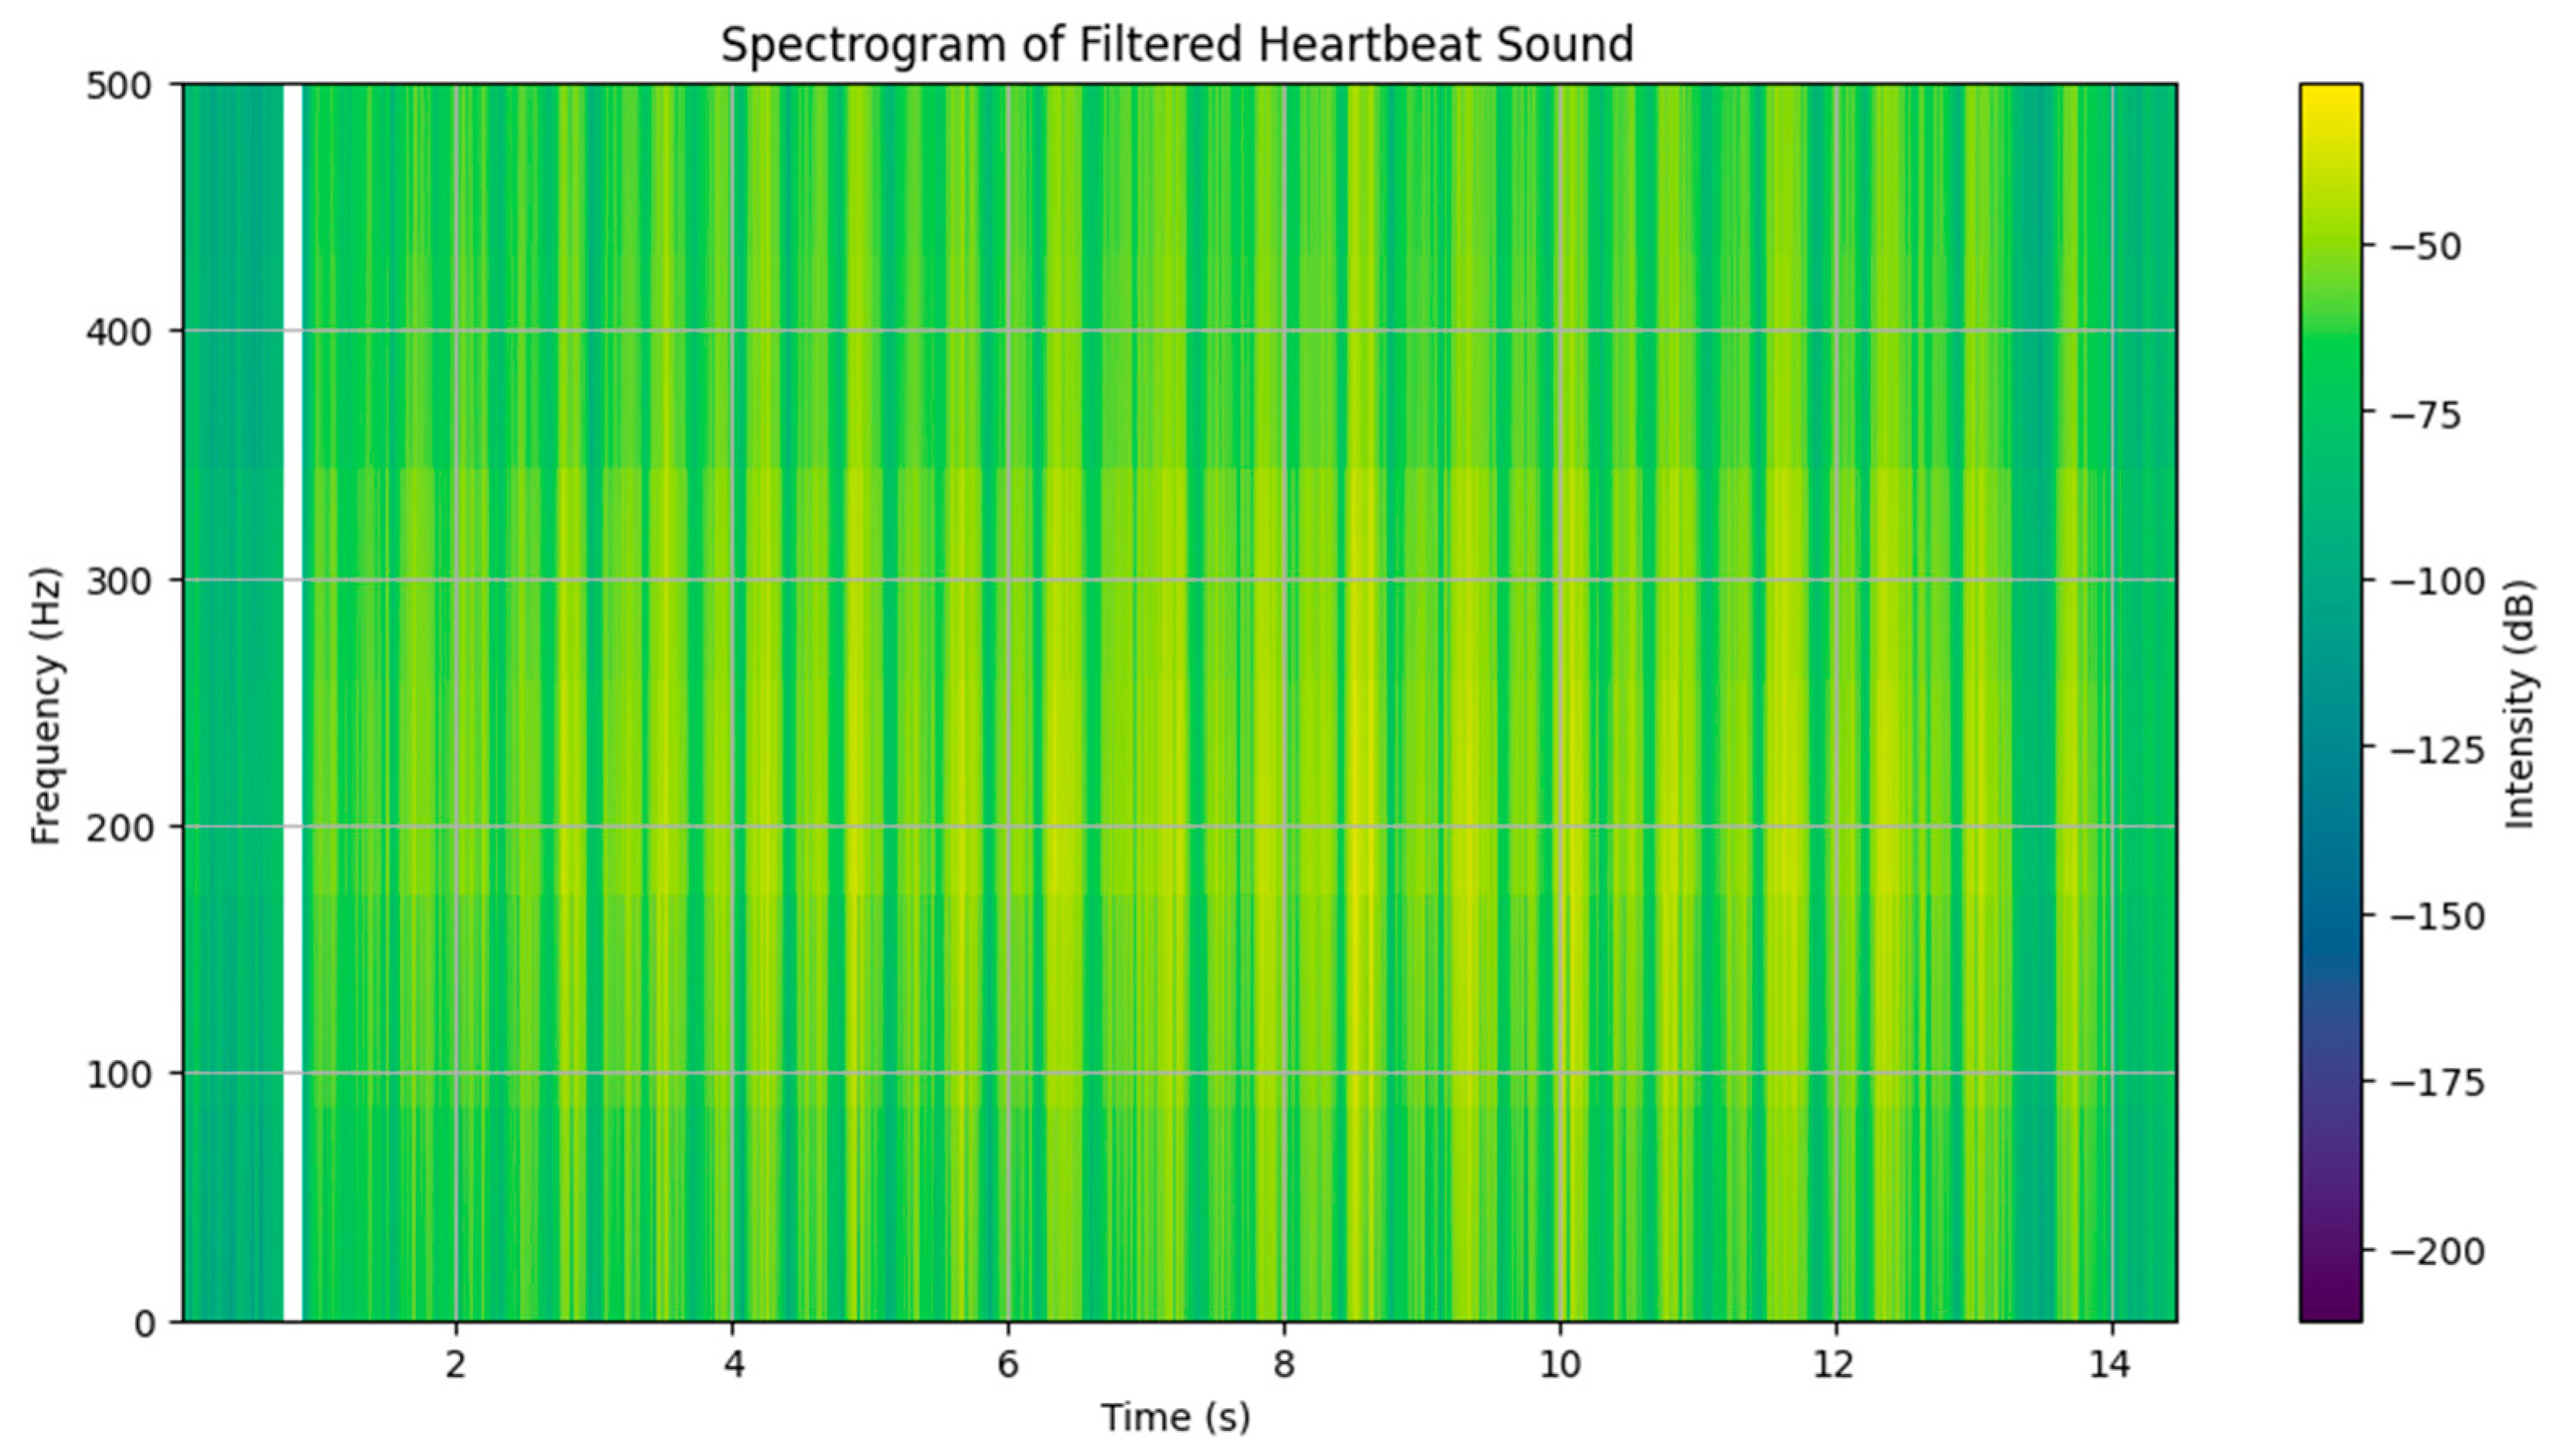
Figure 40.
Extracted Audio Features from the Heartbeat Signal.
Disclaimer/Publisher’s Note: The statements, opinions and data contained in all publications are solely those of the individual author(s) and contributor(s) and not of MDPI and/or the editor(s). MDPI and/or the editor(s) disclaim responsibility for any injury to people or property resulting from any ideas, methods, instructions or products referred to in the content. |
© 2025 by the authors. Licensee MDPI, Basel, Switzerland. This article is an open access article distributed under the terms and conditions of the Creative Commons Attribution (CC BY) license (http://creativecommons.org/licenses/by/4.0/).
Copyright: This open access article is published under a Creative Commons CC BY 4.0 license, which permit the free download, distribution, and reuse, provided that the author and preprint are cited in any reuse.


