
Submitted:
20 June 2025
Posted:
20 June 2025
You are already at the latest version
Abstract
Energy storage systems are becoming increasingly important as more renewable energy systems are integrated into the electrical (or power utility) grid. Low-cost and reliable energy storage is paramount if renewable energy systems are to be increasingly integrated into the power grid. Lead-acid batteries are widely used as energy storage for stationary renewable energy systems and agriculture due to their low cost, especially compared to lithium-ion batteries (LIB). However, lead-acid battery technology suffers from system degradation and relatively short lifetime, largely due to its charging/discharging cycles. In the present study, we use Machine Learning methodology to estimate the battery degradation in an energy storage system. It uses two types of datasets: discharge condition and lead acid battery data. The use of the Long Short-Term Memory (LSTM) model algorithm for estimating battery Remaining Useful Lifetime (RUL) is a promising development that has the potential to significantly improve battery performance/durability and reduce maintenance costs. The initial State of Health (SOH) and predicted SOH values provide insights into battery aging and RUL estimation for lead-acid batteries in the renewable energy systems for agricultural purposes.
Keywords:
Solar Energy
; Battery aging
; Remote Agriculture Areas
; RUL Estimation
; SOH
; LSTM
; SVR
1. Introduction
Indonesia is an agricultural country, and the agricultural sector has a very important role in the national economy. Based on data from the Central Bureau of Statistics (2021) [1] the percentage of workers in the agricultural sector is 88.43% in 2021. Apart from the planting process, post-harvest yield management will greatly affect the quality of agricultural products, one of which is the drying process of agricultural products [2]. Drying can be done by using a machine with electrical energy, or manually by relying on sunlight, which only supplies energy during the day. Thus, at night, the drying process cannot be carried out. Drying with electric-powered machines is difficult, especially in remote agricultural areas, because electricity from the State Electricity Company sources is not yet affordable. Therefore, local electricity production by utilizing energy resources such as Renewable Energy Resources (RES) can be implemented, one of which is solar energy [3] In their research [4] have developed what they called “SMART DOME 4.0” which is a Solar Drying Dome system [4] for drying agricultural products using photovoltaic (PV) energy sources to answer the problems of post-harvest agricultural activities. In the Solar Power Plant energy system[4] , the battery plays an important role as a store of electrical energy in electrochemical cells. The importance of battery for an energy storage system goes beyond agricultural applications. Energy storage systems are becoming increasingly important as more renewable energy systems are integrated into the electrical grid. If renewable energy systems are to be increasingly integrated into the electrical (or power utility) grid, low-cost and reliable energy storage is paramount[4]. Renewable energy systems, such as solar and wind power, are variable in their output and are therefore not always able to meet consumers' electricity demands. Energy storage systems can help balance the supply and demand of electricity by storing excess energy when it is produced and releasing it when it is needed.
Battery performance can be seen based on several parameters including depth of discharge (DoD), number of cycles of battery, the efficiency of battery, charge and discharge rate, and temperature of battery and battery capacity. During its use, the battery will degrade. Battery management plays an important role in battery operation to prevent the battery from being damaged quickly. Accurate estimation is one of the efforts to prevent batteries from operating in an overcharge and over-discharge state which can cause damage to the battery and cause a short battery life [5]. Research on the estimation of battery characteristics has been carried out, especially on batteries that are applied to electric motors [6]–[9]. However, there are still not many batteries that can be used as energy storage in solar power plants. While lead-acid batteries have been a popular choice for energy storage in solar power plants due to their low cost and reliability, several other battery technologies are being developed specifically for use in solar power systems. These newer technologies offer advantages over lead-acid batteries in terms of efficiency, capacity, and lifespan [10]).
With the aim of optimizing the battery storage system by describing the battery degradation model based on the state of health (SOH) and estimating the remaining useful lifetime (RUL) of the battery, an approach method with high accuracy is needed. Batteries consist of electrochemical cells that cause dynamics of parameter changes that are affected by their use. In other words, battery degradation is nonlinear. Therefore, it is possible to estimate accurate results using a machine-learning approach [6,7,8,9,11] Coulomb Counting [9], Fuzzy Logic [12] , Artificial Neural Network [13]. In this research, the methods used were long short-term memory and support vector regression. Therefore, this study was conducted to determine the battery capacity and RUL with the result that the use of batteries in SMART DOME 4.0 can be operated in optimal conditions and support the performance of the existing system. Battery RUL (remaining useful life) estimation and optimization are critical for the successful commercialization of renewable energy systems through full integration into the power grid [14]. RUL estimation is the process of predicting how much longer a battery will be able to operate before it needs to be replaced. This information is important for system operators, as it allows them to plan for battery replacement and maintenance, which can help minimize downtime and maximize the lifespan of the battery [15]. Optimization, on the other hand, involves using data and algorithms to manage the charging and discharging of batteries in a way that maximizes their performance and lifespan. This can help reduce operating costs and improve the overall efficiency of the energy storage system [16]. By accurately estimating battery RUL and optimizing battery performance, renewable energy systems can be integrated more fully into the power grid, improving grid resilience and enabling greater use of renewable energy sources. This can help reduce our reliance on fossil fuels and decrease carbon emissions, leading to a more sustainable energy future [17].
The research on battery characteristics estimation has been carried out previously to determine battery capacity by estimating State Of Charge (SOC) [6,7,8,9], RUL and degradation model and SOH prediction . Many previous estimates have been made on battery applications in electric [6,7,8,9], for applications in Solar Power Plants that use lead acid batteries, there are still not many published. The challenges related to battery lifetime and optimization are not limited to lead-acid batteries only but also apply to other battery technologies including lithium-ion batteries (LIBs) that are commonly used in renewable energy systems [18] . While LIBs have many advantages over lead-acid batteries, such as higher energy density and better efficiency, they do have a relatively short life compared to the lifetime of the power generation technology. This means that the batteries may need to be replaced before the power generation technology, which can be costly and may reduce the overall efficiency of the energy system.
Therefore, the techniques for battery RUL estimation and optimization that we propose in this manuscript are relevant to all types of batteries used in renewable energy systems, including lead-acid and lithium-ion batteries. By accurately estimating the remaining useful life of batteries and optimizing their performance, we can maximize the value of the energy storage system and minimize costs. While our focus in this manuscript is on the use of lead-acid batteries due to the low-cost agricultural needs of the project, the techniques we propose can be applied to any type of battery used in renewable energy systems, making them a valuable tool for the industry as a whole. The condition of a battery can be seen from two things, namely SOC and SOH. While the accurate estimation/prediction of the SOC in lead-acid battery for an advanced RES has been the focus of many earlier studies [6,7,8,9,10,11,12], the emphasis on lead-acid battery’s long-term degradation and an in-depth look at the use of machine learning and its potential insights into the reliability/durability or long-term health aspects of the battery system (SOH and RUL) have not been a subject of in-depth investigations in many studies. This manuscript is our attempt to start looking into these important aspects in more systematic manners, especially for the lead-acid battery as an energy storage system with potential importance for an advanced RES.
The prediction of battery condition is categorized into four, namely direct measurement, bookkeeping estimation, adaptive systems, and hybrid methods mentioned by Danko et al., (2019) [19].Adaptive system is an estimate using artificial intelligence (AI) or machine learning. The methods that can be used are neural networks, support vector machines (SVM), fuzzy neural networks and Kalman filters. SVM is a machine learning model with an algorithm that separates data based on the best hyperplane. SVM is used for classification, while for estimation in the form of regression, support vector regression is used which is part of SVM [13].
2. Materials and Methods
2.1. Dataset
This study uses two types of datasets. The first dataset is the NASA Prognostic Center of Excellence dataset for batteries B0006 and B0005 measured in 168 cycles at a discharge temperature of 240 with a total data of 50,285 [20]. In this dataset, the variables used in the discharge condition are voltage measured (Volts), current measured (Amps), temperature measured (0C), current charge (Amps), voltage charged (Volts), time (sec) and capacity (Ahr). The second dataset used is lead acid battery data applied to one of Solar Power Plant owned by The State Electricity Company. This data is used because it has almost the same characteristics as SMART DOME, namely the OPzV lead acid battery type.
2.2. Models
All tested models in this study were developed with machine learning tools, support vector regression (SVR), and long short-term memory (LSTM), which receive the time series variables and output of State of Health (SOH) and remaining useful lifetime (RUL) at the next time step. The State of Health (SOH) refers to the current condition of a battery, expressed as a percentage of its original capacity. SOH is used as a measure of how much the battery has degraded over time due to usage or other factors. Meanwhile, Remaining Useful Lifetime (RUL) refers to the amount of time or usage left before a battery reaches the end of its useful life. RUL estimation is important for predicting maintenance needs and optimizing battery usage.
The model development begins with data preprocessing, involving the identification of missing values. In this study, the used dataset does not contain any missing values, thus allowing for further analysis and model formation. Once the data preprocessing is completed, Exploratory Data Analysis (EDA) is conducted to gain a more detailed understanding of the data characteristics. EDA aims to discover patterns, trends, and relationships within the dataset, providing initial insights into the dataset's distribution and the nature of each variable. EDA is carried out using descriptive statistics.
The LSTM method is built using a sequential model, the ReLu activation function, the ADAM optimizer with a loss means absolute error function, while the SVR model is built using the RBF kernel with three parameters namely gamma, epsilon, and C which then calculates the accuracy value to assess the accuracy of the results of the model built. LSTM stands for Long Short-Term Memory and is a type of recurrent neural network (RNN) that can process sequential data, such as time series data. LSTM can selectively remember or forget information from previous time steps, making it useful for predicting time-dependent outcomes like SOH and RUL. Then SVR stands for Support Vector Regression and is a type of supervised learning algorithm used for regression problems. SVR works by finding the best-fitting hyperplane in a high-dimensional space, using a kernel function to map the input data into this space.
The steps carried out in this research are as follows:
- (1)
- The time series data from batteries is collected and divided into two datasets: B0006 for training and B0005 for testing.
- (2)
- The data undergoes preprocessing steps, which may include data cleaning, normalization, and feature engineering.
- (3)
- LSTM Model Building:
- The LSTM architecture is created as a sequential model with 3 dense to process the time series data.
- Rectified Linear Unit (ReLU) is used as the activation function for the LSTM neurons.
- The ADAM optimizer is employed to update the model's parameters during training (beta_1=0.9, beta_2=0.999, epsilon=1e-08).
- The MAE loss function is used to quantify the difference between predicted and actual values.
Adam combines the Momentum and RMSprop algorithms to optimize the training process and search for the model's optimal weight and bias values.
- (4)
- SVR Model Building:
- The SVR model is built using the Radial Basis Function (RBF) kernel.
- The model's hyperparameters (gamma= scale, epsilon=0.1, and C= 1.0) are set to appropriate values.
The Radial Basis Function (RBF) kernel is the most commonly used kernel in Support Vector Regression (SVR). This kernel generates a mapping to an infinite-dimensional space using a Gaussian function. To control the shape of the RBF kernel in this research, the parameter gamma is also used, with a scale value calculated as 1 divided by the number of features, thus influencing the kernel scale. Optimization in this context involves minimizing prediction errors on the training data by optimizing the parameters of the constructed model. Subsequently, after the model is built, predictions are made and the model's performance is evaluated.
- (5)
- Training Stage:
- The LSTM model is trained using dataset B0006. The model learns to predict SOH and RUL for the next time step.
- The SVR model is trained using dataset B0006. It learns to estimate SOH and RUL values based on the given features.
- (6)
- Testing Stage:
- The trained LSTM model is used to predict SOH and RUL values for dataset B0005.
- The trained SVR model is used to estimate SOH and RUL values for dataset B0005.
- (7)
- The errors between the predicted values and the actual values for SOH and RUL are calculated using suitable evaluation metrics, such as RMSE.
- (8)
- A graph is generated to show the comparison between the estimated SOH values obtained from both models and the actual SOH values in dataset B0005.
- (9)
- The model with the best accuracy based on the evaluation metric is selected for RUL prediction.
- (10)
- The chosen model is used to estimate RUL values for dataset B0005.
- (11)
- The estimated RUL values are compared with the values in the Solar Power Plant of The State Electricity Company (PLTS PLN) dataset.
In summary, these techniques and methods are used to build and evaluate machine learning models for predicting SOH and RUL based on time series data from batteries. LSTM and SVR are two commonly used algorithms for this purpose, and hyperparameters like the kernel function and learning rate can significantly affect model performance. Evaluating model accuracy using metrics like RMSE is crucial for selecting the best model for RUL prediction.
The estimation is done by using dataset B0006 as training data and B0005 as test data. The estimation results obtained are then calculated for errors. The algorithm model that has been built at the training stage is then used for dataset testing, then the results are depicted in a graph to show a comparison of the estimated SOH value obtained with the calculated SOH value. The method with the best accuracy will then be selected to estimate the RUL value of the battery. The results of the RUL will be compared with the values in the Solar Power Plant of The State Electricity Company (PLTS PLN) dataset to illustrate the comparison of the degradation models owned.
3. Results and Discussion
Correlation between numerical variables is conducted to determine the relationship among variables. Visualization of the correlation between variables is carried out using a heatmap or correlation plot. A heatmap is a visualization that depicts a matrix using colors to represent values. The use of a color scale indicates the values of the matrix, using a spectrum from cooler colors (blue) to warmer colors (red). Based on Figure 1, the correlation results of variables using a heatmap show that the spectrum of red colors indicates higher correlation values, while blue indicates lower correlation. It can be concluded that variables such as capacity, voltage measured, current measured, temperature measured, and time have a high correlation, indicated by the dark red color with a positive value of 1.
The color intensity in heatmap cells reflects the correlation value between variables; the stronger the correlation, whether positive or negative, the brighter the color. As the correlation value approaches 1, the color will be closer to bright red or a shade of positive correlation. Conversely, as the correlation value approaches -1, the color will be closer to bright blue, and it will become darker when closer to 0.
A strong positive correlation indicates that the variables move together or in the same direction. This means that if the value of one variable increases, the other variables are also likely to increase. On the other hand, negative correlation indicates that the variables have an inverse relationship, meaning that if the value of one variable increases, the other variable is likely to decrease. A correlation value close to 0 indicates that the two variables do not have a strong linear relationship, meaning that changes in one variable do not consistently affect changes in another variable.
The SVR method built with the RBF kernel shows poor SOH estimation results. This is indicated by the low accuracy value of 0.127. The accuracy value shows the ratio of the correct prediction results to the overall data. With the results obtained, the correct prediction results from the SVR model are very small. Thus, this indicates that the algorithm performance of the built model is poor. Therefore, the use of the prediction results of this model has a very large risk of error while the algorithm model with the LSTM method that was built showed better estimation results. The calculation results show the RMSE value obtained is 0.0688. A prediction model is said to be the best if the RMSE value is 0. This means that the smaller the RMSE value, the closer the predicted and observed values are. In the prediction model in this study 0.0688 is close to 0. Figure 1 shows the estimation results of LSTM SOH. It can also be seen from the graph form obtained with almost the same curve showing the data pattern the model studied correctly. The capacity decline, which is mostly connected to the battery's SOH, is the most obvious sign of battery deterioration. From Figure 2, we can see that the actual SOH value is higher than the predicted SOH for each cycle. This shows that the current model cannot accurately predict the Remaining Useful Lifetime (RUL) and that the battery may degrade faster than expected. This could be due to a variety of factors, such as variability in the manufacturing process, differences in usage patterns or environmental conditions, or the inherent complexity of battery aging.
The capacity decline, which is mostly connected to the battery's SOH, is the most obvious sign of battery deterioration. From Figure 2, we can see that the actual SOH value is higher than the predicted SOH for each cycle. This shows that the Remaining Useful Lifetime (RUL) cannot be accurately predicted by the current model and that the battery may degrade faster than expected. This could be due to a variety of factors, such as variability in the manufacturing process, differences in usage patterns or environmental conditions, or the inherent complexity of battery aging.
To accurately predict RUL, it is important to consider additional factors that may impact battery degradation and incorporate them into the model. This could involve collecting more data on the battery's usage history, environmental conditions, and other relevant factors, and using advanced modeling techniques to better capture the complex interactions between these variables. Ultimately, accurate prediction of RUL is critical for optimizing battery performance and minimizing downtime, particularly in applications where batteries play a critical role, such as electric vehicles or grid-scale energy storage systems. Therefore, continued research and development in this area is essential for advancing the state-of-the-art in battery management and improving the reliability and performance of battery systems. With a smaller error value, the LSTM model algorithm was chosen to estimate the battery RUL. The estimation is carried out with the same stages and models, namely sequential, using the initial 50 cycles of data as training data. In the training phase, the model is trained using 200 epochs. This model training is carried out using a regress fit code (x_train, y_train, epochs=200, batch_size = 25). In this study, one epoch was achieved when 25 batches of training data samples were processed. Fitting results show good model performance. This is indicated by the reduction in the loss value in each epoch.
The prediction results show that the RMSE value is 0.031 which indicates the error value is close to 0. This means that the predicted results are close to the actual observed data. The RUL graph can be seen in Figure 3.
In the initial analysis, the Support Vector Regression (SVR) method with the RBF kernel showed poor results with a low accuracy value of 0.0127 and RMSE 5,377. This indicates that the SVR model's algorithm performance is not suitable for accurate State of Health (SOH) estimation. On the other hand, the Long Short-Term Memory (LSTM) method demonstrated better estimation results with an RMSE value of 0.0688, which is relatively close to 0.
To gain more insights into the relationship between features and the target variable (SOH), it's essential to conduct a thorough analysis of feature correlations and their impact on the model. By conducting a comprehensive analysis of feature statistics and correlations, we can gain valuable insights into the behaviour of the battery and identify critical factors affecting SOH. This, in turn, will help refine the LSTM model andmake more accurate predictions for the remaining useful lifetime (RUL) for the battery.
The use of the LSTM model algorithm for estimating battery RUL with a smaller error value is a promising development. LSTM models are a type of neural network that is well-suited for sequential data analysis and has been shown to be effective for time series forecasting. The training of the LSTM model using 200 epochs and a batch size of 25 is a standard approach for deep learning models. The reduction in the loss value in each epoch indicates that the model is learning and improving its performance over time.
The prediction results with an RMSE value of 0.031 indicate that the model's predictions are very close to the actual observed data. This is a good indication that the model RUL model shown in Figure 3 shows accurately capturing the complex relationships between the input variables and the battery RUL. However, it is important to note that even small errors can have a significant impact on the performance of the battery, so ongoing monitoring and optimization of the model will be important for maximizing battery lifespan and performance.
The description of the battery capacity is then compared with the use of batteries in Solar Power Plants in Indonesia. This comparison data illustrates the condition of lead acid battery capacity in use as energy storage for power systems as well as SMART Solar Dome 4.0 [4].
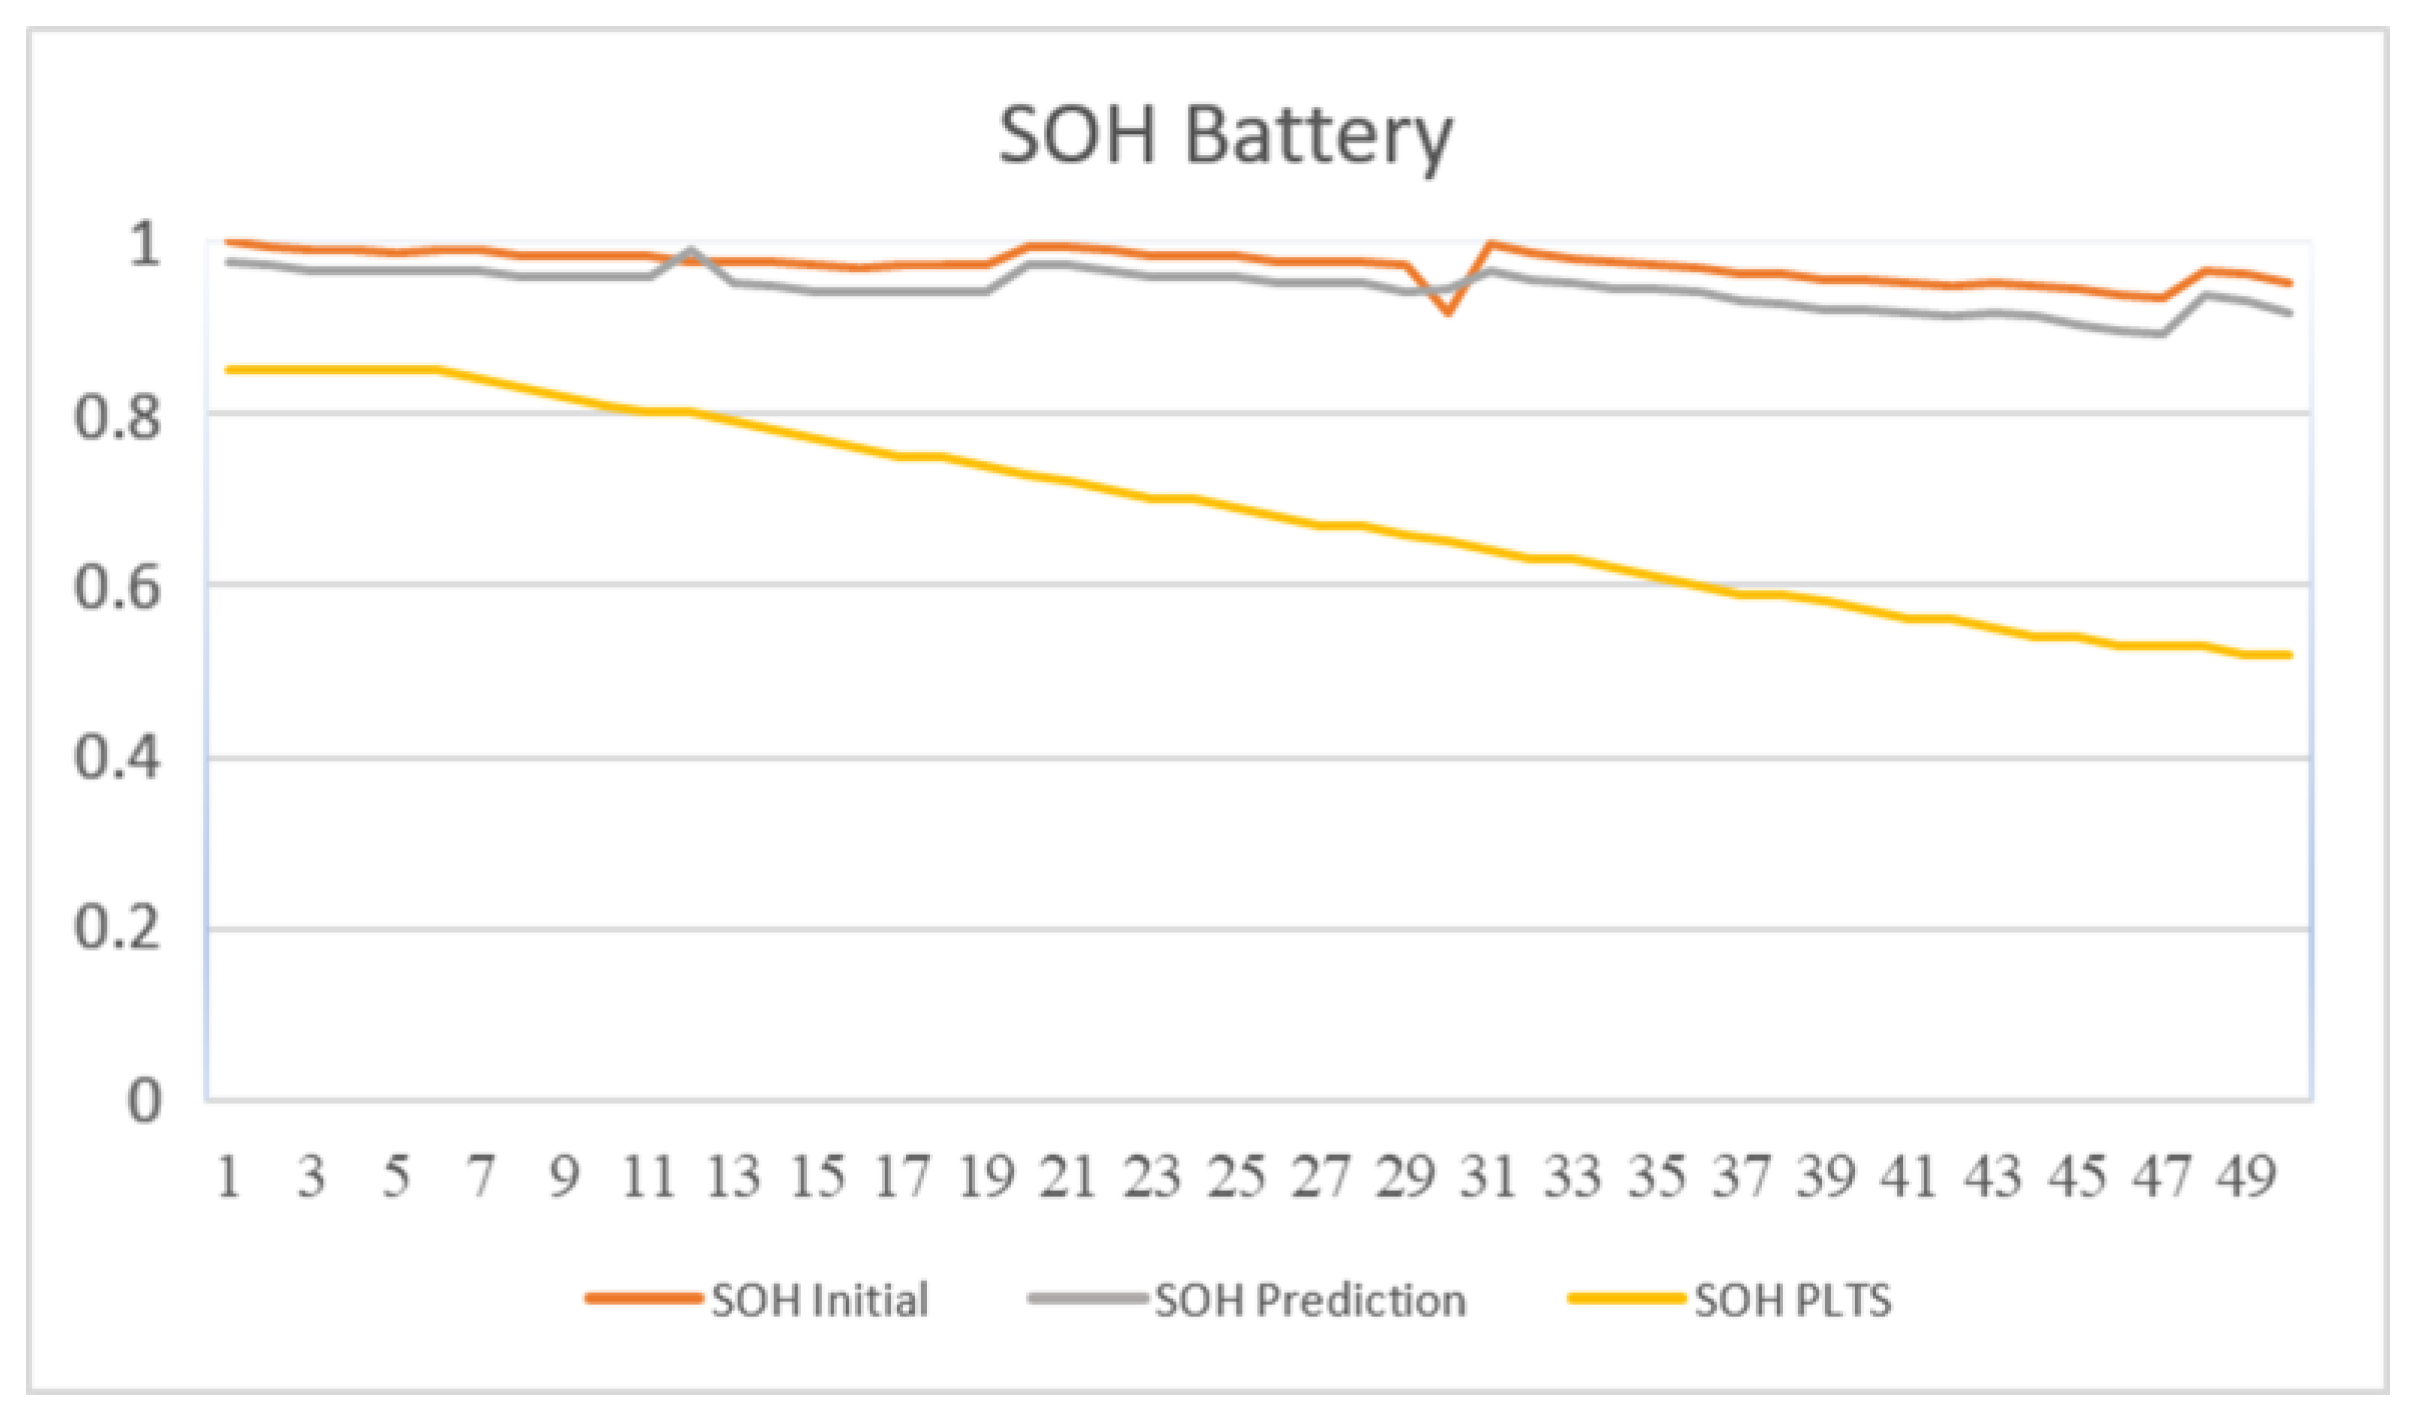
While the description of the battery capacity in the previous section focused on a specific study and experimental setup, it is useful to consider how these findings relate to the use of batteries in other applications, such as solar power plants in Indonesia. For instance, the difference rates of SOH or battery health decline as shown in Figure 4 could be an important insight that we could learn from this specific system. There is clearly a change of battery health decline rate at about 50 cycles – it was declining at much higher pace from thereon. Whether this may be associated with the system parameters of the battery arrays or as part of the larger energy systems, or with more fundamental parameters of the individual batteries, remain an important insight worth for further pursuing more in future studies which could benefit from our data analytics in this article.
Initial SOH and predicted SOH have relatively higher values compared to the Solar Power Plant SOH shown in Figure 4. This shows that the initial SOH and predicted SOH values from the previous section may not be directly comparable to the SOH values observed in solar power plant batteries in Indonesia or other locations. There are several reasons why this may be the case.
- (1)
- The battery chemistries used in solar power plant applications may differ from those used in the experimental setup described in the previous section. For example, some solar power plants may use lithium-ion batteries, which have different aging characteristics and performance requirements compared to lead-acid batteries.
- (2)
- The operating conditions in solar power plant applications may be different from those in the experimental setup. Solar power plant batteries may be subject to different temperature and humidity conditions, may have different charge and discharge profiles, and may experience different levels of usage and cycling. All of these factors can impact the aging and performance of the batteries and may result in different SOH values.
- (3)
- Finally, it is possible that the differences in SOH values between the experimental setup and solar power plant applications may reflect differences in the quality or maintenance of the batteries. Solar power plant batteries may be subject to different maintenance schedules, inspection procedures, and replacement criteria compared to experimental batteries, which could impact their SOH values.
The results of the estimation of the SOH value of the dataset and Solar Power Plants showed a significant difference. With differences in characteristics at the time of measurement, especially temperature differences, the NASA dataset was measured under constant ambient temperature conditions of 240C different from the Solar Power Plant data conditions measured in temperature differences. The graph above also shows the characteristics of the battery type. The type of lithium-ion has advantages over lead acid. Thus, the RUL of the battery also lasts longer.
In general, lead-acid batteries are a common choice for energy storage in solar power systems, including both off-grid and grid-connected applications. These batteries are relatively inexpensive, widely available, and can provide high discharge currents when needed. However, they also have some limitations, including a relatively short lifespan compared to other battery chemistries and the need for regular maintenance to prevent degradation and ensure reliable operation. This manuscript aims to provide important insights from big data analytics approaches that may be useful for the future studies to enhance long-term reliability and lifetime of the lead-acid battery systems – be it from the systemic point of views (energy storage systems) or from the fundamental electrochemistry aspects of the individual battery elements.
In the context of the SMART Solar Dome 4.0 project [4], it is likely that similar considerations apply. The specific battery capacity requirements and usage patterns will depend on the details of the project, such as the size of the solar array, the expected energy demand, and the local climate and weather conditions. However, some general principles for battery sizing and selection can be applied, such as ensuring that the battery capacity is sufficient to meet the energy demand and taking into account factors such as temperature and depth of discharge.
Monitoring the State of Health (SOH) value of a battery can provide highly valuable information in understanding the physical degradation occurring within the battery [21,22]. Decreased capacity is usually an indicator of physical degradation [23,24,25], as the active materials within the battery cell undergo structural changes and are unable to efficiently store energy as they did when the battery was new.
Meanwhile, SOH reflects the battery's health condition relative to its original capacity. A lower SOH value indicates significant physical degradation within the battery cell. Monitoring the SOH value provides an insight into how charge-discharge cycles affect battery health. Repeated usage and exposure to extreme temperatures during charge cycles can accelerate degradation.
During physical degradation, the battery tends to generate more heat when in use. Monitoring the battery temperature during usage and charge-discharge cycles, detecting unusual temperature changes or excessive temperature rise [26,27,28], which indicates potential physical degradation issues, can be identified more promptly. This is also evident from the graph in Figure 4, where the SOH of the solar PV system experiences a significant decline due to measurements taken in an environment with fluctuating temperatures influenced by changing weather conditions and repeated battery usage, leading to temperature elevation.
Hence, envisaging a scenario where battery temperature remains stable would greatly enhance the effectiveness of battery utilization and extend its lifespan.
4. Conclusion
The use of the LSTM model algorithm for estimating battery RUL with a small error value is a promising development that has the potential to significantly improve battery performance and reduce maintenance costs. Continued research and development in this area will be important for advancing the state-of-the-art in battery management and improving the reliability and performance of battery systems. While the specifics of battery capacity requirements and usage patterns may vary depending on the application, the findings from the previous section on battery ageing and RUL estimation are likely to be relevant for a wide range of energy storage systems, including those based on lead-acid batteries. The lead acid battery in the Solar Power Plant of The State Electricity Company shows a faster capacity degradation model compared to the type of NASA measurement data. However, the results shown do not fully describe the conditions for using lead acid batteries in a Solar Power Plant due to the limited dataset owned by the Solar Power Plant, namely the limited quality and quantity of data. Therefore, the use of actual battery measurement data in SMART DOME will better describe battery degradation. The initial SOH and predicted SOH values from the previous section may provide useful insights into battery ageing and RUL estimation for lead-acid batteries in certain applications; however, they should be interpreted with caution and may not be directly comparable to SOH values observed in solar power plant batteries or other real-world applications. It is important to consider the specific operating conditions and battery chemistries involved when interpreting SOH values and making decisions about battery maintenance, replacement, or optimization.
Funding
Funding information is not available.
Author contribution
Conceptualization, R.F, and A.S.B.; methodology, R.F, and A.S.B.; software, R.F. ; validation, R.F. ; formal analysis, R.F.; investigation, R.F. and A.S.B; resources, R.F.,E.D., A.S.B, and D.S.; data curation, E.D, and D.S .; writing—original draft preparation, R.F and A.S.B.; writing—review and editing, R.F., F.S.M. and A.S.B. ; visualization, R.F.; supervision, A.S.B; project administration, A.S.B, M.A., C.H.; funding acquisition, A.S.B., M.A., B.P., and E.D. All authors have read and agreed to the published version of the manuscript.
Data Availability Statement
Data sharing is not applicable to the article.
Acknowledgement
This work is supported by Bina Nusantara University (Industrial Engineering Department, BINUS Graduate Program – Master of Industrial Engineering). A.S.B and D.S. gratefully acknowledge the support and infrastructure provided by the Oregon Institute of Technology (OIT) via the Provost Student-Faculty Innovation Grant No. 1435036/PVT433 titled “Localized, Self-Sufficient Power Production” and the Oregon Renewable Energy Center (OREC)’s support and resources provided through the Grant OREC/3BOE titled “Enabling Next-Generation Lithium-Ion Battery Technology with Ultra-High Energy Density and Extreme Kinetics (Charging Rate) for Electric Transportation/Aviation” at OregonTech. A.S.B. also gratefully acknowledge the funding from Oregon Renewable Energy Center (OREC) under OREC2024/060/AIBO grant.
References
- Central Body of Statistics, Government of Indonesia (Badan Pusat Statistik), Report titled “Persentase Tenaga Kerja Informal Sektor Pertanian,” 2021. https://www.bps.go.id/indicator/6/1171/1/persentase-tenaga-kerja-informal-sektor-pertanian.html (accessed Jan. 26, 2022).
- Samad, M.Y., 2006. Pengaruh penanganan pasca panen terhadap mutu komoditas hortikultura. Jurnal Sains dan Teknologi Indonesia, 8(1), p.131290. [CrossRef]
- Dwipayana, I.P.G.I., Kumara, I.N.S. and Setiawan, I.N., 2021. Status of Battery in Indonesia to Support Application of Solar PV with Energy Storage. Journal of Electrical, Electronics and Informatics, 5(1), pp.29-40.
- Budiman, A.S., Gunawan, F., Djuana, E., Pardamean, B., Romeli, S., Putri, D.N., Aji, D.P., Rahardjo, K., Wibowo, M.I., Daffa, N. and Owen, R., 2022, April. Smart dome 4.0: Low-cost, independent, automated energy system for agricultural purposes enabled by machine learning. In Journal of Physics: Conference Series (Vol. 2224, No. 1, p. 012118). IOP Publishing. [CrossRef]
- Hlal, M.I., Ramachandaramurthy, V.K., Sarhan, A., Pouryekta, A. and Subramaniam, U., 2019. Optimum battery depth of discharge for off-grid solar PV/battery system. Journal of Energy Storage, 26, p.100999. [CrossRef]
- Chen, D.Z. and Jia, L.J., 2014. Estimation of lead-acid battery SOC Based on Kalman filtering algorithm. Applied Mechanics and Materials, 651, pp.1064-1067. [CrossRef]
- Křivík, P., 2018. Methods of SoC determination of lead acid battery. Journal of Energy Storage, 15, pp.191-195. [CrossRef]
- Wang, Y., Huang, F., Pan, B., Li, Y. and Liu, B., 2021. Augmented system model-based online collaborative determination of lead–acid battery states for energy management of vehicles. Measurement and Control, 54(1-2), pp.88-101. [CrossRef]
- Zine, B., Marouani, K., Becherif, M. and Yahmedi, S., 2018. Estimation of battery SOC for hybrid electric vehicle using coulomb counting method. International Journal of Emerging Electric Power Systems, 19(2), p.20170181. [CrossRef]
- May, G.J., Davidson, A. and Monahov, B., 2018. Lead batteries for utility energy storage: A review. Journal of energy storage, 15, pp.145-157. [CrossRef]
- Zhang, J. and Xia, C., 2011. State-of-charge estimation of valve regulated lead acid battery based on multi-state Unscented Kalman Filter. International Journal of Electrical Power & Energy Systems, 33(3), pp.472-476. [CrossRef]
- Malkhandi, S., 2006. Fuzzy logic-based learning system and estimation of state-of-charge of lead-acid battery. Engineering Applications of Artificial Intelligence, 19(5), pp.479-485. [CrossRef]
- Utama, P.H.K., Husniyyah, H.H., Haq, I.N., Pradipta, J. and Leksono, E., 2021, August. State of Charge (SoC) Estimation of Battery Energy Storage System (BESS) Using Artificial Neural Network (ANN) Based on IoT-Enabled Embedded System. In 2021 International Conference on Instrumentation, Control, and Automation (ICA) (pp. 77-82). IEEE. [CrossRef]
- Ansari, S., Ayob, A., Lipu, M.H., Hussain, A. and Saad, M.H.M., 2022. Remaining useful life prediction for lithium-ion battery storage system: A comprehensive review of methods, key factors, issues and future outlook. Energy Reports, 8, pp.12153-12185. [CrossRef]
- Chen, L., An, J., Wang, H., Zhang, M. and Pan, H., 2020. Remaining useful life prediction for lithium-ion battery by combining an improved particle filter with sliding-window gray model. Energy Reports, 6, pp.2086-2093. [CrossRef]
- Maia, L.K., Drünert, L., La Mantia, F. and Zondervan, E., 2019. Expanding the lifetime of Li-ion batteries through optimization of charging profiles. Journal of cleaner production, 225, pp.928-938. [CrossRef]
- Atawi, I.E., Al-Shetwi, A.Q., Magableh, A.M. and Albalawi, O.H., 2022. Recent advances in hybrid energy storage system integrated renewable power generation: Configuration, control, applications, and future directions. Batteries, 9(1), p.29. [CrossRef]
- Cho, J., Jeong, S. and Kim, Y., 2015. Commercial and research battery technologies for electrical energy storage applications. Progress in Energy and Combustion Science, 48, pp.84-101. [CrossRef]
- Danko, M., Adamec, J., Taraba, M. and Drgona, P., 2019. Overview of batteries State of Charge estimation methods. Transportation Research Procedia, 40, pp.186-192.
- Saxena, A., Bole, B., Daigle, M. and Goebel, K., 2012. Prognostics for Batteries. Aging Experiments and Modeling. In NASA Battery Workshop 2012.
- Widjaja, R.G., Asrol, M., Agustono, I., Djuana, E., Harito, C., Elwirehardja, G.N., Pardamean, B., Gunawan, F.E., Pasang, T., Speaks, D., Hossain, E. and Budiman, A.S., 2023. State of charge estimation of lead acid battery using neural network for advanced renewable energy systems. Emerg. Sci. J., 7(3), pp.691-703. [CrossRef]
- Budiman, A.S., Speaks, D., Hossain, E., Tippabhotla, S.K., Sahay, R., Baji, A. and Pasang, T., 2023. Battery anode design: From 1D nanostructure to 3D nanoarchitecture–Enabling next-generation energy storage technology. Microelectronic Engineering, 270, p.111927. [CrossRef]
- Harito, C., Wijaya, J., Fajarna, R., Tippabhotla, S.K., Thomas, O., Gunawan, F.E. and Budiman, A.S., 2023, April. Mechanical behaviours and modelling of nanostructure anode in Lithium-Ion battery (LIB)–enabling low-cost 3D nanostructures in future LIB for sustainable energy storage. In AIP Conference Proceedings (Vol. 2594, No. 1). AIP Publishing. [CrossRef]
- Budiman, A.S., Putri, D.N.N., Candra, H., Djuana, E., Sari, T.K., Aji, D.P., Putri, L.R., Sitepu, E., Speaks, D. and Pasang, T., 2024. Crack Catcher AI–Enabling smart fracture mechanics approaches for damage control of thin silicon cells or wafers. Solar Energy Materials and Solar Cells, 273, p.112927. [CrossRef]
- Pasang, T., Budiman, A.S., Wang, J.C., Jiang, C.P., Boyer, R., Williams, J. and Misiolek, W.Z., 2023. Additive manufacturing of titanium alloys–Enabling re-manufacturing of aerospace and biomedical components. Microelectronic Engineering, 270, p.111935. [CrossRef]
- Tippabhotla, S.K., Diesta, N.G., Zhang, X., Sridhara, S., Stan, C.V., Tamura, N., Tay, A.A. and Budiman, A.S., 2019. Thermomechanical residual stress evaluation in multi-crystalline silicon solar cells of photovoltaic modules with different encapsulation polymers using synchrotron X-ray microdiffraction. Solar Energy Materials and Solar Cells, 193, pp.387-402. [CrossRef]
- Handara, V.A., Illya, G., Tippabhotla, S.K., Shivakumar, R. and Budiman, A.S., 2016. Center for Solar Photovoltaics (CPV) at Surya University: novel and innovative solar photovoltaics system designs for tropical and near-ocean regions (an overview and research directions). Procedia Engineering, 139, pp.22-31. [CrossRef]
- Shivakumar, R., Tippabhotla, S.K., Handara, V.A., Illya, G., Tay, A.A., Novoa, F., Dauskardt, R.H. and Budiman, A.S., 2016. Fracture mechanics and testing of interface adhesion strength in multilayered structures–application in advanced solar PV materials and technology. Procedia Engineering, 139, pp.47-55. [CrossRef]
Figure 1.
Correlation Variables.
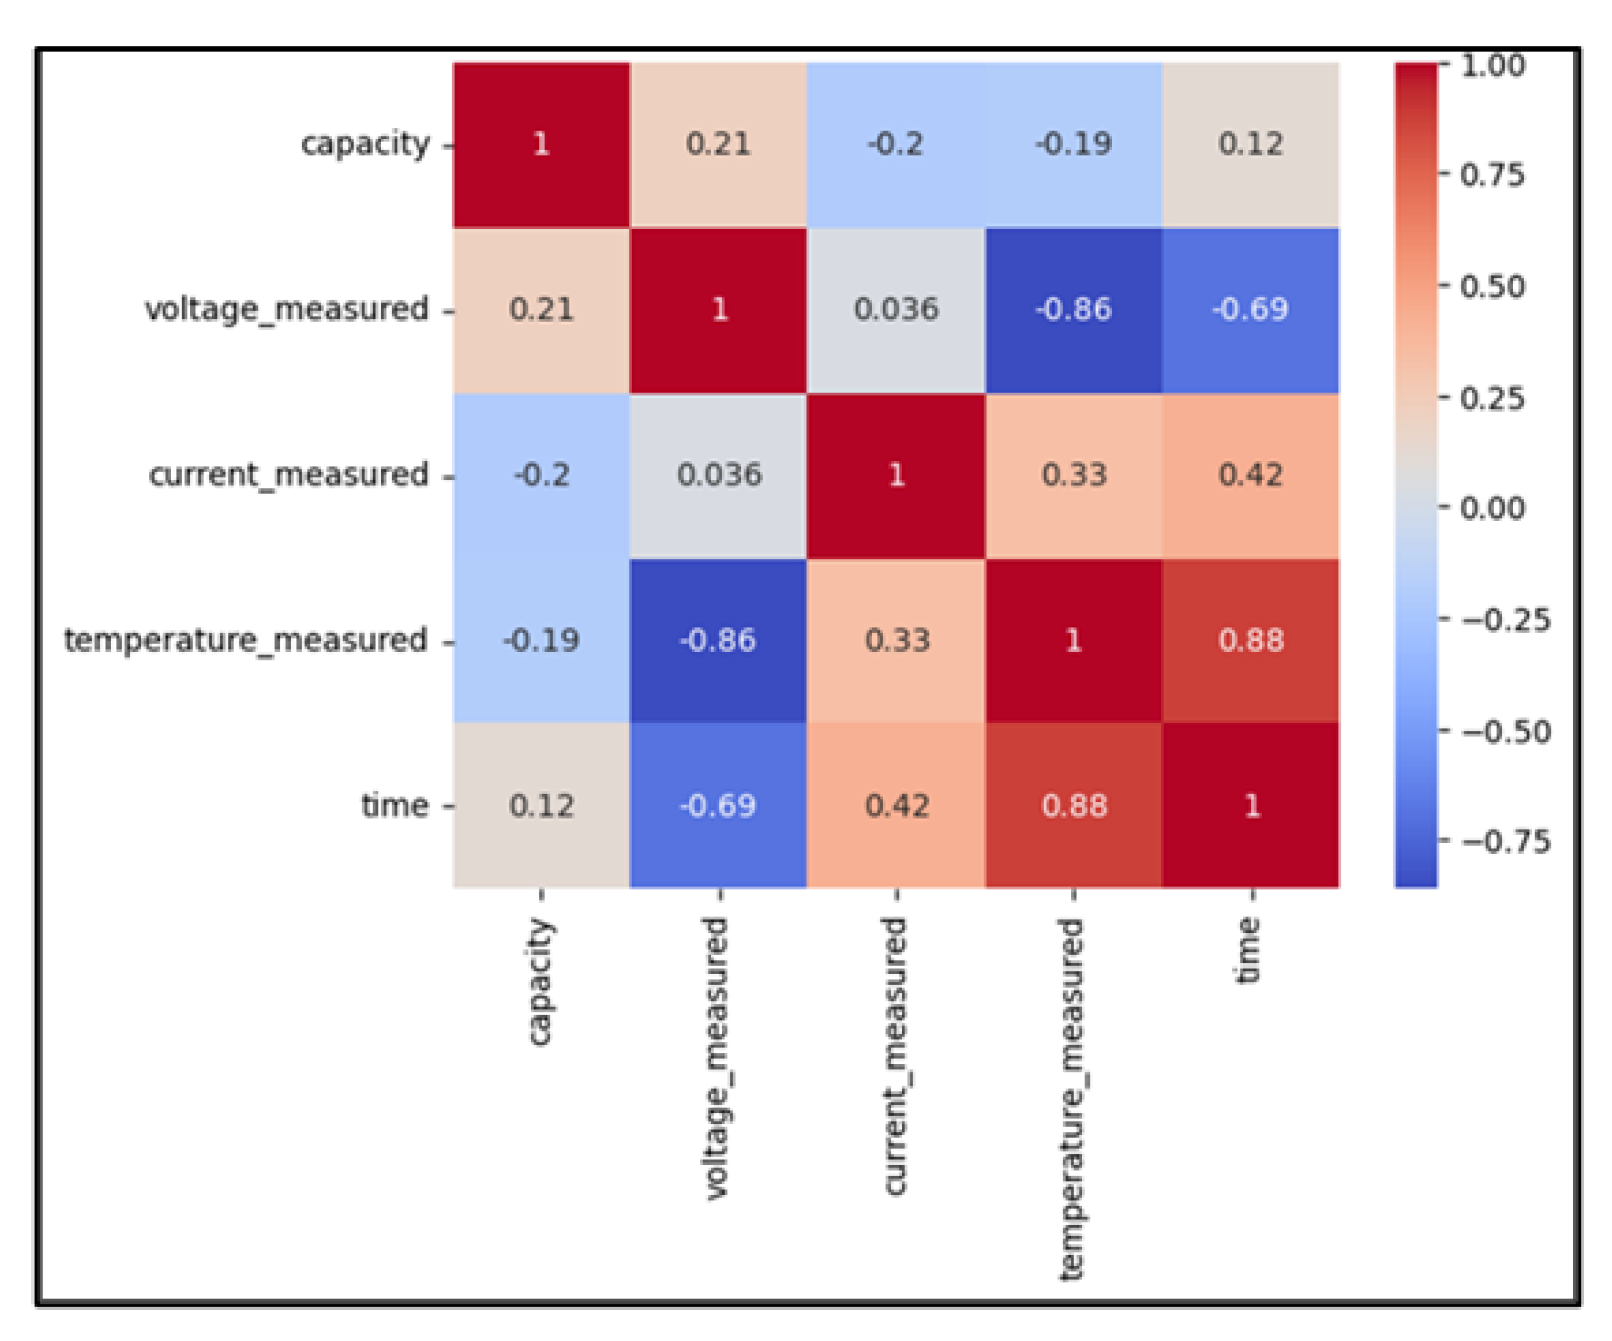
Figure 2.
Battery B0005 SOH.
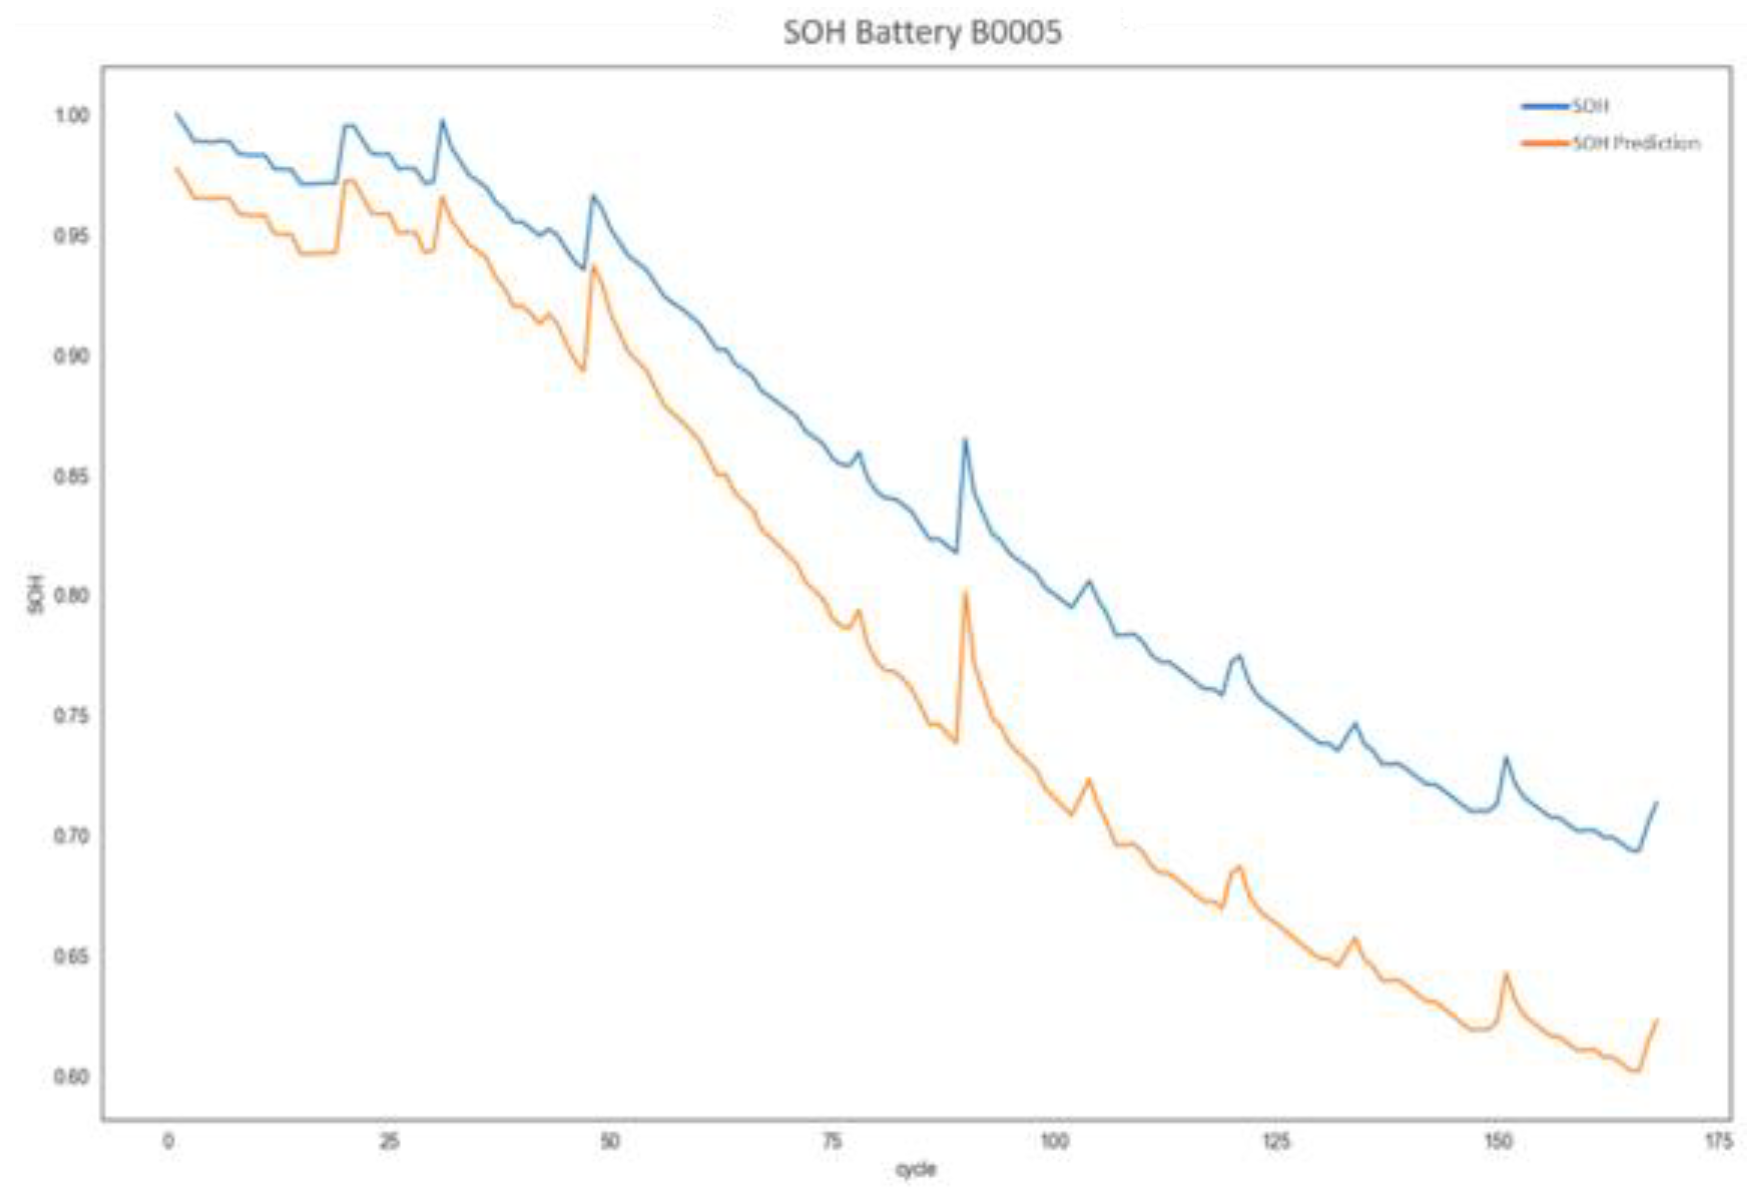
Figure 3.
Battery B0005 RUL Graph.
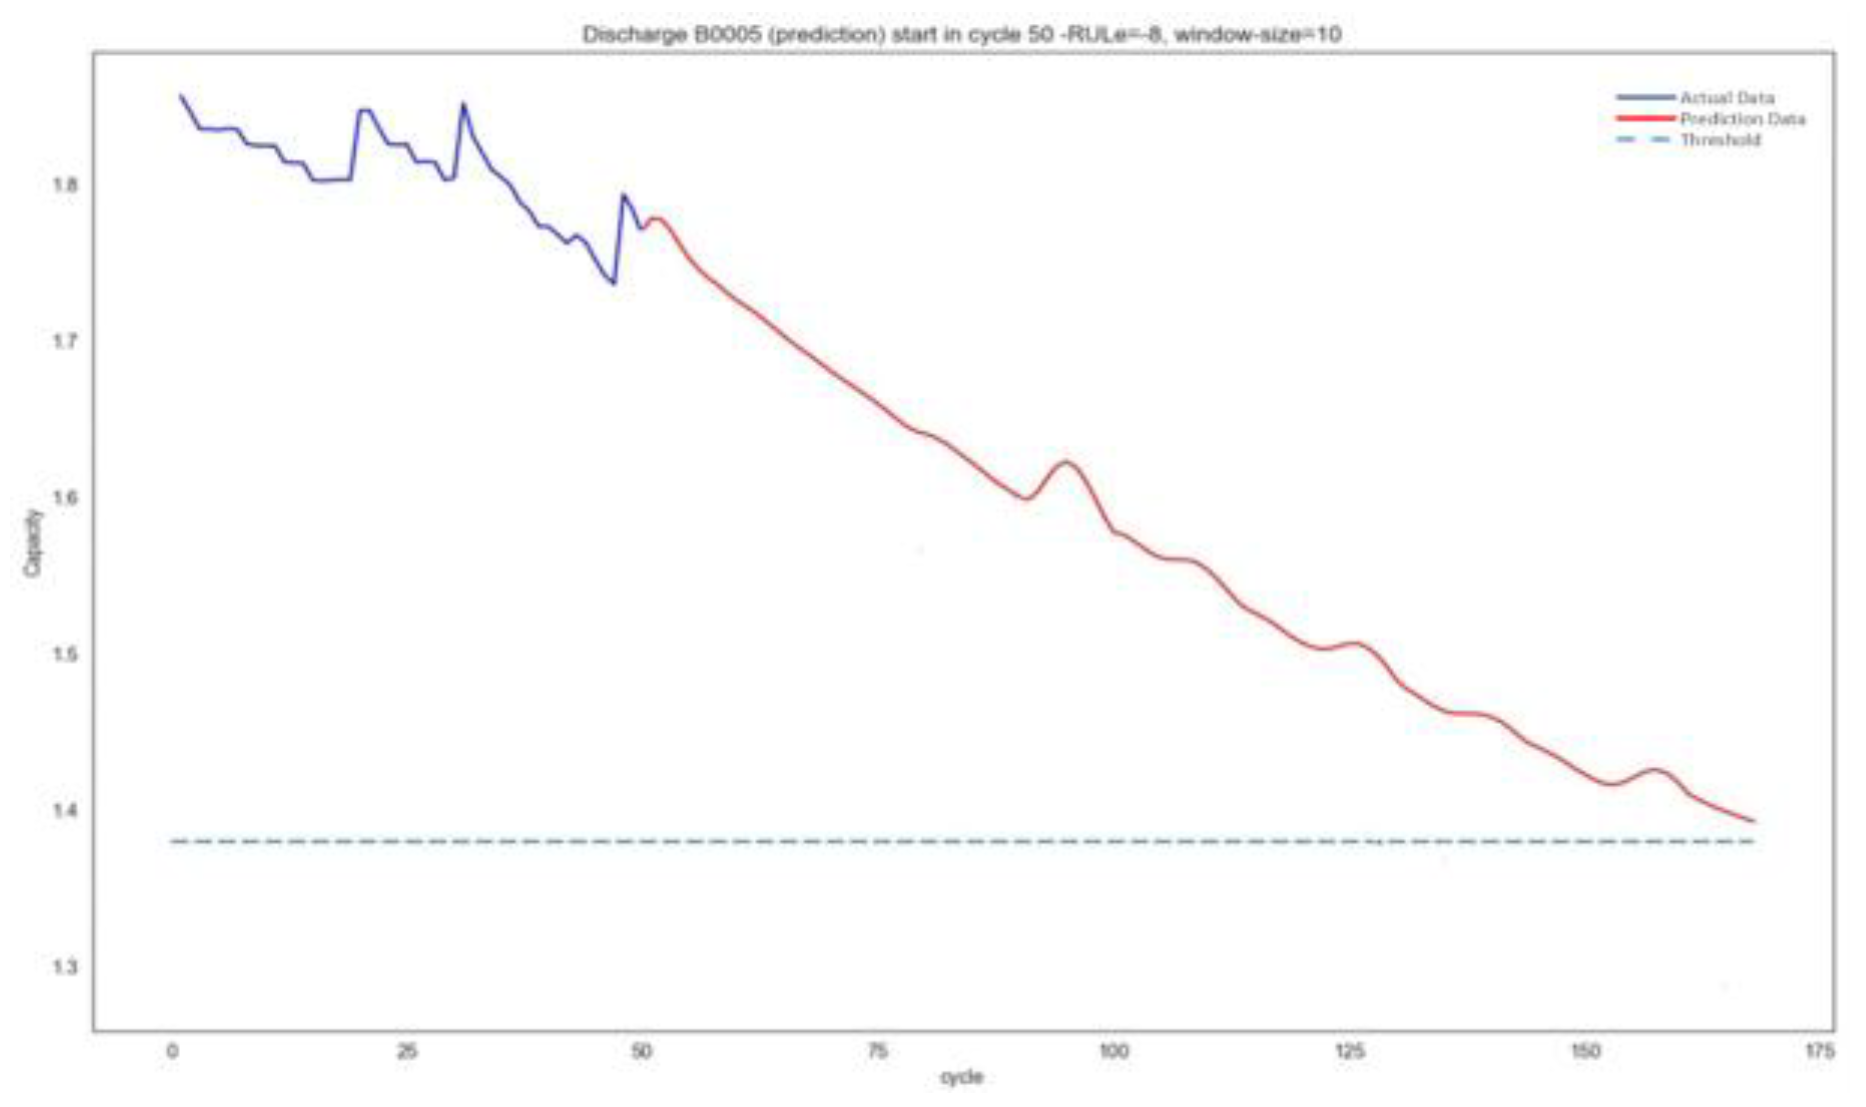
Figure 4.
Comparison between Initial, Predicted, and Observed SOH.
Disclaimer/Publisher’s Note: The statements, opinions and data contained in all publications are solely those of the individual author(s) and contributor(s) and not of MDPI and/or the editor(s). MDPI and/or the editor(s) disclaim responsibility for any injury to people or property resulting from any ideas, methods, instructions or products referred to in the content. |
© 2025 by the authors. Licensee MDPI, Basel, Switzerland. This article is an open access article distributed under the terms and conditions of the Creative Commons Attribution (CC BY) license (http://creativecommons.org/licenses/by/4.0/).
Copyright: This open access article is published under a Creative Commons CC BY 4.0 license, which permit the free download, distribution, and reuse, provided that the author and preprint are cited in any reuse.


