
Submitted:
31 October 2025
Posted:
03 November 2025
You are already at the latest version
Abstract
Battery health monitoring is essential for ensuring the safety, longevity, and efficiency of energy storage systems, particularly in critical applications where reliability is important. Traditional methods for assessing battery degradation, such as Electrochemical Impedance Spectroscopy (EIS), are effective but impractical for large-scale deployment due to their time-intensive nature. This study introduces a novel model-based approach for estimating a critical indicator of battery aging, the internal resistance. Using the NASA battery dataset, specifically focusing on batteries number 5 and 7 with NCA chemistry, a comprehensive framework that integrates advanced predictive models, i.e. the Random Forest Regressor (RF), the XGBoost Regressor (XGBR), the Gated Recurrent Unit (GRU), and the Long Short-Term Memory (LSTM) networks, was developed. The models were evaluated using common regression metrics, while hyperparameter tuning was performed accomplished to optimize performance. The results demonstrated that recurrent neural networks, particularly GRU and LSTM, effectively capture the temporal dependencies inherent in battery aging, offering more accurate State of Health (SOH) predictions. This approach significantly improves computational efficiency and prediction accuracy, paving the way for practical applications in Battery Management Systems (BMS).
Keywords:
LIB
; SOH
; data-driven method
; energy systems safety
1. Introduction
Lithium-ion (Li-ion) batteries are indispensable for modern electric vehicles (EVs), portable electronics, and grid storage due to their high energy density and long cycle life [1]. However, the inevitable capacity fade and performance decline over time, demands for accurate assessment of the battery’s SOH to ensure safety and reliability [1,2]. SOH is commonly defined as the ratio of the current maximum capacity of a cell to its initial nominal capacity. The SOH reflects the current health state of a battery and directly indicates its capability to further deliver energy, capacity and power [3]. As a consequence, precise SOH estimation is important for several tasks, like estimating the Remaining Useful Life (RUL) and predicting the End of Life (EOL) of a cell (typically defined as the moment when its SOH falls below 80% of nominal capacity), optimizing charging strategies, and avoiding unexpected failures [2].
Accurate SOH estimation supports predictive maintenance, reduces operational disruptions, and may help to prevent safety hazards such as thermal runaway, which are usually addressed using model-based approaches relying on physical and electrochemical behavior of the battery [4,5,6,7,8]. More detailed electrochemical models (e.g. pseudo-2D models) capture more complicated internal behavior of the cell but when scaled to large battery packs they are computationally demanding, which consequently limits their real-time applicability [2,9].
In contrast, data-driven approaches use statistical approaches or machine learning techniques to learn patterns from historical datasets [10,11,12,13,14]. These methods have demonstrated strong predictive power and can be used in a wide variety of applications such as electric vehicles and stationary storage systems. The success of data-driven methods critically depends on the quality of the training data, avoiding overfitting or poor generalization if training data are noisy or insufficient [2,9]. These data are often obtained from experimental measurements [10,11,12,13,14,15], physics-based simulations [14,16], or open-source datasets, such as the NASA Ames, CALCE (University of Maryland), Stanford/MIT Fast-Charging, and Hawaii Natural Energy Institute (HNEI) datasets [17,18,19]. In these categories of data, open datasets provide transparency and reproducibility, with some disadvantages related to missing values, noise, and outliers, as mentioned, that can impair model accuracy if not properly preprocessed. For predicting SOH, it is necessary to extract health factors (HFs) usually related to voltage, current, and temperature signals. Some of the most used HFs in the literature include discharge duration, incremental capacity (dQ/dV), differential voltage (DV), and temperature-related features [20,21,22].
Due to the nature of SOH evolution, classical regression methods which treat samples independently, fail to capture temporal dependencies. Recurrent neural networks (RNNs) represent a type of neural network widely adopted for SOH prediction [23,24]. Among them, the LSTM and the GRU architectures, which mitigate vanishing gradient issues, are well suited for long-term dependencies [21,25,26,27]. Also, extensions of these RNNs such as LSTNet, which integrates convolutional and recurrent layers, have shown improvements in estimation of complex multivariate time series [28]. However, these deep models demand large amounts of training data and significant computational resources, posing challenges for deployment in resource-constrained BMS hardware [29].
As discussed, both model-based and data-driven approaches for SOH estimators have trade-offs in accuracy and complexity [2]. Among the various health indicators, the cell’s internal resistance has emerged as a simple, yet powerful metric of aging [30].
As a battery ages, its capacity gradually decreases while its internal resistance increases. This trend is primarily driven by two dominant aging mechanisms: Solid Electrolyte Interphase (SEI) growth and lithium plating [31,32]. During cycling, lithium ions are irreversibly consumed to thicken the SEI layer on the anode surface. As this layer grows, it creates a more resistive path for lithium-ion transport, leading to a steady rise in internal resistance. Similarly, lithium plating, which consists in the deposition of metallic lithium on the anode surface, further impedes ions mobility and contributes to resistance increment [31,32,33]. These mechanisms not only reduce the cell’s available lithium inventory and thus its capacity, but also make internal resistance a reliable indirect indicator of battery aging and capacity loss. In fact, as previously reported [31,34], internal resistance is an effective indicator for battery aging because it reflects the cumulative effects of several degradation mechanisms. In other words, multiple aging processes (SEI layer thickening, active material loss, electrolyte breakdown, etc.) all tend to increase the cell’s resistance to current flow [31]. Practically, as SOH declines, the cell’s internal resistance grows and leads to greater voltage drop and heat generation during operation. Thus, monitoring internal resistance can represent a readily interpretable measure of battery health state.
As a matter of fact, EIS-based health indicators are sensitive to cell aging and dependent on test conditions and models, and thus they cannot be easily used for on-line SOH estimations [9]. An alternative is to calculate or infer resistance through cell modeling. In particular, electrochemical–thermal models (ETMs) of the cell can be used to calculate Ohmic resistance from observed behavior. This approach essentially distills a complex impedance spectrum into one effective resistance parameter. Tulabi and Bubbico [34] demonstrated that a single-particle model with heat balance is highly effective for capturing the cell’s thermal behavior, which enables accurate calibration of resistance. By iteratively adjusting the model’s ohmic resistance to minimize the temperature error against experimental data, one obtains a time-series of resistance values over cycles. Importantly, model-based resistance estimation can be done on-line with only standard voltage, current, and temperature sensors. Unlike full EIS, no AC impedance measurement is needed. The cell’s internal resistance is revealed indirectly via its influence on heat generation (Joule heating), which thermal models can capture.
The effectiveness of resistance as a health metric stems from its close ties to the underlying degradation chemistry. As emphasized by Seok et al. [31], lithium plating and SEI layer growth directly increase the cell’s internal resistance. Because resistance increases monotonically with cumulative damage, it tends to correlate strongly with loss of capacity and available power [1].
This study addressed the limitations of conventional methods by proposing a novel hybrid approach for the predictive estimation of SOH of Li-ion cells. First, by incorporation of an electrochemical-thermal model, resistance-based features have been calculated to be used in the SOH prediction, by minimizing the RMSE of simulation and NASA dataset in each cycle. Then, extracted resistance time-series, are fed to two Ensemble tree-based models and two recurrent neural network-based models, in order to find the best and the most accurate model. The proposed approach considered both cycling aging and calendar aging, represented by the cycle number and the day of the experiments, respectively, which are crucial for accurate forecasting. The predictive models employed included traditional machine learning algorithms, i.e. the Random Forest Regressor (RF) and the XGBoost Regressor (XGBR), alongside deep learning architectures, the Gated Recurrent Units (GRU) and the Long Short-Term Memory (LSTM) networks. These models have been rigorously evaluated using Root Mean Square Error (RMSE) and Mean Absolute Error (MAE) values to determine their effectiveness in SOH estimation.
2. Methods
The State of Health (SOH) is one of the indicators adopted for estimating the End-of-Life of a battery [15,16,17,18], it reflects a battery’s aging level, and it is calculated by the following ratio (Equation 1):
where is the nominal capacity of the cell and is the maximum capacity of cell after c1 cycles.
2.1. Data Collection and Preprocessing
The dataset utilized in this study is the NASA battery degradation dataset developed by Saha et al. [35]. It consists of measurements on 18650 lithium-ion batteries with nickel-cobalt-aluminum (NCA) chemistry and a nominal capacity of 2 Ah, tested under controlled charging, discharging, and Electrochemical Impedance Spectroscopy (EIS) conditions. For training and evaluating the models under investigation, batteries No. 7 and 5 were selected for this study due to their complete set of data on discharge cycles and their clearly observable degradation trends over their operational lifespan. These batteries were cycled using a constant-current constant-voltage (CCCV) charging protocol, followed by constant-current discharging to a specified voltage cutoff, all under a stable ambient temperature of 297.5 K. The dataset offered detailed measures of voltage, current, and temperature, providing comprehensive information for battery health state modeling and analysis, as illustrated in Figure 1.
As capacity measures during discharge were available for batteries no. 7 and 5, SOH was calculated and set as a single output for the data-driven methods adopted in the present analysis.
Three key features were selected for the SOH prediction model, based on their relevance to battery degradation mechanisms:
- Cycle Number, accounting for actual operation of the cell (cycling aging),
- Date of Measurement, which represents the number of calendar days since the start of operation and accounts for time-based degradation (calendar aging), even when the battery is not in use,
- Internal Resistance, which reflects both cycling and structural degradation, as resistance typically increases with age, affecting performance and heat generation. Three types of resistances were considered: a) the electrolyte resistance (Re), representing the ionic resistance of the electrolyte and separator, b) the charge transfer resistance (Rct), which reflects the kinetic barrier to lithium-ion intercalation and deintercalation at the electrode–electrolyte interface, and c) a fitted resistance value. The latter parameter was derived from simulations, as discussed in detail in the following section, while the two former resistances were both obtained from the NASA dataset [35].
An iterative optimization process was introduced for resistance fitting. The procedure consisted in creating a base cell model in COMSOL Multiphysics environment, with the cell configurations corresponding to the NASA dataset [35], and the maximum capacity of the cell during discharge, calculated by Equation 2
where the is the maximum capacity of the cell after c1 discharge cycles, and is the current during discharge and t is the time in the discharge process, and t0 and t1, is the time when the battery completely charged, and completely discharged, respectively.
As can be expected, with different values of resistance, different trends can be calculated for the mean temperature of the outer layer of the cell. The optimization task with the root-mean-square error (RMSE), calculated by Equation 3, as an error function, was used to find the best fitted temperature trend on the trend available from NASA dataset:
where , are the actual and predicted values, respectively, and n is the number of observations. The model configuration yielding the lowest RMSE was chosen as the best fit for each cycle.
The base model was created by introducing some further adjustments in previous results [34], as follows.
The model inferred the cell's internal resistance from its thermal response during each discharge phase, captured through temperature-time profiles represented by Equations 4 – 6:
In these equations denotes the density of the system, is the specific heat capacity, and represents the thermal conductivity. The terms , , and correspond to the ohmic overpotential of the aged cell, the activation overpotential of the fresh cell, and the concentration overpotential of the fresh cell, respectively. For the aged cell, the effects of activation and concentration overpotentials were incorporated into the overall ohmic resistance to capture degradation-induced changes in internal resistance. The resistive components — , , and — represent, respectively, the degraded cell resistance (including ohmic, activation, and concentration contributions), the ohmic resistance of the fresh cell, and the change in internal resistance resulting from aging. In this study, fitted resistance refers to .
The fitting process was automated in Python v3.9 using MPH library connected to COMSOL Multiphysics for modeling of a single lithium-ion cell.
2.2. Correlation Analysis of the Selected Features
To verify the correlation between the selected health factor and SOH, Pearson correlation coefficients (PCC) were used to calculate the degree of correlation between the resistance and SOH. PCC is a statistical measure used to assess the linear correlation between two variables. By calculating PCC, the effectiveness of the selected parameter in battery SOH estimation can be determined [36]. The greater the absolute value of PCC, the stronger the correlation between the feature and the capacity. The PCC calculation formula is:
where and respectively represent the i-th sample value of variables x and y, and and respectively represent the sample means of variables x and y.
2.3. Predictive Modeling
For this study, four models, two decision tree-based models, the RF and XGBR, and two Recurrent Neural Network-based models, the GRU and LSTM models, have been used for estimating the state-of-health of the cell.
Random Forest is a widely used ensemble learning algorithm that aggregates the outputs of multiple decision trees to produce a single, robust prediction. It operates by selecting random samples from the training dataset with replacements, called bootstrapping, so the data can appear in multiple samples. Each tree then is trained on a different sample, and the final prediction is obtained by averaging (by regression) across all trees. The second method, XGBoost, is a powerful gradient boosting algorithm that builds an ensemble of decision trees sequentially to improve prediction accuracy. It begins with a simple initial prediction and calculates the residual errors between the predicted and actual values. Each subsequent tree is trained to correct these residuals, progressively refining the model. By iteratively focusing on the remaining errors, XGBoost enhances performance with each added tree. It continuously minimizes a loss function to guide improvement and stops when certain criteria, such as reaching a maximum number of iterations or achieving minimal gain, are met, ensuring a balance between accuracy and complexity. These methods reduce variance and improve generalization, making them particularly suitable for noisy datasets such as battery measurements.
RNNs are designed to handle sequential data by maintaining a hidden state that captures temporal dependencies. However, traditional RNNs struggle with learning long-term patterns due to the vanishing gradient problem. To address this issue, advanced variants like the LSTM networks and the GRUs method were developed. LSTM networks manage long-term dependencies through a cell state regulated by three gates, input, forget, and output, that determine how information is stored, discarded, or passed on. GRUs offer a more streamlined approach by merging the input and forget gates into a single update gate and unifying the cell and hidden states, which reduces complexity and speeds up training.
To prevent overfitting and evaluate the model’s generalization performance, the dataset will be randomly split into training and testing sets, with 20% of the data reserved for testing. All computations have been performed using Python v3.9, utilizing the open-source libraries scikit-learn v1.7 and TensorFlow v2.16.
In addition to the above-mentioned RMSE (equation 3), the Mean Absolute Error (MAE) was also used for comparison of the models. Its formulation is presented in equation 8.
where, and are the actual and predicted values of the output parameter, respectively, and n is the number of observations.
2.4. Model Optimization and Evaluation
In machine learning approach, there are two sets of parameters: learnable, or model, parameters and hyperparameters, or tuneable parameters. Model parameters are set during the model training, while the hyperparameters have to be set manually before the training. Common techniques for hyperparameter optimization include Grid Search, Randomized Search, Bayesian Optimization, etc. Hyperparameter tuning is computationally intensive but crucial for achieving optimal model performance [24].
For hyperparameter tuning of the models studied, a Bayesian method, i.e. the Tree-structured Parzen Estimator (TPE) method was selected. TPE is a specialized variant of Bayesian Optimization that models the objective function using conditional probability densities for both good and bad configurations. Its use of non-parametric models makes it highly scalable and effective for high-dimensional hyperparameter spaces. The TPE improves hyperparameter optimization by modeling two probability distributions: one for good configurations and one for poor ones. Rather than modeling the objective function directly, TPE selects new hyperparameters by maximizing the ratio of these distributions, which aligns with maximizing Expected Improvement (EI). For instance, if the objective function is the model's validation loss (such as mean squared error), TPE evaluates hyperparameter configurations that are more likely to yield a loss lower than a threshold, which typically represents the best performance observed so far. This strategy effectively focuses the search on regions of the hyperparameter space that are more likely to improve performance [37].
One of the main concerns in data-driven modelling is overfitting, meaning that the model will perform well on the training data but poorly on unseen data. To avoid this and to select the model which generalizes better, after training the models with the data referred to battery no. 7, the behavior of the models on battery no. 5 data (i.e. data not used for model training) has been evaluated.
Finally, missing data is a common challenge in real-world datasets, often caused by sensors malfunctions, communication errors, or data logging failures [38]. These missing values can significantly degrade the performance of machine learning models by introducing bias, reducing statistical power, and affecting the model's ability to generalize. To address this issue, the model has been tested under conditions simulating real-world data imperfections by randomly introducing 2, 5, 10, 20, 30 and 50% missing values of unseen data for battery no. 5. This approach allowed evaluating the model’s robustness and its capability to handle incomplete inputs effectively.
3. Results
3.1. Fitted Resistance
Figure 2 illustrates the evolution of three resistance type parameters for Battery No. 7 from the NASA dataset over different cycles: the electrolyte resistance (Re), the charge-transfer resistance (Rct) obtained from EIS data available in NASA dataset, and the fitted ohmic resistance (Fitted Rohm) estimated through electrochemical–thermal simulations. As can be seen, the calculations exhibit some noises, primarily attributed to the fitting process, where RMSE was used as the evaluation metric. Since RMSE is sensitive to outliers and not fixed, some fluctuations are observed in the results. All three resistances exhibit an increasing trend as the number of cycles progresses, reflecting the progressive degradation of the cell. Rct (blue line) has the highest absolute values and shows the most pronounced growth with cycling, consistent with the slowing electrode kinetics caused by SEI thickening and loss of active sites. Re (light green) remains lower in magnitude and increases more gradually, indicating moderate contributions from electrolyte and ionic transport aging. The fitted resistance (dark green) follows a trajectory closely aligned with the EIS-derived parameters, lying between Re and Rct throughout cycling. This alignment demonstrates that the fitted resistance successfully captures the overall degradation dynamics without requiring detailed EIS measurements.
Overall, the results represented in Figure 2, confirm that all resistance components increase with age, and the strong agreement between the fitted resistance and the EIS-derived resistances supports the use of a simulation-based fitted resistance, which closely follow the degradation trends observed in the literature [33], as a reliable and cost-effective health indicator for SOH estimation.
Figure 3, presents the root mean square error (RMSE) of the temperature profiles for each cycle in simulation, relative to the corresponding temperature profiles in the NASA dataset: the values initially lie in a relatively narrow band around 0.42–0.46, indicating that the simulation-based fitted resistance closely matches the experimental data in the early stages of battery life. This stable trend suggests that during initial operation, the dominant degradation mechanisms such as SEI formation and minor electrolyte changes are well captured by the single resistance parameter, resulting in low residual error. The model remains a reliable predictor of the cell’s internal resistance and its relation to state of health.
As cycling progresses, the graph shows a clear rise in RMSE toward 0.50–0.57, representing a temporary loss of model accuracy. Physically, this spike corresponds to the onset of more complex degradation processes such as electrolyte depletion, and non-uniform current distribution, which cannot be fully represented by a single fitted resistance value. These effects increase the discrepancy between experimental values and model predictions. Interestingly, the RMSE trend later returns closer to the baseline (~0.45–0.47), suggesting that the battery enters a more stabilized degradation regime where resistance growth again follows a predictable path. Thus, the RMSE curve itself provides insight into different phases of aging: early predictable growth, mid-life complexity, and late-stage stabilization.
Table 1 compares the PCC of charge transfer resistance (Rct), electrolyte resistance (Re) from EIS, and the simulation-derived fitted resistance against battery SOH. All three show strong negative correlations, confirming that resistance increases as capacity declines. Notably, fitted resistance exhibits nearly the same correlation strength as the EIS-derived parameters, demonstrating that a single fitted resistance can effectively capture the same degradation trends as multiple impedance components. This result, which is in agreement with other results reported in the literature [30,39], further highlights the potential of fitted resistance as a simpler, cost-effective substitute for traditional EIS measurements in SOH estimation.
3.2. Models Performance
As can be seen in Figure 4, after replacing the separate EIS-derived features (Re, Rct, and their combination) with a single COMSOL-fitted ohmic resistance (Fitted Resistance), all four models retain, or even improve, their predictive accuracy, while greatly simplifying the input set. When using the Fitted Resistance, the LSTM model achieves the same optimal performance obtained with the EIS combination with a marginally lower MAE.
Most notably, the Random Forest model actually benefits from the switch to Fitted Resistance: its MAE falls to just 0.0017 (vs. 0.00199 for Rct and Re). XGBoost displays only a minor decrease in accuracy with Fitted Resistance —MAE of 0.0016 vs. 0.00147—yet it still outperforms all RNNs by an order of magnitude.
These results demonstrate that a single, fitted value of the ohmic resistance can effectively outperform the more complex, multi-parameter EIS analysis without loss of predictive accuracy, and, in particular, in the case of the Random Forest approach, this capability is actually improved. As a consequence, in the case of practical SOH-estimation workflows, using Fitted Resistance can reduce measurement and feature-engineering complex calculations, still yielding model performance comparable with EIS-based approach for calculating the resistance.
3.3. Generalization Ability of Models for SOH Calculations
To assess how well each model truly captures the underlying degradation dynamics, rather than merely memorizing the training cells, the models were evaluated on a completely new set of battery data. In this unseen-data test, the output and the standard regression metrics (MAE and RMSE) were computed to quantify their generalization ability outside the original training data.
When evaluated on entirely new cells, the GRU model exhibited the strongest generalization capability, achieving the lowest MAE and RMSE (respectively 0.0177 and 0.0243 in Table 2). This indicates that it captures the underlying degradation patterns more effectively than the other models, without overfitting the training data.
RF and XGBR deliver very similar performances (MAEs around 0.023–0.024) showing that they can generalize well but with slightly higher residual errors than GRU. The LSTM behaves worst on unseen data (MAE = 0.0319), suggesting that it may have over-specialized to the training set or struggled with limited new-cell variability. All metrics results are summarized in Table 2. While tree-based methods remain competitive, the GRU’s architecture offers superior generalization capability for SOH prediction on truly novel batteries, likely because its simpler gating mechanism is sufficient to model degradation trends without overfitting. The findings of this study align well with the model performance metrics reported in the literature [9] indicating that the proposed physics-constrained approach offers strong generalization capability for predicting SOH on previously unseen cells.
3.4. SOH Prediction with Missing Data
To evaluate the robustness of the GRU-based SOH predictor under sensors unavailability conditions, a series of random dropout experiments on an entirely unseen cell (Battery no. 5), were conducted, and the results are reported in Table 3. In evaluation phase, between 2 % and 50 % of the input sensor streams (in this scenario entire input row) were randomly dropped, and key regression metrics (MAE and RMSE) were recorded. Remarkably, up to a 10 % sensor loss, the model’s MAE exhibited an almost constant MAE, which only slightly increases at losses higher than 10%, and only at the extreme of 50 % dropout did performance meaningfully decline (MAE = 0.0245), indicating a slight degradation rather than a full failure.
This resilience arises from the GRU’s ability to capture temporal dependencies and exploit cross-sensor redundancies in the time-series data. The recurrent gates allow the network to infer missing information from historical context and remaining signals, effectively “filling in” gaps caused by sensor outages. As more data streams vanish, the model’s uncertainty naturally grows, but its sequential memory and learned correlations enable it to sustain accurate SOH estimates until the information becomes too sparse. Such robustness to partial sensor failure makes the GRU architecture particularly well suited for deployment in battery management systems, where intermittent sensor faults and communication losses are an operational reality.
4. Conclusions
This study investigated the use of internal resistance as a cost-effective and simple indicator for lithium-ion battery state-of-health (SOH) estimation. By comparing the electrolyte resistance (Re) and the charge transfer resistance (Rct) obtained from electrochemical impedance spectroscopy (EIS) measurements with a single fitted resistance derived from electrochemical–thermal simulations, it was shown that the fitted resistance can reliably capture the degradation behavior of the battery without requiring expensive or time-consuming impedance measurements. The strong negative correlations between capacity and all three resistance values confirm that internal resistance is a robust predictor of SOH. Importantly, fitted resistance exhibited nearly identical correlation strength to EIS-derived parameters, highlighting its potential as a practical substitute.
Across all the four model classes adopted for SOH prediction (LSTM, GRU, Random Forest, and XGBR), using Fitted Resistance simplified the feature set without sacrificing accuracy. Deep-learning RNNs (LSTM, GRU) retained their low-error performance, while tree-based methods further improved it. Crucially, when challenged with completely unseen cells, the GRU model achieved the highest generalization capability, closely followed by the Random Forest and XGBR models. LSTM underperformed slightly, suggesting its greater parameter count may over-specialize to training data. Finally, under simulated sensor-failure scenarios on a novel battery, the GRU maintained robust performance, holding low error with random sensor dropout even higher than 10 %, and degrading only beyond 30 % loss, underscoring its resilience in real-world BMS applications.
In conclusion, by unifying impedance inputs into a single, representative resistance indicator, SOH estimation workflows can be greatly streamlined: fewer measurements, and simpler preprocessing will be required, still achieving state-of-the-art accuracy and robustness.
Author Contributions
Conceptualization, M.T. and R.B.; Data curation, M.T.; Funding acquisition, R.B.; Investigation, M.T.; Methodology, M.T. and R.B.; Software, M.T.; Supervision, R.B.; Validation, M.T.; Writing—original draft, M.T.; Writing—review and editing, R.B. All of the authors have read and agreed to the published version of the manuscript.
Funding
The results of this work have been obtained with the financial support of the National Recovery and Resilience Plan (PNRR), Mission 4 Component 2 Investment 1.3, funded by the European Union - NextGenerationEU, Spoke 6 "Energy Storage" of the Extended Partnership (PE2) NEST - Network 4 Energy Sustainable Transition.
Data Availability Statement
Data used in this study will be available upon request.
Conflicts of Interest
The authors declare no conflicts of interest.
Abbreviations
The following abbreviations are used in this manuscript:
| EIS | Electrochemical Impedance Spectroscopy |
| RF | Random Forest Regressor |
| XGBR | XGBoost Regressor |
| GRU | Gated Recurrent Unit |
| LSTM | Long Short-Term Memory |
| SOH | State of Health |
| BMS | Battery Management Systems |
| LIB | Lithium ion battery |
| Li-ion | Lithium-ion |
| EV | Electric Vehicle |
| RUL | Remaining Useful Life |
| EOL | End of Life |
| HF | Health Factor |
| DV | Differential Voltage |
| RNN | Recurrent Neural Network |
| SEI | Solid Electrolyte Interphase |
| ETM | Electrochemical–Thermal Model |
| RMSE | Root Mean Square Error |
| MAE | Mean Absolute Error |
| NCA | Nickel-Cobalt-Aluminum |
| CCCV | Constant-Current Constant-Voltage |
| PCC | Pearson Correlation Coefficient |
| TPE | Tree-structured Parzen Estimator |
| EI | Expected Improvement |
References
- Rout S, Samal SK, Gelmecha DJ, Mishra S. Estimation of state of health for lithium-ion batteries using advanced data-driven techniques. Scientific Reports. 2025; 15(1):30438. [CrossRef]
- Zhang M, Yang D, Du J, Sun H, Li L, Wang L, Wang K. A review of SOH prediction of Li-ion batteries based on data-driven algorithms. Energies. 2023; 16(7):3167. [CrossRef]
- Abada, S., Petit, M., Lecocq, A., Marlair, G., Sauvant-Moynot, V. and Huet, F., Combined experimental and modeling approaches of the thermal runaway of fresh and aged lithium-ion batteries. Journal of Power Sources, 2018, 399, pp.264-273. [CrossRef]
- Abada, S., Marlair, G., Lecocq, A., Petit, M., Sauvant-Moynot, V. and Huet, F., Safety focused modeling of lithium-ion batteries: A review. Journal of Power Sources, 2016, 306, pp.178-192. [CrossRef]
- Guo, G., Long, B., Cheng, B., Zhou, S., Xu, P. and Cao, B., Three-dimensional thermal finite element modeling of lithium-ion battery in thermal abuse application. Journal of power sources, 2010, 195(8), pp.2393-2398. [CrossRef]
- Cianciullo, M., Vilardi, G., Mazzarotta, B. and Bubbico, R., Simulation of the thermal runaway onset in Li-ion cells—influence of cathode materials and operating conditions. Energies, 2022, 15(11), p.4169. [CrossRef]
- Zhang, L., Zhao, P., Xu, M. and Wang, X., Computational identification of the safety regime of Li-ion battery thermal runaway. Applied Energy, 2020, 261, p.114440. [CrossRef]
- Lee, K.J., Smith, K., Pesaran, A. and Kim, G.H., Three dimensional thermal-, electrical-, and electrochemical-coupled model for cylindrical wound large format lithium-ion batteries. Journal of Power Sources, 2013, 241, pp.20-32. [CrossRef]
- Tang, K., Luo, B., Chen, D., Wang, C., Chen, L., Li, F., Cao, Y. and Wang, C., The State of Health Estimation of Lithium-Ion Batteries: A Review of Health Indicators, Estimation Methods, Development Trends and Challenges. World Electric Vehicle Journal, 2025, 16(8), p.429. [CrossRef]
- Zhang, Y., Tang, Q., Zhang, Y., Wang, J., Stimming, U. and Lee, A.A., Identifying degradation patterns of lithium ion batteries from impedance spectroscopy using machine learning. Nature communications, 2020, 11(1), p.1706. [CrossRef]
- Severson, K.A., Attia, P.M., Jin, N., Perkins, N., Jiang, B., Yang, Z., Chen, M.H., Aykol, M., Herring, P.K., Fraggedakis, D. and Bazant, M.Z., Data-driven prediction of battery cycle life before capacity degradation. Nature Energy, 2019, 4(5), pp.383-391. [CrossRef]
- Song, Y., Liu, D., Liao, H. and Peng, Y., A hybrid statistical data-driven method for on-line joint state estimation of lithium-ion batteries. Applied Energy, 2020, 261, p.114408. [CrossRef]
- Chen, Z., Xiong, R., Lu, J. and Li, X., Temperature rise prediction of lithium-ion battery suffering external short circuit for all-climate electric vehicles application. Applied energy, 2018, 213, pp.375-383. [CrossRef]
- Ding, S., Dong, C., Zhao, T., Koh, L., Bai, X. and Luo, J., A meta-learning based multimodal neural network for multistep ahead battery thermal runaway forecasting. IEEE Transactions on Industrial Informatics, 2020, 17(7), pp.4503-4511. [CrossRef]
- Wen, J., Chen, X., Li, X. and Li, Y., SOH prediction of lithium battery based on IC curve feature and BP neural network. Energy, 2022, 261, p.125234. [CrossRef]
- Jia, Y., Li, J., Yuan, C., Gao, X., Yao, W., Lee, M. and Xu, J., Data-driven safety risk prediction of lithium-ion battery. Advanced Energy Materials, 2021, 11(18), p.2003868. [CrossRef]
- Meng, H., Yang, Q., Zio, E. and Xing, J., An integrated methodology for dynamic risk prediction of thermal runaway in lithium-ion batteries. Process Safety and Environmental Protection, 2023, 171, pp.385-395. [CrossRef]
- Lin, M., Wu, D., Meng, J., Wu, J. and Wu, H., A multi-feature-based multi-model fusion method for state of health estimation of lithium-ion batteries. Journal of Power Sources, 2022, 518, p.230774. [CrossRef]
- Wang, Z., Yang, F., Xu, Q., Wang, Y., Yan, H. and Xie, M., Capacity estimation of lithium-ion batteries based on data aggregation and feature fusion via graph neural network. Applied Energy, 2023, 336, p.120808. [CrossRef]
- Dou, Z., Zhang, C., Li, D., Ye, Z. and Wang, Y., Machine learning-based prediction of battery heat generation management in standard driving cycles to avoid thermal runaway and increasing safety. Process Safety and Environmental Protection, 2024, 188, pp.1385-1397. [CrossRef]
- Hong, J., Wang, Z., Qu, C., Zhou, Y., Shan, T., Zhang, J. and Hou, Y., Investigation on overcharge-caused thermal runaway of lithium-ion batteries in real-world electric vehicles. Applied Energy, 2022, 321, p.119229. [CrossRef]
- Li, T., Zhang, W., Huang, G., He, H., Xie, Y., Zhu, T. and Liu, G., Real-world data-driven charging strategies for incorporating health awareness in electric buses. Journal of Energy Storage, 2024, 92, p.112064. [CrossRef]
- Yao, X.Y., Chen, G., Pecht, M. and Chen, B., A novel graph-based framework for state of health prediction of lithium-ion battery. Journal of Energy Storage, 2023, 58, p.106437. [CrossRef]
- Ma, Y., Shan, C., Gao, J. and Chen, H., A novel method for state of health estimation of lithium-ion batteries based on improved LSTM and health indicators extraction. Energy, 2022, 251, p.123973. [CrossRef]
- Hong, J., Wang, Z., & Yao, Y. Fault prognosis of battery system based on accurate voltage abnormity prognosis using long short-term memory neural networks. Applied Energy, 2019, 251, p.113381. [CrossRef]
- Wei, Y., & Wu, D. Prediction of state of health and remaining useful life of lithium-ion battery using graph convolutional network with dual attention mechanisms. Reliability Engineering & System Safety, 2023, 230, p.108947. [CrossRef]
- Gong, Y., Zhang, X., Gao, D., Li, H., Yan, L., Peng, J., & Huang, Z. State-of-health estimation of lithium-ion batteries based on improved long short-term memory algorithm. Journal of Energy Storage, 2022, 53, p.105046. [CrossRef]
- Ping, F., Miao, X., Yu, H., & Xun, Z. An Improved LSTNet Approach for State-of-Health Estimation of Automotive Lithium-Ion Battery. Electronics, 2023, 12(12), 2647. [CrossRef]
- Wang, S., Zhou, R., Ren, Y., Jiao, M., Liu, H., & Lian, C. Advanced data-driven techniques in AI for predicting lithium-ion battery remaining useful life: a comprehensive review. Green Chemical Engineering, 2025, 6(2), pp.139-153. [CrossRef]
- Tan, X., Tan, Y., Zhan, D., Yu, Z., Fan, Y., Qiu, J., & Li, J. Real-time state-of-health estimation of lithium-ion batteries based on the equivalent internal resistance. Ieee Access, 2020, 8, pp.56811-56822. [CrossRef]
- Seok, J., Lee, W., Lee, H., Park, S., Chung, C., Hwang, S., & Yoon, W. S. Aging Mechanisms of Lithium-ion Batteries. Journal of Electrochemical Science and Technology, 2024, 15(1), pp.51-66.
- Edge, J.S., O’Kane, S., Prosser, R., Kirkaldy, N.D., Patel, A.N., Hales, A., Ghosh, A., Ai, W., Chen, J., Yang, J. and Li, S., Lithium ion battery degradation: what you need to know. Physical Chemistry Chemical Physics, 2021, 23(14), pp.8200-8221. [CrossRef]
- Santhanagopalan, S., Smith, K., Neubauer, J., Kim, G.H., Pesaran, A. and Keyser, M, Design and analysis of large lithium-ion battery systems (Vol. 5400, No. 63600). Artech House. Norwood, MA, USA, 2014.
- Tulabi, M. and Bubbico, R., Electrochemical–Thermal Modeling of Lithium-Ion Batteries: An Analysis of Thermal Runaway with Observation on Aging Effects. Batteries, 2025, 11(5), p.178. [CrossRef]
- NASA Dataset. Available online: https://phm-datasets.s3.amazonaws.com/NASA/5.+Battery+Data+Set.zip (accessed on 8 October 2024).
- Zhang, C., Luo, L., Yang, Z., Zhao, S., He, Y., Wang, X., & Wang, H. Battery SOH estimation method based on gradual decreasing current, double correlation analysis and GRU. Green Energy and Intelligent Transportation, 2023, 2 (5): p.100108. [CrossRef]
- Passos, D., & Mishra, P. A tutorial on automatic hyperparameter tuning of deep spectral modelling for regression and classification tasks. Chemometrics and Intelligent Laboratory Systems, 2022, 223, p.104520. [CrossRef]
- Tran, M. K., & Fowler, M. A review of lithium-ion battery fault diagnostic algorithms: Current progress and future challenges. Algorithms, 2020, 13(3), p.62. [CrossRef]
- Rodriguez-Cea, A.I., Morinigo-Sotelo, D. and Tinaut, F.V., A procedure for evaluating the SOH of Li-ion batteries from data during the constant voltage charge phase and the use of an ECM with internal resistance. Journal of Energy Storage, 2025, 108, p.115074. [CrossRef]
Figure 1.
Battery No. 7 measured data [35]: (a) Capacity vs no. of Cycle; (b) Temperature vs time during 1st, 80th and 160th discharges.
Figure 1.
Battery No. 7 measured data [35]: (a) Capacity vs no. of Cycle; (b) Temperature vs time during 1st, 80th and 160th discharges.
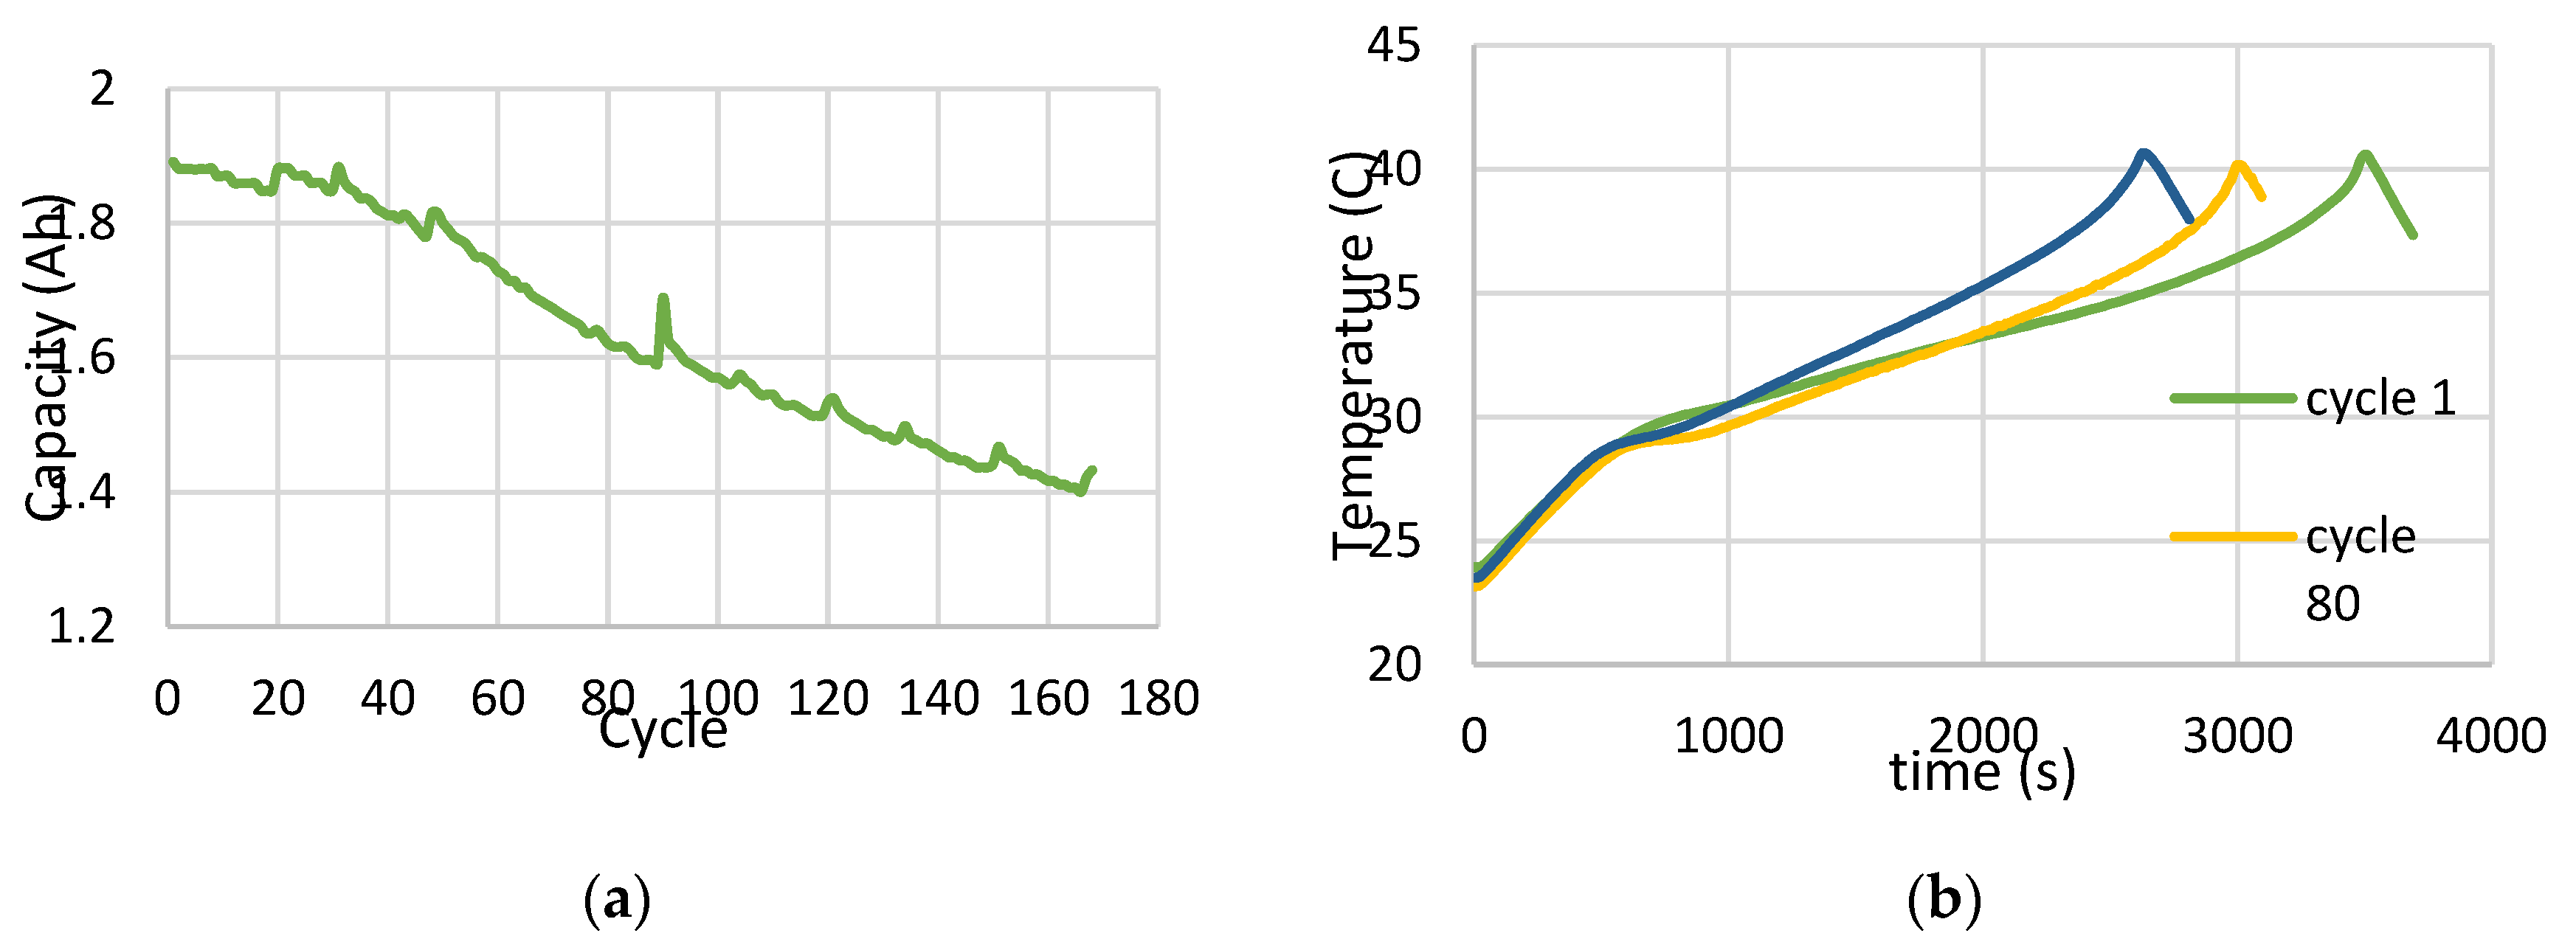
Figure 2.
Resistances trends relative to NASA cell no. 7.
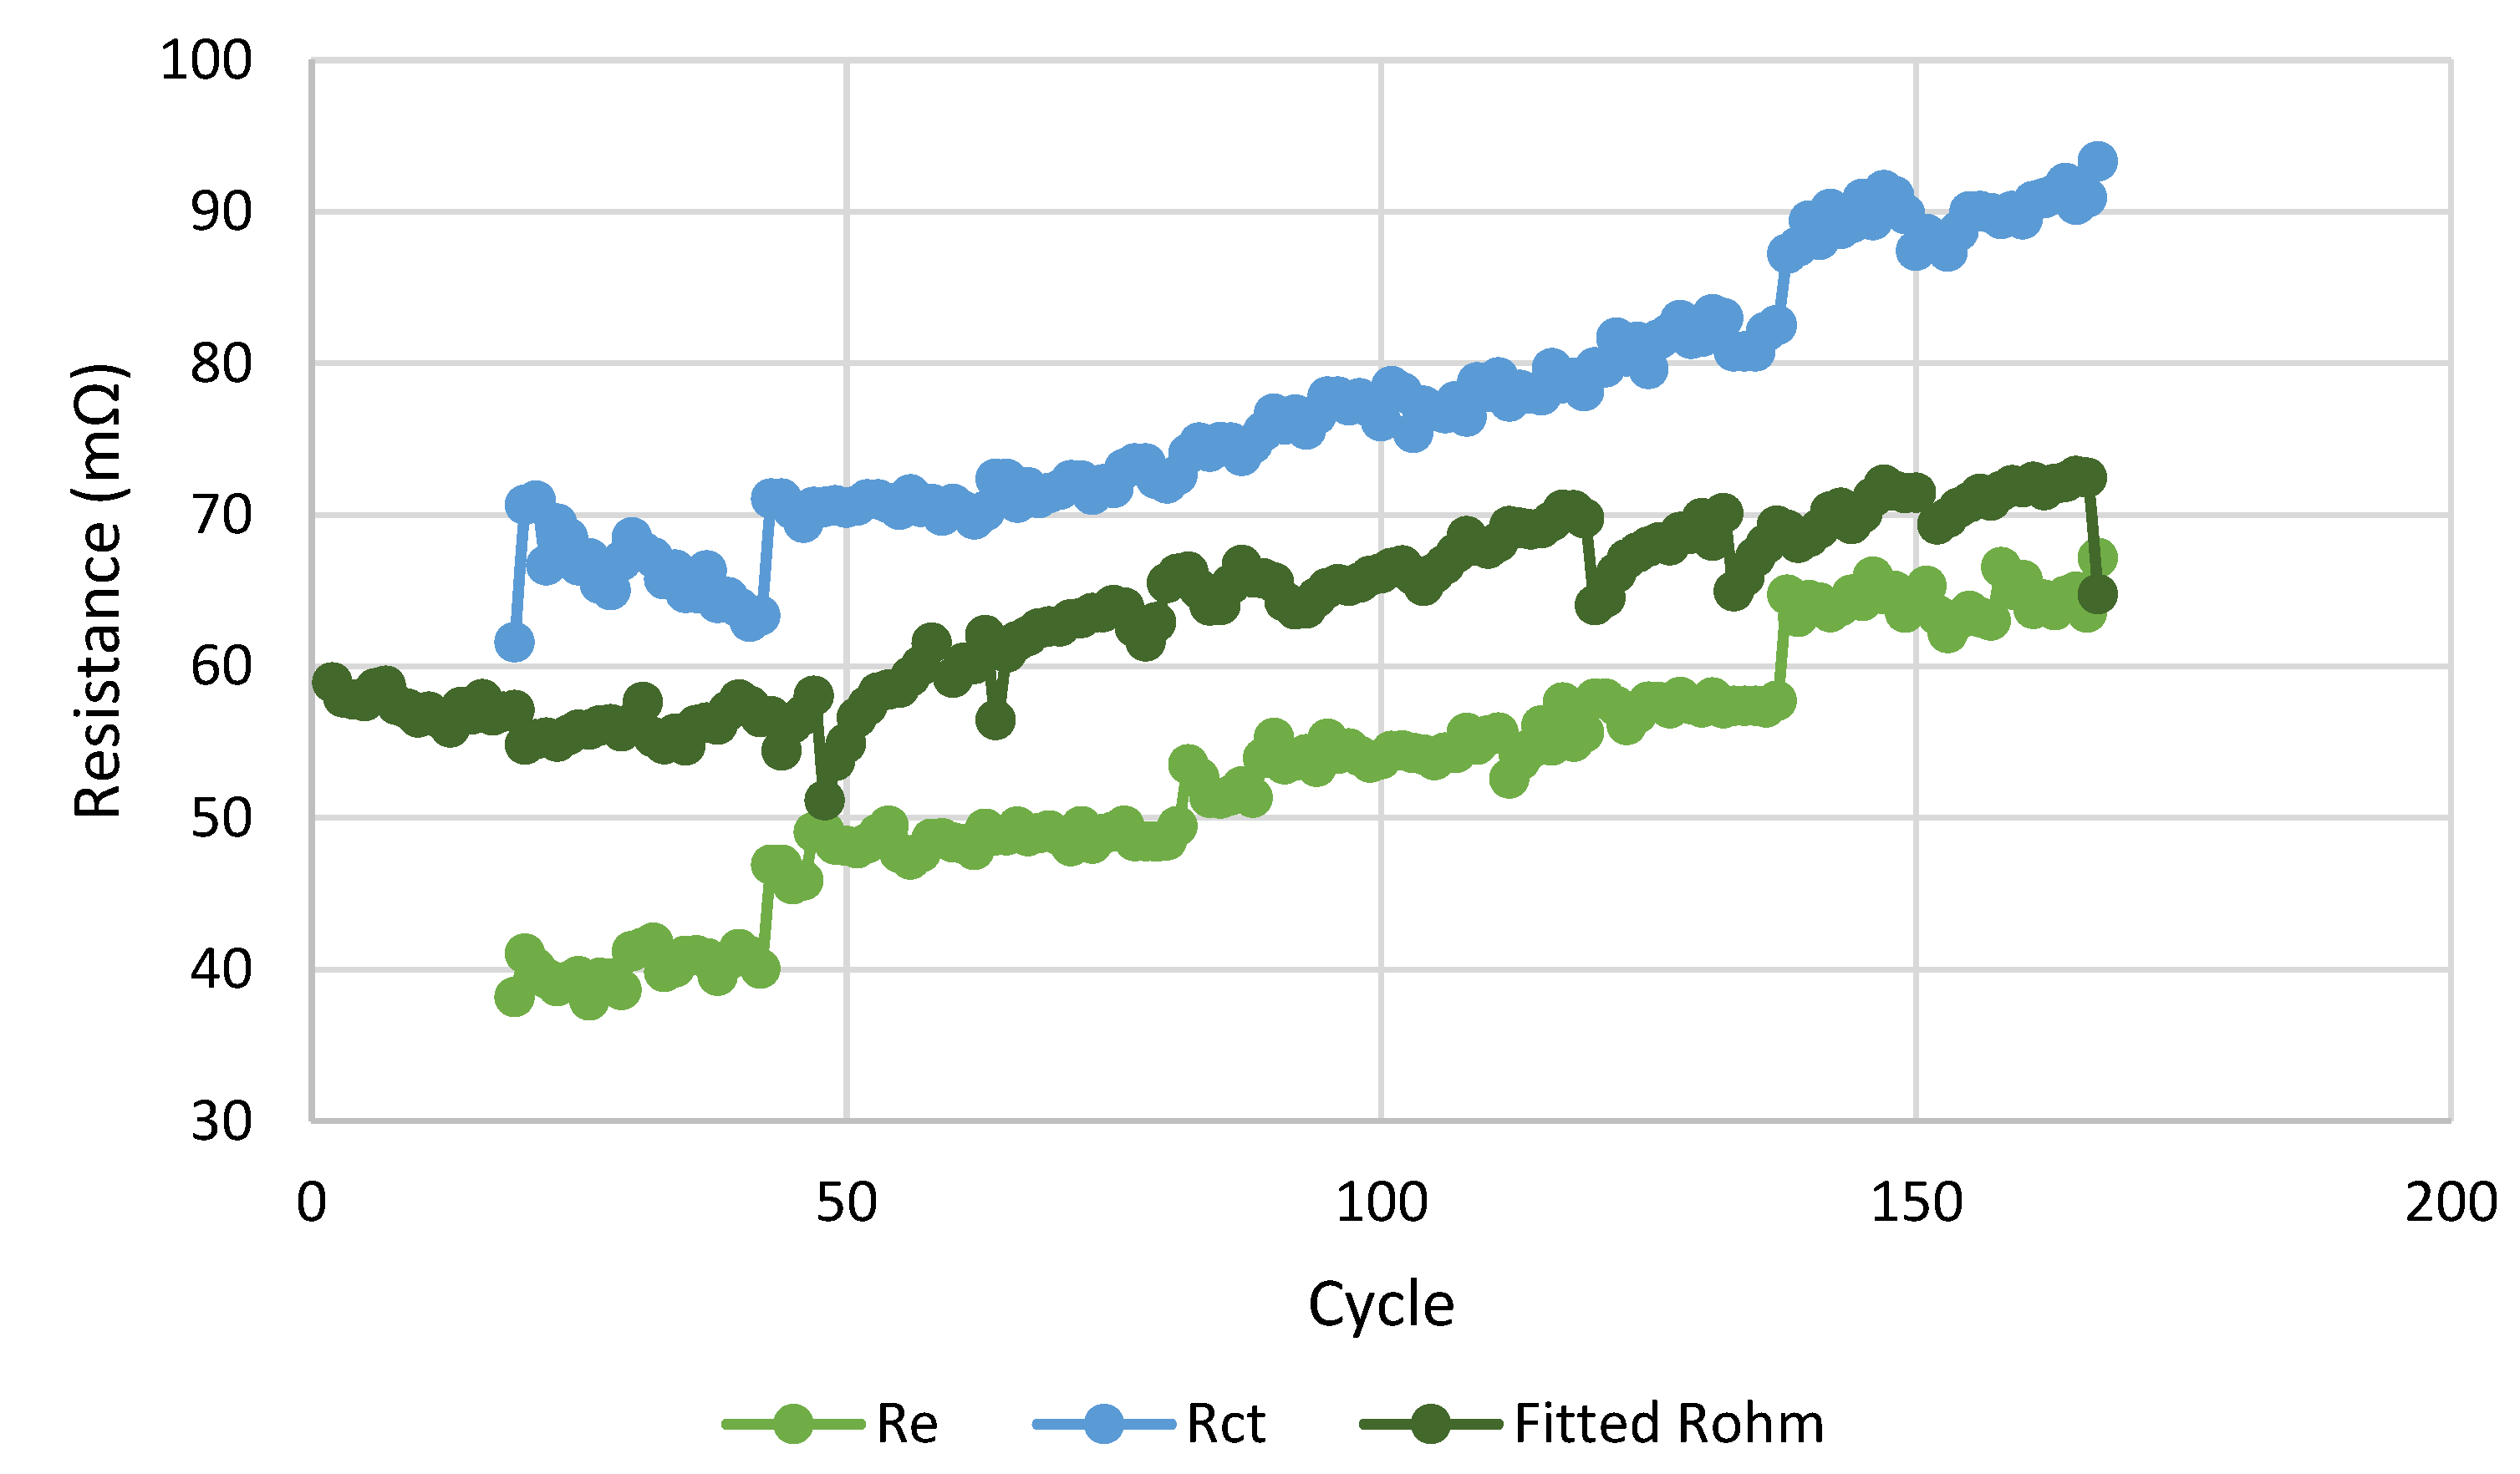
Figure 3.
RMSE for fitted resistance (data for Battery no. 7).
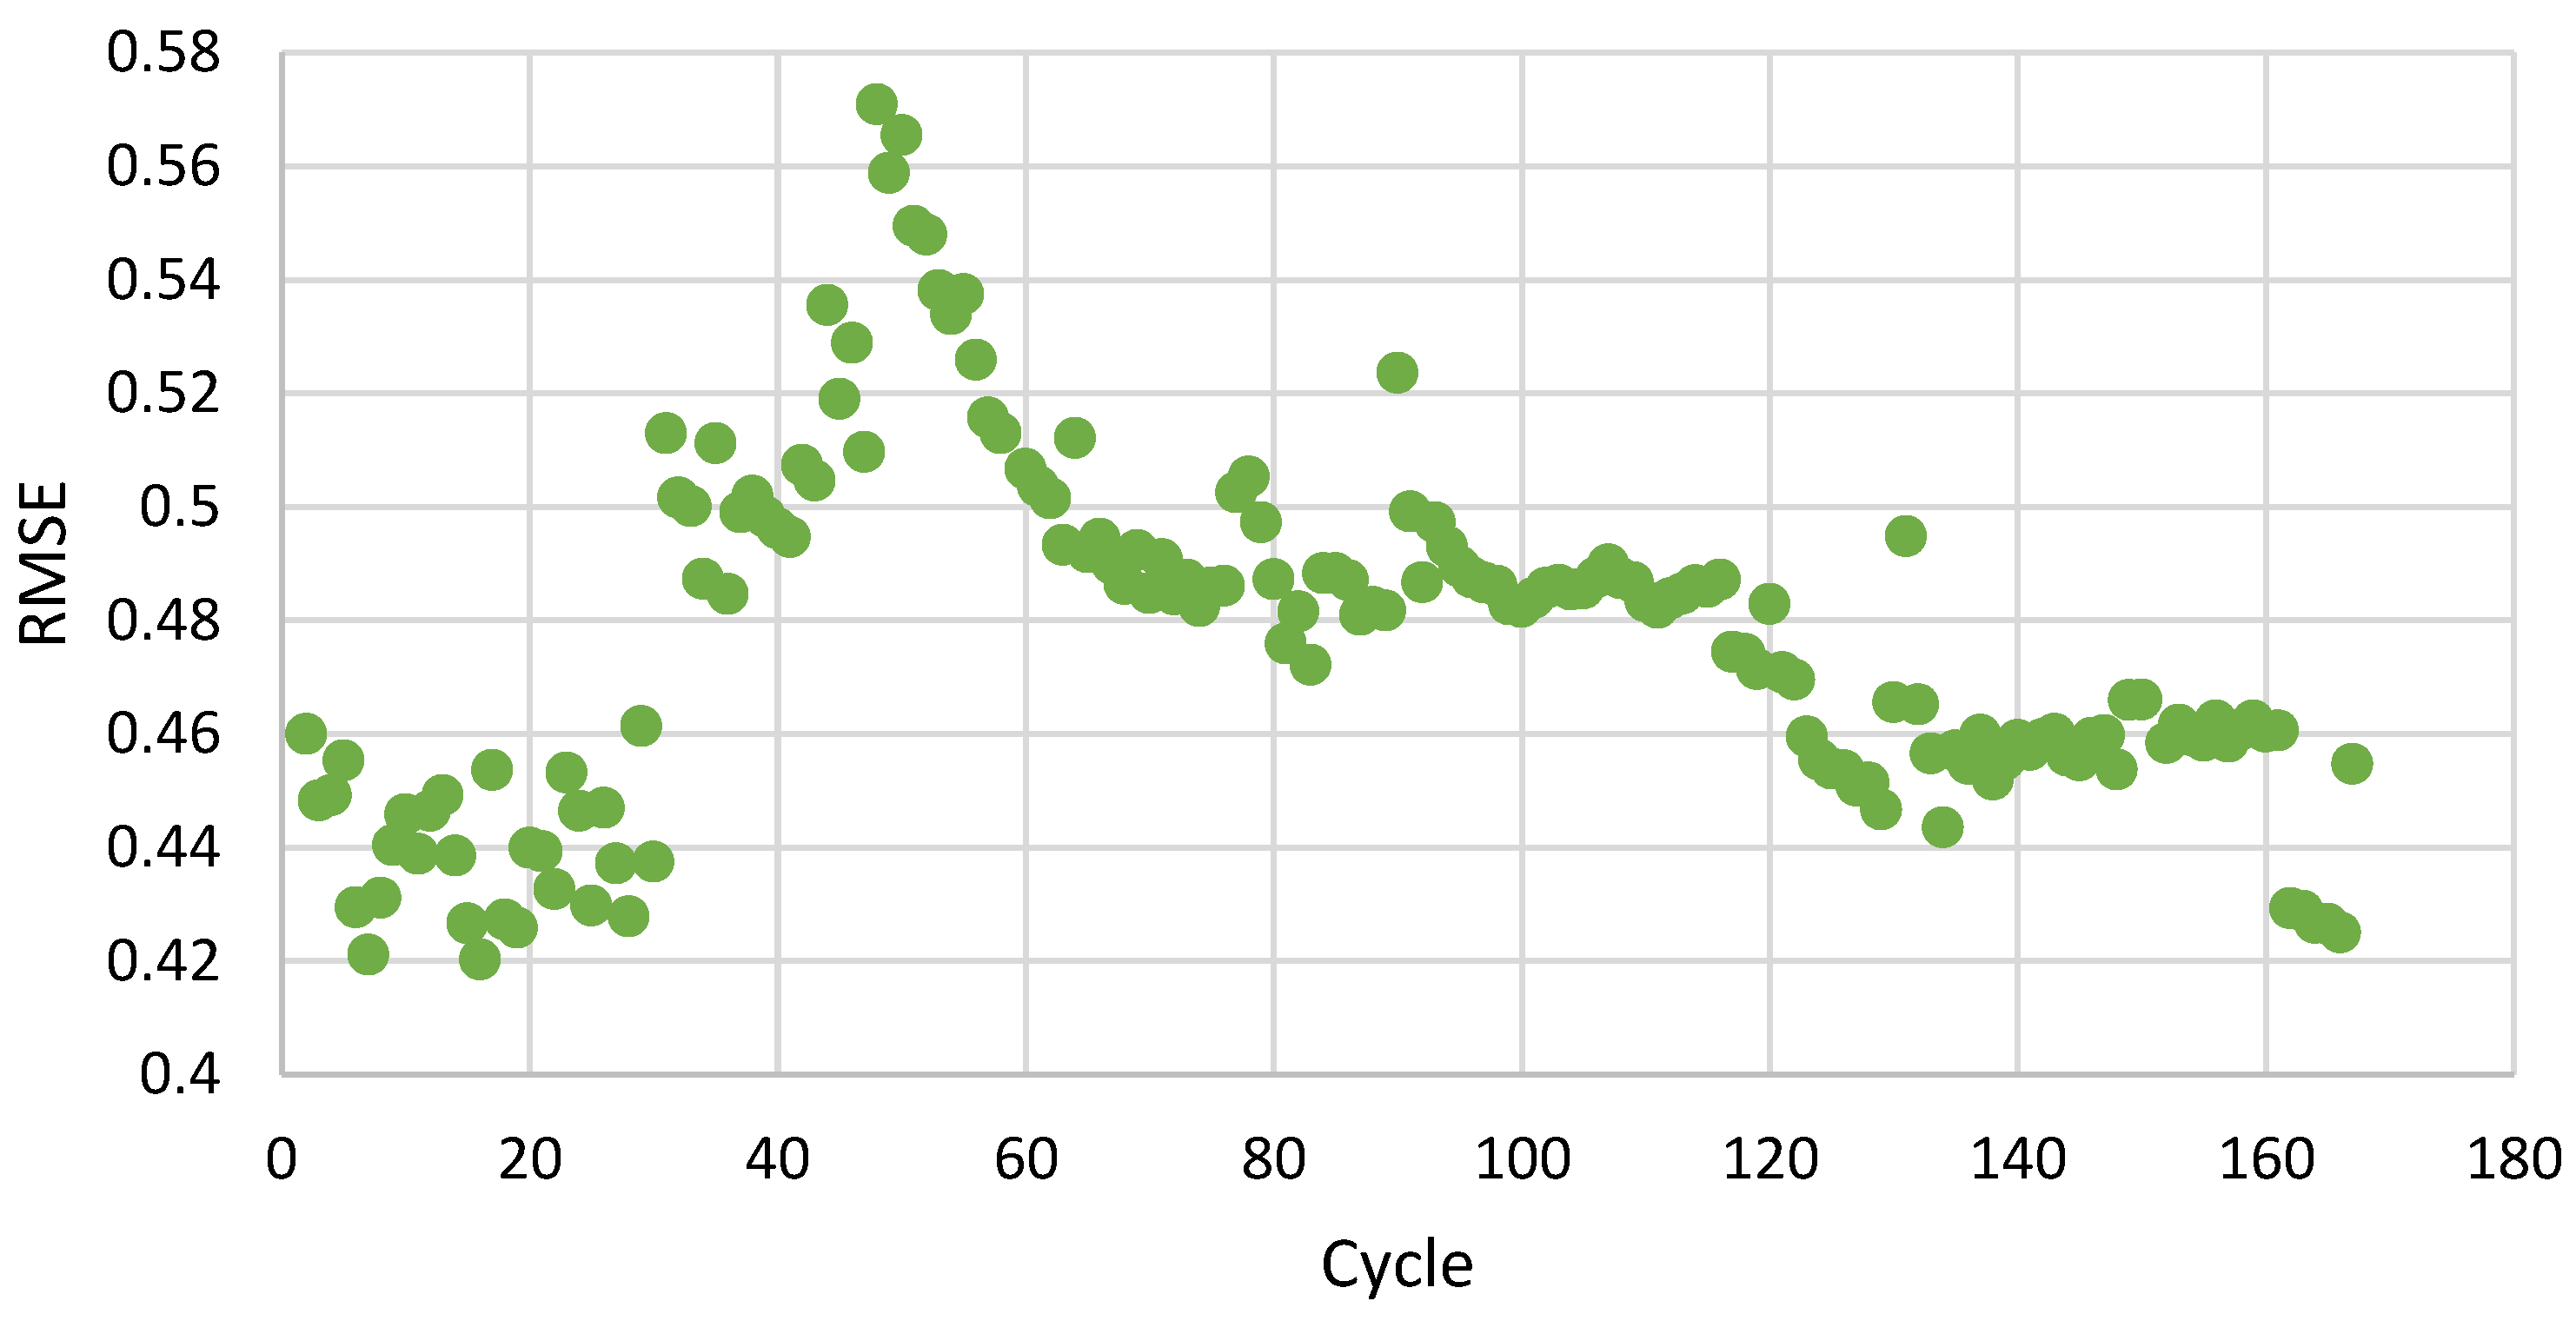
Figure 4.
Results for training of the four models for different sets of inputs, (a) RMSE, (b) MAE
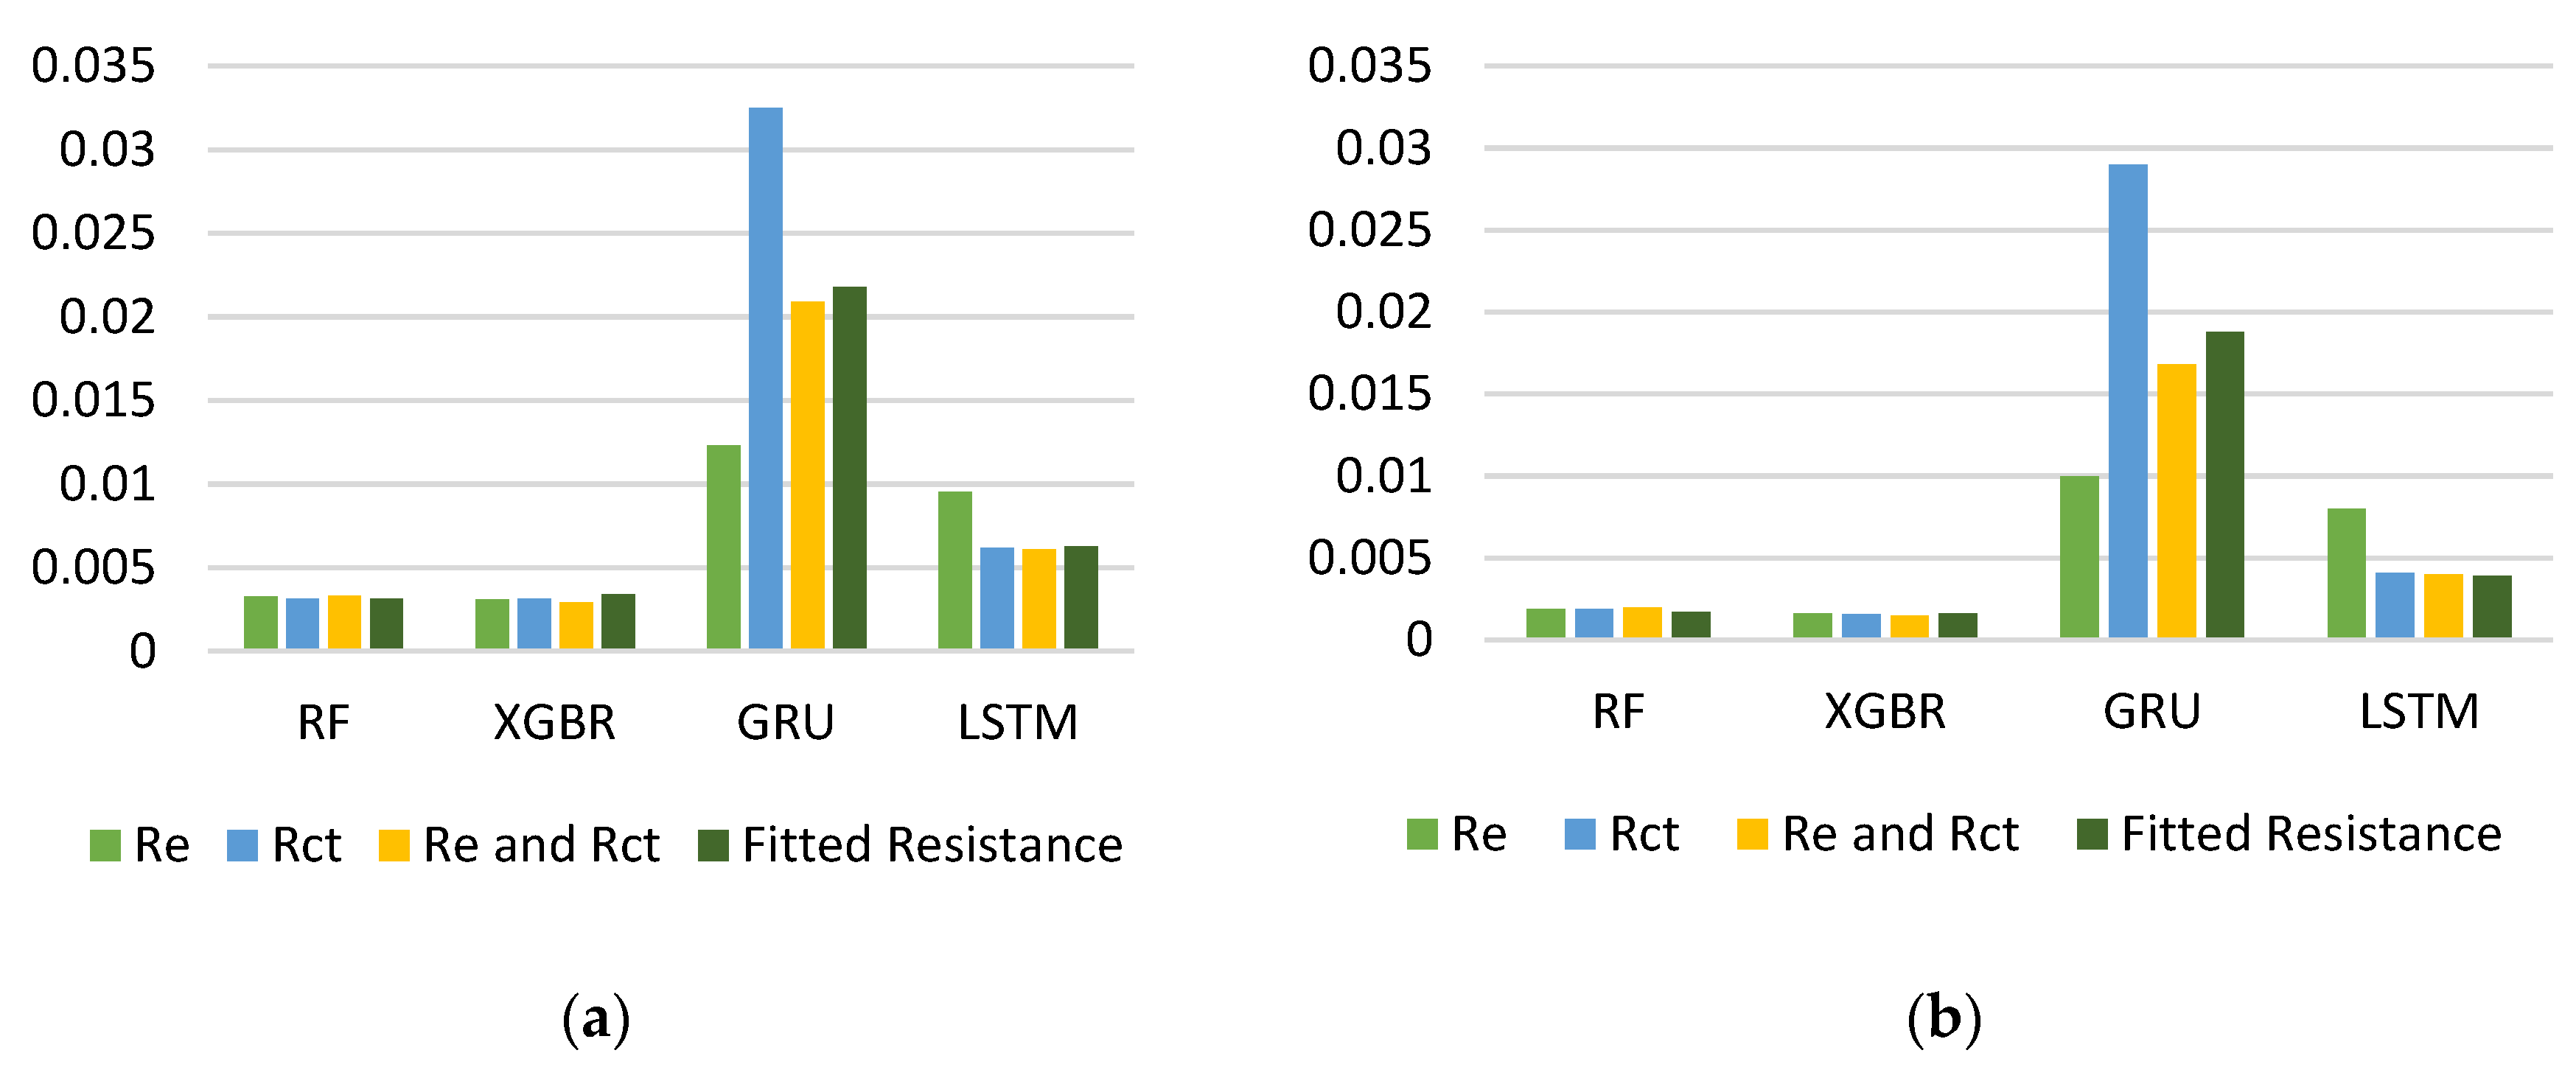

Table 1.
PCC results for Resistance against SOH.
| Parameter | PCC |
|---|---|
| Rct | -0.94479 |
| Re | -0.96460 |
| Fitted Resistance | -0.96240 |
Table 2.
Four models metrics report for unseen data.
| Model | MAE (-) | RMSE (-) |
|---|---|---|
| RF | 0.02322 | 0.0287 |
| XGBR | 0.02377 | 0.02868 |
| GRU | 0.01773 | 0.0243 |
| LSTM | 0.0319 | 0.0406 |
Table 3.
Best model on sensor failure scenarios (random failure) - performance on battery no. 5 (unseen data) - GRU.
Table 3.
Best model on sensor failure scenarios (random failure) - performance on battery no. 5 (unseen data) - GRU.
| Missing Data | MAE (-) | RMSE (-) |
|---|---|---|
| 2 % | 0.0180 | 0.02457 |
| 5 % | 0.01792 | 0.02435 |
| 10 % | 0.01811 | 0.02469 |
| 20 % | 0.01848 | 0.02510 |
| 30 % | 0.01938 | 0.02622 |
| 50 % | 0.02448 | 0.0303 |
Disclaimer/Publisher’s Note: The statements, opinions and data contained in all publications are solely those of the individual author(s) and contributor(s) and not of MDPI and/or the editor(s). MDPI and/or the editor(s) disclaim responsibility for any injury to people or property resulting from any ideas, methods, instructions or products referred to in the content. |
© 2025 by the authors. Licensee MDPI, Basel, Switzerland. This article is an open access article distributed under the terms and conditions of the Creative Commons Attribution (CC BY) license (https://creativecommons.org/licenses/by/4.0/).
Copyright: This open access article is published under a Creative Commons CC BY 4.0 license, which permit the free download, distribution, and reuse, provided that the author and preprint are cited in any reuse.


