
Submitted:
12 March 2025
Posted:
13 March 2025
You are already at the latest version
Abstract
Lithium-ion batteries are extensively utilized in modern applications due to their high energy density, long cycle life, and efficiency. With the increasing demand for sustainable energy storage solutions, accurately estimating the State of Health (SOH) is essential to address challenges related to battery degradation and secondary life management. Electrochemical Impedance Spectroscopy (EIS) is a widely used diagnostic tool for evaluating battery performance due to its simplicity and cost-effectiveness. However, EIS often struggles to decouple overlapping electrochemical processes. The Distribution of Relaxation Times (DRT) method has emerged as a powerful alternative, enabling the isolation of key processes such as ohmic resistance, SEI resistance, charge transfer resistance, and diffusion, thereby providing deeper insights into battery aging mechanisms. This paper presents a novel approach for estimating the State of Health (SOH) of batteries by leveraging DRT parameters across multiple State of Charge (SOC) levels. The study incorporates data from three lithium-ion batteries, each with distinct initial capacities, introducing variability that reflects the natural differences observed in real-world battery performance. By employing a Long Short-Term Memory (LSTM)-based machine learning model, the proposed framework demonstrates superior accuracy in SOH prediction compared to traditional EIS-based methods. The results highlight the sensitivity of DRT parameters to SOH degradation and validate their effectiveness as reliable indicators for battery health. This research underscores the potential of combining DRT analysis with AI-driven models to advance scalable, precise, and interpretable battery diagnostics.
Keywords:
Electrochemical Impedance Spectroscopy
; Distribution of Relaxation Times Parameters
; Long Short-Term Memory
; State of Health Estimation
1. Introduction
Lithium-ion batteries (LIBs) have become indispensable in modern technological advancements, powering applications ranging from portable electronics to electric vehicles and large-scale renewable energy storage systems [1,2,3]. Their popularity stems from their high energy density, extended lifespan, and operational efficiency, which collectively address the growing demand for sustainable energy solutions [4,5]. However, with the increasing deployment of LIBs, accurately estimating their State of Health (SOH) has become crucial for ensuring safety, optimizing performance, and extending their service life [6]. Beyond first-life applications, SOH estimation is also critical for assessing battery suitability for second life uses, such as stationary energy storage or backup power systems [7]. Effective SOH estimation promotes sustainable utilization of resources, reduces waste, and enhances the overall lifecycle value of lithium-ion batteries.
Electrochemical Impedance Spectroscopy (EIS) is widely regarded as a fundamental technique for evaluating battery health by analyzing the impedance response of a cell across a range of frequencies. This diagnostic approach captures key electrochemical properties, including internal resistance, charge transfer behavior, and capacitive dynamics, which are directly linked to the aging mechanisms of the battery. Despite its utility, EIS has notable limitations when analyzing overlapping electrochemical processes. The impedance spectra obtained through EIS often lacks the resolution needed to isolate specific physical and chemical phenomena within the cell, leading to incomplete interpretations of the internal dynamics of the battery [8,9].
The Distribution of Relaxation Times (DRT) has emerged as an advanced technique to refine impedance analysis and overcome its limitations [10]. By deconvoluting impedance spectra, DRT provides higher resolution of distinct electrochemical processes and their timescales, enabling a deeper understanding of the internal dynamics that influence battery performance. Integrating EIS with DRT allows for a more detailed analysis of the internal chemical behavior of the battery and contributes to improving the Equivalent Circuit Models (ECMs) traditionally developed using EIS methods, as highlighted in recent literature [11], thereby creating a robust framework for assessing battery health. This study leverages both methods to improve the accuracy of SOH estimation in lithium-ion batteries, particularly focusing on applications for second-life usage [3,10].
This paper utilizes the DRT method to analyze EIS data, aiming to extract key parameters that reflect detailed internal processes within lithium-ion batteries. The charge transfer peak, a prominent feature in the DRT spectrum, is utilized to train a Long Short-Term Memory (LSTM) model for estimating the SOH of Galaxy S9+ battery cells. By integrating DRT-derived features into an AI-based model, this approach establishes an advanced framework to enhance the accuracy of SOH estimation, supporting data-driven strategies for monitoring the long-term performance of lithium-ion batteries.
The overall framework for the proposed methodology is summarized in Figure 1, which outlines the key steps involved in the process. First, lithium-ion batteries undergo cycling tests and EIS measurements to evaluate their degradation behavior. The EIS data is then processed using the DRT method, which deconvolutes the impedance spectra to isolate critical processes, particularly the charge transfer peak. Key DRT parameters are extracted as quantitative features reflecting the charge transfer resistance and associated aging mechanisms [10]. These features are analyzed and subsequently used as inputs to a LSTM model, which is trained to predict the SOH of the batteries. Finally, the performance of the LSTM model is evaluated using prediction results and error metrics, confirming the accuracy and robustness of the approach. This integrated framework demonstrates the effective combination of advanced electrochemical analysis with AI-based modeling for accurate SOH estimation.
2. Data Acquisition Method
The battery aging test was conducted on three lithium-ion batteries extracted from the Galaxy S9+ smartphone to evaluate their performance degradation over 1000 charge-discharge cycles. Capacity and impedance spectra measurements were performed at intervals of every 20 cycles using EIS. The aging tests were conducted in a controlled environment using a HYSCLAB chamber to maintain a constant temperature of 25°C, ensuring consistency throughout the experimental duration. WonATech WBCS3000 M2 equipment was used to perform the charge-discharge cycling, while ZIVE MP2A was employed for EIS measurements. The charge and discharge profile, as illustrated in Figure 1, included distinct phases designed to simulate real operating conditions. During the charging phase, a constant current (CC) of 2 A (0.57C) was applied until the battery reached its termination voltage of 4.4 V, at which point the process transitioned into constant voltage (CV) charging [3]. In the CV phase, charging was completed when the current decreased to 0.02C (70 mA). Discharging was performed at an accelerated rate of 1.35C (4.71 A), and the process terminated when the voltage dropped to 2.8 V. To stabilize the battery before initiating the next cycle, a 1-hour rest period was introduced after each discharge phase.
Impedance spectra measurements were taken every 20 cycles, as shown in Figure 2, at six State of Charge (SOC) intervals (0%, 20%, 40%, 60%, 80%, and 100%) to capture the evolution of battery impedance under varying states. A small perturbation voltage of 100 mV was applied across a frequency range of 0.1 Hz to 4 kHz to ensure accurate and reliable impedance measurements [8]. After completing EIS measurements at 100% SOC, the battery was fully discharged at a current of 0.2C until the voltage reached 2.8 V, and the next cycle of charge-discharge testing commenced. The decision to perform EIS measurements at 20-cycle intervals strikes a balance between obtaining sufficient impedance data for analysis and minimizing the additional stress imposed on the battery during testing, which could independently accelerate battery degradation. This strategy ensured that the aging behavior of the batteries remained representative of real-world usage conditions without excessively extending the testing duration.
The results of the 1000-cycle aging test revealed distinct trends in capacity retention across the three battery cells. Coulombic counting was used to calculate the initial and remaining capacities relative to the nominal capacity of 3500mAh. As presented in Figure 3, the capacities of all three batteries declined gradually over the test duration, with variations between the cells. After completing 1000 cycles, the remaining capacities for Battery 1, Battery 2, and Battery 3 were recorded as 90.76%, 93.76%, and 90.34%, respectively, as shown in Figure 3. These results demonstrate a consistent aging pattern while highlighting minor variations in capacity fading, likely due to intrinsic differences between the cells despite their identical specifications.
3. Analysis of Electrochemical Impedance Spectroscopy and Distribution of Relaxation Times
EIS is a fundamental technique for analyzing the internal dynamics of the battery by measuring impedance and observing electrochemical processes over a range of frequencies. In this study, EIS measurements were performed every 20 charge-discharge cycles at six State of Charge (SOC) levels (0%, 20%, 40%, 60%, 80%, and 100%) to monitor and evaluate changes in the internal processes of the three lithium-ion cells as they aged over 1000 cycles. The resulting impedance data are visualized using Nyquist plots, which are crucial for understanding the progression of battery degradation by identifying and analyzing distinct electrochemical phenomena such as ohmic resistance, Solid Electrolyte Interface (SEI) layer resistance, charge transfer resistance, and diffusion processes [12].
Figure 4 displays the Nyquist plots of the impedance spectra at 100% SOC for all three cells across the cycling duration, from 0 cycles to 1000 cycles. These plots illustrate the progressive changes in impedance, which reflect the internal degradation mechanisms. The high-frequency intercept on the real axis, representing ohmic resistance, remains relatively stable during the early stages of cycling but gradually increases as cycling progresses. This increase in ohmic resistance is attributed to the buildup of contact resistance at the electrode interfaces and possible electrolyte degradation. Similarly, the semi-circular arc in the high-to-mid-frequency range, associated with the SEI layer resistance, demonstrates a gradual increase in diameter with cycling. This trend highlights the continuous formation and thickening of the SEI layer, which increases internal resistance and impacts performance.
The second semi-circular arc observed in the mid-frequency region, linked to charge transfer resistance, shows a more pronounced evolution compared to other components. As cycling progresses, the charge transfer resistance increases significantly, indicating slower electrochemical reactions at the electrode-electrolyte interface [13]. This is a critical marker of aging, as it reflects the deterioration of active materials and the growing difficulty in facilitating ion transfer during charge and discharge processes. The diameter of this arc expands over time for all three cells, suggesting that charge transfer resistance plays a dominant role in the observed capacity fade and performance decline. Despite the detailed insights provided by Nyquist plots, the low-frequency tail of the spectra, indicative of diffusion processes or Warburg impedance, is not fully captured due to the limited frequency range of the measurements. Additionally, overlapping semi-circular arcs with similar reaction time constants obscure the clear separation of electrochemical processes [14], complicating the interpretation of battery aging mechanisms solely from EIS data.
To overcome these limitations, DRT analysis was employed for a more precise deconvolution of the impedance spectra. Unlike Nyquist plots, DRT analysis breaks down the impedance response into distinct peaks, each corresponding to a specific internal process, such as ohmic resistance, SEI layer resistance, charge transfer resistance, and diffusion [15]. This enables a deeper and more detailed insight into the individual contributions of various electrochemical processes over time.
As shown in Figure 4 (right), the charge transfer peak, which is the most dynamic feature of the spectrum, exhibits several clear trends with cycling across all three cells. Firstly, the peak shifts to longer relaxation times (τ), indicating slower charge transfer processes as the battery ages. This shift reflects the growing resistance at the electrode-electrolyte interface and the declining efficiency of ion transport. Secondly, the peak height increases noticeably, confirming a steady rise in resistive behavior due to material degradation and structural changes in the electrodes. Additionally, the FWHM of the charge transfer peak widens over the cycling duration, suggesting increased heterogeneity in the electrode reactions and reduced uniformity in the material properties. The overall area under the charge transfer peak also increases significantly, underscoring the critical role of charge transfer resistance in the aging process and its direct correlation with battery degradation.
Other peaks observed in the DRT analysis, such as those corresponding to ohmic resistance and SEI layer resistance, show comparatively minor changes during the 1000-cycle test. The ohmic resistance peak remains stable for the initial cycles but increases slightly as the aging process progresses, reflecting growing internal resistance. The SEI layer resistance peak also demonstrates a modest increase in magnitude, consistent with the gradual thickening of the SEI layer [16]. The diffusion-related processes, which manifest at longer relaxation times, are observed but remain less pronounced due to the limited frequency range. However, their presence highlights the cumulative effects of aging on ion transport and mass diffusion, even if these mechanisms are less dominant compared to charge transfer resistance.
Overall, DRT analysis reveals that charge transfer resistance is the most significant indicator of battery aging across all three cells. The progressive changes in the charge transfer peak provide critical insights into the mechanisms underlying capacity fade and performance degradation. By enabling a clearer separation and quantification of electrochemical processes, DRT analysis serves as a valuable tool for accurately assessing battery health and improving SOH estimation models. Summarizing, the enhanced clarity offered by DRT is particularly useful for identifying key aging mechanisms and evaluating their impact on battery performance over time.
4. Correlation of Aging and DRT Parameters Evolution
Figure 5 shows the evolution of key DRT-derived parameters, including peak area, FWHM, center relaxation time and peak height for the charge transfer peak in the DRT plots of Cell 01 over 1000 cycles at six different SOC levels. These parameters were extracted through Gaussian fitting of the charge transfer peaks, ensuring precise quantification. The results reveal consistent trends influenced by both the cycle number and SOC, reflecting the progression of battery aging mechanisms. As the battery ages, charge transfer resistance, which dominates the mid-frequency region of the impedance spectrum, increases significantly.
This resistance is indicated by the widening of the FWHM, the gradual increase in peak area and height, and the shift of the center relaxation time to longer values. The changes become more pronounced at both ends of SOC levels, where aging effects tend to accelerate, signaling slower reaction kinetics and reduced transport efficiency. These trends suggest that the charge transfer process becomes increasingly complex and heterogeneous over time, making it a key factor in understanding battery degradation [17]. Furthermore, the observed consistency across all three cells reinforces the robustness and reliability of the analysis. By monitoring DRT parameters at multiple SOC levels, a comprehensive understanding of internal battery processes and their evolution over time is achieved, offering critical insights for developing accurate battery state estimation models.
In order to clarify the links between these variables, a heatmap was created using the correlation matrix in Figure 6 using Spearman correlation matrix, The Spearman correlation coefficient (ρ) is a non-parametric measure that evaluates the strength and direction of these relationships [18] and is calculated using below equation.
where di is the rank difference between corresponding values of two variables, and n is the total number of observations. The analysis reveals a strong positive correlation among the DRT-derived parameters, indicating their collective representation of the same underlying charge transfer relaxation process. As the battery ages, these parameters demonstrate consistent trends, reflecting the gradual increase in charge transfer resistance. In contrast, the correlation between the DRT parameters and SOH exhibits a consistent negative trend, with correlation coefficients ranging from −0.49 to −0.55. This negative relationship highlights the sensitivity of the charge transfer relaxation process to SOH degradation, as SOH declines, the charge transfer resistance peak becomes more prominent, further emphasizing its importance as a reliable indicator of battery health.
The findings from the Spearman correlation analysis confirm the strong interdependence among the DRT-derived parameters and their inverse relationship with SOH, establishing them as effective indicators for tracking battery degradation. By incorporating these parameters into machine learning-based models such as LSTM for SOH prediction, predictive accuracy can be significantly enhanced.
5. LSTM Model for SOH Estimation
5.1. Architecture
The Long Short-Term Memory (LSTM) model is a type of neural network designed for sequential data, with a unique memory feature that enables it to retain and update relevant information over time [19,20,21]. The architecture of an LSTM cell as shown in Figure 7 comprises four key gates, the forget gate, input gate, cell state update, and output gate, which work together to manage the flow of information.
The forget gate decides how much of the previous cell state Ct-1 should be retained or discarded. It uses the previous hidden state ht-1 and the current input xt, along with a weight matrix Wf and bias bf, to compute the forget vector ft using a sigmoid activation function [19]. The sigmoid σ ensures the output ranges between 0 and 1.
The input gate determines what new information should be added to the cell state. It involves two components: the input gate vector it, which determines the proportion of new information to incorporate, and the candidate cell state which holds potential new values for the cell state [22]. While it is computed using a sigmoid function, is calculated using a tanh activation function to scale its output between -1 and 1
The cell state update combines the outputs from the forget gate and input gate to update the cell state Ct. The forget gate scales down the previous cell state Ct-1, while the input gate determines how much of the candidate cell state should be added. This enables the model to selectively retain old information and incorporate new information effectively.
The output gate determines what information from the updated cell state Ct should be passed forward as the current hidden state ht. The output gate vector ot is calculated using a sigmoid function, while the updated cell state is scaled using a tanh function to produce the final hidden state. This hidden state serves as both the output of the LSTM cell and the input to the next time step [23].
5.2. Model Training
In this study, the LSTM model is trained as described in Figure 8, The process begins with the selection of key electrochemical features as input parameters, which include DRT parameters along with SOC to cover the different state of charge applications. In the data processing stage, the input data undergoes two critical preprocessing steps. First, any missing values are handled, ensuring that the dataset is complete and reliable. Second, the data is normalized to bring all input features to a consistent scale, which helps improve the convergence of the model during training. After preprocessing, the dataset is split with the ratio of 80% and 20%, training set to train the model, and a testing set to evaluate its performance respectively.
The model training process involves LSTM model with two hidden layers, each consisting of 200 units. To prevent overfitting and improve generalization, L2 regularization and a dropout rate of 0.4 are applied. A Dense output layer predicts the SOH values. The model is trained using the Adam optimizer, which efficiently adjusts weights to minimize the prediction error. The Mean Squared Error (MSE) loss function guides the training process over 250 epochs with a batch size of 32 [24]. Additionally, hyperparameter optimization is performed using Random Search to identify the optimal values for the configuration of the model.
5.3. Model Performance
Once the final trained LSTM model is obtained, it is used to predict the SOH values for the testing set. The performance of the model is evaluated using metrics such as Mean Squared Error (MSE) and Root Mean Squared Error (RMSE), which measure the accuracy of the predictions by quantifying the difference between the predicted and actual SOH values.
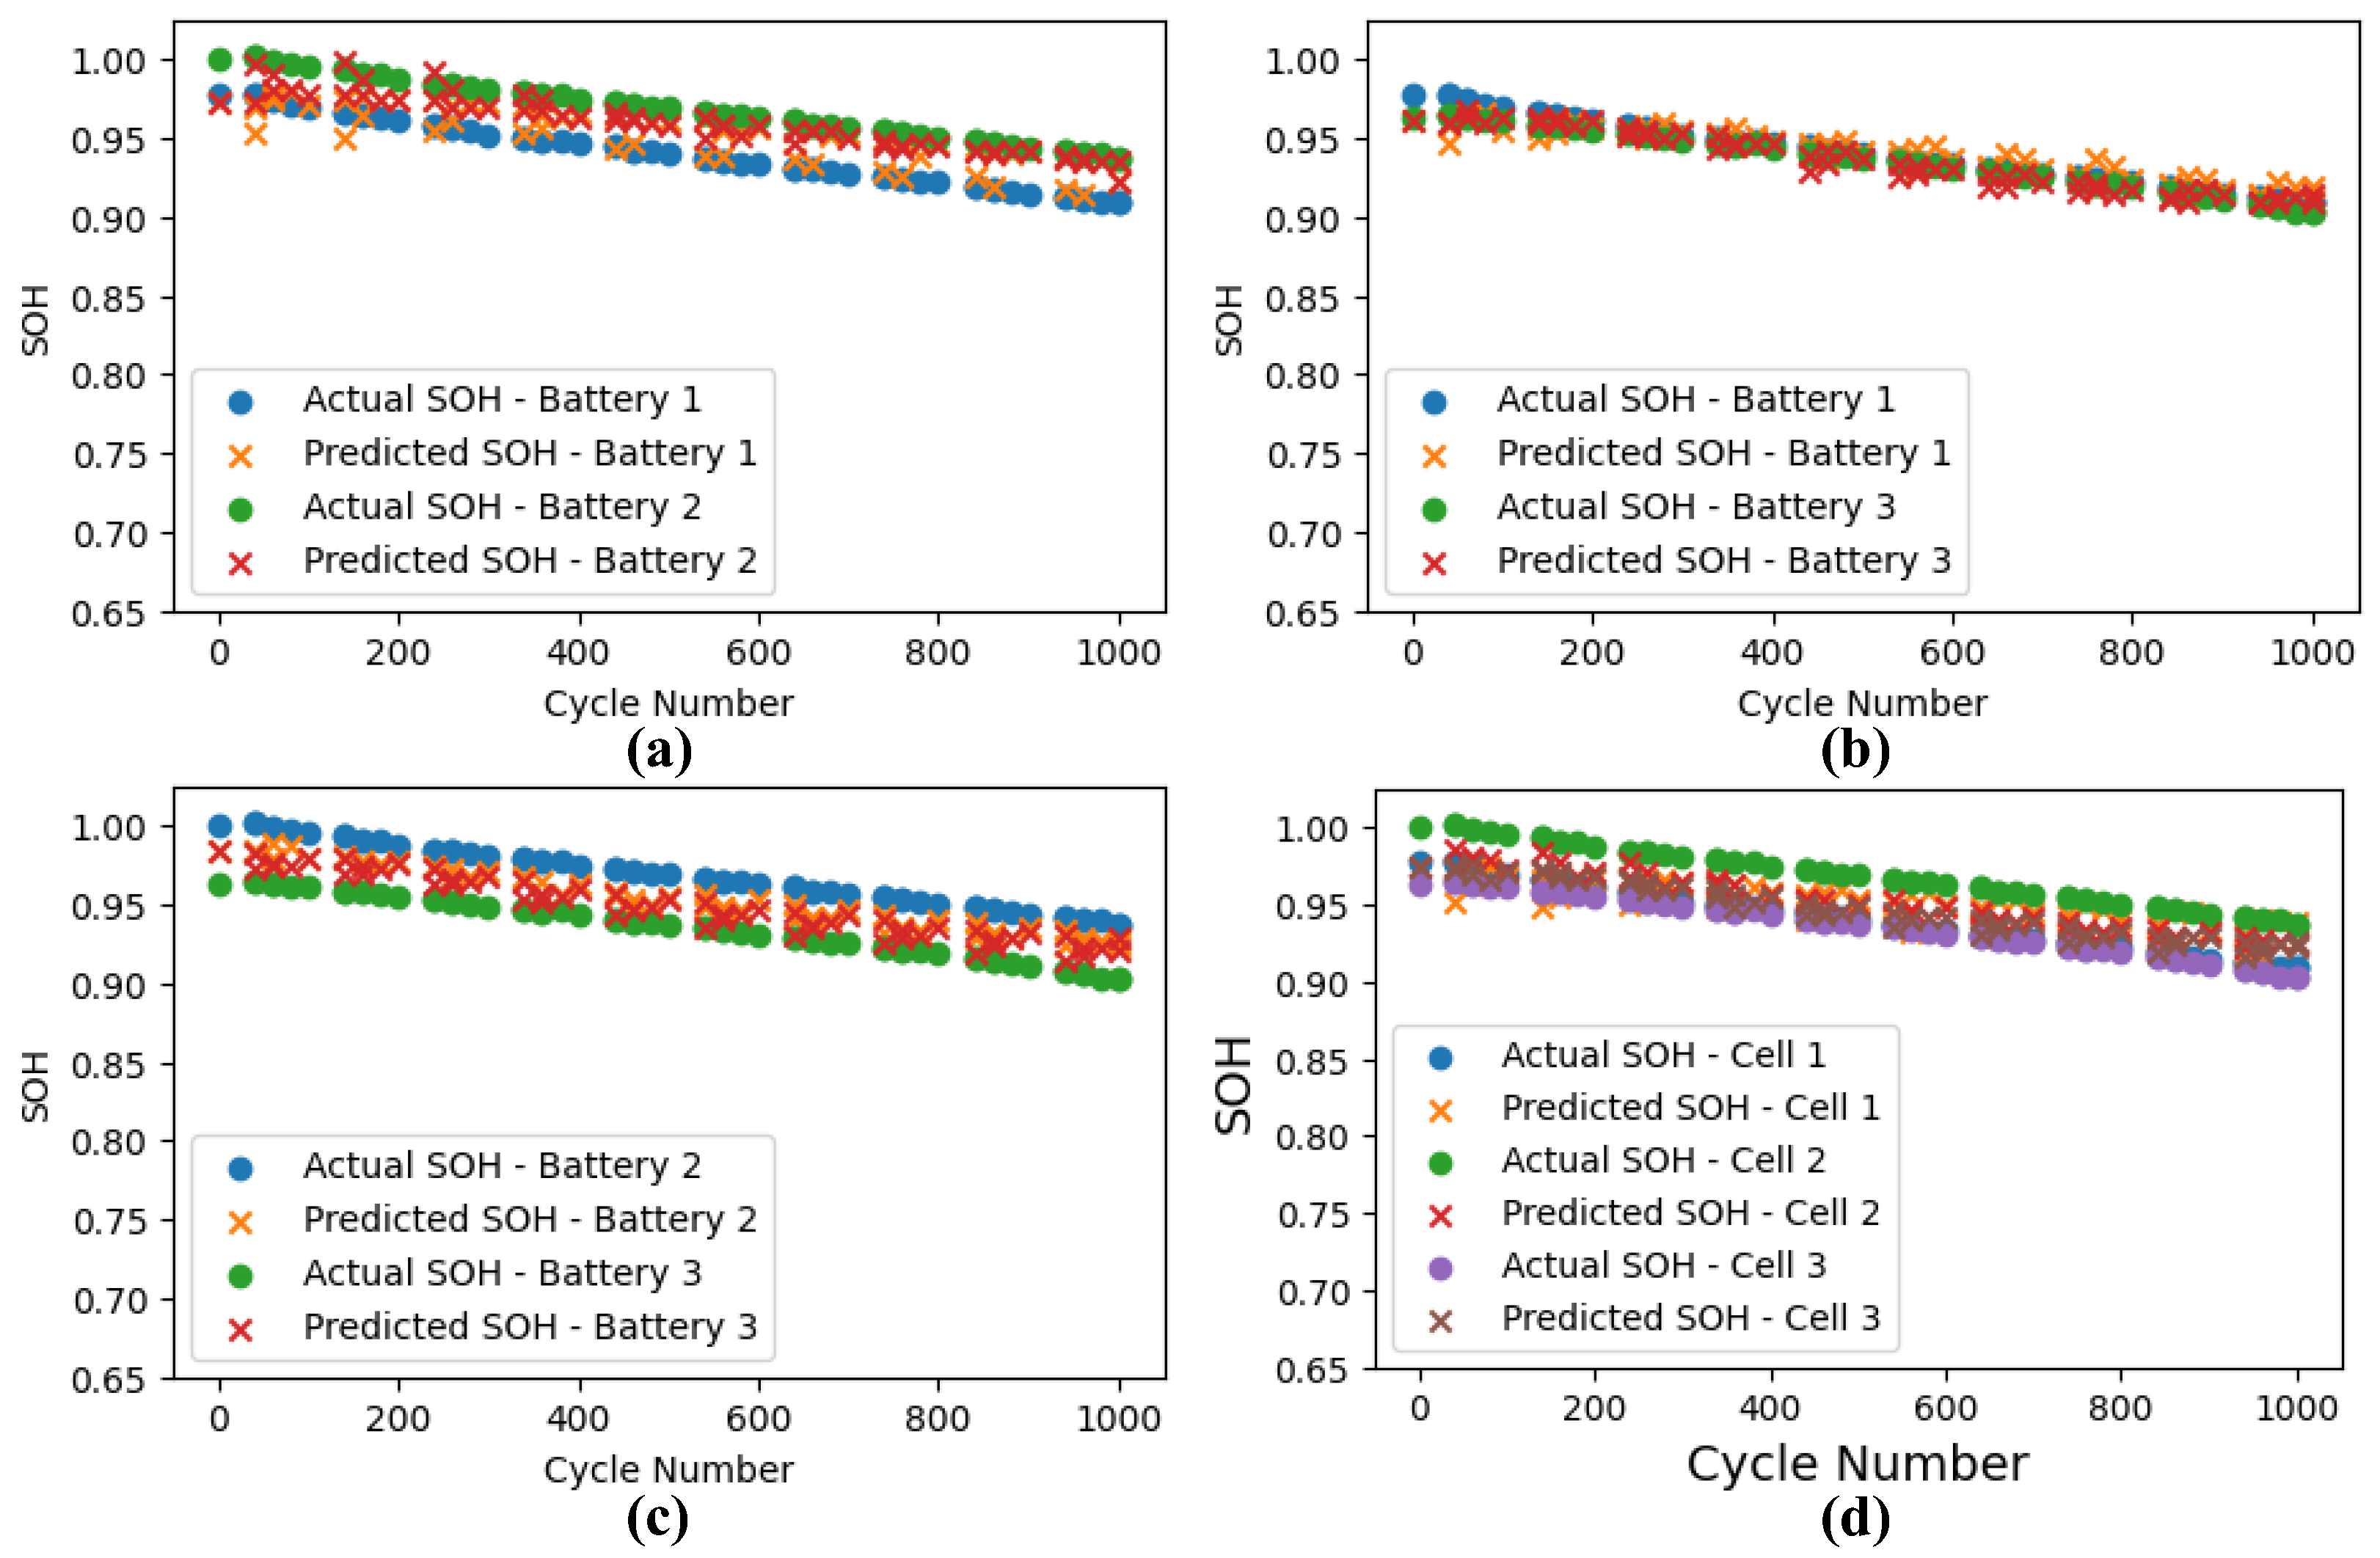
The LSTM model was employed to predict the State of Health (SOH) of three lithium-ion batteries across 1000 cycles. The results demonstrate the ability of the model to accurately capture the degradation trends of the batteries using key DRT parameters (FWHM, Height, Center Relaxation Time, and Area) and SOC as input features. The analysis was performed using four datasets: (a) Battery 1 and Battery 2, (b) Battery 1 and Battery 3, (c) Battery 2 and Battery 3, and (d) a combined dataset including all three batteries.
Figure 9 presents a comparison of the actual SOH and predicted SOH for these datasets. The results indicate that when the LSTM model was trained and tested with datasets from Battery 1 and Battery 3, the prediction accuracy was the highest. This can be attributed to the fact that the initial capacity difference between Battery 1 and Battery 3 is minimal, approximately 1%, resulting in smaller deviations and a closer alignment between predicted and actual SOH. The performance metrics for this dataset were particularly impressive, achieving a Mean Absolute Error (MAE) of 0.58% and a Root Mean Squared Error (RMSE) of 0.70%.
In contrast, when the model was trained and tested with datasets from Battery 1 and Battery 2 or Battery 2 and Battery 3, the prediction errors were slightly higher. The combined dataset (all three batteries) captured a wider range of capacity variations, leading to a comparatively higher error. However, the combined dataset provides a more realistic representation of real-time scenarios by incorporating diverse aging patterns across different batteries. Despite the slightly increased error, the LSTM model still outperformed traditional EIS based ECM methods using the same dataset for predictive battery health estimation using neuro fuzzy [8]. The Mean Absolute Error (MAE) and Root Mean Squared Error (RMSE), as defined below, were used to evaluate the performance of the model [25].
where is the total number of data points, and represents the error for each prediction. To summarize the results, the MAE and RMSE for all datasets are presented in the following table:
| Battery Dataset | MAE (%) | RMSE (%) |
| Battery 1 and Battery 2 | 1.16 | 1.38 |
| Battery 2 and Battery 3 | 1.37 | 1.46 |
| Battery 1 and Battery 3 | 0.58 | 0.70 |
| Combined (Battery 1, 2, 3) | 1.28 | 1.41 |
The results demonstrate that the inclusion of data from three cells with different capacities essentially averages out the differences across these varying capacities. It indicates that the LSTM model converges toward stable and reliable predictions by including more data. Although higher capacity retention of the Battery 2 influences the combined dataset, the model shows a better estimation capability when applied to a range of battery behaviors. Since batteries with the same chemistry share similar trends, collecting data across multiple cells ultimately leads to a more generalized model for SOH estimation. In turn, this kind of broad coverage ensures the model can handle real-world variability and deliver consistent performance, even when faced with different capacities within the same battery chemistry.
6. Conclusion
This study highlights the effectiveness of integrating Distribution of Relaxation Times (DRT) analysis with EIS to achieve advanced and accurate SOH estimation for lithium-ion batteries. By systematically analyzing DRT peak parameters (Area, FWHM, Center Relaxation Time, and Height) over 1000 cycles at six distinct SOC levels, the developed LSTM model demonstrated its capability to capture the complex temporal dependencies associated with battery aging. The model achieved an MAE of 1.28% and an RMSE of 1.41% when tested with combined datasets from three batteries, underscoring its robust prediction capability for real-time SOH estimation across varying cell capacities. The highest predictive accuracy was observed when using datasets from batteries with minimal initial capacity differences, such as Battery 1 and Battery 3, where the model achieved an MAE of 0.58% and RMSE of 0.70%. These values underline the strength of the proposed methodology in accurately predicting SOH while accommodating variations in battery aging trends.
This work establishes a reliable and scalable framework for enhancing battery health monitoring and prediction across diverse real-world applications, including portable electronics, electric vehicles, and energy storage systems. The integration of DRT parameters with advanced machine learning techniques like LSTM not only improves the accuracy of SOH estimation but also highlights the potential of leveraging electrochemical features for long-term battery performance monitoring. Future research directions will focus on incorporating more detailed electrochemical parameters, such as those representing other processes, to provide a more comprehensive understanding of battery degradation mechanisms.
Author Contributions
For research articles with several authors, a short paragraph specifying their individual contributions must be provided. The following statements should be used “Conceptualization, X.X. and Y.Y.; methodology, X.X.; software, X.X.; validation, X.X., Y.Y. and Z.Z.; formal analysis, X.X.; investigation, X.X.; resources, X.X.; data curation, X.X.; writing—original draft preparation, X.X.; writing—review and editing, X.X.; visualization, X.X.; supervision, X.X.; project administration, X.X.; funding acquisition, Y.Y. All authors have read and agreed to the published version of the manuscript.” Please turn to the CRediT taxonomy for the term explanation. Authorship must be limited to those who have contributed substantially to the work reported.
Funding
Please add: “This research received no external funding” or “This research was funded by NAME OF FUNDER, grant number XXX” and “The APC was funded by XXX”. Check carefully that the details given are accurate and use the standard spelling of funding agency names at https://search.crossref.org/funding. Any errors may affect your future funding.
Conflicts of Interest
The authors declare no conflicts of interest.
References
- Rahman, Md Arafat, Jin-Hyuk Kim, and Shakhawat Hossain. "Recent advances of energy storage technologies for grid: A comprehensive review." Energy Storage 4.6 (2022): e322. [CrossRef]
- Ahmad, Furkan, Mohd Khalid, and Bijaya Ketan Panigrahi. "Development in energy storage system for electric transportation: A comprehensive review." Journal of Energy Storage 43 (2021): 103153. [CrossRef]
- Akram, A. S., Sohaib, M., & Choi, W. (2024). "SOH Estimation of the Lithium-ion Batteries using the Parameters of Distribution of Relaxation Times. " Proceeding of the KIPE Autumn Conference 2024, 52-54.
- Xu, Jingjing, et al. "High-energy lithium-ion batteries: recent progress and a promising future in applications." Energy & Environmental Materials 6.5 (2023): e12450.
- Lin, Zihui, Dagang Li, and Yuntao Zou. "Energy efficiency of lithium-ion batteries: Influential factors and long-term degradation." Journal of Energy Storage 74 (2023): 109386. [CrossRef]
- Zhang, Zhengming John, Premanand Ramadass, and Weifeng Fang. "Safety of lithium-ion batteries." Lithium-ion batteries. Elsevier, 2014. 409-435.
- Chen, Tianmei, et al. "Applications of lithium-ion batteries in grid-scale energy storage systems." Transactions of Tianjin University 26.3 (2020): 208-217. [CrossRef]
- Kim, M. S., Akram, A. S., & Choi, W. (2024). A neuro-fuzzy system to evaluate the remaining useful life of the lithium-ion battery using the impedance spectrum in the overall range of SOCs. Journal of Power Electronics, 1-12. [CrossRef]
- Pradyumna, T. K., et al. "Capacity estimation of lithium-ion batteries using convolutional neural network and impedance spectra." Journal of Power Electronics 22.5 (2022): 850-858. [CrossRef]
- Sohaib, M., & Choi, W. (2024). "Investigation of the Aging Phenomena in Lithium-Ion Batteries Using Distribution of Relaxation Time Analysis". Proceeding of the KIPE Summer Conference 2024, 187-189.
- Azizighalehsari, S., Boj, E. A., Venugopal, P., Soeiro, T. B., & Rietveld, G. (2024). A Distribution of Relaxation Time Approach on Equivalent Circuit Model Parameterization to Analyse Li-ion Battery Degradation. IEEE Transactions on Industry Applications. [CrossRef]
- Chang, Young-Churl, and Hun-Joon Sohn. "Electrochemical impedance analysis for lithium-ion intercalation into graphitized carbons." Journal of the Electrochemical Society 147.1 (2000): 50. [CrossRef]
- Zhang, D., et al. "Studies on capacity fade of lithium-ion batteries." Journal of Power Sources 91.2 (2000): 122-129. [CrossRef]
- Suarez-Hernandez, Ruben, et al. "A graphical approach for identifying the limiting processes in lithium-ion battery cathode using electrochemical impedance spectroscopy." Journal of The Electrochemical Society 167.10 (2020): 100529. [CrossRef]
- Robayo-Molina, Iván, Gastón A. Crespo, and María Cuartero. "Usefulness of the Distribution of Relaxation Time Method in Electroanalytical Systems: The Case of Voltammetric Ion-Selective Electrodes." ACS omega 9.7 (2024): 8162-8172. [CrossRef]
- Iurilli, Pietro, Claudio Brivio, and Vanessa Wood. "Detection of Lithium-Ion Cells’ Degradation through Deconvolution of Electrochemical Impedance Spectroscopy with Distribution of Relaxation Time." Energy Technology 10.10 (2022): 2200547. [CrossRef]
- Sohaib, M., & Choi, W. (2024). "A Novel Aging Diagnosis Method Using Distribution of Relaxation Time. " Proceeding of the KIPE Autumn Conference 2024, 46-48.
- Zhou, Y., Huang, M., Chen, Y., & Tao, Y. (2016). A novel health indicator for on-line lithium-ion batteries remaining useful life prediction. Journal of Power Sources, 321, 1-10. [CrossRef]
- Park, K., Choi, Y., Choi, W. J., Ryu, H. Y., & Kim, H. (2020). LSTM-based battery remaining useful life prediction with multi-channel charging profiles. IEEE Access, 8, 20786-20798. [CrossRef]
- X. Li, L. Zhang, Z. Wang and P. Dong, "Remaining useful life prediction for lithium-ion batteries based on a hybrid model combining the long short-term memory and Elman neural networks", J. Energy Storage, vol. 21, pp. 510-518, Feb. 2019. [CrossRef]
- Y. Liu, G. Zhao, X. peng and C. Hu, "Lithium-ion battery remaining useful life prediction with long short-term memory recurrent neural network", Proc. Annu. Conf. Prognostics Health Manage. Soc., no. 1, pp. 1-7, Oct. 2017. [CrossRef]
- Deng, Zhongwei, et al. "Battery health estimation with degradation pattern recognition and transfer learning." Journal of Power Sources 525 (2022): 231027. [CrossRef]
- Zhang, YongZhi, et al. "A LSTM-RNN method for the lithuim-ion battery remaining useful life prediction." 2017 prognostics and system health management conference (phmharbin). IEEE, 2017.
- Shi, Junchuan, Alexis Rivera, and Dazhong Wu. "Battery health management using physics-informed machine learning: Online degradation modeling and remaining useful life prediction." Mechanical Systems and Signal Processing 179 (2022): 109347. [CrossRef]
- Wei, Liangliang, et al. "State of Health Estimation of Lithium-ion Batteries Based on Stacked-LSTM Transfer Learning with Bayesian Optimization and Multiple Features." IEEE Sensors Journal (2024). [CrossRef]
Figure 1.
Overall Framework of SOH Estimation by LSTM.
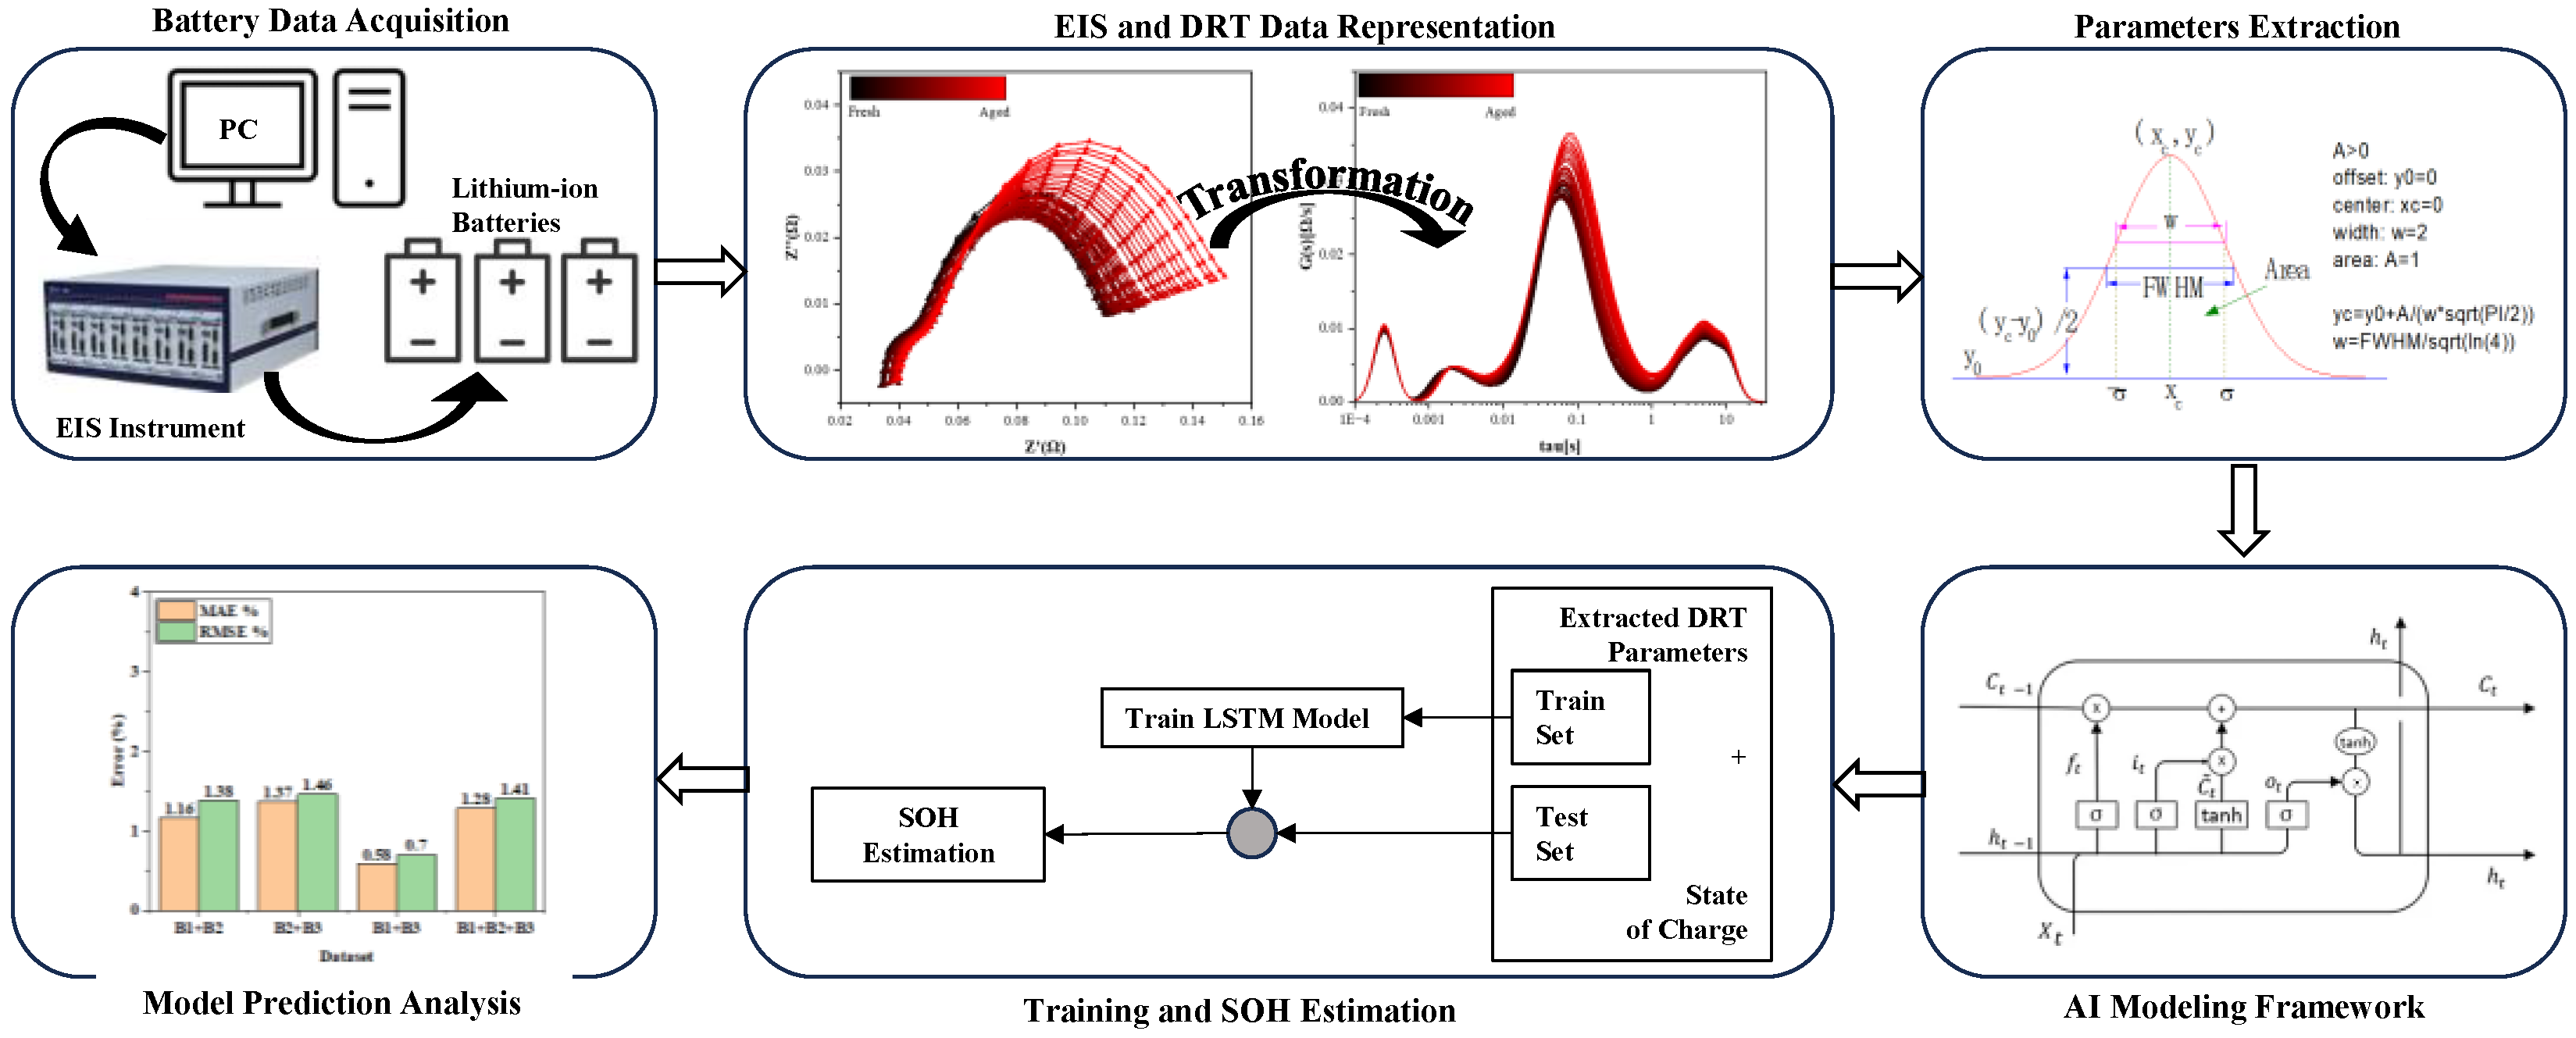
Figure 2.
Data Acquisition Network.
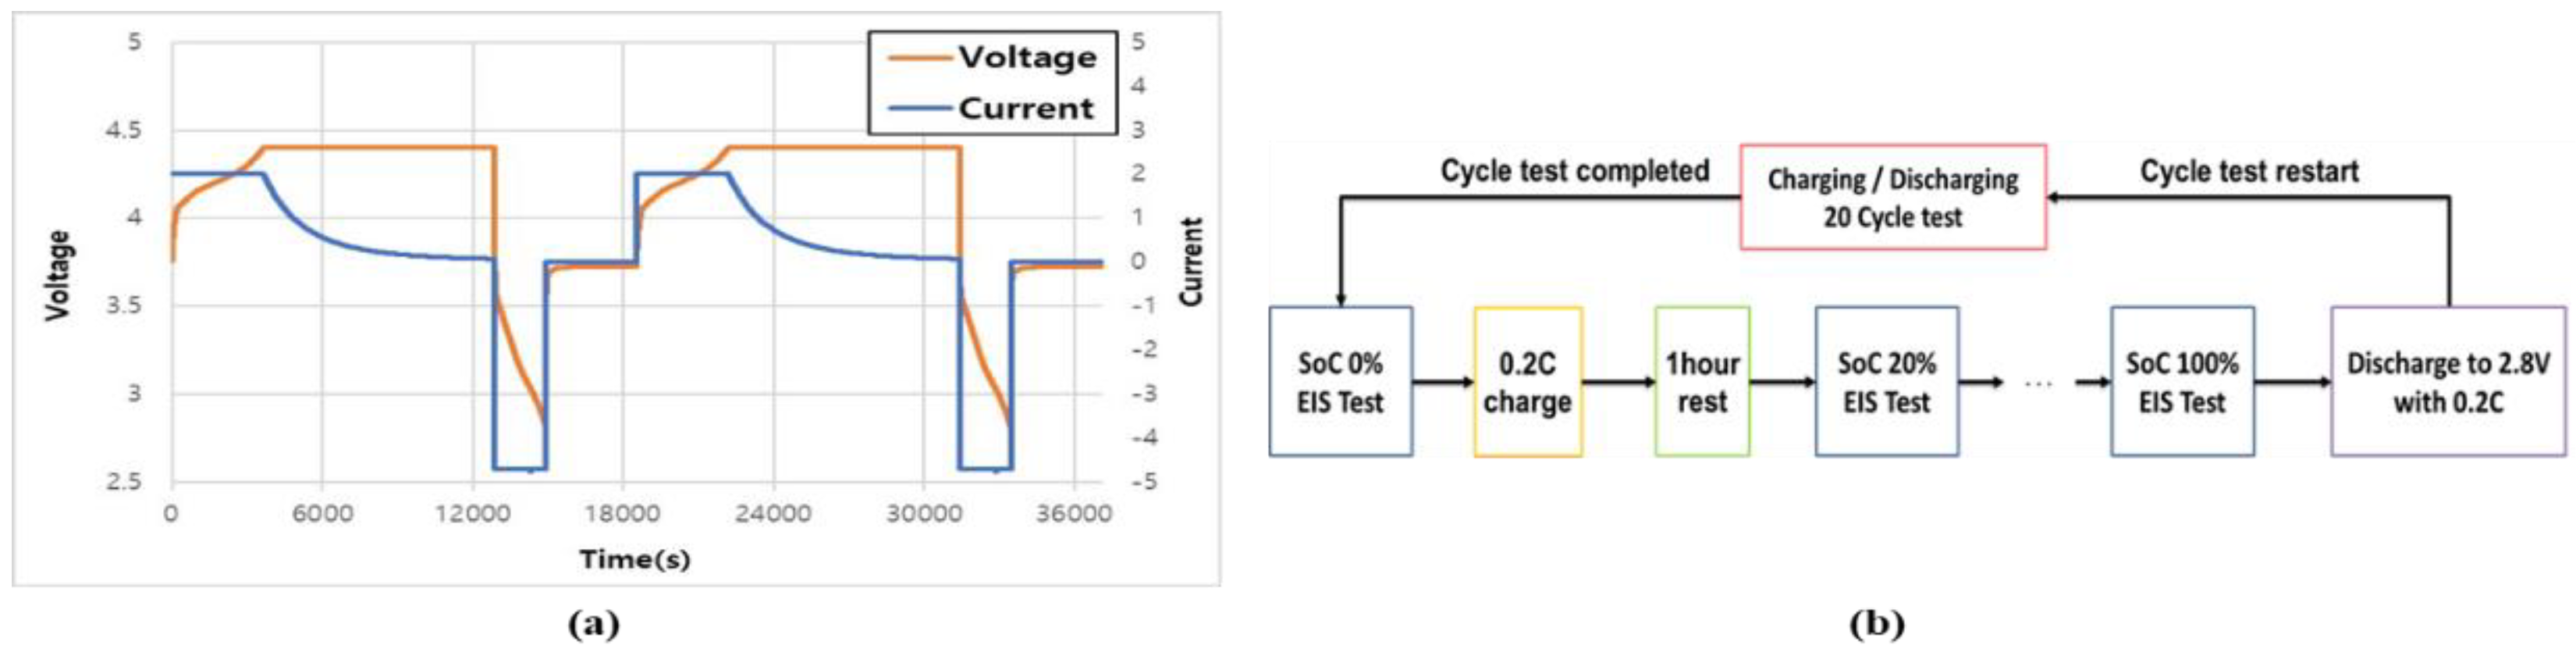
Figure 3.
Capacity Retention of Three Lithium-ion Cells with Cycling.
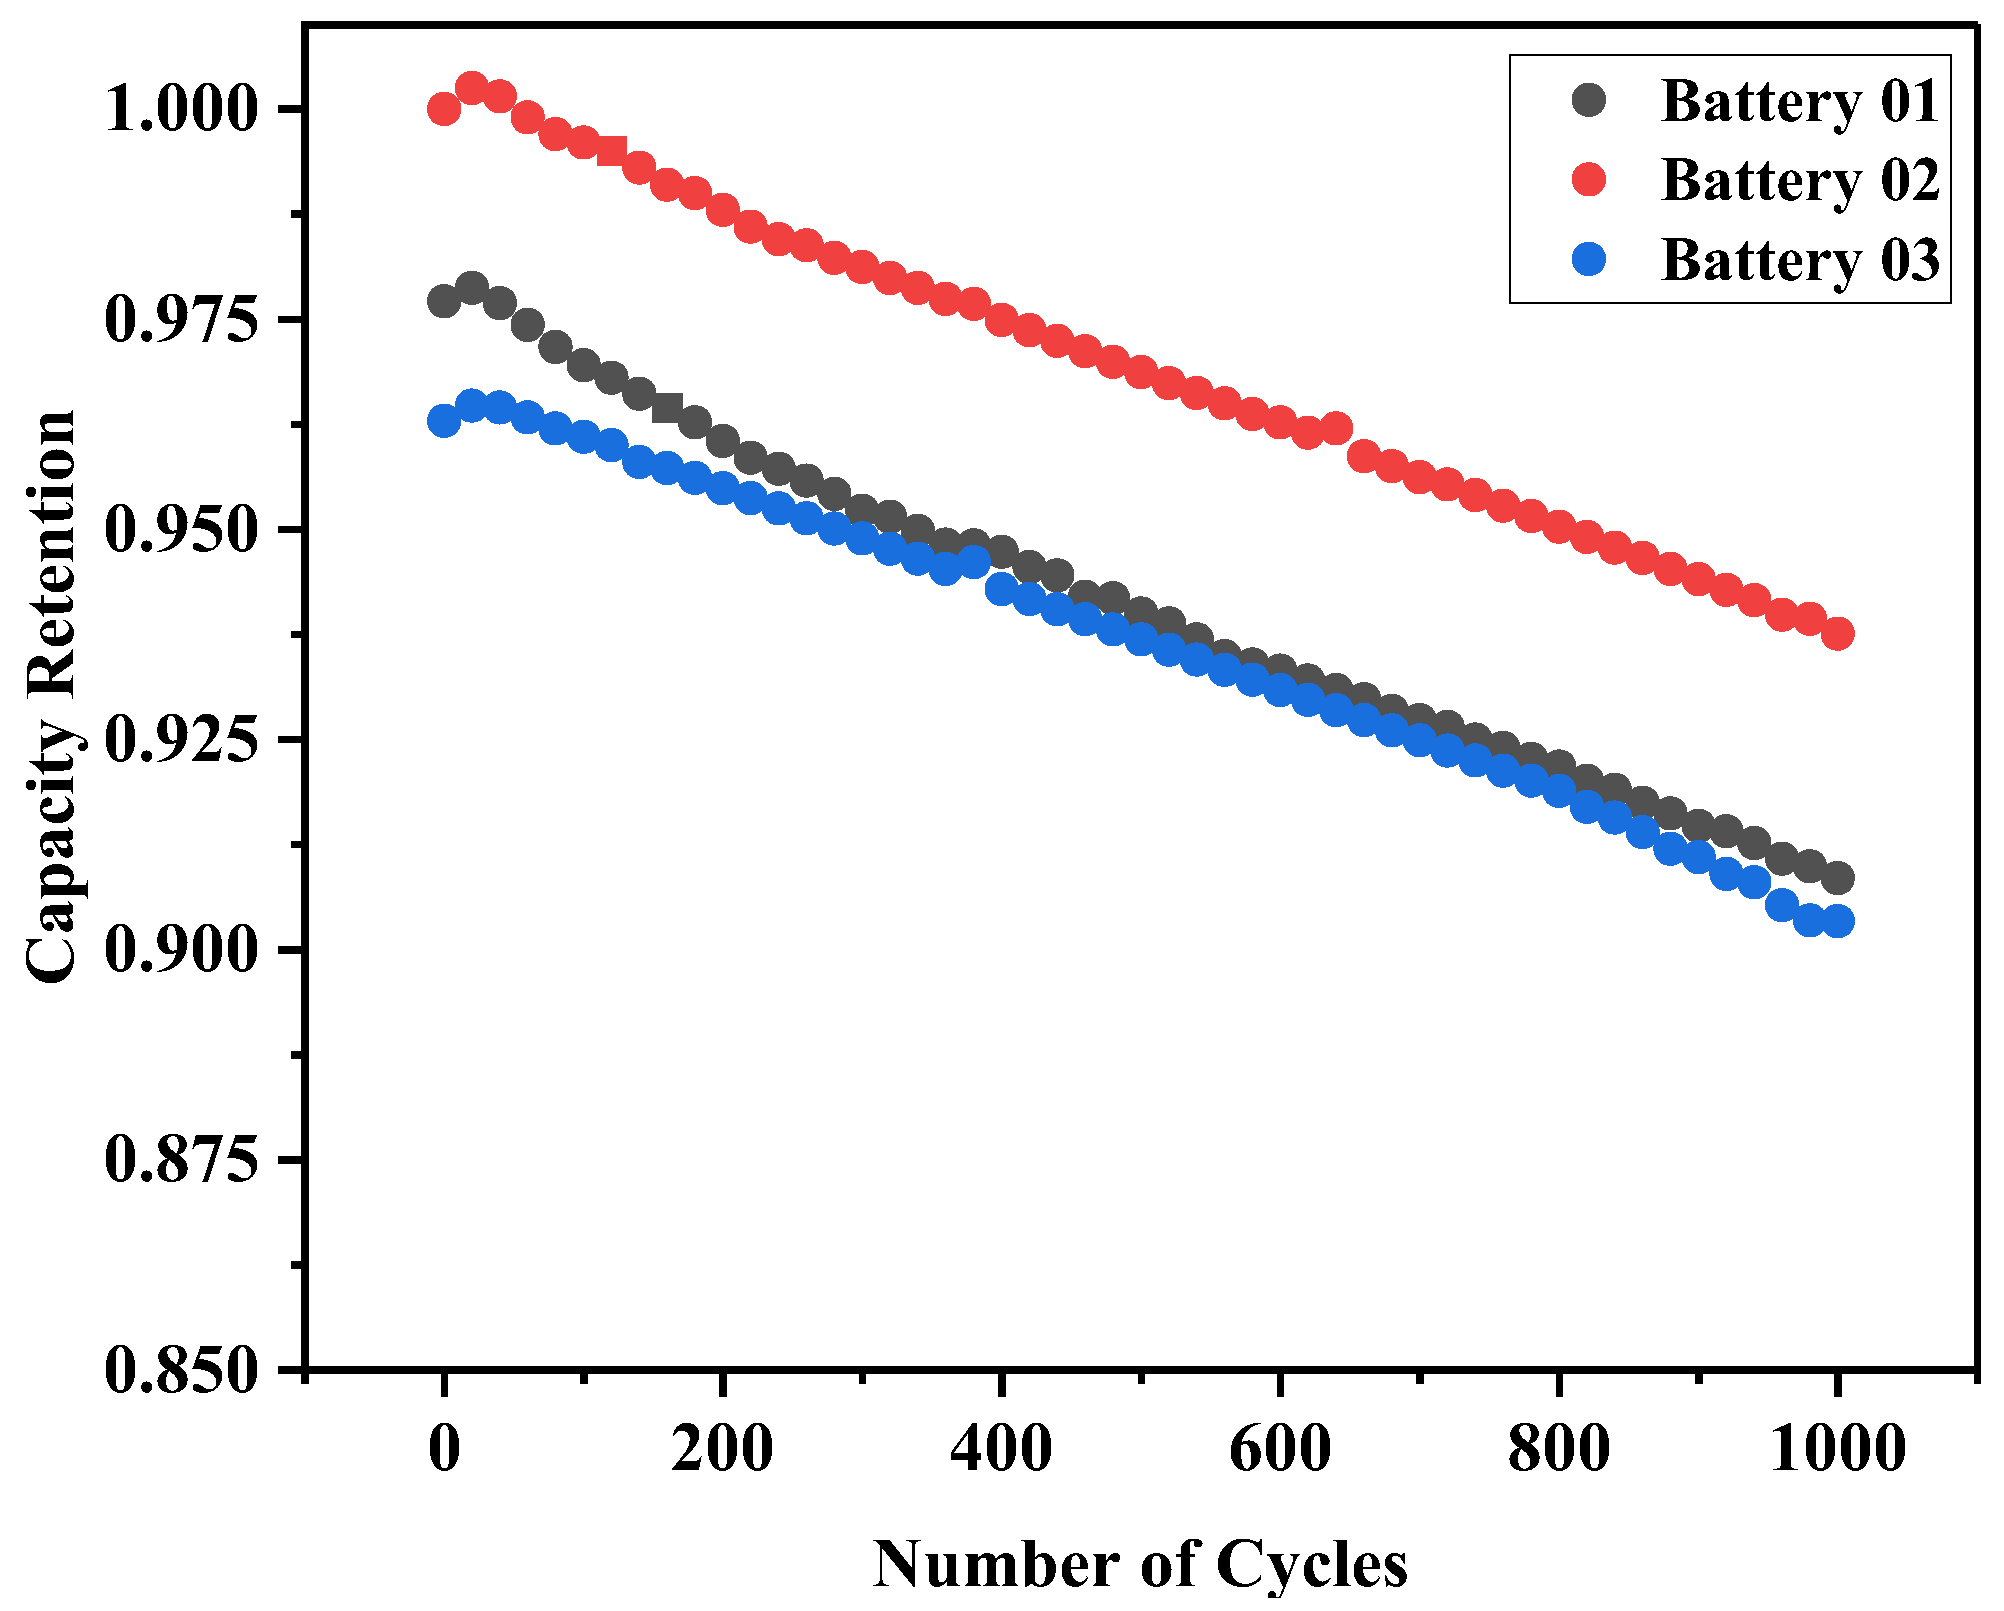
Figure 4.
Nyquist (left) and DRT (right) Plots of Galaxy S9+ Battery at 100% SOC.
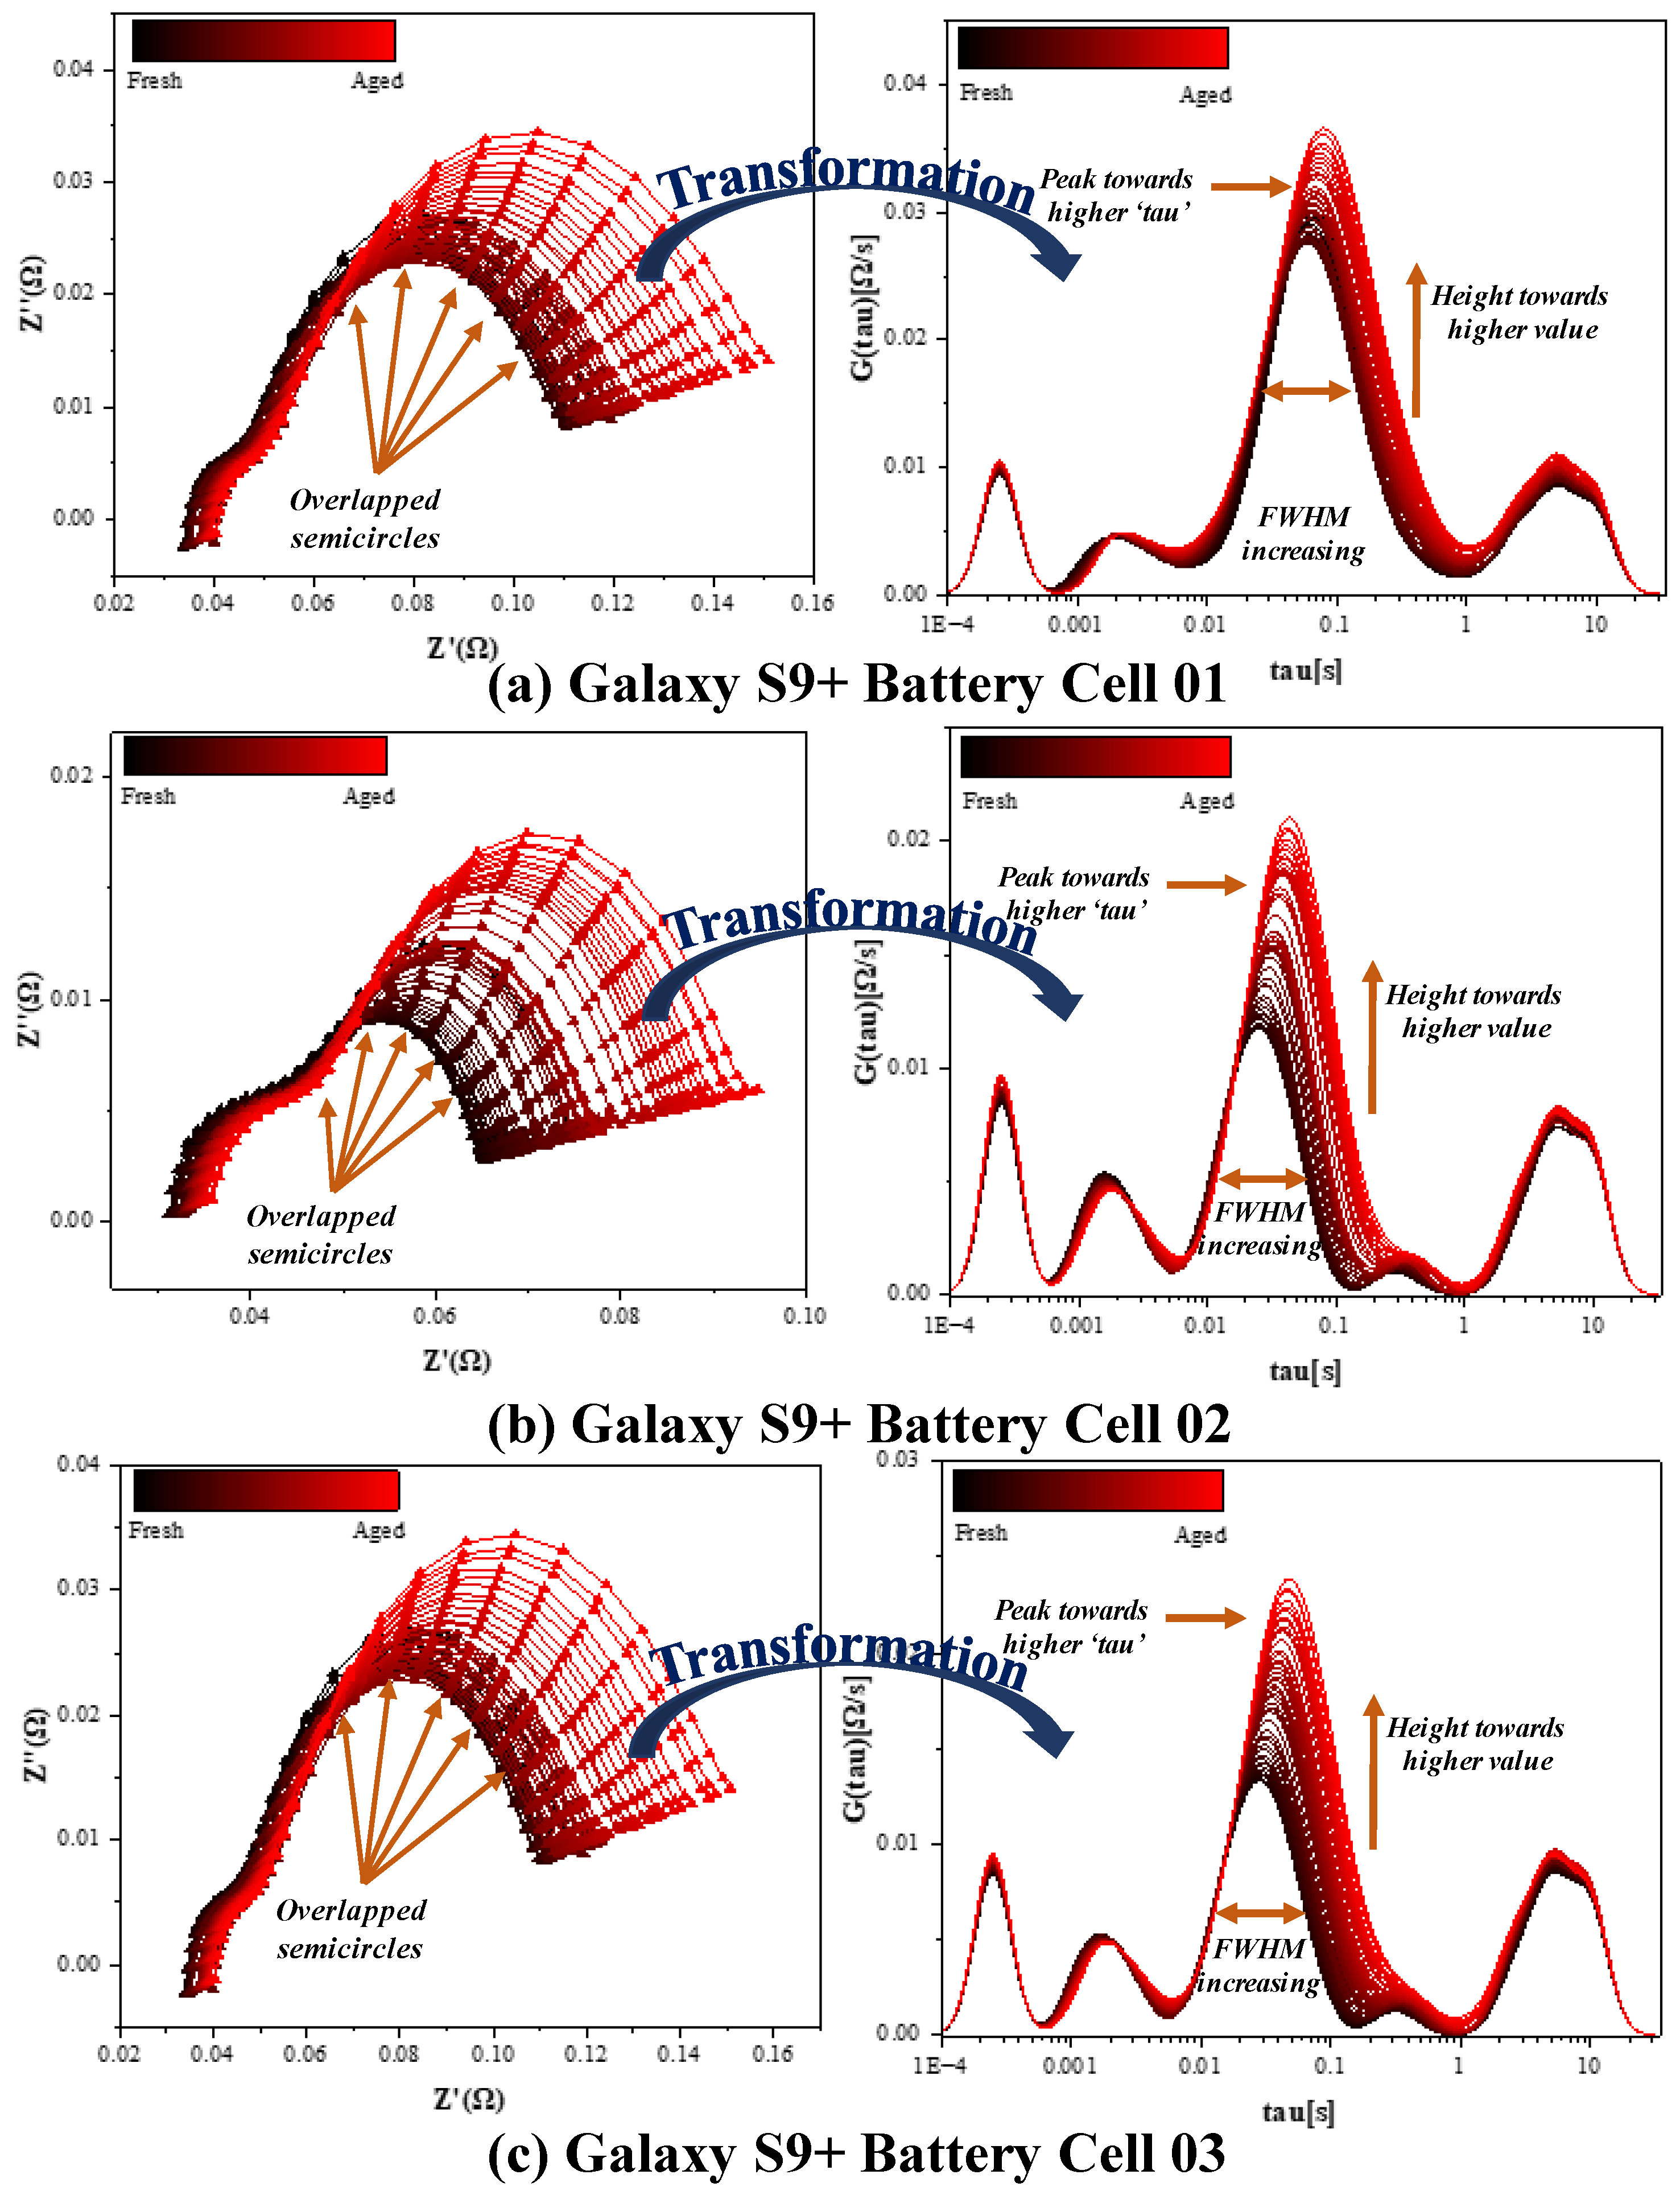
Figure 5.
Variation in DRT Parameters at Different SOCs over 1000-cycles for Cell-01.
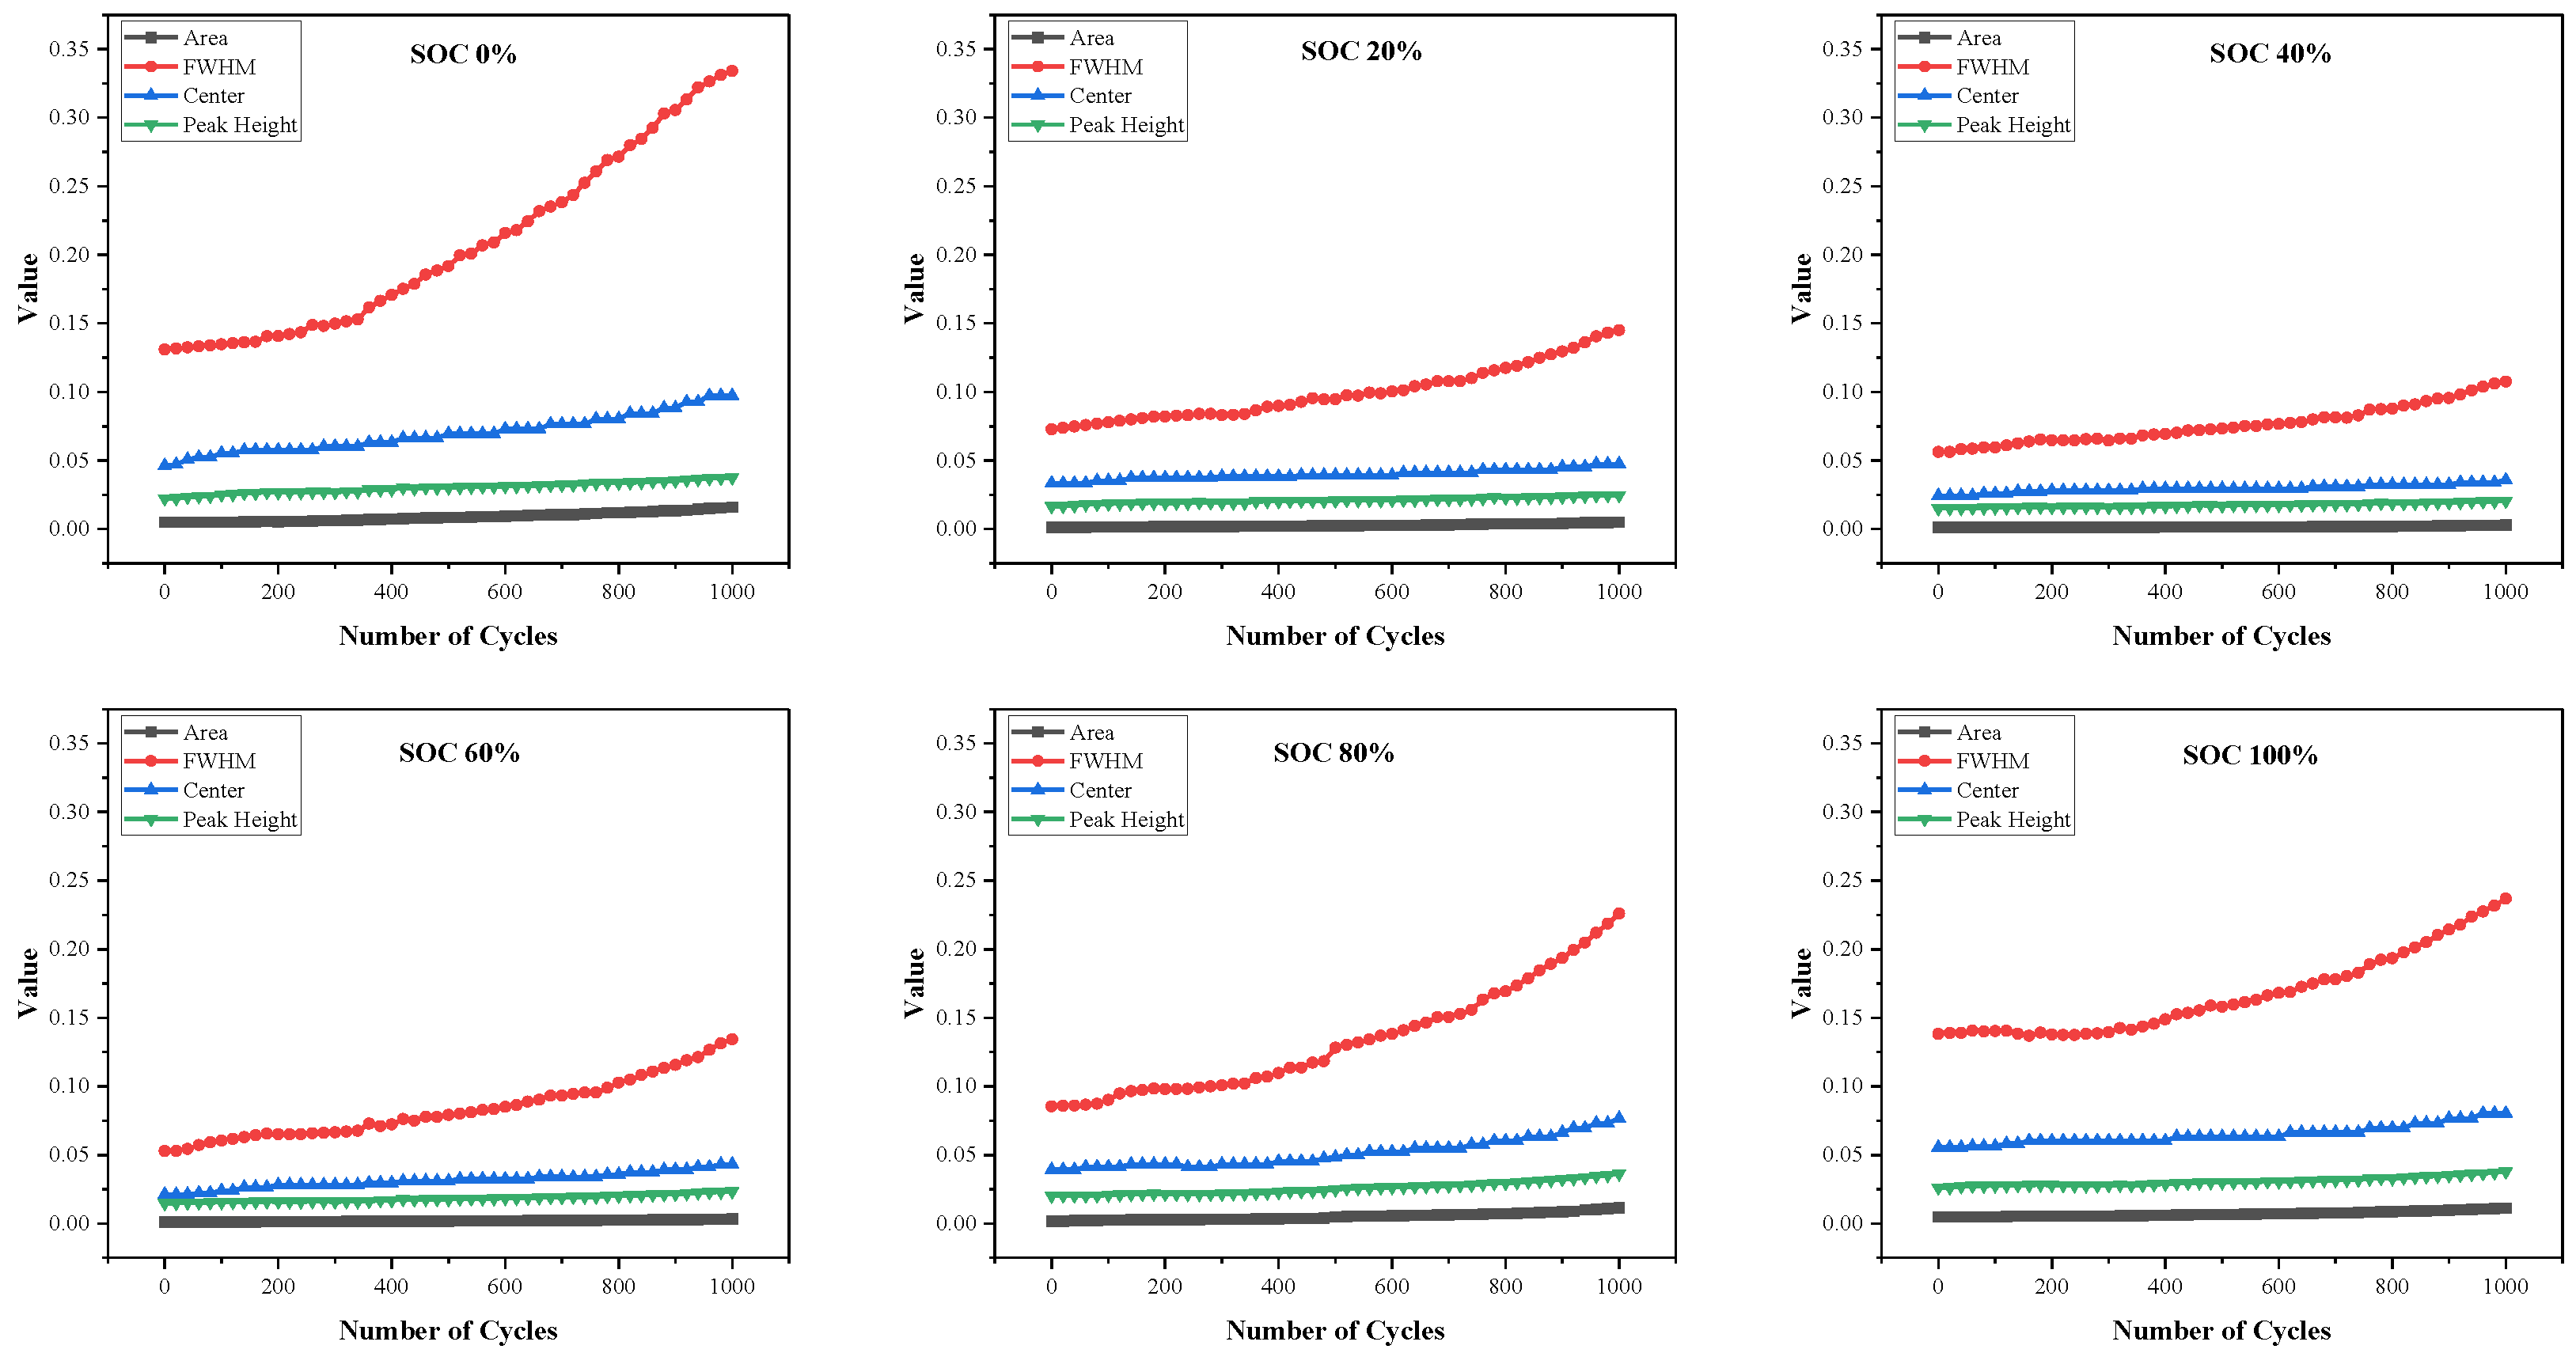
Figure 6.
Spearman Correlation Matrix.
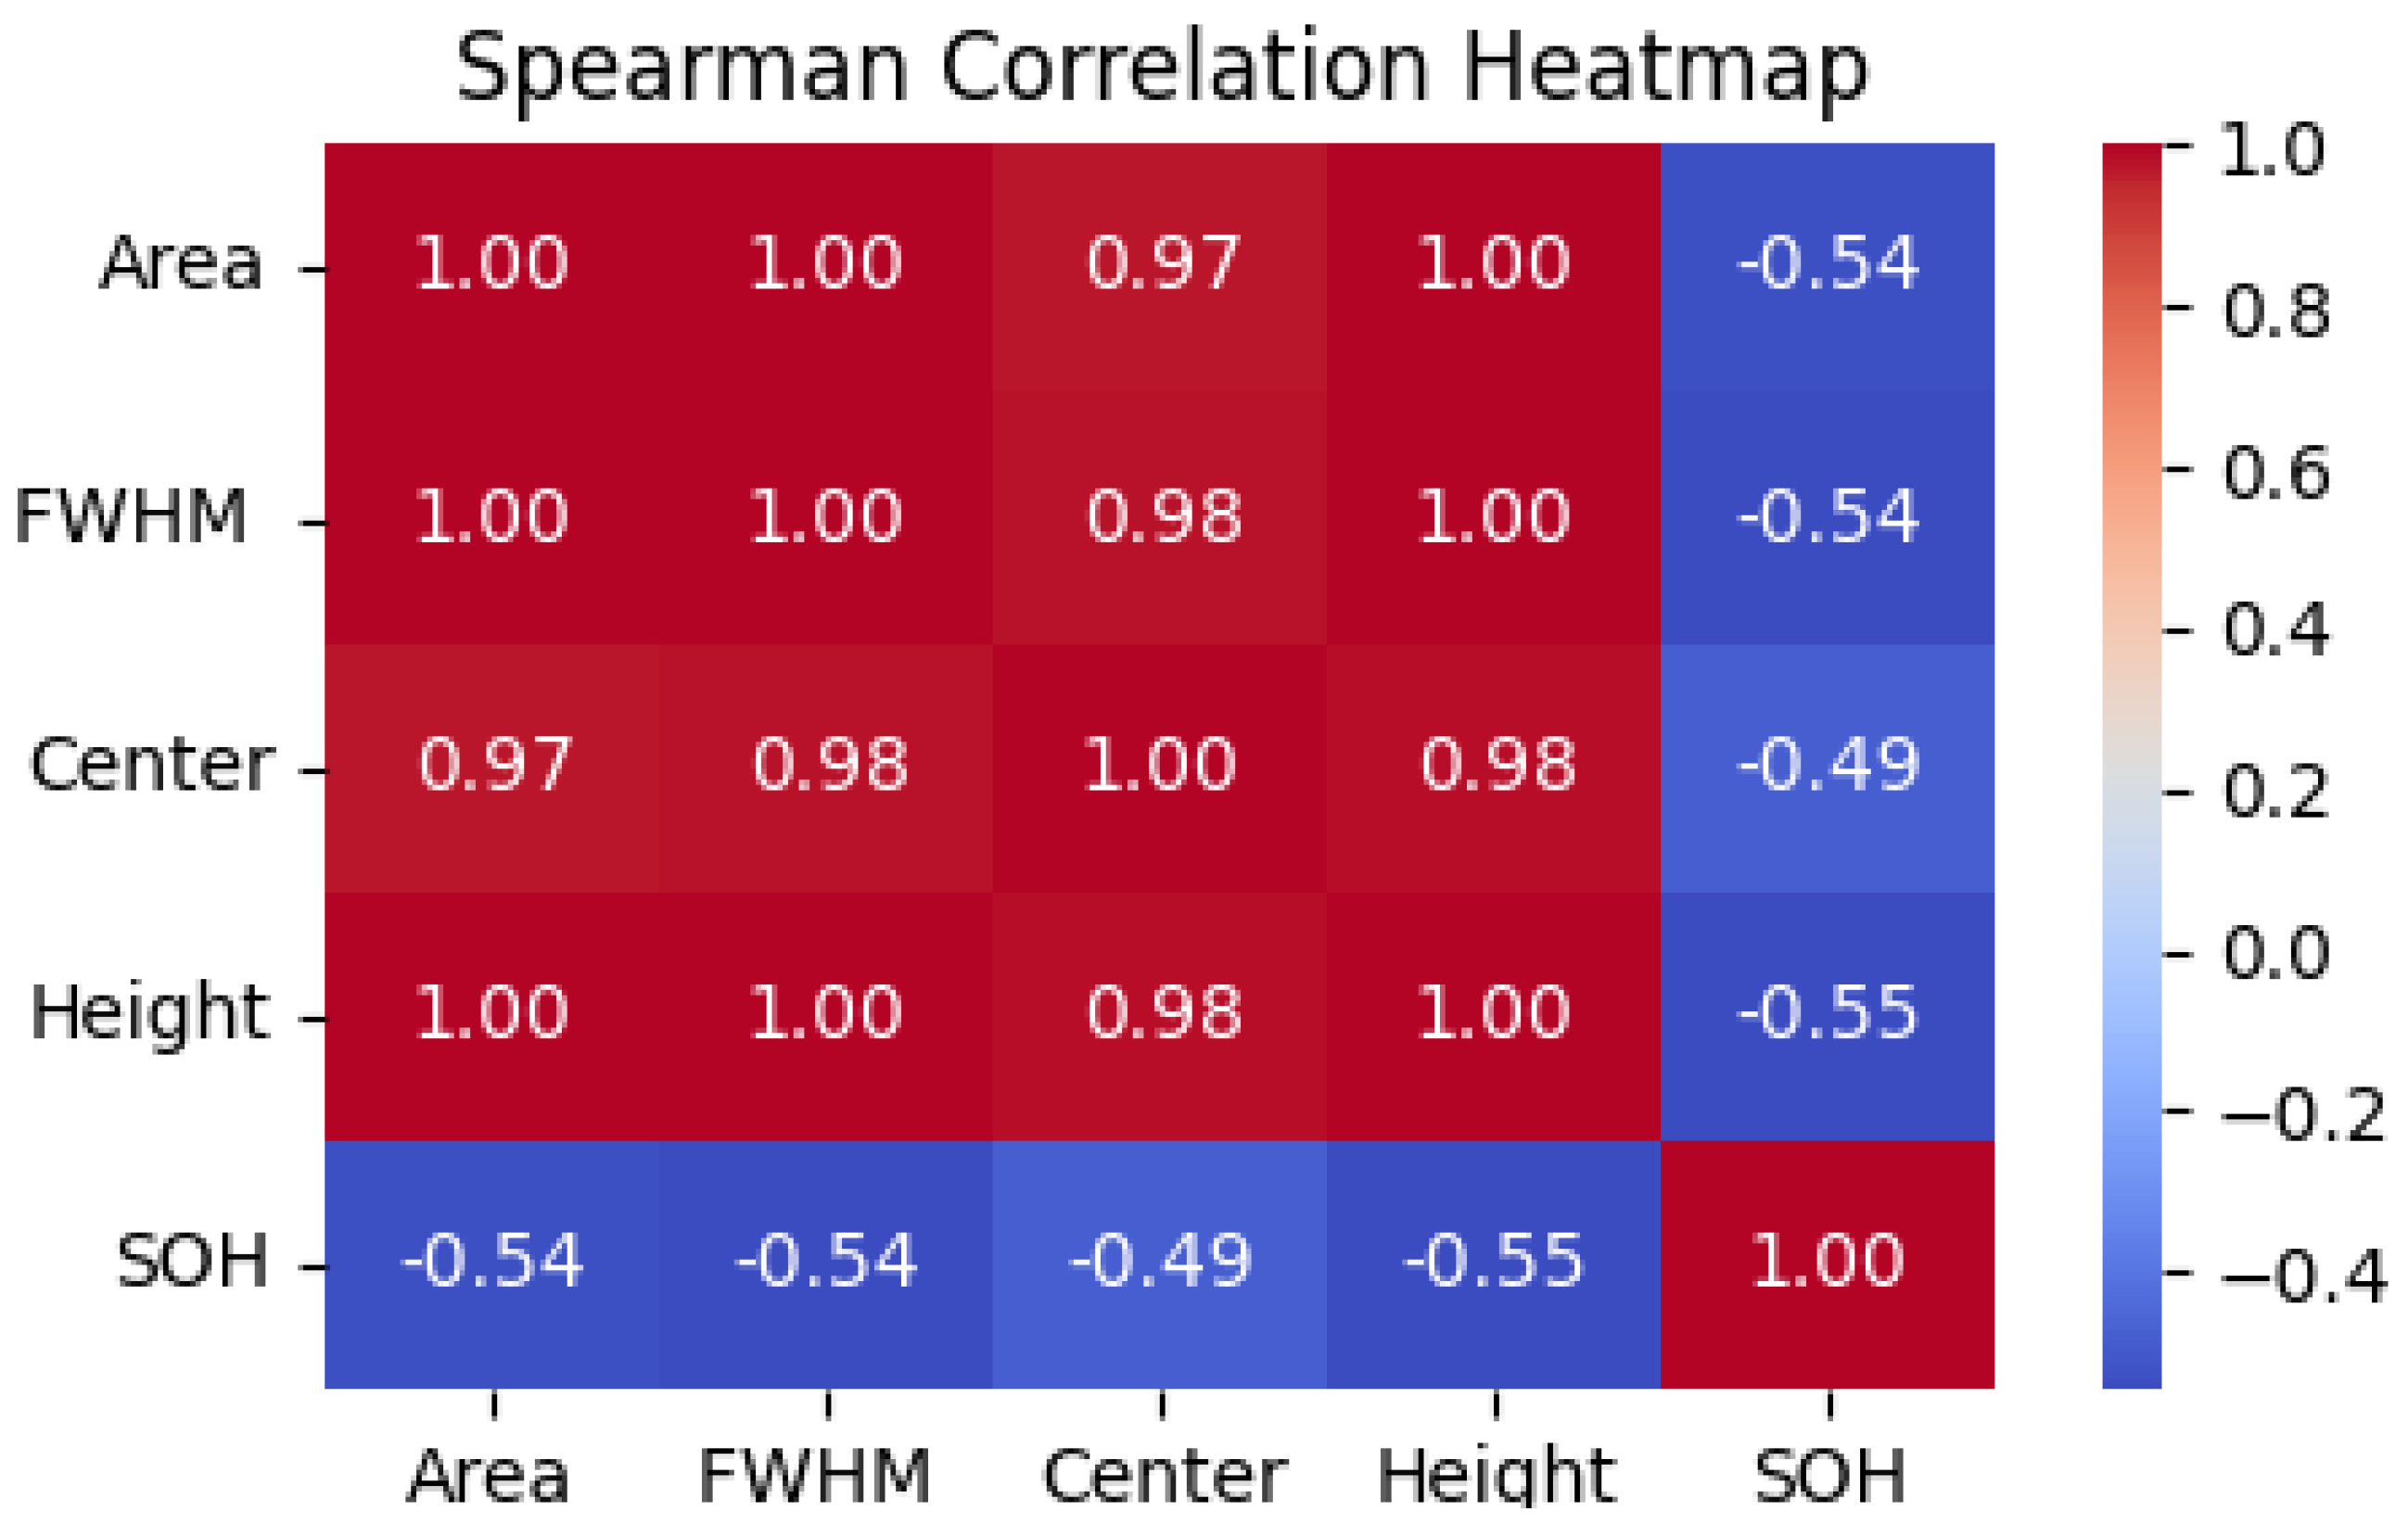
Figure 7.
The Cell Structure of LSTM.
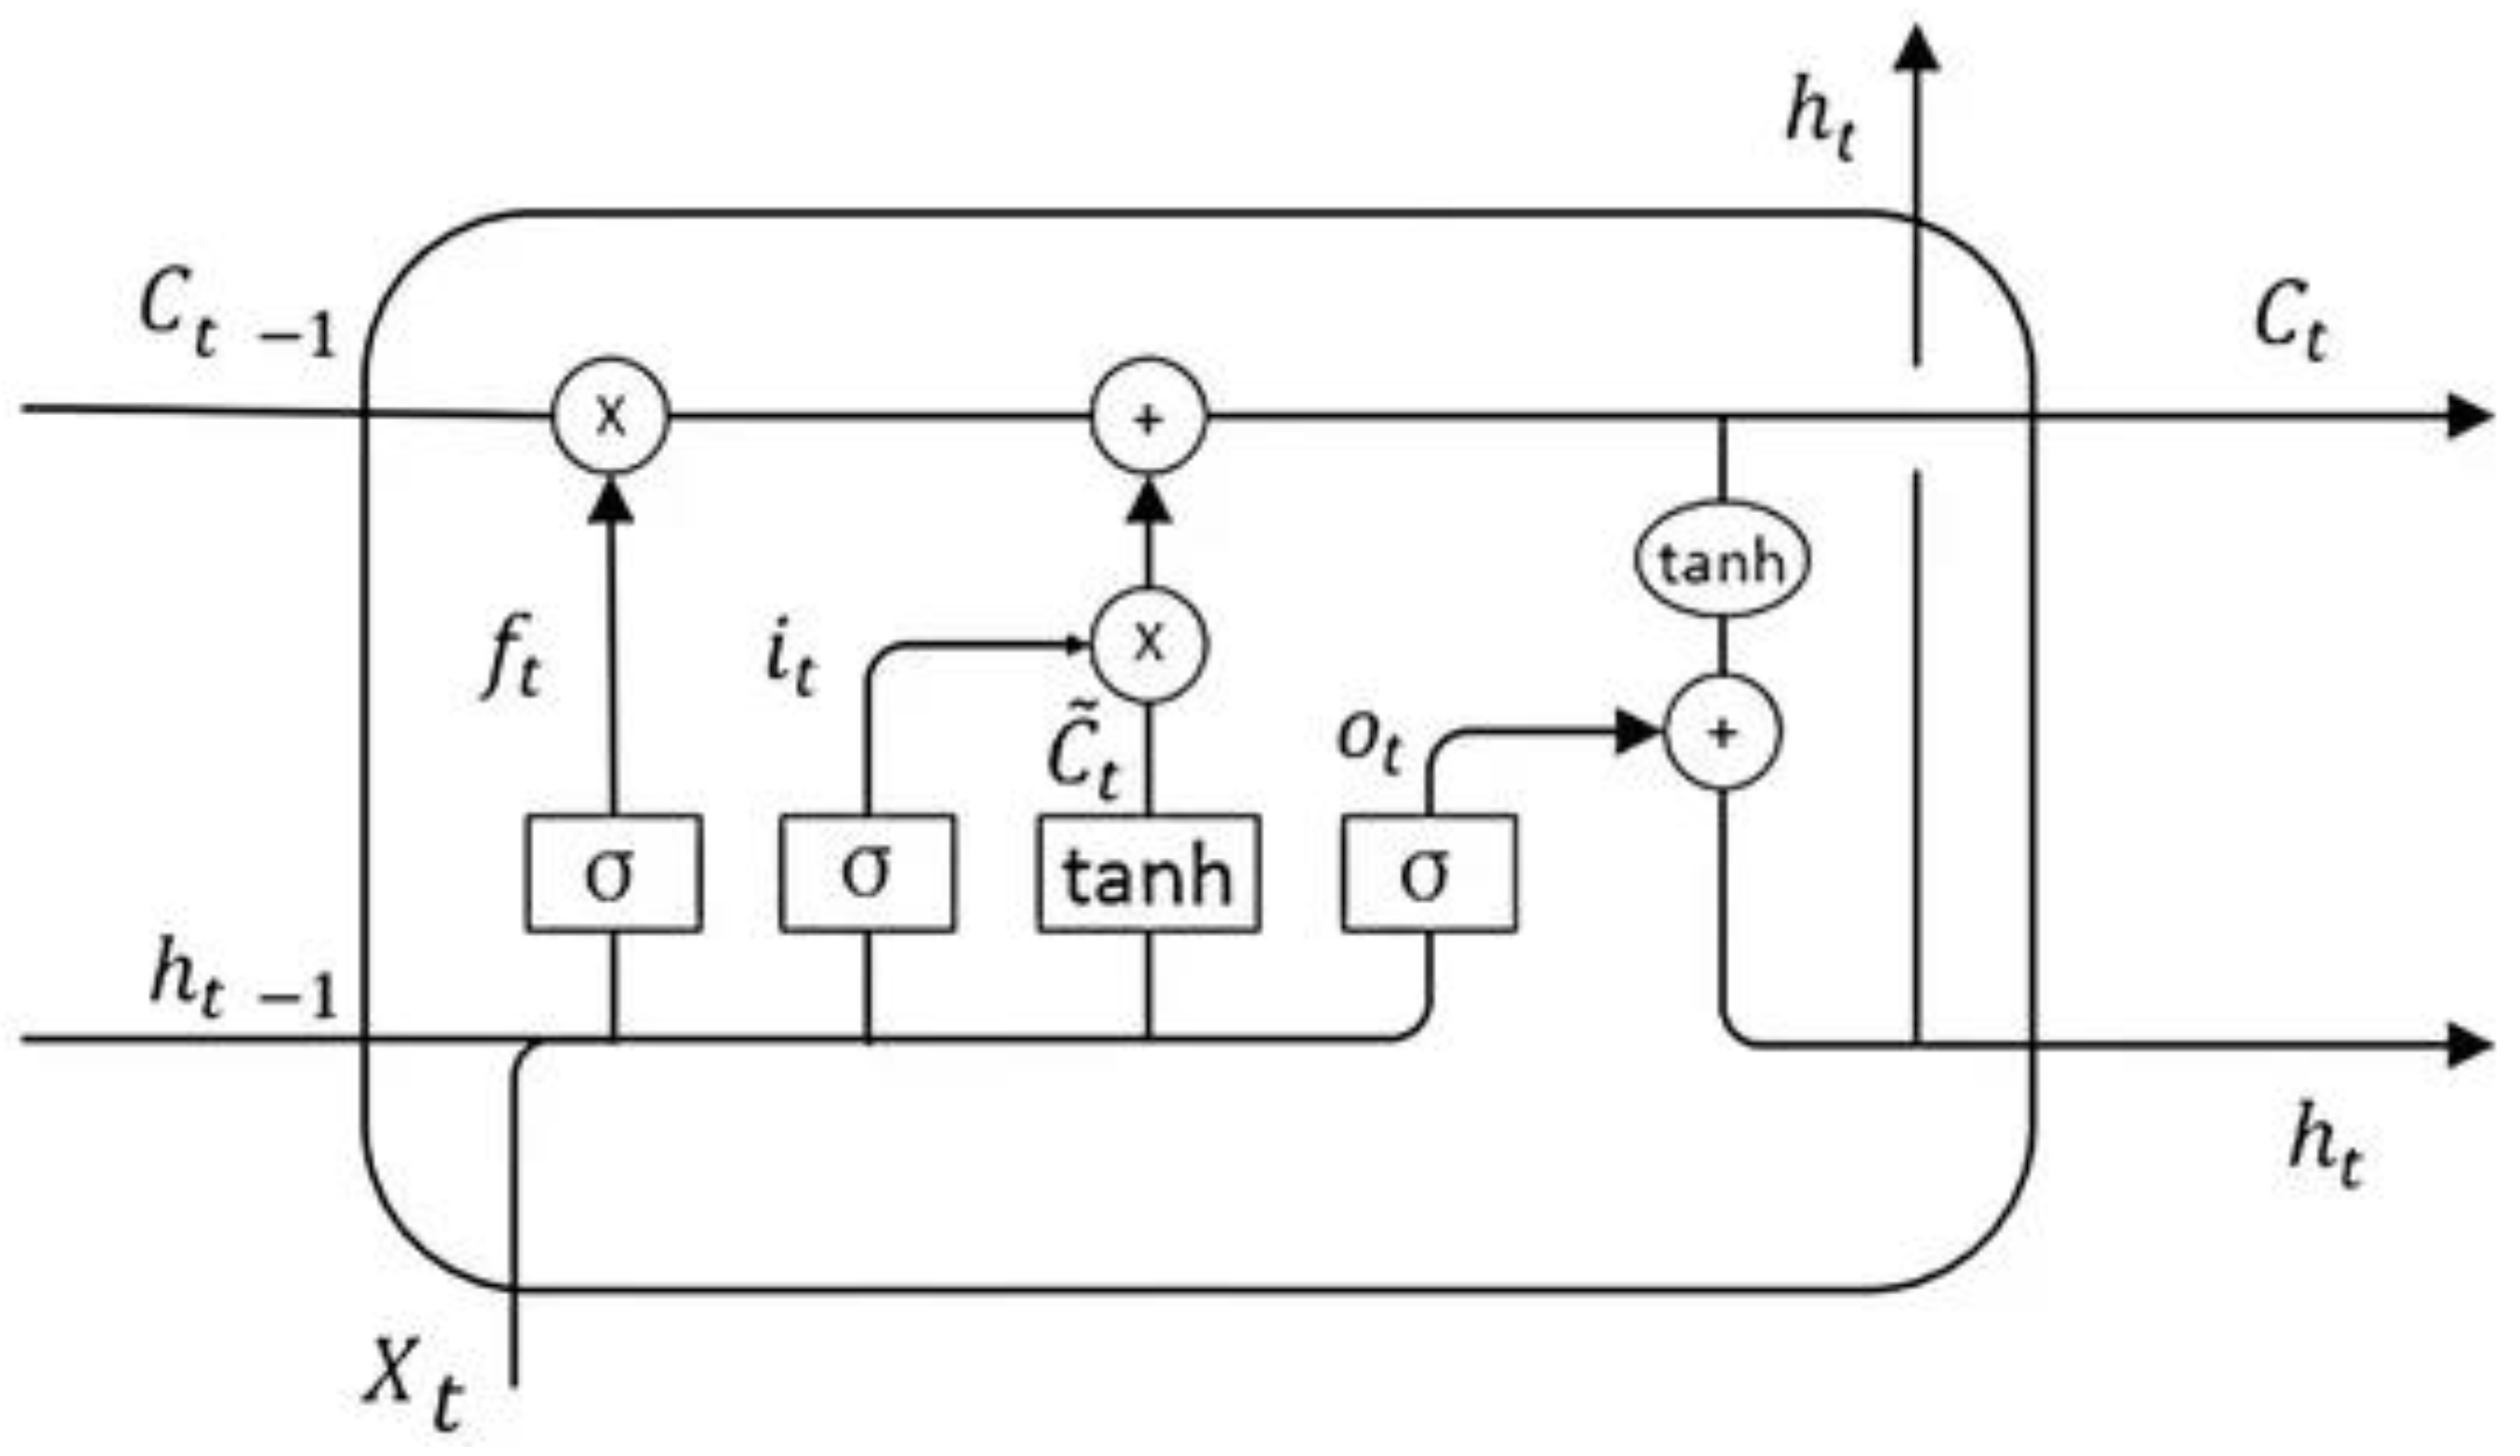
Figure 8.
SOH Estimation Framework based on LSTM Model.
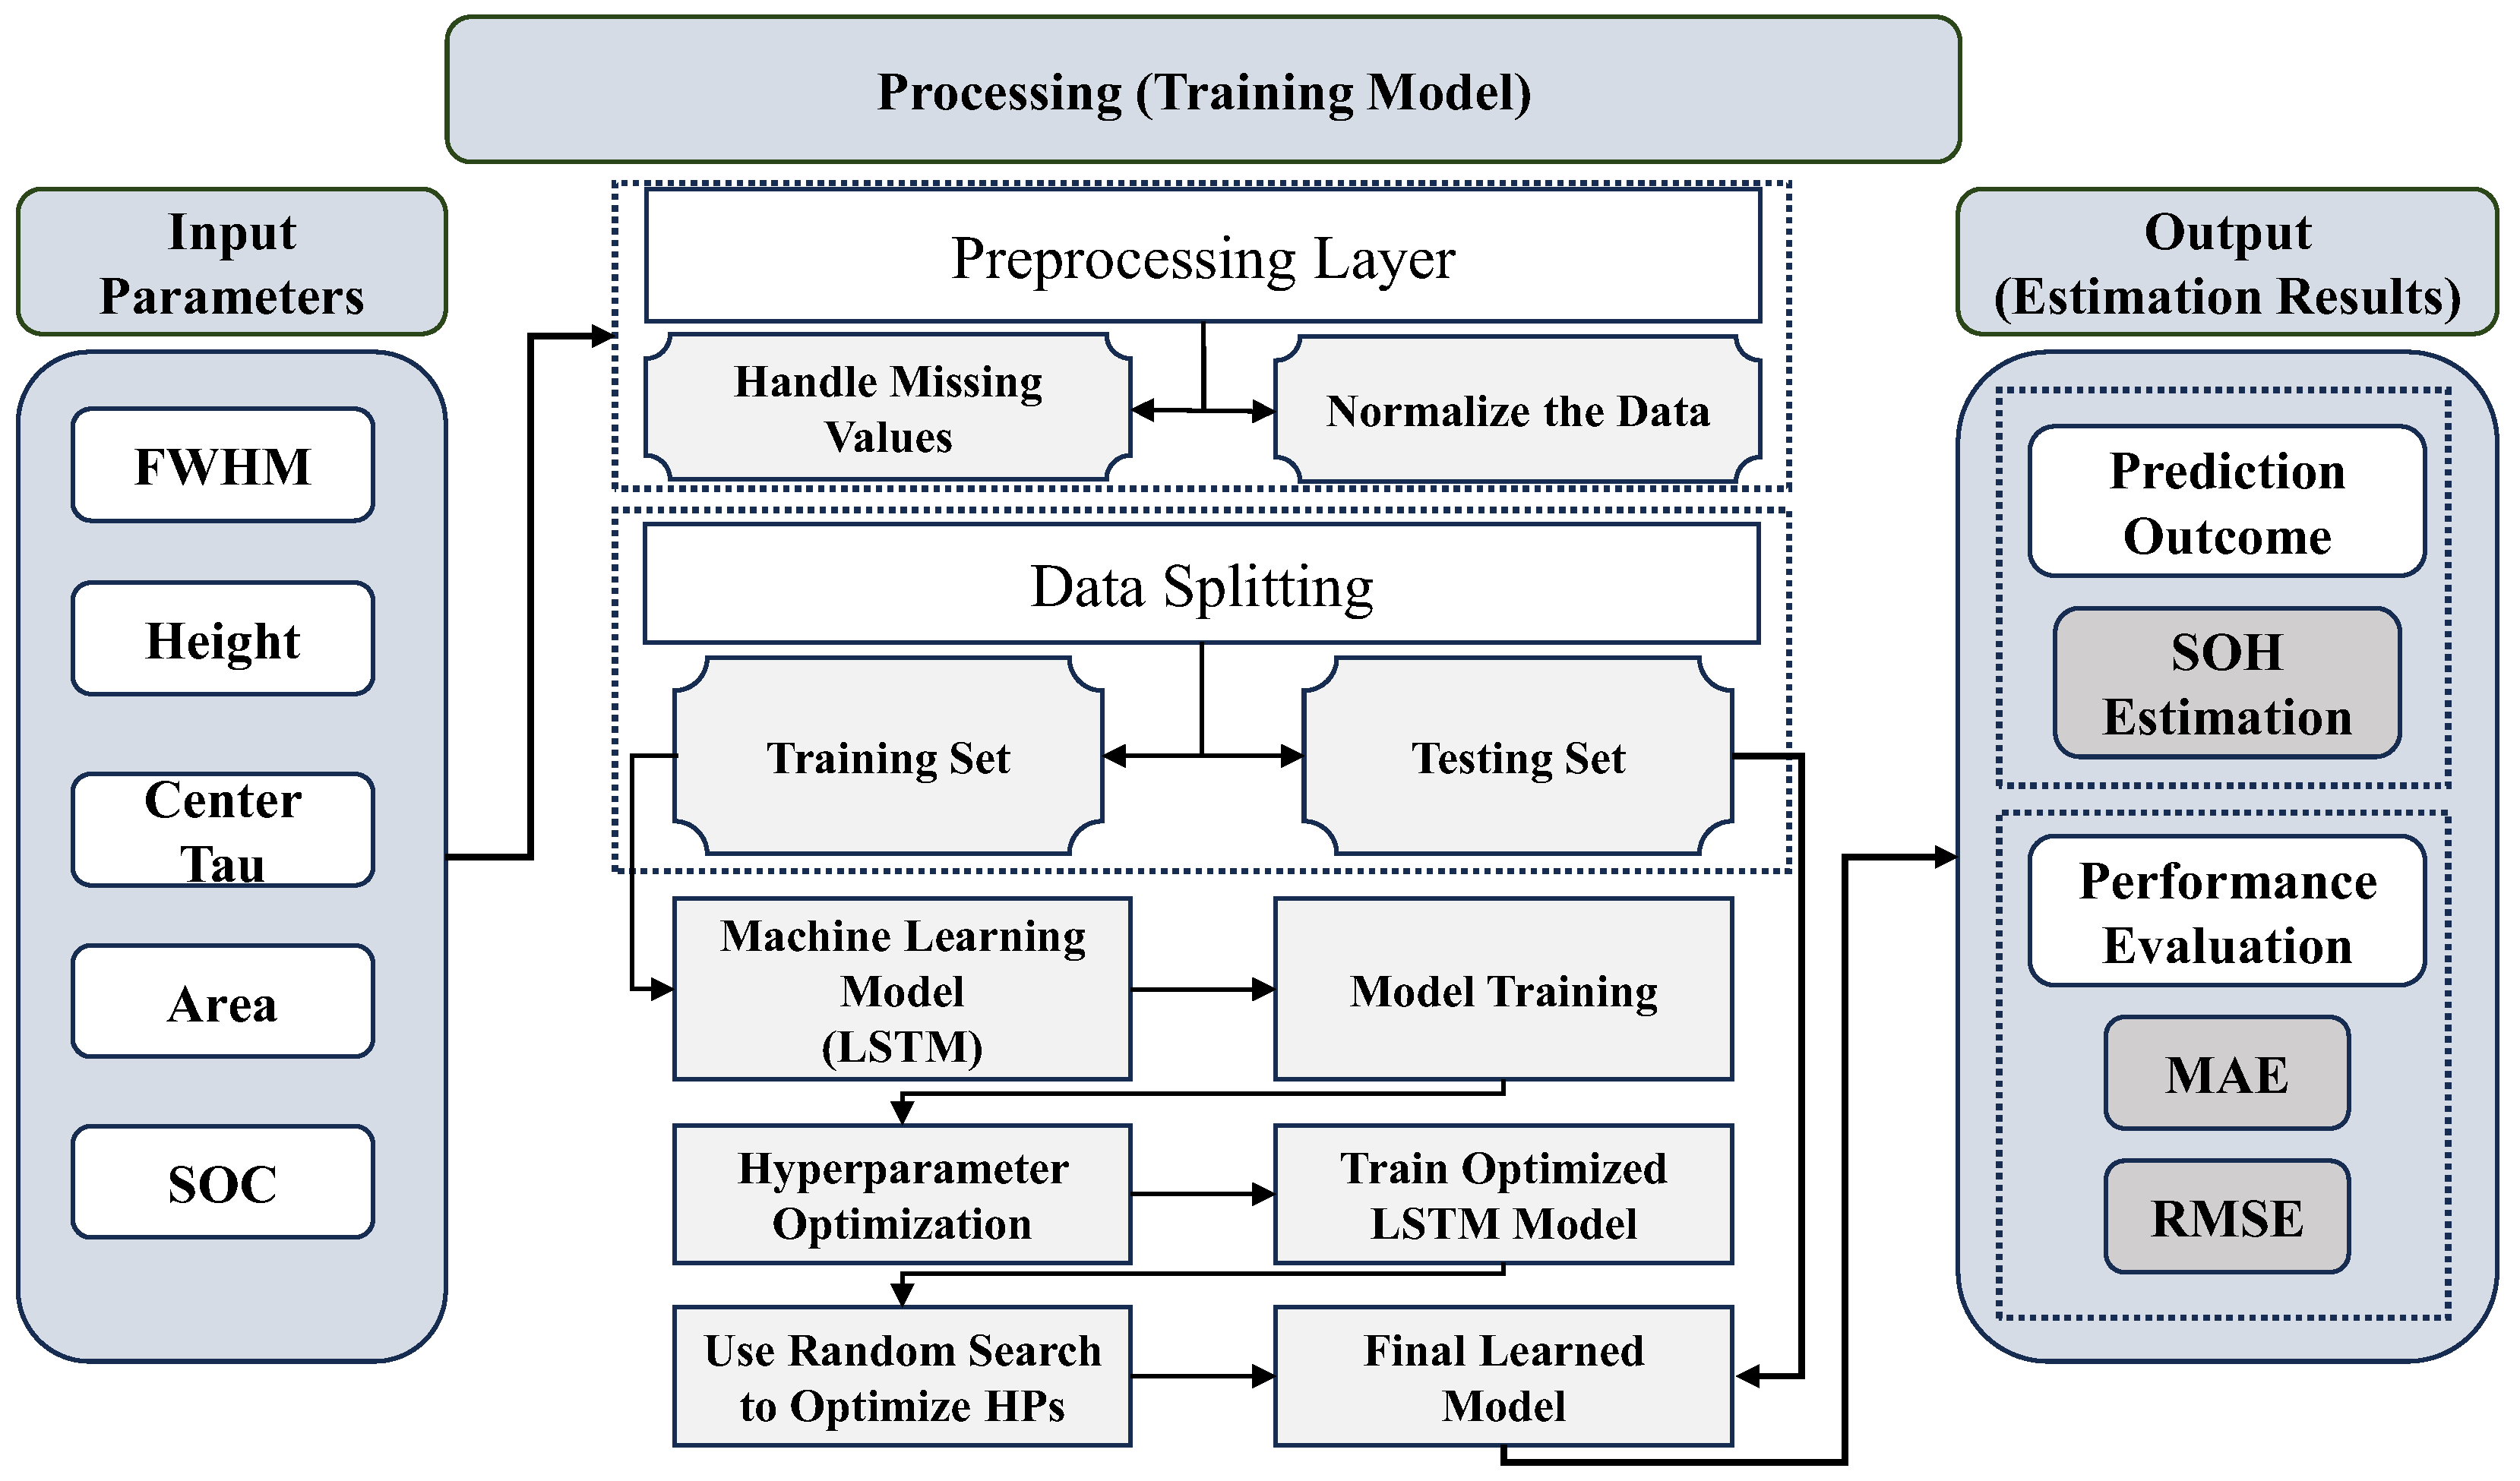
Figure 9.
SOH Estimation Performance of DRT trained LSTM Model.
Disclaimer/Publisher’s Note: The statements, opinions and data contained in all publications are solely those of the individual author(s) and contributor(s) and not of MDPI and/or the editor(s). MDPI and/or the editor(s) disclaim responsibility for any injury to people or property resulting from any ideas, methods, instructions or products referred to in the content. |
© 2025 by the authors. Licensee MDPI, Basel, Switzerland. This article is an open access article distributed under the terms and conditions of the Creative Commons Attribution (CC BY) license (http://creativecommons.org/licenses/by/4.0/).
Copyright: This open access article is published under a Creative Commons CC BY 4.0 license, which permit the free download, distribution, and reuse, provided that the author and preprint are cited in any reuse.


