
Submitted:
17 June 2025
Posted:
19 June 2025
You are already at the latest version
Abstract
This study presents a detailed analysis of the combustion dynamics of hydrogen and methane air mixtures at temperatures ranging from 298 K up to 423 K and at stoichiometric ratio, integrating experimental data of the pressure‐time histories obtained in a 20-liter closed vessel and detailed kinetic simulations by using three independent mechanisms: KiBo_MU from University of Bologna; a detailed chemical kinetic mechanism from University of San Diego; and a mechanism from Lund University. Key parameters, including the maximum explosion pressure (Pmax), the maximum rate of explosion pressure rise (dP/dt)max and the laminar burning velocity (LBV), were evaluated. The study provides some insights into combustion dynamics within the given temperature range, thus offering a comparative evaluation of the predictive accuracy of current kinetic models and laminar burning velocity correlations.
Keywords:
hydrogen
; methane
; laminar burning velocity
; deflagration
; kinetic modeling
1. Introduction
Hydrogen-air and methane-air mixtures are gaining traction across multiple sectors of the process industry, including natural gas distribution networks, compressed natural gas (CNG) vehicle fueling stations, gas storage facilities and combined-cycle power plants, due to their potential to reduce carbon emissions while maintaining high energy density and combustion efficiency. However, the safe handling of these light gases throughout their entire lifecycle (production, storage, transport, and end-use) remains a critical challenge. This work investigates the deflagration dynamics for these mixtures at elevated temperatures (298-423 K) and provides key quantitative parameters: laminar burning velocity (LBV), maximum explosion pressure (Pₘₐₓ), and deflagration index (KG), that underpin explosion risk assessments and inform the design of mitigation measures such as vent sizing, flame arrestors, and safe separation distances in process industries (Wako et al, 2020; Pio et al., 2022; Porowski et al, 2024).
The laminar burning velocity (LBV) of hydrogen-air as well as methane-air mixtures has been extensively studied, with a particular focus on the influence of various conditions, including equivalence ratios, initial pressures and temperatures (Cammarota et al., 2009; Pio et al., 2018; Salzano et al., 2018; Porowski et al., 2023). ) as well as hydrogen-methane-air ratio (Nilsson et al., 2017; Hu et al., 2009). Another investigation, employing both experimental and numerical approaches, has analyzed the LBV of mixtures of methane, ammonia, and air using kinetic models (Okafor et al., 2018). Other researchers have also explored the laminar burning velocity and burned gas Markstein length of methane–air mixtures diluted with N₂, H₂O, and CO₂ (Duva et al., 2020). Also, the effects of hydrogen addition and carbon dioxide dilution on LBV for methane-air mixtures have been studied experimentally and numerically (Ueda et al., 2021), highlighting the significant impacts of these additives (AL-Khafaji et al., 2023; Varghese et al., 2019). There are also several studies with experimental results of LBV using the Bunsen flame method at 373 K, with kinetic models accurately predicting LBV for methane-air premixed flames containing DMMP (Li et al., 2019).The correlation between LBV and the burned gas Markstein length of methane–air mixtures shows that LBV increased by 23–29% with a temperature rise from 373 K to 423 K, and by 22–34% from 423 K to 473 K (Yang et al., 2023). A comprehensive review highlighted the use of polynomial regression curves to fit LBV data from various publications, including those focused on methane–air mixtures (Halter et al., 2010; Ihme et al., 2022; Porowski et al., 2024). Akram et al. (2013) demonstrated that slightly richer methane–air mixtures exhibit a minimal temperature exponent and an increased adiabatic flame temperature. This behavior arises because the normalized sensitivity to methane in the dominant reactions increases with temperature for mixtures near the lean flammability limit, while it slightly decreases for stoichiometric mixtures. It is recommended to avoid assuming a linear change in the temperature exponent as a function of the equivalence ratio. Maximum flame speed has been observed in slightly richer methane–air mixtures, aligning with computational results. However, this contrasts with experimental findings, which indicate peak flame speeds for either lean or very rich mixtures at high temperatures. This discrepancy is attributed to the inaccuracy and variability of the temperature exponent across different equivalence ratios. Finally, Ghosh et al. (2022) measured the LBV of hydrogen–air mixtures under stoichiometric conditions across a temperature range of 160 to 295 K. Their findings revealed that the LBV decreased by 50% when the unburned mixture temperature was reduced by 100 K. This behavior followed a power-law relationship with an exponent of 1.571, determined for temperatures above ambient conditions. In this study, the temperature dependence on the LBV of hydrogen-air mixtures as well as methane-air mixtures up to 423,15 K (Mitu et al., 2021).
2. Experiments and Kinetic Modeling
The experimental measurements reported in this work were collected by means of the 20-liter combustion vessel reported in Figure 1. Also, Table 1 shows a detailed description of the experimental setup, which comprises the following components. The combustion chamber was designed as a spherical stainless-steel container with a volume of 20 dm³. Stainless steel was chosen for its corrosion resistance against reactive substances and combustion by-products, as well as its high-temperature durability, both crucial for combustion testing. The equipment was carefully selected to withstand pressures of up to 15 bar, ensuring durability and reliability under demanding experimental conditions. The spherical chamber is equipped with specialized ports for introducing and removing test gases and injecting or extracting the methane–air mixture. This setup allows precise control of the gas composition within the chamber, which is essential for accurate and reproducible experimental results. Such control ensures that the experimental conditions replicate real-world scenarios, facilitating the transfer of findings to practical engineering applications. Temperature within the chamber is monitored using a thermocouple positioned to avoid interference with the flame path. Temperature readings are displayed on a monitor located at the base of the apparatus for immediate observation.
To minimize heat loss and maintain stable conditions, the chamber is equipped with a water jacket, which ensures uniform temperature distribution and enhances experimental precision and reliability. The water jacket also facilitates rapid cooling after experiments, expediting the research cycle. The ignition system, centrally located in the test volume, uses a 0.2 mm nickel–chromium (Ni-Cr) wire ignited by an electric arc to initiate combustion. Ni-Cr was chosen for its high heat resistance and chemical stability. The chamber also includes a mechanical mixer, which uses a partial pressure technique to prepare a homogeneous test mixture. This ensures an even distribution of components, critical for achieving consistent and reliable results. A heat-resistant quartz glass observation window allows direct inspection of the combustion process. Quartz glass was selected for its ability to withstand high temperatures, enabling long-term observation without risk of damage. This visual access is invaluable for qualitative analysis and verification of the combustion process. An advanced data acquisition system is integrated to collect key parameters during combustion. This system includes a calibrated pressure transducer, a signal amplifier, and a recording unit, ensuring precise measurements across a wide pressure range. The collected data is transferred to a connected computer with specialized software for comprehensive analysis. This software enables accurate data processing, identification of key trends, and modeling of combustion dynamics (Porowski et al., 2024).
This advanced system facilitates a detailed study of combustion dynamics, enabling in-depth analysis of experimental results and a more profound understanding of combustion processes. By leveraging these insights, predictive models can be developed to optimize real-world combustion systems, improve efficiency, and minimize environmental impact. The data collected also serves as a valuable resource for validating numerical models, enhancing their reliability and applicability in engineering practice. In this study, we meticulously adhered to experimental procedures using the described equipment (Section 2.1) to ensure accurate and reliable data collection. These efforts established a robust foundation for observations and subsequent analyses (Yang et al., 2023).
The numerical investigations performed in this work include different strategies devoted to the analysis of the fuel reactivity in the closed vessel, based on empirical correlations and detailed chemical kinetic mechanisms. To this end, laminar burning velocity (LBV) as a function of the unburned properties of the mixtures was calculated, as described below. The operative conditions (intended as fuel composition, fuel-to-oxidant ratios, initial temperatures and pressures) included in the experimental campaign were tested numerically, as well. Numerical simulations for the evaluation of the LBV for hydrogen and methane were performed using three detailed chemical kinetic models: a chemical kinetic mechanism developed by the University of Bologna (KiBo_MU) (Wako et al., 2022), a detailed chemical kinetic mechanism from the University of San Diego (C.R. Group, 2016), and a mechanism from Lund University developed by Konnov et al. (Konnov et al., 2018). Each of them derives from diverse assumptions and target species, resulting in a significantly different number of species and reactions, as reported in Table 3.
Simulations of laminar burning velocity were performed using an open-source Cantera suite with appropriate reactor modules using a transient condition as a first-attempt solution for the steady-state conditions. In addition, acceptance criteria for residuals were considered once steady-state (ss) and transient-state (ts) problems were solved. More specifically, the following values were imposed: absolute tolerance(ss) = 1.0 x 10⁻⁸, relative tolerance(ss) = 1.0 x 10⁻¹⁵, absolute tolerance(ts) = 1.0 x 10⁻⁴, relative tolerance(ts) = 1.0 x 10⁻¹³. An adaptive grid was determined by using the following criteria: maximum acceptable ratio among adjacent solutions (ratio) equal to 3, maximum first derivative for adjacent solutions (slope) equal to 0.06, and maximum acceptable second derivative for adjacent solutions (curve) equal to 0.12. Additional details on the reported numerical methodology can be found elsewhere (Pio & Salzano, 2019).
The obtained data were compared with results combining experimental data collected in this work, following the procedure described in the previous section, with empirical correlations. For both fuel mixtures, laminar burning velocities were calculated from the closed vessel experimental pressure time history using equations provided by Dahoe, Zevenbergen, Lemkowitz, and Scarlett (commonly written as DZLS model, Dahoe et al., 1996) (Eq. 1).
where is the flame radius defined in Eq. 2, V vessel volume, the initial pressure, P is the actual pressure, Pmax is the maximum explosion pressure, and is the adiabatic coefficient of the unburned gas. Considering the nature of the experiments, only the data related to the reactive phase were selected. Namely, pre-ignition and post-combustion data were neglected for the evaluation of the LBV. In addition, since fuel reactivity is also a function of fuel composition in the fuel mixtures, LBV were also computed using a power law expression of fuel composition, temperature and pressure as reported by Dahoe et al. (2005) as shown in Eq. 3.
where LBV0 is the laminar burning velocity at reference pressure (i.e., P0) and temperature (i.e., T0), is the coefficient for temperature dependence, is the coefficient for pressure dependence, and is the equivalence ratio.
Other than the overall reactivity expressed in terms of laminar burning velocity, the detailed kinetic mechanism considered so far was adopted for the assessment of the pressure profile, too. To this aim, a constant-volume zero-dimensional reactor simulation with adiabatic and chemically inert walls in Cantera (Goodwin et al., 2003), using input pressures from experimental readings in closed vessels, was modelled. The investigation was performed at low initial temperatures (i.e., 298 – 423 K), which are lower than the auto-ignition temperature of the investigated mixtures. Hence, an ignition source needs to be considered in the numerical study, as well, to overcome the activation barrier and initiate the chemistry. To this end, in Cantera, spark ignition can be mimicked by artificially adding a pulsed flow of atomic hydrogen into the reaction mixtures. Once the reaction started, it releases heat and produces highly reactive intermediates, apparently accelerating the reaction to produce ignition. Then, the igniter turns off once the system approaches steady burning. A pressure controller with a fixed volume is used for the simulation. Simulations were performed using the KiBo_MU detailed chemical kinetic model.
From the measured pressure-time (P-t) histories, the deflagration index (KG) was quantified according to the classical cubic-root equation:
where V is the volume of the explosion vessel and (dP/dt)max is the maximum velocity of pressure rise. As can be seen from Eq. (5), the rate of pressure rise monotonically increases with explosion pressure and hence the maximum rate of pressure rise is attained when P = Pex (explosion pressure). So, multiplying both sides of Eq. (4) by V1/3, (dP/dt)max can be related to the laminar burning velocity as reported by Dahoe et al (2005), considering the dependency of the parameter on the size and shape of the vessel in addition to maximum pressure rise and volume. In the same way, as reported in the literature (Movileanu et al. 2012; Ajrash et al. 2016; Mitu & Brandes, 2017; Saeed, 2017; Sun, 2019), flame shape, structure and flame speed are affected by the size and shape of the vessel, eventually affecting the deflagration index KG.
where Pexp is the instantaneous explosion pressure at which the maximum rate of pressure rise is reached. P0 is the initial pressure, LBV is the laminar burning velocity, KG is the deflagration index, and γ is the adiabatic coefficient of the unburned gas. Eq. (5) has been used to calculate the deflagration index for hydrogen-air and methane-air under the operative conditions tested experimentally in this work.
3. Results
The explosions of hydrogen and methane with air at stoichiometric ratio ( were carried out for six different initial temperatures of the mixtures. Five measurements were taken for each initial temperature T0, each according to the test procedure presented. The recording frequency of the reaction explosion parameters was maintained at 150 kHz. The initial pressure for each trial was P0 = 1 bar. The results of a single trial are plotted as a curve of explosion pressure increase over time. Summary curves of the 5 measurements for T0 =298.15 K are shown in Figure 2, for T0 =323.15 K in Figure 3, for T0 =348.15 K in Figure 4, for T0 =373.15 K in Figure 5, for T0 =398.15 K in Figure 6, and for T0 =423.15 K in Figure 7. The temperatures were chosen for the LBV test because they represent typical operating temperatures for many hydrogen or methane-fueled systems. These temperatures are also easy to achieve and precisely controlled, making them ideal for laboratory testing.
Figure 8 presents the variation of laminar burning velocity (LBV) with initial reaction temperatures ranging from 298 to 423 K, as obtained from newly collected experimental data, numerical simulations using three detailed chemical kinetic mechanisms, and values reported in the literature.
As depicted in the figure, the results obtained using both approaches (i.e., correlations based on experimental data and numerical simulations) exhibit strong agreement for both fuel components. This consistency validates the accuracy of both methods for computing LBV. Additionally, the experimental pressure–time history recorded in this study aligns well with both literature-reported experimental results and simulation outcomes.
Figure 9 illustrates the pressure–time curves for methane–air and hydrogen–air mixtures over the studied temperature range (298–423 K). The simulated pressure–time histories generally follow the same trend as the experimental results across all tested temperatures, although minor deviations are observed. Notably, in graphs (a) and (b), ignition occurs later in the simulated cases compared to the experimental conditions.
Because we only study the temperature dependence, the values of were calculated having considered the unity for the equivalence ratio. For each fuel (H₂ and CH₄), we assembled laminar burning velocity (LBV) data as a function of initial temperature from measured experimental pressures at φ=1 and p=1 atm (Cammarota et al, 2009) as well as computed SL from three kinetic mechanisms (KiBo_MU, Konnov, San Diego) at the same conditions. We then chose a reference state at T₀ = 298.15 K with reference LBV₀ = LBV(T₀) from the experimental dataset. For each higher temperature Ti in the set {323.15, 348.15, 373.15, 398.15, 423.15 K}, the local exponent αi was computed via the log–log definition:
Figure 10 and Figure 11 show the calculated for hydrogen-air and methane-air mixtures at the same range of initial temperatures as experiments and numerical simulations.
All α values were shown in Table 4 and Table 5, where the average α and standard deviation σ over the temperature range were reported separately for experimental and each mechanism. This provides insight into how the sensitivity exponent α varies (or remains approximately constant) with temperature.

Table 4.
Details of the for hydrogen-air mixture ( = 1, P0 = 1 bar).
| Data | Standard deviation | |
|---|---|---|
| KiBo_MU | 1,760 | +/- 0,372 |
| San Diego | 1,822 | +/- 0,389 |
| Konnov | 1,790 | +/- 0,380 |
| Experiments | 1,790 | +/- 0,380 |
Table 5.
Details of the for methane-air mixture ( = 1, P0 = 1 bar).
| Data | Standard deviation | |
|---|---|---|
| KiBo_MU | 2,177 | +/- 0,095 |
| San Diego | 2,282 | +/- 0,108 |
| Konnov | 2,228 | +/- 0,101 |
| Experiments | 2,820 | +/- 0,411 |
For stoichiometric hydrogen–air mixtures at φ = 1 and 1 atm, Konnov (2010) compiled reported α values around 1.54-1.72. Although some studies fit data over different temperature intervals and methods, a mid-range near ≈1.6 is common. In our study, from experimental data, the α may appear higher at lower T increments (e.g., 2.5 at 323 K) but declines toward 1.5 at 423 K; the resulting average over 323-423 K is 1.79 ± 0.38. Kinetic mechanisms (KiBo_MU, Konnov, San Diego) yield similar local averages, indicating consistency with experimental trends. A global ln–ln regression through zero over all combined points gives an effective exponent αfit = 1.66, in line with the literature mid-range around 1.6. For stoichiometric methane-air mixtures at φ = 1 and 1 bar, Konnov (2010) and Han et al. (2019) show the α values between roughly 1.58 and 2.0, with many well-controlled studies clustering near 1.7-1.9. Our calculated α, derived from experimental data, decreases from higher values at moderate T toward 1.5-1.6 at 423 K, yielding an average over 323-423 K around 1.7-1.8 with moderate scatter. Simulation mechanisms agree closely with experiment at each temperature. In both fuels, the agreement between literature-reported α ranges (Konnov, 2010) and our combined experimental/simulation exponents confirms that detailed kinetic models capture the temperature sensitivity of LBV well in 298–423 K. Using an average exponent (e.g., 1.66 for H₂–air, 1.75 for CH₄–air) is acceptable for moderate temperature spans, but one should be cautious when extrapolating beyond ~450 K, where fewer data exist and α may differ a lot. That means more experimental studies are needed for higher initial temperatures.
4. Discussion
In order to capture the intrinsic reactivity of methane-air and hydrogen-air mixtures, the deflagration index obtained from the pressure-time history of 20 L closed explosion vessel together with the burning velocity has been shown in Figure 12. From the figure, deflagration index showed an inverse relation to the reaction temperatures whereas, laminar burning velocity showed a direct relation to the reaction temperatures. This is because the initial temperature has a significant effect on the explosion pressure consequently dictating the maximum rate of pressure rise in the vessel and therefore, the deflagration index. In other words, increasing initial temperature has an inverse relation with explosion pressure and so on KG. Even though, there happens to be too much inconsistency in measured deflagration index as reported by several authors (Cashdollar et al. 2000; Ma, et al, 2014; Mittal, 2017; Pasman, 2005) ranging from 30-86 bar∙m/s for methane-air and 215-1100 bar*m/s for hydrogen-air mixtures at standard conditions, the present study lies in the range experimentally reported in the literature. For instance, for methane, the closest experimental result reported in the literature to those calculated as results of the project SAFEKINEX (Pasman et al., 2005). From this observation, it can be said that the deflagration index and laminar burning velocity are sensitive to initial temperatures, which are consistent with the study reported in the literature. Overall, the deflagration index showed an inverse relation with flame propagation. Furthermore, the relationship between the explosion pressure and the deflagration index is shown in Figure 13 within the studied temperature ranges. It can be seen from the figure that the deflagration index has a direct relationship with the explosion pressure and the maximum pressure rise rate, because the maximum rate for pressure rise has a similar relationship with the maximum explosion pressure.
The investigation into the deflagration dynamics of hydrogen and methane mixtures provides valuable insights into the combustion characteristics and safety implications of using these gases as alternative energy sources. The results of this study highlight several critical aspects that can influence the efficiency, safety, and environmental impact of combustion processes involving hydrogen and methane. One significant finding is the variation in LBV with temperature for both hydrogen-air and methane-air mixtures. The experimental data, supported by numerical simulations, demonstrate that the LBV increases exponentially with temperature. This increase in LBV at higher temperatures suggests enhanced reactivity of the fuel mixtures, which is crucial for optimizing combustion processes in practical applications. The agreement between experimental results and numerical simulations further validates the reliability of the kinetic models used in this study.
The deflagration index was observed to have an inverse relationship with temperature, which contrasts with the direct relationship between LBV and temperature. This inverse relationship indicates that higher initial temperatures lead to a lower maximum rate of pressure rise during combustion, which could influence the design and safety measures of combustion systems. The deflagration index values obtained in this study are consistent with those reported in the literature, reinforcing the validity of the experimental approach and findings.
The pressure-time histories for both hydrogen-air and methane-air mixtures provide a detailed understanding of the combustion dynamics. The observed trends in pressure rise and the time to ignition underscore the importance of precise control over the initial conditions, such as temperature and mixture composition, to achieve desired combustion outcomes. The discrepancies between experimental and numerical ignition times suggest potential areas for improving the accuracy of kinetic models, particularly in simulating the initial stages of combustion.
5. Conclusions
This study about the temperature dependence on deflagration dynamics of hydrogen and methane mixtures offers several key conclusions that are critical for advancing the use of these gases in applications of energy and fuel technologies.
Overall, this study contributes to the foundational understanding of the combustion dynamics of hydrogen and methane mixtures at elevated temperatures, providing a basis for further research and development in the field of process industries.
Author Contributions
Conceptualization, R.P., E.S., G.P.; methodology, R.P., E.S.; software, F.M.W., T.G.; validation T.G., F.M.W., R.K.; formal analysis, R.K., V.J., T.G.; investigation, R.P., G.P., F.M.W., T.G., V.J.; resources, R.P., E.S.,V.J.; data curation, E.S., R.P., V.J.; writing—original draft preparation, R.K., R.P. F.M.W., T.G.; writing—review and editing, E.S., G.P., V.J.; visualization, R.K., F.M.W., T.G.; supervision, E.S.; project administration, R.P.; funding acquisition, E.S., R.P. All authors have read and agreed to the published version of the manuscript.
Funding
This research was supported by a subsidy from the Polish Ministry of Science and Higher Education for Jan Kochanowski University of Kielce, under research grant no. SUPB.RN.25.057.
Acknowledgments
This work was supported by the European Union under the Horizon Europe project CESAR (Centre of Excellence for Safety Research, GA No 101186946).
Conflicts of Interest
The authors declare no conflicts of interest.
References
- Ajrash, M.J.; Zanganeh, J.; Moghtaderi, B. Methane-coal dust hybrid fuel explosion properties in a large scale cylindrical explosion chamber. J. Loss Prev. Process Ind. 2016, 40, 317–328. [Google Scholar] [CrossRef]
- Akram, M.; Saxena, P.; Kumar, S. Laminar Burning Velocity of Methane–Air Mixtures at Elevated Temperatures. Energy Fuels 2013, 27, 3460–3466. [Google Scholar] [CrossRef]
- AL-Khafaji, M.; Yang, J.; Tomlin, A.S.; Thompson, H.M.; de Boer, G.; Liu, K.; Morsy, M.E. Laminar burning velocities and Markstein numbers for pure hydrogen and methane/hydrogen/air mixtures at elevated pressures. Fuel 2023, 354, 129331. [Google Scholar] [CrossRef]
- Brusca, S.; Lanzafame, R.; Garrano, A.M.C.; Messina, M. Effects of Pressure, Temperature and Dilution on Fuels/Air Mixture Laminar Flame Burning Velocity. Energy Procedia 2015, 82, 125–132. [Google Scholar] [CrossRef]
- Cammarota, F. , Di Benedetto, A. , Di Sarli, V., Salzano, E., Russo, G. Combined effects of initial pressure and turbulence on explosions of hydrogen-enriched methane/air mixtures, Journal of Loss Prevention in the Process Industries 2009, 22, 607–613. [Google Scholar] [CrossRef]
- Cashdollar, K.L.; A. Zlochower, I.; Green, G.M.; Thomas, R.A.; Hertzberg, M. Flammability of methane, propane, and hydrogen gases. J. Loss Prev. Process Ind. 2000, 13, 327–340. [Google Scholar] [CrossRef]
- Dahoe, A.E. Laminar burning velocities of hydrogen–air mixtures from closed vessel gas explosions. J. Loss Prev. Process Ind. 2005, 18, 152–166. [Google Scholar] [CrossRef]
- Dahoe, A.E.; Zevenbergen, J.F.; Lemkowitz, S.M.; Scarlett, B. Dust explosions in spherical vessels: The role of flame thickness in the validity of the ‘cube-root law. ’ J. Loss Prev. Process Ind. 1996, 9, 33–44. [Google Scholar] [CrossRef]
- Duva, B.C.; Chance, L.E.; Toulson, E. Dilution effect of different combustion residuals on laminar burning velocities and burned gas Markstein lengths of premixed methane/air mixtures at elevated temperature. Fuel 2020, 267, 117153. [Google Scholar] [CrossRef]
- Ghosh, A.; Munoz-Munoz, N.M.; Chatelain, K.P.; Lacoste, D.A. Laminar burning velocity of hydrogen, methane, ethane, ethylene, and propane flames at near-cryogenic temperatures. Appl. Energy Combust. Sci. 2022, 12, 100094. [Google Scholar] [CrossRef]
- Halter, F.; Tahtouh, T.; Mounaïm-Rousselle, C. Nonlinear effects of stretch on the flame front propagation. Combust. Flame 2010, 157, 1825–1832. [Google Scholar] [CrossRef]
- Han, X. , Wang, Z., Wang, S., Whiddon, R., He, Y., Lv, Y., Konnov, A.A., Parametrization of the temperature dependence of laminar burning velocity for methane and ethane flames. Fuel 2019, 239, 1028–1037. [Google Scholar] [CrossRef]
- Hu, E.; Huang, Z.; He, J.; Jin, C.; Zheng, J. Experimental and numerical study on laminar burning characteristics of premixed methane–hydrogen–air flames. Int. J. Hydrog. Energy 2009, 34, 4876–4888. [Google Scholar] [CrossRef]
- Ihme, M.; Chung, W.T.; Mishra, A.A. Combustion machine learning: Principles, progress and prospects. Prog. Energy Combust. Sci. 2022, 91, 101010. [Google Scholar] [CrossRef]
- Konnov, A.A. The effect of temperature on the adiabatic laminar burning velocities of CH4-air and H2-air flames, Fuel 2010, 89, 2211–2216. 89. [CrossRef]
- Konnov, A.A.; Mohammad, A.; Kishore, V.R.; Kim, N. il, Prathap, C.; Kumar, S. A comprehensive review of measurements and data analysis of laminar burning velocities for various fuel+air mixtures. Prog. Energy Combust. Sci. 2018, 68, 197–267. [Google Scholar] [CrossRef]
- Li, W.; Jiang, Y.; Jin, Y.; Zhu, X. Investigation of the influence of DMMP on the laminar burning velocity of methane/air premixed flames. Fuel 2019, 235, 1294–1300. [Google Scholar] [CrossRef]
- Luo, C.; Yu, Z.; Wang, Y.; Ai, Y. Experimental Investigation of Lean Methane–Air Laminar Premixed Flames at Engine-Relevant Temperatures. ACS Omega 2021, 6, 17977–17987. [Google Scholar] [CrossRef]
- Ma, Q.; Zhang, Q.; Chen, J.; Huang, Y.; Shi, Y. Effects of hydrogen on combustion characteristics of methane in air. Int. J. Hydrog. Energy 2014, 39, 11291–11298. [Google Scholar] [CrossRef]
- Milton, B.E.; Keck, J.C. Laminar burning velocities in stoichiometric hydrogen and hydrogen-hydrocarbon gas mixtures. Combust. Flame 1984, 58, 13–22. [Google Scholar] [CrossRef]
- Mittal, M. Explosion pressure measurement of methane-air mixtures in different sizes of confinement. J. Loss Prev. Process Ind. 2017, 46, 200–208. [Google Scholar] [CrossRef]
- Mitu, M.; Razus, D.; Schroeder, V. Laminar Burning Velocities of Hydrogen-Blended Methane–Air and Natural Gas–Air Mixtures, Calculated from the Early Stage of p(t) Records in a Spherical Vessel. Energies 2021, 14, 7556. [Google Scholar] [CrossRef]
- Movileanu, C.; Gosa, V.; Razus, D. Explosion of gaseous ethylene–air mixtures in closed cylindrical vessels with central ignition. J. Hazard. Mater. 2012, 235–236, 108–115. [Google Scholar] [CrossRef] [PubMed]
- Nilsson, E.J.K.; van Sprang, A.; Larfeldt, J.; Konnov, A.A. The comparative and combined effects of hydrogen addition on the laminar burning velocities of methane and its blends with ethane and propane. Fuel 2017, 189, 369–376. [Google Scholar] [CrossRef]
- Okafor, E.C.; Naito, Y.; Colson, S.; Ichikawa, A.; Kudo, T.; Hayakawa, A.; Kobayashi, H. Experimental and numerical study of the laminar burning velocity of CH4–NH3–air premixed flames. Combust. Flame 2018, 187, 185–198. [Google Scholar] [CrossRef]
- Pasman, H.J.; Pekalski, A.; Braithwaite, M.; Braithwaite, M. To enable a better CAPE: the EU SAFEKINEX project. Comput. Aided Chem. Eng. 2005, 20, 355–360. [Google Scholar] [CrossRef]
- Pio, G. , Salzano, E. (2018), Laminar burning velocity of methane, hydrogen, and their mixtures at extremely low-temperature conditions. Energy fuels 32, 8830-8836. [CrossRef]
- Pio, G.; Salzano, E. The effect of ultra-low temperature on the flammability limits of a methane/air/diluent mixtures. J. Hazard. Mater. 2019, 362, 224–229. [Google Scholar] [CrossRef]
- Pio, G.; Eckart, S.; Salzano, E.; Krause, H. Kinetic parameters for safety of hydrogen-containing mixtures, Chemical Engineering Transactions 2022, 90. [CrossRef]
- Porowski, R.; Kowalik, R.; Grzmiączka, M.; Jurišević, N.; Gawdzik, J. Influence of initial temperature on laminar burning velocity in hydrogen-air mixtures as potential for green energy carrier. Int. Commun. Heat Mass Transf. 2023, 146, 106861. [Google Scholar] [CrossRef]
- Porowski, R.; Kowalik, R.; Nagy, S.; Gorzelnik, T.; Szurlej, A.; Grzmiączka, M.; Zielińska, K.; Dahoe, A. Deflagration Dynamics of Methane–Air Mixtures in Closed Vessels at Elevated Temperatures. Energies 2024, 17, 2855. [Google Scholar] [CrossRef]
- Saeed, K. Determination of the explosion characteristics of methanol – Air mixture in a constant volume vessel. Fuel 2017, 210, 729–737. [Google Scholar] [CrossRef]
- Salzano, E. , Cammarota, F. , A Di Benedetto, V Di Sarli. Explosion behavior of hydrogen–methane/air mixtures, Journal of Loss Prevention in the Process Industries 2012, 25, 443–447. [Google Scholar]
- Salzano, E. , Pio, G. , Ricca, A., Palma, V. The effect of a hydrogen addition to the premixed flame structure of light alkanes, Fuel 2018, 234, 1064–1070. [Google Scholar] [CrossRef]
- Skrinsky, J. Calculation and Experimental Validation of Pressure and Temperature Effects on COG-Air Fuel Mixtures. ITM Web Conf. 2018, 16, 03003. [Google Scholar] [CrossRef]
- Sun, Z.-Y. Experimental studies on the explosion indices in turbulent stoichiometric H2/CH4/air mixtures. Int. J. Hydrog. Energy 2019, 44, 469–476. [Google Scholar] [CrossRef]
- Ueda, A.; Nisida, K.; Matsumura, Y.; Ichikawa, T.; Nakashimada, Y.; Endo, T.; Kim, W. Effects of hydrogen and carbon dioxide on the laminar burning velocities of methane–air mixtures. J. Energy Inst. 2021, 99, 178–185. [Google Scholar] [CrossRef]
- Varghese, R.J.; Kolekar, H.; Kishore, V.R.; Kumar, S. Measurement of laminar burning velocities of methane-air mixtures simultaneously at elevated pressures and elevated temperatures. Fuel 2019, 257, 116120. [Google Scholar] [CrossRef]
- Wako, F.M. , Pio, G. , Salzano, E. The effect of hydrogen addition on low-temperature combustion of light hydrocarbons and alcohols. Energies 2020, 13, 3808. [Google Scholar]
- Wako, F.M.; Pio, G.; Salzano, E. Modeling Formic Acid Combustion. Energy Fuels 2022, 36, 14382–14392. [Google Scholar] [CrossRef]
- Yang, H.; Wang, X.; Fu, J.; Liu, J. Numerical study of the effect of CO2 H2O dilution on the laminar burning velocity of methane/air flames under elevated initial temperature and pressure. Can. J. Chem. Eng. 2023, 101, 4092–4105. [Google Scholar] [CrossRef]
Figure 1.
Testing 20 L combustion vessel provided by ANKO. Numbers on the figure corresponds to the description in the Table 1 (Porowski et al., 2024).
Figure 1.
Testing 20 L combustion vessel provided by ANKO. Numbers on the figure corresponds to the description in the Table 1 (Porowski et al., 2024).

Figure 2.
P(t) curves for hydrogen (left), and methane (right) mixtures with air. T0 = 298.15 K.
Figure 3.
P(t) curves for hydrogen (left), and methane (right) mixtures with air. T0 = 323.15 K.
Figure 4.
P(t) curves for hydrogen (left), and methane (right) mixtures with air. T0 = 348.15 K.
Figure 5.
P(t) curves for hydrogen (left), and methane (right) mixtures with air. T0 = 373.15 K.
Figure 6.
P(t) curves for hydrogen (left), and methane (right) mixtures with air. T0 = 398.15 K.
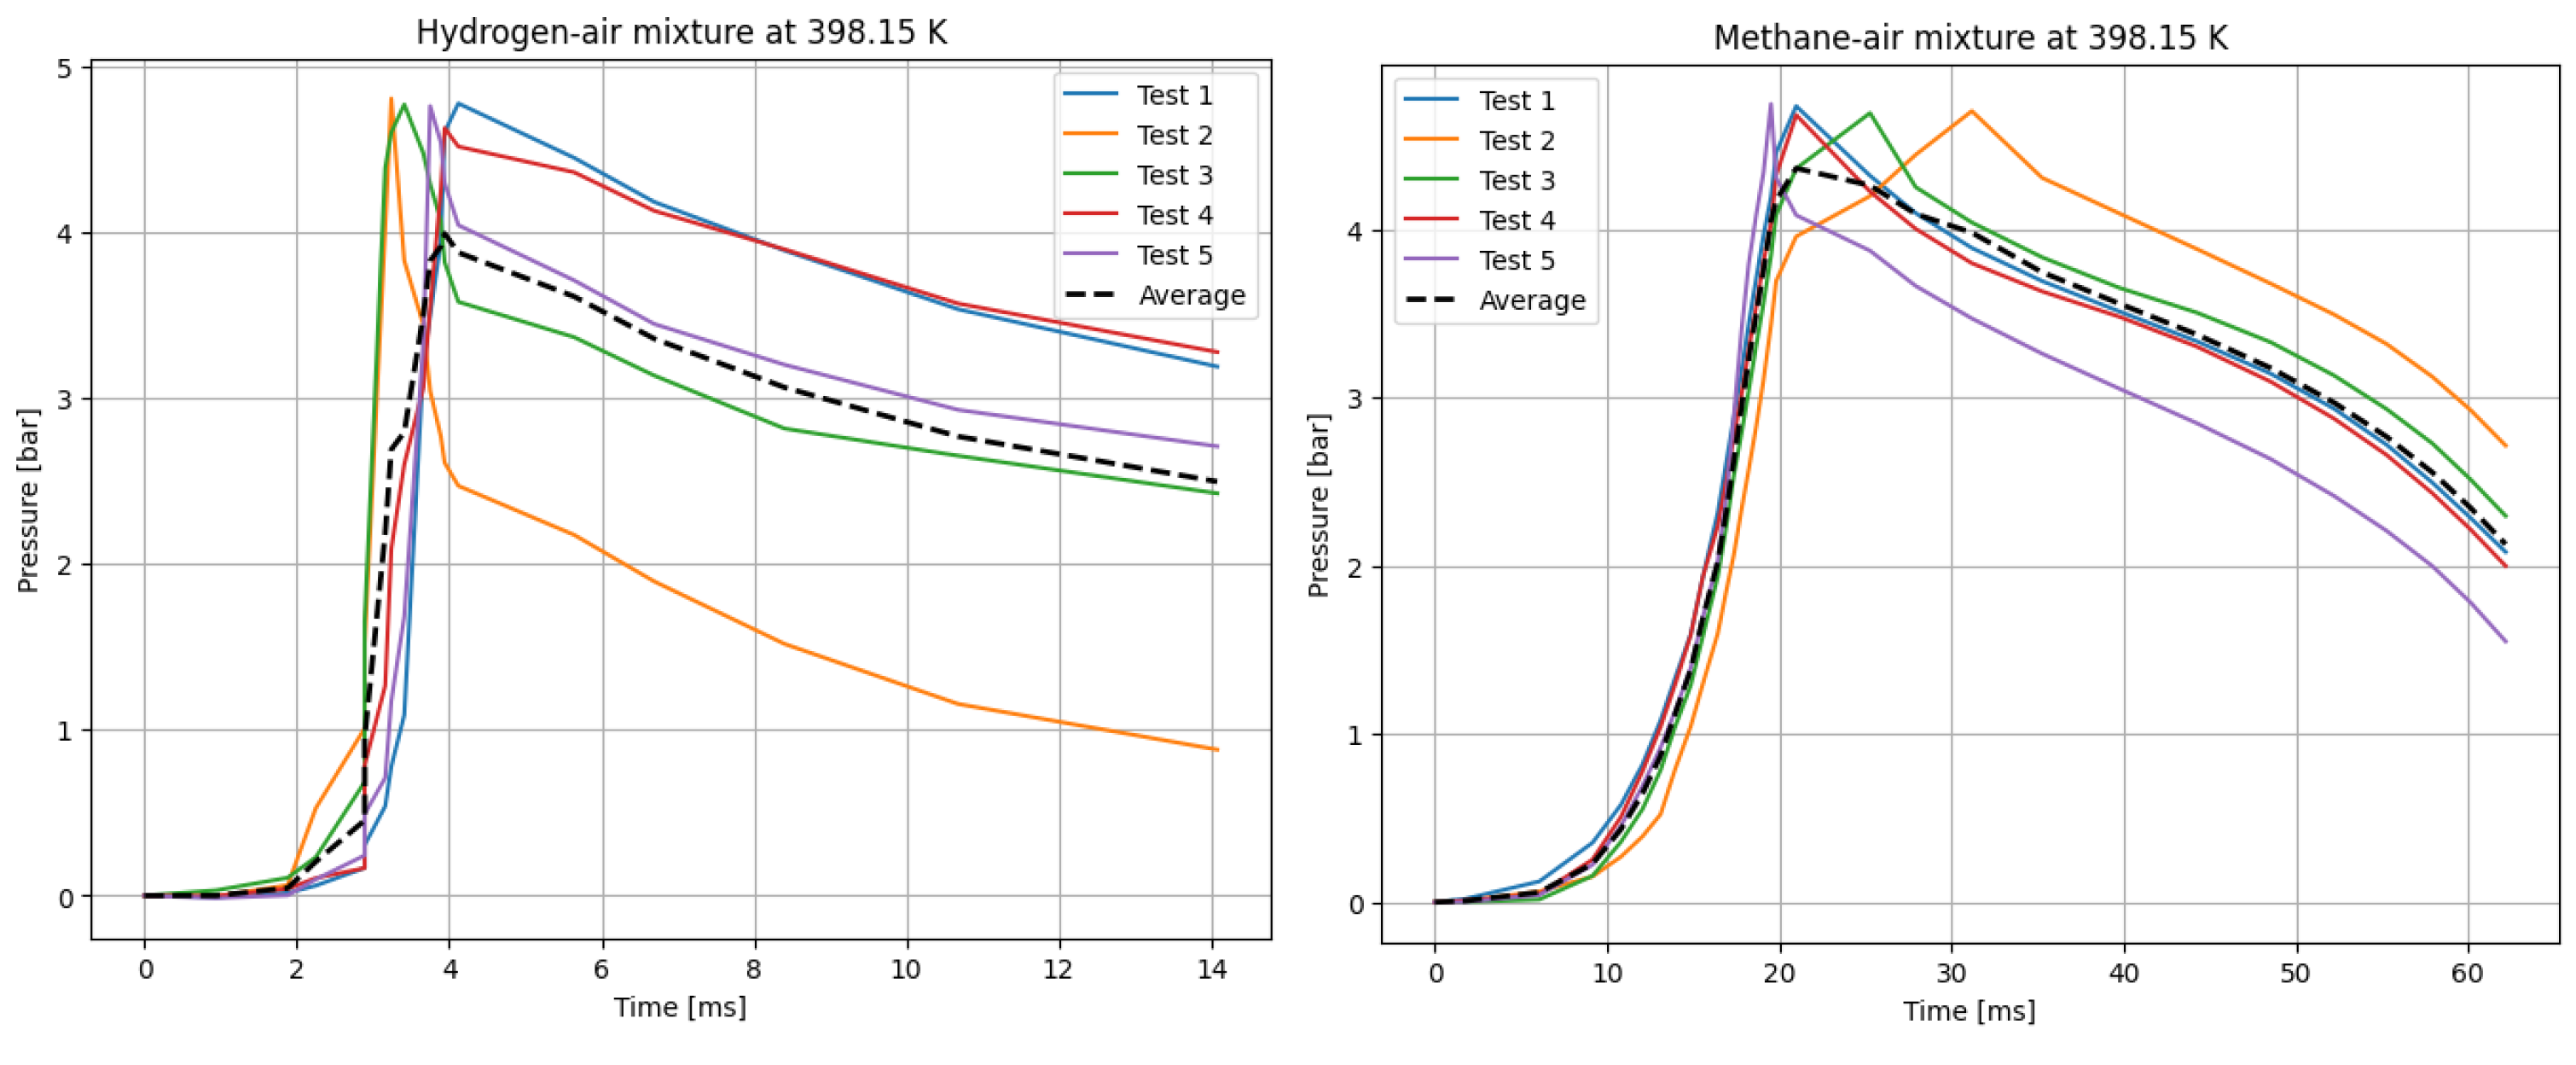
Figure 7.
P(t) curves for hydrogen (left), and methane (right) mixtures with air. T0 = 423.15 K.
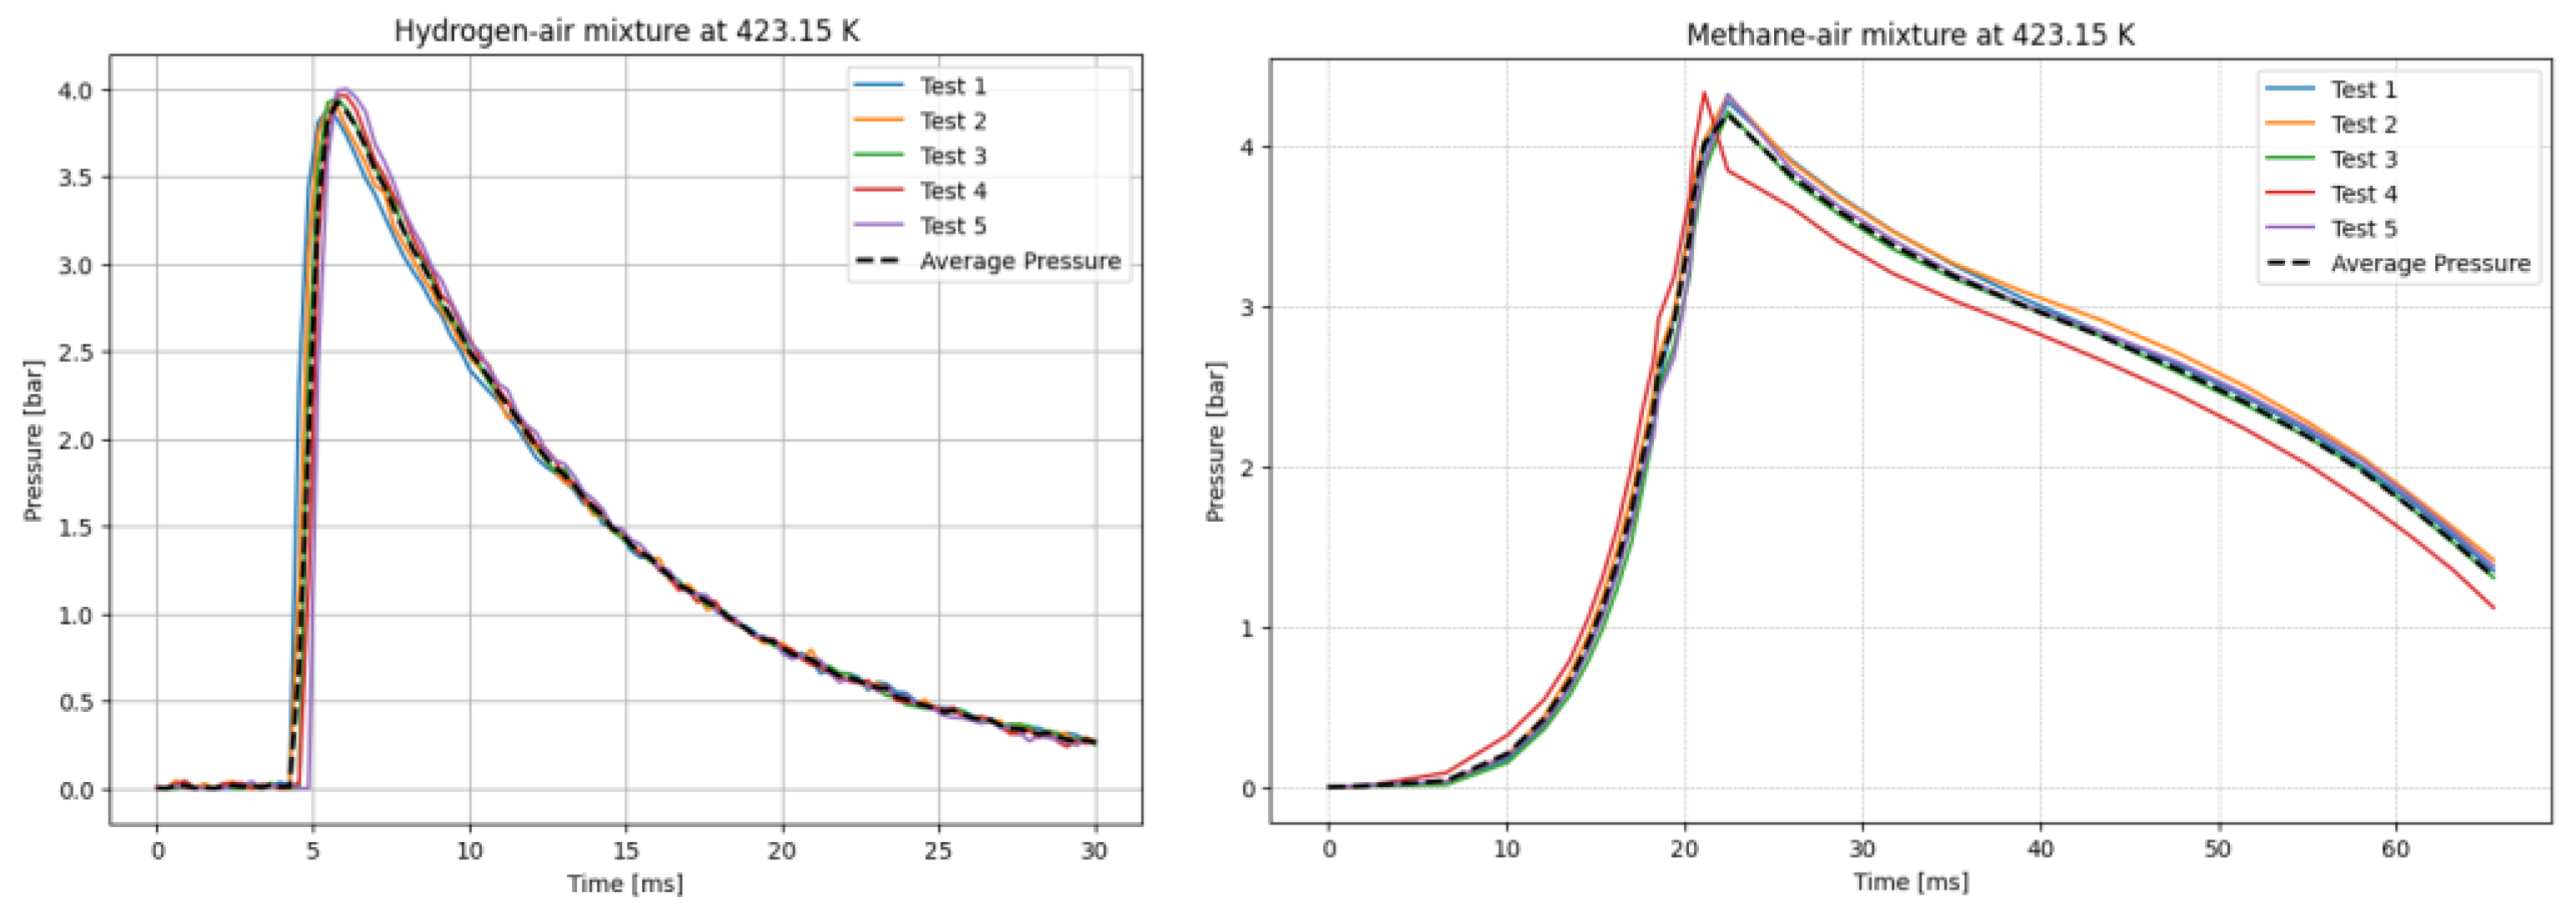
Figure 8.
Laminar burning velocity of hydrogen (a) and methane (b) air mixtures obtained by different approaches as a function of the initial temperature. Symbols: experimental data from present work and literature (Milton and Keck 1984, Brusca, Lanzafame et al. 2015, Luo, Yu et al. 2021). Broken lines: simulation results from detailed mechanisms.
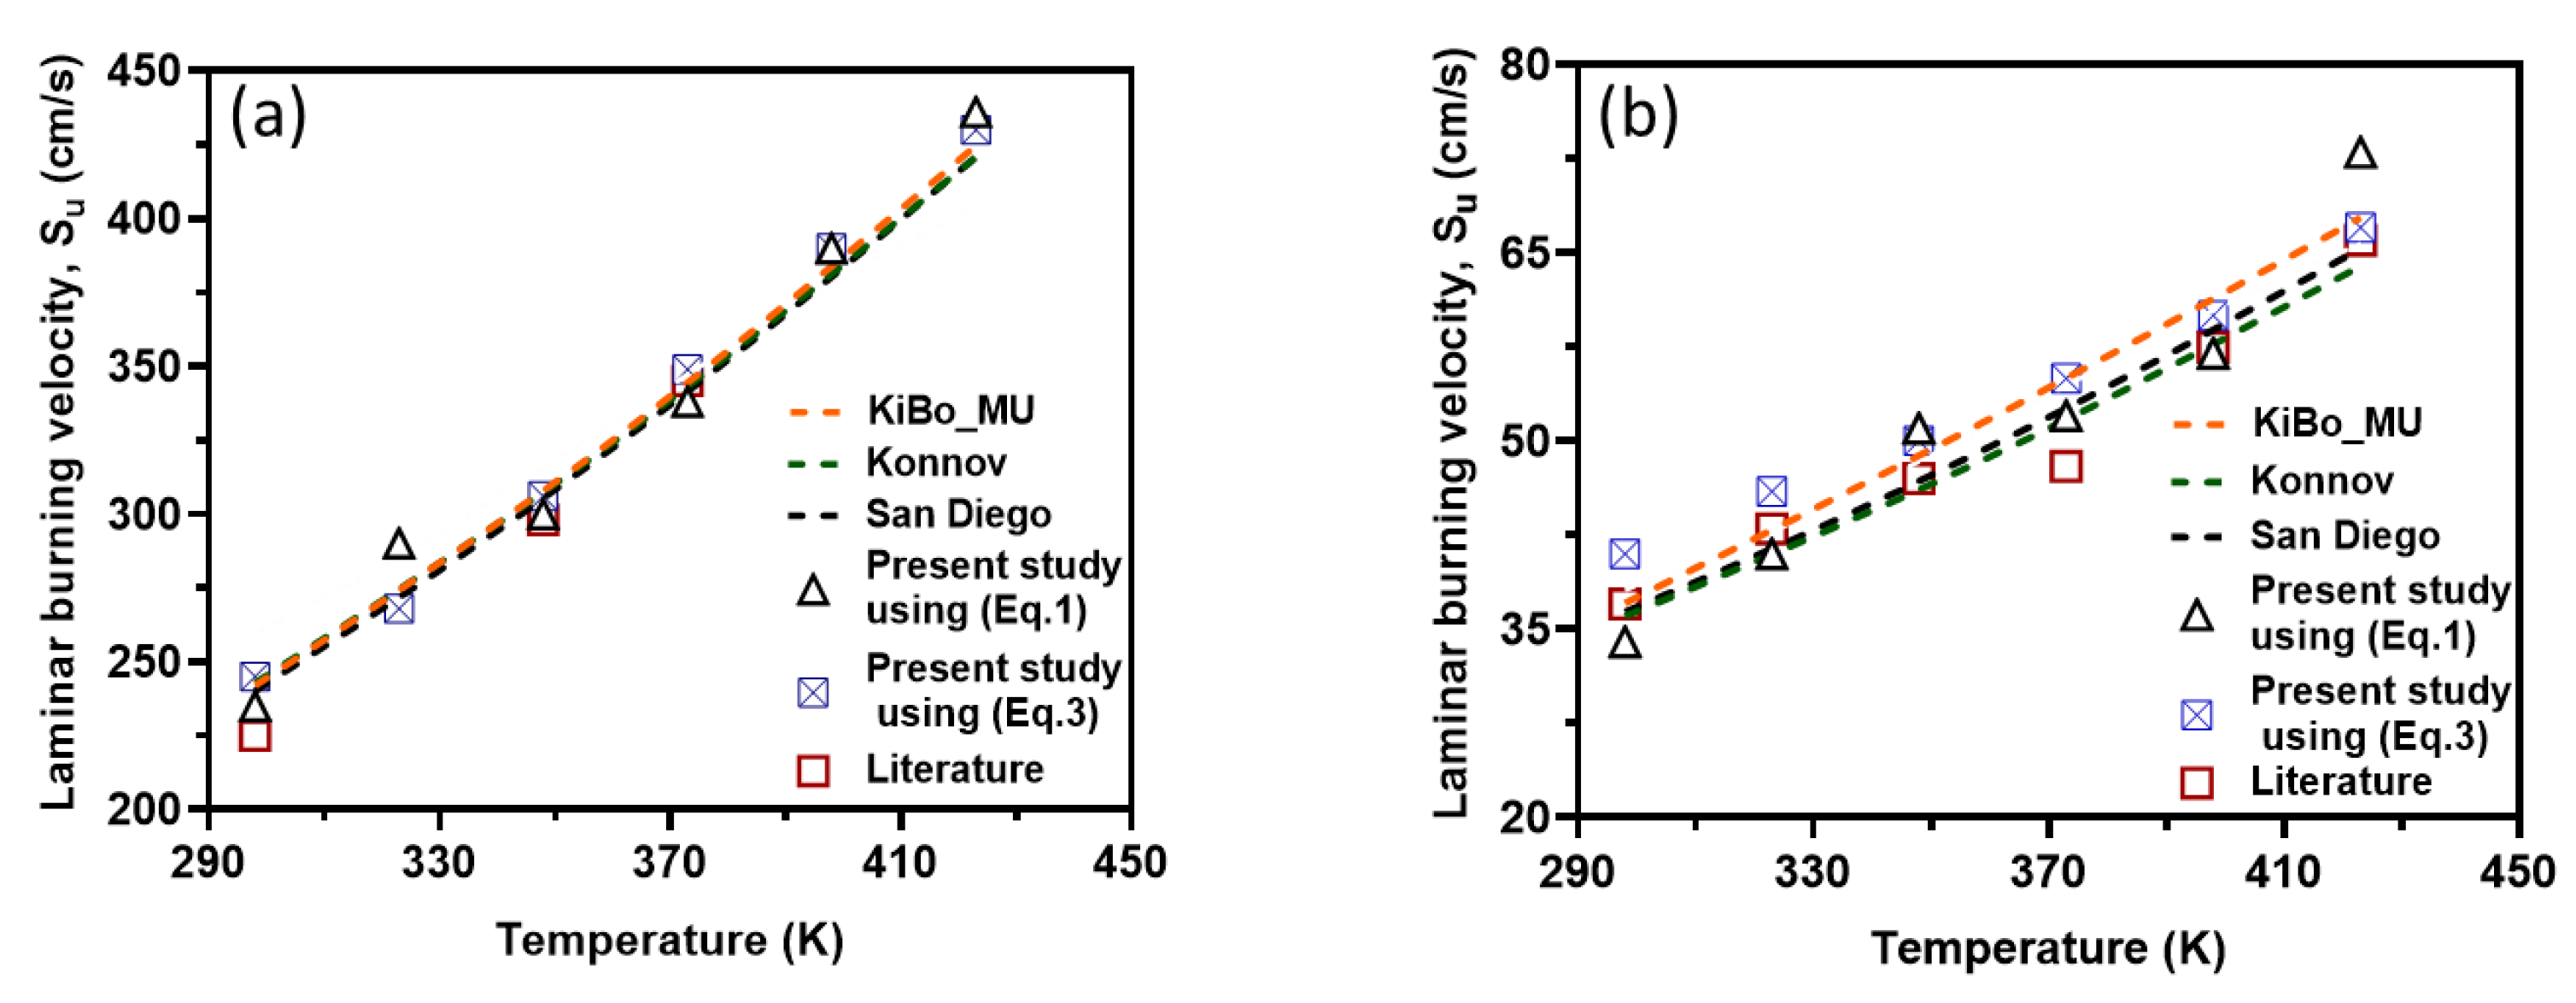
Figure 9.
Pressure rise in a closed vessel as a function of time for CH4-air (a, b) and H2-air (c, d) mixtures. Symbols: experimental data. Broken lines; simulation results.
Figure 9.
Pressure rise in a closed vessel as a function of time for CH4-air (a, b) and H2-air (c, d) mixtures. Symbols: experimental data. Broken lines; simulation results.
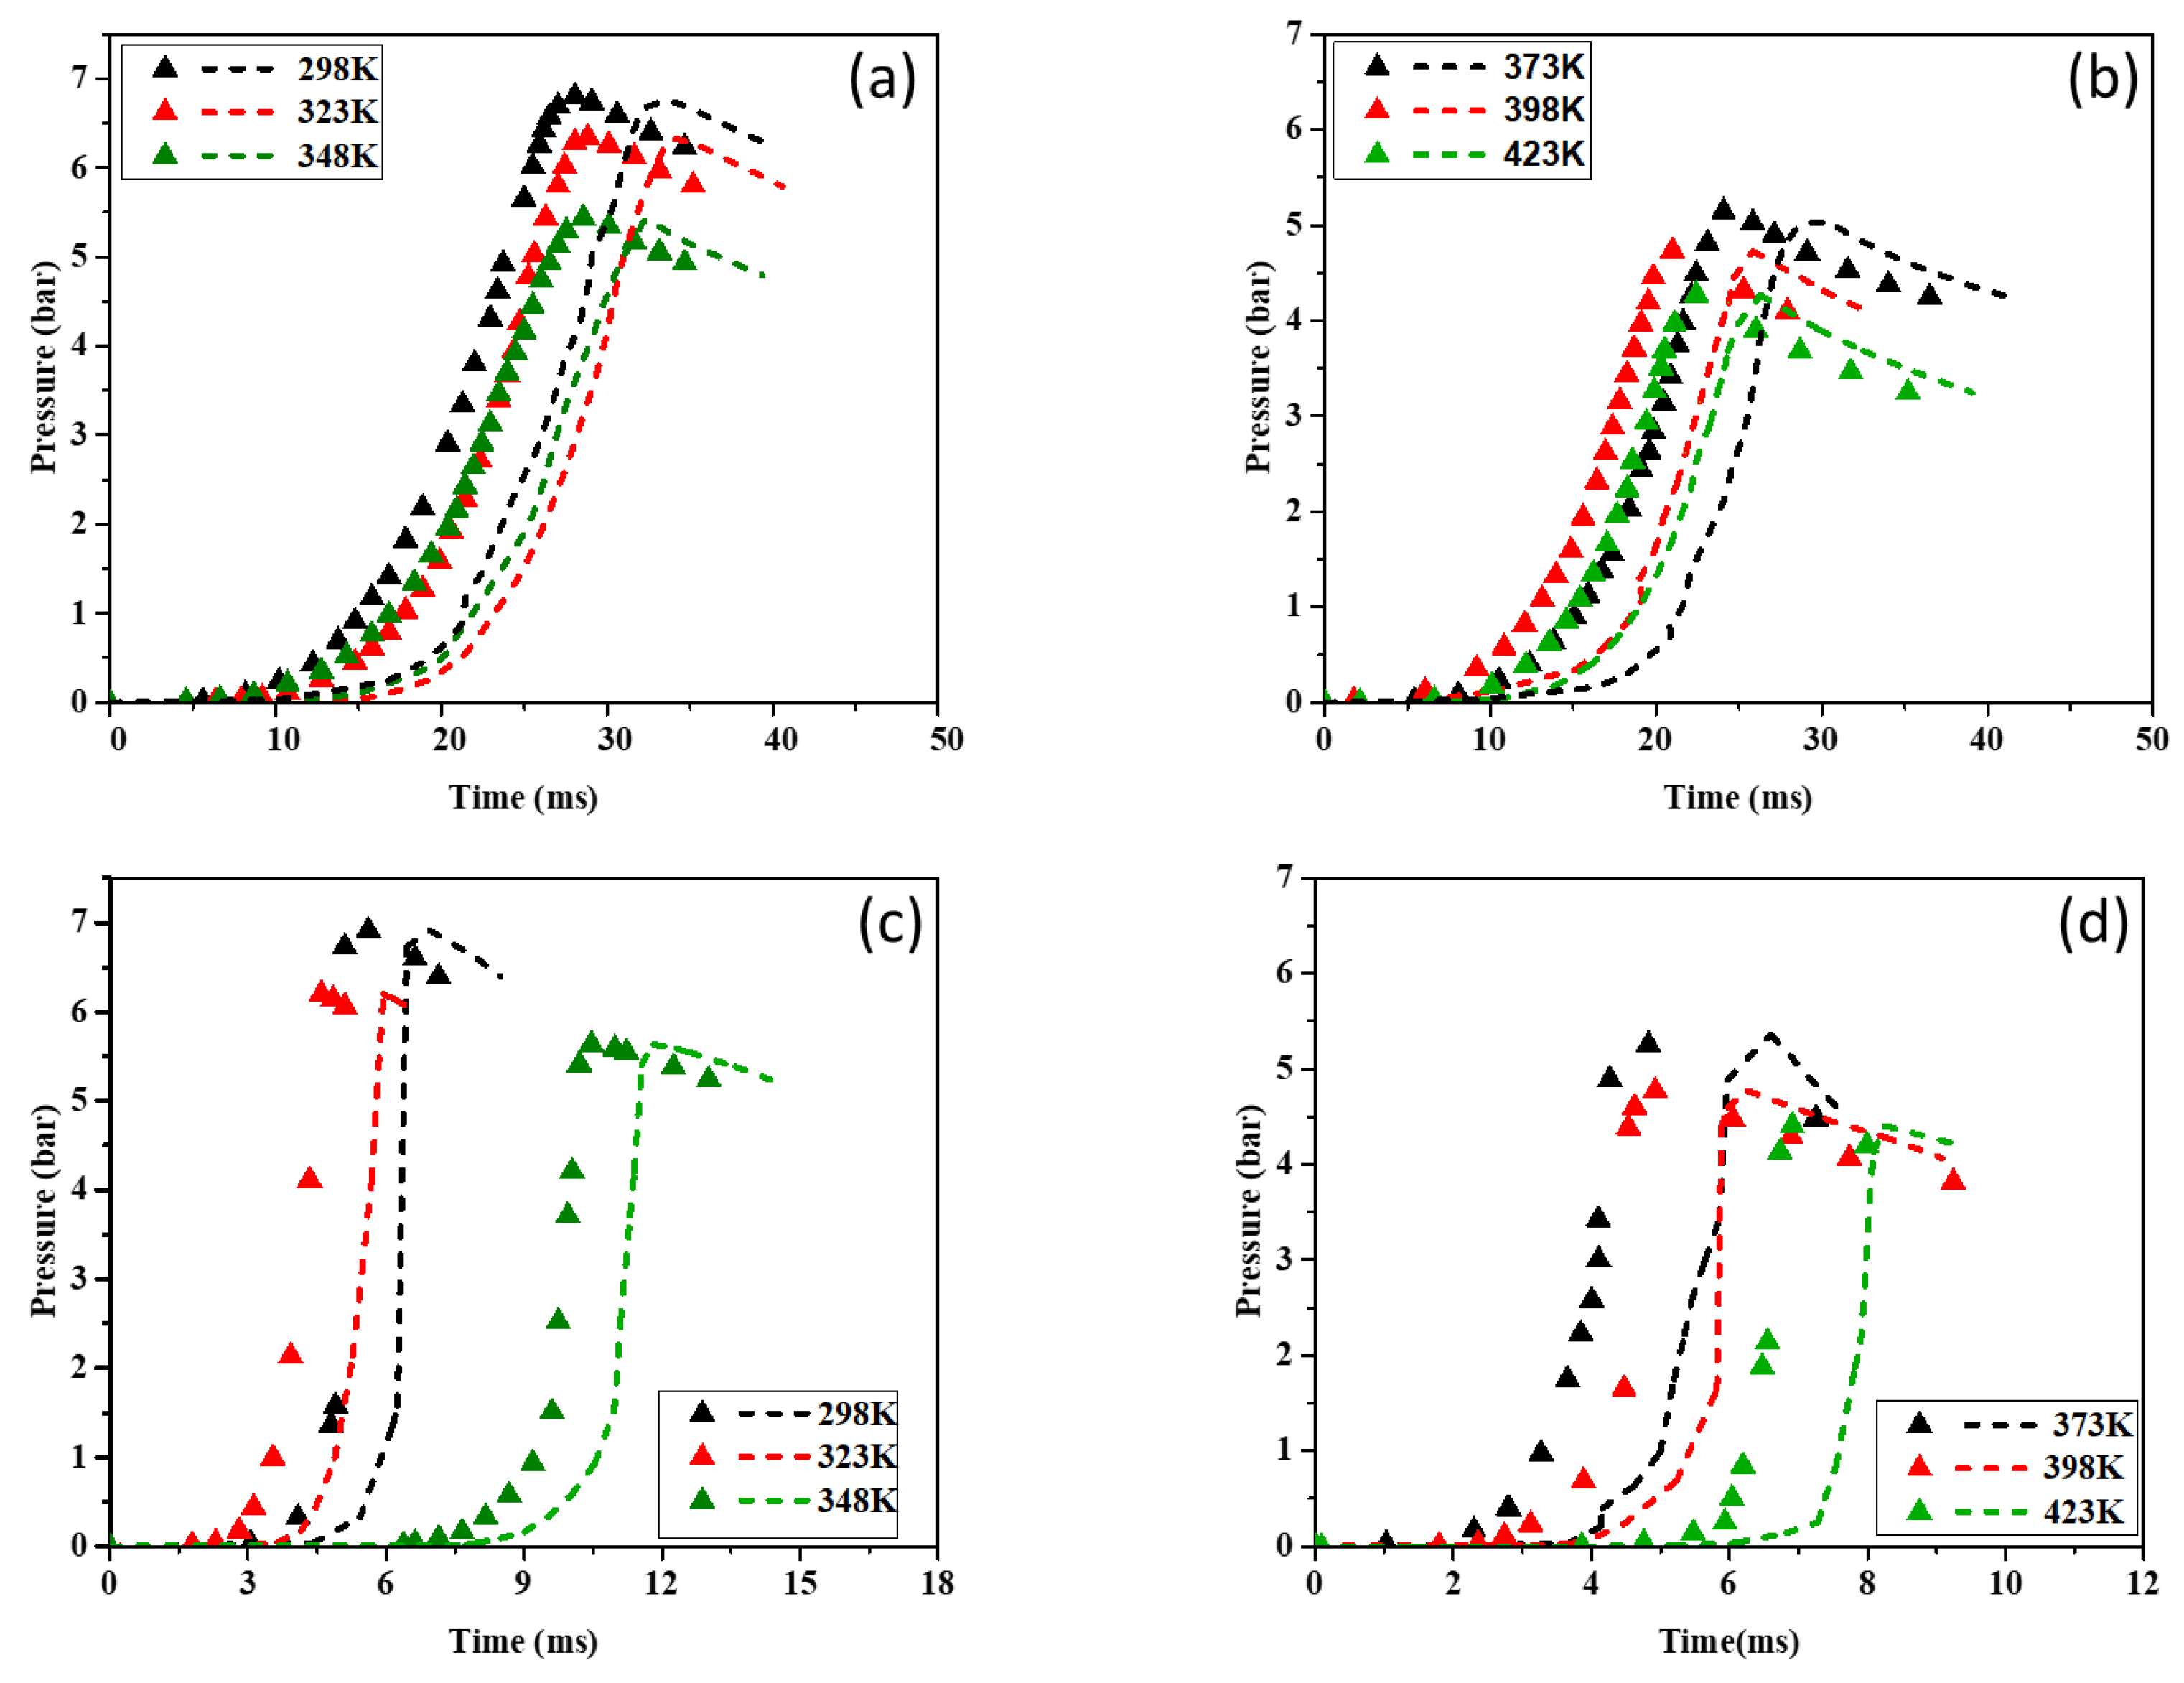
Figure 10.
for hydrogen-air mixture based on experiments and kinetics.
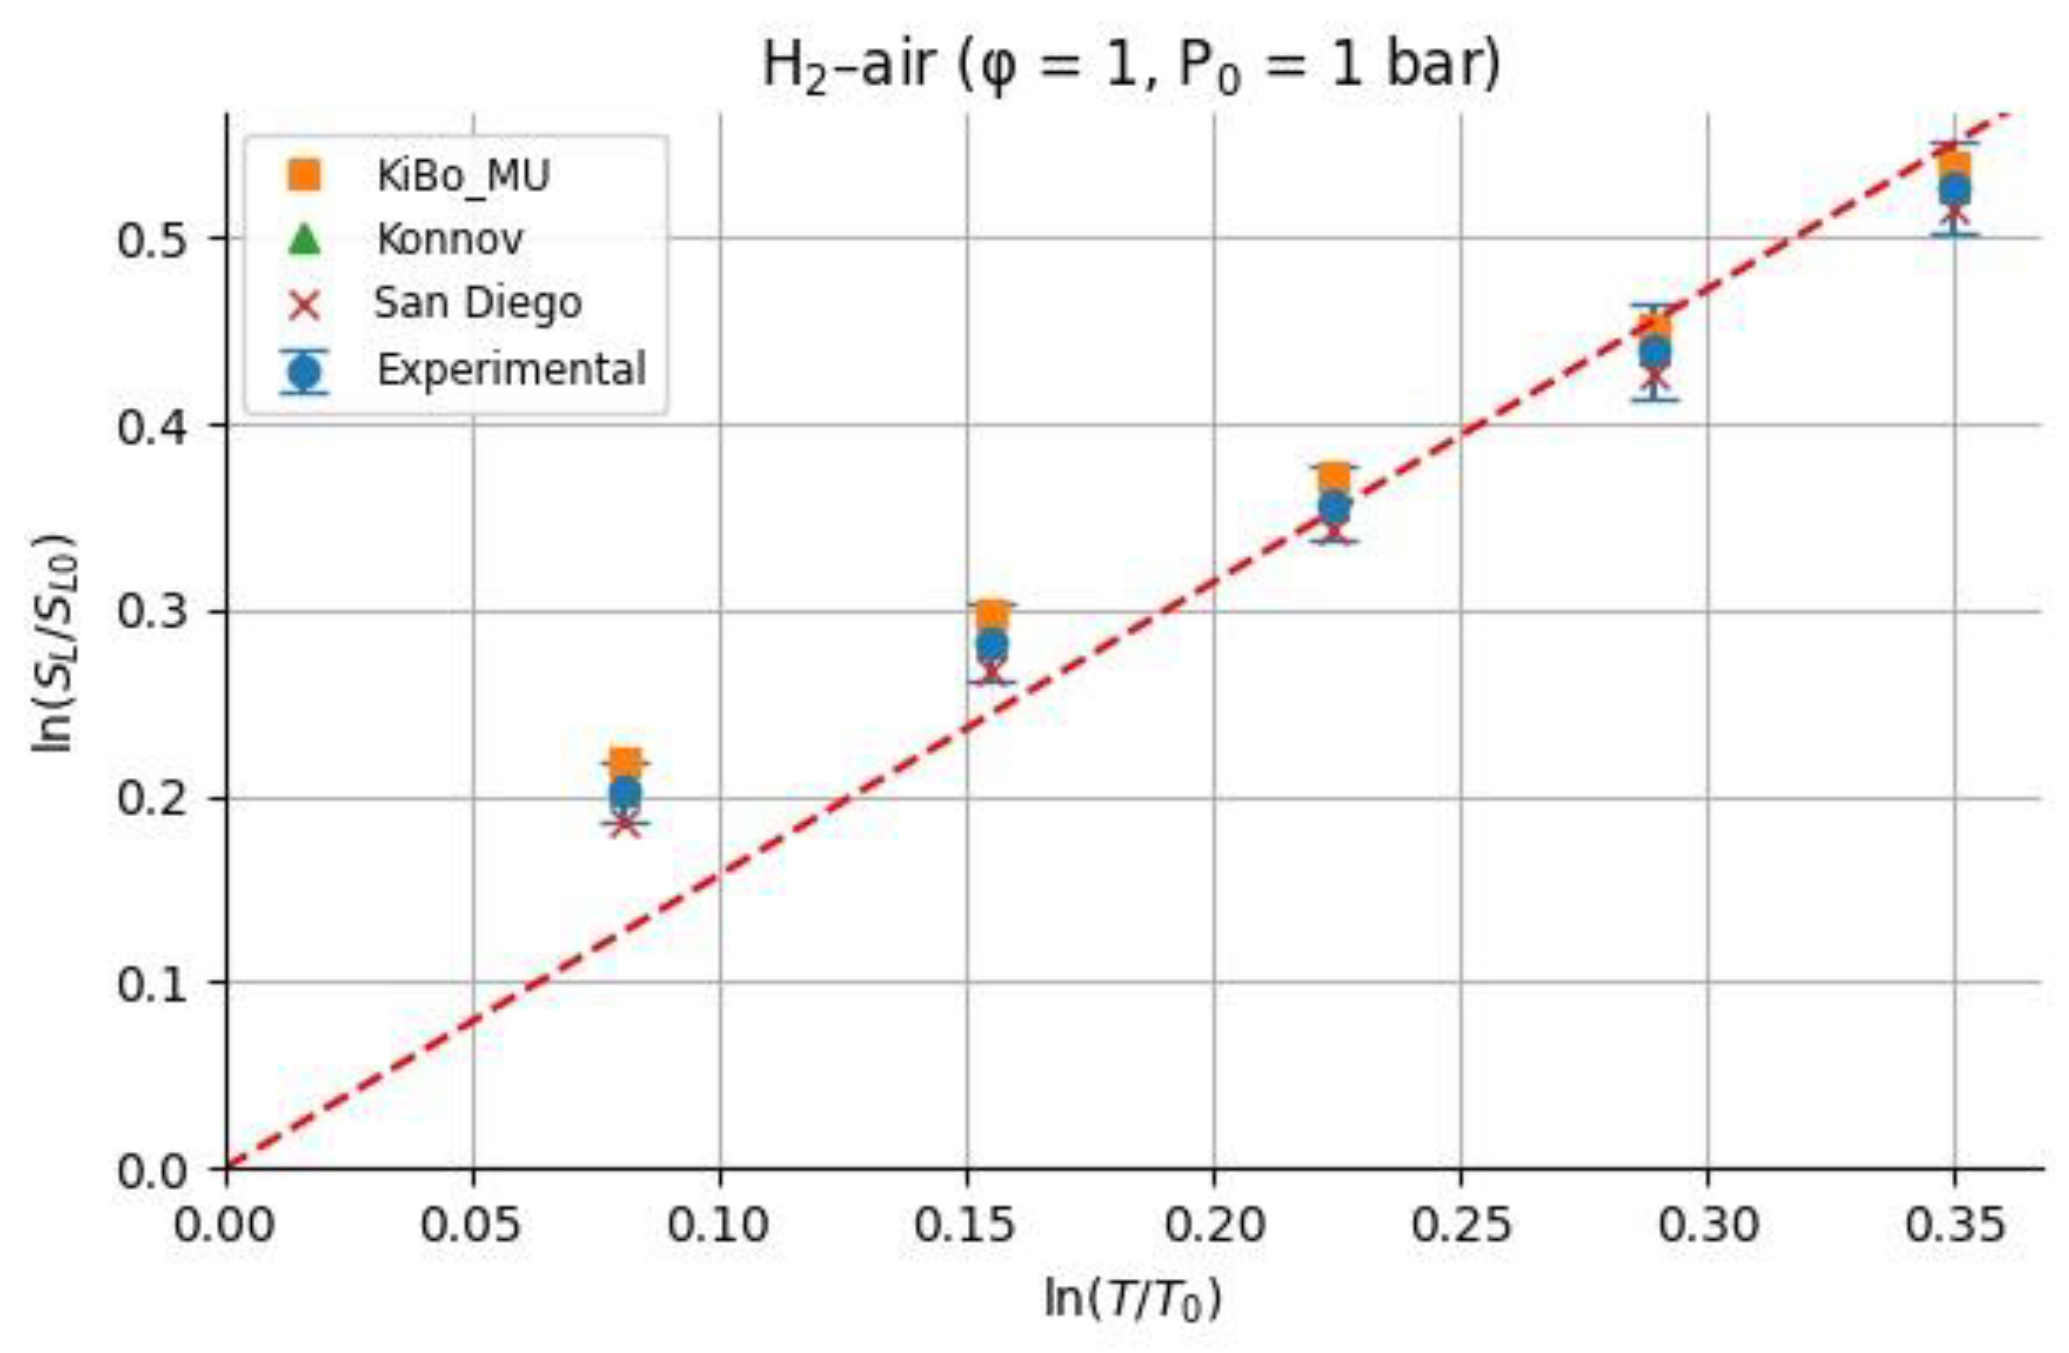
Figure 11.
for methane-air mixture based on experiments and kinetics.
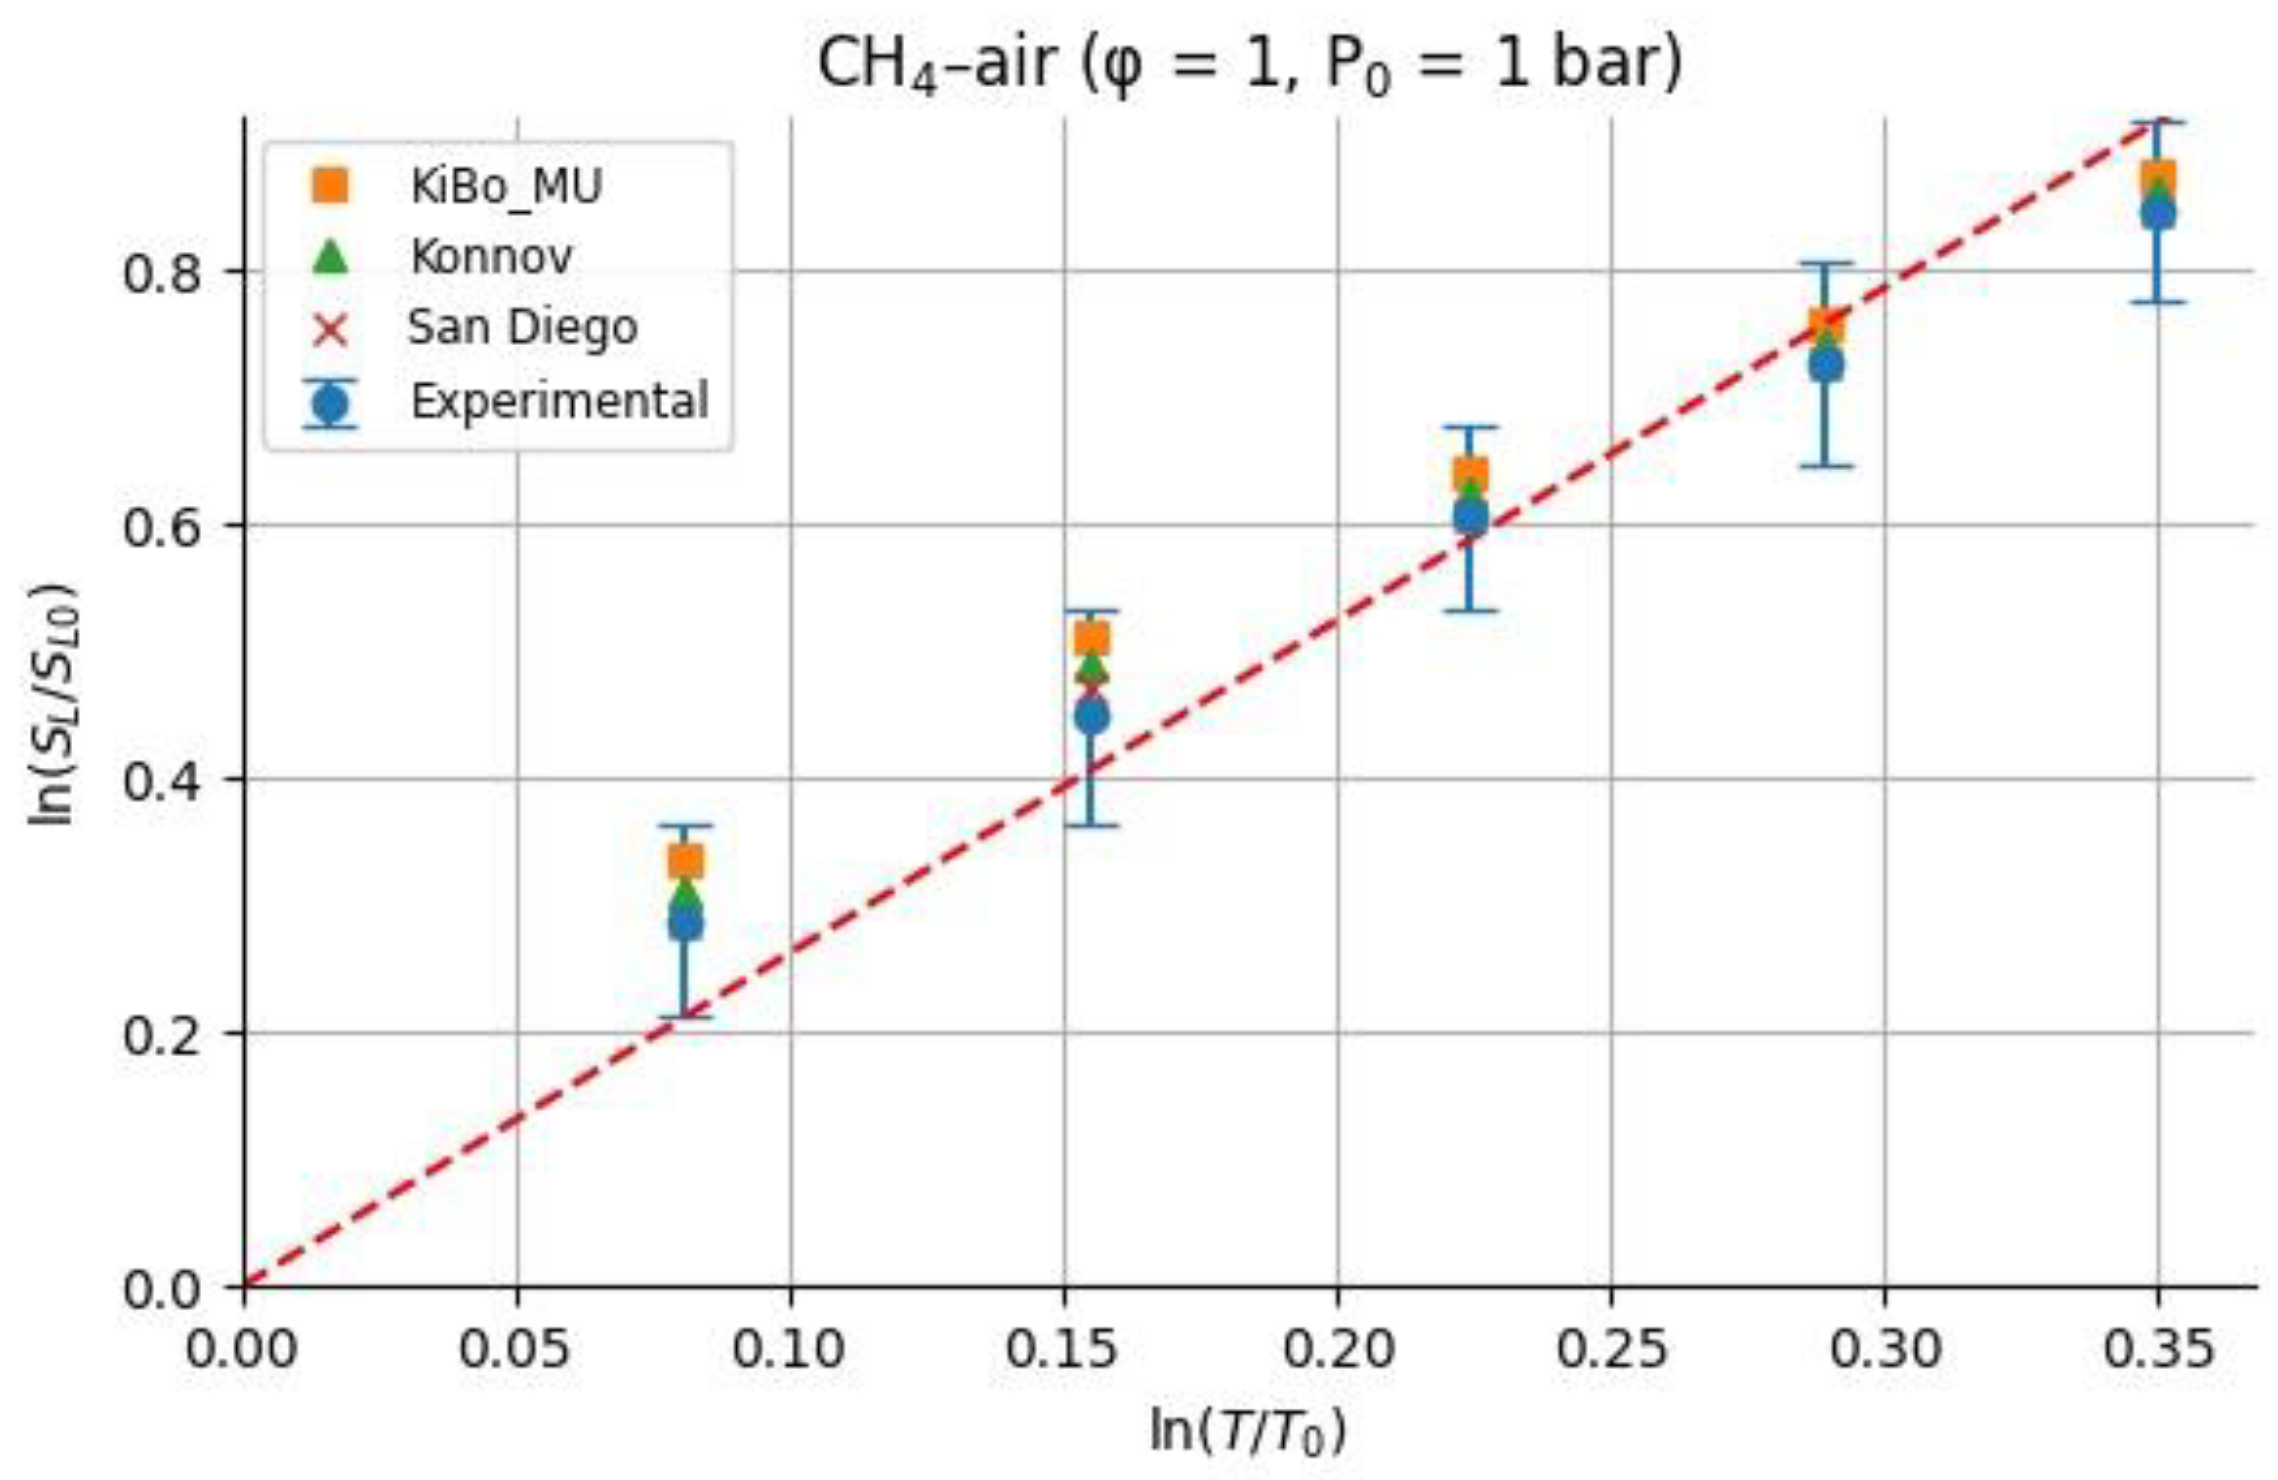
Figure 12.
Comparison of deflagration index and laminar burning velocity; CH4-air (a) and H2-air (b). Symbols: experimental data. Broken lines: simulation results.
Figure 12.
Comparison of deflagration index and laminar burning velocity; CH4-air (a) and H2-air (b). Symbols: experimental data. Broken lines: simulation results.
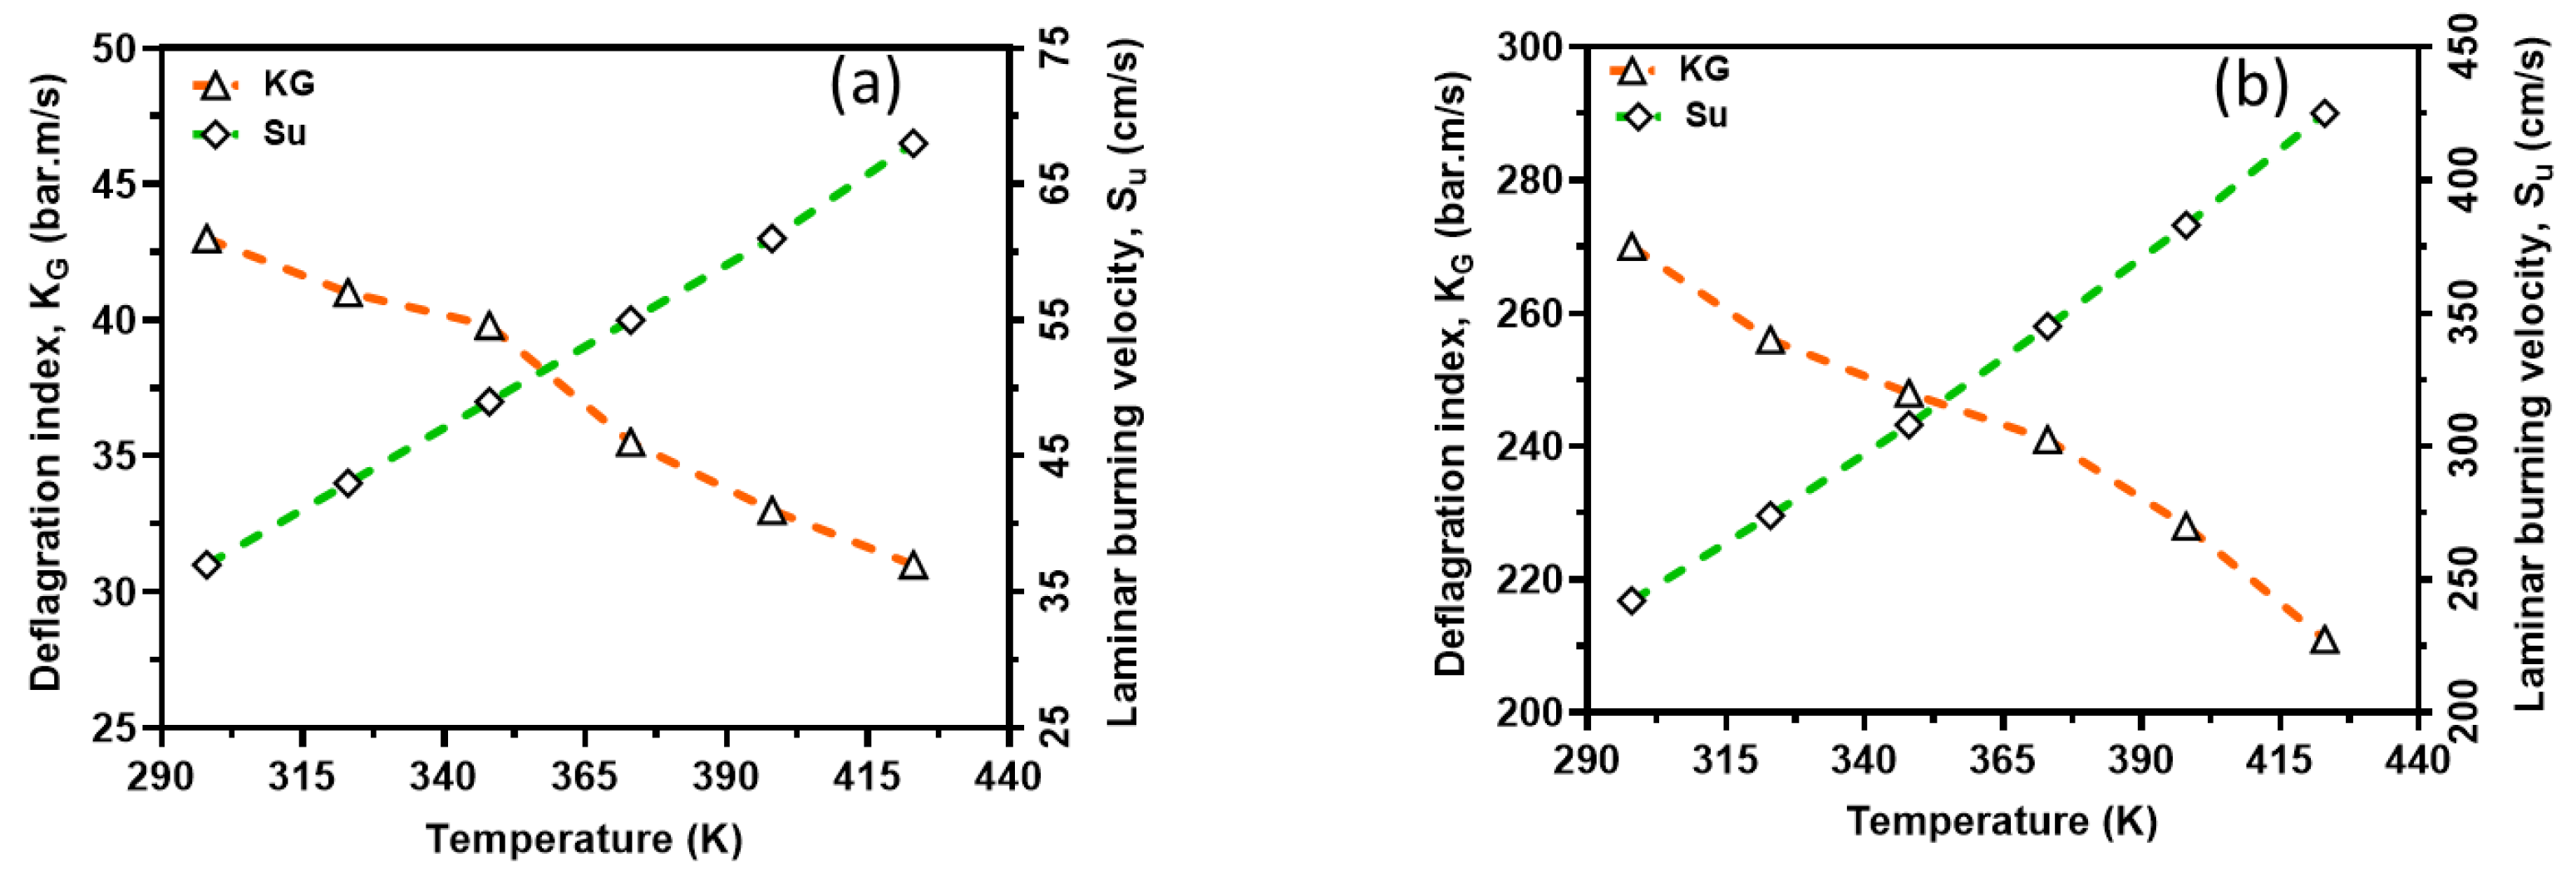
Figure 13.
Deflagration index as a function of actual explosion pressure; CH4-air (a) and H2-air (b). Symbols: experimental data. Broken lines: simulation results.
Figure 13.
Deflagration index as a function of actual explosion pressure; CH4-air (a) and H2-air (b). Symbols: experimental data. Broken lines: simulation results.
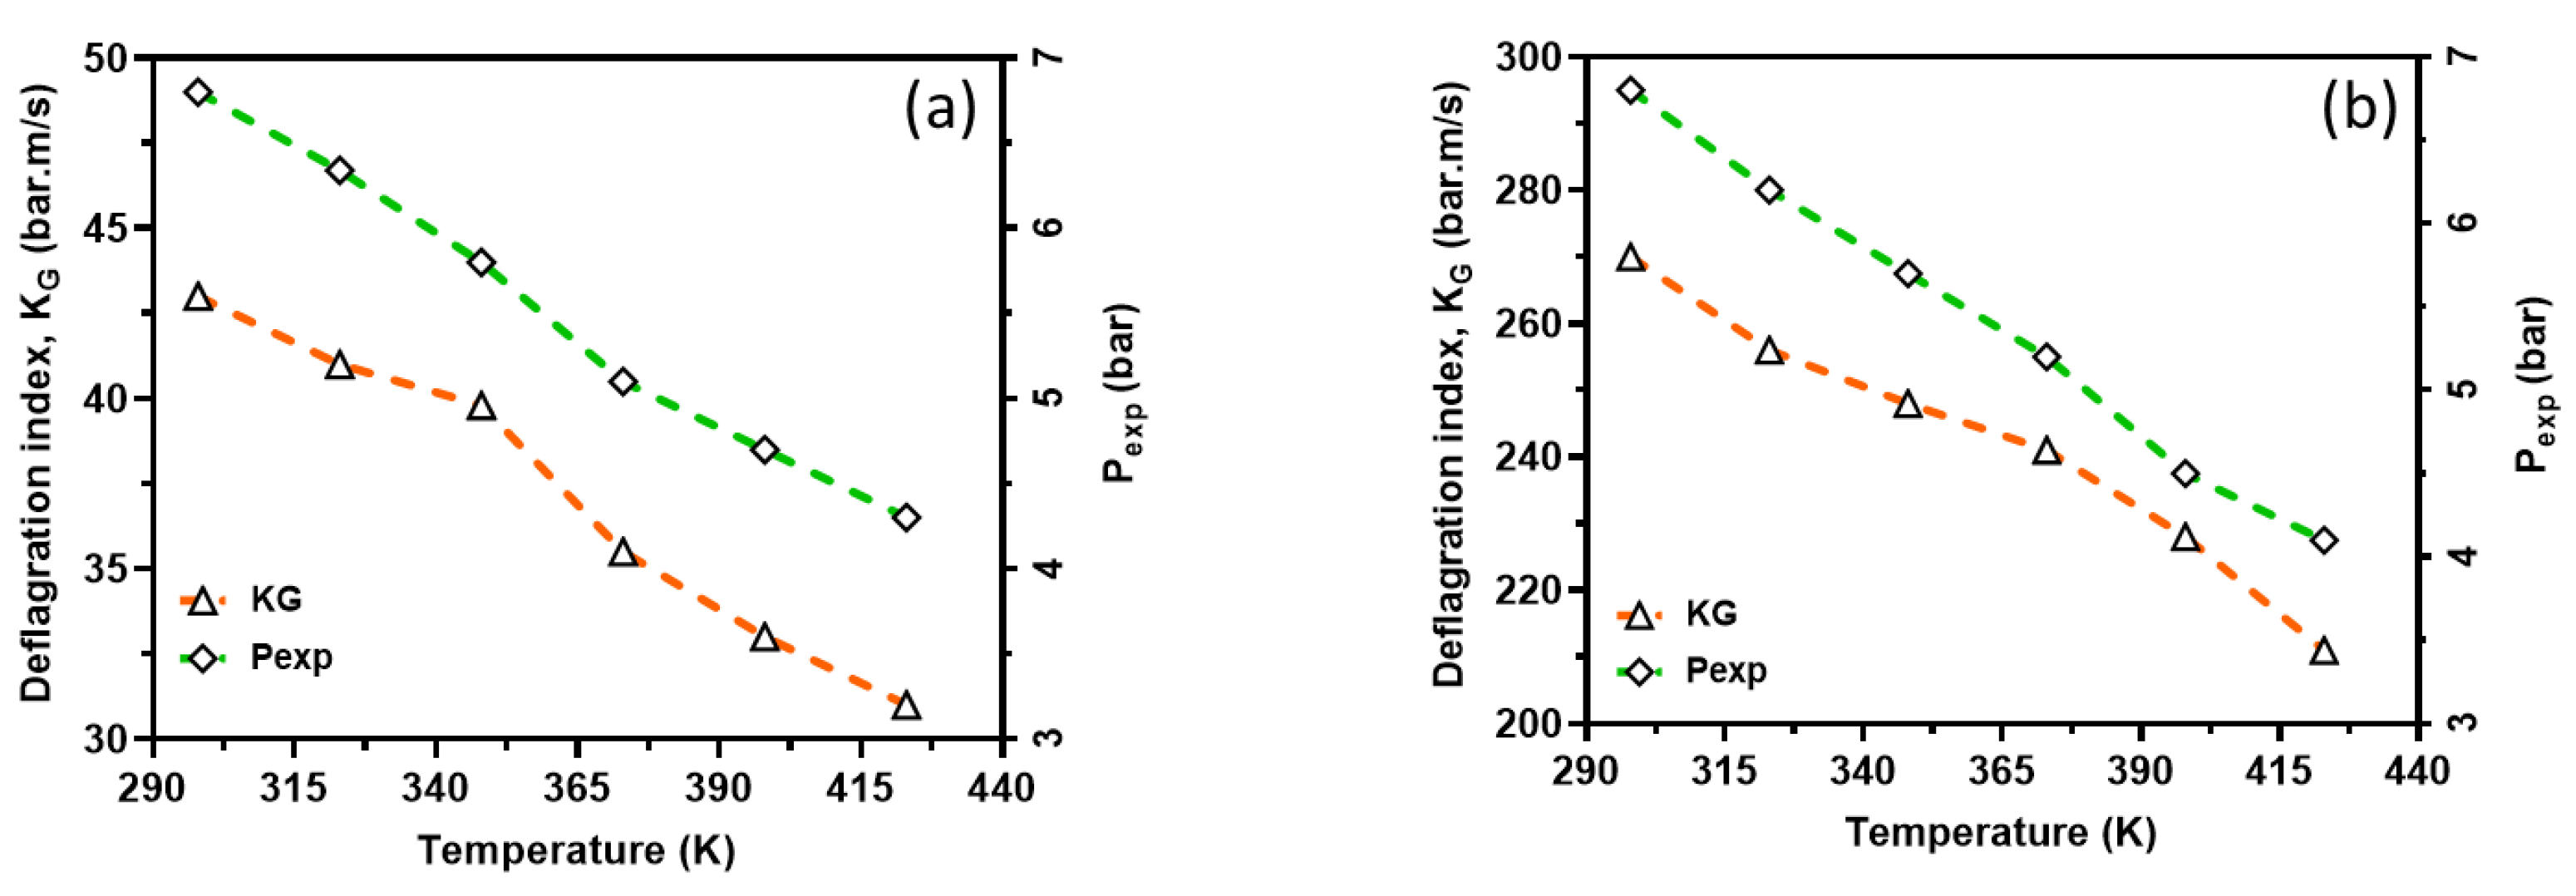
Table 1.
Description of experimental set-up.
| Set-up component | Description of the experimental set-up |
|---|---|
| 1. Combustion chamber | A 20 dm³ stainless steel spherical combustion chamber, resistant to high pressures and corrosion, with dedicated ports for the introduction and removal of gases and the fuel-air mixture. |
| 2. Ignition initiation system | A central ignition mechanism using a 0.2 mm diameter thin nickel-chromium (Ni-Cr) wire, ignited by an electric arc to ensure precise initiation of the combustion process. |
| 3. Pressure measurement system | An advanced system comprising a pressure transducer, signal amplifier and recording device to accurately measure the explosion pressure in the combustion chamber. |
| 4. Partial pressure mixture preparation unit | A system that allows the precise preparation of a homogeneous fuel-air mixture using the partial pressure technique, ensuring an even distribution of the components. |
| 5. Temperature measurement system | System monitoring the temperature in the chamber by means of a thermocouple, with readings available on the display, equipped with a water jacket to stabilize temperature conditions and minimize heat loss. |
| 6. Safety instruments | A set of instruments to ensure the safe conduct of experiments, including protection against overpressure, gas leakage and other protective measures for operators and apparatus. |
Table 3.
Details of the kinetic mechanisms used in this study.
| Mechanism | No. Species | No. Reactions |
|---|---|---|
| KiBo_MU | 141 | 453 |
| San Diego | 54 | 268 |
| Konnov | 89 | 1419 |
Disclaimer/Publisher’s Note: The statements, opinions and data contained in all publications are solely those of the individual author(s) and contributor(s) and not of MDPI and/or the editor(s). MDPI and/or the editor(s) disclaim responsibility for any injury to people or property resulting from any ideas, methods, instructions or products referred to in the content. |
© 2025 by the authors. Licensee MDPI, Basel, Switzerland. This article is an open access article distributed under the terms and conditions of the Creative Commons Attribution (CC BY) license (http://creativecommons.org/licenses/by/4.0/).
Copyright: This open access article is published under a Creative Commons CC BY 4.0 license, which permit the free download, distribution, and reuse, provided that the author and preprint are cited in any reuse.


