Submitted:
14 September 2024
Posted:
16 September 2024
You are already at the latest version
Abstract
Hydrogen and carbon monoxide over-equilibria have been found computationally in kinetic dependencies of methane reforming catalytic reactions (steam and dry reforming) using conditions of the conservatively perturbed equilibrium (CPE) phenomenon, i.e. at the initial equilibrium concentration of hydrogen or carbon monoxide. The influence of pressure, temperature, flow rate and composition of the initial mixture on the position of the CPE point (the extremum point) was investigated in a wide domain of parameters. It is demonstrated that the CPE phenomenon significantly increases the product concentration (H2 and CO) at the reactor length which is significantly less than the reactor length required to reach the equilibrium. The CPE-point was interpreted as the “turning point” in kinetic behavior. Recommendations on the temperature and pressure regimes are different from the traditional ones related to the Le Chatelier’s law. Obtained results provide valuable information on optimal reaction conditions for complex reversible chemical transformations, offering potential applications in chemical engineering processes.
Keywords:
modelling
; optimization
; methane reforming
; chemical equilibrium
; conservatively perturbed equilibrium
; extremum
; CPE point
1. Introduction
Increasing the intensity of a complex catalytic reaction is a fundamental challenge in chemical technology, particularly when it comes to achieving the kinetic characteristics above equilibrium (such as rate, concentration, and selectivity) under transient non-steady-state conditions. As well known, the chemical equilibrium represents the final state of complex chemical reaction for both closed systems and open systems of infinite length.
The equilibrium composition is characterized by its uniqueness and stability. In a closed chemical system, this implies that for a fixed quantity of chemical elements at a given temperature, the system will always reach the same chemical composition from any initial state, ensuring that the equilibrium composition is both unique and stable. Zel’dovich [1,2] qualitatively demonstrated these properties in 1938. Since the 1960s, numerous researchers including Shapiro, Shapley [3], Aris [4,5], Horn, Jackson [6], Volpert, Khudyaev [7,8], and Gorban’ [9], along with Gorban’ and Yablonsky [10,11], have examined this problem more rigorously. Their detailed findings are documented in various monographs [12,13].
Calculating equilibrium composition has become essential for addressing the numerous issues in chemical and biochemical engineering. These calculations are typically based on a procedure that employs a list of components with known chemical potentials minimizing the Gibbs free energy. It is assumed that the system’s temperature and the total amount of any specific chemical element remain constant throughout the process.
2. Analysis of Previous Studies
Conservatively Perturbed Equilibrium (CPE). Definition and Properties
In [14,15,16,17,18], a new phenomenon in chemical kinetics, the conservatively perturbed equilibrium (CPE), was described and analyzed. To achieve this phenomenon, some initial concentrations of components are replaced by the corresponding equilibrium concentrations while keeping the total amount of each chemical element constant. The temperature of the system should be held constant too.
The computational phenomenon CPE is carried out as follows:
- The values of equilibrium concentrations of all components are determined.
- Some components are selected so that their initial concentrations differ from the equilibrium concentrations.
- At least one component is selected such that its initial concentration is equal to the equilibrium value.
- Perturbations introduced before (see item 2) must comply with all conservation laws applicable to this reaction system.
- The evolution of all concentrations is observed as they tend toward the equilibrium.
The CPE phenomenon is illustrated based on the consecutive reactions [19]:
In accordance with the mass-action law, the steady-state kinetic model for the plug flow reactor (PFR) is expressed as follows:
where CA, CB, CC are concentrations of substances A, B, and C, respectively; τ is residence time. – are the rate coefficients of the corresponding forward and reverse reactions.
Obviously, , where are initial concentrations of substances A, B, C, respectively. The following kinetic parameters and equilibrium concentrations are used:
where , and are equilibrium concentrations of substances A, B, and C, respectively.
Concentration dependencies for reactions (1) performed in the PFR with the CPE phenomenon represent the properties of the CPE phenomenon.
Figure 1.
Dimensionless concentration dependencies for reactions (1).
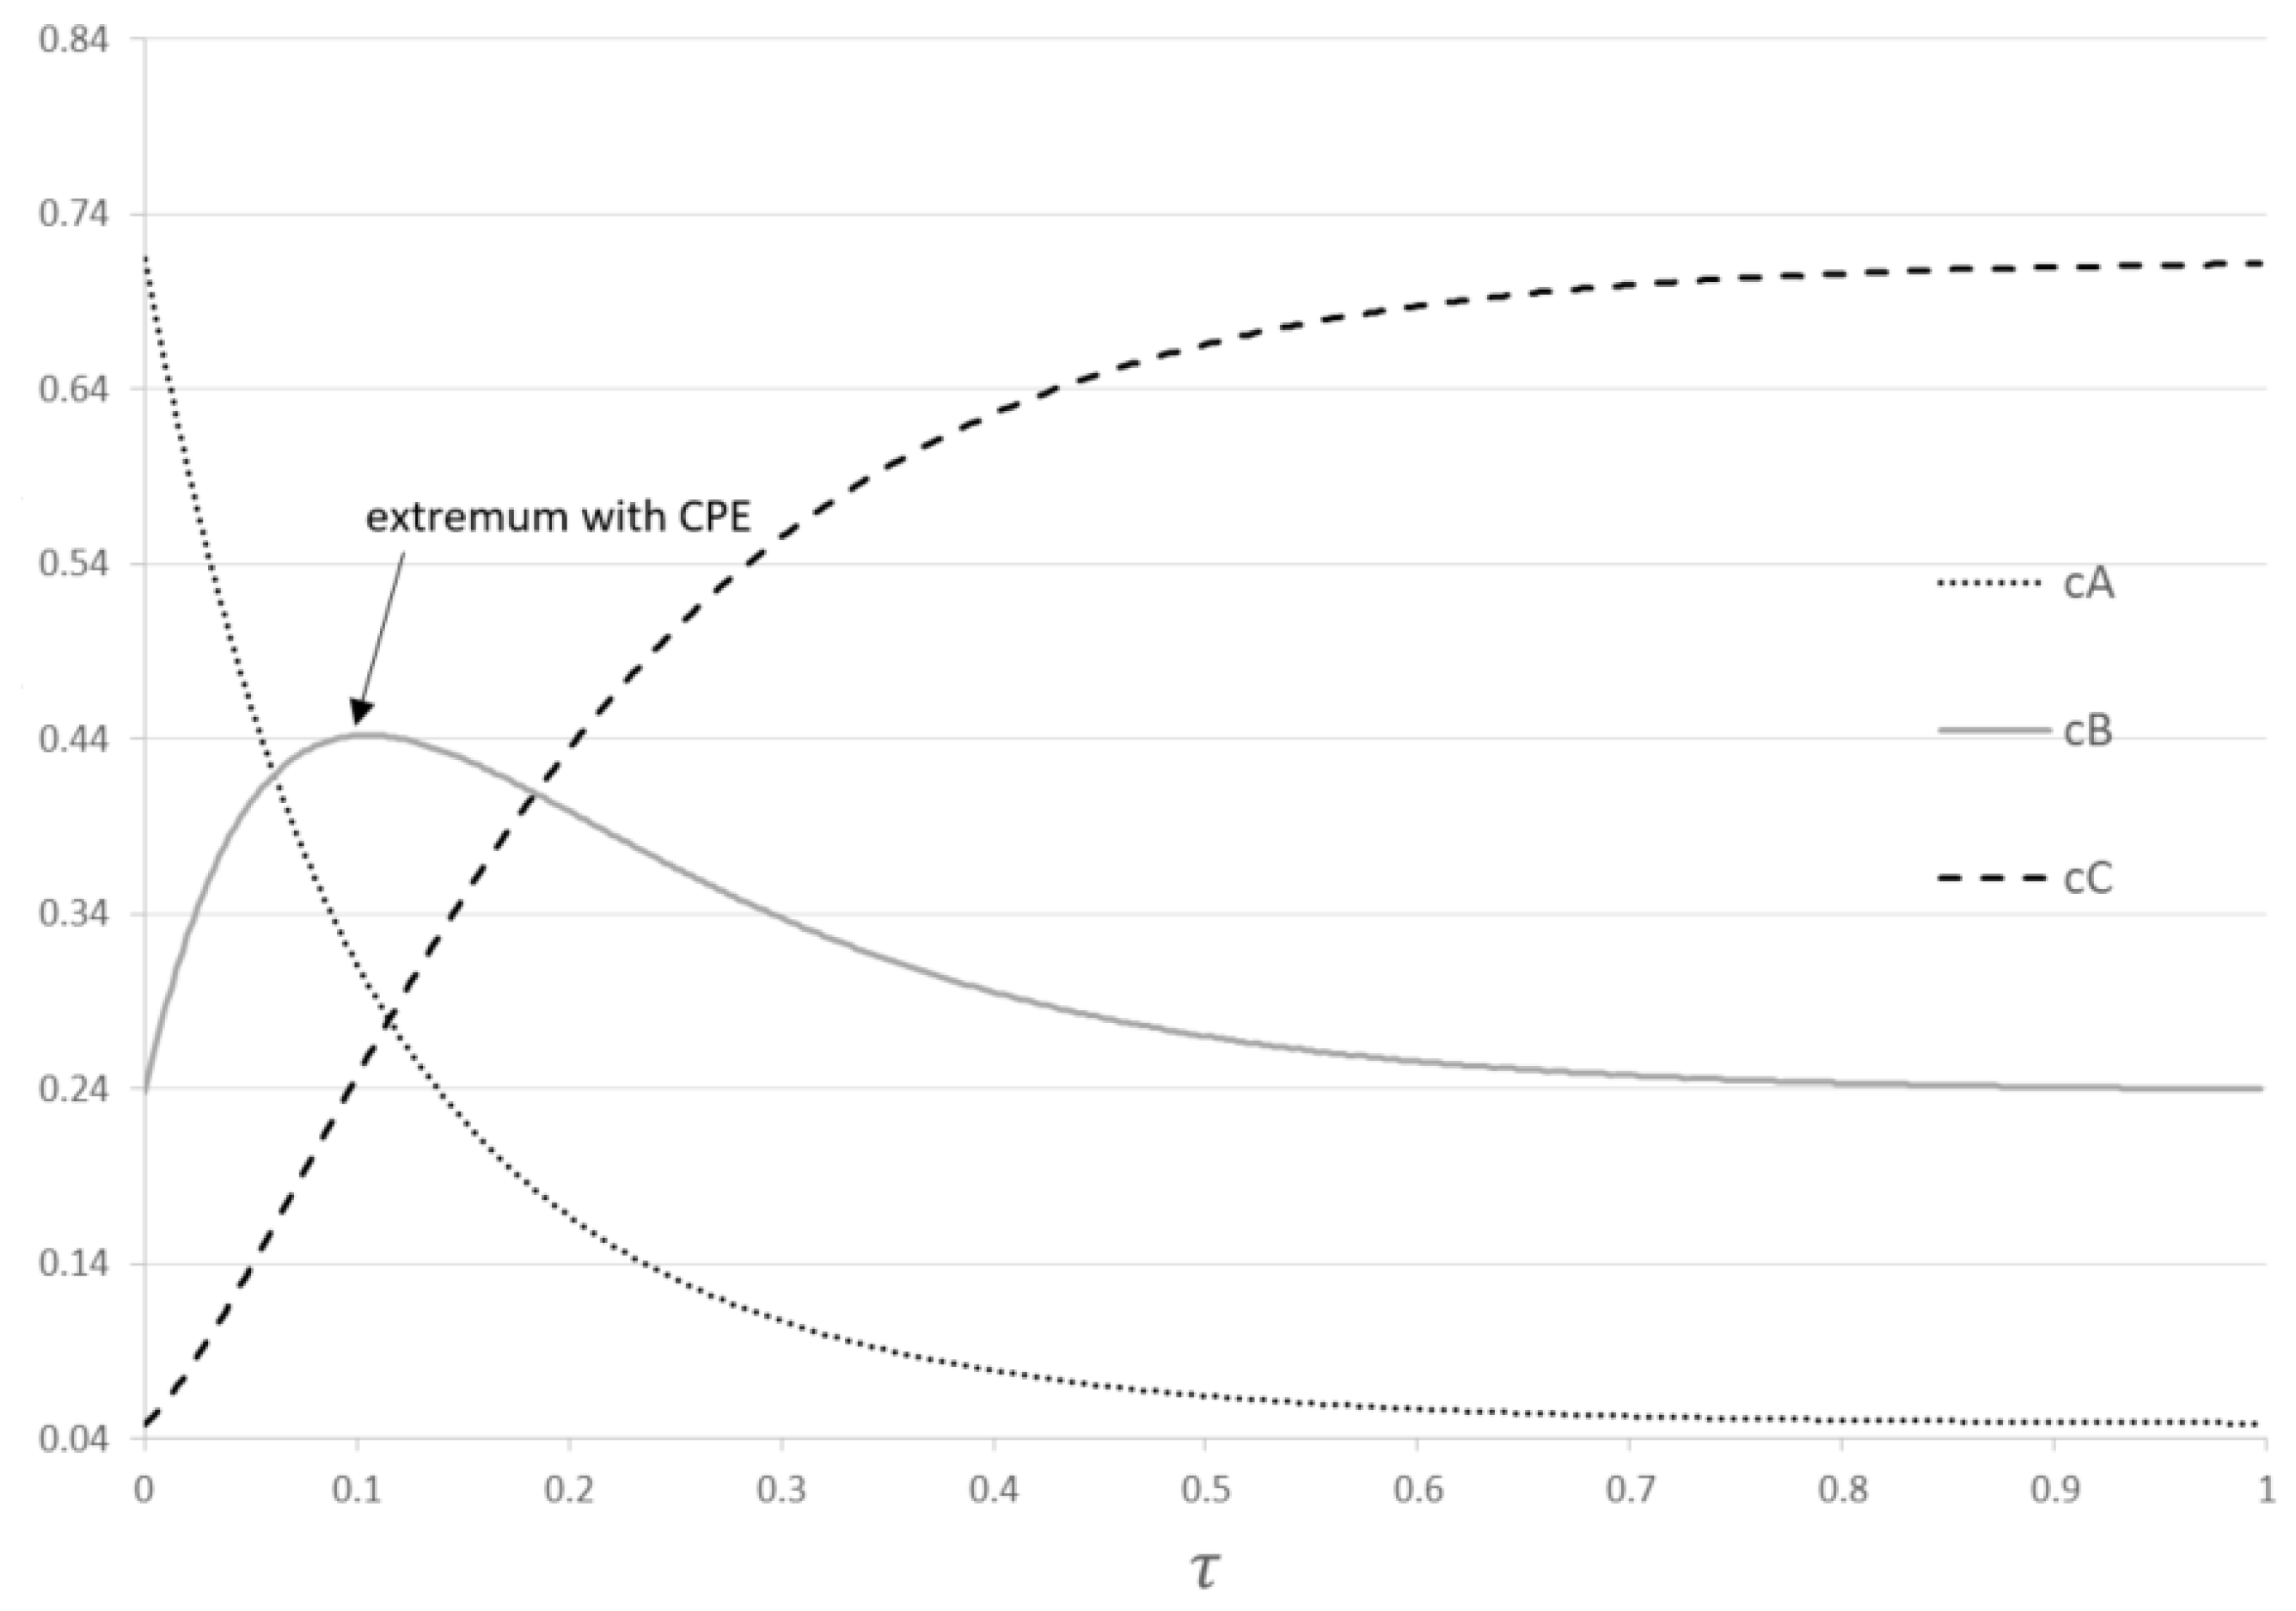
The concentration of component B passes through the unavoidable extremum and goes to its equilibrium value:
Three concentration dependences for different initial compositions of the mixture are shown (Figure 2). In this linear case, two important features are demonstrated: 1) the CPE point does not change its position when the initial composition of the mixture changes; 2) the greater the deviation of the concentration of disturbed substances within balance limitations, the higher the magnitude of the CPE extremum. For the general linear case, the rigorous theoretical proof of these two findings is still lacking. However, for typical examples of simple linear mechanisms, these properties are demonstrated computationally.
The value of this extremum can provide important information about the detailed mechanism and kinetic parameters. This information about the CPE phenomenon can be used for searching the optimal operating conditions for complex reversible chemical transformations [20]. Recently, the CPE method has been experimentally tested in a batch reactor for the complex esterification reaction in which ethanol and benzyl alcohol are reacted with acetic acid to form two different esters and water [21].
The goal of this paper is a continuation of our previous work [22] in which the CPE phenomenon was just demonstrated computationally for the reforming of methane (RM) reactions using a limited number of parameters. In this paper, we are going to study this phenomenon systematically, presenting the effect of different process parameters in a wide range, i.e., pressure, initial mixture composition, and flow rate as well on the kinetic dependencies, especially on CPE point characteristics. Also, the temperature domain will be modified. In the paper, the physicochemical meaning of the CPE point will be interpreted.
The obtained CPE characteristics will be compared with cases without CPE and recommendations which correspond to the known Le Chatelier’s law.
Steam and dry reforming overall reactions are considered in the reforming of methane (RM) process (see Table 1).
3. Methods
Mathematical modelling of reforming reactions was based on kinetic equations of dry and steam reforming on the nickel catalyst which were taken from the literature [23].
Generally, these equations are nonlinear. However, in both cases, kinetic terms andare linear. In accordance with the CPE requirements, in any experiment the total amounts of any element (C, H, and O) must be conserved.
where N is the total number of atoms of a specific element (C, H, or O) in all the respective compounds. Parameters of the system are listed in Table 2.
In this case, we consider that concentrations of catalytic intermediates are negligible in comparison with concentrations of reactants .
4. Results
Figure 3 shows the effect of the CPE phenomenon on concentration profiles of H2 and CO in comparison with no CPE case. Under given pressure and temperature conditions, the concentration of products can be increased using the CPE phenomenon by 39% and 49% for H2 and CO, respectively. Additionally, utilizing the CPE phenomenon allows for a reduction of reactor length due to the faster occurrence of the extremum (CPE point) compared to the case without CPE phenomenon. Later, the kinetic dependencies with the CPE phenomenon and without it will be compared in more detail.
Figure 4 and Figure 5 demonstrate the effect of pressure and temperature on the kinetic dependencies, especially on the position of the CPE point regarding the products, H2 and CO, respectively.
As can be seen from Figure 4 and Figure 5, pressure, temperature, and flow rate all affect the position of the CPE point. An increase in temperature or pressure has a positive effect on the value of the CPE point, causing the magnitude of this point to increase. Additionally, higher temperatures or pressures result in a shorter reactor length required to reach the CPE point. With the increase in the flow rate, the magnitude of the CPE point does not change. However, the length of the reactor at which the extremum occurs is increased in such a way that the residence time of CPE point remains almost constant. These findings are consistent with previous results obtained for simple linear mechanisms [14,15]. It should be noted that when temperature and pressure are increased simultaneously, the CPE point occurs faster compared to when these parameters are changes separately (e.g., increasing temperature while maintaining a constant pressure).
The kinetic behaviour of CPE extrema varies significantly depending on the initial concentration of H2 and CO. For hydrogen, the position of the CPE point changes insignificantly.
CPE Phenomenon vs No CPE Cases. CPE Phenomenon and Le Chatelier’s Law
For a more detailed understanding, computer simulations without CPE have been systematically performed.
Specifically, we analysed the effect of pressure and temperature changes for dry reforming and steam reforming reactions for two cases:
- a)
- b)
Both steam and dry reforming reactions are endothermic and both result in an increase in number of molecules i.e., four molecules of products compared to two molecules of reactants. In accordance with the Le Chatelier’s law the optimal equilibrium regimes are the following ones: the temperature is increased; the pressure is decreased.
Our computer calculations demonstrate similar behaviour for both cases regardless of whether methane reforming has occurred for two processes together of for the separate process. All kinetic dependencies exhibit a plateau which reflects the near-equilibrium regime. This plateau increases as the temperature rises and decreases as the pressure rises. Beyond the equilibrium regime, both temperature and pressure affect the concentration of products, H2 and CO, in proportion to the kinetic term of equations (5), or .
The CPE phenomenon where both temperature and pressure promote the concentration of H2 and CO, is different from the recommendations of Le Chatelier’s law and similar to kinetic behaviour beyond the domain of the Le Chatelier’s law. However, as mentioned, concentrations of products for the CPE regimes are significantly higher than the ones for no-CPE cases.
5. Discussion
CPE Point: Analysis and Interpretation. CPE as the Turning Point
To gain a detailed understanding of the physicochemical significance of the CPE phenomenon, the typical longitudinal profiles of reaction rates are presented. For the CPE case related to hydrogen (Figure 10 a), reaction rates for dry and steam reforming are shown. Evidently, the steam reforming reaction undergoes a reversal, crossing the equilibrium and changing its direction to become exothermic. The reaction rate reaches zero precisely at the CPE point for hydrogen. Therefore, this CPE point is at the same time the turning point of the steam reforming reaction.
Similarly, for the CPE case related to CO (Figure 10 b), the dry reforming reaction also reverses crossing the equilibrium, and becoming exothermic. The rate of dry reforming reaches zero at the CPE point for CO, which occurs at the same time as the turning point of this reaction.
The corresponding longitudinal profiles of component concentrations are presented in Figure 11a,b. In the case of the hydrogen CPE point, the hydrogen concentration maximum coincides with the water concentration minimum. The CO2 concentration decrease is accompanied by the CO concentration increase. For the carbon monoxide CPE point, the CO maximum coincides with the CO2 minimum, and the water concentration decrease is accompanied by the hydrogen concentration increase.
There is an interesting feature in kinetic behaviour of our system. Initially, in the hydrogen CPE case, the concentration of hydrogen is equal to the equilibrium one. Then, under conditions that the concentration of CO is absent or small, the hydrogen concentration can only increase, not decrease. This is achieved via forward reactions of dry and steam reforming because reverse reactions are absent or negligible. This is a reason of the over equilibrium, which is also the momentary equilibrium of the steam reforming reaction. So, at the CPE point, this reaction reverses, and the CPE point becomes the turning point. It is a physicochemical explanation for our over equilibrium effect.
A similar explanation can be done for the carbon monoxide CPE case, which is observed when the initial concentration of CO is high and H2 is negligible or absent.
Starting from the CPE point, an almost steady-state concentration of methane is observed (Figure 11 a, b).
The reason is the following: one of two reactions, steam or dry reforming, goes in reverse direction and balances another reaction, dry or steam reforming, respectively. Formally, starting from the CPE point the condition is fulfilled approximately: .
Then, in this domain related to the CPE hydrogen case (Figure 11 a), rates of other substances are:
It is easy to understand, that in this scenario, the combined overall equation is realized: ,, i.e., the reverse water-gas-shift reaction (RWGS).
In another domain related to the CPE carbon monoxide case (Figure 11 b), rates are:
The combined overall reaction can be presented as follows: , i.e., the water-gas-shift reaction (WGS).
Evidently, the water-gas-shift reaction, forward or reverse, can be obtained as a linear combination of dry and steam reforming reactions. Summing up, this reaction can be considered as an essential simplification of our chemical process: two reactions of methane reforming ‘degenerate’ into one water-gas-shift reaction, forward or reverse.
6. Conclusions
Kinetic dependencies for two methane reforming reactions, dry and steam reforming, were studied systematically for the conservatively perturbed equilibrium (CPE) phenomenon, i.e., at the initial equilibrium concentration of hydrogen or carbon monoxide, in a wide domain of parameters: temperature (873.15 – 1023.15 K), pressure (5 – 20 bar), initial concentrations of other substances, flow rate (50 – 200 kg/h). The obtained results confirmed that the changes in pressure and temperature significantly influence the CPE effect, resulting in the ‘over-equilibrium’ for hydrogen and carbon monoxide which is achieved at the residence time and corresponding reactor length that are much shorter than the length of the typical industrial reactor. The recommendations for temperature and pressure control based on CPE phenomenon were compared with recommendations based on Le Chatelier’s law related to equilibrium regimes revealing a notable difference between them.
A physicochemical interpretation of the CPE points, both for hydrogen and carbon monoxide cases, was conducted. It was shown that the over equilibrium observed under CPE conditions occurs due to the absence of the reverse reaction rates. Furthermore, it was found that beyond the CPE point two reforming reactions become opposite to each other and balance each other out. Finally, these two reactions ‘degenerate’ into the water-gas-shift reaction, forward or reverse.
These findings suggest that the CPE phenomenon could be utilized as an efficient tool for understanding the kinetic dependencies of reforming processes and for optimising industrial reactors as well.
This could lead to the development of new optimal strategies in various industrial applications, particularly in processes where maximizing reaction efficiency and product yield is crucial.
Author Contributions
Conceptualization, G.S.Y. and V.R.T.; methodology, D.O.K.; software, V.R.T.; validation, M.O.V.; resources, M.O.V.; data curation, G.S.Y.; writing—original draft preparation, V.R.T.; writing—review and editing, G.S.Y., D.O.K. and M.O.V.; visualization, V.R.T.; supervision, G.S.Y. All authors have read and agreed to the published version of the manuscript.
Funding
This research received no external funding
Conflicts of Interest
The authors declare no conflicts of interest.
References
- Zel’dovich, Ya.B. A proof of the uniqueness of the solution of the equations for the law of mass action. Zh. Fiz. Khim. 1938.
- Zel’dovich, Ya.B. Selected Works of Yakov Borisovich Zeldovich: Chemical Physics and Hydrodynamics; Princeton University Press: Princeton, NJ, USA, 2014. [Google Scholar]
- Shapiro, N.Z.; Shapley, L.S. Mass action laws and the Gibbs free energy function. J. Soc. Ind. Appl. Math. 1965. [CrossRef]
- Aris, R. Prolegomena to the rational analysis of systems of chemical reactions. Arch. Ration. Mech. Anal. 1965, 19. [Google Scholar] [CrossRef]
- Aris, R. Prolegomena to the rational analysis of systems of chemical reactions II. Some addenda. Arch. Ration. Mech. Anal. 1968, 27. [Google Scholar]
- Horn, F.; Jackson, R. General mass action kinetics. Arch. Ration. Mech. Anal. 1972, 47. [Google Scholar] [CrossRef]
- Vol’pert, A.I. Deferential equations on Figures. Math USSR Sbornik 1972, 17. [Google Scholar]
- Vol’pert, A.I.; Khudyaev, S.I. Analysis in Classes of Discontinuous Functions and Equations of Mathematical Physics; Martinus Nijhous: Dordrecht, The Netherlands, 1985. [Google Scholar]
- Gorban, A.N. On the problem of boundary equilibrium points. React. Kinet. Catal. Lett. 1980, 15. [Google Scholar]
- Gorban, A.N.; Yablonsky, G.S. Extended detailed balance for systems with irreversible reactions. Chem. Eng. Sci. 2011, 63, 375–379. [Google Scholar] [CrossRef]
- Gorban, A.N.; Yablonsky, G.S. Three Waves of Chemical Dynamics. Math. Model. Nat. Phenom. 2015, 10. [Google Scholar] [CrossRef]
- Yablonsky, G.S.; Bykov, V.I.; Gorban, A.N.; Elokhin, V.I. Kinetic Models of Catalytic Reactions. In Comprehensive Chemical Kinetics; Compton, R.G., Ed.; Elsevier: Amsterdam, The Netherlands, 1991; Volume 32. [Google Scholar]
- Marin, G.B.; Yablonsky, G.S.; Constales, D. Kinetics of Chemical Reactions: Decoding Complexity, 2nd ed.; John Wiley–VCH: Weinheim, Germany, 2019. [Google Scholar]
- Yablonsky, G.S.; Branco, D.P.; Marin, G.B.; Constales, D. Conservatively Perturbed Equilibrium (CPE) in chemical kinetics. Chem. Eng. Sci. 2019, 196, 384–390. [Google Scholar] [CrossRef]
- Yiming, X.; Xinquan, L.; Constales, D.; Yablonsky, G.S. Perturbed and Unperturbed: Analyzing the Conservatively Perturbed Equilibrium (Linear Case). Entropy 2020, 22, 1160. [Google Scholar] [CrossRef] [PubMed]
- Trishch, V.R.; Beznosyk, Y.O.; Yablonsky, G.S.; Constales, D. The phenomenon of conservative-perturbed equilibrium in conditions different reactors. Bull. NTUU “Igor Sikorsky Kyiv Polytechnic Institute”. Ser. Chem. Eng. Ecol. Resour. Conserv. 2021, 1. [Google Scholar] [CrossRef]
- Trishch, V.R.; Beznosyk, Y.O.; Constales, D.; Yablonsky, G.S. Over-Equilibrium as a Result of Conservatively-Perturbed Equilibrium (Acyclic and Cyclic Mechanisms). J. Non-Equilib. Thermodyn. 2022, 47, 103–110. [Google Scholar] [CrossRef]
- Trishch, V.R.; Yablonsky, G.S.; Constales, D.; Beznosyk, Y.O. Conservatively perturbed equilibrium in multi-route catalytic reactions. J. Non-Equilib. Thermodyn. 2023, 48, 229–241. [Google Scholar] [CrossRef]
- Yablonsky, G.S.; Constales, D.; Marin, G.B. Equilibrium relationships for non-equilibrium chemical dependencies. Chem. Eng. Sci. 2011, 66, 20004. [Google Scholar] [CrossRef]
- Gorban, A.N.; Constales, D.; Yablonsky, G.S. Transient Concentration Extremum and Conservatively Perturbed Equilibrium. Chem. Eng. Sci. 2020. [CrossRef]
- Peng, B.; Zhu, X.; Constales, D.; Yablonsky, G.S. Experimental verification of conservatively perturbed equilibrium for a complex non-linear chemical reaction. Chem. Eng. Sci. 2020. [CrossRef]
- Vilboi, M.O.; Trishch, V.R.; Yablonsky, G.S. Conservatively Perturbed Equilibrium (CPE)—Phenomenon as a Tool for Intensifying the Catalytic Process: The Case of Methane Reforming Processes. J. Catalysts 2024, 14, 395. [Google Scholar] [CrossRef]
- Izquierdo, U.; Barrio, V.L.; Requies, J.; Cambra, J.F.; Güemez, M.B.; Arias, P.L. Tri-reforming: a new biogas process for synthesis gas and hydrogen production. Int. J. Hydrog. Energy 2013, 38, 7623–7631. [Google Scholar] [CrossRef]
Figure 2.
Concentration dependencies for different initial compositions A and C ().
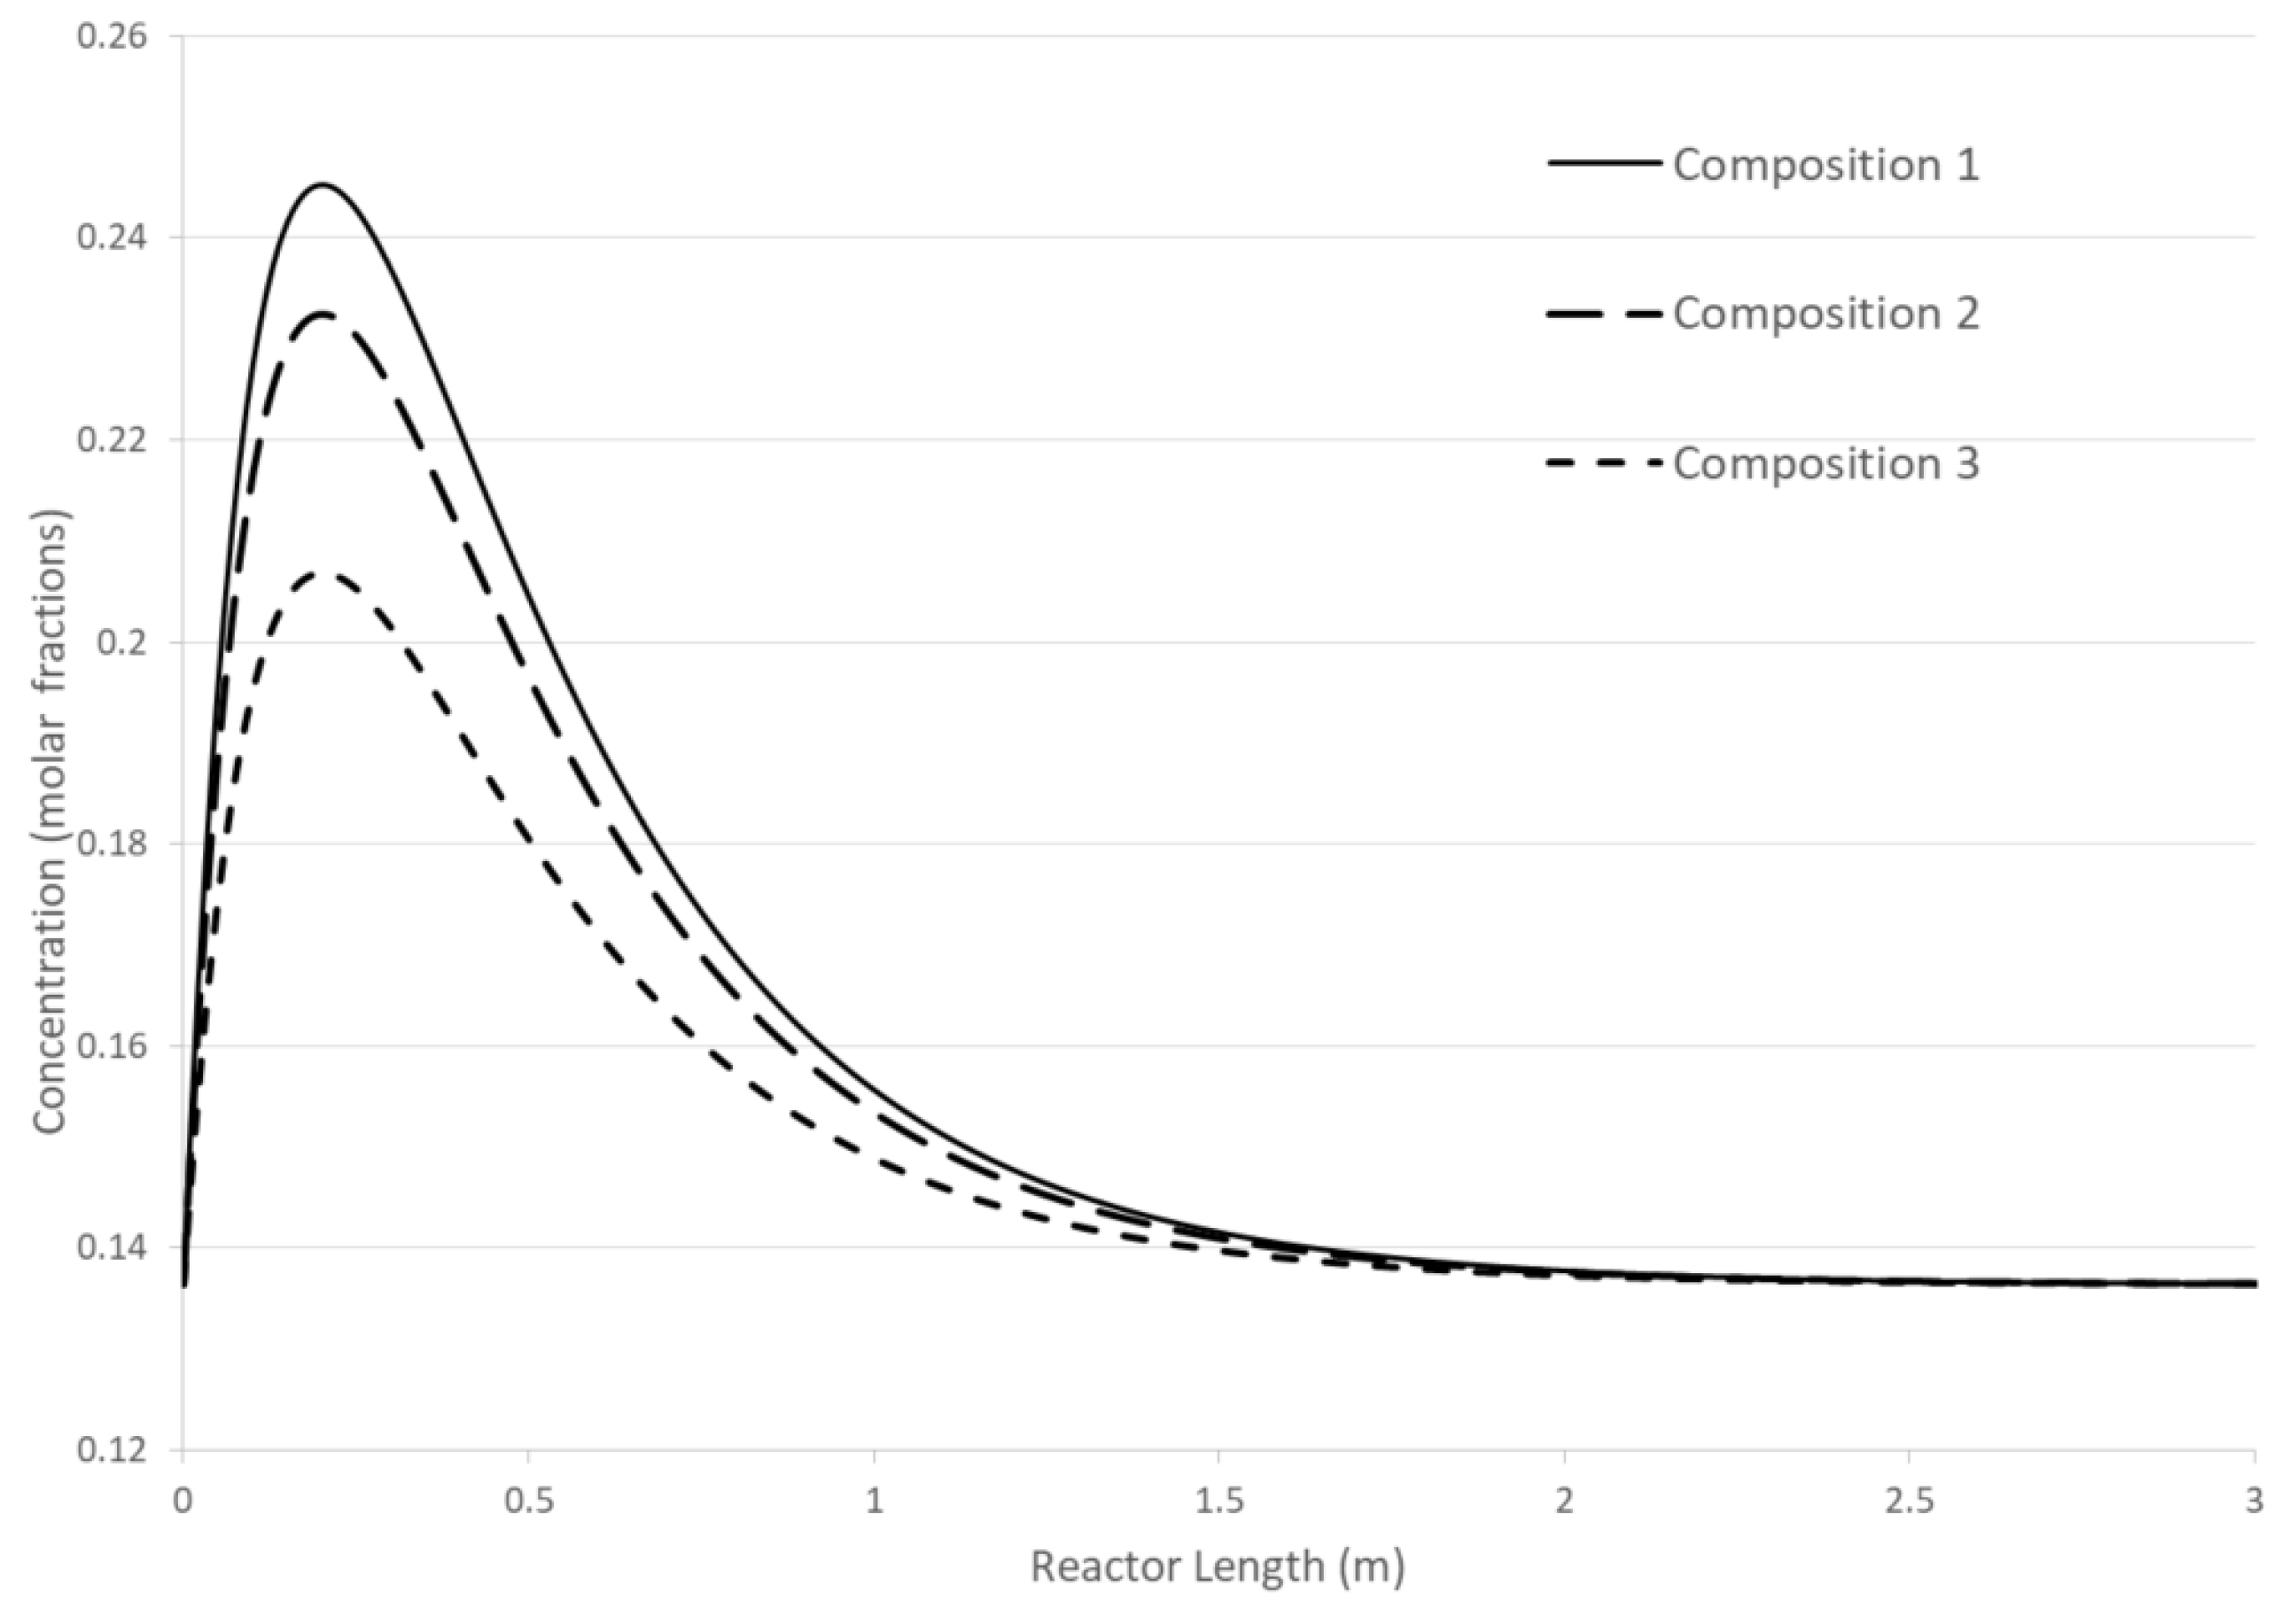
Figure 3.
Longitudinal profile of mole fractions. Cases with and without CPE phenomenon: (a) hydrogen; (b) carbon monoxide.
Figure 3.
Longitudinal profile of mole fractions. Cases with and without CPE phenomenon: (a) hydrogen; (b) carbon monoxide.
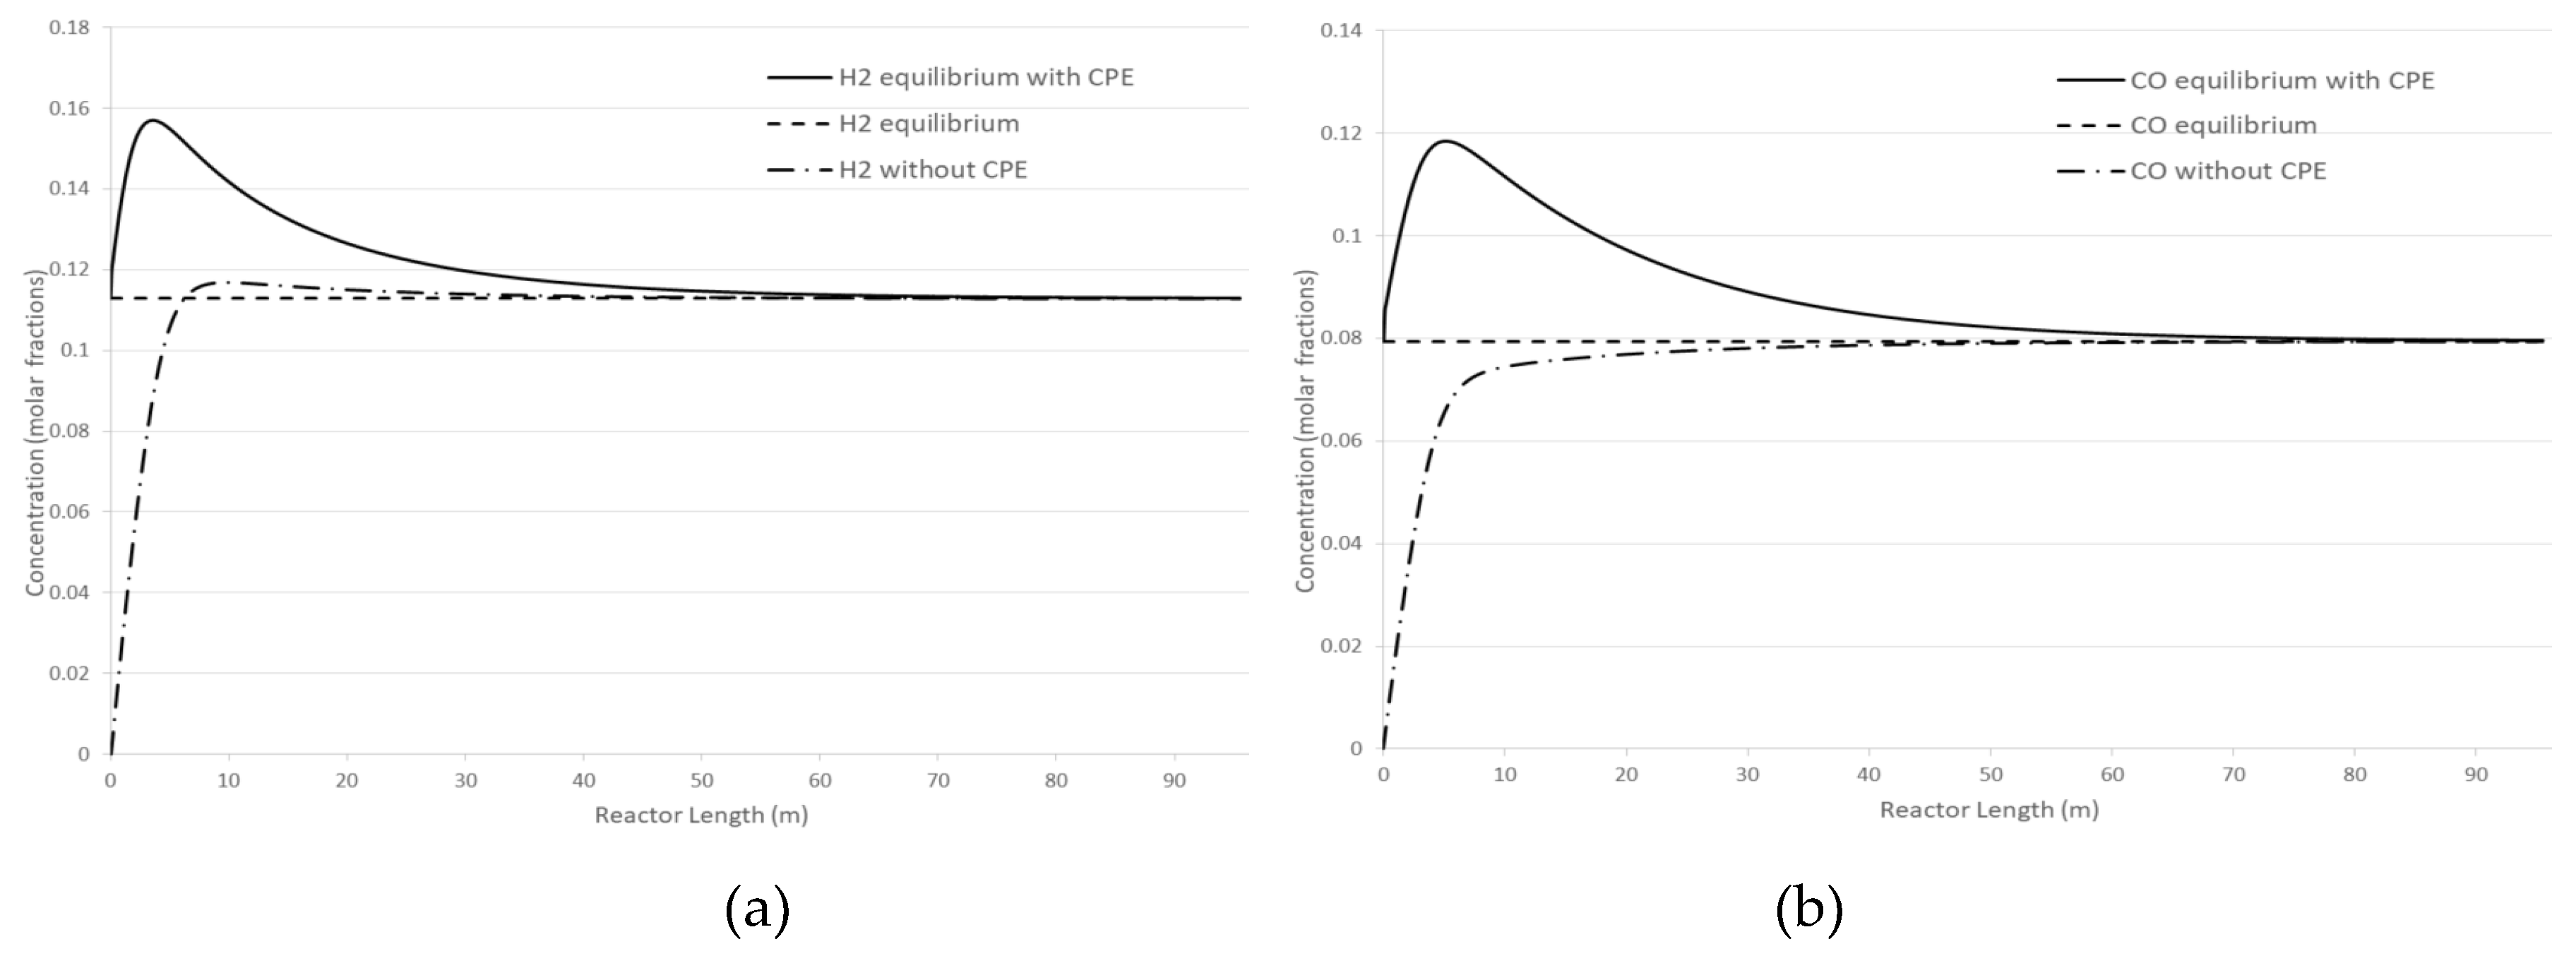
Figure 4.
Longitudinal profiles of the H2 concentration: (a) with the pressure change, (b) with the temperature change, (c)with the flow rate change, (d) with changes of the initial indicated concentration.
Figure 4.
Longitudinal profiles of the H2 concentration: (a) with the pressure change, (b) with the temperature change, (c)with the flow rate change, (d) with changes of the initial indicated concentration.
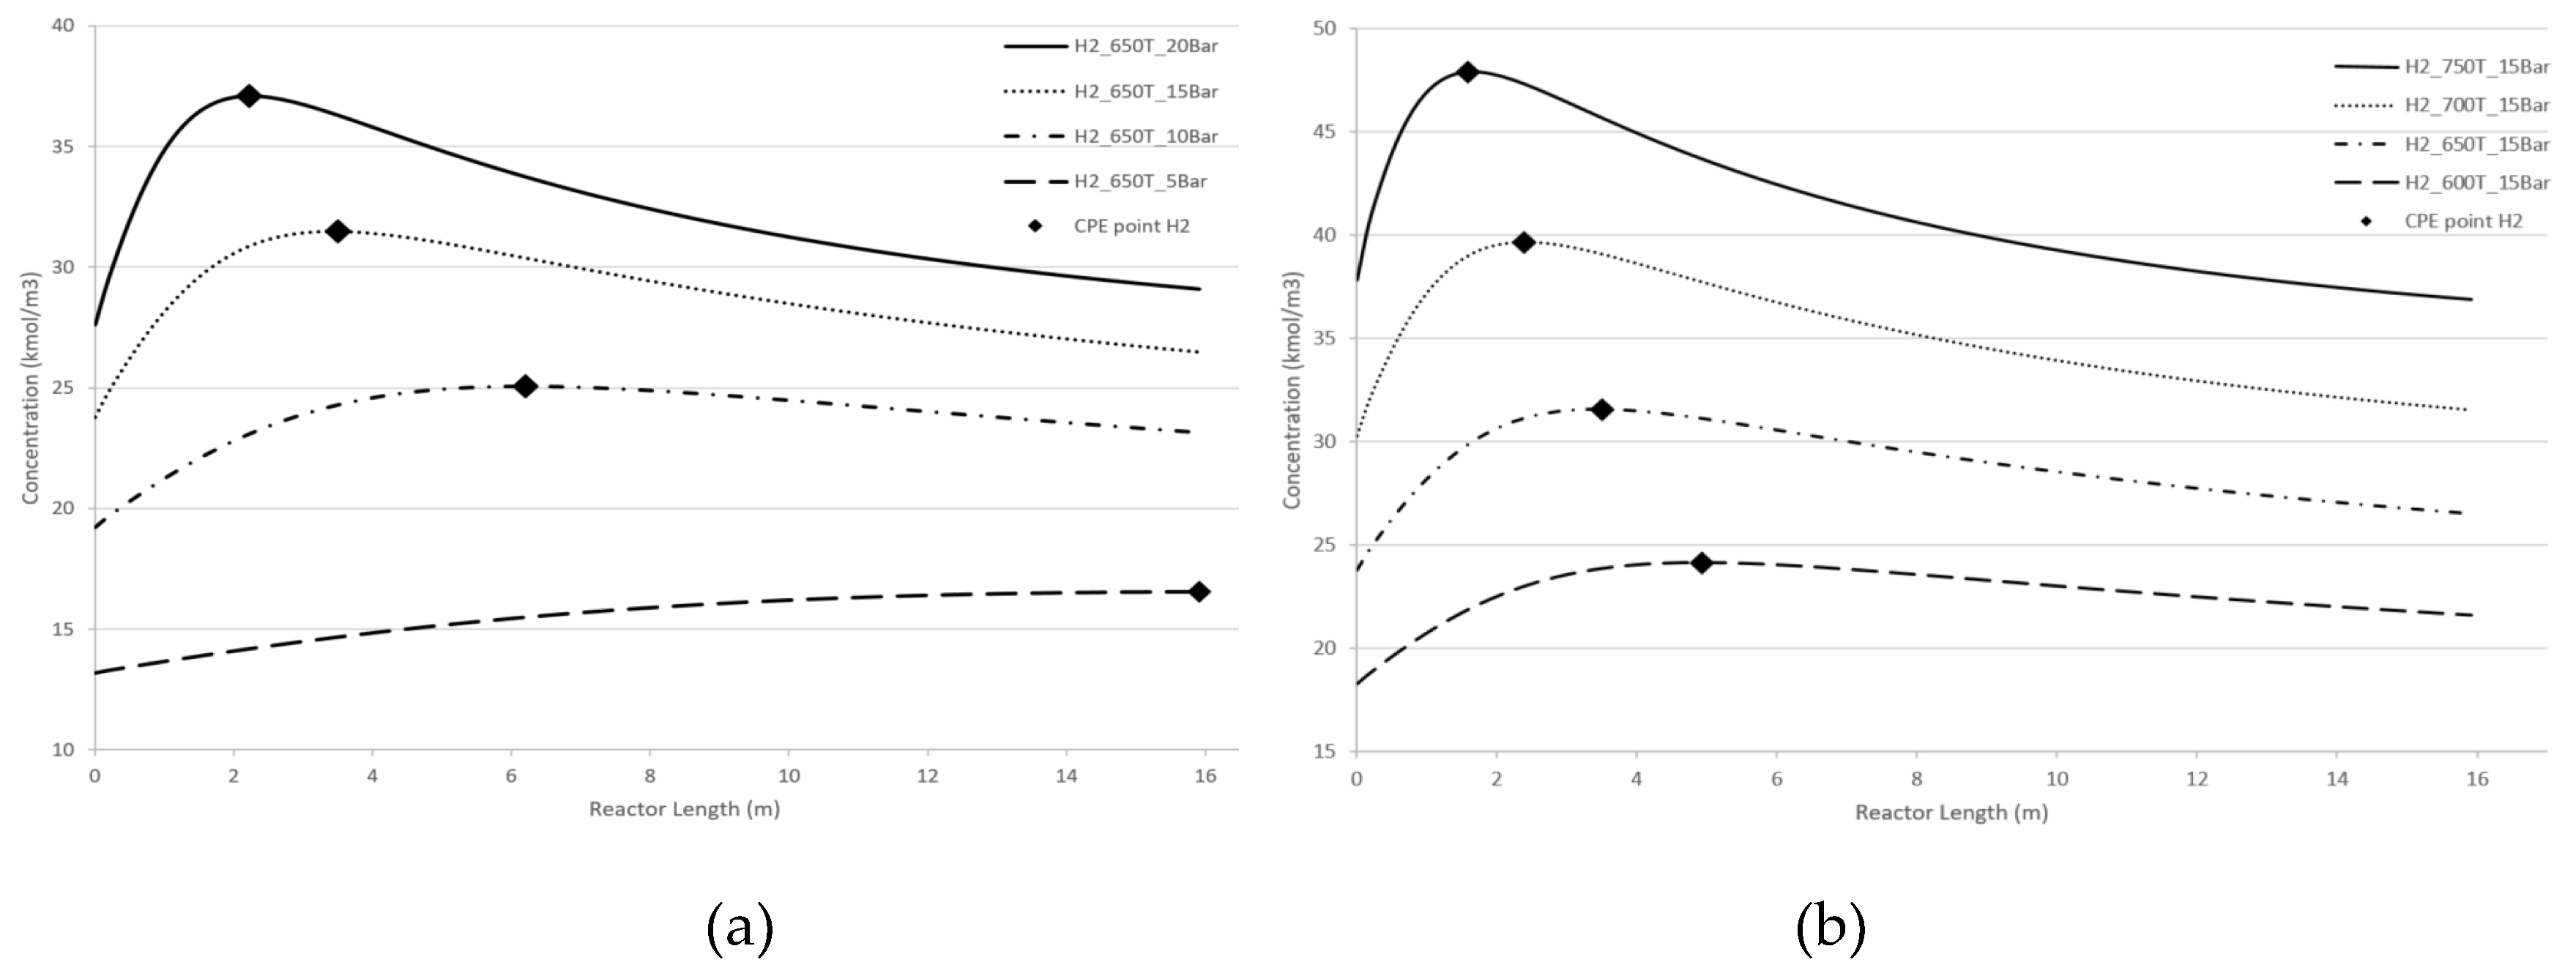
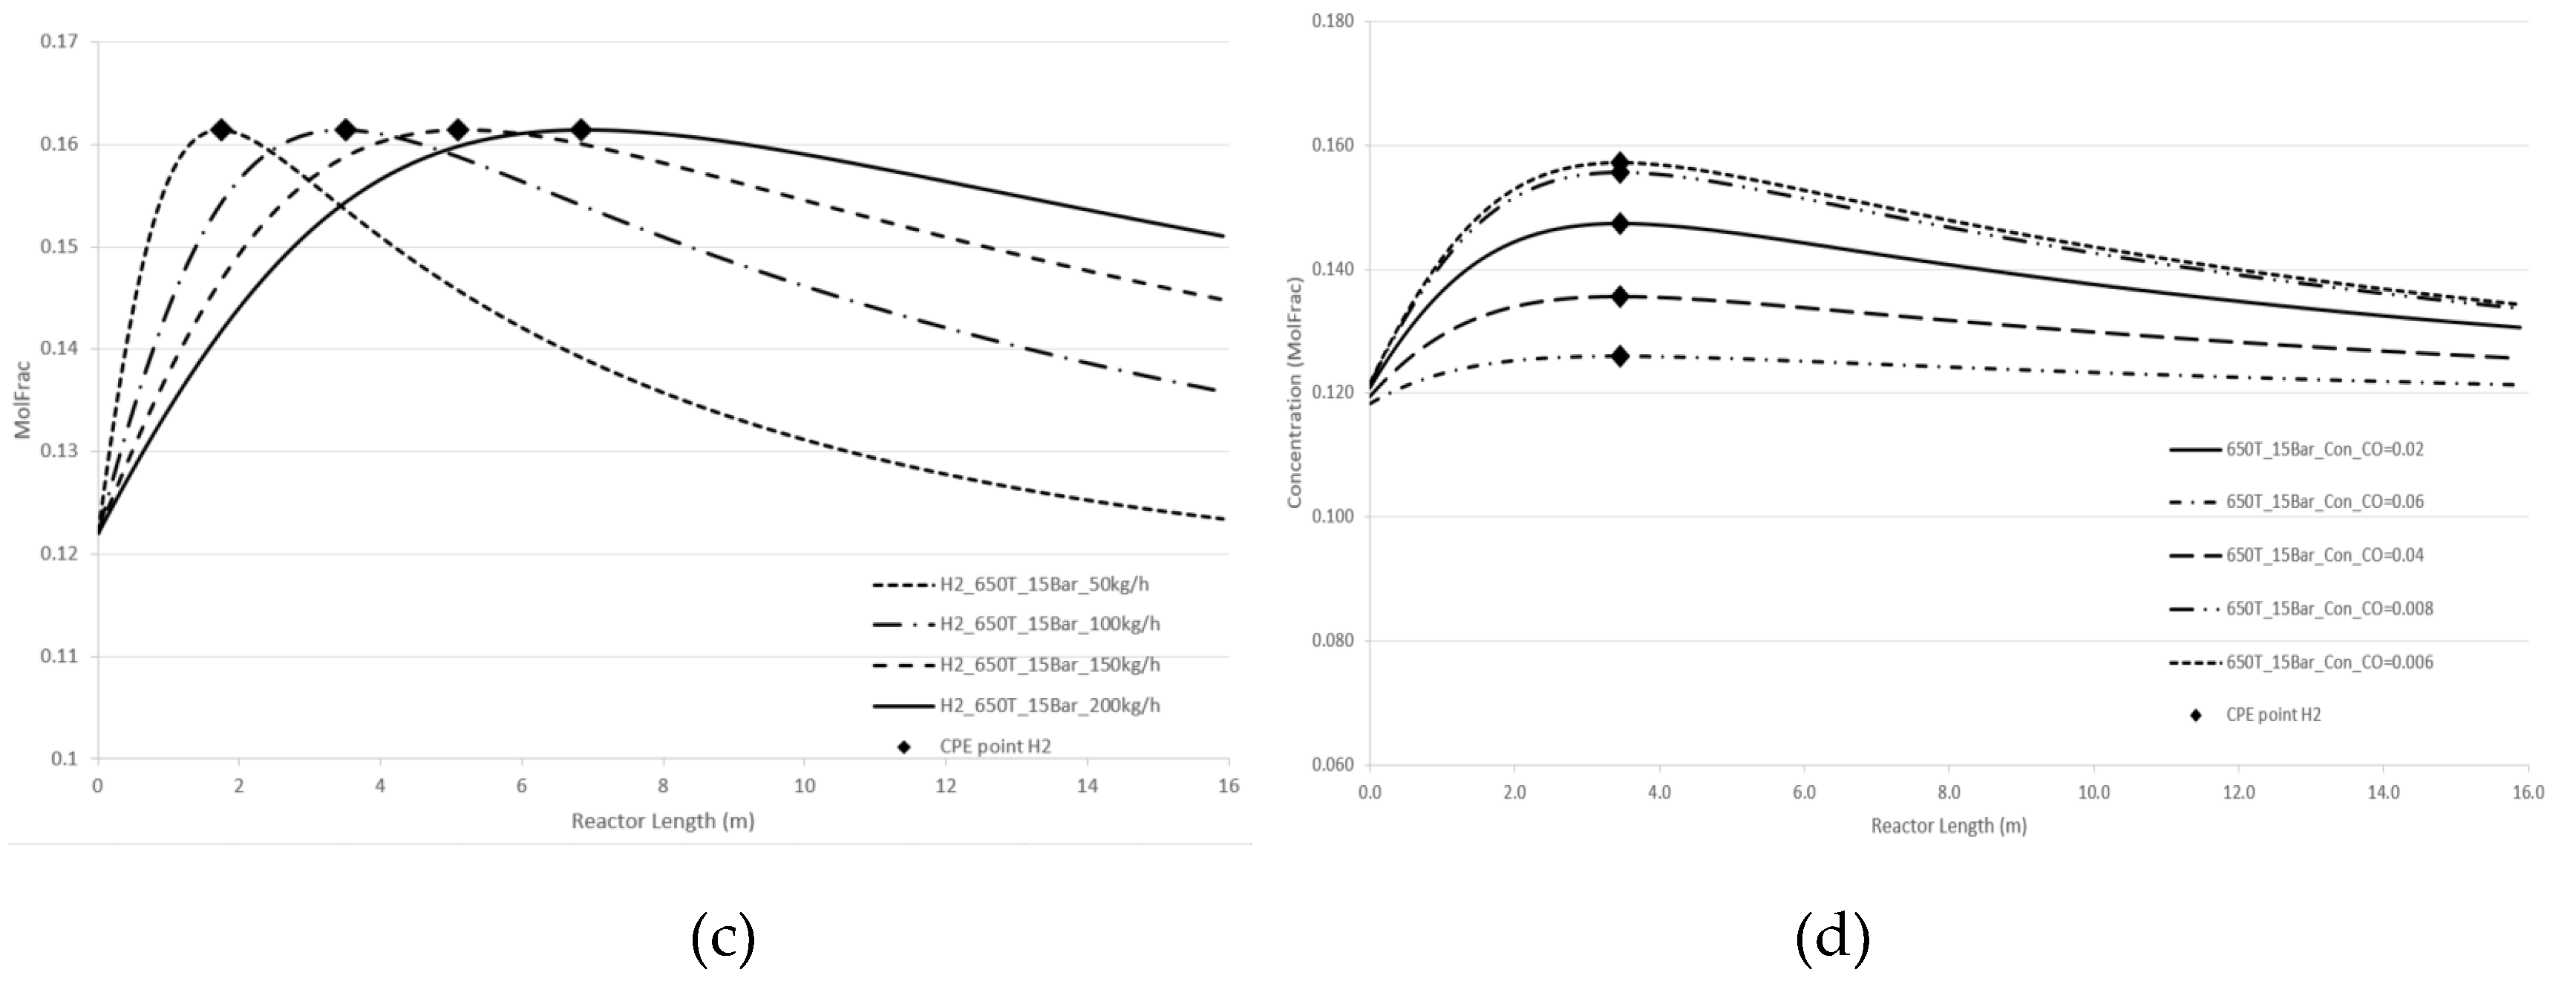
Figure 5.
Longitudinal profiles of CO concentration: (a) with the pressure change, (b) with the temperature change, (c) with the flow rate change, (d) with changes of the initial indicated concentration.
Figure 5.
Longitudinal profiles of CO concentration: (a) with the pressure change, (b) with the temperature change, (c) with the flow rate change, (d) with changes of the initial indicated concentration.
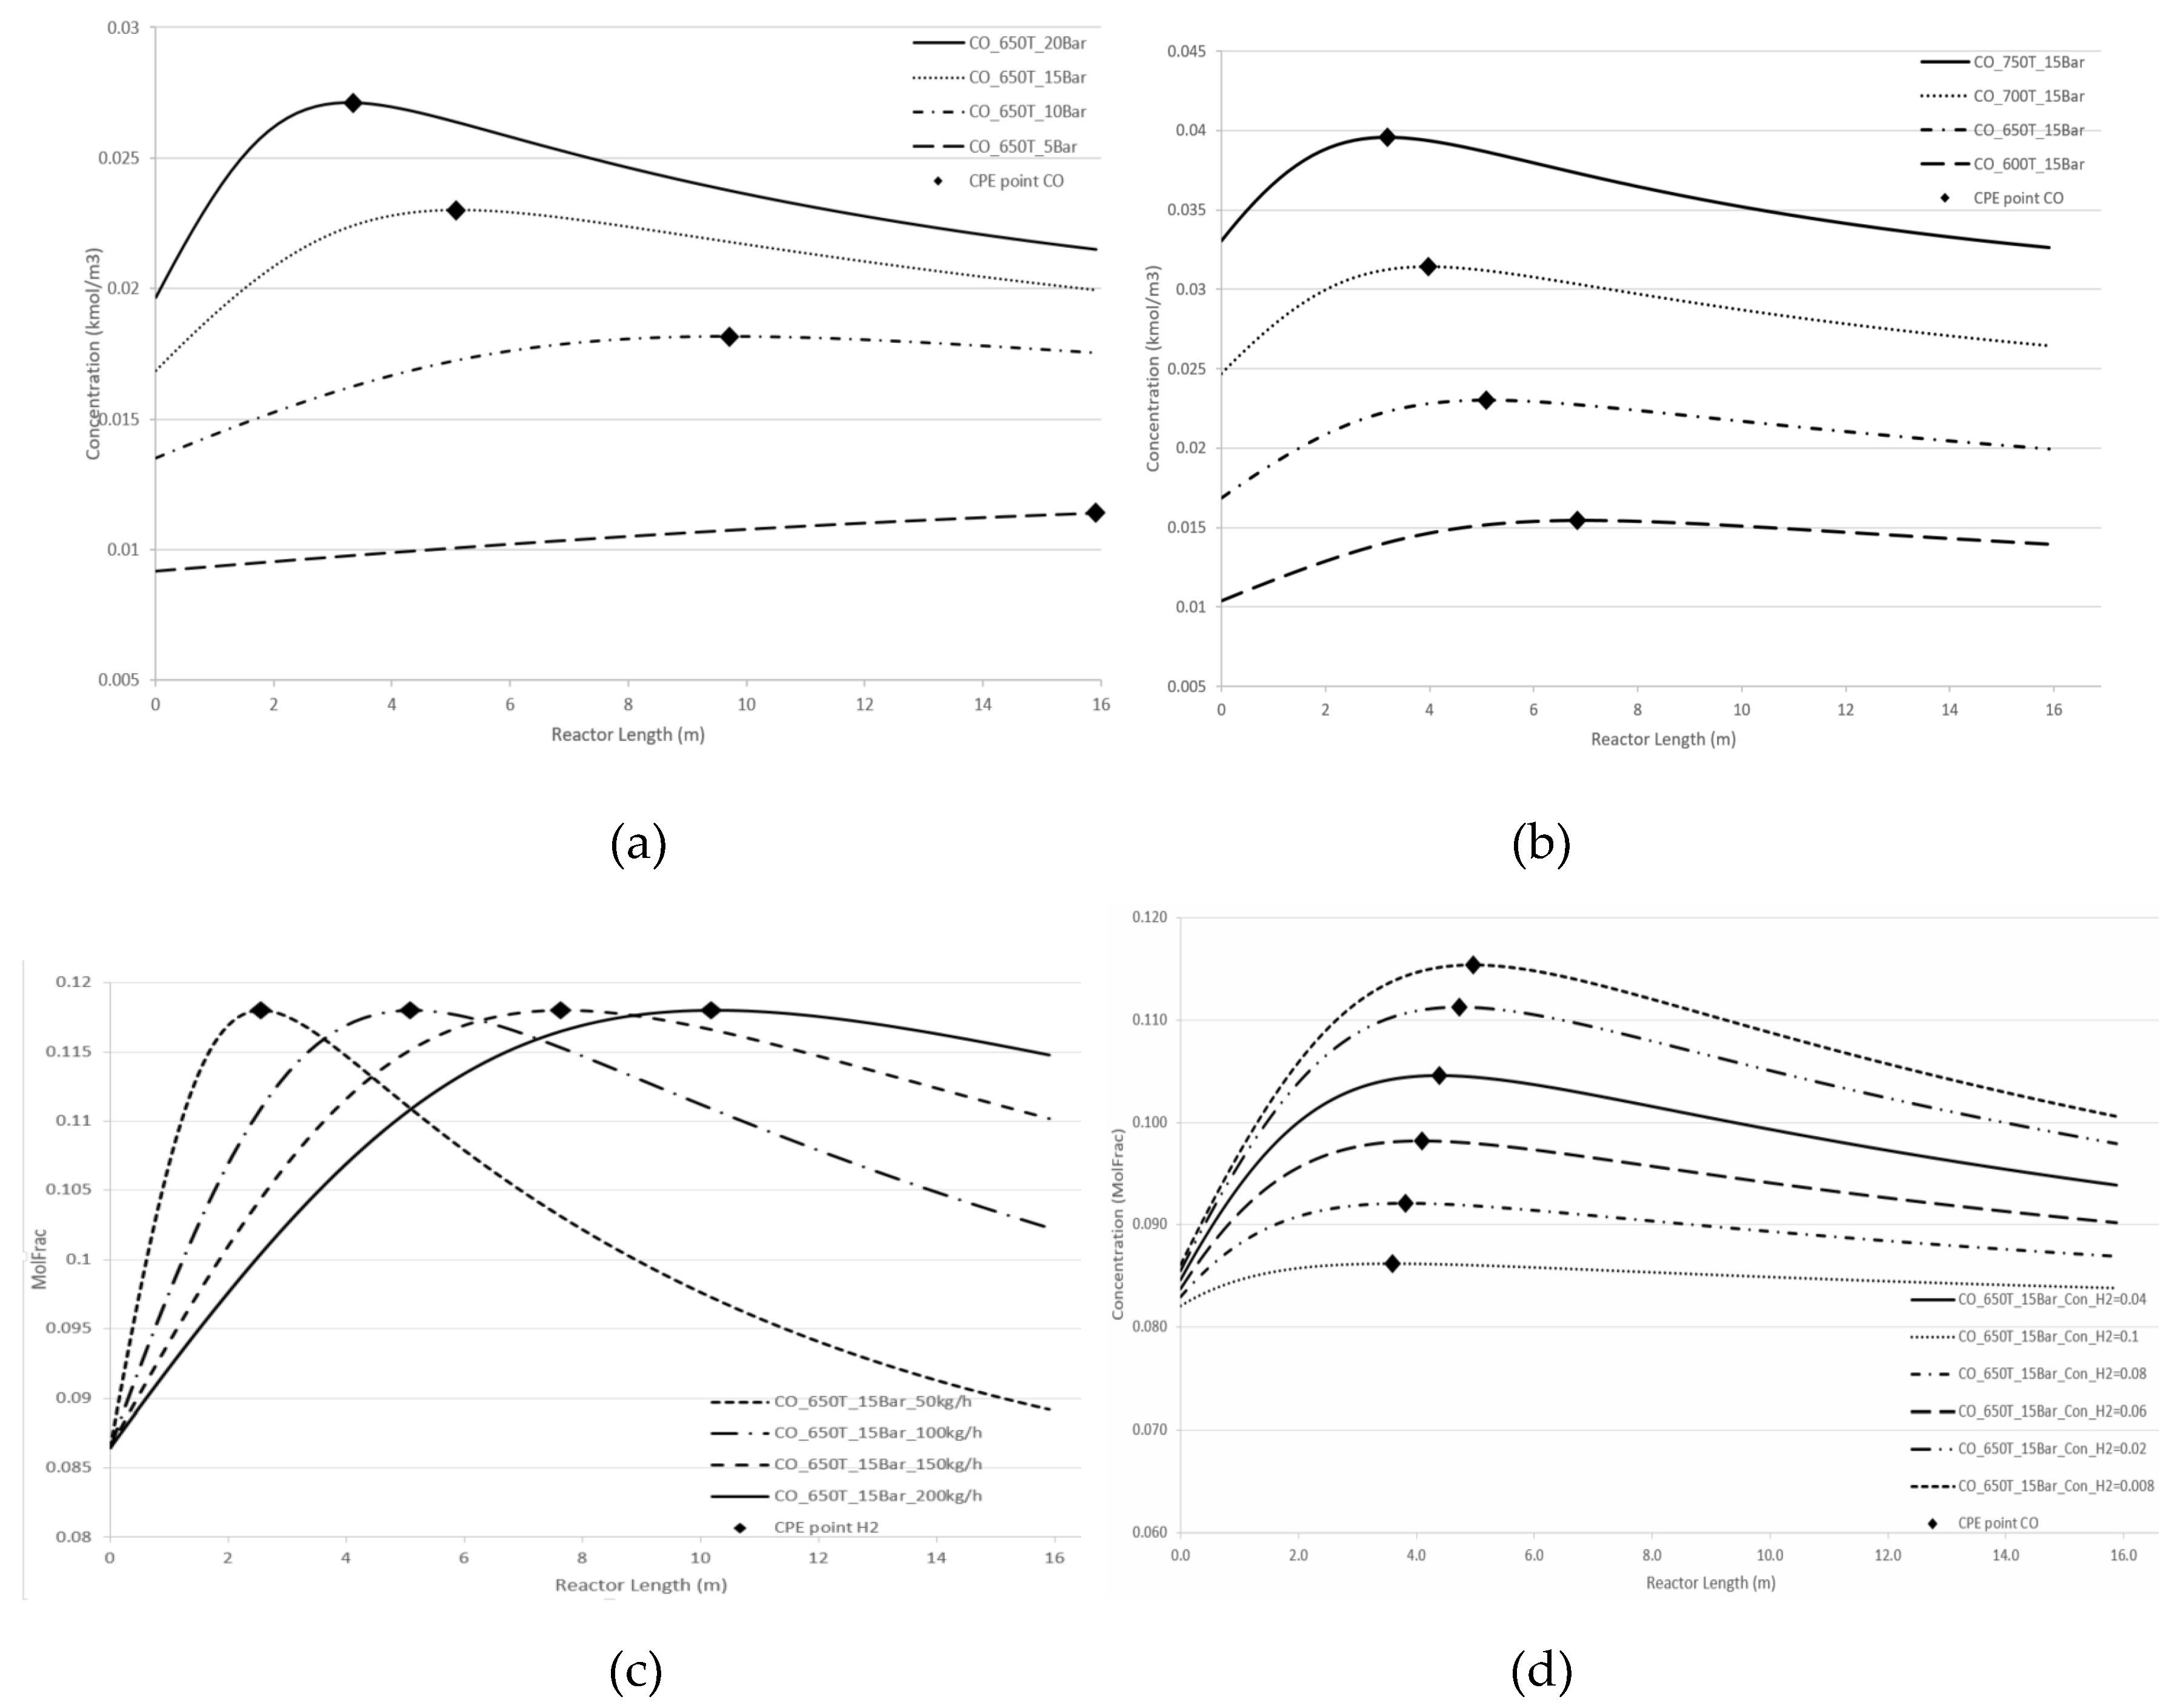
Figure 6.
Two reforming reactions with no CPE. Longitudinal molar fraction profiles of hydrogen: (a) pressure change, (b) temperature change.
Figure 6.
Two reforming reactions with no CPE. Longitudinal molar fraction profiles of hydrogen: (a) pressure change, (b) temperature change.
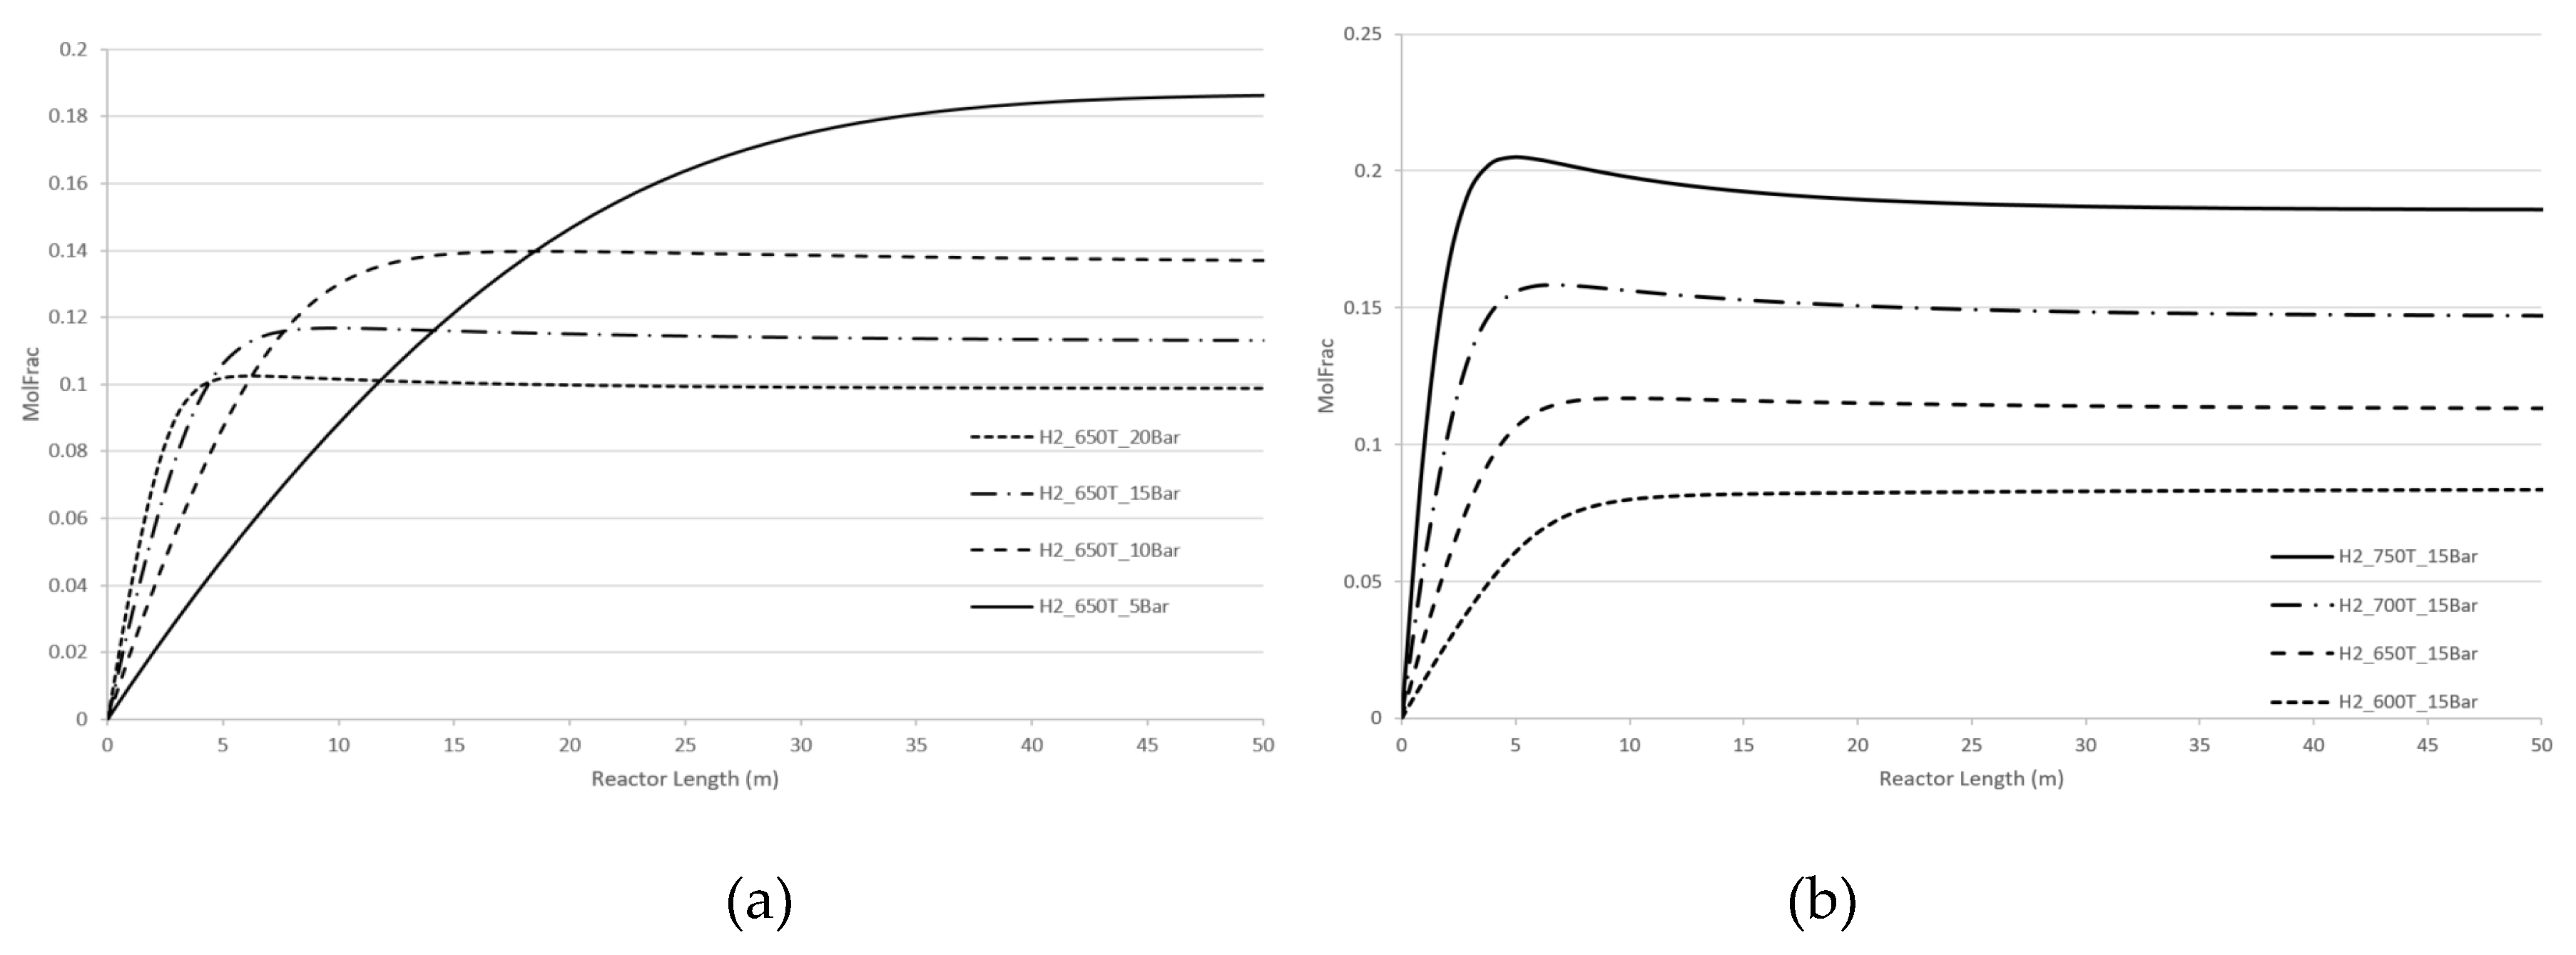
Figure 7.
Two reforming reactions with no CPE. Longitudinal molar fraction profiles of carbon monoxide: (a) pressure change, (b) temperature change.
Figure 7.
Two reforming reactions with no CPE. Longitudinal molar fraction profiles of carbon monoxide: (a) pressure change, (b) temperature change.
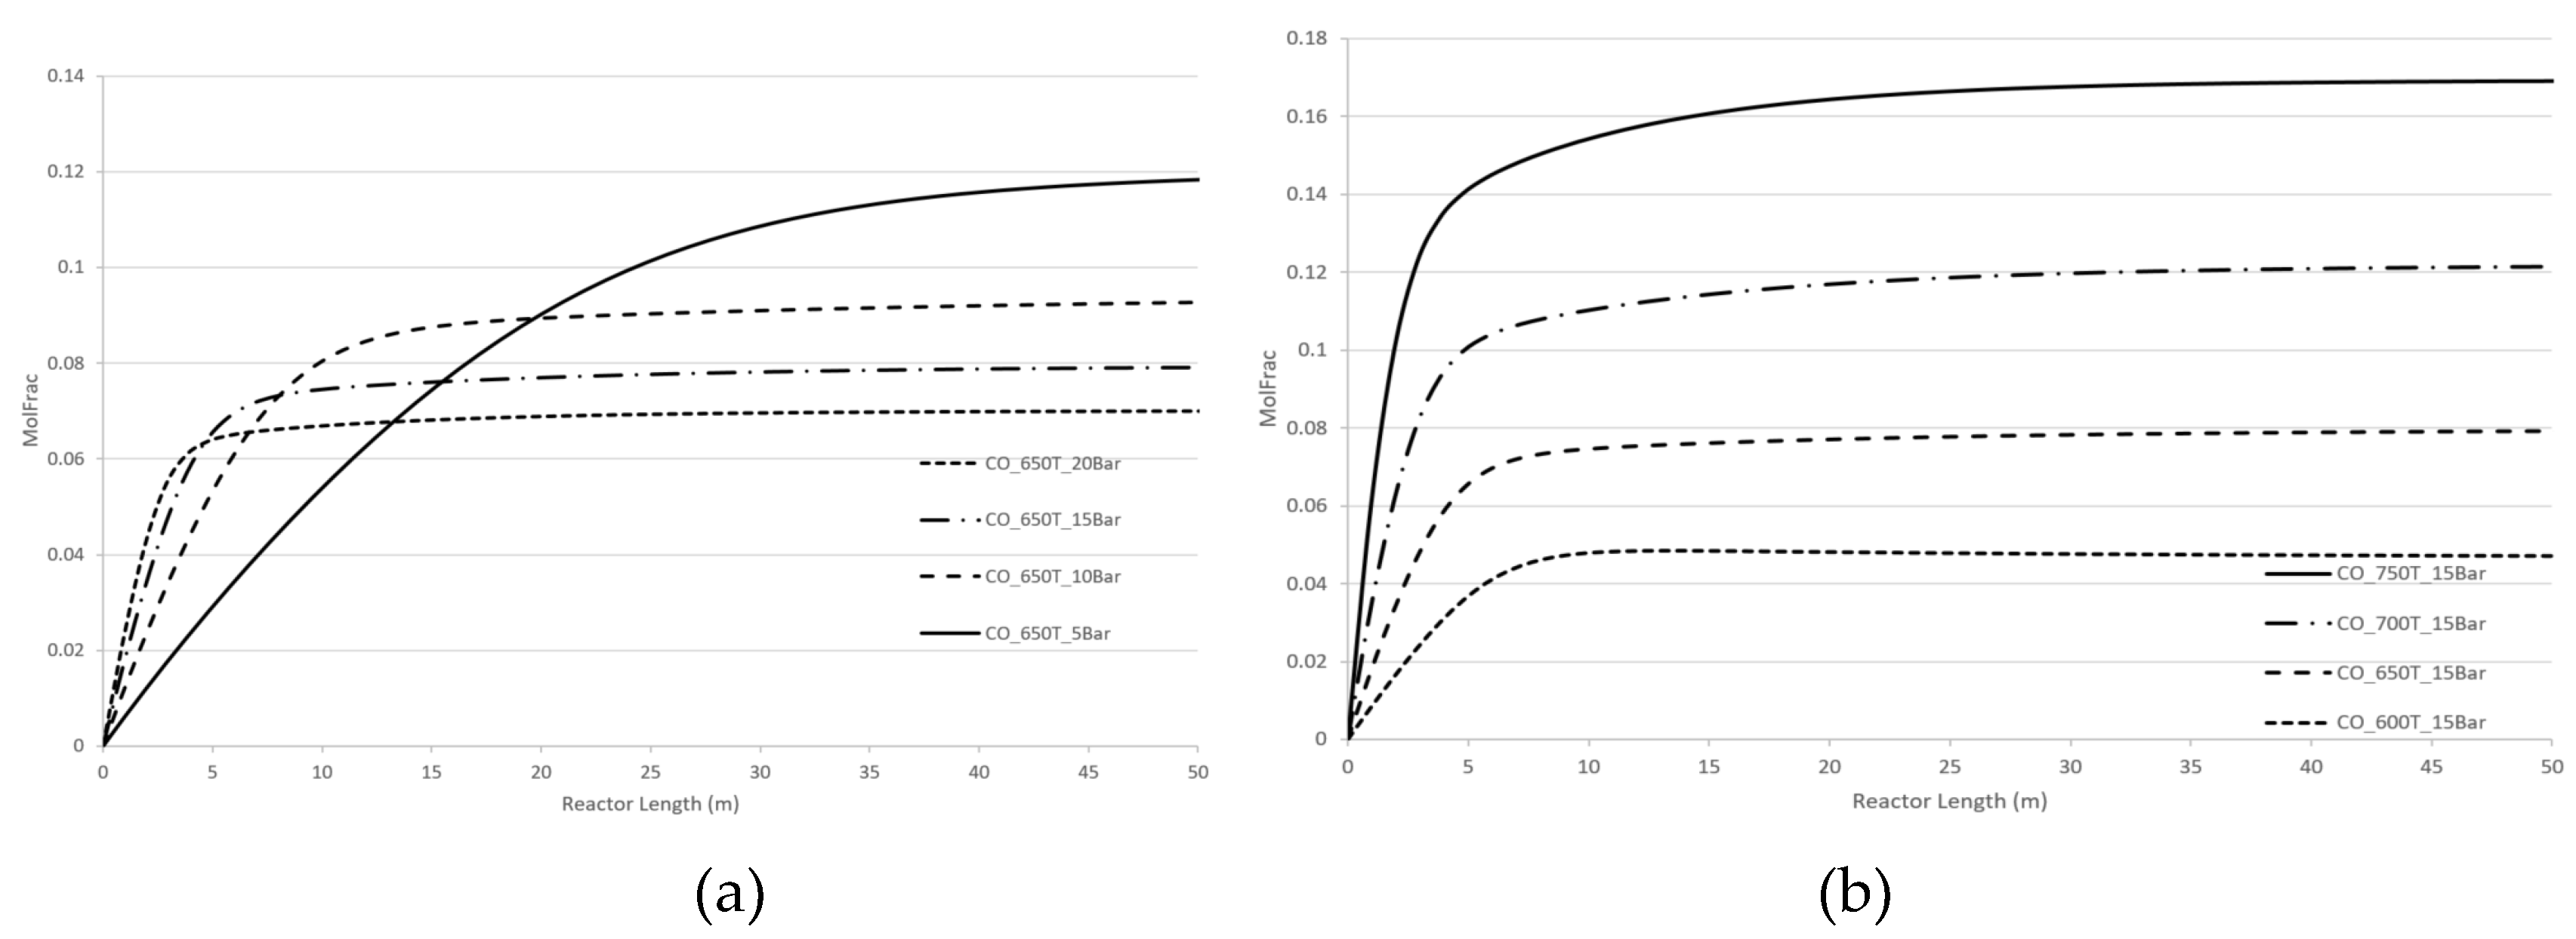
Figure 8.
Steam reforming. Longitudinal molar fraction profiles of hydrogen: (a) pressure change; (b) temperature change.
Figure 8.
Steam reforming. Longitudinal molar fraction profiles of hydrogen: (a) pressure change; (b) temperature change.
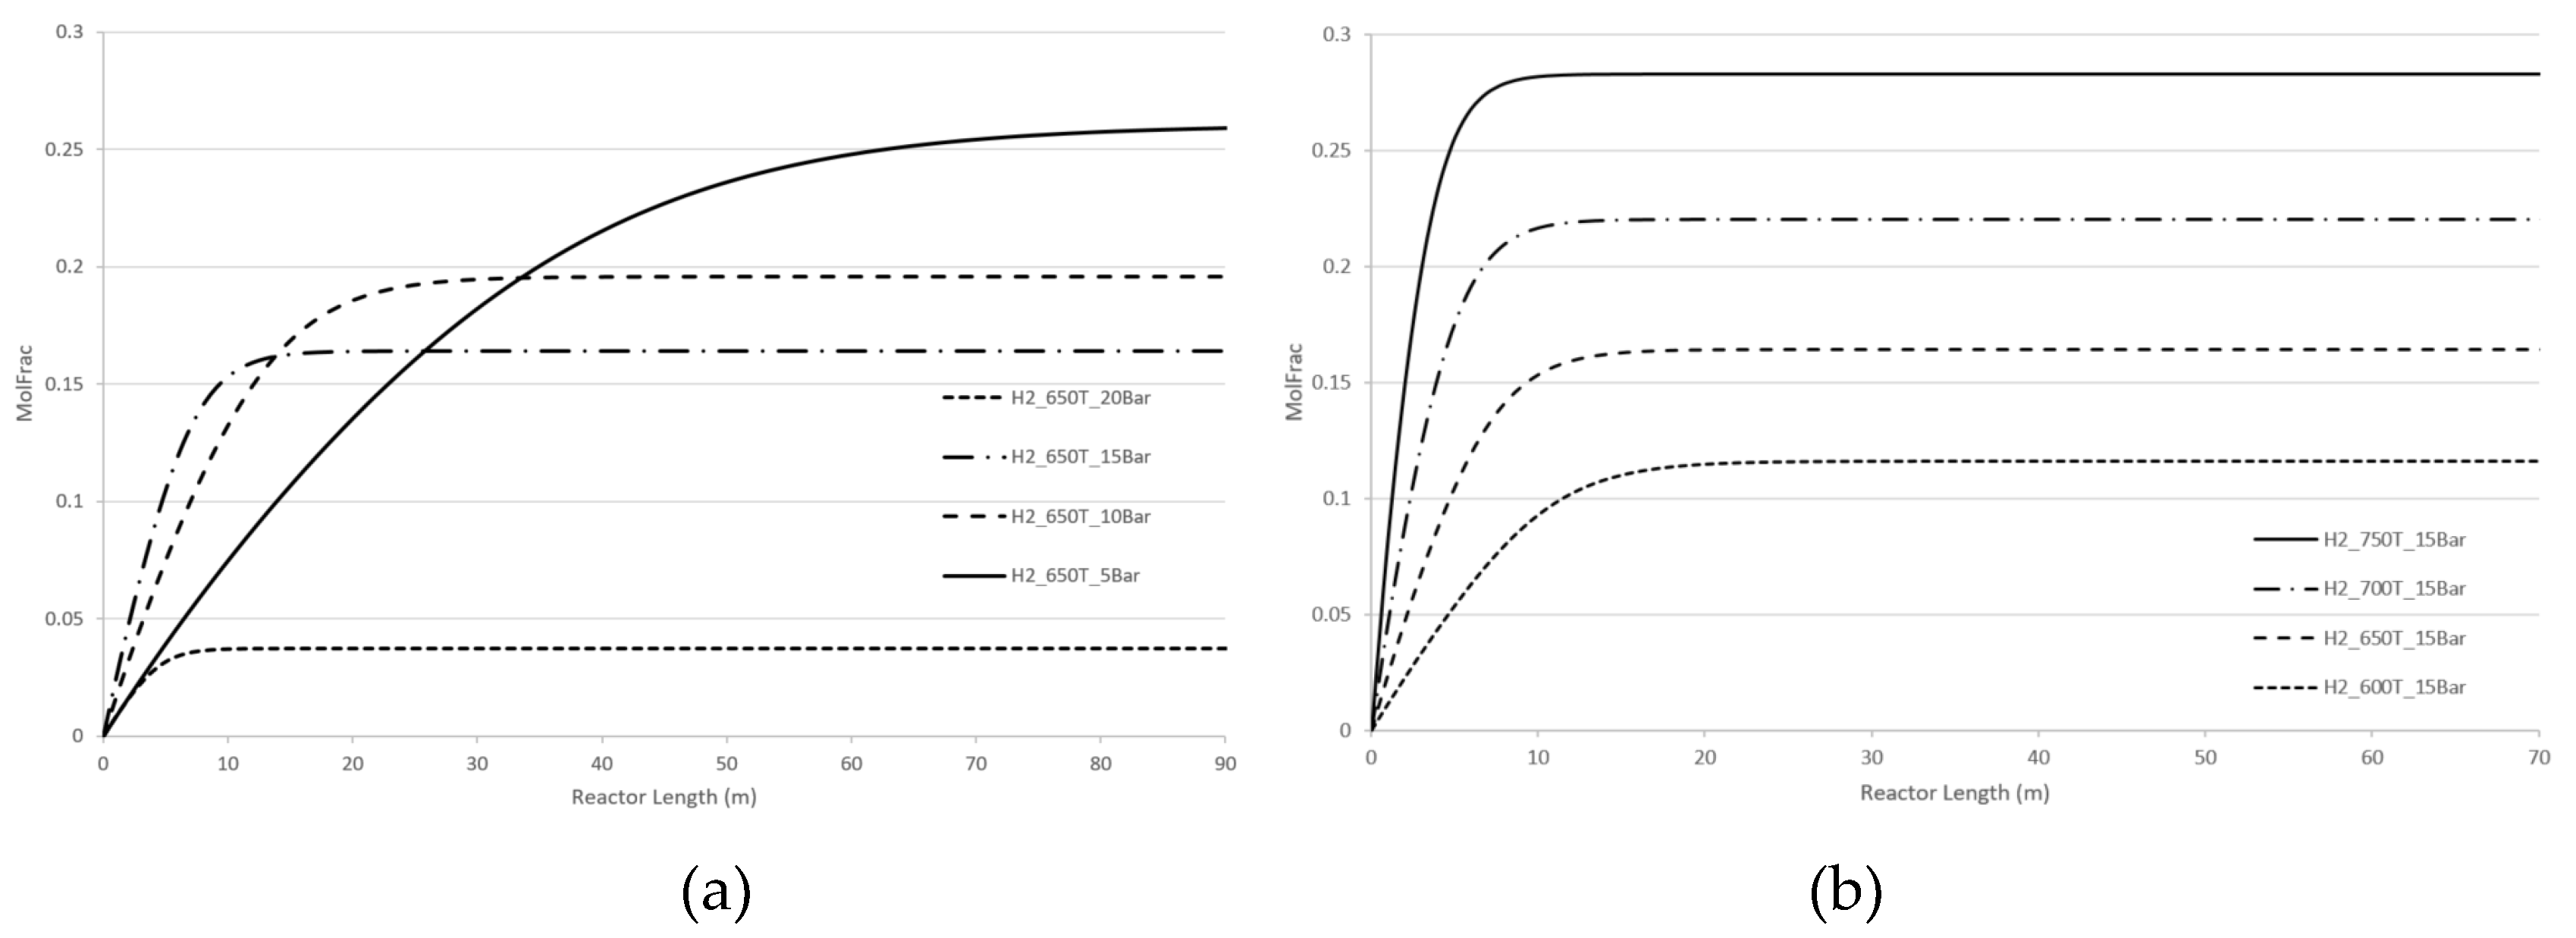
Figure 9.
Dry reforming. Longitudinal molar fraction profiles of hydrogen: (a) pressure change; (b) temperature change.
Figure 9.
Dry reforming. Longitudinal molar fraction profiles of hydrogen: (a) pressure change; (b) temperature change.
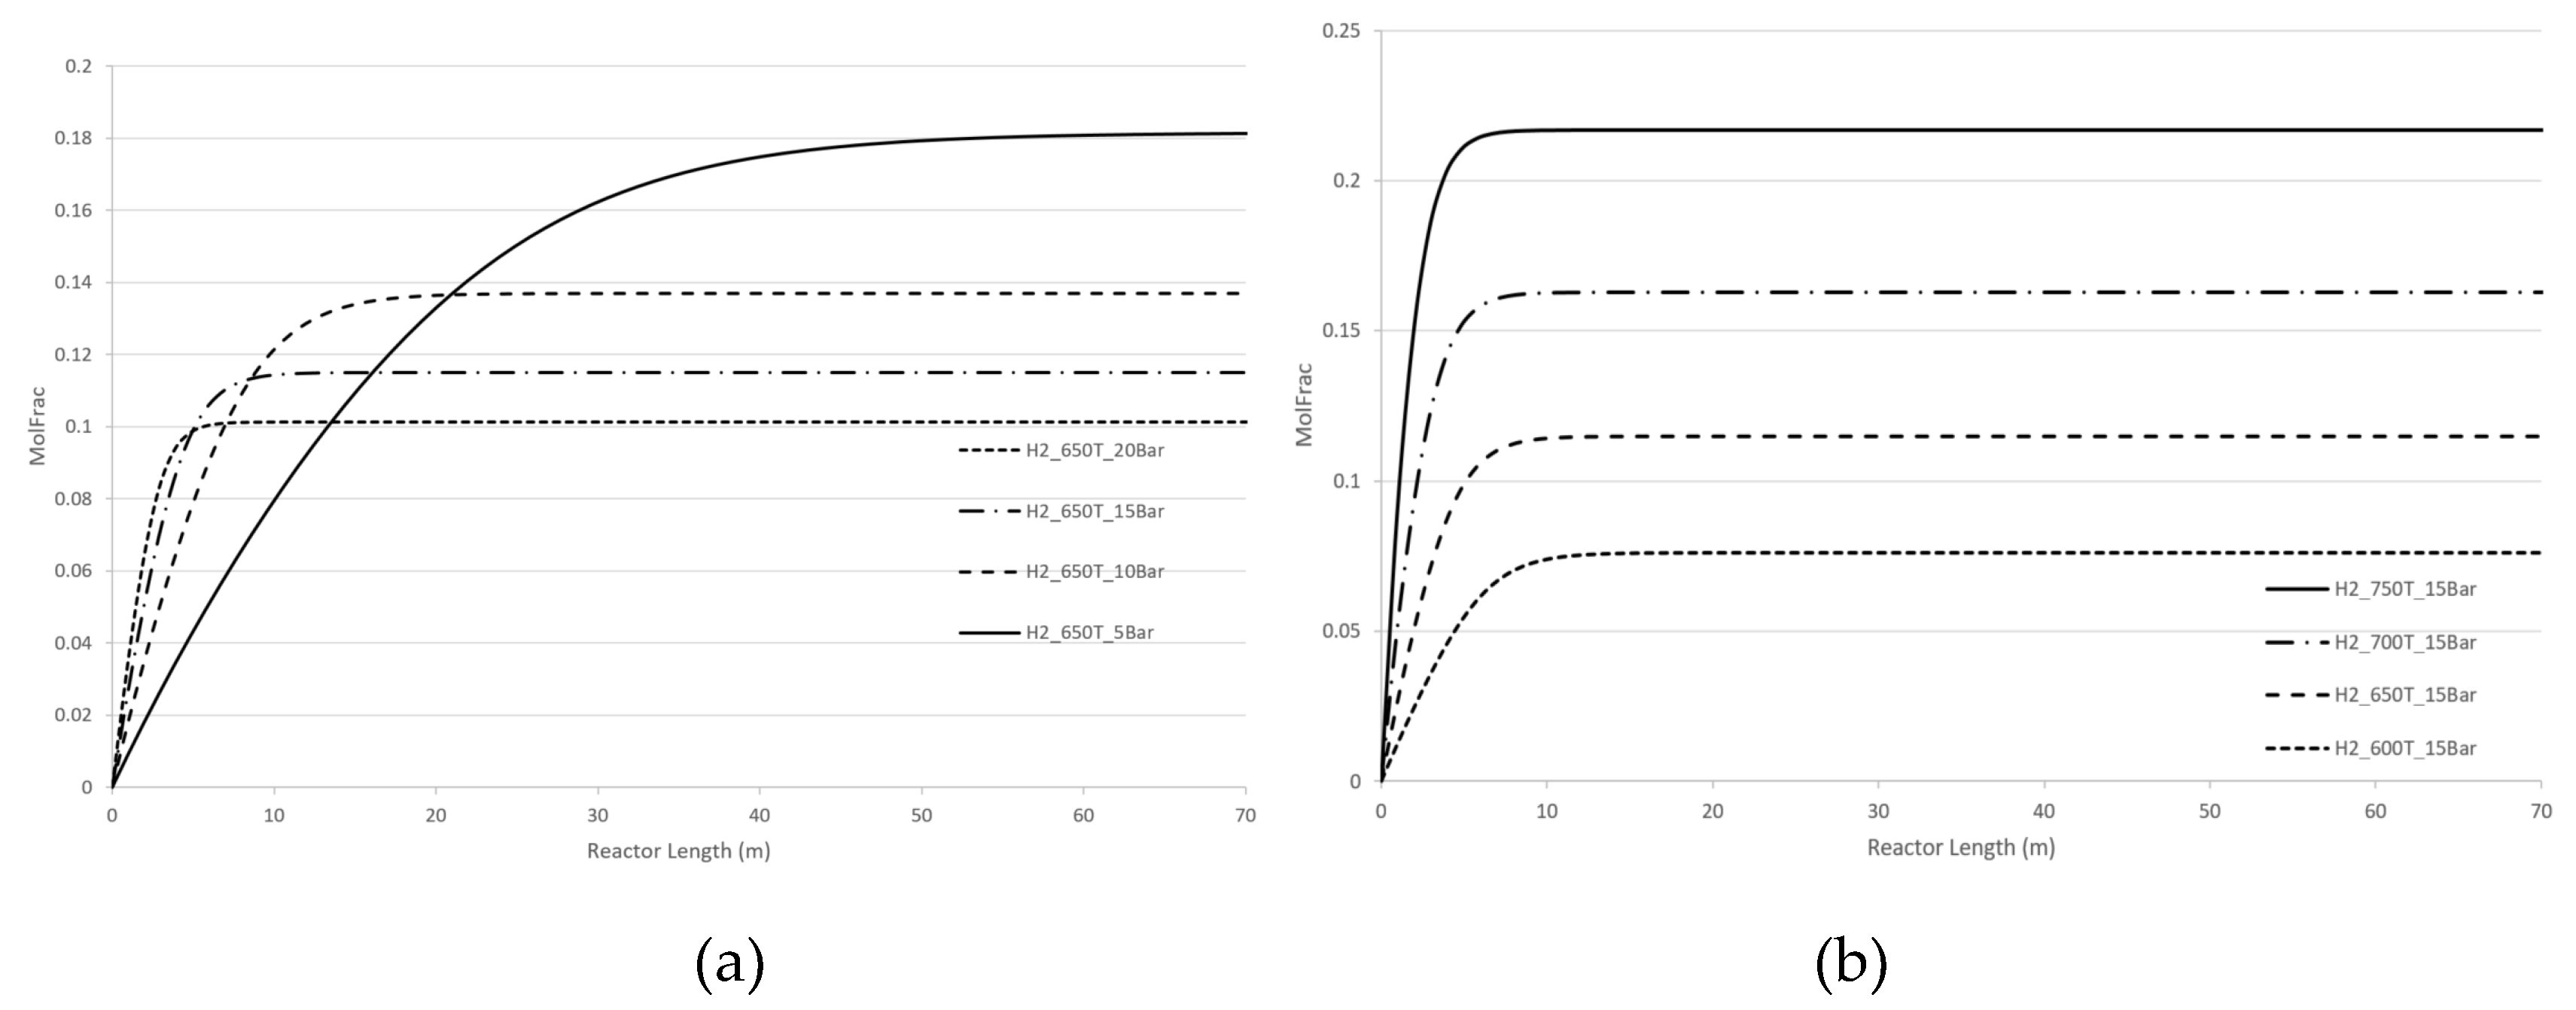
Figure 10.
Reaction rates for the hydrogen CPE case (a) and for the carbon monoxide CPE case (b).
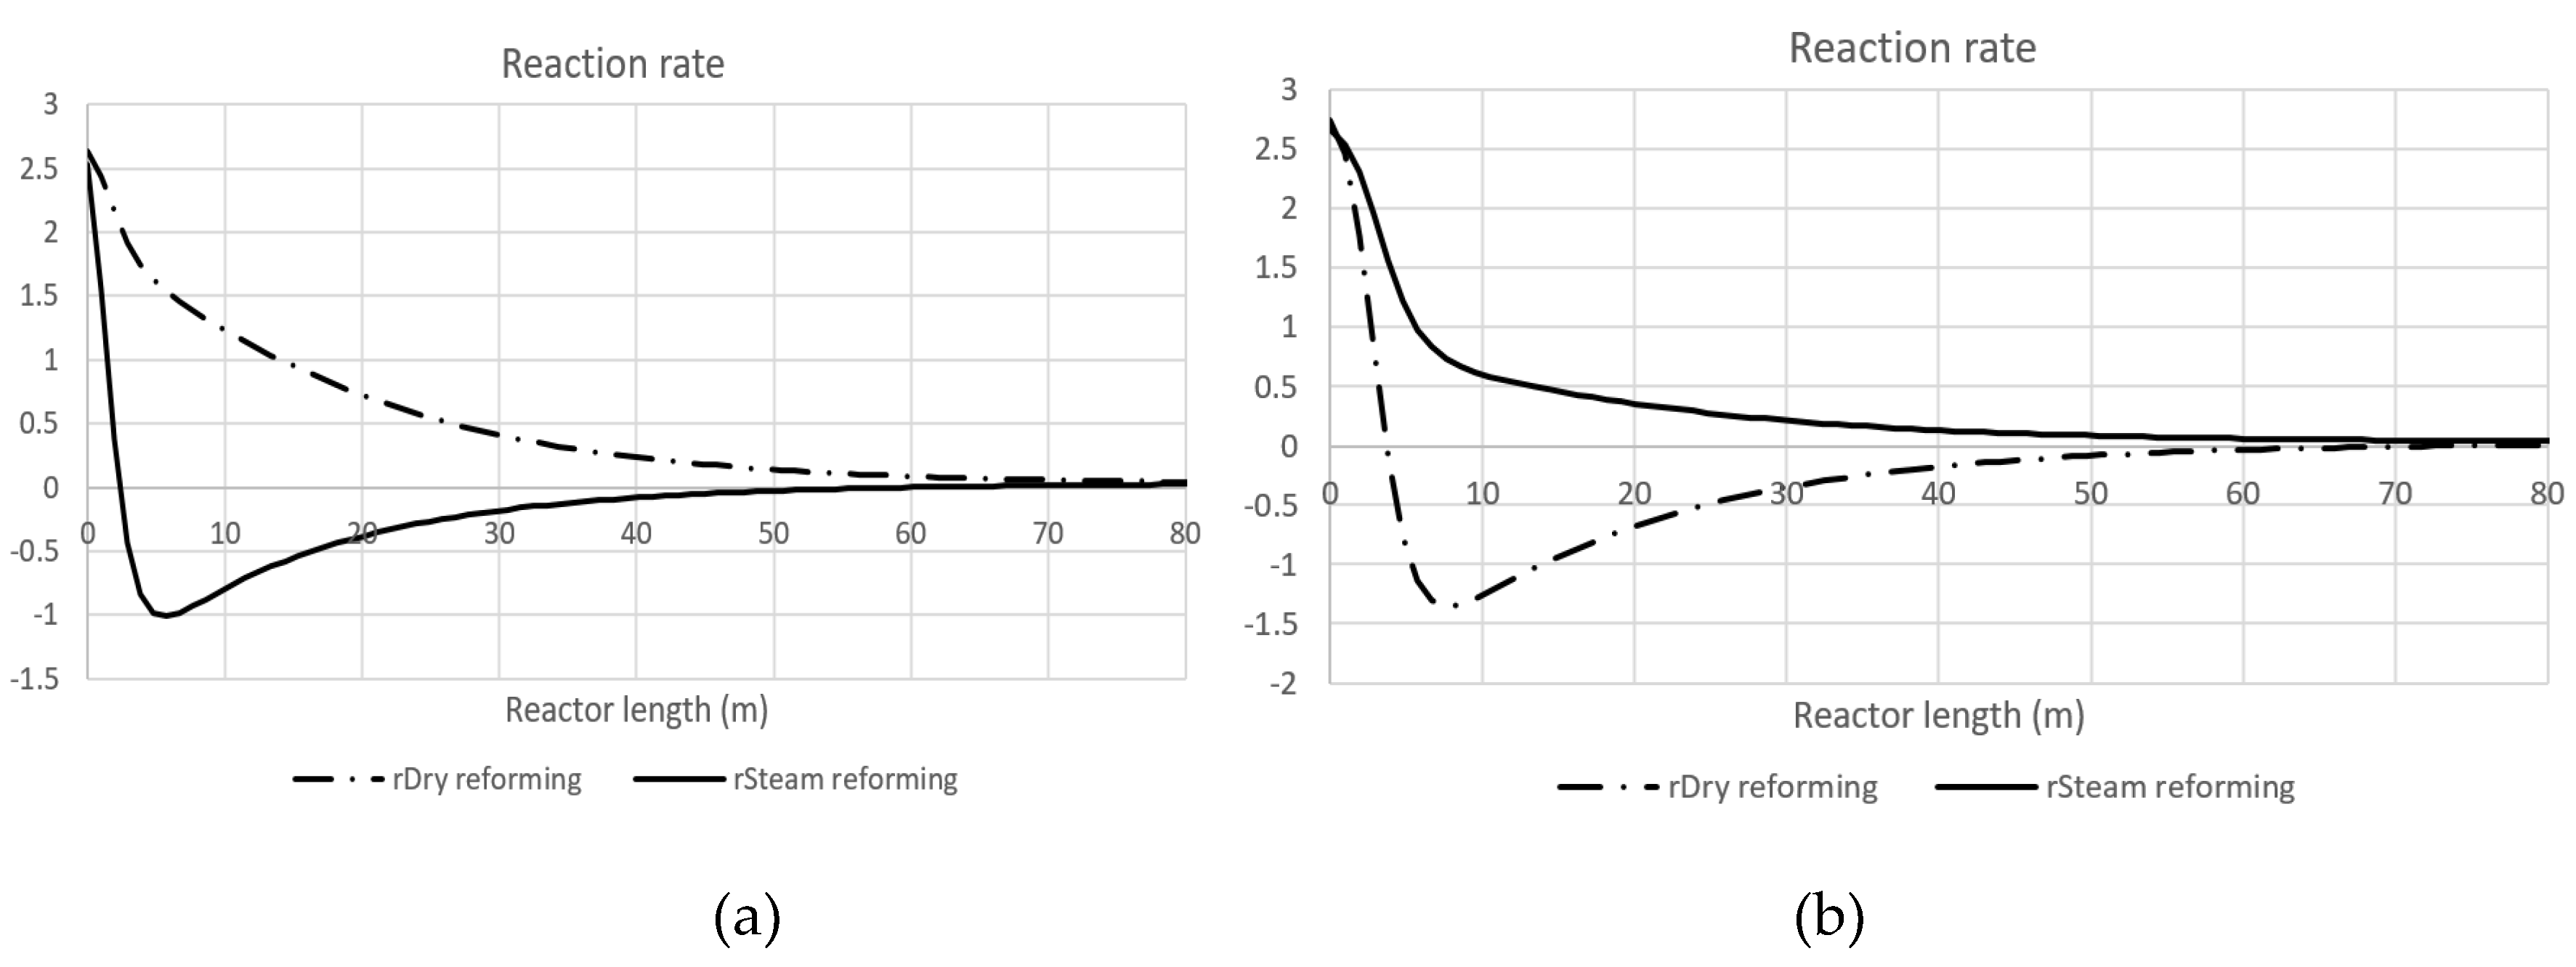
Figure 11.
Longitudinal profiles of mass flows: a) hydrogen CPE case; b) carbon monoxide CPE case.
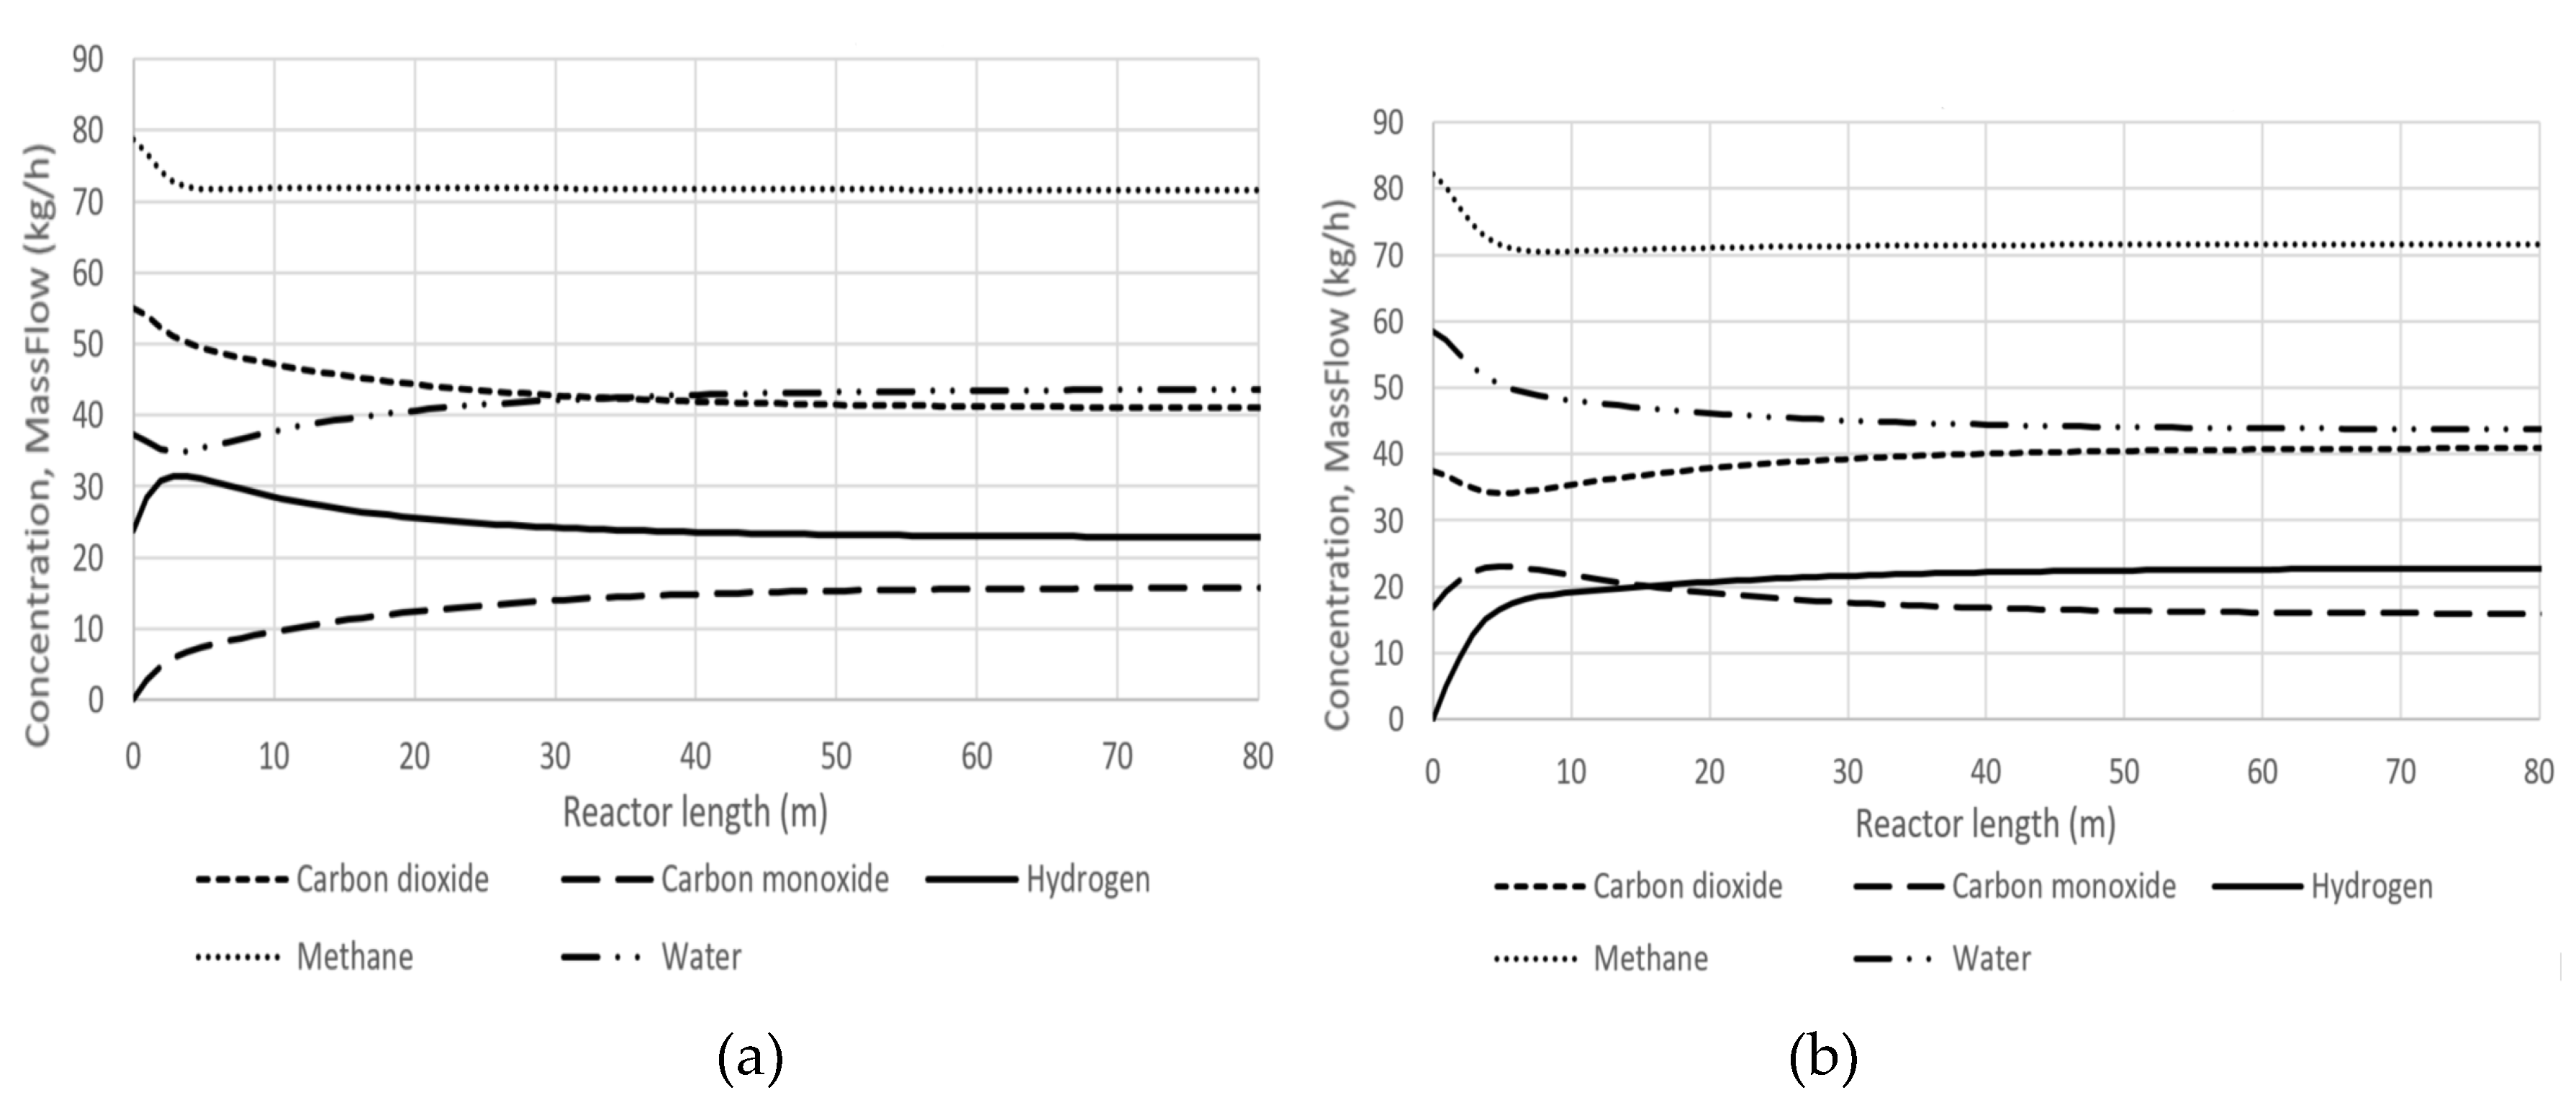

Table 1.
Selected reactions of methane reforming.
| Reaction | ∆H298 (kJ/mole) | Link |
|---|---|---|
|
CH4 + CO2 ↔ 2CO + 2H2 CH4 + H2O ↔ CO + 3H2 |
+247 +206 |
(4) |
Table 2.
Parameters of the system.
| Object | Parameters |
|---|---|
| Input | Temperature: 873.15 – 1023.15 K with 50 K intervals. |
| Pressure: 5 – 20 bar | |
| Mass flow: 50 – 200 kg/h | |
| Reactor | Reaction Set: dry and steam reforming |
| Calculation Mode: isothermic Property Package: Peng–Robinson Reactive Volume: 0.5; 3 m3 Tube Diameter: 200 mm |
Table 3.
Concentrations (mole fractions) and balances.
| Concentrations | Balance of components | Equilibrium | Initial concentrations | ||
|---|---|---|---|---|---|
| Equilibrium | Initial concentrations | ||||
| 0.2101 | 0.2711 | C | 0.659 | 0.659 | |
| 0.0814 | 0.0001 | H | 2.152 | 2.152 | |
| 0.1171 | 0.1171 | O | 0.726 | 0.726 | |
| 0.3674 | 0.3877 | ||||
| 0.2240 | 0.1834 | ||||
Disclaimer/Publisher’s Note: The statements, opinions and data contained in all publications are solely those of the individual author(s) and contributor(s) and not of MDPI and/or the editor(s). MDPI and/or the editor(s) disclaim responsibility for any injury to people or property resulting from any ideas, methods, instructions or products referred to in the content. |
© 2024 by the authors. Licensee MDPI, Basel, Switzerland. This article is an open access article distributed under the terms and conditions of the Creative Commons Attribution (CC BY) license (http://creativecommons.org/licenses/by/4.0/).
Copyright: This open access article is published under a Creative Commons CC BY 4.0 license, which permit the free download, distribution, and reuse, provided that the author and preprint are cited in any reuse.


