
Submitted:
17 June 2025
Posted:
19 June 2025
You are already at the latest version
Abstract
Cyclin-dependent kinase-like 5 (CDKL5) deficiency disorder (CDD) is a severe X-linked neurodevelopmental condition characterized by early-onset, intractable epilepsy, motor and cognitive impairment, and autistic-like features. Although constitutive Cdkl5 knock-out (KO) models have established the importance of CDKL5 during early brain develop-ment, its role in the mature brain remains poorly defined. Here, we used an inducible, conditional KO model in which Cdkl5 is selectively deleted from forebrain glutamatergic neurons in adult mice to investigate the postdevelopmental functions of CDKL5. Tamoxi-fen-induced Cdkl5 deletion in adult Cdkl5flox/Y(Cre+) males led to prominent behavioral impairments, including deficits in motor coordination, reduced sociability, and impaired hippocampus-dependent spatial memory, while behavioral features such as hyperactivity and stereotypic jumping, typically present in germline KOs, were absent. Sensory func-tions, including olfaction and pain perception, were also preserved. At the cellular level, the loss of Cdkl5 resulted in a marked reduction of excitatory synapse density in the cortex and hippocampus, accompanied by increased numbers of immature dendritic spines and decreased mature spines. Neuronal loss in the hippocampal CA1 region and selective mi-croglial activation in the cortex were also observed. These alterations closely resemble those seen in constitutive KO models, underscoring the ongoing requirement for CDKL5 expression in excitatory neurons for maintaining synaptic integrity and neuronal homeo-stasis in the adult brain. This study underscores the importance of temporally controlled models for investigating the mechanisms underlying CDD pathophysiology in the adult brain.
Keywords:
CDKL5 deficiency disorder
; postdevelopmental stage
; conditional knockout mouse models
; glutamatergic neurons
; behavioral phenotyping
1. Introduction
Variants in the X-linked cyclin-dependent kinase-like 5 (CDKL5) gene are associated with a rare neurodevelopmental disorder known as CDKL5 deficiency disorder (CDD) [1]. The CDKL5 gene encodes a serine/threonine kinase that is abundantly expressed in both the developing and adult brain [2], and plays a crucial role in regulating key processes essential for proper neural network formation [3,4]. The loss of CDKL5 function leads to a complex clinical phenotype, characterized by early infantile-onset, drug-resistant epilepsy, followed by severe neurodevelopmental impairment. Associated neurological features include hypotonia, intellectual and motor disabilities, autistic-like traits, and cortical visual impairment, as well as other comorbidities such as gastrointestinal issues and sleep disturbances.
Over the past several years, multiple constitutive Cdkl5 knockout (KO) mouse models have been generated by permanently inactivating Cdkl5 in all cells and tissues throughout development [5,6,7,8]. These animal models, which exhibit constitutive Cdkl5 deficiency, recapitulate most of the phenotypic features of the disorder, including severe impairments in hippocampal-dependent learning and memory, autistic-like behaviors, altered social interactions, visual and respiratory deficits, and motor stereotypies [5,6,8,9,10,11,12,13]. Neuroanatomical analyses have shown that these defects are associated with altered neuronal architecture, characterized by impairments in dendritic arborization, synaptogenesis, and connectivity of pyramidal neurons in both the cortical [14,15,16,17] and hippocampal regions [6,9,10,18,19,20] of Cdkl5 KO mice. Additionally, the absence of Cdkl5 leads to decreased survival of CA1 pyramidal neurons in the hippocampus of these animal models [9,21,22], as well as the presence of a generalized neuroinflammatory process [23,24].
Although most studies on Cdkl5 KO mice have primarily focused on the adult brain phenotype that results from constitutive inactivation, a recent comparative analysis of brain defects across developmental stages in a Cdkl5 KO mouse model has shown that many structural alterations emerge early in postnatal development and are largely maintained throughout later stages of brain maturation [17]. These findings suggest that CDKL5 function is crucial for early postnatal developmental processes that underlie brain maturation. However, using a genetic approach to selectively ablate Cdkl5 expression in adult mice, Terzic and colleagues demonstrated that postdevelopmental deletion of Cdkl5 leads to behavioral and neuroanatomical defects similar to those observed in germline knockout mice [25], suggesting a crucial functional role of CDKL5 also in the mature brain.
Since Cdkl5 is expressed in both glutamatergic and GABAergic neurons [2,26,27], conditional knockout (cKO) models have been developed to selectively delete Cdkl5 in forebrain excitatory [6,7,27,28] or inhibitory neurons [6,27], in order to identify the specific cell type in which Cdkl5 deficiency drives pathological phenotypes. These studies highlight the critical role of CDKL5 in glutamatergic neurons, where it serves as a key regulator of circuit development and synaptic activity. Notably, prenatal deletion of Cdkl5 in forebrain excitatory neurons leads to both morphological and functional changes in hippocampal and cortical neurons, impairing synaptic activity, hippocampal-dependent memory, and cortical visual responses [7,28].
Although conditional knockout (cKO) mouse models have been pivotal in advancing our understanding of the primary role of Cdkl5 in glutamatergic neurons during brain development, the selective deletion of Cdkl5 in these neurons within the mature brain has yet to be investigated. Understanding how the absence of CDKL5 in the adult brain impacts the brain phenotypes is crucial in order to predict the effectiveness of future therapies aimed at restoring CDKL5 expression in CDD patients. To investigate the role of CDKL5 in the adult brain, we used a recently developed cKO mouse model that allows for inducible deletion of Cdkl5 expression in forebrain glutamatergic neurons [26,29]. Our findings demonstrate that the loss of Cdkl5 in excitatory neurons of the adult brain leads to neuroanatomical alterations, including a reduction in excitatory synapse density, impaired dendritic spine maturation, and decreased neuronal survival. These structural changes were accompanied by increased microglial activation, indicative of localized neuroinflammation. Behaviorally, Cdkl5 cKO mice exhibited impairments in hippocampus-dependent learning and memory, reduced sociability, motor coordination deficits, and autistic-like features. Collectively, these results highlight that CDKL5 plays a critical postdevelopmental role in glutamatergic neurons, maintaining synaptic architecture, neuronal viability, and functional integrity of forebrain circuits essential for normal cognitive and social behaviors.
2. Results
2.1. Postnatal Cdkl5 Deletion in Forebrain Glutamatergic Neurons, Body Weight and General Health in Cdkl5flox/Y(Cre+) Mice
To investigate whether Cdkl5 deletion in excitatory neurons of the adult brain leads to neurobehavioral alterations, we used a previously established tamoxifen-inducible conditional knockout (cKO) Cdkl5 mouse model. [26,29]. Three-month-old cKO male mice carrying an inducible Cre recombinase gene (CamK2α-iCre) under the control of the mouse CamK2α (calcium/calmodulin-dependent protein kinase 2 alpha) promoter, hereafter referred to as Cdkl5flox/Y(Cre+) mice, and their Cre-negative male littermate controls (Cdkl5flox/Y(Cre−)) were administered tamoxifen via intraperitoneal injection for five consecutive days to induce a postnatal, forebrain-specific deletion of Cdkl5 in glutamatergic neurons (Figure 1A). Mice were subjected to a series of behavioral tests between the third and twelfth weeks following tamoxifen treatment. These tests evaluated locomotor activity and coordination, spontaneous home-cage behaviors, sociability, hippocampal-dependent learning and memory, and sensory abilities (Figure 1A). Mice were sacrificed four weeks after the initiation of treatment to confirm the inactivation of the Cdkl5 gene, or after six or twenty weeks to evaluate the presence of neuroanatomical changes and their temporal progression (Figure 1A).
To assess the effective inactivation of the Cdkl5 gene, we analyzed the expression levels of Cdkl5 and the phosphorylation status of its well-known target, EB2 [30], in brain extracts from Cdkl5flox/Y(Cre+) and Cdkl5flox/Y(Cre−) mice through Western blot. A significant decrease in Cdkl5 expression was observed in homogenates from cortical and hippocampal tissue of Cdkl5flox/Y(Cre⁺) mice compared to their littermate Cdkl5flox/Y(Cre⁻) controls. In contrast, Cdkl5 levels remained unchanged in cerebellar tissue, confirming the specific knockout of Cdkl5 in forebrain excitatory neurons (Figure 1B). Accordingly, a decrease in Cdkl5 kinase activity was observed in the cortex and hippocampus of Cdkl5flox/Y(Cre⁺) mice, as evidenced by the reduced phosphorylation levels of EB2 (Figure 1C).
To further validate the forebrain-specific deletion of Cdkl5, in situ hybridization for Cdkl5 mRNA was performed on brain sections from Cdkl5flox/Y(Cre⁺) and Cre⁻ mice (Figure 1D and Figure S1). Although fluorescence intensity was not quantitatively measured, a marked reduction in Cdkl5 mRNA signal was clearly observed in the cortex and hippocampus of Cre⁺ mice compared to Cre⁻ controls (Figure 1D and Figure S1). In contrast, Cdkl5 mRNA levels remained unchanged in other brain regions, including the striatum, thalamus, and cerebellum (Figure S1). This regional expression pattern confirms the selective deletion of Cdkl5 in forebrain glutamatergic neurons and aligns with the known higher density of excitatory neurons in the cortex and hippocampus [31,32].
Regarding animal welfare, Cdkl5flox/Y(Cre⁺) mice exhibited a slight reduction in body weight compared to Cre⁻ controls during the fourth and fifth weeks following tamoxifen administration. Although this reduction persisted up to 12 weeks, it did not reach statistical significance (Figure 1E), suggesting that Cdkl5 deficiency may modestly impair somatic growth or influence food intake. Nonetheless, no signs of compromised welfare were detected in Cdkl5flox/Y(Cre⁺) mice, as indicated by the normal fur condition, unimpaired mobility within the home cage, and absence of spontaneous spasms.
The absence of spontaneous epileptic events, although differing from previous observations in this model [26,29], allowed us to perform a comprehensive series of behavioral analyses. Since the constitutive loss of Cdkl5 in Cdkl5 KO mice has been associated with a broad range of behavioral impairments, including deficits in motor coordination, autistic-like traits, reduced social interactions, and memory impairments [5,6,19,20,33,34], we assessed these same behavioral domains in the Cdkl5flox/Y(Cre⁺) cKO mouse model.
2.2. Motor Coordination, Repetitive and Autistic-like Behaviors in Cdkl5flox/Y(Cre+) Mice
We evaluated motor coordination using an accelerating rotarod assay by analyzing the frequency of passive rotations (number of passive rotations per second). Locomotor performance was significantly impaired in Cdkl5flox/Y(Cre⁺) mice compared to Cdkl5flox/Y(Cre⁻) control mice (genotype: F(1, 160) = 11.11, P=0.0011; two-way ANOVA), as evidenced by the higher number of passive rotations observed in all subsequent testing trials (Figure 2A).
In the marble burying assay, used to assess autistic-like behavior, Cdkl5flox/Y(Cre⁺) mice exhibited significantly impaired behavior, burying fewer marbles compared to their (Cre⁻) counterparts (Figure 2B).
As a sign of stereotypic movements, we assessed the clasping time in Cdkl5flox/Y(Cre⁺) mice. We found that Cdkl5flox/Y(Cre⁺) mice exhibited increased clasping of the hind limbs, as evidenced by a longer duration of sustained clasping and a higher percentage of mice displaying this phenotype compared to Cdkl5flox/Y(Cre⁻) control mice (Figure 2C).
The open field test was employed to evaluate both locomotor activity and anxiety-like behavior. In contrast to constitutive Cdkl5 KO mice, which display hyperactivity in this assay [5,6,33], Cdkl5flox/Y(Cre⁺) mice exhibited normal activity levels compared to Cdkl5flox/Y(Cre⁻) controls, with no significant differences in either velocity or total distance traveled (Figure 2D). Both groups showed a progressive decrease in locomotor activity over repeated trials, suggesting habituation to the environment (time: F(3, 104) = 9.073, P<0.0001; two-way ANOVA). With regard to the stereotypic jumping behavior that characterizes constitutive Cdkl5 KO mice [20], we did not observe this phenotype in Cdkl5flox/Y(Cre⁺) animals under our testing conditions (data not shown), suggesting that this specific behavioral trait may depend on early developmental loss of Cdkl5 rather than from its postnatal ablation in forebrain excitatory neurons. To assess anxiety-like behavior, we compared the time spent in the peripheral versus central zones of the arena and found no significant differences between groups (Figure 2E).
2.3. Social Interaction and Memory Impairments in Cdkl5flox/Y(Cre+) Mice
To assess social interaction in Cdkl5flox/Y(Cre⁺) mice, we performed the three-chamber test (Figure 3A), which quantifies sociability by measuring the time spent interacting with a novel mouse versus a non-social object. While Cdkl5flox/Y(Cre⁻) control mice showed a clear preference for the stranger mouse over the object, Cdkl5flox/Y(Cre⁺) mice failed to display such a preference, spending comparable amounts of time with both the mouse and the object (Figure 3B). These results indicate impaired social interaction in the Cdkl5flox/Y(Cre⁺) group.
To evaluate hippocampus-dependent learning and memory, we employed the Barnes maze and passive avoidance tests. During the learning phase of the Barnes maze, mice were trained to locate a hidden escape box using spatial cues positioned around the arena. Cdkl5flox/Y(Cre⁺) mice demonstrated the ability to learn the task over time; however, their learning curve was consistently higher compared to that of Cdkl5flox/Y(Cre⁻) control mice (genotype: F(1, 54) = 8.201, P=0.0059; two-way ANOVA), indicating slower acquisition of the task (Figure 3C). When daily performances were compared between groups using Fisher’s LSD test, a significant difference emerged on the first day of training (P = 0.0053), while differences on subsequent days did not reach statistical significance (Figure 3C). In the day 4 probe test, Cdkl5flox/Y(Cre⁺) mice exhibited significantly impaired memory performance compared to Cdkl5flox/Y(Cre⁻) controls. Specifically, they showed a longer latency to locate the former position of the escape box, made a higher number of incorrect hole entries, and spent less time in the target zone overall (Figure 3D,E).
In the passive avoidance test, mice were conditioned with a single aversive stimulus, and their ability to avoid the associated environment was subsequently assessed. No significant differences were observed between Cdkl5flox/Y(Cre⁺) and Cdkl5flox/Y(Cre⁻) mice in latency to enter the dark compartment during the training session (Day 1; Figure 3F). On the retention test (Day 2), a trend toward reduced latency was observed in the Cre⁺ group, although this difference did not reach statistical significance probably due to high inter-individual variability in this test (Figure 3F).
2.4. Olfaction and Pain Perception in Cdkl5flox/Y(Cre+) Mice
To determine whether the loss of Cdkl5 from excitatory forebrain neurons in adulthood affects sensory abilities due to impaired central sensory signal integration, we assessed olfactory function and pain perception in Cdkl5flox/Y(Cre⁺) mice. Olfactory performance was tested using the buried food test, which evaluates the animal’s ability to locate hidden food using olfactory cues. No significant difference was observed between Cdkl5flox/Y(Cre⁺) and Cdkl5flox/Y(Cre⁻) mice (Figure 4A), indicating intact olfactory function in the Cre⁺ group.
Given that altered pain perception has been reported in CDD patients and in constitutive Cdkl5 KO mice [35], we next evaluated mechanical nociception using the Von Frey filament test. Cdkl5flox/Y(Cre⁺) and Cdkl5flox/Y(Cre⁻) mice showed no significant differences in mechanical sensitivity, as reflected by comparable paw withdrawal thresholds (in grams) and similar latencies of hind paw withdrawal following stimulation (Figure 4B).
These results suggest that postnatal deletion of Cdkl5 in excitatory neurons does not impair basic sensory processing.
2.5. Brain Connectivity and Hippocampal Dendritic Spine Maturation in Cdkl5flox/Y(Cre+) Mice
Since behavioral abnormalities in constitutive Cdkl5 KO mice are associated with neuroanatomical alterations such as impaired connectivity and dendritic spine maturation [15,16,17,19,20,34], we investigated synaptic organization in the hippocampus and cortex of Cdkl5flox/Y(Cre⁺) mice by analyzing the number of excitatory and inhibitory terminals that were immunoreactive for vesicular glutamate transporter-1 (VGLUT1), a marker of glutamatergic axon terminals [36], and vesicular GABA transporter (VGAT), a marker of GABAergic axon terminals [37], respectively. In both the cortex and hippocampus of Cdkl5flox/Y(Cre⁺) mice, we observed a reduced number of VGLUT1-positive puncta compared to Cdkl5flox/Y(Cre⁻) controls (Figure 5A,B; cortex: −10.77 ± 2.81%; hippocampus: −7.71 ± 3.62%), suggesting a decrease in glutamatergic terminal density following Cdkl5 deletion. In both experimental groups, the density of VGLUT1-positive puncta was significantly higher in the hippocampus compared to the cortex (Figure 5A; Cre⁻: +15.26 ± 3.53%; Cre+: +19.21 ± 4.68%), indicating/confirming a regional difference in glutamatergic terminal distribution.
Concerning inhibitory terminals, no differences were found in the density of VGAT-positive puncta between Cdkl5flox/Y(Cre⁺) and Cdkl5flox/Y(Cre⁻) mice in either the cortex or the hippocampus (Figure 5B,C). However, comparison of inhibitory terminal density between the cortex and hippocampus in Cdkl5flox/Y(Cre⁻) mice revealed a significantly lower density in the hippocampus (Figure 5B; −16.81 ± 1.63%), whereas no such difference was observed in Cdkl5flox/Y(Cre⁺) mice (Figure 5B).
To investigate whether the loss of Cdkl5 in excitatory neurons of the adult brain affects spine development, we analyzed Golgi-stained brain sections and quantified spine density on the dendrites of pyramidal neurons in the hippocampal CA1 region. Cdkl5flox/Y(Cre⁺) mice exhibited a significantly increased spine density compared to their Cre⁻ counterparts (Figure 5D; +16.81 ± 3.24%). To further investigate potential alterations in dendritic spine development, we quantified dendritic spines based on their morphology and maturation state. As previously described [38], spines were classified as immature (filopodia, thin-shaped, and stubby-shaped) or mature (mushroom- and cup-shaped). Morphological analysis revealed that adult loss of Cdkl5 in glutamatergic neurons impaired spine maturation in Cdkl5flox/Y(Cre⁺) mice. Specifically, hippocampal neurons from Cdkl5flox/Y(Cre⁺) mice displayed a significant reduction in the proportion of mature spines (Figure 5E,F; mushroom: −31.51 ± 3.52%; cup-shaped: −80.45 ± 14.87%) and a corresponding increase in the percentage of immature spines (Figure 5E,F; filopodia plus thin-shaped: +58.41 ± 3.05%) compared to Cdkl5flox/Y(Cre⁻) controls.
2.6. Microglial Cell Density and Hippocampal Neuronal Survival in the Brain of Cdkl5flox/Y(Cre+) Mice
Since the loss of Cdkl5 has recently been shown to promote neuroinflammatory processes in the cortex and hippocampus of constitutive Cdkl5 KO mice, along with a reduction in neuronal survival [23,24], we analyzed the number of microglial cells (AIF-1-positive) in the cortical and hippocampal regions of Cdkl5flox/Y(Cre⁺) mice at two different time points, six and twenty weeks after tamoxifen treatment, to assess whether the persistence of Cdkl5 deficiency leads to a worsening of the phenotype.
Quantification of AIF-1-positive cells in the somatosensory cortex revealed a higher microglial density in Cdkl5flox/Y(Cre⁺) mice compared to Cre⁻ controls as early as six weeks post-treatment (+14.61 ± 3.11%), a difference that persisted at twenty weeks (+12.99 ± 2.37%; Figure 6A,C). In contrast, no significant differences in microglial density were observed between the two groups in the hippocampal region at either time point (Figure 6B).
Regarding hippocampal neuronal survival, Cdkl5flox/Y(Cre⁺) mice showed a comparable percentage reduction in the number of DAPI-positive nuclei in the CA1 region at both six and twenty weeks following tamoxifen treatment, relative to controls (Figure 6D,E; 6w: −8.38 ± 1.67% and 20w: −11.90 ± 0.38%). These findings suggest that hippocampal neuron loss occurs early after Cdkl5 deletion and does not significantly progress over time. In contrast, an age-dependent decline in hippocampal neuron survival was evident in both experimental groups (Figure 6D,E; Cre⁻: −6.87 ± 1.31% and Cre⁺: −10.45 ± 0.38%).
3. Discussion
This study provides compelling evidence for the essential role of CDKL5 in the adult brain, showing that its selective deletion in glutamatergic neurons of the forebrain, even after the completion of brain development, is sufficient to induce neuroanatomical, synaptic, and behavioral alterations that are characteristic of the CDKL5 deficiency disorder (CDD) phenotype. These findings reinforce the hypothesis that CDKL5 is not only critical during early neurodevelopment but also plays a key role in maintaining neuronal function and the structural integrity of brain circuits throughout adulthood. Previous studies in constitutive Cdkl5 KO mouse models have highlighted the importance of CDKL5 during early developmental stages, with animals displaying profound synaptic deficits, impaired neuronal maturation, and a wide spectrum of behavioral abnormalities that resemble core features of CDD [5,6,8,9,10,14,15,16,17,18,19,20,39]. However, it remained unclear whether these phenotypes were exclusively the result of early developmental dysfunction or whether CDKL5 continued to exert essential functions in the mature brain. By employing a conditional and neuron-specific deletion strategy, our study clearly demonstrates that the postdevelopmental loss of CDKL5 in forebrain excitatory neurons is sufficient to recapitulate many of the structural and behavioral deficits observed in constitutive models. This suggests that the function of CDKL5 extends beyond neurodevelopment and remains crucial for synaptic maintenance and the regulation of complex behaviors in adulthood.
In particular, our data show that postnatal loss of Cdkl5 in excitatory neurons leads to a reduction in glutamatergic synapse density in both the cortex and hippocampus, without significant changes in the inhibitory synaptic component. The presence of mature spines is essential for the establishment of excitatory synaptic contacts. Therefore, the reduction in the number of excitatory terminals observed in Cdkl5flox/Y(Cre⁺) mice is consistent with the decreased number of mature spines. Notably, Ricciardi et al. [40], using in utero electroporation of shRNA targeting Cdkl5, similarly reported a decrease in VGLUT1 terminal density in cortical neurons, supporting our findings. However, other studies in the visual cortex [15], and our own recent observations in the somatosensory cortex [17], have reported an increase in VGLUT1 puncta, which appears contradictory and warrants further discussion. This discrepancy could reflect differences in developmental stages, or the timing and method of Cdkl5 deletion, suggesting a complex and possibly region-specific role of CDKL5 in synapse regulation. Importantly, our model specifically targets Cdkl5 deletion in excitatory neurons postnatally, whereas many of the contrasting studies use constitutive Cdkl5 KO mice that lack CDKL5 in all cell types throughout development. This difference may explain some of the divergent results, as the absence of CDKL5 in non-excitatory cells (e.g., inhibitory neurons) in constitutive KOs could influence synaptic connectivity in ways that are not captured by excitatory neuron-specific deletion.
As previously reported in a conditional Cdkl5 KO model in which selective deletion in excitatory neurons is induced during early cortical development (embryonic day 9.5–10.5; [28]), we observed an increased density of immature dendritic spines accompanied by a marked reduction in mature spines. These findings further support the critical role of CDKL5 in regulating synaptic maturation and stability in the adult brain. Additionally, in Cdkl5flox/Y(Cre⁺) mice, overall spine density on CA1 pyramidal neurons was increased compared to controls. However, a higher proportion of these spines exhibited a filopodia-like morphology, characteristic of immature spines. This shift in the balance between immature and mature spines, favoring the former, is also consistent with observations from constitutive Cdkl5 KO models [18,33,39,40], further supporting the idea that CDKL5 function in excitatory neurons is essential to maintain synaptic integrity and confirming that synaptic abnormalities are not exclusively the result of disrupted neurodevelopment but can also arise following postnatal loss of CDKL5 function.
Our results showed that in Cdkl5flox/Y(Cre+) mice, the ratio between glutamatergic and GABAergic terminals in both the cortex and hippocampus was reduced, primarily due to a decrease in excitatory terminals. This altered balance, with its shift toward excessive inhibition, may impair neuronal firing and disrupt proper signal processing. Such an inhibitory dominance has previously been hypothesized in constitutive Cdkl5 KO mouse models, in which an increase in inhibitory terminals was reported, associated with impaired long-term potentiation (LTP) [41,42].
From a phenotypic perspective, Cdkl5flox/Y(Cre+) adult mice display a phenotype that is strikingly similar to that of germline knockouts, including deficits in motor coordination, repetitive and stereotyped behaviors, reduced sociability, and impaired spatial memory. Despite the absence of spontaneous seizures in this model, in contrast with previous reports [26,29], these mice exhibit clear behavioral abnormalities that align with core symptoms of CDKL5 deficiency disorder (CDD).
Our findings from postnatal deletion of Cdkl5 in forebrain glutamatergic neurons reveal a behavioral phenotype that partially overlaps with previously reported studies in [7]. Importantly, unlike the milder phenotype reported in the Nex-Cre conditional knockout model [7], which showed relatively selective impairments in hippocampal-dependent memory and modest behavioral alterations, our inducible deletion leads to a more severe and broader spectrum of behavioral deficits. These include pronounced motor coordination impairments and marked social interaction deficits that exceed those observed in the Nex-Cre model. Differently from GABAergic neuron-specific knockouts [6], all conditional models targeting forebrain excitatory neurons, whether during brain development (Emx1::Cre [6]; Nex-Cre [7]) or in adulthood (present study, Camk2a-iCre), consistently display hindlimb clasping behavior. This indicates that loss of Cdkl5 in excitatory neurons is sufficient to induce this motor phenotype regardless of the timing of deletion, and further supports the notion that this abnormality is specifically linked to excitatory, rather than inhibitory, neuron dysfunction. All conditional models maintained normal body weight and viability [6,7], paralleling the general health parameters observed in our Cdkl5flox/Y(Cre+) mice.
In contrast, hyperactivity in the open field test and stereotypic jumping behavior, hallmark phenotypes consistently observed in constitutive Cdkl5 knockout mice [20,33,39,43], were absent in our Cdkl5flox/Y(Cre+) animals. Similarly, some sensory functions, such as olfaction and mechanical pain perception, remain preserved, likely because the selective deletion of CDKL5 in central glutamatergic neurons spares peripheral sensory neurons and primary sensory pathways. This suggests that CDKL5’s critical role in the adult brain is focused on cortical and hippocampal circuits involved in cognition, memory, and social behavior, rather than on peripheral or primary sensory processing. Indeed, Cdkl5 is expressed in nociceptive dorsal root ganglia (DRG) neurons [35], further supporting the idea that peripheral CDKL5 expression contributes to pain processing pathways.
Together, these findings emphasize that the timing and cell-type specificity of Cdkl5 deletion critically influence the spectrum and severity of behavioral phenotypes. While postnatal deletion in forebrain excitatory neurons is sufficient to reproduce core features of CDD, such as motor deficits, social impairments, and cognitive dysfunction, it does not fully recapitulate the broader phenotype observed in constitutive knockouts. This highlights the pivotal role of excitatory neurons in mediating key aspects of the disorder, while also suggesting that additional features may require Cdkl5 loss in other neuronal populations and/or during early developmental stages.
The presence of microglial activation in the brains of Cdkl5flox/Y(Cre⁺) mice suggests a potential neuroinflammatory response that is secondary to neuronal dysfunction, a phenomenon previously reported in constitutive Cdkl5 knockout models [23,24]. Notably, the increase in microglial cells is restricted to the cortex and absent in the hippocampus, indicating a region-specific neuroinflammatory response that may reflect differential vulnerability or the engagement of compensatory mechanisms across brain regions. Since microglial activation is often associated with epilepsy, and considering that this model has shown epileptic activity in other studies [26,29], the elevated microglial cell number may point to underlying neuronal hyperactivity that is not readily detectable without electrophysiological assessment. However, this microgliosis, observed six weeks after Cdkl5 deletion, does not appear to worsen over time, suggesting it represents an early and transient response to functional alterations in neuronal circuits rather than a progressive neuroinflammatory process. This pattern implies that microglial activation in this model may reflect a homeostatic adaptation to altered neuronal activity rather than an ongoing degenerative process. Supporting this, the reduced number of neurons observed in the hippocampal CA1 field of Cdkl5flox/Y(Cre⁺) mice compared to controls also shows no deterioration over time.
At present, we do not have a clear explanation for why we do not observe epilepsy or increased mortality in this model, unlike in previous studies [26,29]. Since the genetic background of the mice and the timing of Cdkl5 deletion closely match previously published conditions, we can hypothesize that environmental and husbandry factors, such as animal management, diet, and environmental stressors, may influence the onset of epileptic seizures and overall survival. This lack of reproducibility has also been reported in other murine models of epilepsy [44], and it nonetheless underscores the limitations of this phenotype in the mouse models of CDD.
4. Materials and Methods
4.1. Animals
All experiments were conducted on male C57BL/6J mice carrying a floxed allele of the Cdkl5 gene (Cdkl5flox/Y) either with or without the Camk2a-CreERT2 transgene. Cdkl5flox/Y; Camk2a-CreERT2 (referred to as Cdkl5flox/Y(Cre⁺)) mice were generated by crossing Cdkl5flox/flox females [5] with Camk2a-CreERT2 males [45]. Male Cdkl5flox/Y littermates lacking the Camk2a-CreERT2 transgene (Cdkl5flox/Y (Cre⁻)) were used as controls. Postnatal day zero (P0) was designated as the day of birth, and 24 h later mice were considered as one-day-old animals (P1). After weaning (P21–23), mice were housed three to five per cage under a 12-h light/dark cycle in a temperature- and humidity-controlled environment, with food and water provided ad libitum. Animal health and well-being were monitored by the veterinary service. All efforts were made to minimize animal suffering and to keep the number of animals used to a minimum. Experiments were carried out on a total of 48 mice (Cdkl5flox/Y(Cre⁻), n = 18; Cdkl5flox/Y(Cre⁺), n = 30).
4.2. Tamoxifen Treatment
Starting at three months of age, all mice were treated with tamoxifen (Sigma-Aldrich, Saint Louis, MO, USA) dissolved in corn oil (Sigma-Aldrich, Saint Louis, MO, USA) at a concentration of 20 mg/ml. Tamoxifen was administered via intraperitoneal injections at a dose of 100 mg/kg once daily for five consecutive days.
4.3. Behavioral Assays
Mice were subjected to a battery of behavioral tests, arranged to minimize the effect of one test on the evaluation of the next. To further reduce inter-test interference, a recovery period of at least 24 h was allowed between each test. All behavioral experiments and subsequent analyses were conducted blind to genotype. Prior to each session, mice were habituated to the testing room for at least 1 h, and all tests were performed at the same time of day.
4.3.1. Marble Burying
The marble burying test was performed by placing mice individually in transparent polycarbonate cages (40 × 25 × 15 cm) filled with 6 cm of clean wood chip bedding. Each mouse was first habituated to the testing cage (without marbles) for 5 min. After the habituation period, the mouse was gently removed, and twenty glass marbles (14.3 mm in diameter) were arranged in a 4 × 5 grid on the surface of the bedding. The mouse was then reintroduced into the same cage and left undisturbed for 30 min. The number of marbles that were at least two-thirds buried at the end of the trial was counted.
4.3.2. Hind-Limb Clasping
Mice were suspended by their tail for 2 min, and their behavior was video-recorded. A clasping event is defined by the retraction of the hind-limbs toward the abdomen and midline. From the video recordings, two parameters were analyzed: (1) the total duration of hind-limb clasping exhibited by each mouse during the 2-min suspension and (2) the percentage of mice showing clasping for at least 3 s during the trial. Evaluation from video recordings was performed by an experimenter blinded to genotype.
4.3.3. Accelerating Rotarod Assay
Motor coordination was assessed using an accelerating rotarod apparatus (Ugo Basile, Gemonio, Italy). Prior to testing, mice were briefly trained on the rotarod at a constant speed of 5 rpm for 30 s. Testing was then performed at an accelerating linear speed (5-35 rpm within 270 s + 30 s max speed). Four testing trials with an intertrial interval of 1 h were performed. The latency to fall from the rotating rod and the number of passive rotations (rotations in which the mouse does not perform any coordinated movement but is passively transported by the rotating apparatus) were recorded for each trial.
4.3.4. Open Field
Mice were individually placed in the center of a square open field arena (50 × 50 cm), and their behavior was recorded for 20 min using a video camera positioned above the center of the arena. Distinct features of locomotor activity, including total distance traveled, average locomotion velocity, and the time spent in the central and peripheral zones were scored using EthoVision15XT software (Noldus Information Technology, Wageningen, The Netherlands). The open field arena was cleaned with 70% ethanol between test subjects.
4.3.5. Three-Chambers
Social interaction was assessed using an open-topped plastic apparatus divided into three chambers (20 × 40 × 22 cm) by two transparent walls, each equipped with a retractable doorway to allow access between compartments. The experimental mouse was placed in the center of the middle chamber and allowed to explore the whole apparatus for two trials of 5 min each. On the first trial (habituation phase) the stimulus cages were empty, and the experimental mouse was left undisturbed to explore the apparatus and habituate to the testing environment. At the end of this trial, the experimental mouse was confined to the central chamber using two transparent Plexiglas doors. On the second trial (sociability phase), a stimulus mouse (an age-matched unfamiliar C57BL/6 J male mouse) was introduced into one of the stimulus cages, while a novel object (a plastic cylinder filled with clean wood chip bedding) was introduced in the other one. The position of the social stimulus and of the object was counterbalanced between genotypes. The apparatus and the stimulus cages were cleaned with 70% ethanol at the end of each second trial. The total time spent in each chamber was automatically scored using EthoVision15XT software (Noldus Information Technology, Wageningen, The Netherlands).
4.3.6. Barnes Maze
Spatial memory acquisition and retention were evaluated using the Barnes maze test. The apparatus consisted of a circular platform (1 m in diameter) elevated 60 cm above the floor, with twenty evenly spaced holes (each 5 cm in diameter) along the perimeter (Ugo Basile, Gemonio, Italy). An escape box was placed under one of the holes. Mice were trained to locate the escape box over three consecutive days (three trials per day, maximum duration of 3 min per trial), with a 30-min intertrial interval. At the beginning of each trial, mice were placed in the center of the platform under a dark cylindrical chamber for 10 s; the chamber was then lifted to start the trial. Mice that initially failed to locate the escape box within 3 min were gently guided to the target by the experimenter. To assess spatial memory retention, a 90 s probe trial was performed 24 h after the last trial, during which the escape box was removed. Latency to enter the escape box during training sessions, latency to locate the former location of the escape box (i.e., the target zone) during the probe trial, and the total time spent in the target zone were automatically scored using EthoVision XT 15 software (Noldus Information Technology, Wageningen, The Netherlands).
4.3.7. Passive Avoidance
For the passive avoidance test, a memory task involving contributions from both the hippocampus and amygdala, the apparatus consisted of a tilting-floor box (47 x 18 x 26 cm) divided into two compartments (illuminated and dark) by a sliding door, and a control unit incorporating a shock generator (Ugo Basile, Gemonio, Italy). On day 1, mice were placed in the illuminated compartment, and upon entering the dark compartment, they received a brief mild foot shock (0.4 mA for 3 s). Mice were removed from the apparatus 15 s after the shock was delivered. After a 24 h retention period, mice were returned to the illuminated compartment, and the latency to re-enter the dark compartment was scored, up to a maximum of 360 s. The two compartments were cleaned with 70% ethanol between the testing of each subject.
4.3.8. Buried Food Test
The buried food test assesses olfactory function based on the animal’s ability to detect volatile odors and its natural tendency to use olfactory cues for foraging. The testing protocol consisted of three days and included an odor familiarization phase on day 1, food deprivation on day 2, and testing on day 3. On day 1, mice were placed in a clean cage with a piece of raisin (identical to the one used during the testing day) and left overnight. On day 2, cages were inspected to confirm raisin consumption, ensuring that the bait was highly palatable. Mice were then food-deprived for 24 h. On day 3, mice were individually placed in a clean cage containing 4 cm of bedding and allowed to acclimate for 5 min to reduce the interference of novel environment exploration during the test. A piece of raisin was then buried beneath 1 cm of bedding in a randomly selected corner of the cage. Mice were reintroduced into the cage, and the latency to retrieve the raisin using their front paws was measured, up to a maximum of 900 s.
4.3.8. Von Frey Filament Test
Mechanical allodynia was quantified by measuring the hind paw withdrawal response to von Frey filament stimulation (Ugo Basile, Gemonio, Italy). Mice were acclimated for 1 hour in acrylic cages (12 × 20 × 17 cm) with a wire-grid floor (5 mm²). A single, unbending von Frey filament was applied perpendicularly to the plantar surface of each hind paw with gradually increasing force, and stimulation was stopped upon observation of a withdrawal response. Latency to paw withdrawal and the force (in grams) required to elicit the response were calculated as the average of three measurements taken from each hind paw.
4.4. Histological and Immunohistochemistry Procedures
Animals were anesthetized with isoflurane (2% in pure oxygen) and sacrificed through cervical dislocation. Brains were quickly removed and cut along the midline. Left hemispheres were Golgi-stained or quickly frozen and used for Western blot analyses. Right hemispheres were fixed by immersion in 4% paraformaldehyde in 0.1 M phosphate-buffered saline (PBS) for 48 h, kept in 15-20% sucrose for an additional 24 h, frozen with dry ice, and stored at - 80°C.
4.4.1. Immunofluorescence Staining
Right hemispheres were cut using a freezing microtome (Microm GmbH, Walldorf, Germany) into 30-μm-thick coronal sections, which were serially collected in 96-well plates containing a solution composed of 30% glycerol, 30% ethylene glycol, 0.02% sodium azide in 0.1 M PBS. One out of every eight free-floating sections from the hippocampal formation was incubated overnight at 4°C with one of the following primary antibodies: rabbit polyclonal anti-AIF-1 antibody (1:300; Thermo Fisher Scientific, Waltham, MA, USA), rabbit polyclonal anti-VGAT antibody (1:300; Synaptic Systems, Göttingen, Germany), or goat polyclonal anti- VGLUT1 antibody (1:300; Synaptic Systems, Göttingen, Germany). The following day, the sections were incubated for 2 h at room temperature with one of the following secondary antibodies: Alexa Fluor 555-conjugated anti-rabbit IgG antibody (1:200; Thermo Fisher Scientific, Waltham, MA, USA), or Alexa Fluor 555-conjugated anti-goat IgG antibody (1:200; Thermo Fisher Scientific, Waltham, MA, USA). Sections were then mounted with DAPI (40,6-diamidino-2-phenylindole)-Fluoromount-G® (SouthernBiotech, Birmingham, AL, USA).
4.4.2. Golgi Staining
Left hemispheres were Golgi-stained using the FD Rapid Golgi StainTM Kit (FD Neuro Technologies, Columbia, MD, USA), as previously described [46]. Hemispheres were cut using a cryostat (Histo-Line Laboratories, Pantigliate, Italy) into 100-µm-thick coronal sections, which were directly mounted onto Superfrost® Plus microscope slides (Thermo Fisher Scientific, Waltham, MA, USA) and air-dried at room temperature for 1 day. After drying, sections were rinsed with distilled water, stained in the developing solution of FD Rapid Golgi StainTM Kit (FD NeuroTechnologies, Columbia, MD, USA), and coverslipped with DPX mounting medium (Sigma-Aldrich, Saint Louis, MO, USA).
4.4.3. In Situ Hybridization (ISH)
Right hemispheres were cut using a cryostat into 15-μm-thick sagittal sections which were serially collected onto Superfrost® Plus microscope slides (Thermo Fisher Scientific, Waltham, MA, USA). The in situ hybridization (ISH) for Cdkl5 mRNA was performed using the BaseScope™ technology (Bio-Techne, Minneapolis, MN, USA), following the manufacturer’s protocol. A 1ZZ probe targeting exon 4 of the CDKL5 transcript was used, as previously described [47].
4.5. Image Acquisition and Measurements
Fluorescence images of brain sections processed for AIF-1 immunofluorescence or for Cdkl5 mRNA detection via BaseScope™ were acquired using a Nikon Eclipse TE 2000-S fluorescence microscope equipped with a DS-Qi2 digital SLR camera (Nikon Instruments Inc., Tokyo, Japan). Fluorescence images of sections immunostained for VGAT or VGLUT1 were acquired using a Nikon Ti-E fluorescence microscope connected to an A1R confocal system (Nikon Instruments Inc., Tokyo, Japan). Bright-field images of Golgi-stained brain sections were acquired using a light microscope (Leica Microsystems, Shinjuku City, Tokyo, Japan) equipped with a motorized stage and focus control system, and a color digital camera (Coolsnap-Pro, Media Cybernetics, Rockville, MD, USA).
4.5.1. Quantification of VGAT and VGLUT1 Immunoreactive Puncta
Three to four sections per animal were analyzed. For each section, three images were acquired from layers II–III of the somatosensory cortex and from the stratum oriens of the hippocampus using a 60× oil immersion objective lens (1.32 NA; zoom factor = 8). The density of individual puncta exhibiting VGAT or VGLUT1 immunoreactivity was manually quantified using Image-Pro Plus software (Media Cybernetics, Rockville, MD, USA), as previously described [17]. The number of immunoreactive puncta was expressed per µm2.
4.5.2. Dendritic Spine Number and Morphology
In Golgi-stained sections, dendritic spines located in the basal dendrites of hippocampal pyramidal neurons were captured with a 100× oil immersion objective lens (1.4 NA) and manually counted using Image-Pro Plus software (Media Cybernetics, Rockville, MD, USA). For each mouse, 10-12 dendritic segments of 10 μm each were analyzed, and spine density was expressed as the number of spines per 10 μm of dendrite. Based on their morphology, dendritic spines can be classified into two categories reflecting their maturation state: immature spines (filopodium-like, thin, and stubby-shaped) and mature spines (mushroom- and cup-shaped). The number of spines in each category was quantified and expressed as a percentage.
4.5.3. Cell Density
Starting from 20× magnification images, the number of AIF-1-positive cells in the hippocampus and somatosensory cortex was manually counted using the point tool in Image-Pro Plus software (Media Cybernetics, Rockville, MD, USA), and cell density was expressed as AIF-1-positive cells/mm². Similarly, starting from 40× magnification images, the density of DAPI-positive nuclei in the CA1 field of the hippocampus was manually counted and expressed as cells/mm².
4.6. Western Blotting
Tissue samples were homogenized in RIPA buffer (50 mM Tris-HCl, pH 7.4, 150 mM NaCl, 1% Triton-X100, 0.5% sodium deoxycholate, 0.1% SDS) supplemented with 1 mM PMSF and 1% protease and phosphatase inhibitor cocktail (Sigma-Aldrich, Saint Louis, MO, USA). Protein concentration was determined using the Bradford method [48]. Equal amounts of protein (50 μg) were separated by electrophoresis on a 4-12% Mini-PROTEAN® TGX™ Gel (Bio-Rad, Hercules, CA, USA) and transferred to a Hybond ECL nitrocellulose membrane (GE Healthcare, Chicago, IL, USA). The following primary antibodies were used: sheep polyclonal anti-CDKL5 (1:1000; University of Dundee, Dundee, UK); rabbit polyclonal anti-P-EB2 (S222; 1:1000; Covalab, Bron, France); rabbit polyclonal anti-EB2 (1:1000; Abcam, Cambridge, UK); rabbit polyclonal anti-GAPDH (1:5000; Sigma-Aldrich, Saint Louis, MO, USA). The following secondary antibodies were used: HRP-conjugated anti-sheep IgG antibody (1:5000; Jackson ImmunoResearch Laboratories, West Grove, PA, USA); HRP-conjugated anti-rabbit IgG antibody (1:5000; Jackson ImmunoResearch Laboratories, West Grove, PA, USA). Densitometric analysis of digitized Western blot images was performed using ChemiDocTM MP Imaging System equipped with Image Lab Touch Software (Bio-Rad, Hercules, CA, USA), which automatically highlights saturated pixels in red. Images acquired with exposure times that generated protein signals out of a linear range were not considered for quantification.
4.7. Statistical Analysis
Statistical analysis was performed using GraphPad Prism 8.0.1 (GraphPad Software, Boston, MA, USA). Data are presented as means ± standard error of the mean (SEM). Statistical significance was assessed using Student’s t-test (or Welch’s t-test in case of unequal variances), or two-way analysis of variance (ANOVA) followed by Fisher’s LSD post hoc test for parametric data, or Mann-Whitney for non-parametric data, as specified in the figure legends. A p-value < 0.05 was considered statistically significant.
5. Conclusions
Taken together, these results reinforce the idea that CDKL5 remains essential beyond early development for the maintenance of excitatory synapses and the regulation of complex behaviors. Moreover, this study highlights the critical need for experimental models that can differentiate between the effects of early and late CDKL5 loss. Such models are key to more accurately recapitulating the human condition of CDKL5 Deficiency Disorder (CDD) and will enhance our understanding of the ongoing pathophysiological mechanisms in the adult brain.
Supplementary Materials
The following supporting information can be downloaded at: www.mdpi.com/xxx/s1, Figure S1: Cdkl5 mRNA expression in the brain of Cdkl5flox/Y(Cre+) mice.
Author Contributions
Conceptualization, E.C., Z.Q.X, and S.T.; Data curation, G.M., N.M. and F.I.; Formal analysis M.L., G.M., G.C., F.T., F.I. and A.M.B.; Funding acquisition E.C.; Investigation, N.M., S.T. and F.I.; Methodology, N.M., G.M. and S.T.; Supervision E.C.; Writing—original draft preparation, E.C. and S.T.; Writing—review and editing, E.C., N.M. and S.T. All authors have read and agreed to the published version of the manuscript.
Funding
This research was supported by #NEXTGENERATIONEU (NGEU) and funded by the Ministry of University and Research (MUR), National Recovery and Resilience Plan (NRRP), project MNESYS (PE0000006; DN. 1553 11.10.2022), to EC. This research was also financed by a contribution from the Italian parent association “CDKL5 insieme verso la cura” to E.C.
Institutional Review Board Statement
The animal study protocol complied with EU Directive 2010/63/EU and with Italian law (DL 26, 4 March 2014) and were approved by the Italian Ministry of Health (protocol code: 376/2025-PR).
Informed Consent Statement
Not applicable.
Data Availability Statement
The datasets analyzed during the current study are available from the corresponding author upon reasonable request.
Conflicts of Interest
The authors declare no conflicts of interest.
References
- Fehr, S.; Wilson, M.; Downs, J.; Williams, S.; Murgia, A.; Sartori, S.; Vecchi, M.; Ho, G.; Polli, R.; Psoni, S.; et al. The cdkl5 disorder is an independent clinical entity associated with early-onset encephalopathy. Eur J Hum Genet 2013, 21, 266–273. [Google Scholar] [CrossRef] [PubMed]
- Rusconi, L.; Salvatoni, L.; Giudici, L.; Bertani, I.; Kilstrup-Nielsen, C.; Broccoli, V.; Landsberger, N. Cdkl5 expression is modulated during neuronal development and its subcellular distribution is tightly regulated by the c-terminal tail. J Biol Chem 2008, 283, 30101–30111. [Google Scholar] [CrossRef] [PubMed]
- Van Bergen, N.J.; Massey, S.; Quigley, A.; Rollo, B.; Harris, A.R.; Kapsa, R.M.I.; Christodoulou, J. Cdkl5 deficiency disorder: Molecular insights and mechanisms of pathogenicity to fast-track therapeutic development. Biochem Soc Trans 2022, 50, 1207–1224. [Google Scholar] [CrossRef] [PubMed]
- Sun, X.; Wang, T. Research progress on the pathogenesis of cdkl5 pathogenic variants and related encephalopathy. Eur J Pediatr 2023, 182, 3049–3056. [Google Scholar] [CrossRef]
- Wang, I.T.; Allen, M.; Goffin, D.; Zhu, X.; Fairless, A.H.; Brodkin, E.S.; Siegel, S.J.; Marsh, E.D.; Blendy, J.A.; Zhou, Z. Loss of cdkl5 disrupts kinome profile and event-related potentials leading to autistic-like phenotypes in mice. Proc Natl Acad Sci U S A 2012, 109, 21516–21521. [Google Scholar] [CrossRef]
- Amendola, E.; Zhan, Y.; Mattucci, C.; Castroflorio, E.; Calcagno, E.; Fuchs, C.; Lonetti, G.; Silingardi, D.; Vyssotski, A.L.; Farley, D.; et al. Mapping pathological phenotypes in a mouse model of cdkl5 disorder. PLoS One 2014, 9, e91613. [Google Scholar] [CrossRef]
- Tang, S.; Wang, I.J.; Yue, C.; Takano, H.; Terzic, B.; Pance, K.; Lee, J.Y.; Cui, Y.; Coulter, D.A.; Zhou, Z. Loss of cdkl5 in glutamatergic neurons disrupts hippocampal microcircuitry and leads to memory impairment in mice. J Neurosci 2017, 37, 7420–7437. [Google Scholar] [CrossRef]
- Okuda, K.; Kobayashi, S.; Fukaya, M.; Watanabe, A.; Murakami, T.; Hagiwara, M.; Sato, T.; Ueno, H.; Ogonuki, N.; Komano-Inoue, S.; et al. Cdkl5 controls postsynaptic localization of glun2b-containing nmda receptors in the hippocampus and regulates seizure susceptibility. Neurobiol Dis 2017, 106, 158–170. [Google Scholar] [CrossRef]
- Fuchs, C.; Trazzi, S.; Roberta, T.; Viggiano, R.; De Franceschi, M.; E., A.; Gross, C.T.; Calzà, L.; Bartesaghi, R.; Ciani, E. Loss of cdkl5 impairs survival and dendritic growth of newborn neurons by altering akt/gsk-3beta signaling. Neurobiology of Disease 2014. [Google Scholar] [CrossRef]
- Fuchs, C.; Gennaccaro, L.; Trazzi, S.; Bastianini, S.; Bettini, S.; Martire, V.L.; Ren, E.; Medici, G.; Zoccoli, G.; Rimondini, R.; et al. Heterozygous cdkl5 knockout female mice are a valuable animal model for cdkl5 disorder. Neural Plast 2018, 2018, 9726950. [Google Scholar] [CrossRef]
- Lo Martire, V.; Alvente, S.; Bastianini, S.; Berteotti, C.; Silvani, A.; Valli, A.; Viggiano, R.; Ciani, E.; Zoccoli, G. Cdkl5 deficiency entails sleep apneas in mice. J Sleep Res 2017, 26, 495–497. [Google Scholar] [CrossRef] [PubMed]
- Mazziotti, R.; Lupori, L.; Sagona, G.; Gennaro, M.; Della Sala, G.; Putignano, E.; Pizzorusso, T. Searching for biomarkers of cdkl5 disorder: Early-onset visual impairment in cdkl5 mutant mice. Hum Mol Genet 2017, 26, 2290–2298. [Google Scholar] [CrossRef] [PubMed]
- Mottolese, N.; Coiffard, O.; Ferraguto, C.; Manolis, A.; Ciani, E.; Pietropaolo, S. Autistic-relevant behavioral phenotypes of a mouse model of cyclin-dependent kinase-like 5 deficiency disorder. Autism Res 2024, 17, 1742–1759. [Google Scholar] [CrossRef] [PubMed]
- Della Sala, G.; Putignano, E.; Chelini, G.; Melani, R.; Calcagno, E.; Michele Ratto, G.; Amendola, E.; Gross, C.T.; Giustetto, M.; Pizzorusso, T. Dendritic spine instability in a mouse model of cdkl5 disorder is rescued by insulin-like growth factor 1. Biol Psychiatry 2016, 80, 302–311. [Google Scholar] [CrossRef]
- Pizzo, R.; Gurgone, A.; Castroflorio, E.; Amendola, E.; Gross, C.; Sassoe-Pognetto, M.; Giustetto, M. Lack of cdkl5 disrupts the organization of excitatory and inhibitory synapses and parvalbumin interneurons in the primary visual cortex. Front Cell Neurosci 2016, 10, 261. [Google Scholar] [CrossRef]
- Ren, E.; Roncace, V.; Trazzi, S.; Fuchs, C.; Medici, G.; Gennaccaro, L.; Loi, M.; Galvani, G.; Ye, K.; Rimondini, R.; et al. Functional and structural impairments in the perirhinal cortex of a mouse model of cdkl5 deficiency disorder are rescued by a trkb agonist. Front Cell Neurosci 2019, 13, 169. [Google Scholar] [CrossRef]
- Tassinari, M.; Uguagliati, B.; Trazzi, S.; Cerchier, C.B.; Cavina, O.V.; Mottolese, N.; Loi, M.; Candini, G.; Medici, G.; Ciani, E. Early-onset brain alterations during postnatal development in a mouse model of cdkl5 deficiency disorder. Neurobiol Dis 2023, 182, 106146. [Google Scholar] [CrossRef]
- Trazzi, S.; Fuchs, C.; Viggiano, R.; De Franceschi, M.; Valli, E.; Jedynak, P.; Hansen, F.K.; Perini, G.; Rimondini, R.; Kurz, T.; et al. Hdac4: A key factor underlying brain developmental alterations in cdkl5 disorder. Hum Mol Genet 2016, 25, 3887–3907. [Google Scholar] [CrossRef]
- Fuchs, C.; Rimondini, R.; Viggiano, R.; Trazzi, S.; De Franceschi, M.; Bartesaghi, R.; Ciani, E. Inhibition of gsk3beta rescues hippocampal development and learning in a mouse model of cdkl5 disorder. Neurobiol Dis 2015, 82, 298–310. [Google Scholar] [CrossRef]
- Trazzi, S.; De Franceschi, M.; Fuchs, C.; Bastianini, S.; Viggiano, R.; Lupori, L.; Mazziotti, R.; Medici, G.; Lo Martire, V.; Ren, E.; et al. Cdkl5 protein substitution therapy rescues neurological phenotypes of a mouse model of cdkl5 disorder. Hum Mol Genet 2018, 27, 1572–1592. [Google Scholar] [CrossRef]
- Fuchs, C.; Medici, G.; Trazzi, S.; Gennaccaro, L.; Galvani, G.; Berteotti, C.; Ren, E.; Loi, M.; Ciani, E. Cdkl5 deficiency predisposes neurons to cell death through the deregulation of smad3 signaling. Brain Pathol 2019, 29, 658–674. [Google Scholar] [CrossRef] [PubMed]
- Mottolese, N.; Uguagliati, B.; Tassinari, M.; Cerchier, C.B.; Loi, M.; Candini, G.; Rimondini, R.; Medici, G.; Trazzi, S.; Ciani, E. Voluntary running improves behavioral and structural abnormalities in a mouse model of cdkl5 deficiency disorder. Biomolecules 2023, 13. [Google Scholar] [CrossRef] [PubMed]
- Galvani, G.; Mottolese, N.; Gennaccaro, L.; Loi, M.; Medici, G.; Tassinari, M.; Fuchs, C.; Ciani, E.; Trazzi, S. Inhibition of microglia overactivation restores neuronal survival in a mouse model of cdkl5 deficiency disorder. J Neuroinflammation 2021, 18, 155. [Google Scholar] [CrossRef] [PubMed]
- Tassinari, M.; Mottolese, N.; Galvani, G.; Ferrara, D.; Gennaccaro, L.; Loi, M.; Medici, G.; Candini, G.; Rimondini, R.; Ciani, E.; et al. Luteolin treatment ameliorates brain development and behavioral performance in a mouse model of cdkl5 deficiency disorder. Int J Mol Sci 2022, 23, 8719. [Google Scholar] [CrossRef]
- Terzic, B.; Davatolhagh, M.F.; Ho, Y.; Tang, S.; Liu, Y.T.; Xia, Z.; Cui, Y.; Fuccillo, M.V.; Zhou, Z. Temporal manipulation of cdkl5 reveals essential postdevelopmental functions and reversible cdkl5 deficiency disorder-related deficits. J Clin Invest 2021, 131. [Google Scholar] [CrossRef]
- Wang, H.T.; Zhu, Z.A.; Li, Y.Y.; Lou, S.S.; Yang, G.; Feng, X.; Xu, W.; Huang, Z.L.; Cheng, X.; Xiong, Z.Q. Cdkl5 deficiency in forebrain glutamatergic neurons results in recurrent spontaneous seizures. Epilepsia 2021, 62, 517–528. [Google Scholar] [CrossRef]
- Silvestre, M.; Dempster, K.; Mihaylov, S.R.; Claxton, S.; Ultanir, S.K. Cell type-specific expression, regulation and compensation of cdkl5 activity in mouse brain. Mol Psychiatry 2024, 29, 1844–1856. [Google Scholar] [CrossRef]
- Lupori, L.; Sagona, G.; Fuchs, C.; Mazziotti, R.; Stefanov, A.; Putignano, E.; Napoli, D.; Strettoi, E.; Ciani, E.; Pizzorusso, T. Site-specific abnormalities in the visual system of a mouse model of cdkl5 deficiency disorder. Hum Mol Genet 2019, 28, 2851–2861. [Google Scholar] [CrossRef]
- Zhu, Z.A.; Li, Y.Y.; Xu, J.; Xue, H.; Feng, X.; Zhu, Y.C.; Xiong, Z.Q. Cdkl5 deficiency in adult glutamatergic neurons alters synaptic activity and causes spontaneous seizures via trkb signaling. Cell Rep 2023, 42, 113202. [Google Scholar] [CrossRef]
- Baltussen, L.L.; Negraes, P.D.; Silvestre, M.; Claxton, S.; Moeskops, M.; Christodoulou, E.; Flynn, H.R.; Snijders, A.P.; Muotri, A.R.; Ultanir, S.K. Chemical genetic identification of cdkl5 substrates reveals its role in neuronal microtubule dynamics. EMBO J 2018. [Google Scholar] [CrossRef]
- DeFelipe, J.; Alonso-Nanclares, L.; Arellano, J.I. Microstructure of the neocortex: Comparative aspects. J Neurocytol 2002, 31, 299–316. [Google Scholar] [CrossRef] [PubMed]
- Sukenik, N.; Vinogradov, O.; Weinreb, E.; Segal, M.; Levina, A.; Moses, E. Neuronal circuits overcome imbalance in excitation and inhibition by adjusting connection numbers. Proc Natl Acad Sci U S A 2021, 118. [Google Scholar] [CrossRef] [PubMed]
- Okuda, K.; Takao, K.; Watanabe, A.; Miyakawa, T.; Mizuguchi, M.; Tanaka, T. Comprehensive behavioral analysis of the cdkl5 knockout mice revealed significant enhancement in anxiety- and fear-related behaviors and impairment in both acquisition and long-term retention of spatial reference memory. PLoS One 2018, 13, e0196587. [Google Scholar] [CrossRef] [PubMed]
- Gennaccaro, L.; Fuchs, C.; Loi, M.; Pizzo, R.; Alvente, S.; Berteotti, C.; Lupori, L.; Sagona, G.; Galvani, G.; Gurgone, A.; et al. Age-related cognitive and motor decline in a mouse model of cdkl5 deficiency disorder is associated with increased neuronal senescence and death. Aging and disease 2021. [Google Scholar] [CrossRef]
- La Montanara, P.; Hervera, A.; Baltussen, L.L.; Hutson, T.H.; Palmisano, I.; De Virgiliis, F.; Kong, G.; Chadwick, J.; Gao, Y.; Bartus, K.; et al. Cyclin-dependent-like kinase 5 is required for pain signaling in human sensory neurons and mouse models. Sci Transl Med 2020, 12. [Google Scholar] [CrossRef]
- Wojcik, S.M.; Rhee, J.S.; Herzog, E.; Sigler, A.; Jahn, R.; Takamori, S.; Brose, N.; Rosenmund, C. An essential role for vesicular glutamate transporter 1 (vglut1) in postnatal development and control of quantal size. Proc Natl Acad Sci U S A 2004, 101, 7158–7163. [Google Scholar] [CrossRef]
- Chaudhry, F.A.; Reimer, R.J.; Bellocchio, E.E.; Danbolt, N.C.; Osen, K.K.; Edwards, R.H.; Storm-Mathisen, J. The vesicular gaba transporter, vgat, localizes to synaptic vesicles in sets of glycinergic as well as gabaergic neurons. J Neurosci 1998, 18, 9733–9750. [Google Scholar] [CrossRef]
- Risher, W.C.; Ustunkaya, T.; Singh Alvarado, J.; Eroglu, C. Rapid golgi analysis method for efficient and unbiased classification of dendritic spines. PLoS One 2014, 9, e107591. [Google Scholar] [CrossRef]
- Feng, X.; Zhu, Z.A.; Wang, H.T.; Zhou, H.W.; Liu, J.W.; Shen, Y.; Zhang, Y.X.; Xiong, Z.Q. A novel mouse model unveils protein deficiency in truncated cdkl5 mutations. Neurosci Bull 2025, 41, 805–820. [Google Scholar] [CrossRef]
- Ricciardi, S.; Ungaro, F.; Hambrock, M.; Rademacher, N.; Stefanelli, G.; Brambilla, D.; Sessa, A.; Magagnotti, C.; Bachi, A.; Giarda, E.; et al. Cdkl5 ensures excitatory synapse stability by reinforcing ngl-1-psd95 interaction in the postsynaptic compartment and is impaired in patient ipsc-derived neurons. Nat Cell Biol 2012, 14, 911–923. [Google Scholar] [CrossRef]
- Gennaccaro, L.; Fuchs, C.; Loi, M.; Roncace, V.; Trazzi, S.; Ait-Bali, Y.; Galvani, G.; Berardi, A.C.; Medici, G.; Tassinari, M.; et al. A gaba(b) receptor antagonist rescues functional and structural impairments in the perirhinal cortex of a mouse model of cdkl5 deficiency disorder. Neurobiol Dis 2021, 153, 105304. [Google Scholar] [CrossRef] [PubMed]
- Hao, S.; Wang, Q.; Tang, B.; Wu, Z.; Yang, T.; Tang, J. Cdkl5 deficiency augments inhibitory input into the dentate gyrus that can be reversed by deep brain stimulation. J Neurosci 2021, 41, 9031–9046. [Google Scholar] [CrossRef] [PubMed]
- Jhang, C.L.; Huang, T.N.; Hsueh, Y.P.; Liao, W. Mice lacking cyclin-dependent kinase-like 5 manifest autistic and adhd-like behaviors. Hum Mol Genet 2017, 26, 3922–3934. [Google Scholar] [CrossRef] [PubMed]
- Wang, Y.; Wei, P.; Yan, F.; Luo, Y.; Zhao, G. Animal models of epilepsy: A phenotype-oriented review. Aging Dis 2022, 13, 215–231. [Google Scholar] [CrossRef]
- Erdmann, G.; Schutz, G.; Berger, S. Inducible gene inactivation in neurons of the adult mouse forebrain. BMC Neurosci 2007, 8, 63. [Google Scholar] [CrossRef]
- Guidi, S.; Stagni, F.; Bianchi, P.; Ciani, E.; Ragazzi, E.; Trazzi, S.; Grossi, G.; Mangano, C.; Calza, L.; Bartesaghi, R. Early pharmacotherapy with fluoxetine rescues dendritic pathology in the ts65dn mouse model of down syndrome. Brain Pathol 2013, 23, 129–143. [Google Scholar] [CrossRef]
- Medici, G.; Tassinari, M.; Galvani, G.; Bastianini, S.; Gennaccaro, L.; Loi, M.; Mottolese, N.; Alvente, S.; Berteotti, C.; Sagona, G.; et al. Expression of a secretable, cell-penetrating cdkl5 protein enhances the efficacy of gene therapy for cdkl5 deficiency disorder. Neurotherapeutics 2022, 19, 1886–1904. [Google Scholar] [CrossRef]
- Bradford, M.M. A rapid and sensitive method for the quantitation of microgram quantities of protein utilizing the principle of protein-dye binding. Anal Biochem 1976, 72, 248–254. [Google Scholar] [CrossRef]
Figure 1.
Postnatal Cdkl5 deletion in forebrain glutamatergic neurons of Cdkl5flox/Y(Cre⁺) mice. (A) Schematic representation of the experimental design. Three-month-old conditional knockout (cKO) hemizygous male Cdkl5flox/Y(Cre⁺) mice received intraperitoneal (i.p.) injections of tamoxifen (100 mg/kg) for five consecutive days to activate Cre recombinase and induce Cdkl5 gene deletion. Cdkl5flox/Y(Cre⁻) littermates were used as controls. Animals were divided into three groups and sacrificed at different time points (4, 6, and 20 weeks after the start of tamoxifen treatment). (B) Western blot analysis of Cdkl5 protein expression in tamoxifen-treated mice. Protein extracts from the somatosensory cortex (Ctx), hippocampus (Hp), and cerebellum (Cb) were analyzed in Cdkl5flox/Y(Cre⁻) (n = 3) and Cdkl5flox/Y(Cre⁺) (n = 3) mice. The histogram on the right shows Cdkl5 levels normalized to GAPDH and expressed as a percentage relative to controls. Representative immunoblots for Cdkl5 and GAPDH from two animals per group are shown on the left. (C) Western blot analysis of phosphorylated EB2 (phospho-EB2) and total EB2. Protein extracts from the cortex (Ctx), hippocampus (Hp), and cerebellum (Cb) were analyzed as in panel (B). The histogram on the right shows phospho-EB2 levels normalized to total EB2 and expressed relative to controls. Representative immunoblots from two animals per group are shown on the left. Values in panels (B,C) are presented as means ± SEM. *p < 0.05, ***p < 0.001 (two-tailed Student’s t-test). (D) Representative fluorescence images of cortical and hippocampal sections from one animal per group processed by in situ hybridization (ISH) for Cdkl5 mRNA (red). Scale bar = 50 µm. (E) Body weight (in grams) of Cdkl5flox/Y(Cre⁻) (n = 15-18) and Cdkl5flox/Y(Cre⁺) (n = 23-26) mice measured weekly over a five-week period following tamoxifen treatment, and of an additional cohort of Cdkl5flox/Y(Cre⁻) (n = 15) and Cdkl5flox/Y(Cre⁺) (n = 10) mice assessed 12 weeks after tamoxifen administration. Data are shown as mean ± SEM. *p < 0.05, Fisher’s LSD post hoc test following two-way ANOVA. Abbreviations: Ctx = somatosensory cortex; Hp = hippocampus; Cb = cerebellum; CA1 = hippocampal CA1 region.
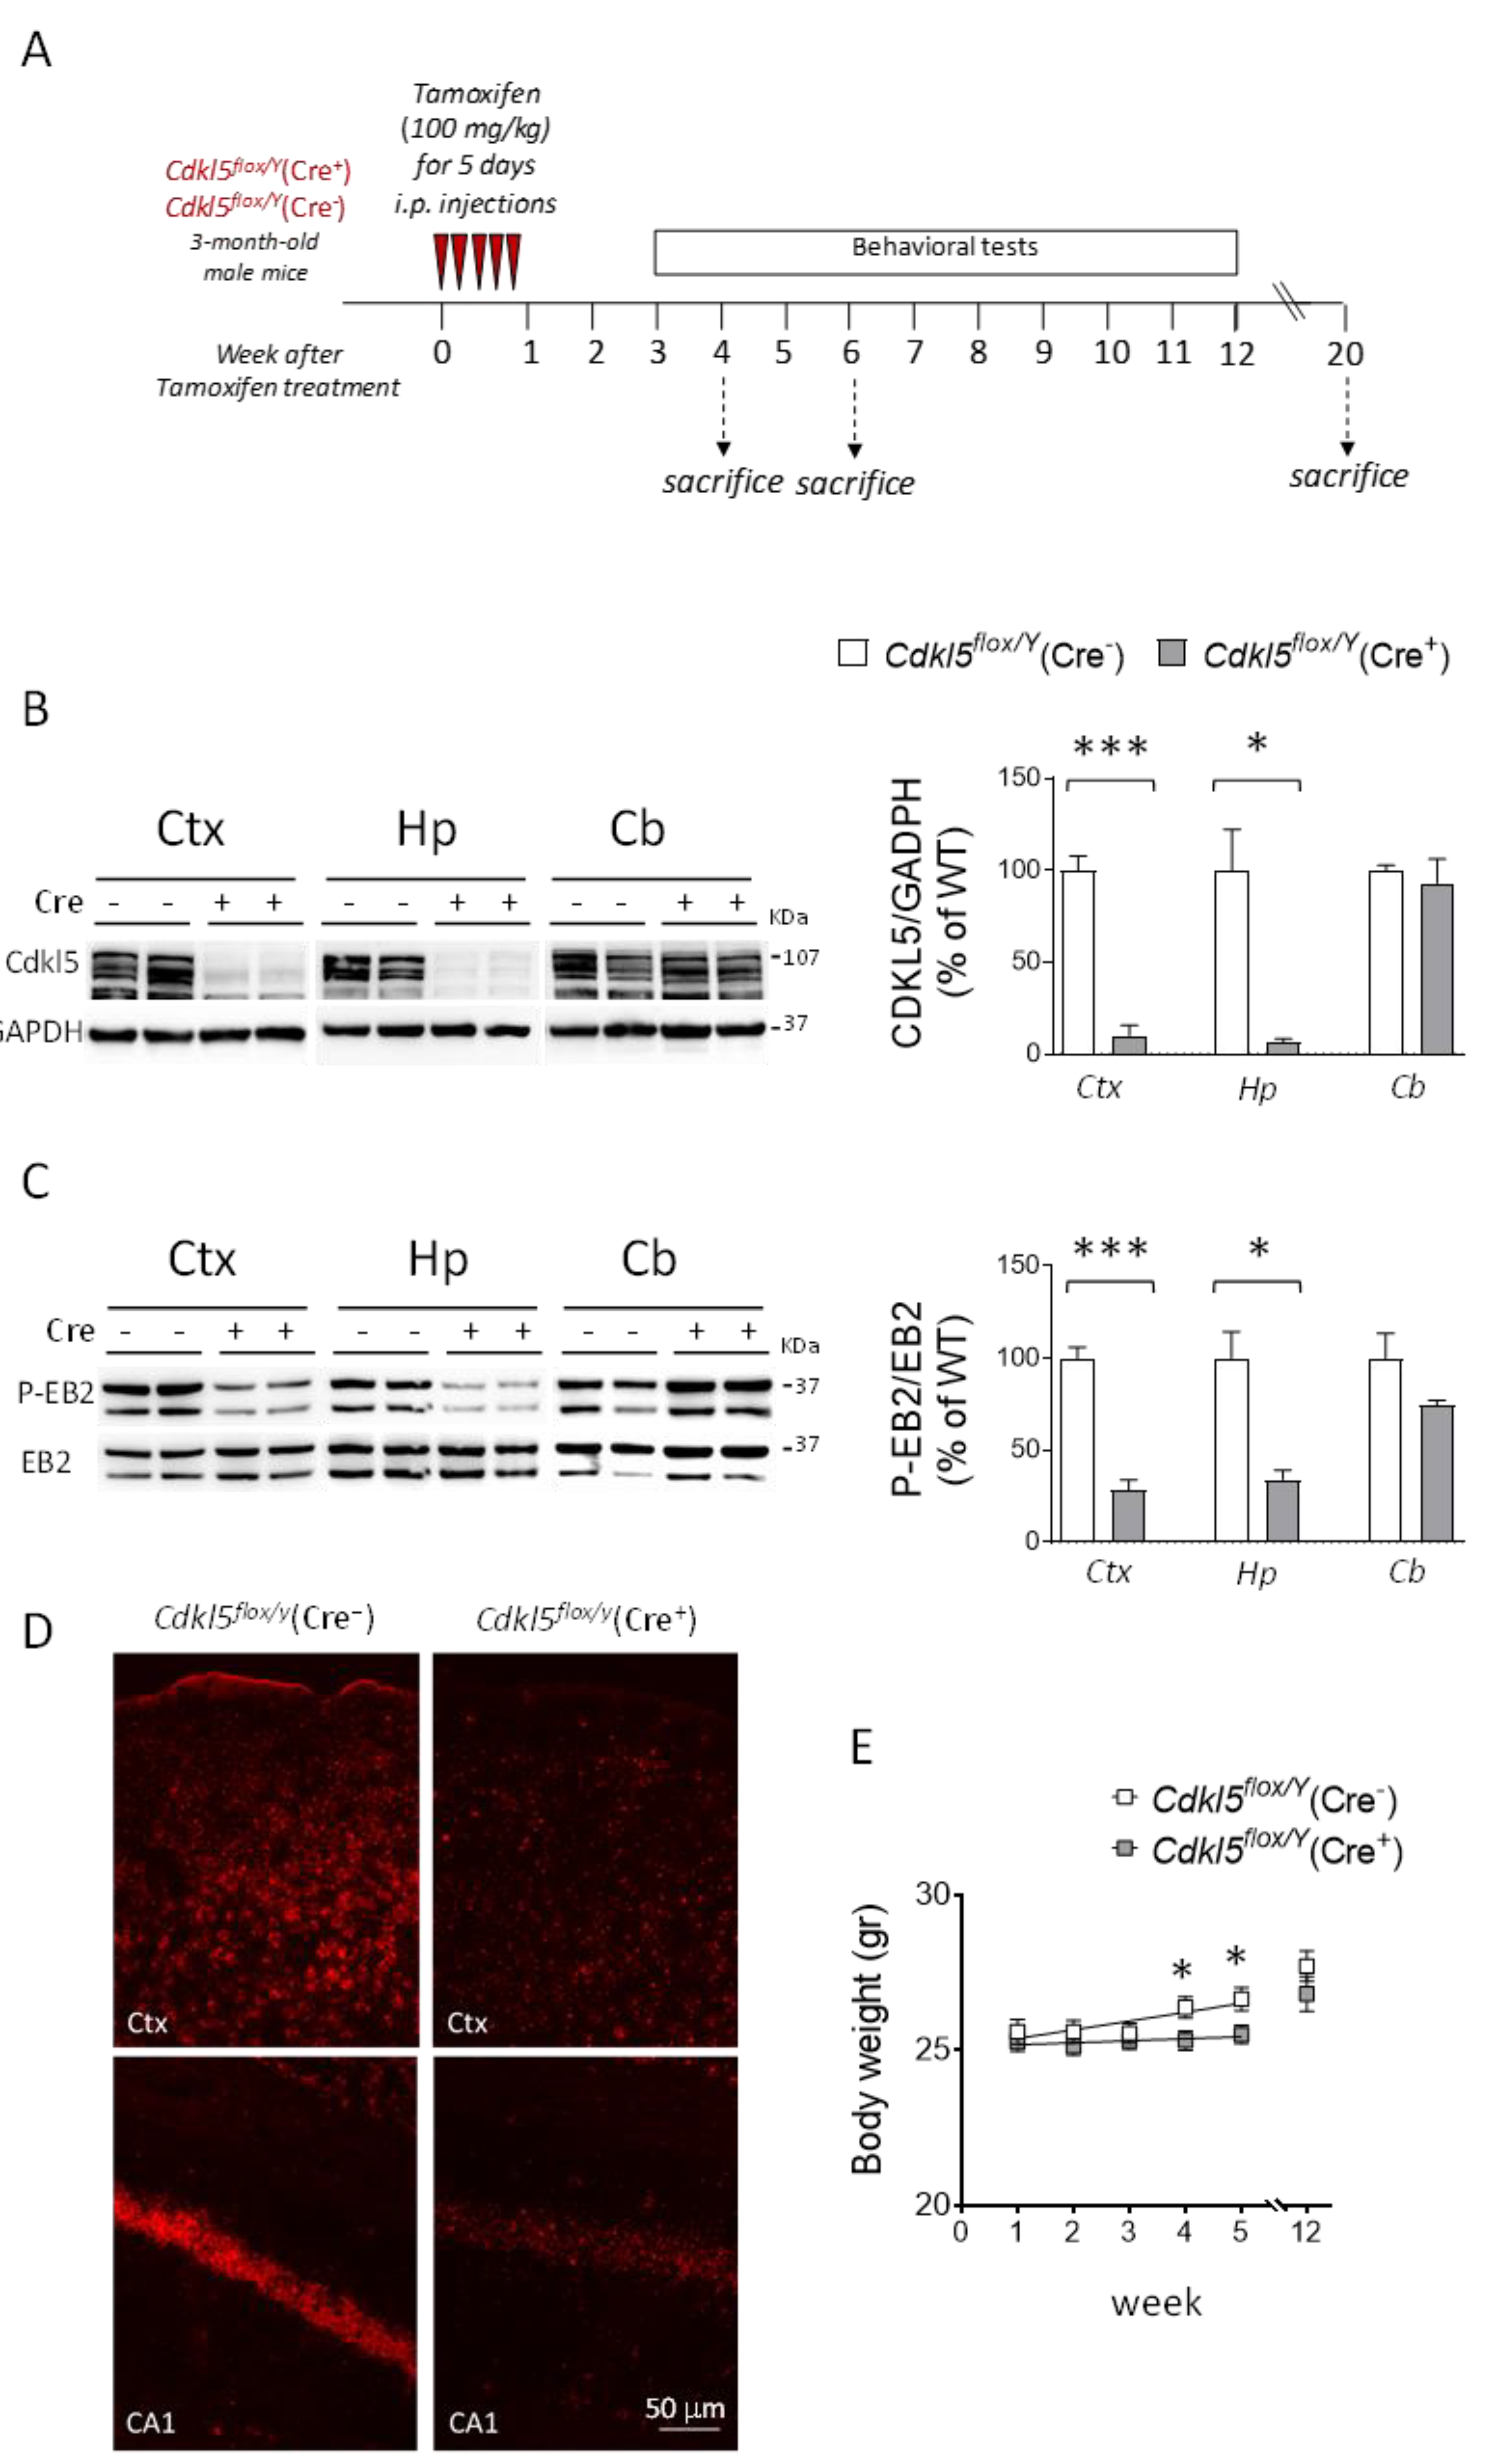
Figure 2.
Effect of postnatal Cdkl5 deletion in forebrain glutamatergic neurons on motor control and autistic-like behaviors in Cdkl5flox/Y(Cre⁺) mice. (A) Accelerating rotarod test performed over four consecutive trials with 1-hour inter-trial intervals. The graph on the left shows the number of passive rotations per trial (i.e., instances in which the mouse remains immobile and is passively carried by the rotating rod). The graph on the right reports the average number of passive rotations across trials in tamoxifen-treated Cdkl5flox/Y(Cre⁻) (n = 17) and Cdkl5flox/Y(Cre⁺) (n = 26) mice. (B) Assessment of repetitive and stereotyped behaviors using the marble-burying test. The number of marbles buried by Cdkl5flox/Y(Cre⁻) (n = 18) and Cdkl5flox/Y (Cre⁺) (n = 26) mice is shown. (C) Hind-limb clasping behavior: total duration of clasping behavior over a 2-minute observation period (left) and percentage of mice displaying clasping (right) in tamoxifen-treated Cdkl5flox/Y(Cre⁻) (n = 16) and Cdkl5flox/Y(Cre⁺) (n = 24) mice. (D) Locomotor activity assessed in a 20-minute open field test. The graphs show average locomotion velocity (left) and total distance traveled (right) in tamoxifen-treated Cdkl5flox/Y(Cre⁻) (n = 8) and Cdkl5flox/Y(Cre⁺) (n = 20) mice. (E) Anxiety-like behavior in the open field test: time spent in the border (left) and center (right) zones of the arena during the same 20-minute session as in panel (D). Data are presented as mean ± SEM. *p < 0.05, **p < 0.01. Unpaired two-tailed Student’s t-test for data in (E); Mann-Whitney test for data in (A right graph, B, and C); Fisher’s LSD post hoc test following two-way ANOVA for (A left graph and D).
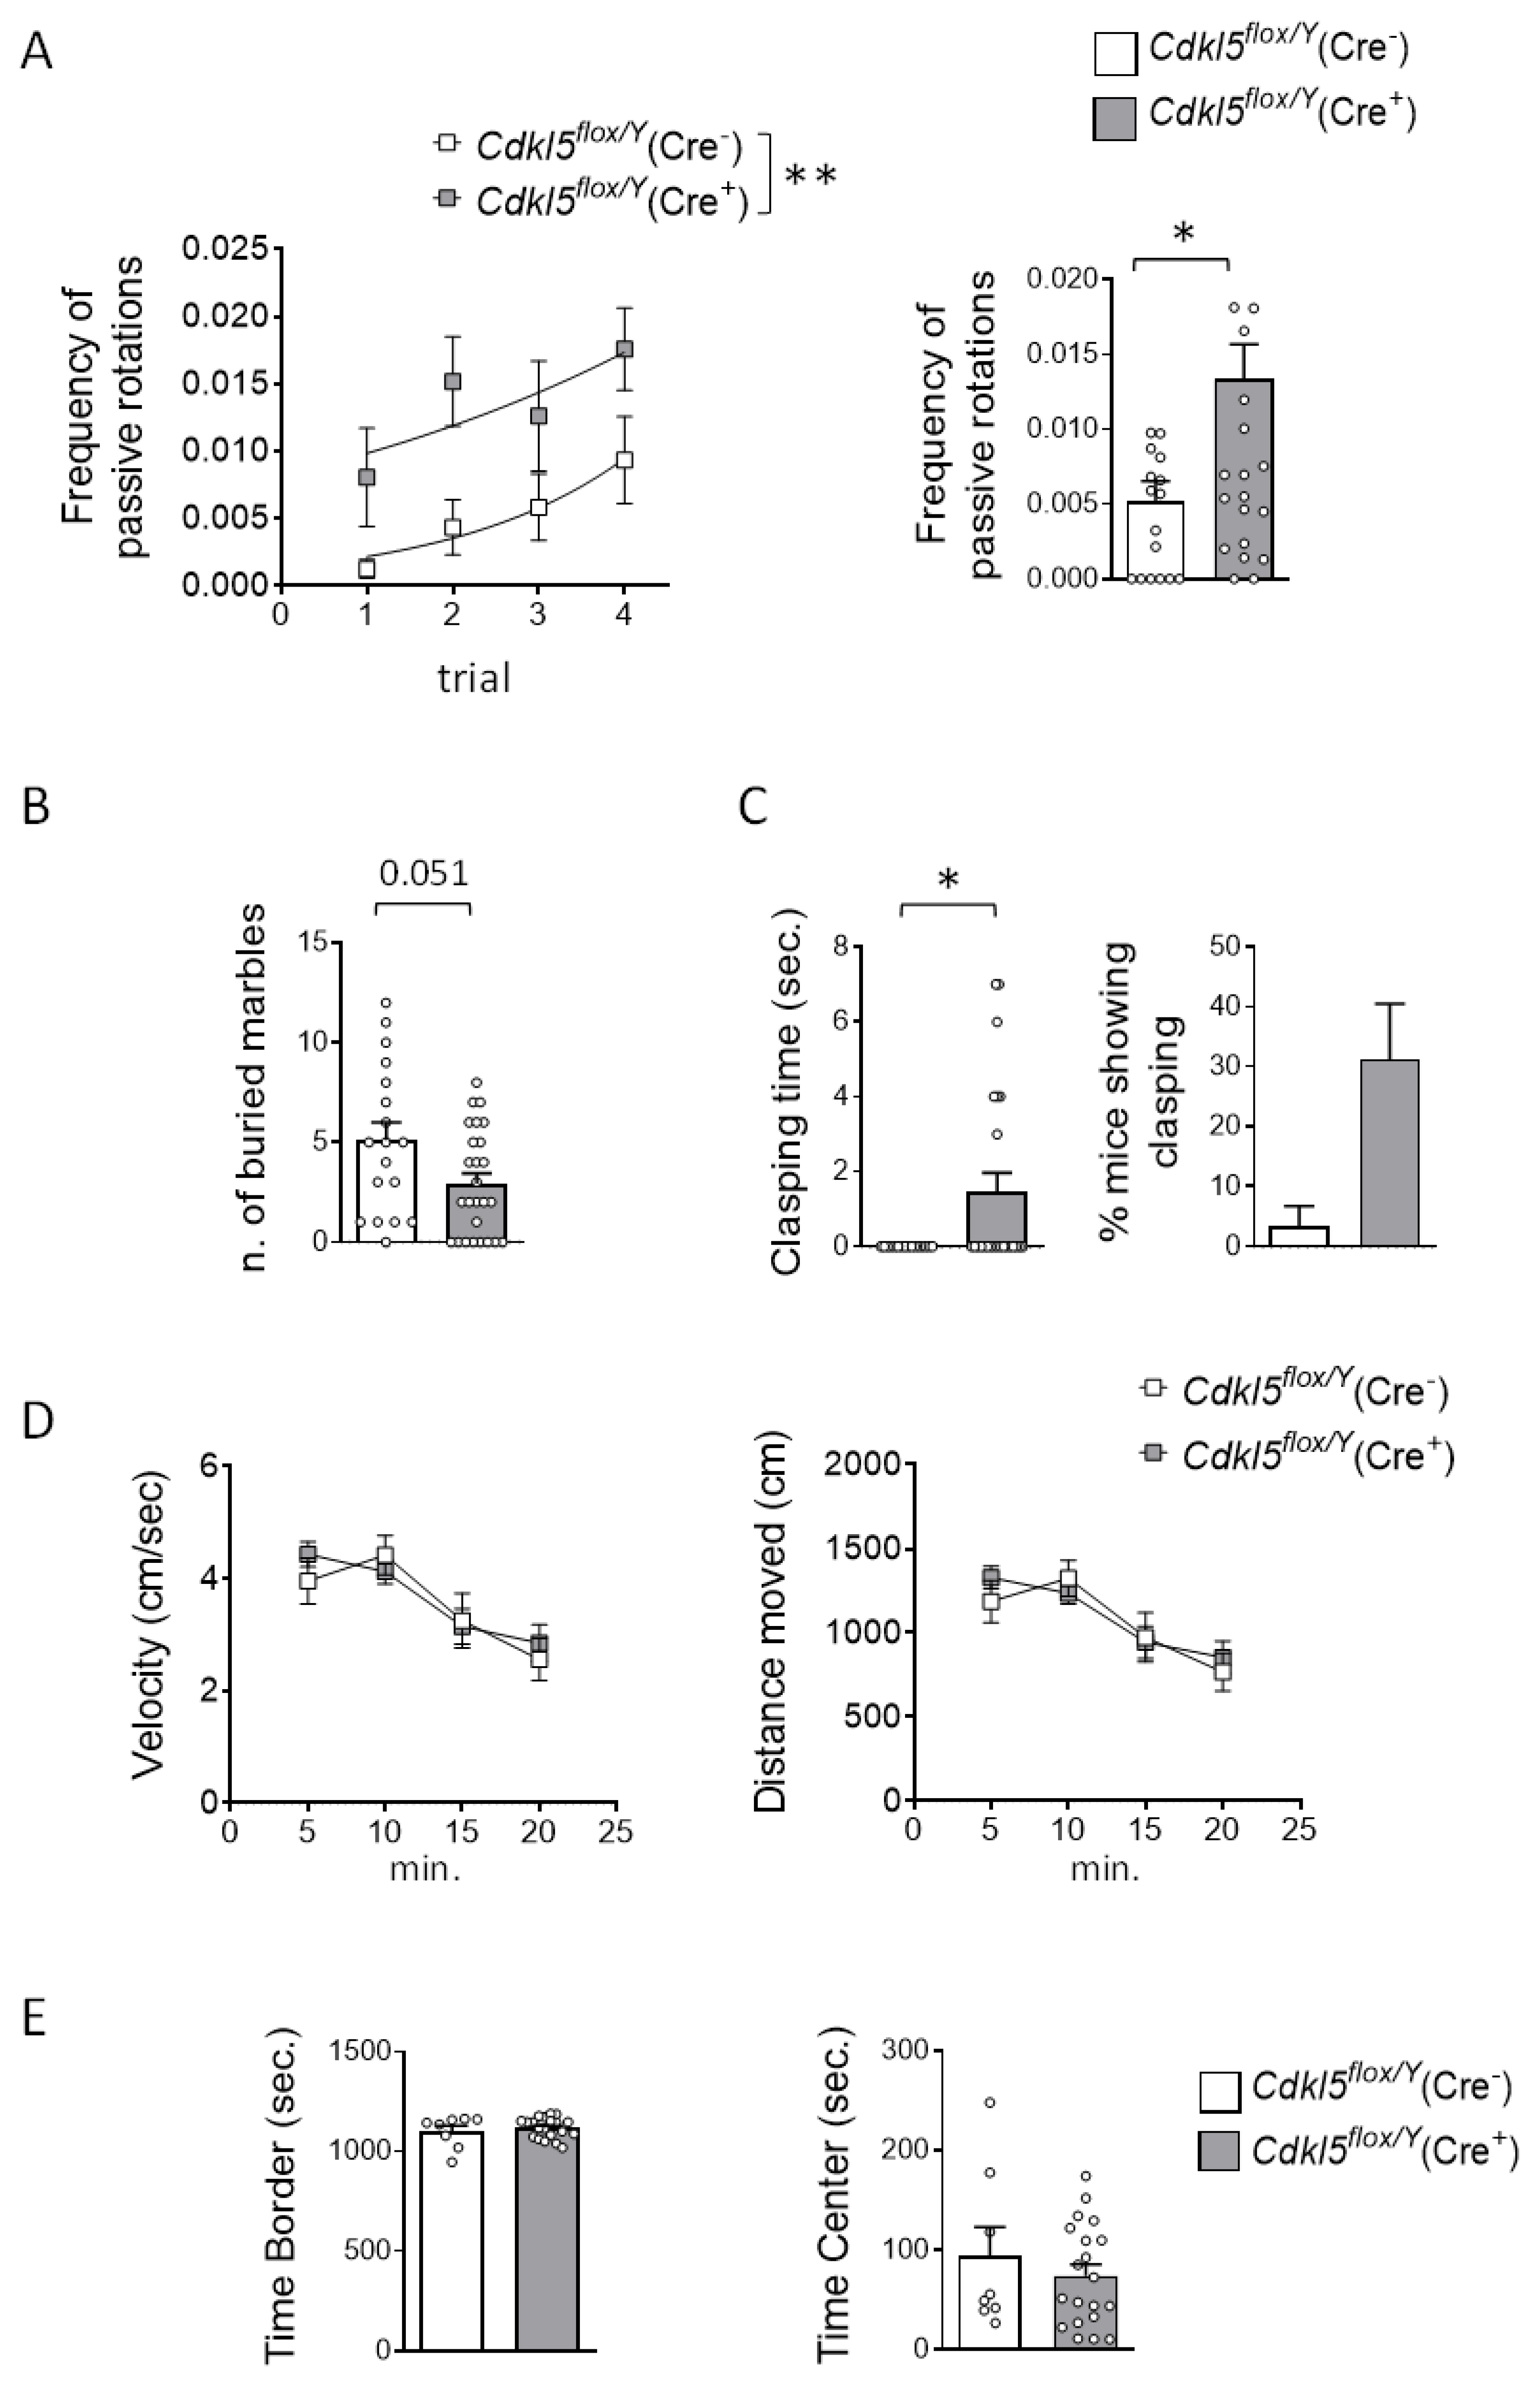
Figure 3.
Effects of postnatal Cdkl5 deletion in forebrain glutamatergic neurons on sociability and hippocampal-dependent memory in Cdkl5flox/Y(Cre+) mice. (A,B) Three-Chamber Social Interaction Test. Panel (A) illustrates the schematic of the experimental paradigm. Panel (B) quantifies the cumulative time spent interacting with either an inanimate object or a social partner during the second trial (sociability phase). The test was conducted on the same cohort of tamoxifen-treated Cdkl5flox/Y(Cre−) (n = 10) and Cdkl5flox/Y(Cre+) (n = 10) mice. The asterisk denotes within-subject comparison. Data are presented as mean ± SEM. *p < 0.05, Fisher’s LSD post hoc test following two-way ANOVA. (C-E) Barnes Maze – Spatial Learning and Memory. Spatial learning performance during the 3-day acquisition phase is shown in Panel (C) as the mean latency to find the target hole. Panel (D) presents representative heat maps from the probe trial (day 4), with warmer colors indicating longer dwell times. Panel (E) displays quantitative results from the probe trial, including (left) latency to enter the target zone, (middle) number of errors (incorrect hole entries), and (right) cumulative time spent in the target zone. (F) Passive Avoidance Test. Graph depicts the latency to enter the dark compartment on day 1 (training) and day 2 (retention) for tamoxifen-treated Cdkl5flox/Y(Cre−) and Cdkl5flox/Y(Cre+) mice (n = 10 and 9 per group, respectively). Data are presented as mean ± SEM. *p < 0.05, **p < 0.01. Fisher’s LSD post hoc test following two-way ANOVA (C); unpaired two-tailed Student’s t-test (B within groups, E right graph, and F); Welch’s t-test (E left graph); Mann-Whitney test (E middle graph).
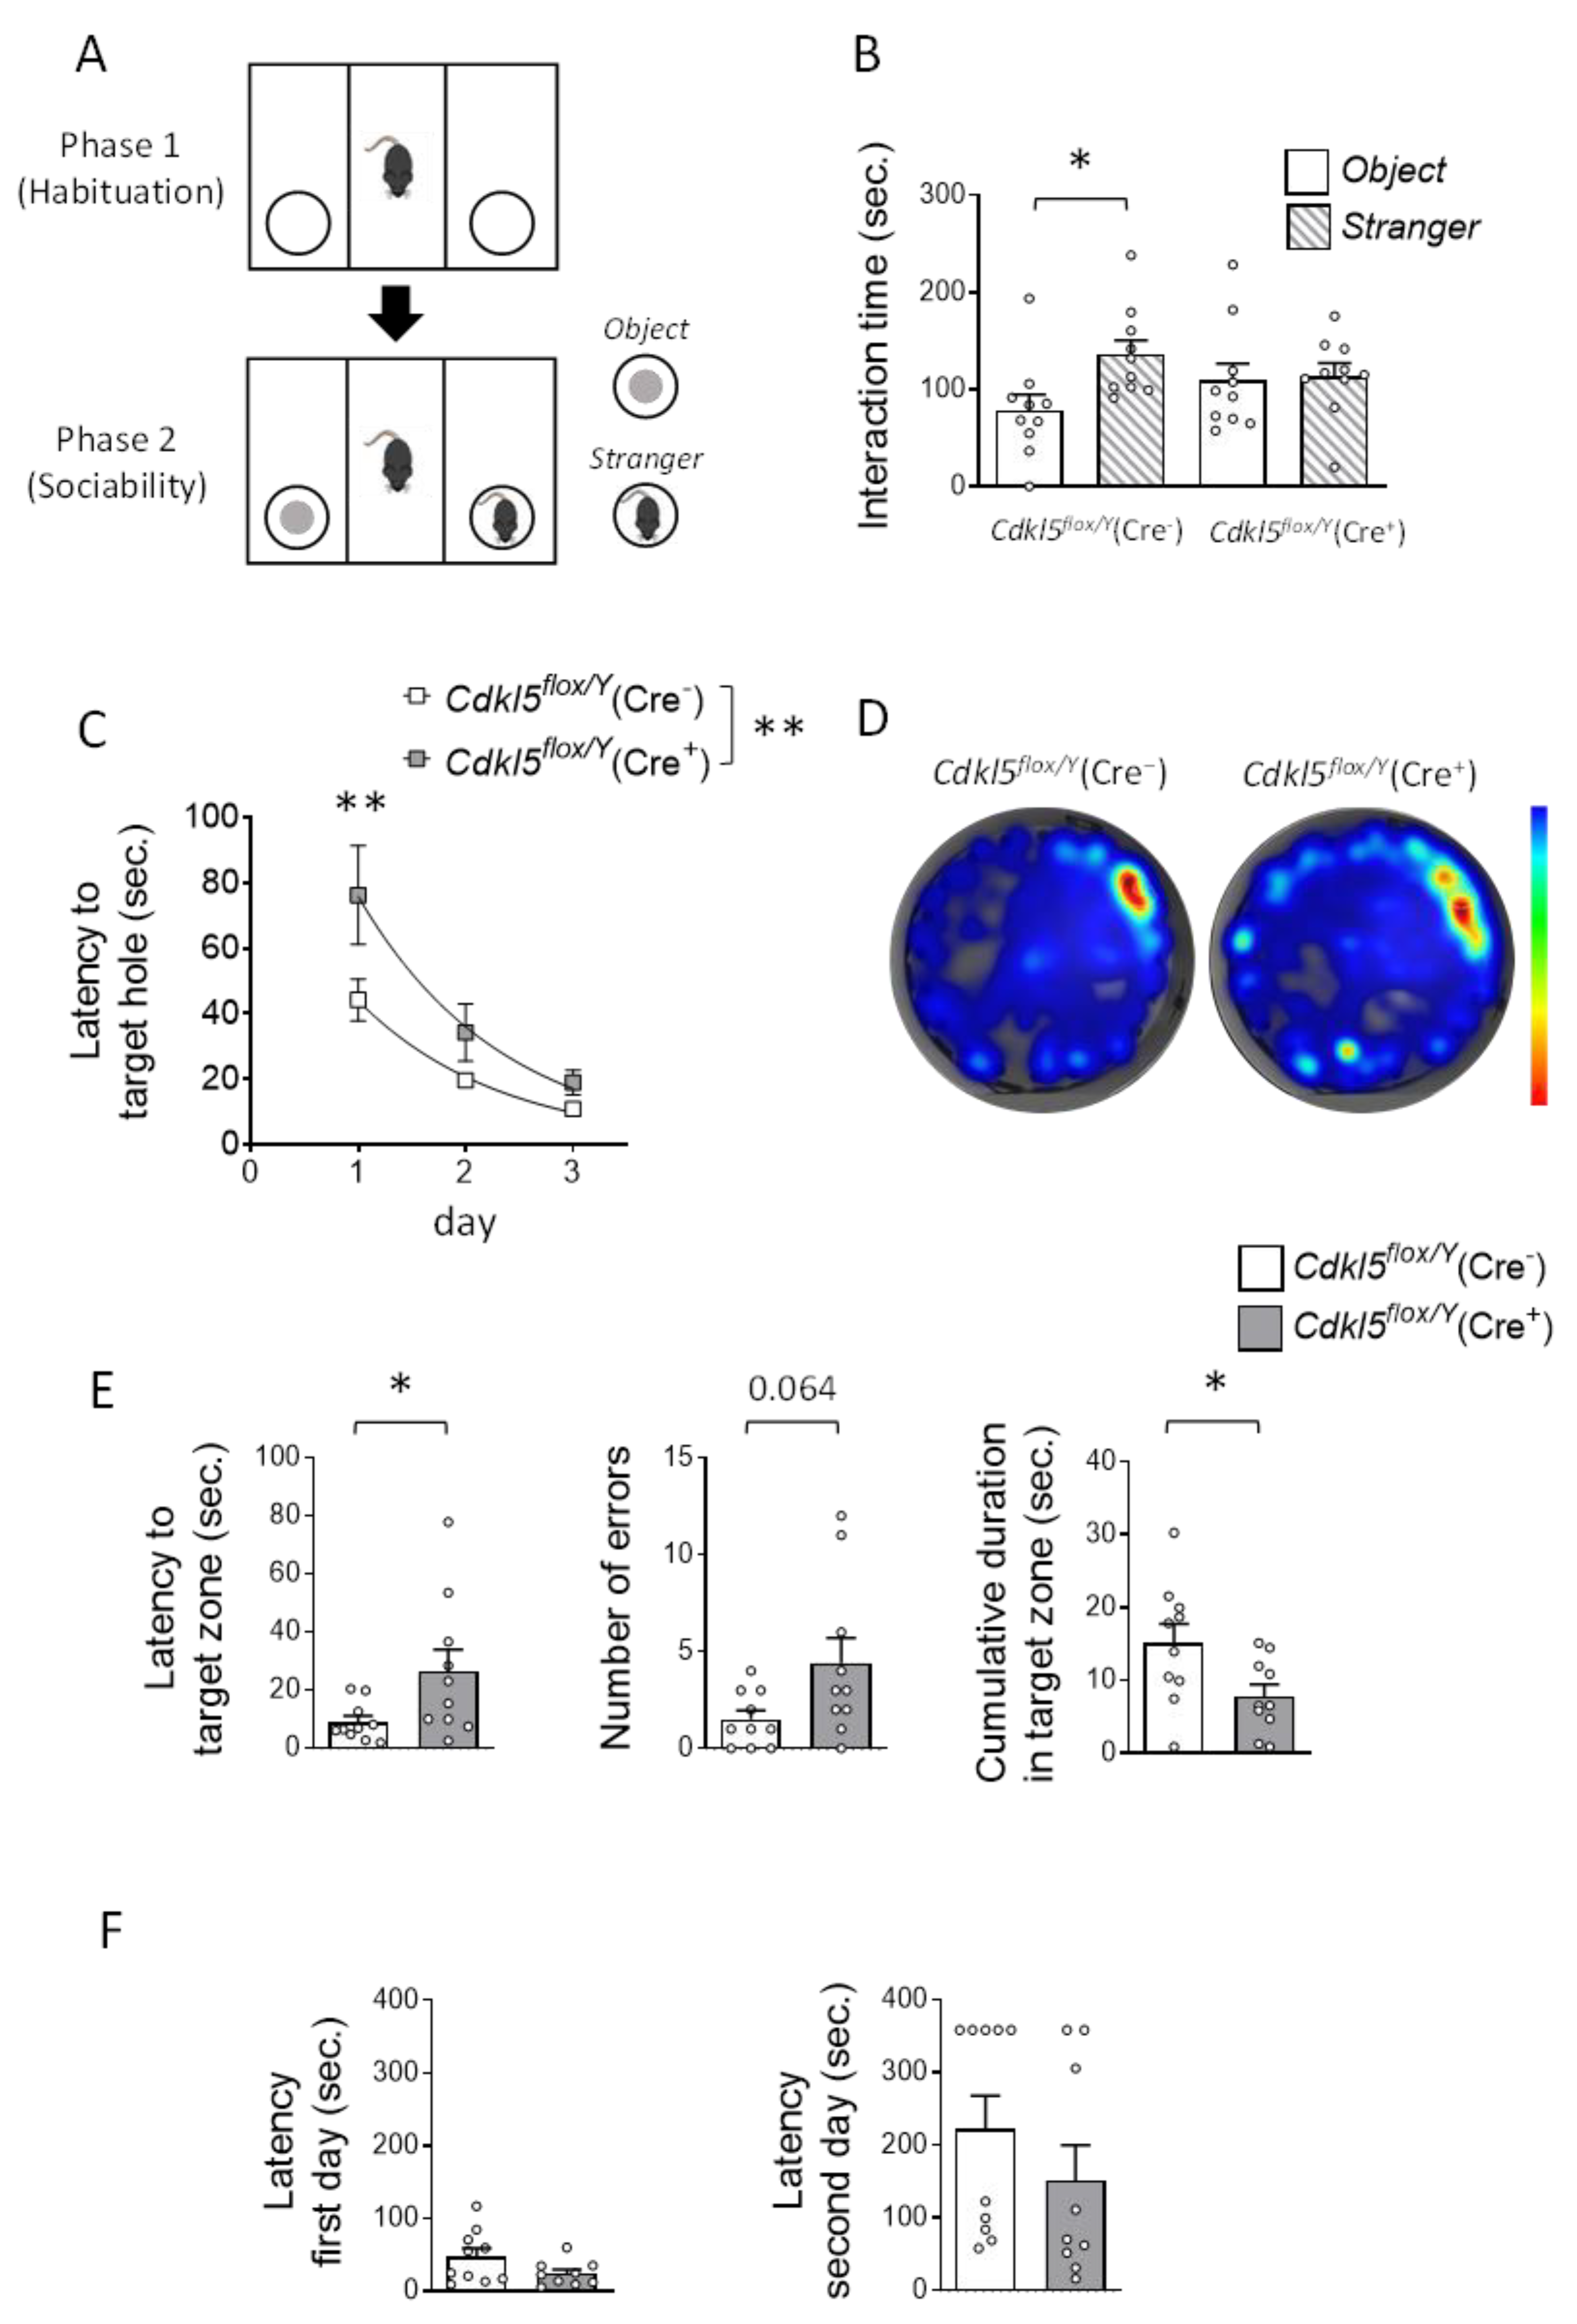
Figure 4.
Effects of postnatal Cdkl5 deletion in forebrain glutamatergic neurons on olfactory and pain perception in Cdkl5flox/Y(Cre+) mice. (A) Olfactory function was assessed using the buried food test. The histogram shows the latency to locate the buried raisin in tamoxifen-treated Cdkl5flox/Y(Cre−) (n = 10) and Cdkl5flox/Y(Cre+) (n = 10) mice. (B) Pain sensitivity was evaluated using the Von Frey filament test in the same animals. Mechanical allodynia was quantified by measuring the force (in grams) required to elicit paw withdrawal (left) and the latency of hind paw withdrawal following stimulation (right). Data are presented as mean ± SEM. Statistical analysis: unpaired two-tailed Student’s t-test.
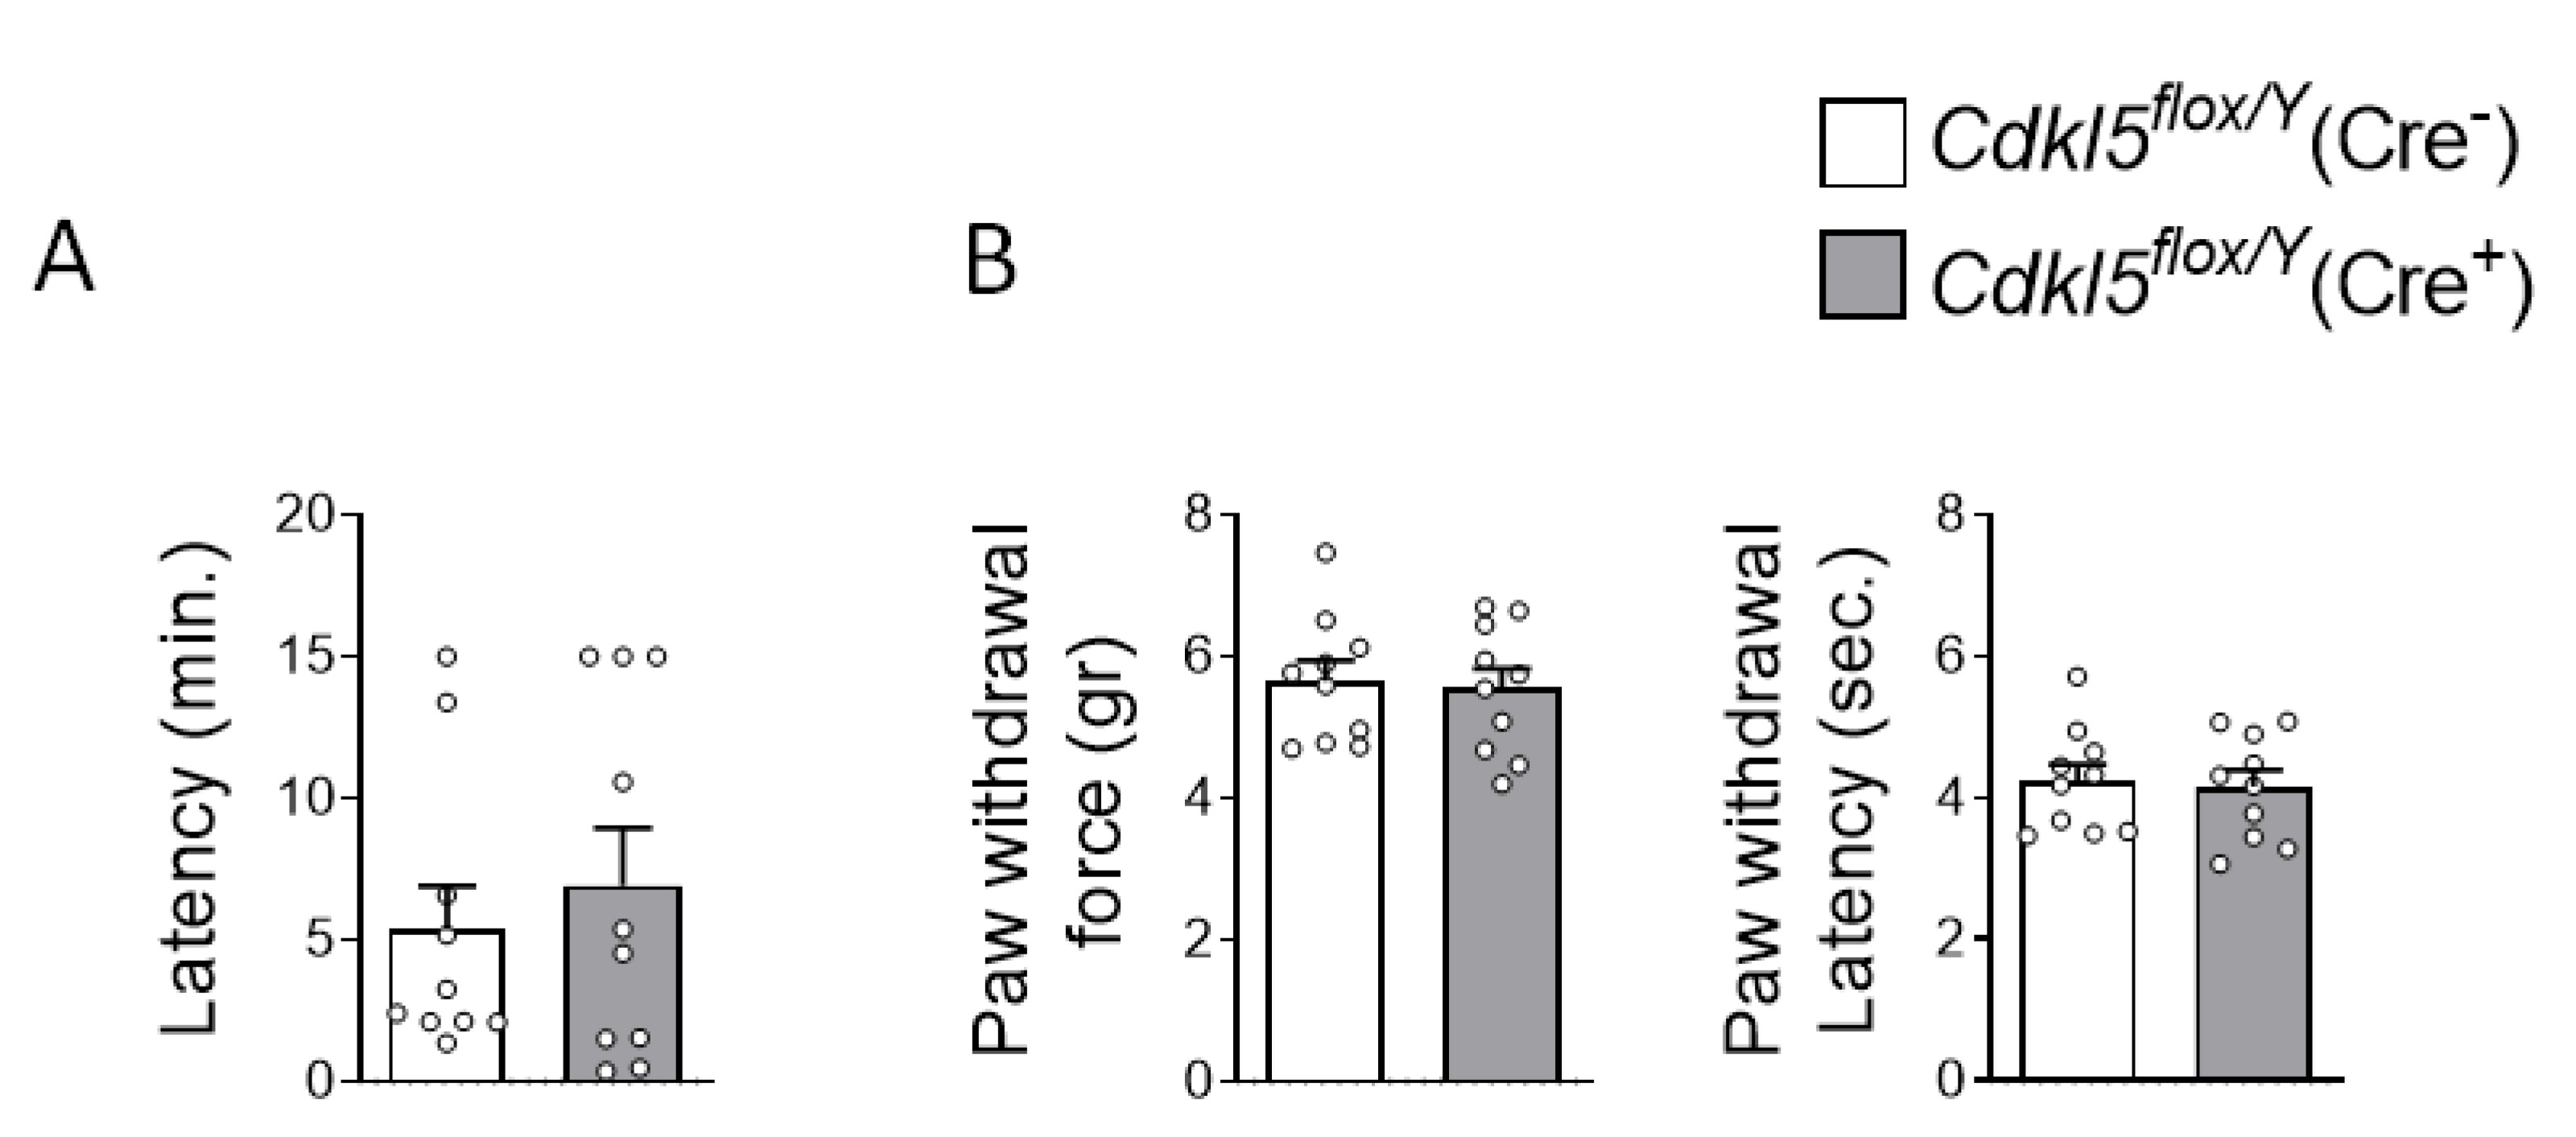
Figure 5.
Effects of postnatal Cdkl5 deletion in forebrain glutamatergic neurons on neuronal connectivity and dendritic spine maturation in Cdkl5flox/Y(Cre+) mice. (A,B) Quantification of fluorescent puncta per μm² positive for vesicular glutamate transporter 1 (VGLUT1, A) and vesicular GABA transporter (VGAT, B) in the somatosensory cortex (Ctx) and hippocampus (Hp) of Cdkl5flox/Y(Cre−) (n = 4) and Cdkl5flox/Y(Cre+) (n = 4) mice, six weeks after tamoxifen treatment. (C) Representative confocal images showing VGLUT1 (top) and VGAT (bottom) immunostaining in cortical sections from one mouse per group. Scale bar = 3 μm. (D,E) Dendritic spine analysis in CA1 pyramidal neurons of the hippocampus of Cdkl5flox/Y(Cre−) (n = 3) and Cdkl5flox/Y(Cre+) (n = 4) mice, twenty weeks after tamoxifen treatment. Panel (D) shows spine density in basal dendrites; panel (E) shows the proportion of immature and mature spine types relative to the total number of protrusions. (F) Representative Golgi-stained dendrites from one mouse per group. Blue arrows indicate mature spines; red arrows indicate immature spines. Scale bar = 3 μm. Data are expressed as mean ± SEM. *p < 0.05, **p < 0.01, ***p < 0.001. Fisher’s LSD post hoc test following two-way ANOVA (A, B, and E); two-tailed Student’s t-test (D).
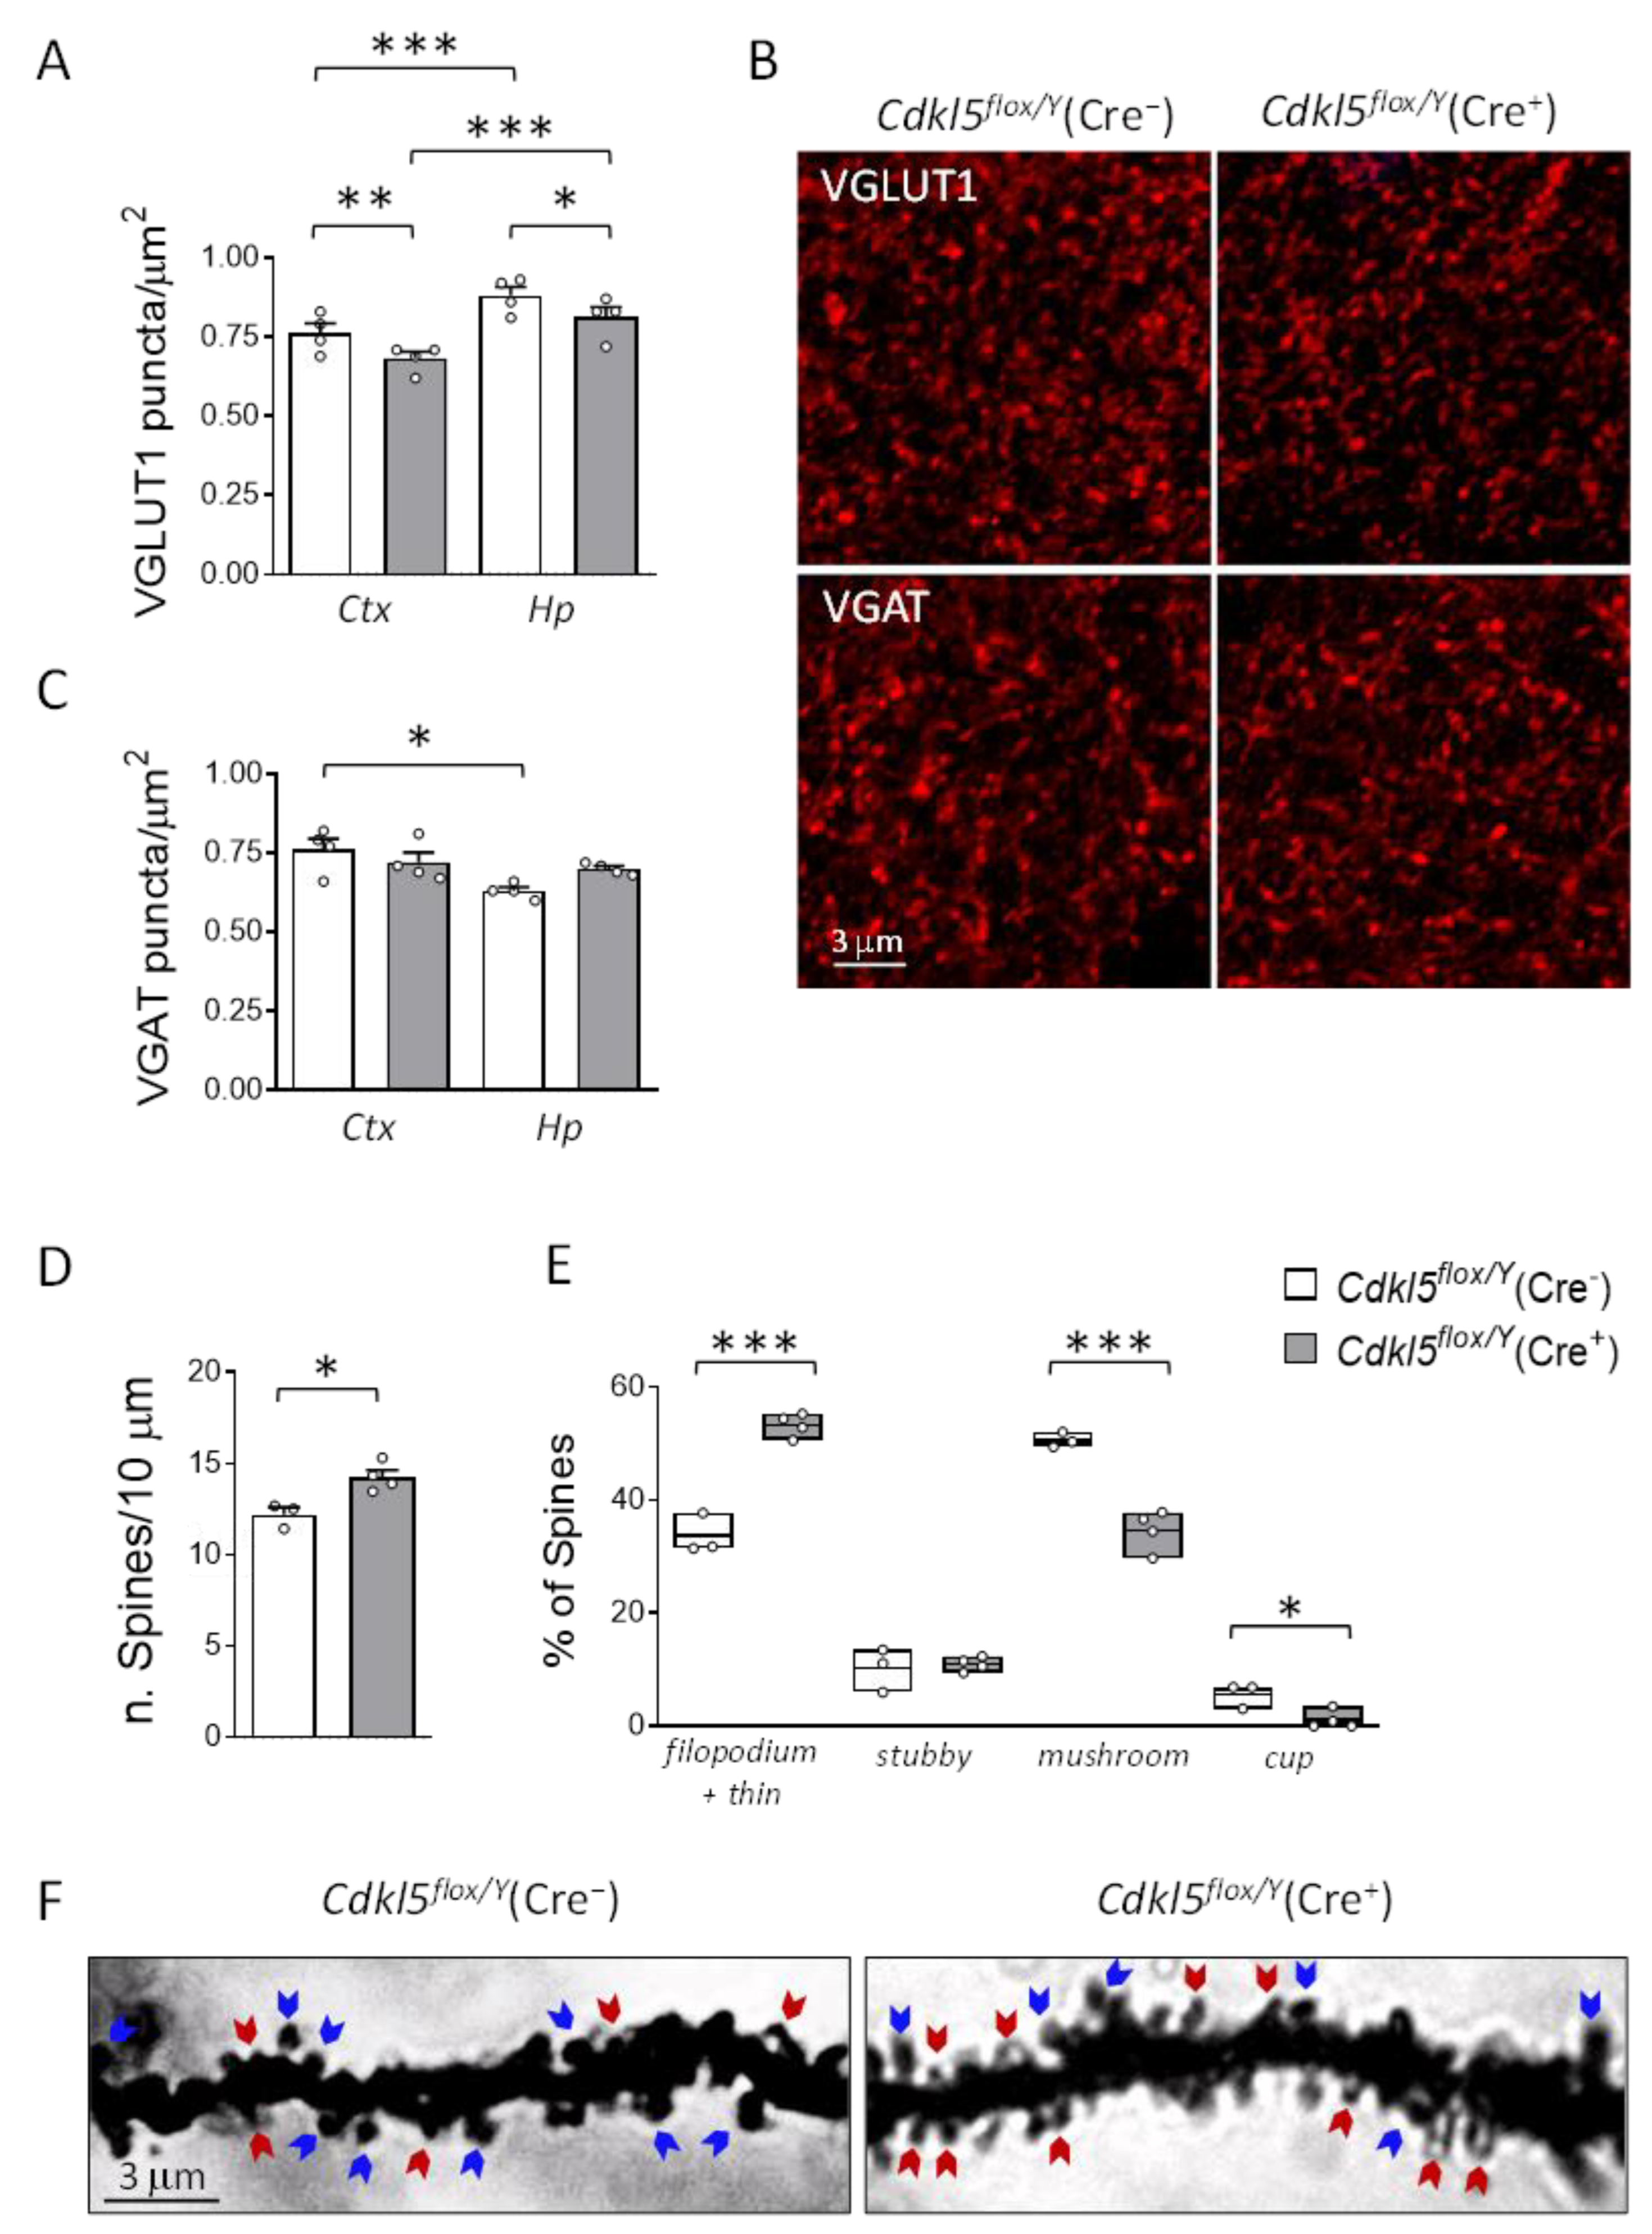
Figure 6.
Effects of postnatal Cdkl5 deletion in forebrain glutamatergic neurons on microglial density and neuronal survival in Cdkl5flox/Y(Cre+) mice. (A,B) Quantification of AIF-1-positive cells in the somatosensory cortex (A) and hippocampus (B) of Cdkl5flox/Y(Cre−) and Cdkl5flox/Y(Cre+) mice (n = 4 per group), at six (6w) and twenty weeks (20w) after tamoxifen treatment. (C) Representative fluorescence images of AIF-1 immunostaining in cortical sections from one mouse per group at six weeks post-treatment. Scale bar = 50 μm. Cortical layers I-IV are indicated. (D) Quantification of DAPI-positive cells in the CA1 region of the hippocampus, from the same animals analyzed in panel (B). (E) Representative DAPI-stained hippocampal sections from one mouse per group, six weeks post-treatment. Scale bar = 40 μm. Data are shown as mean ± SEM. *p < 0.05, **p < 0.01. Fisher’s LSD post hoc test following two-way ANOVA (A, B, and D).
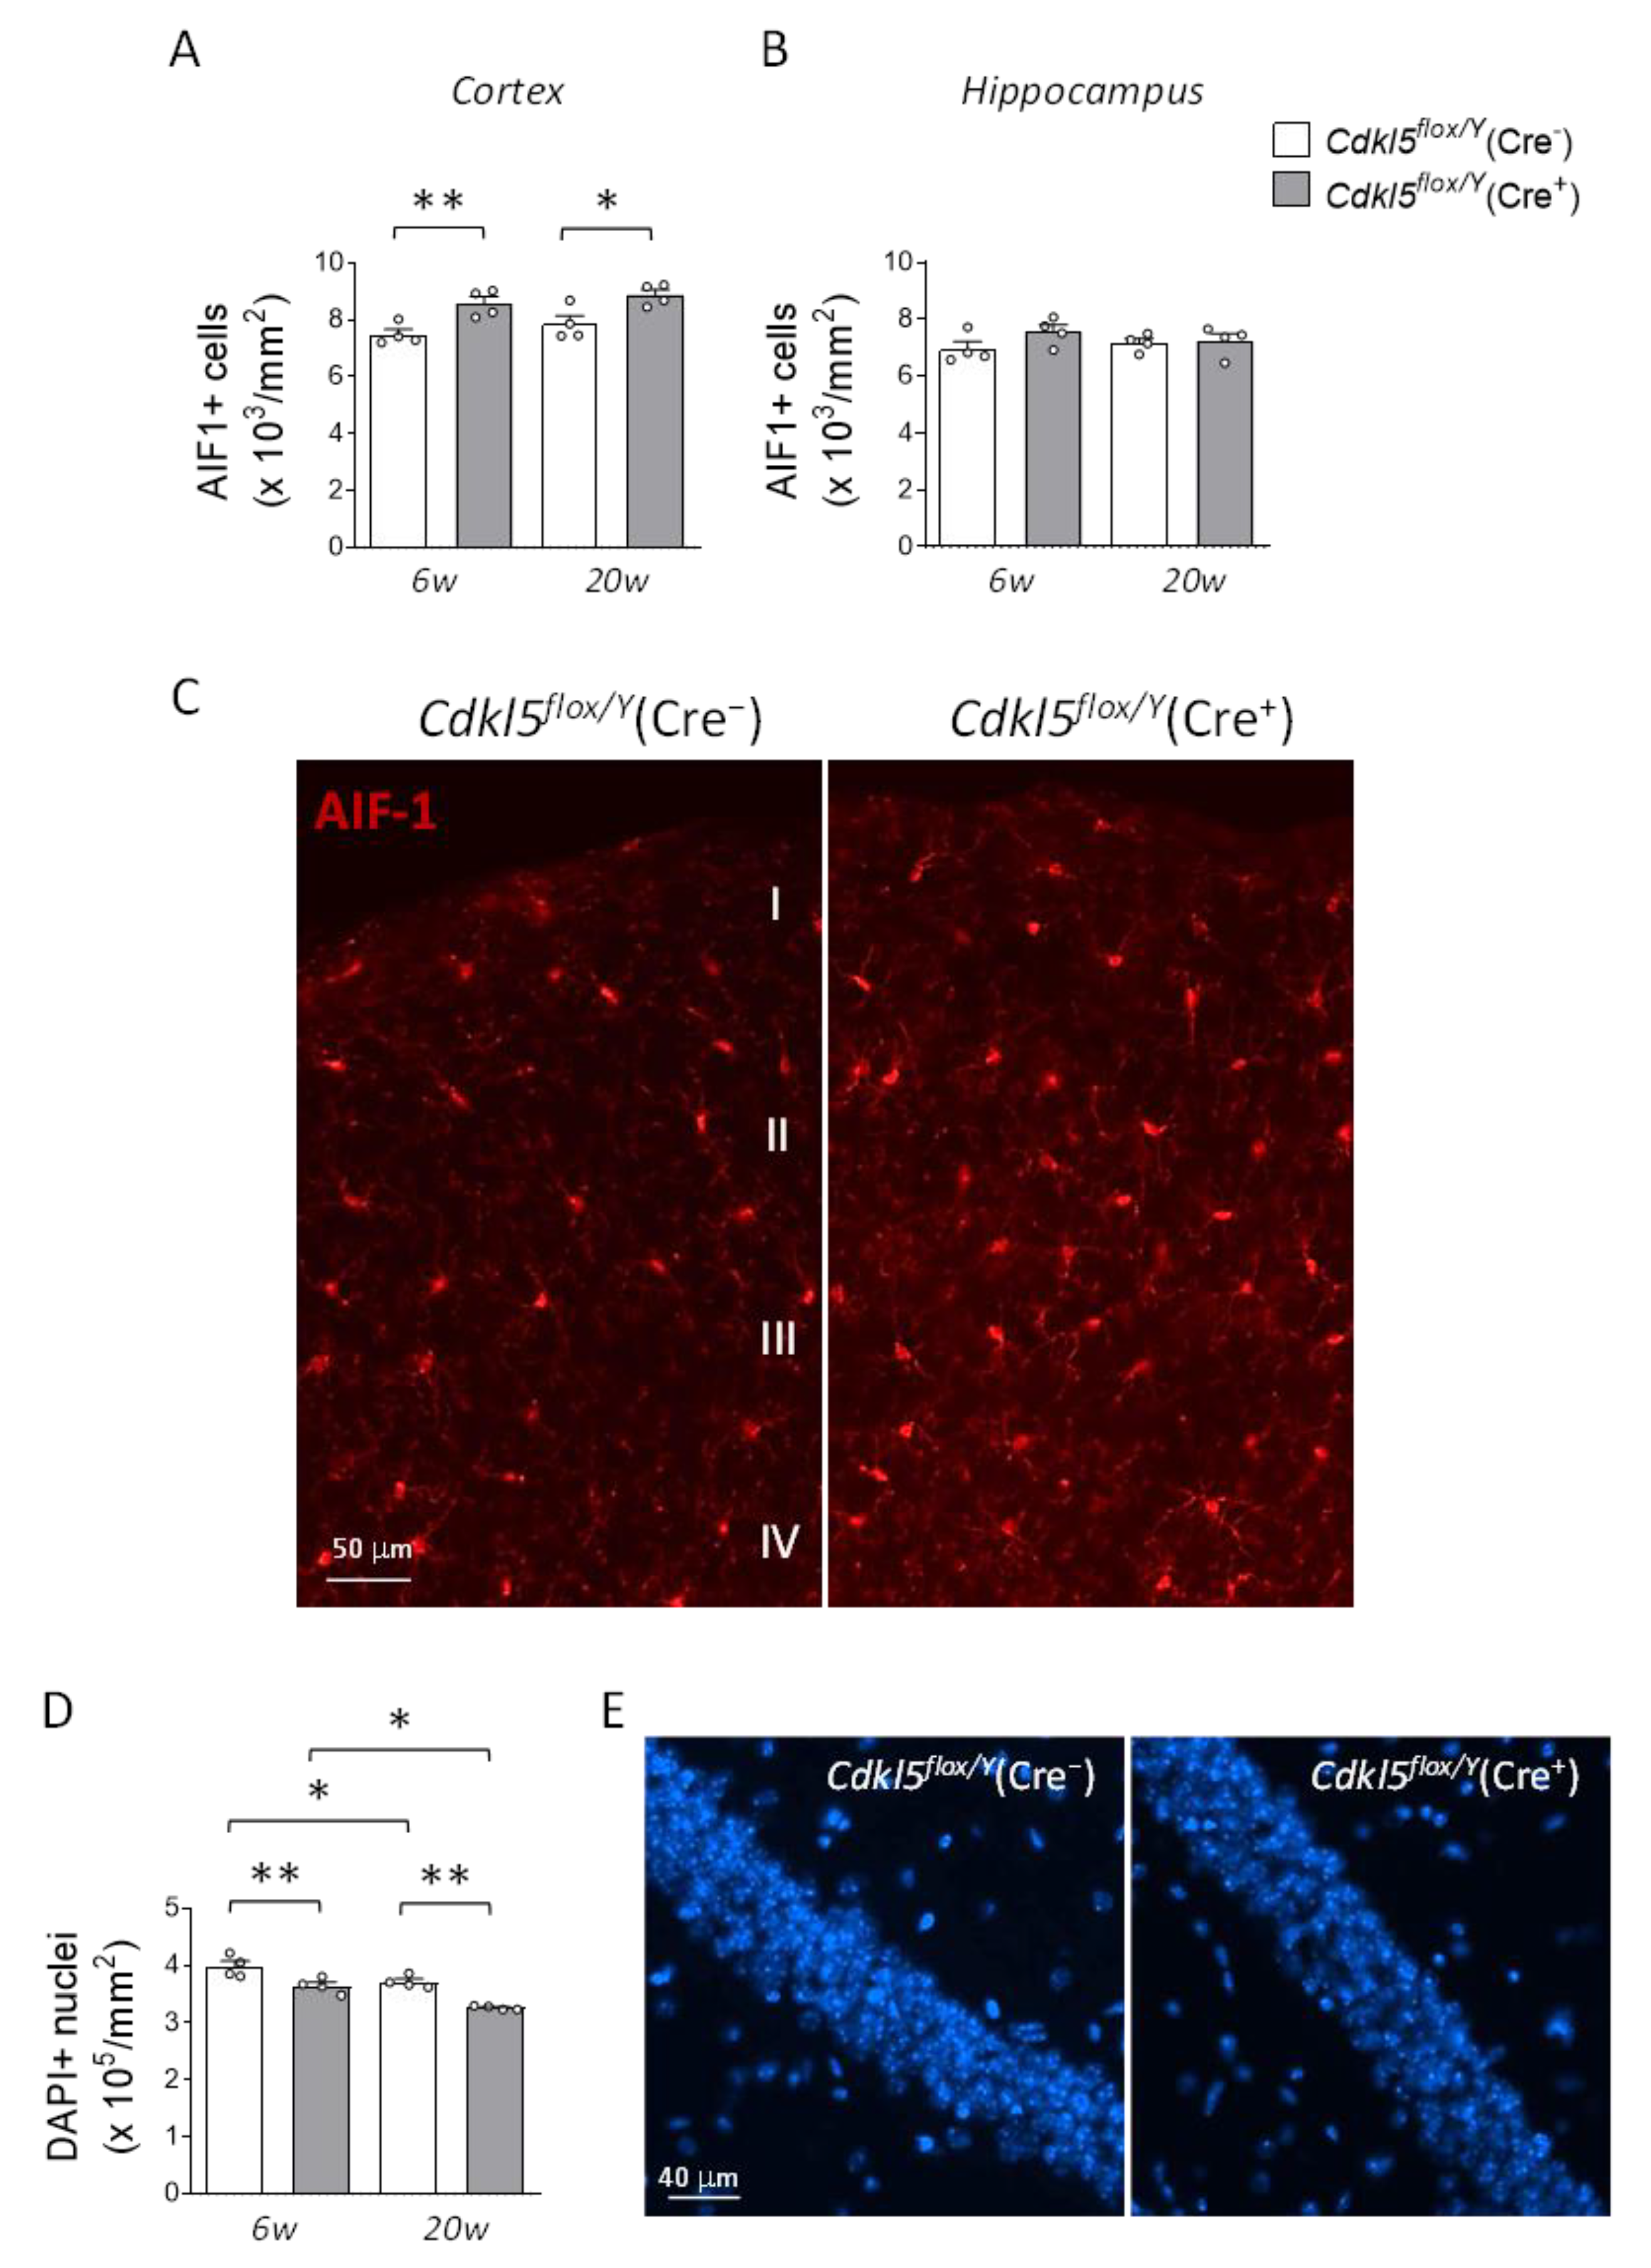
Disclaimer/Publisher’s Note: The statements, opinions and data contained in all publications are solely those of the individual author(s) and contributor(s) and not of MDPI and/or the editor(s). MDPI and/or the editor(s) disclaim responsibility for any injury to people or property resulting from any ideas, methods, instructions or products referred to in the content. |
© 2025 by the authors. Licensee MDPI, Basel, Switzerland. This article is an open access article distributed under the terms and conditions of the Creative Commons Attribution (CC BY) license (http://creativecommons.org/licenses/by/4.0/).
Copyright: This open access article is published under a Creative Commons CC BY 4.0 license, which permit the free download, distribution, and reuse, provided that the author and preprint are cited in any reuse.


