
Submitted:
16 June 2025
Posted:
17 June 2025
You are already at the latest version
Abstract
Staphylococcus saprophyticus (S. saprophyticus) is an opportunistic coagulase−negative staphylococcus (CoNS) known to cause urinary tract infections in humans and increasingly recognized in veterinary medicine. The aim of this study was to provide an epidemiological characterization of S. saprophyticus strains and to identify potential virulence factors that may contribute to interspecies transmission. This research is particularly important, as companion animals represent an understudied reservoir of this microorganism, and their role in the spread of resistant pathogens remains insufficiently understood. A total of 61 S. saprophyticus strains from humans, dogs and cats were analyzed. Identification was performed using MALDI –TOF MS and confirmed by PCR targetting the hrcA gene. Antimicrobial susceptibility was assessed using disk−diffusion and broth microdilution methods, while resistance genes were detected by PCR. The blaZ and mecA genes was present in all strains; additionally, the majority harbored resistance genes ermA, ermB, tetM, and tetK. Multidrug resistance (MDR) was identify in 21/61 strains (34.4%). Biofilm−forming capacity was temperature−dependent, with the strongest biofilm production observed at 37℃ (70.5%). At 38℃ and 39℃, the proportion of strong biofilm producers decreased to 50.8% and 52.5%, respectively. All testes strains demonstrated pathogenic potential in the Galleria mellonella larvae infection model, with the highest mortality recorded for selected feline and canine strains. These findings indicate that S. saprophyticus strains from both humans and companion animals possess notable virulence and multidrug resistance. The detection of genotypically and phenotypically resistant strains in animals highlights their potential role as reservoir for zoonotic transmission.
Keywords:
epidemiology
; public health
; multidrug resistance
; staphylococcus
; CoNS
1. Introduction
The significant majority of all Staphylococcus species are coagulase–negative staphylococci (CoNS) [1]. For a long time, the pathogenicity of CoNS was questioned, and their presence in clinical samples was often considered a result of contamination rather than true infection [1,2,3]. Since the 1980s, increasing attention has been paid to the clinical relevance of CoNS, which are now recognized as potential cause of serious nosocomial and environmental infections [4]. Today, certain CoNS species demonstrate pathogenicity comparable to that of Staphylococcus aureus (S. aureus) [5].
Staphylococcus saprophyticus (S. saprophyticus) naturally colonizes the skin and gastrointestinal tract of both humans and animals, particularly the perianal region and the genitourinary tract [6,7,8]. It is responsible for 20–42% of all human genitourinary infections, especially among young women [9,10,11]. Although urinary tract infections (UTIs) caused by S. saprophyticus are typically benign [12], there are reports in the literature of more severe nosocomial complications, including cystitis, pyelonephritis, urethritis, and even bacteremia and endocarditis [13,14,15,16,17]. Experimental murine models have further shown that S. saprophyticus displays a tropism for kidneys, persisting in renal tissue for up to 14 days post–infection, while being rapidly cleared from the bladder. This finding supports the potential for kidney–specific pathology in certain hosts [18].
In veterinary medicine, livestock such as cattle and pigs have been identified as potential sources of infection for humans. In the case of S. saprophyticus, a significant proportion of these animals have been shown to carry CoNS. One study reported the presence of S. saprophyticus in 7.1% of samples collected from the rectum of cattle carcasses and in 7.3% of samples obtained from pigs. These findings highlight the zoonotic potential of this microorganism and emphasize the need for further investigation into its role in interspecies transmission [19]. Given the documented carriage of S. saprophyticus in slaughter animals, increasing attention has been directed toward the possibility of its transmission to humans through contaminated food products. Infection with S. saprophyticus via consumption of meat from colonized animals has been described in the literature as a likely route of transmission . Hedman et al., in a study exploring potential sources of UTIs caused by S. saprophyticus, the bacterium was detected in 16.4% of tested meat samples. The highest prevalence was found in a raw pork and beef, where S. saprophyticus was present in up to 34% of samples [20].
Information regarding colonization and infection caused by S. saprophyticus in companion animals remains limited. In companion animals such as dogs and cats presenting with symptoms of UTIs, S. saprophyticus is estimated to be responsible for approximately 2.9% of UTIs cases in dogs [21]. Additionally, this bacterium has been identified in dogs diagnosed with dermatitis, suggesting its potential pathogenic role in dermatological conditions as well [22]. In veterinary medicine, cases of disease among S. saprophyticus infection secondary to bladder stones in a female dog have been described [23], and even a fatal course of infection in armadillos has been reported [24]. In a study analyzing isolates of CoNS and coagulase–positive staphylococci (CoPS) obtained from both healthy and sick dogs and cats, a significantly higher proportion of methicillin–resistant strains was observe among CoNS (17.86%) compared to CoPS (1.95%). These findings suggest that the clinical relevance of CoNS may be underestimated, particularly in the context of their increasing antibiotic resistance and potential role in infections in companion animals [25].
CoNS have increasingly been recognized as a significant public health concern due to their growing antibiotic resistance. These strains, long considered non–pathogenic and frequently dismissed as contaminants in clinical samples, are now acknowledged as important opportunistic pathogens, particularly in hospital settings [26,27]. CoNS are frequently isolated from bloodstream infections, catheter–associated infections, and prosthetic device–related complications. Their ability to form biofilm significantly hinders treatment efficacy [28,29]. Studies have shown that CoNS strains can reach high levels of antibiotic resistance, particularly against β–lactams (e.g., oxacillin), as well as macrolides, lincosamides and glycopeptides [30,31]. In some clinical setting, the proportion of methicillin–resistant CoNS isolates has exceeded 80–90%, indicating strong selective pressure imposed by antimicrobial therapies [1]. Moreover CoNS are considered important reservoirs of resistance genes, including mecA, which may be horizontally transferred to other species such as S. aureus increasing the risk of MRSA emergence [32]. There is also a noted increase in multidrug–resistant isolates, not only in healthcare environments but also among healthy individuals in the general population, emphasizing the need to broaden epidemiological surveillance beyond clinical setting [33,34]. S. saprophyticus a species frequently isolated from companion animals, has also demonstrated considerable resistance to selected antimicrobials. One study revealed strong resistance to novobiocin and nalidixi acid, as well as a bimodal susceptibility pattern to erythromycin [35,36]. Notably, CoNS were isolated from 81.75% of 274 animals tested (224/274), with S. saprophyticus being the most commonly identified species in sick dogs. In the same cohort, 70 methicillin–resistant strains were found among 392 strains (70/392) [25].
Consequently, CoNS – including S. saprophyticus – should be regarded as an emerging epidemiological threat, requiring systematic monitoring and further research into their resistance mechanism and treatment strategies. It is also important to emphasize that both colonization and infections caused by CoNS in companion animals remain poorly understood. Given their potential zoonotic nature, additional studies are warranted, particularly in the context of their role as reservoir of antibiotic–resistant strains that may pose a risk to public health. The aim of the present study was to investigate the antimicrobial resistance profiles and biofilm–forming properties of S. saprophyticus strains isolated from pets and humans, contributing to a better understanding of their epidemiological significance in veterinary medicine and potential implications for public health.
2. Results
2.1. Identification and Cluster Analysis
All archived strains (n=61) were re–identified as S. saprophyticus using the matrix–assisted laser desorption/ionization time–of–flight mass spectrometry (MALDI–TOF MS), with identification scores exceeding the threshold value of 2.000, indicating high reliability. Additionally, species affiliation of all strains was confirmed by molecular analysis through the detection of the hrcA gene, which is specific to this species [37].
To visualize the relationships among the analyzed strains, cluster analysis was performed using principal component analysis (PCA) and a hierarchial dendrogram (Figure 1A). Cluster analysis of MALDI–TOF MS spectra of strains identified as S. saprophyticus revealed the presence of four clearly defined clusters: red, blue, green and purple (Figure 1A and 1B). The two main clusters (red and green) comprised isolates of various origins. Notably, human–derived strains – regardless of host species or health status – were distributed across different groups. The highest homogeneity was observed among isolates obtained from healthy cats (hFe5, hFe10, hFe21, hFe13, hFe14, hFe15, hFe22), which clustered together in the purple group (Figure 1A and 1B). However, it is worth noting that most strains from healthy cats were assigned to other clusters. Additionally, a clear exception from the expected classification was observed – one feline strain (hFe12) clustered together with the reference strains (S. saprophyticus PCM 2109, S. saureus ATCC 43300, S. epidermidis PCM 2532). Detailed results are presented in Figure 1A, showing the principal component analysis (PCA) and the corresponding hierarchical clustering dendrogram.
1. hHo8 2. hFe29 3. sHo2 4. hFe9 5. hHo12 6. hHo9 7. hFe26 8. hHo4 9. hHo5 10. sFe1 11. hFe2 12. hFe20 13. hFe6 14. sHo7 15. hFe3 16. hFe8 17. hFe27 18. hFe17 19. hHo1 20. hHo11 21. sCa7 22. hFe16 23. sCa8 24. hFe11 25. hHo2 26. hFe19 27. sCa3 28. sCa4 29. hFe1 30. hFe25 31. hFe24 32. hHo14 33. sHo3 34. sHo5 35. S. haemolyticus PCM 2113 36. S. aureus ATCC 43300 37. S. lugdunensis PCM 2430 38. S. epidermidis PCM 2532 39. hHo12 40. hFe5 41. hFe10 42. hFe21 43. hFe13 44. hFe14 45. hFe15 46. hFe22 47. sFe3 48. S. saprophyticus PCM 2109 49. sCa2 50. hHo13 51. hFe7 52. sHo6 53. hHo10 54. sFe2 55. sCa5 56. hHo6 57. sHo4 58. hCa1 59. sCa1 60. hHo7 61. hHo3 62. hFe23 63. sHo1 64. hFe12 65. hFe4 66. hFe28
2.2. Antimicrobial Phenotyping Testing
2.2.1. Disk Diffusion Method
Antibiotic susceptibility of all S. saprophyticus strains (n=61) was determined using the disk–diffusion method, following current interpretive guidelines [38,39,40]. During the analysis, the zone of growth inhibition around antibiotic–impregnanted disks was measured, allowing classification of strains as susceptible, intermediate or resistant. The analysis reveald that 34.43% (21/61) of the tested strains exhibited a multi–drug resistance (MDR) phenotype, defined as resistance to at least one agent in three or more antimicrobial classes. Among isolates from humans, two most frequently occuring resistance profiles were identified: AMP, E, FD (n=5) and AMP, AMC, P, OX (n=2). In isolates obtained from other sources a much greater diversity of resistance profiles was obsered with no repeating patterns. The complete phenotypic resistance profiles for all strains are provided in the Supplementary Material (Table S1).
In the detailed analysis the highest overall resistance levels were observed for erythromycin (47.54%, 29/61), oxacillin (42.62%, 26/61), ampicillin (27.87%, 17/61) and fusidic acid (24.59%, 15/61). Conversley, the lowest resistance levels or complete susceptibility were recorded for mupirocin (3.28%, 2/61), tigecycline (1.64%, 1/61), linezolid (1.64%, 1/61) and trimetoprim with sulfamethoxazole (0/61). In the subgroup of strains obtained from humans (n=21) the most prevalent resistance was noted against erythromycin (52.38%, 11/21) and oxacillin (42.86%, 9/21). No resistance was observed among humans strains to linezolid, mupirocin, tigecycline or thrimethoprim with sulfamethoxazole.
Due to the limited sample size of some animal subgroups, data from dogs and cats were analyzed together (n=40). Similarly to human strains results, high resistance to erythromycin (45.0%, 18/40) and oxacillin (42.5%, 17/40) was observed in the overall animal group and no resistance was observed for tigecycline and sulfamthoxazole with trimetoprime. Among sick animals (n=10) resistance rated were even higher reaching 80.0% for both erythromycin and oxacillin. The lowest resistance levels overall were recorded in strains from clinically healthy animals, suggesting a potential correlation between host health status and antimicrobial resistance profiles. Detailed antibiotic susceptibility results are presented in Table 1.
2.2.2. Minimal Inhibitory Concentration and Minimal Bactericidal Concentration for Selected Antimicrobials
In the analyzed group of strains (n=61), no resistance was observed to vancomycin and teicoplanin. The highest overall resistance rated were recorded for erythromycin (78.69%, 48/61), clindamycin (44.26%, 27/61) and tetracycline (16.39%, 10/61). Strains isolated from humans showed particularly high resistance to erythromycin (95.24%, 20/21) and clindamycin (33.33%, 7/21). Among animal–derived strains (n=40), resistance to erythromycin and clindamycin reached 70.0% (28/40) and 50.0% (20/40), respectively with the highest levels observed in strains from sick cats and dogs (100.0%, 10/10). Strains obtained from healthy animals showed lower resistance rates, particularly to tetracycline (13.33%, 4/30) and oxacillin (16.67%, 5/30), although the values remained relatively high. Minimum inhibitory concentrations (MICs) determined for selected antibiotics (vancomycin, teicoplanin, tetracycline, clindamycin, erythromycin and oxacillin) were consistent with the results obtained using disk–diffusion method, exhibiting the same resistance trend.
This trend in resistance was also reflected in bacterial activity profiling. To further assess the strength of antimicrobial activity, the relationship between MIC and the minimum bactericidal concentration (MBC) was analyzed by calculating the log2(MBC/MIC) values (Figure 2). Detailed data are provided in Table S2 in Supplementary Materials.
2.3. Detection of Resistance Genes Using PCR–Based Genotypic Analysis
The study revealed that blaZ and mecA genes were detected in all analyzed strains. Macrolide resistance genes (ermA, ermB) were most frequently detected in humans, regardless of health status. Both genes were found in 92.86% (13/14) of healthy individuals. In sick indyviduals ermA was present in 85.71% (6/7) while ermB 57.14% (4/7). In animal isolates, the prevalence of these genes was also high but slightly lower – 87.5% (35/40) ermA and 60.0% (24/40) for ermB. Among the four tetracycline resistance genes analyzed (tetK, tetL, tetM, tetO), tetK was not detected in any of the tasted samples. In contrast, the remaining three genes were present, with tetM and tetL being the most prevalent, followed by tetO, which was detected less frequently. Regardless of clinical status, tetM was found in 100.0% of the tested straines from humans (21/21) and dogs (8/8). A similliar trend was observed in cats with a high prevalence 96.88% (31/32). The tetL gene was detected in all diseased humans and was also prevalent in the entire human cohort, with an overall frequency of 80.95% (17/21). The fusB was detected sporadically 13.79% (4/29) and exclusively in healthy cats. In these cases, the results of the disk–diffusion test for fusidic acid resistance were consistent with the presence of the genes. Interestingly, the highest level of phenotypic resistance to fusidic acid, as determined by disk–diffusion, was observed among diseased humans, despite the absence of any known resistance genes associated with this antibiotic. In the group of healthy cats, the mupA gene was identified in 6.90% of individuals (2/29) and resistance to mupirocin determined by the disk–diffusion method was consistent with the genotypic finding. Overall, resistance genes were more frequently detected in humans than in animals. A detailed breakdown of genotypic antibiotic resistance data is presented in Table 2. Genetic profiles of resistance are shown in Table S4 in Supplementary Materials.
2.4. Bacterial Growth Curves and Biofilm Formation
Growth curves were generated for eleven strains (hHo4, hHo5, sHo1, sHo2, hFe14, hFe17, hFe26, sFe3, hCa1, sCa1 and sCa8) at temperatures of 37℃, 38℃ and 39℃. The resulting growth curves along with the corresponding doubling times are presented in the Supplementary Materials (Figure S1–S10). Incubation at 37℃ promoted the most robust growth in the majority of tested strains, regardless of host origin and health status. At this temperature, strains exhibited the fastest growth rates and reached the highest OD600 plateau values, indicating that 37℃ represents optimal culture conditions for this species. At 38℃, althought the exponential growth rate remained similar to that at 37℃, the OD600 plateau values were generally lower. In contrast, growth at 39℃ was clearly reduced for some strains – particularly those derived from healthy hosts. These strains displayed prolonged lag phase and lower OD600values after 24 hours.
Biofilm–forming capacity was assessed by measuring absorbance at 570 nm following 24 hour of incubation at 37℃, 38℃ and 39℃.All isolates were at least weak or moderate biofilm producers. At 37℃, 70.5% (43/61) strains exceeded the threshold for strrong biofilm formation, while this numer decreased to 50.8% (31/61) and 52.5% (32/61) isolates at 38℃and 39℃respectively. S. saprophyticus strains from healthy dogs formed strong biofilms at all three temperatures. Over 60% of human–derived strains exhibited strong biofilm–forming capacity at 37℃ while at 38℃and 39℃ this proportion decreased to approximately 52% (Figure 3). Detailed data are provided in Table S3 in the Supplementary Materials.
To assess the influence of incubation temperature and host origin on biofilm formation, a two–way ANOVA was conducted using absorbance values at 570 nm measured for all S. saprophyticus strains (n=61) at all three temperatures. The analysis revealed a statistically significant effect of incubation temperature on biofilm forming (F(2.174)=8.72, p=0.000245), indicating that temperature has a substantial impact on the extent of biofilm formation. In contrast, no statistically significant effect of host origin was observed (F(2.174)=1.44, p=0.2408) nor was there a significant interaction between temperature and host origin (F(4.174)=0.37, p=0.8327). Post hoc Tukey’s HSD test showed that strains incubated at 37℃ exhibited significantly higher biofilm production compared to 38℃ (p=0.0002) and 39℃ (p=0.0186) while no significant difference was observed between 38℃ and 39℃ (p=0.3000). These findings indicate that 37℃ is the optimal temperature for strong biofilm formation by S. saprophyticus strains, regardless of their host origin.
2.5. Pathogenicity Tests on Galleria mellonella Larvae Model
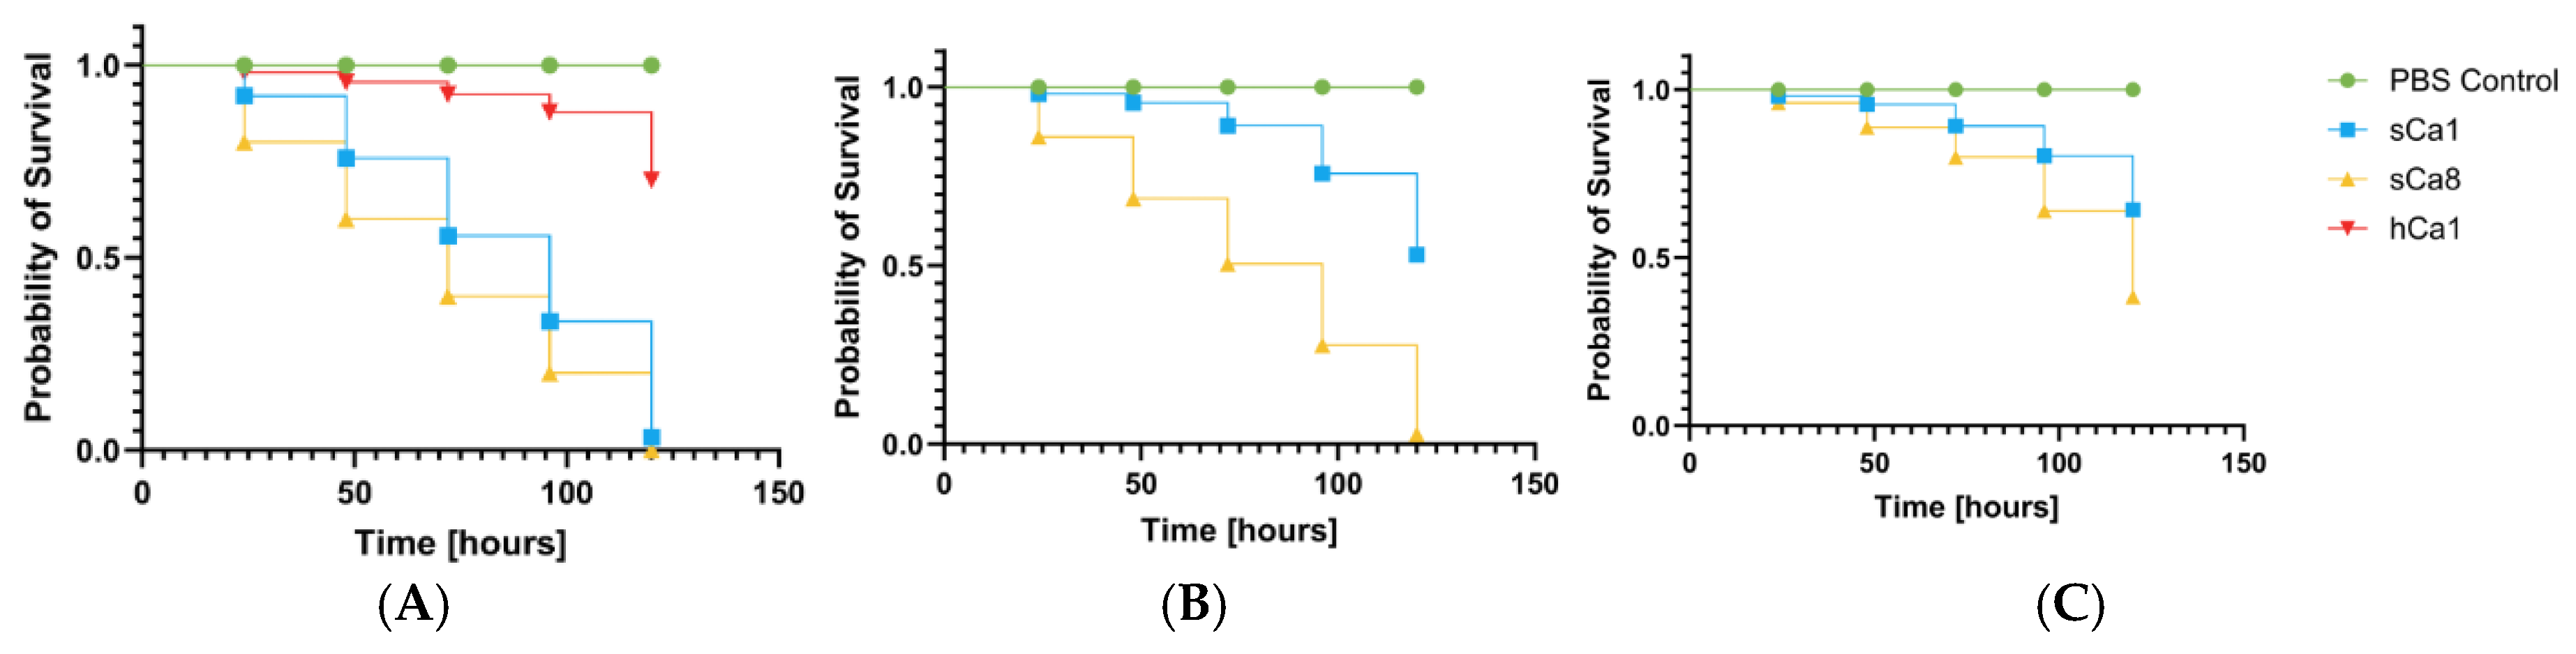
All tested S. saprophyticus strains exhibited significant pathogenicity in the Galleria mellonella (G. mellonella) infection model. Virulence of strains strongly dependent on the bacterial inoculum dose. The highest larval mortality was observed at higher inoculum densities (OD600=0.5 and 0.1) while the lowest concentration (OD600=0.01) generally did not result in significant reductions in survival. Notably, the feline isolate hFe17 and the canine isolate sCa8 exhibited particularly high virulence, causing substantial larval mortality at all tested concentrations, indicationg their potentially heightened clinical relevance. Human–derived strains were also pathogenic but showed a clear–dependent virulence pattern. The variation in pathogenic potential among strains of different host origin suggests the presence of host–specific adaptations. These findings are presented in Figure 3(A–C), Figure 4(A–C) and Figure 5 (A–C).
Figure 3.
Survival curves of larvae (n=4) following injection with the tested strains of S. saprophyticus. The negative control of larvae injected with a sterile PBS buffer (PBS control). Larval survival was monitored for 120 hours. Galleria mellonella larvae infected with human-derived S. saprophyticus strains at an inoculum density of A. OD₆₀₀ = 0.5 B. OD₆₀₀ = 0.1 C. OD₆₀₀ = 0.01.
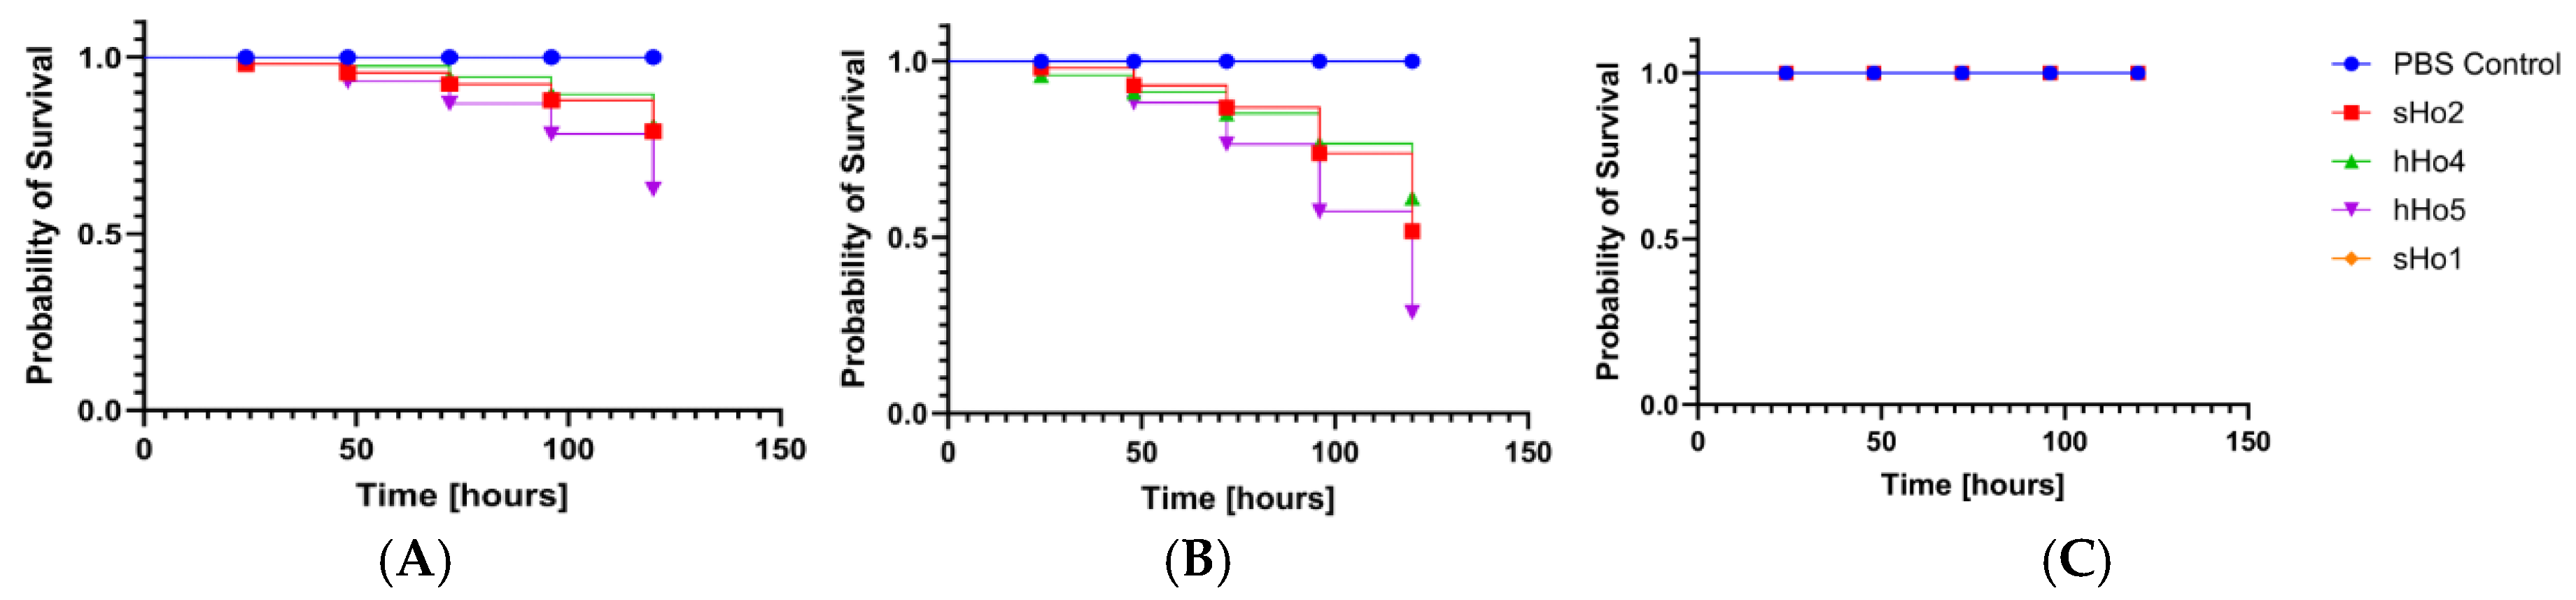
Figure 4.
Survival curves of larvae (n=4) following injection with the tested strains of S. saprophyticus. The negative control of larvae injected with a sterile PBS buffer (PBS control). Larval survival was monitored for 120 hours. Galleria mellonella larvae infected with feline-derived S. saprophyticus strains at an inoculum density of A. OD₆₀₀ = 0.5 B. OD₆₀₀ = 0.1 C. OD₆₀₀ = 0.01.
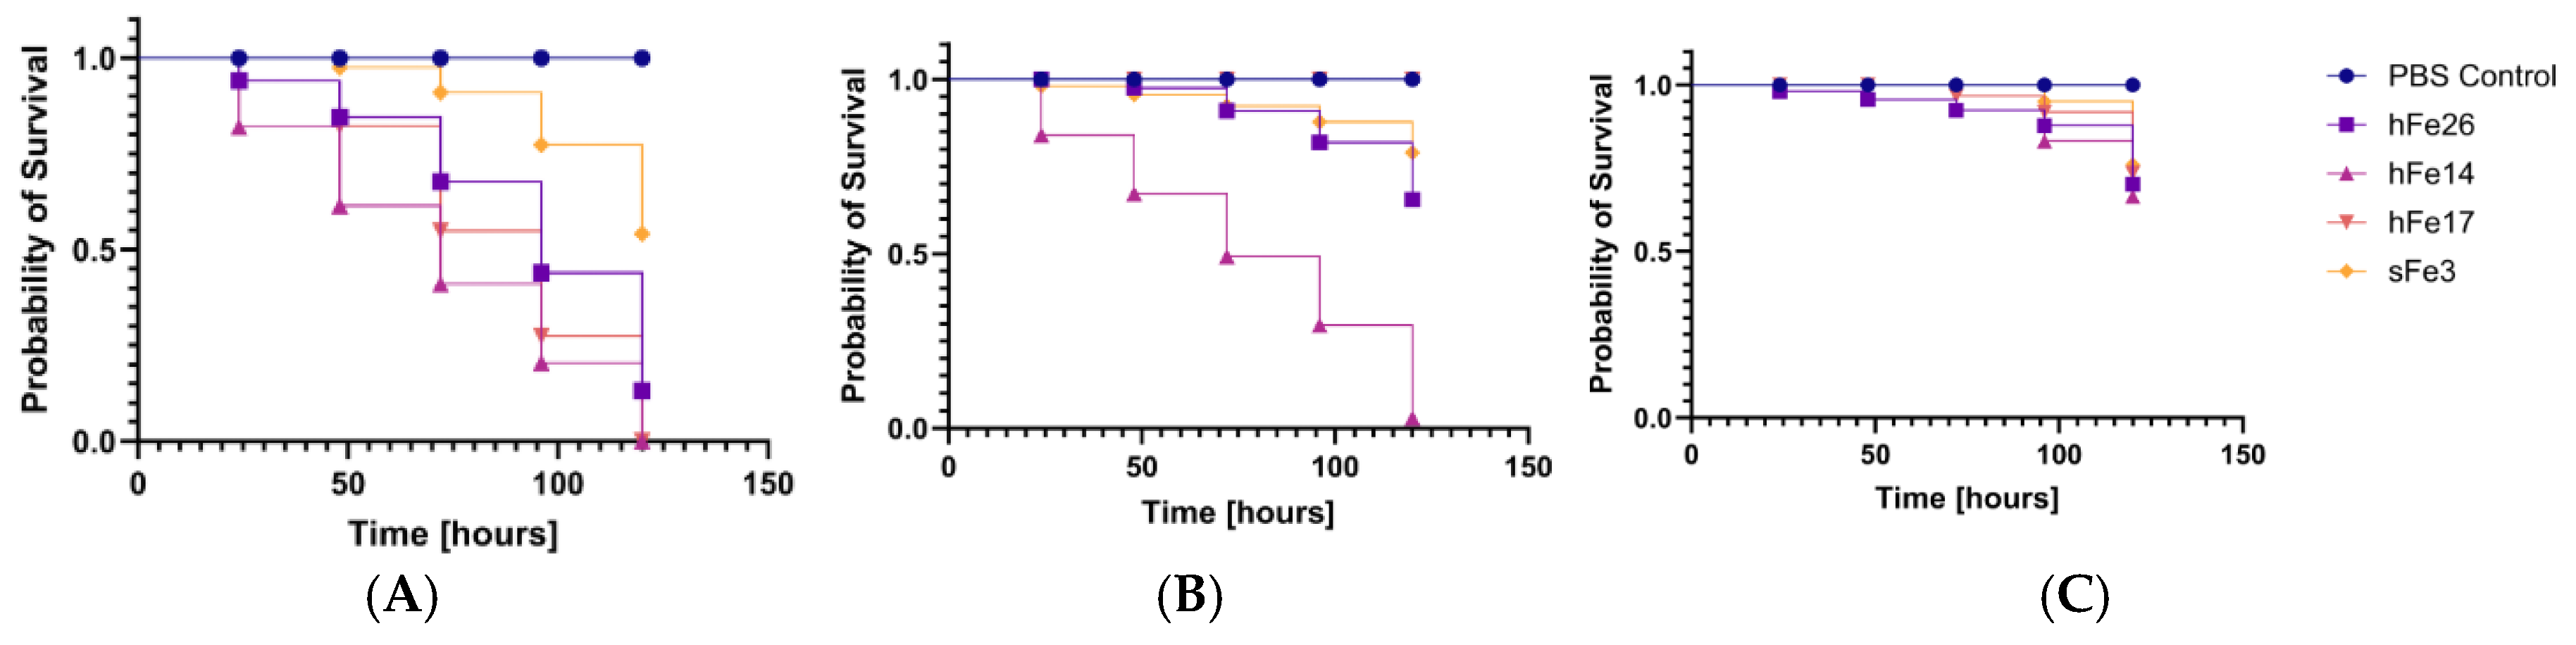
Figure 5.
Survival curves of larvae (n=3) following injection with the tested strains of S. saprophyticus. The negative control of larvae injected with a sterile PBS buffer (PBS control). Larval survival was monitored for 120 hours. Galleria mellonella larvae infected with canine-derived S. saprophyticus strains at an inoculum density of A. OD₆₀₀ = 0.5 B. OD₆₀₀ = 0.1 C. OD₆₀₀ = 0.01.
3. Discussion
Staphylococcus saprophyticus is uncommonly found in companion animals but is a significant cause of urinary tract infections, particularly cystitis, in humans. [6]. Although direct evidence of transmission between humans and companion animals has not yet been clearly demonstrated, the possibility of such transmission exists and should be considered in epidemiological analyses [41]. Many studies highlight that, despite the increasing clinical importance of CoNS as causative agents of infections, their identification in routine clinical diagnostics is most often limited to the species level. This is primarily due to the fact that more detailed differentation methods such as advanced biochemical test or molecular analyses are frequently too time–consuming, expensive or insufficiently precies for widespread implementation [1,42,43,44].
In recent years the use of MALDI TOF MS has been described as a rapid and effective method for bacterial identification, which was confirmed in epidemiological studies conducted by Mlaga et al. during an outbreak of urinary tract infections caused by S. saprophyticus [45]. Our findings also support the high reliability of this method it proved to be fast, sensitive and highly reproducible, with spectral profiles fully consistent with the results of PCR targeting the species specific gene hrcA [37]. Moreover cluster analysis based on MALDI TOF MS spectra revealed considerable intraspecies diversity among S. saprophyticus isolates, consistent with previous reports on the species high genomic plasticity [45,46,47]. The highest degree of spectral homogeneity was observed among isolates obtained from healthy cats, however, even within this group, the strains were dispersed across multiople clusters. This may indicate the existance of subpopulations adapted to specific hosts and suggest the potential for dynamic population shifts as part of the species adaptive strategy for colonizing different hosts [48,49,50].
Phenotypic antimicrobial susceptibility testing using disk diffusion method revealed high levels of resistance, particularly to erythromycin (47.54%, 29/61). Among the isolates obtained from dogs, an exceptionally high level of resistance to erythromycin (100.0%, 8/8) and clindamycin (50.5%, 4/8) was observed. It may reflect a species specific selective pressure associated with routine veterinary therapeutic practices but the limited sample size of the canine group may partially account for the high observed resistance rate. Neverttheless, these findings underscore the need for continued and systematic monitoring of resistance to this antibiotic in strains obtained from dogs. Similar patterns of high resistance to erythromycin and clindamycin in S. saprophyticus have been reported previously, including findings by Rafie et al. who observed erythromycin resistance in 51.4% of isolates [51]. Khan et al. reported that 91% of S. saprophyticus strains exhibited resistance to penicillin, a markedly higher rate compared to our findings [52]. In our study, penicillin resistance was observed primarly among human-derived strains, particularly those obtained from healthy individuals (35.71%, 5/14). Among animals-derived strains, no resistance was detected in canine strains, while in feline population it was observed only in healthy cats (24.14%, 7/29). In contrast, Marepalli et al. documented ampicillin resistance in approximately 50.0% of isolates which closely mirrors our results [53]. In our data, ampicillin resistance was highest among human-derived strains with similar rates found in strains from healthy individuals (50.0%, 7/14) and those with clinical symptoms (42.86%, 3/7). Oxacillin resistance in our study reached 42.62% (26/61) with comparable rates between humans and animal-derived strains. Literature reports also decribe a wide range of resistance levels to this antibiotic, ranging 76.2% [1] to as high as 98.2% in zone of inhibition analysess [54]. This findings confirm that resistance of S. saprophyticus to many antibiotics (erythromycin, clindamycin, oxacillin, penicillin) is not a local phenomenon but rather a widespread and clinically relevant issue.
Additionally, the use of MIC determination for selected antibiotics allowed for a more precise assessment of actual resistance levels. In the case of oxacillin and tetracycline, there was high concordance between MIC and disk-diffusion results (difference ≤3%). However for erythromycin and clindamycin significant discrepancies were noted – disk-diffusion method resistance rates by 45.9% (28/61) and 14.75% (9/61) was lower than in broth microdilution method – respectively 78,69% (48/61) and 44.26% (27/61). This may be attributed to the classification strategy applied: isolates were considered susceptible if bacterial growth did not clearly extend beyond the edge of the inhibition zone, even when growth reached its boundary. While this approach aimed to avoid overinterpretation and the risk of falsely classifying strains as resistant it led to an underestimation of the number of truly resistant strains compared to MIC references values. It is worth noting that similar interpretive challenges particularly for erythromycin and oxacillin in staphylococci, have been previusly reported [55]. In the subsequent part of the study the MBC/MIC ratio was assessed for selected antibiotics to idetify potential mechanism of antibiotic tolerance. The highest frequency of elevated MBC/MIc rratios (log2[MBC/MIC]≥4) was observed for tetracycline, affecting 49.2% (30/61). A high MBC/MIc ratio may idicate the presence of tolerance mechanism such as biofilm formation, active drug efflux systems or decreased cell membrane permeability. Similar findings have been documented in earlier research [56,57]. The smallest differences between MBC/MIc values were recorded for vancomycin and teicoplanin, both of which demonstrated complete effiacy against all tested strains in MIC–based assessments. These findings are consistent with earlier studies reporting that S. saprophyticus remains susceptible to glycopeptides, particularly vancomycin althought some strains may exhibit intermediate susceptibility to teicoplanin (MIC range 2–8µg/ml) [58]. Our results reaffirm the therapeutic utility of glycopeptides against this species, especially in the context of increasing resistance to first line antibiotics such as macrolides, tetracyclines and β–lactams. Importantly strains obtained from healthy animals exhibited lower and more stable log2(MBC/MIC) values, which may reflect selective pressure in non–clinical environments and potentially limited expression of tolerance mechanisms in these strains.
All analyzed S. saprophyticus strains carried the blaZ and mecA genes which are associated with widespread resistance to β–lactam antibiotics. The simultaneous presence of both determinants indicates the coexistance of enzymatic inactivation mechanisms (β–lactamase production) and altered penicillin binding proteins (PBP2a) characteristic of methicillin resistant coagulase–negative staphylococci (MRCoNS). These results are consistent with previous studies reporting the detection of blaZ and mecA in S. saprophyticus strains isolated from both humans and animals [61]. Genes associated with MLSb resistance ermA and ermB were particularly prevalent among human–derived isolates which may reflect selective pressure resulting from the frequent use of macrolides in the treatment of urinary tract infections. The presence of these genes in S. saprophyticus has also been documented in the context of urological infections [62]. Determinants of tetracycline resistance tetM and tetK were dominant among strains from infected humans and cats possibly indicating convergent selection pressures or similar levels of exposure to tetracyclines in these populations. Their presence has previously been documented in CoNS strains isolated from bovine mastitis cases, confirming the widespread distribution of these genes across different environemnts [63,64]. Particular attention should be given to the fusB and mupA genes, which are responsible for resistance to fusidic acid and mupirocin. The fusB gene was detected in 13.79% (4/29) and mupA 6.9% (2/29) of strains, both exclusively among strains derived from cats. In all cases, phenotypic resistance confirmed by the disk–diffusion method corresponded with the presence of the respective gene, suggesting active expression. Notably the highest levels of phenotypic resistance to fusidic acid was observed in isolates obtained from diseased humans despite the absence of resistance genes related to this antibiotic. This may indicate the involvement of alternative as yet unidetified resistance mechnisams. Considering the frequent use of fusidic acid in human dermatology, particularly for topical treatment of skin infections this observation may have important clinical relevance [65]. Althought the total number of mupA positive cases was low (2/61) the presence of these genes in commensal strains isolated from companion animals may indicate a reservoir of resistance determinants that are rarely found in the human population. The detection of such genes even in individual cases highlights the importance of continued surveillance of this bacterial group especially in the context of close human–pet interactions [66,67]. These findings point to a significant dissemination of resistance genes within the S. saprophyticus species, regardless of the isolation source and highlight the need for continued monitoring of this organism as a potential reservoir of clinically and epidemiologically relevant resistance determinants. Importantly, genotypic resistance did not always align with the presence of phenotypic resistance, indicating discrepancies between genotypic and phenotypic profiles across various antibiotics.
MDR defined as resistance to three or more classes of antibiotics was observed in 38.1% of human–derived strains (8/21) and 32.5% of animal–derived strains (13/40). Althought the proportion was slightly higher among human isolates the difference was not statistically significant suggesting that MDR S. saprophyticus strains occur in both human and animal populations. This finding may indicate the widespread distribution of resistance mechanisms across environments and highlights the potential role of animal–derived strains in resistance gene dissemination. The presence of MDR strains among healthy companion animals further empasizes the importance of including these populations in antimicrobial resistance surveillance programs, particularly given their close contact with humans. The phenotypic resistance profile was futher supported by genotypic analysis. All examinated S. saprophyticus strains were susceptible to glycopeptides (vancomycin and teicoplanin) in agreement with MIC data and consistent with previous reports describing CoNS susceptibility to this antibiotic group [1,59].
Both the biofilm formation assays and the growth curve analysses consistently idetified 37℃ as the optimal temperature for S. saprophyticus highlighting the species strong physiological adaptaion to host like conditions. At this temperature the highest proportion of strong biofilm producers was recorded and strains exhibited the fastest growth rates and highest OD600 plateau values. In contrast increasing the incubation temperature to 38℃ and 39℃ led to a general decline in both biofilm forming capacity and growth efficency, suggesting a degree of temperatur sensitivity in the regulatory mechanisms govering these processes. This trend was particularly evident among animal–derived strains which showed reduced performance in both traits at elevated temperatures. The convergence of these findings underscore the potential role of temperature as a key environmental signal influencing not only bacterial metabolism but also the expression of virulence associated phenotypes such as biofilm formation. Thus, 37℃ appears to represent not only the physiological but also the functional optimum for S. saprophyticus survival and persistence within the host [32,60]. Physiological body temperatures in cats (approximately 38-39,2°C) and dogs (around 3,5-39°C) are consistently higher than the typical human core temperature of 37°C. This thermal difference could represent a significant physiological barrier, potentially explaining the relatively lower rates of S. saprophyticus isolation from companion animals compared to humans.
This study represent the first attempt to assess the virulence of S. saprophyticus using the G. mellonella larvae infection model [68]. All tested strains demonstrated pathogenic potential in this model, with the highest larval mortality observed for isolates hFe30 and sCa8. The fastest growing strain hFe11 also exhibited high virulence however no clear correlation was found between growth rate and pathogenicity. These results suggest that other virulence factors such as biofilm formation or toxin production may also play a significant role [1,69]. The results of this study confirm that CoNS including S. saprophyticus possess significant pathogenic potential and the capacity to develop multidrug resistance [1]. Accurate species identification and resistance profiling remain essential for effective treatment and for reducing the risk of interspecies transmission. Given the high proportion of MDR strains (39.34%, 21/61) routine antimicrobial susceptibility testing should be a standard component of micorbiological diagnostics [69].
It is worth emphasizing that S. saprophyticus and other CoNS were for many years routinely regarded as contaminants in clinical or environmental samples. However numerous studies have demonstrated that such isolates should not be automatically classified as contaminats particularly in light of their documented ability to form biofilms, carry resistance genes and participate in opportunistic infections. Importantly the presence of strains from companion animals exhibiting concordant phenotypic and genotypic resistance highlights the need to consider this group as a potential reservoir of resistant microorganism within antimicrobial resistance monitoring programs.
4. Materials and Methods
4.1. S. saprophyticus Strains Collection
The strain collection for this study consisted of 61 S. saprophyticus deposited in the years 2013–2022 during research carried out in the Department of Epizootiology and the Clinic of Birds and Exotic Animals of the Faculty of Veterinary Medicine, University of Environmental and Life Sciences in Wroclaw. Sampling and the necessary approvals of ethics committees were described earlier [25,70]. The strains were isolated from swabs taken from two groups of patients: healthy dogs, cats and humans – without any symptoms of the disease; sick dogs, cats and humans with symptoms of disease (coughing, discharge from conjunctival sac or skin lesions). In the current study 21 samples from humans (n=14 healthy, n=7 sick) and 40 samples from dogs and cats (n=30 healthy, n=10 sick) were investigated. All bacterial strains were stored at –80°C in Brain Heart Infusion (BHI) broth (OXOID Ltd., Basingstone, UK) containing 40% (v/v) glycerol (Thermo Fischer Scientific, Kandel, Germany). Detailed information on sampling sites and group sizes is presented in Table 3.
4.2. Identification of S. saprophyticus
All bacterial strains were cultured on Mannitol Salt Agar (OXOID Ltd., Bansingston, UK) and Columbia Agar (OXOID Ltd., Bansingston, UK) supplemented with 5% sheep blood for 24 hours at 37°C. Primary identification of the strains as Staphylococcus spp. was conducted using colony morphology and tube test coagulase (Immunolab, Gdańsk, Poland). Then bacterial species were identified using a Bruker ultrafleXtreme MALDI–TOF mass spectrometer. To ensure reliability, each strain underwent duplication with two technical replicates prepared per extract. Sample preparation involved ethanol/formic acid extraction: single colonies were resuspended in water, treated with ethanol (Sigma Aldrich, Saint Louis, USA), and centrifuged. The resulting pellet was then processed with 70% formic acid (Sigma Aldrich, Saint Louis, USA) and acetonitrile (Honeywell, Charlotte, USA) followed by a second centrifugation. One microliter of the supernatant was spotted onto a MALDI target plate, dried and overlaid with 1 µL of a 10 mg/mL HCCA (alpha–cyano–4–hydroxycinnamic acid) matrix solution (acetonitrile:water:TFA, 50:47.5:3.5) (Honeywell, Charlotte, USA). To simplify the collected data, the dendrogram and principal component analysis (PCA) were performed based on the MALDI–TOF spectral peak profiles [71].
4.3. Detection of hrcA and Resistance Genes Using PCR-Based Genotypic Analysis
Additional confirmation of species affiliation and identification of the presence of genes that encode resistance to key antibiotic classes were performed using conventional PCR. Genomic DNA from all strains was extracted using the Genomic Mini AX Staphylococcus Spin kit (A&A Biotechnology, Gdansk, Poland). The analysis was focused on the following genes: hrcA encoding a heat shock repressor for species identification; blaZ encoding a β-lactamase responsible for penicillin resistance; mecA and mecC, which encode penicillin-binding proteins (PBP2a/PBP2c) associated with methicillin resistance; ermA, ermB, and ermC, which encode methyltransferases involved in macrolide-lincosamide-streptogramin B resistance; and the tetracycline resistance genes tetK and tetL (efflux pump genes), as well as tetM and tetO, which encode ribosomal protection proteins. Furthermore, glycopeptide resistance genes vanA and vanB were included, along with mupA, aac(6′)-Ie-aph(2″)-Ia (encoding aminoglycoside acetyltransferase), and fusB (associated with fusidic acid resistance) [37,72,73,74,75,76,77]. Each PCR amplification was performed in 25 µl total reaction volume, consisting of 1 µl DNA template, gene-specific primer pair at 0.2 µM final concentration (Eurofins Genomics Germany GmbH, Ebersberg bei München, Germany), 0.2 mM deoxyribonucleotide triphosphate mix (dNTPs) (Thermo Fisher Scientific, Waltham, USA), 2.5 µl 10 × DreamTaq Green Buffer and 1 U of DreamTaq Green Polymerase (Thermo Fisher Scientific, Waltham, USA). The thermal cycling parameters included an initial denaturation step at 94°C for 3 min, followed by 35 cycles of denaturation at 94°C for 30 s, annealing at temperatures specific for each primer pair 52-60°C for 30 s, and extension at 72°C for 1 min, with a final extension step at 72°C for 5 min. The PCR products were separated by electrophoresis at 100 V on a 2% agarose gel stained with Midori Green DNA Stain (Nippon Genetics Europe GmbH, Dueren, Germany).
4.4. Antimicrobial Phenotypic Testing
The disk diffusion method was used to test phenotypic antibiotic resistance for all isolates. Antimicrobials discs used in the study were (μg/disc): amoxicillin with clavulanic acid (30), ampicillin (10), ciprofloxacin (5), chloramphenicol (30), clindamycin (2), erythromycin (15), fusid acid (10), gentamicin (10), linezolid (30), oxacillin (5), mupirocin (200), penicillin G (10), rifampicin (5), tetracycline (30), tigecycline (15) and trimethoprim/sulfamethoxazole (1,25 / 23,75) (Liofilchem, Abruzzi, Italy) and marbofloxacin (5) [(MASTDISCS® AST (Mast Group Ltd., Liverpool, UK]. Positive control for the disk diffusion method was performed using the reference strain Staphylococcus aureus ATCC 25923, as recommended by CLSI/EUCAST guidelines.
The interpretation of antimicrobial susceptibility results was performed according to the Clinical and Laboratory Standards Institute guidelines. For human isolates, breakpoints defined in CLSI M100, 34th Edition (2024) were used. For isolates obtained from dogs and cats, veterinary-specific breakpoints provided in CLSI VET01S, 7th Edition (2024) were applied [39,40,41].
MIC values were determined using the broth microdilution method in 96-well microtiter plates. The bacterial isolates were inoculated into Mueller-Hinton broth (Oxoid, Basingstoke, UK) containing serial dilutions of antibiotics prepared in sterile distilled water. Final concentrations of the tested antibiotics were as follows: for oxacillin, clindamycin, and tetracycline – 16; 8; 4; 2; 1; 0.5; 0.25; 0.125; 0.0625; and 0.03125 µg/ml; for teicoplanin and vancomycin – 128; 64; 32; 16; 8; 4; 2; 1; and 0.5 µg/ml; and for erythromycin – 32; 16; 8; 4; 2; 1; 0.5; 0.25; 0.125; and 0.0625 µg/ml (TOKU-E, Gent, Belgium) [39,40,41]. Each row of the plate corresponded to a single isolate, and tests were performed separately for each antibiotic. Each plate included a growth control (K+) containing broth and bacterial inoculum (without antibiotic) and a sterility control (K–) containing broth and antibiotic but no bacteria. S. aureus ATCC 29213 was used as the reference control strain. If the highest tested concentration of an antibiotic was insufficient to inhibit bacterial growth evidenced by turbidity in all wells the assay was repeated using an extended dilution series, shifted one level higher. This adjustment was applied to selected isolates, except in the case of vancomycin and teicoplanin, for which the initial concentration range proved sufficient. The inoculum with an optical density of 0.5 McFarland was prepared from a fresh 24-hour culture on blood agar. Plates were incubated aerobically at 37°C for 24 hours. MIC was defined as the lowest antibiotic concentration at which no visible bacterial growth (no turbidity) was observed. Minimum bactericidal concentration (MBC) was determined by subculturing 10 µl from each well without visible growth on Brain Heart Infusion Agar (BHA, Oxoid, Basingstoke, UK). Plates were incubated at 37°C for 24 hours. MBC was defined as the lowest concentration of the antibiotic that resulted in no colony growth, indicating ≥99.9% bacterial kill relative to the original inoculum.
To compare the minimum inhibitory concentration (MIC) and the minimum bactericidal concentration (MBC) for each bacterial isolate and antibiotic tested, the MBC/MIC ratio was calculated. These values were subsequently transformed to a base-2 logarithmic scale using the following formula: log2(MBC/MIC). The use of a logarithmic transformation is justified by the exponential nature of MIC and MBC values, which commonly follow two-fold dilution series (e.g., 0.125, 0.25, 0.5, 1, 2, 4, etc.). The log₂ scale enables proportional and statistically comparable evaluation of the differences between MIC and MBC values. A log₂(MBC/MIC) value of 0 indicates complete equivalence between MIC and MBC, suggesting a bactericidal effect. A value of 1 indicates that the MBC is twice as high as the MIC, while a value of 2 corresponds to a fourfold difference, and so on. This analysis was performed for six antibiotics: vancomycin, teicoplanin, tetracycline, oxacillin, erythromycin, and clindamycin.
4.5. Bacterial Growth Curves and Biofilm Formation
Growth profiles of chosen S. saprophyticus strains (sCa1, sCa8, hCa1, hFe26, hFe14, hFe17, sFe3, sHo2, hHo4, hHo5, sHo1 - strains were selected based on the highest number of resistance genes and the highest phenotypic antibiotic resistances in each of the possible groups tested) and reference strains (S. aureus ATCC 43300, S. epidermidis PCM 1869, S. saprophyticus PCM 2109) were assessed using Brain Heart Infusion (BHI) broth (Oxoid, Basingstoke, UK). Overnight cultures were diluted in 5 mL BHI to an optical density (OD) of approximately 0.1 at 600 nm (Eppendorf BioPhotometer 6131, Hamburg, Germany). Subsequently, 500 µL of each diluted culture was added to triplicate wells of a 48-well plate and incubated with automated shaking at 37°C, 38°C and 39°C for 48 hours. Absorbance at 600 nm was measured using an automated absorbance reader (Tecan Infinite 200 Pro M Nano, Männedorf, Switzerland). Biofilm production by S. saprophyticus strains was assessed using the microtiter plate (MTP) method with crystal violet staining [78]. The S. aureus ATCC 29213 strain was used as a positive control, while the negative control consisted of sterile Tryptone Soya Broth (TSB, Oxoid, Basingstoke, UK). Following incubation and staining, absorbance was measured at 570 nm (A570) using a microplate reader. The cut-off value (OD) for determining biofilm formation was defined as the mean absorbance of the negative control plus two standard deviations. Biofilm-forming ability was classified based on the relationship between A570 values and the OD threshold as follows: Weak biofilm producers: OD < A570 ≤ 2×OD; Moderate biofilm producers: 2×OD < A570 ≤ 4×OD; Strong biofilm producers: A570 > 4×OD.
4.6. Pathogenicity Tests on Galleria mellonella Larvae Model
Overnight cultures of selected S. saprophyticus strains (n=11; sCa1, sCa8, hCa1, hFe26, hFe14, hFe17, sFe3, sHo2, hHo4, hHo5, sHo1) were centrifuged at 3500 RPM. The resulting bacterial pellets were washed three times with sterile PBS buffer (Argenta, Poznan, Poland) and resuspended to achieve optical densities of OD600 = 0.5, OD600 = 0.1, and OD600 = 0.01. The larvae used in the experiment were obtained from a self-maintained culture. Larvae weighing 300 ± 30 mg were selected and placed in groups of 10 (n = 10) on sterile Petri dishes. Each larva was injected with 10 μL of bacterial suspension directly into the hemocoel using a Hamilton Bonaduz 100 μL microliter syringe. For the negative control, larvae (n = 10) were injected with 10 μL of sterile PBS buffer. The experiment was repeated at least three times. Larval survival was monitored over 120 hours at 37 °C post-injection, with the number of live and dead larvae recorded. Larvae were considered dead when they appeared darkened and unresponsive to touch. The data were analyzed statistically using GraphPad Prism software with the Kaplan–Meier algorithm [68]. Survival curves were generated based on the results.
4.7. Statistical Methods
The influence of incubation temperature and host origin on biofilm formation was analyzed using a two–way analysis of ariance (ANOVA) with interaction. Temperature and host origin were included as fixe factor and absorbance A570 nm was used as the dependent variable. Post hoc pairwise comparsions were performer Rusing Tukey’s Honestly Significant Difference (HSD) test to identify significant differences between group means. A p–value <0.05 was considered statistically significant. Statistical analysis was performer Rusing Statistica 13 (TIBCO Softaware Inc).
The interactive plots included in the Supplementary Materials were generated Rusing Python (v3.10) and Plotly (v5.x) libraries. The HTML files allow for dynamic exploration of the results.
Supplementary Materials
The following supporting information can be downloaded at the website of this paper posted on Preprints.org.
References
- Becker, K.; Heilmann, C.; Peters, G. Coagulase–negative staphylococci. Clin. Microbiol. Rev. 2014, 27, 870–926. [PubMed].
- Podkowik, M.; Bania, J.; Schubert, J.; Bystroń, J. Gronkowce koagulazo–ujemne: nowe zagrożenie dla zdrowia publicznego. Życie Wet. 2014, 89, 60–64.
- Huebner, J.; Goldmann, D.A. Coagulase–negative staphylococci: role as pathogens. Annu. Rev. Med. 1999, 50, 223–236. [CrossRef]. [CrossRef]
- Heilmann, C.; Ziebuhr, W.; Becker, K. Are coagulase–negative staphylococci virulent? Clin. Microbiol. Infect. 2019, 25(9), 1071–1080. [CrossRef].
- Otto, M. Virulence factors of coagulase–negative staphylococci. Front. Biosci. 2004, 9, 1295–1309 .[PubMed ]. [CrossRef]
- Raz, R.; Colodner, R.; Kunin, C.M. Who are you Staphylococcus saprophyticus? Clin. Infect. Dis. 2005, 40(6), 896–898. [CrossRef].
- Rupp, M.E.; Soper, D.E.; Archer, G.L. Colonization of the female genital tract with Staphylococcus saprophyticus. J. Clin. Microbiol. 1992, 30(11), 2975–2979. [PubMed]. [CrossRef]
- Białek, B.; Tyski, S.; Hryniewicz, W.; Kasprowicz, A,; Heczko, P.B. Role of Staphylococcus saprophyticus in human infection. Acta Microbiol. Pol. 1990, 39(3–4), 129135. [PubMed].
- Latham, R.H.; Running, K.; Stamm, W.E. Urinary tract infections in young adult women caused by Staphylococcus saprophyticus. JAMA 1983, 250(22), 3036–3066. [PubMed].
- Hovelius, B.; Mårdh, P.A. Staphylococcus saprophyticus as common cause of urinary tract infections. Rev. Infect. Dis. 1984, 6(3), 328–337. [PubMed]. [CrossRef]
- Schneider, P.F.; Riley, T.V. Staphylococcus saprophyticus urinary tract infections: epidemiological data from Western Australia. Eur. J. Epidemiol. 1996, 12, 51–54. [Springer]. [CrossRef]
- Jordan, P.A.; Iravani, A.; Richard, G.A.; Baer, H. Urinary tract infection caused by Staphylococcus saprophyticus. J. Infect. Dis. 1980, 142, 510–515. [CrossRef]. [CrossRef]
- Garduño, E.; Márquez, I.; Beteta, A.; Said, I.; Blanco, J.; Pineda, T. Staphylococcus saprophyticus causing native valve endocarditis. Scand. J. Infect. Dis. 2005, 37(9), 690–691. [PubMed]. [CrossRef]
- Tamura, D.; Yamane, H.; Tabakodani, H.; Yamagishi, H.; Nakazato, E.; Kimura, Y.; Shinjoh, M.; Yamagata, T. Clinical impact of bacteremia due to Staphylococcus saprophyticus. Adv. Infect. Dis. 2021, 11, 6–12. [CrossRef]. [CrossRef]
- Hur, J.; Lee, A.; Hong, J.; Jo, W.Y.; Cho, O.H.; Kim, S.; Bae, I.G. Staphylococcus saprophyticus bacteremia originating from urinary tract infections: a case report and literature review. Infect. Chemother. 2016, 48(2), 136–139. [PubMed]. [CrossRef]
- Anderson, J.D.; Clarke, A.M.; Anderson, M.E.; Isaac–Renton, J.L.; McLoughlin, M.G. urinary tract infections due to Staphylococcus saprophyticus biotype 3. CMAJ 1981, 124(4), 415–418. [PubMed].
- Golledge, C.L. Staphylococcus saprophyticus bacteremia. J. Infect. Dis. 1988, 157(1), 215. [PubMed].
- Kline, K.A.; Kau, A.L.; Chen, S.L.; Lim, A.; Pinkner, J.S.; Rosch, J.; Nallapareddy, S.R.; Murray, B.E.; Henriques–Normark, B.; Beatty, W.; Caparon, M.G.; Hultgren, S.J. Characterization of a novel murine model of Staphylococcus saprophyticus urinary tract infection reveals roles for Ss pans Sdrl in virulence. Infect. Immun. 2010, 78(5), 1943–1951. [CrossRef].
- Hedman, P.; Ringertz, O.; Lindström, M.; Olsson, K. The origin of Staphylococcus saprophyticus from cattle and pigs. Scand. J. Infect. Dis. 1993, 25(1), 57–60. [CrossRef].
- Hedman, P.; Ringertz, O.; Erksson, B.; Kvarnfors, P., Andersson, M.; Bengtsson, L.; Olsson, K. Staphylococcus saprophyticus found to be a common contaminant of food. J. Infect. 1990, 21(1), 11–19. [PubMed]. [CrossRef]
- Penna, B.; Varges, R.; Martins, R.; Martins, G.; Lilenbaum, W. In vitro antimicrobial resistance of staphylococci isolated from canine urinary tract infection. Can. Vet. J. 2010, 51(7), 738–742. [PubMed].
- Hauschild, T.; Wójcik, A. Species distribution and properties of staphylococci from canine dermatitis. Res. Vet. Sci. 2007, 82(1), 1–6. [CrossRef]. [CrossRef]
- Mossakowski, P.; Lew–Kojrys, S. Nietypowy rodzaj kamieni moczowych u psa – węglan apatytu. Mag. Wet. 2023; 11.
- Guo, C.; Sun, W.; Cheng, W.; Chen, N.; Lv, Y. Isolation and characterization of Staphylococcus saprophyticus responsible for the death of two six–banded armadillos (Euphractus sexcinctus). Vet. Rec. Case Rep. 2024, 12(1). [CrossRef]. [CrossRef]
- Miszczak, M.; Korzeniowska–Kowal, A.; Wzorek, A.; Gamian, A.; Rypuła, K.; Bierowiec, K. Colonization of methicillin–resistant Staphylococcus species in healthy and sick pets: prevalence and risk factors. BMC Vet. Res. 2023, 19(1), 85. [CrossRef]. [CrossRef]
- Kloos, W.E.; Bannerman, T.L. Update on clinical significance of coagulase–negative staphylococci. Clin. Microbiol. Rev. 1994, 7(1), 117–140. [PubMed].
- Huebner, J.; Goldmann, D.A. Coagulase–negative staphylococci: role as pathogens. Annu. Rev. Med. 1999, 50, 223–236. [CrossRef]. [CrossRef]
- Schulin, T.; Voss, A. Coagulase–negative staphylococci as a cause of infections related to intravascular prosthetic devices: limitations of present therapy. Clin. Microbiol. Infect. 2001, 7($), 1–7. [CrossRef]. [CrossRef]
- Giormezis, N.; Kolonitsiou, F.; Foka, A.; Drougka, E.; Liakopoulos, A.; Makri, A.; Papanastasiou, A.D.; Vogiatzi, A.; Dimitriou, G.; Marangos, M.; Christofidou, M.; Anastassiou, E.D.; Petinaki, E.; Spiliopoulou, I. Coagulase–negative staphylococcal bloodstream and prosthetic–device–associated infections: the role of biofilm formation and distribution of adhesion and toxin genes. J. Med. Microbiol. 2014, 63(11), 1500–1508. [CrossRef].
- May, L.; Klein, E.Y.; Rothman, R.E.; Laxminarayan, R. Trends in antibiotic resistance in coagulase–negative staphylococci in the United States 199 to 2012. Antimicrob. Agents Chemother. 2014, 58(3), 1404–1409. [CrossRef]. [CrossRef]
- Marincola, G.; Liong, O.; Schoen, C.; Abouelfetouh, A.; Hamdy, A.; Wencker, F.D.R.; Marciniak, T.; Becker, K.; Köck, R.; Ziebuhr, W. Antimicrobial resistance profiles of coagulase–negative staphylococci in community–based healthy individuals in Germany. Fron. Public Health 2021, 9, 684456. [CrossRef].
- Otto, M. Coagulase–negative staphylococci as reservoir of genes facilitating MRSA infection. Bioessays. 2012, 19, 35(1), 4–11. [PubMed]. [CrossRef]
- Huang, Y.S.; Lai, L.C.; Chen, Y.A.; Lin, K.Y.; Chou, Y.H.; Chen, H.C.; Wang, S.S.; Wang, J.T.; Chang, S.C. Colonization with multidrug–resistant organism among healthy adults in the community setting: prevalence, risk factors, and composition of gut microbiome. Fron. Microbiol. 2020, 11, 1402. [CrossRef].
- Diop, M.; Bassoum, O.; Ndong, A.; Wone, F.; Tamouh, A.G.; Ndoye, M.; Youbong, T.; Daffé, S.M.M.; Radji, R.O.; Gueye, M.W.; Lakhe, N.A.; Fall, B.; Ba, P.S.; Faye, A. Prevalence of multidrug–resistant bacteria in healthcare and community settings in West Africa: systematic review and meta–analysis. BMC Infectious Disease. 2025, 292. [CrossRef]. [CrossRef]
- Cristino, J.A.; Pereira, A.T.; Andrade, L.G. Diversity of plasmids in Staphylococcus saprophyticus from urinary tract infections ion woman. Epidemiol. Infect. 1989, 102(3), 413–419. [PubMed].
- Vickers, A.A.; Chopra, I.; O’Neill, A.J. Intrinsic novobiocin resistance in Staphylococcuus saprophyticus. Antimicrob. Agents. Chemother. 2007, 51(12), 4484–4485. [CrossRef]. [CrossRef]
- De Pavia–Santos, W.; Barros, E.M.; Santos de Sousa, V.; Silva Laport, M.; Giambiagi–deMarval, M. Identification of coagulase–negative Staphylococcus saprophyticus by PCR based on the heat–shock repressor encoding hrcA gene. Diagn. Microbiol. Infect. Dis. 2016, 86(3), 253–256. [PubMed].
- Clinical and Laboratory Standards Institute (CLSI). Method for Dilution Antimicrobial Susceptibility Test for Bacteria That Grow Aerobically; Approved Standard, 10th ed.; CLSI Document M07–Ed10; CLSI: Wayne, PA, USA, 2024.
- Clinical and Laboratory Standards Institute (CLSI). Performance Standards for Antimicrobial Disk and Dilution Suseptibility Test for Bacteria Isolated from Animals, 7th ed.; CLSI Supplement VET01S; CLSI: Wayne, PA, USA, 2024.
- Clinical and Laboratory Standards Institute (CLSI). Performance Standards for Antimicrobial Susceptibility Testing, 34th ed.; CLSI Supplement M100; CLSI: Wayne, PA, USA, 2024.
- Marques, C.; Belas, A.; Franco, A.; Aboim, C.; Telo Gama, L.; Pomba, C. Increase in antimicrobial resistance and emergence of major international high–risk clonal lineages in dogs and cats with urinary tract infection: 16 year retrospective study. BMC Vet. Res. 2022, 18(1), 1–12. [PubMed]. [CrossRef]
- Widerström, M.; Wiström, J.; Sjöstedt, A.; Monsen, T. Coagulase–negative staphylococci: update on the molecular epidemiology and clinical presentation with a focus on Staphylococcus saprophyticus. Eur. J. Clin. Microbiol. Infect. Dis. 2012, 31(7), 1699–1704. [PubMed].
- Cunha, M.L.R.S.; Sinzato, Y.K.; Silveira, L.V.A. Comparsion of methods for the identification of coagulase–negative staphylococci. Mem. Inst. Oswaldo Cruz 2004, 99(8), 855–860. [CrossRef].
- Kleeman, K.T.; Bannerman, T.L. Evaluation of the Vitek System Gram–positive identification card for species identification of coagulase–negative staphylococci. J. Clin. Microbiol. 1993, 31(5), 1322–1325. [PubMed].
- Mlaga, K.D.; Dubourg, G.; Abat, C.; Chaudet, H.; Lotte, L.; Diene, S.M.; Raoult, D.; Ruimy, R.; Rolain, J.m. Using MALDI TOF MS typing method to decipher outbreak: the case of Staphylococcus saprophyticus causing urinary tract infections (UTIs) in Marseille, France. Eur. J. Clin. Microbiol. Infect. Dis. 2017, 36, 2331 2338. [PubMed]. [CrossRef]
- Dubois, D.; Leyssene, D.; Chacornac, J.P.; Kostrzewa, M.; Schmit, P.O.; Talon, R.; Bonnet, R.; Delmas, J. Identification of a variety of Staphylococcus species by matrix assisted laser desorption ionization time of flight mass spectrometry. J. Clin. Microbiol. 2010, 48(3), 941 945. [PubMed]. [CrossRef]
- Zhang, K.; Potter, R.F.; Marino, J.; Muenks, C.E.; Lammers, M.G.; Dien B.J.; Dingle, T.C.; Humphries, R.; Westblade, L.F.; Burnham, C.A.D.; Dantas, G. Comparative genomics reveals the correlations of stress response genes and bacteriophages in developing antibiotic resistance of Staphylococcus saprophyticus. mSystem. 2023, 8(6). [PubMed]. [CrossRef]
- Youngblom, M.A.; imhoff, M.R.; Smyth, L.M.; Mohamed, M.A.; Pepperell, C.S. Portrait of a generalist bacterium: pathoadaptation, metabolic specialization and extreme environments shape diversity of Staphylococcus saprophyticus. bioRxiv. 2023. [CrossRef].
- Lawal, O.U.; Fraqueza, M.J.; Bouchami, O.; Worning, P.; Bartels, M.D.; Gonçalves, M.L.; Paixão, P.; Gonçalves, E.; Toscano, C.; Empel, J.; Urbaś, M.; Domínguez, M.A.; Westh, H.; de Lancastre, H.; Miragaia, M. Foodborne origin and local and global spread of Staphylococcus saprophyticus causing human urinary tract infections. Emerg. Infect. Dis. 2021, 27, 880 893. [CrossRef]. [CrossRef]
- Sousa, V.S.; Rabello, R.F.; Dias, R.C.S.; Martins, I.S.; Santos, L.B;G.S.; Alves, E.M.; Riley, L.W.; Moreira, B.M. Time based distribution of Staphylococcus saprophyticus pulsed field gel electrophoresis clusters in community acquired urinary tract infections. Mem. Inst. Oswaldo Cruz. 2013, 108(1), 73 76. [CrossRef].
- Rafiee, M.; Tabarraei, A.; Yazdi, M.; Mohebbi, A.; Ghaemi, E.A. Antimicrobial resistance patterns of Staphylococcus saprophyticus isolates causing urinary tract infections in Gorgan, North of Iran. Med. Lab. J. 2023, 17(2), 33 38. [CrossRef]. [CrossRef]
- Khan, F.; Haadi, S.; Khan, F.A.; Shakir, J.; Shafiq, M.; Tariq, S.; Ahmad, J.; Afzal, Q.; Khan, A.A.; Afridi, P. Antibiotic susceptibility profile of Staphylococcus saprophyticus isolated from clinical samples in Peshawar, Pakistan. The Sciencetech. 2023, 4(1), 75-80. [CrossRef].
- Marepalli, N.R.; Nadipelli, A.R.; Jain, M.K.; Parnam, L.S.; Vashyani, A. Antibiotic resistance in urinary tract infections: a retrospective observational study. Cureus. 2024. [CrossRef]. [CrossRef]
- Ferreira, A.M.; Bonesso, M.F.; Mondelli, A.L.; Camargo, C.H.; Cunha, M.L.R.S. Oxacillin resistance and antimicrobial susceptibility profile of Staphylococcus saprophyticus. Chemotherapy. 2002, 48, 267-270. [CrossRef].
- Chambers, H.F. The changing epidemiology of staphylococcus aureus? Emerging Infectious Diseases. 2001;7(2):178–182. [CrossRef].
- Lee, B.; Jeong, D.W.; Lee, J.H. Genetic diversity and antibiotic resistance of Staphylococcus saprophyticus from fermented foods and clinical samples. J. Korean Soc. Appl. Biol. Chem. 2015, 58, 659–668. [CrossRef]. [CrossRef]
- Chua, K.Y.L.; Yang, M.; Wong, L.; Knox, J.; Lee, L.Y. Antimicrobial resistance and its detection in Staphylococcus saprophyticus urinary isolates. Pathology 2023, 55, 1013–016. [CrossRef]. [CrossRef]
- Schmitz, F.J.; Theis, S.; Fluit, A.C.; Verhoef, J.; Heinz, H.P.; Jones, M.E. Antimicrobial susceptibility of coagulase–negative staphylococci isolated between 1991 and 1996 from a German university hospital. Clin. Microbiol Infect. 1999, 5(7), 436–439. [PubMed]. [CrossRef]
- Hiramatsu, K.; Katayama, Y.; Matsuo, M.; Sasaki, T.; Morimoto, Y.; Sekiguchi, A.; Baba, T. Multi-drug-resistant Staphylococcus aureus and future chemotherapy. J Infect Chemother. 2014;20(10):593–601 [ PubMed]. [CrossRef]
- Archer, N.K.; Mazaitis, M.J.; Costerton, J.W.; Leid, J.G.; Powers, M.E.; Shirtliff, M.E. Staphylococcus aureus biofilms: properties, regulation and roles in human disease. Virulence. 2011, 2(5), 445–459. [PubMed].
- Yang, Y.; Li, Y.; Wang, X.; Zhang, H.; Liu, J. Antimicrobial resistance and virulence profiles of staphylococci from clinical bovine mastitis in Ningxia Hui autonomous region of China. Frontiers in Microbiology, 2023, 14. [CrossRef].
- Amiri, R.; Alipour, M.; Engasi, A.K.; Amiri, A.R.; Mofarrah, R. Monitoring and investigation of resistance genes gyrA, parC, blaZ, ermA, ermB and ermC in Staphylococcus saprophyticus isolated from urinary tract infections in mazandaran province, Iran. Infect. Epidemiol. Microbiol. 2023, 9, 117–125. [CrossRef].
- Yang, Y.; Hu, X/; Cai, S.; Hu, N.; Yuan, Y.; Wu, Y.; Wang, Y.; Mi. J.; Liao, X. Pet cats may shape the antibiotic resistome of their owner’s gut and living environment. Microbiome 2023, 11, 235. [ PubMed ]. [CrossRef]
- Guardabassi, L.; Schwarz, S.; Lloyd, D.H. Pet animals are reservoirs of antimicrobial resistant bacteria. Review. J. Antimicrob. Chemotherapy. 2004, 54(2), 321–332. [CrossRef]. [CrossRef]
- Yazdankhah, S.P.; Asli, A.W.; Sorum, H.; Oppegaard, H.; Sunde, M. Fusidic acid resistance, mediated by fusB in bovine coagulase–negative staphylococci. J. Antimicrob. Chemother. 2006, 58(6), 1254–1256. [CrossRef].
- Patel, J.B.; Gorwitz, R.J.; Jernigan, J.A. Mupirocin resistance. Clin. Infect. Dis. 2009, 49(6), 935–941. [CrossRef ].
- Doudoulakakis, A.; Spiliopoulou, I.; Spyridis, N.; Tsabouri, S.; Ntziora, F.; Pana, Z.D.; Michail, G. Emergence of a Staphylococcus aureus clone resistant to mupirocin and fusidic acid carrying exotoxin genes and causing mainly skin infections. J. Clin. Microbiol. 2017, 55(8), 2529–2535. [CrossRef].
- Tsai, C.J.Y.; Loh, J.M.S.; Proft, T. Galleria mellonella infection models for the study of bacterial diseases and for antimicrobial drug testing. Virulence. 2016, 7(3), 214–229. [CrossRef].
- Koksal, F.; Yasar, H.; Samasti, M. Antibiotic resistance patterns of coagulase–negative Staphylococcus strains isolated from blood cultures of septicemic patients in Turkey. Microbiological Research. 2009, 164(4), 404–420. [CrossRef]. [CrossRef]
- Bierowiec, K.; Korzeniowska–Kowal, A.; Wzorek, A.; Rypuła, K.; Gamian, A. Prevalence of Staphylococcus species colonization in healthy and sick cats. Biomed Res int. 2019. [PubMed]. [CrossRef]
- Abdel Samad, R.; Al Disi, Z.; Mohammad Ashfaq, M.Y.; Wahib, S.M.; Zouari, N. The use of principle component analysis and MALDI-TOF MS for the differentiation of mineral forming Virgibacillus and Bacillus species isolated from sabkhas. RSC Adv. 2020, 10, 14606–14616. [CrossRef]. [CrossRef]
- Amini, R.; As, A.; Chung, C.; Jahanshiri, F.; Wong, C.B.; Poyling, B.; Hematian, A.; Sekawi, Z.; Zargar, M.; Jalilian, F.A. Circulation and transmission of methicillin resistant Staphylococcus aureus among college students in Malaysia (cell phones as reservoir). Asian Biomedicine. 2012, 6(5), 659–673.
- Ullah, F.; Malik, S.A.; Ahmed, J.; Ullah, F.; Shah, S.M.; Ayaz, M.; Hussain, S.; Khatoon, L. Investigation of the genetic basis of tetracycline resistance in staphylococcus aureus from Pakistan. Tropical Journal of Pharmaceutical Research, 2012, 11(6), 925–931. [CrossRef]
- Saadat, S.; Solhjoo, K.; Norooz–Nejad, M.J.; Kazemi, A. VanA and VanB positive vancomycin resistant staphylococcus aureus among clinical isolates in shiraz, south iran. Oman Med J. 2014, 29(5), 335–339. [PubMed]. [CrossRef]
- Ciesielczuk, H.; Xenophontos, M.; Lambourne, J. Methicillin resistant staphylococcus aureus harboring mecC still eludes us in east London, united Kingdom. J Clin Microbiol. 2019, 57(6). [PubMed].
- O’neill, A.; Chopra, I. Molecular basis of fusB mediated resistance to fusidic acid in Staphylococcus aureus. Molecular Microbiology. 2006, 59(2), 664–676. [CrossRef].
- Tasara, T.; Cernela, N.; Stephan, R. Function impairing mutations in blaZ and blaR genes of penicillin susceptible Staphylococcus aureus strains isolated from bovine mastitis. Veterinary Microbiology. 2017, 211, 52–56. [CrossRef]
- Płoneczka-Janeczko K, Bierowiec K, Lis P, Rypuła K. Identification of bap and icaA genes involved in biofilm formation in coagulase-negative staphylococci isolated from feline conjunctiva. Vet Res Commun. 2014;38(4). https://pmc.ncbi.nlm.nih.gov/articles/PMC4231282/ [PubMed]. [CrossRef]
Figure 1.
(A) Visual depiction of the closeness of individual spectra of S. saprophyticus and chosen referential strains obtained with MALDI-TOF MS analysis. (B) PCA clustering of MALDI Biotyper spectra of S. saprophyticus isolates and chosen referential strains.
Figure 1.
(A) Visual depiction of the closeness of individual spectra of S. saprophyticus and chosen referential strains obtained with MALDI-TOF MS analysis. (B) PCA clustering of MALDI Biotyper spectra of S. saprophyticus isolates and chosen referential strains.
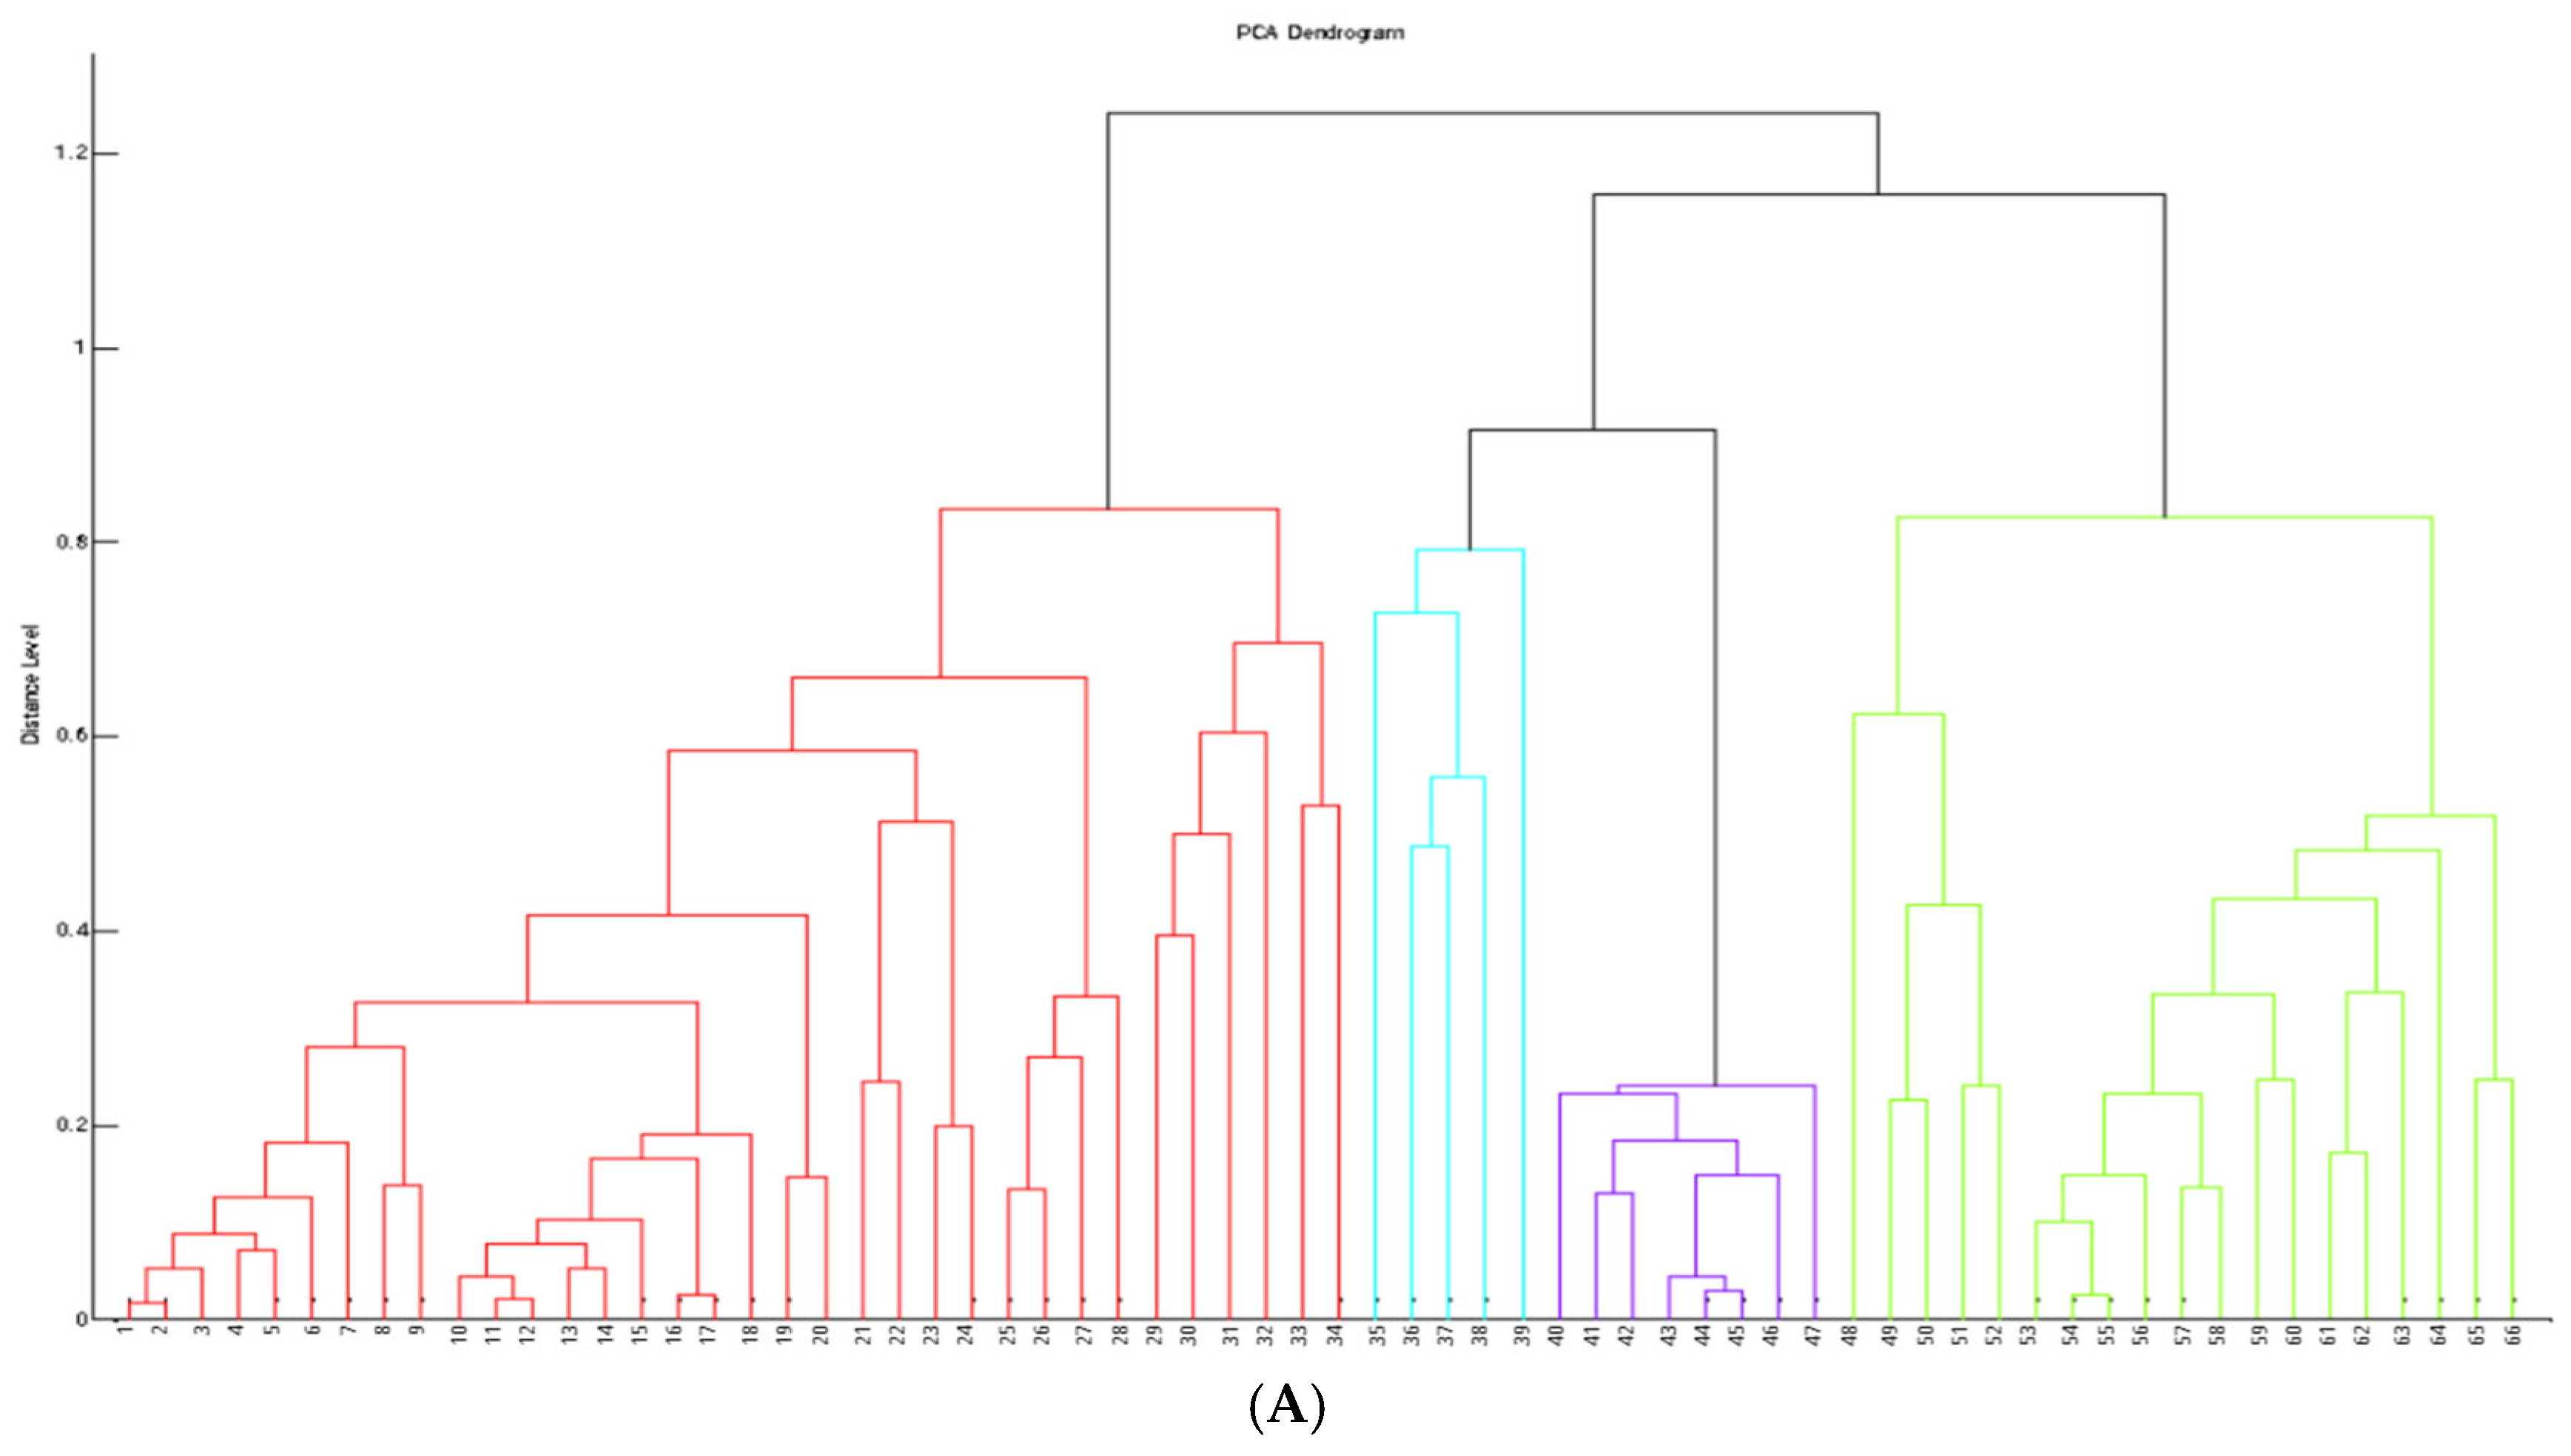
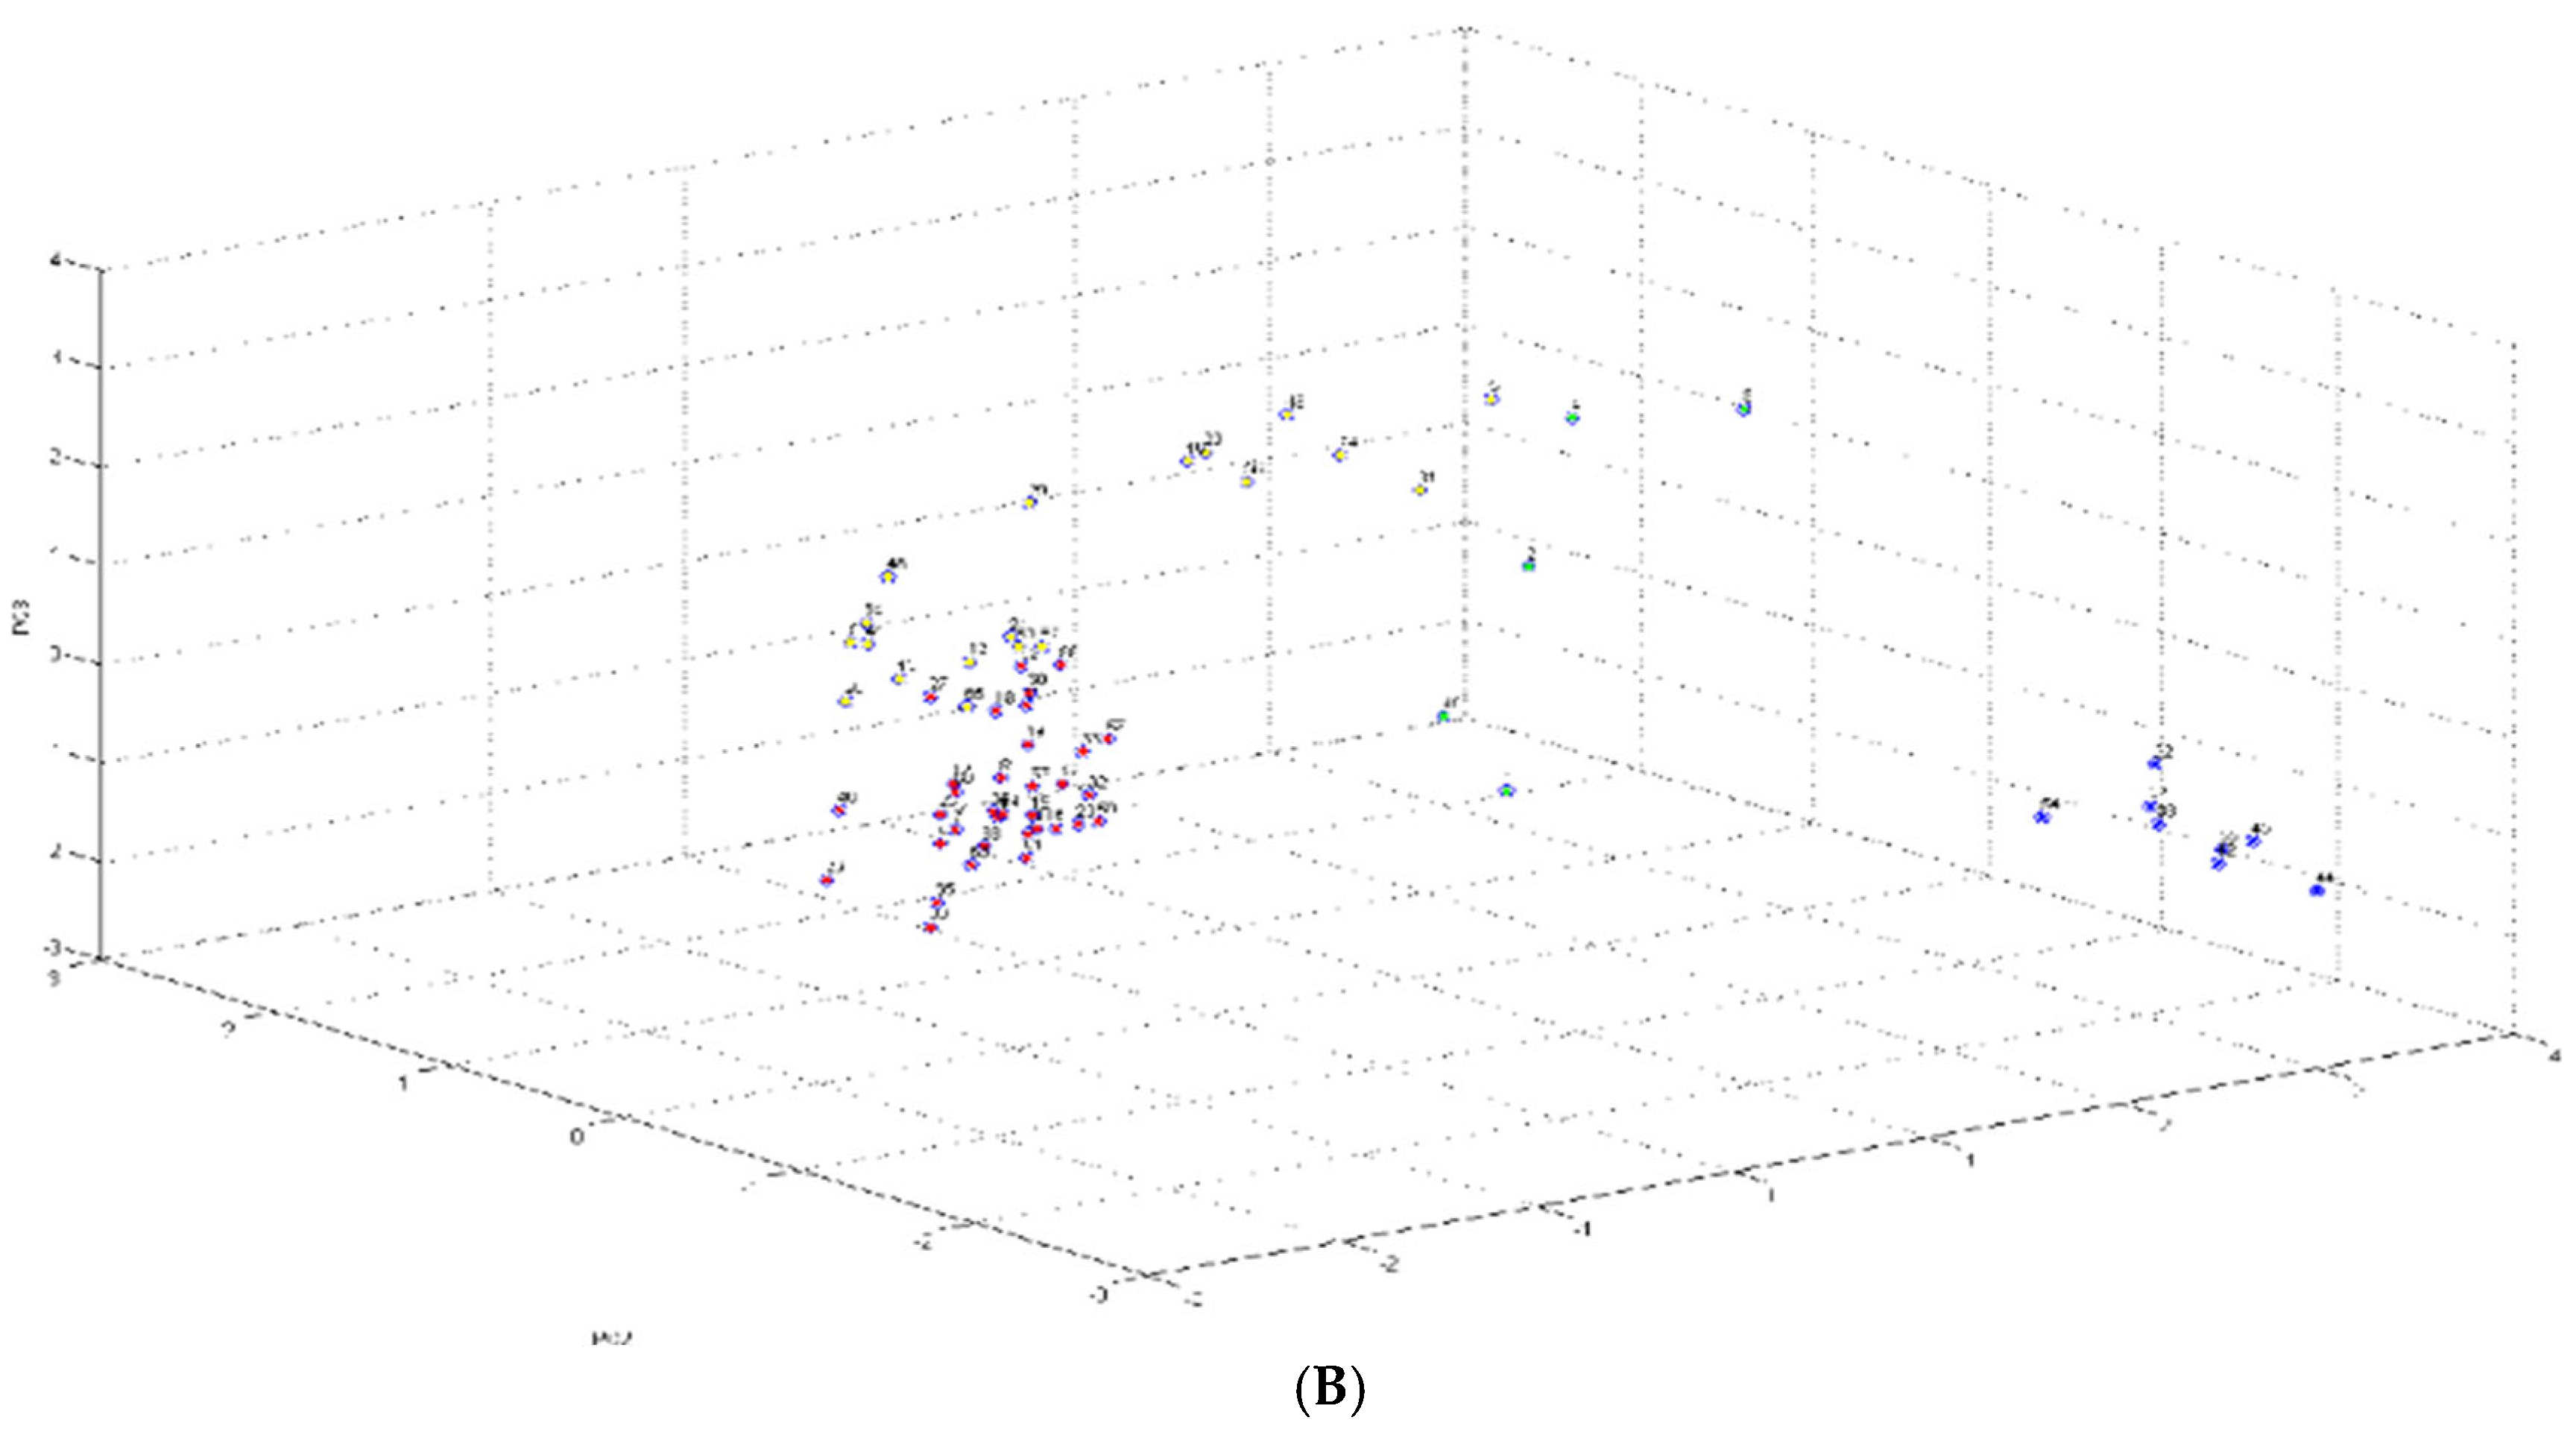
Figure 2.
Heatmap illustrating logarithmic differences (log2) between the minimum bactericidal concentration (MBC) and minimum inhibitory concentration (MIC) for 61 strains tested against six antibiotics: clindamycin, erythromycin, oxacillin, teicoplanin, tetracycline and vancomycin. Darker colors indicate a greater difference between MBC and MIC values (higher concentrations were required to achieve bactericidal effects). Lighter shades reflect smaller MBC/MIC differences (stronger bactericidal efficacy). Exact log2(MBC/MIC) bvalues are numerically displayed on the heatmap.
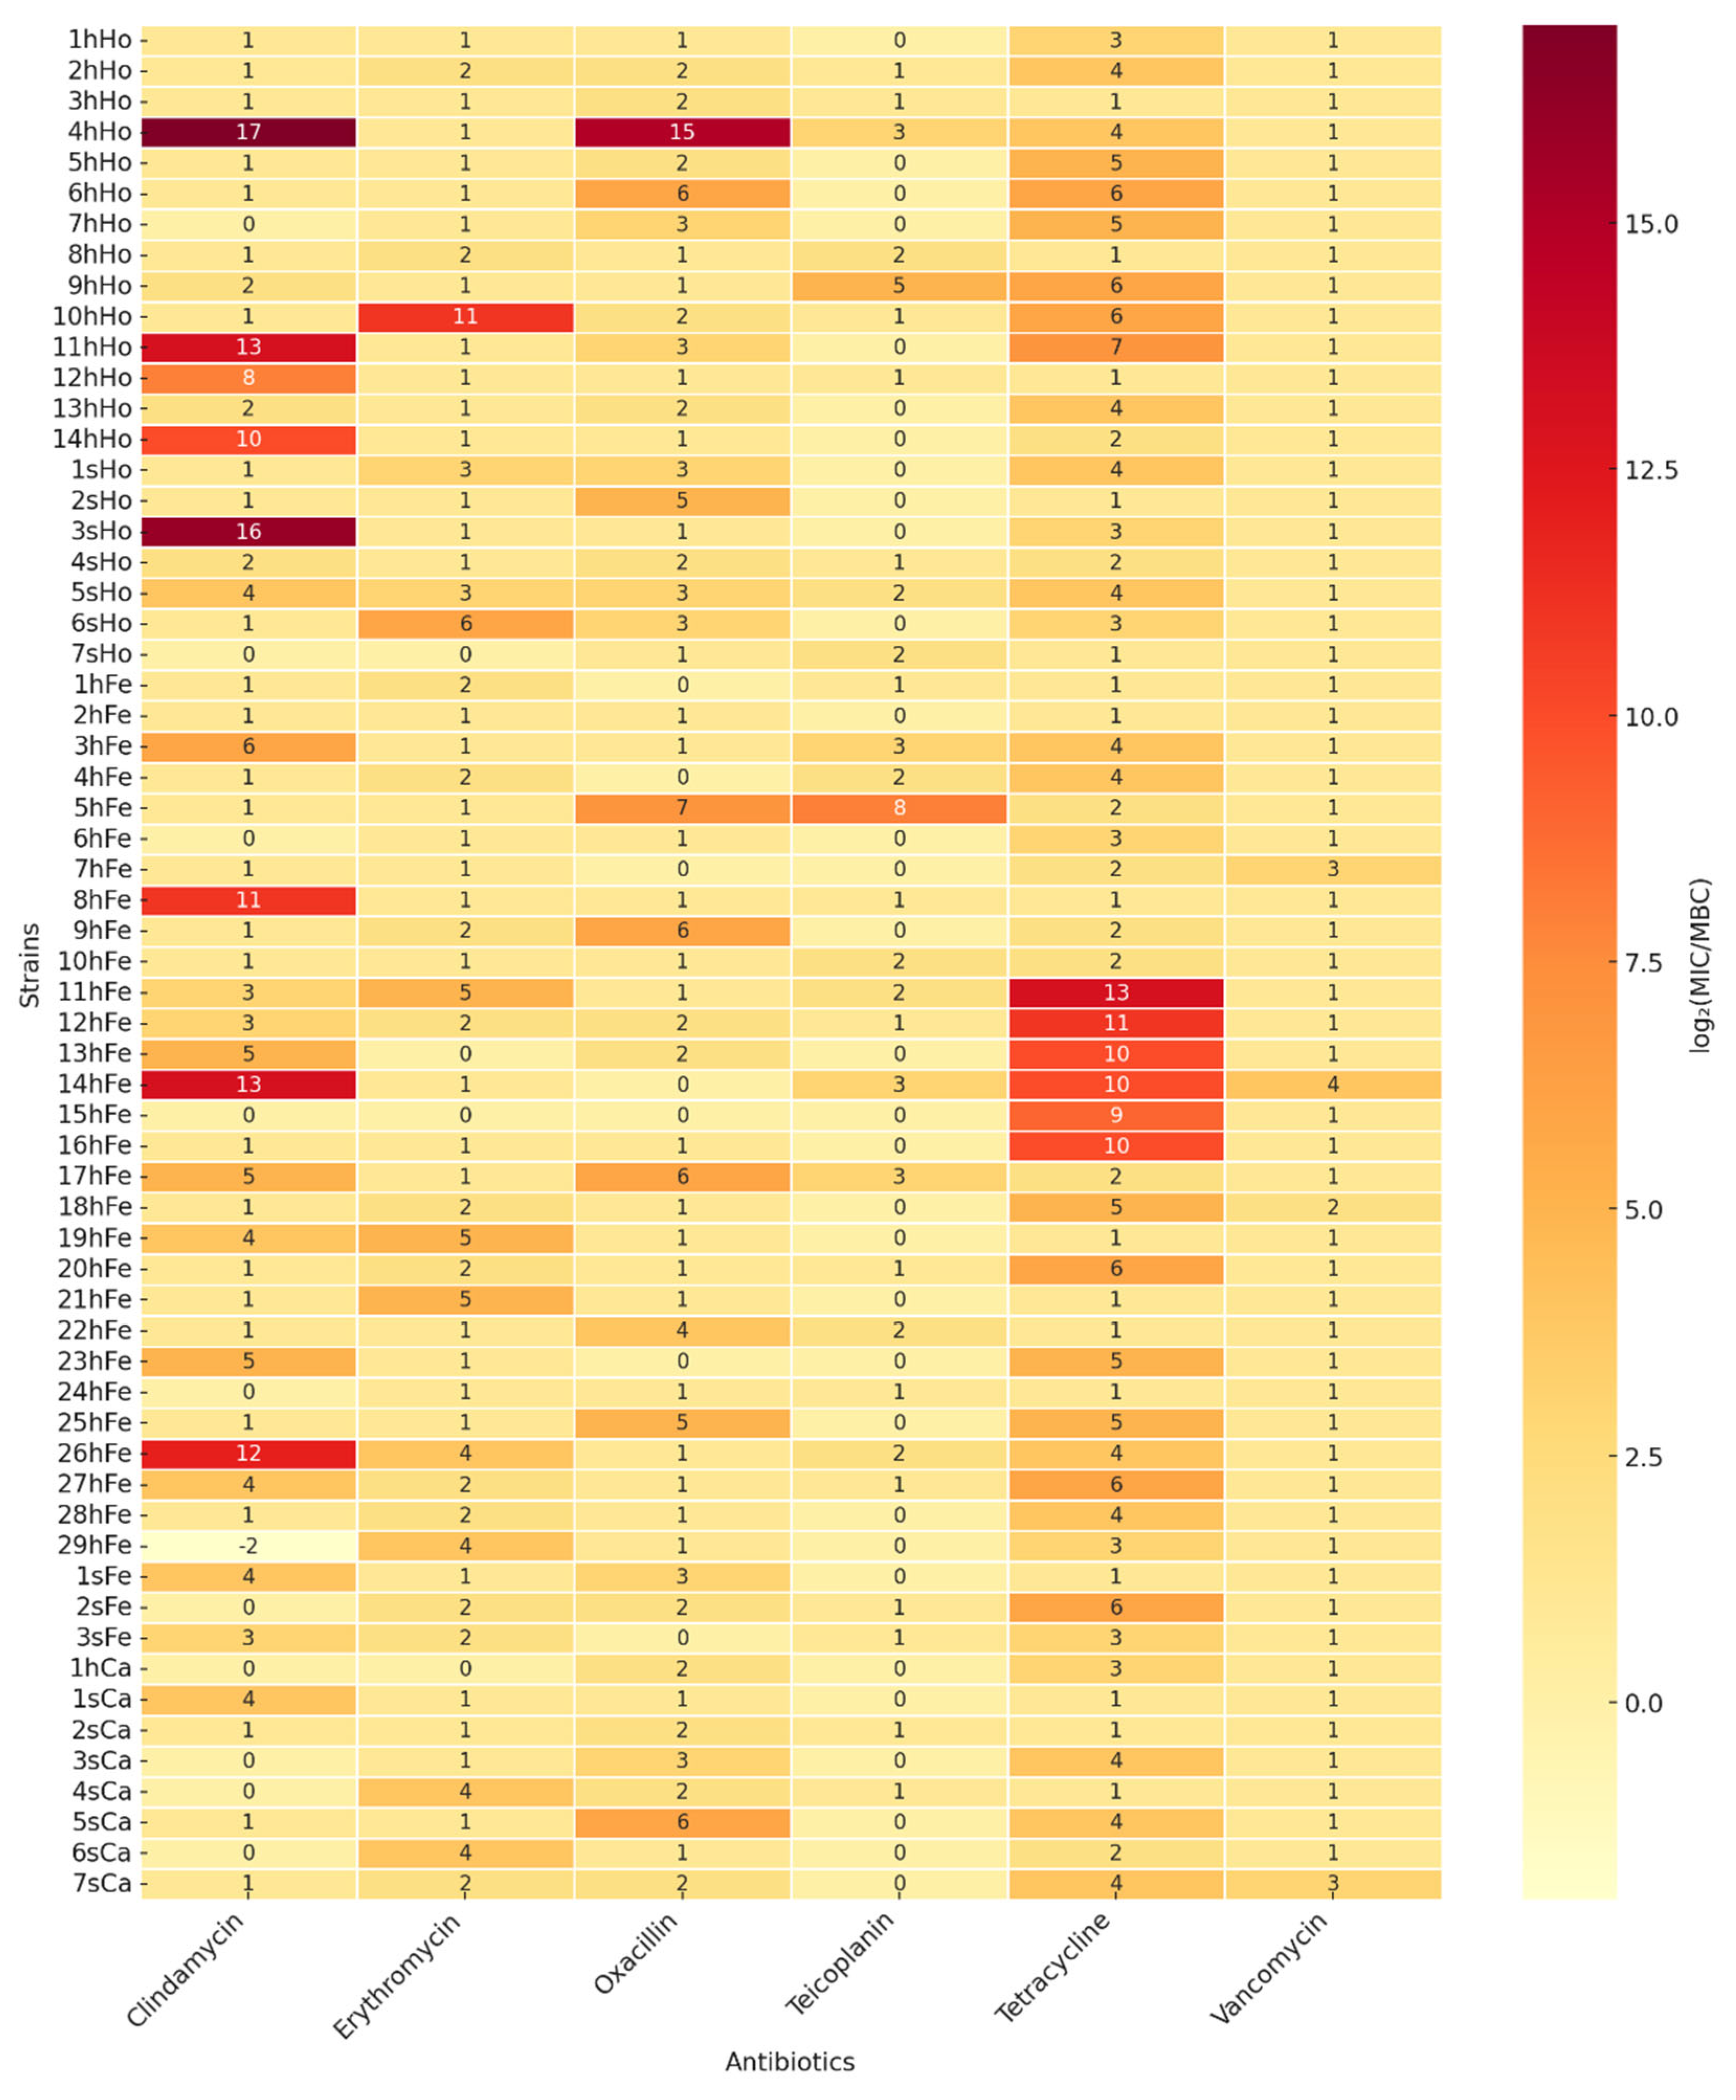
Figure 3.
A. Distribution of S. saprophyticus isolates by biofilm forming strength (weak, medium, strong) across different origin (human, feline, canine) and incubation temperature (37℃, 38℃, 39℃). Bars represent the proportion (%) of strains within each group. The number of strains (n) and their percentage of the group are indicated inside the bars. B. Biofilm forming quantified by absorbance at 570 nm after 34–hours incubation at 37℃, 38℃ and 39℃.Statistical significance was determined by two–way aANOVA and Tukey’s post hoc test. Differencecs were considered statistically significant at p<0.05 [*p<0.05; **p<0.01].
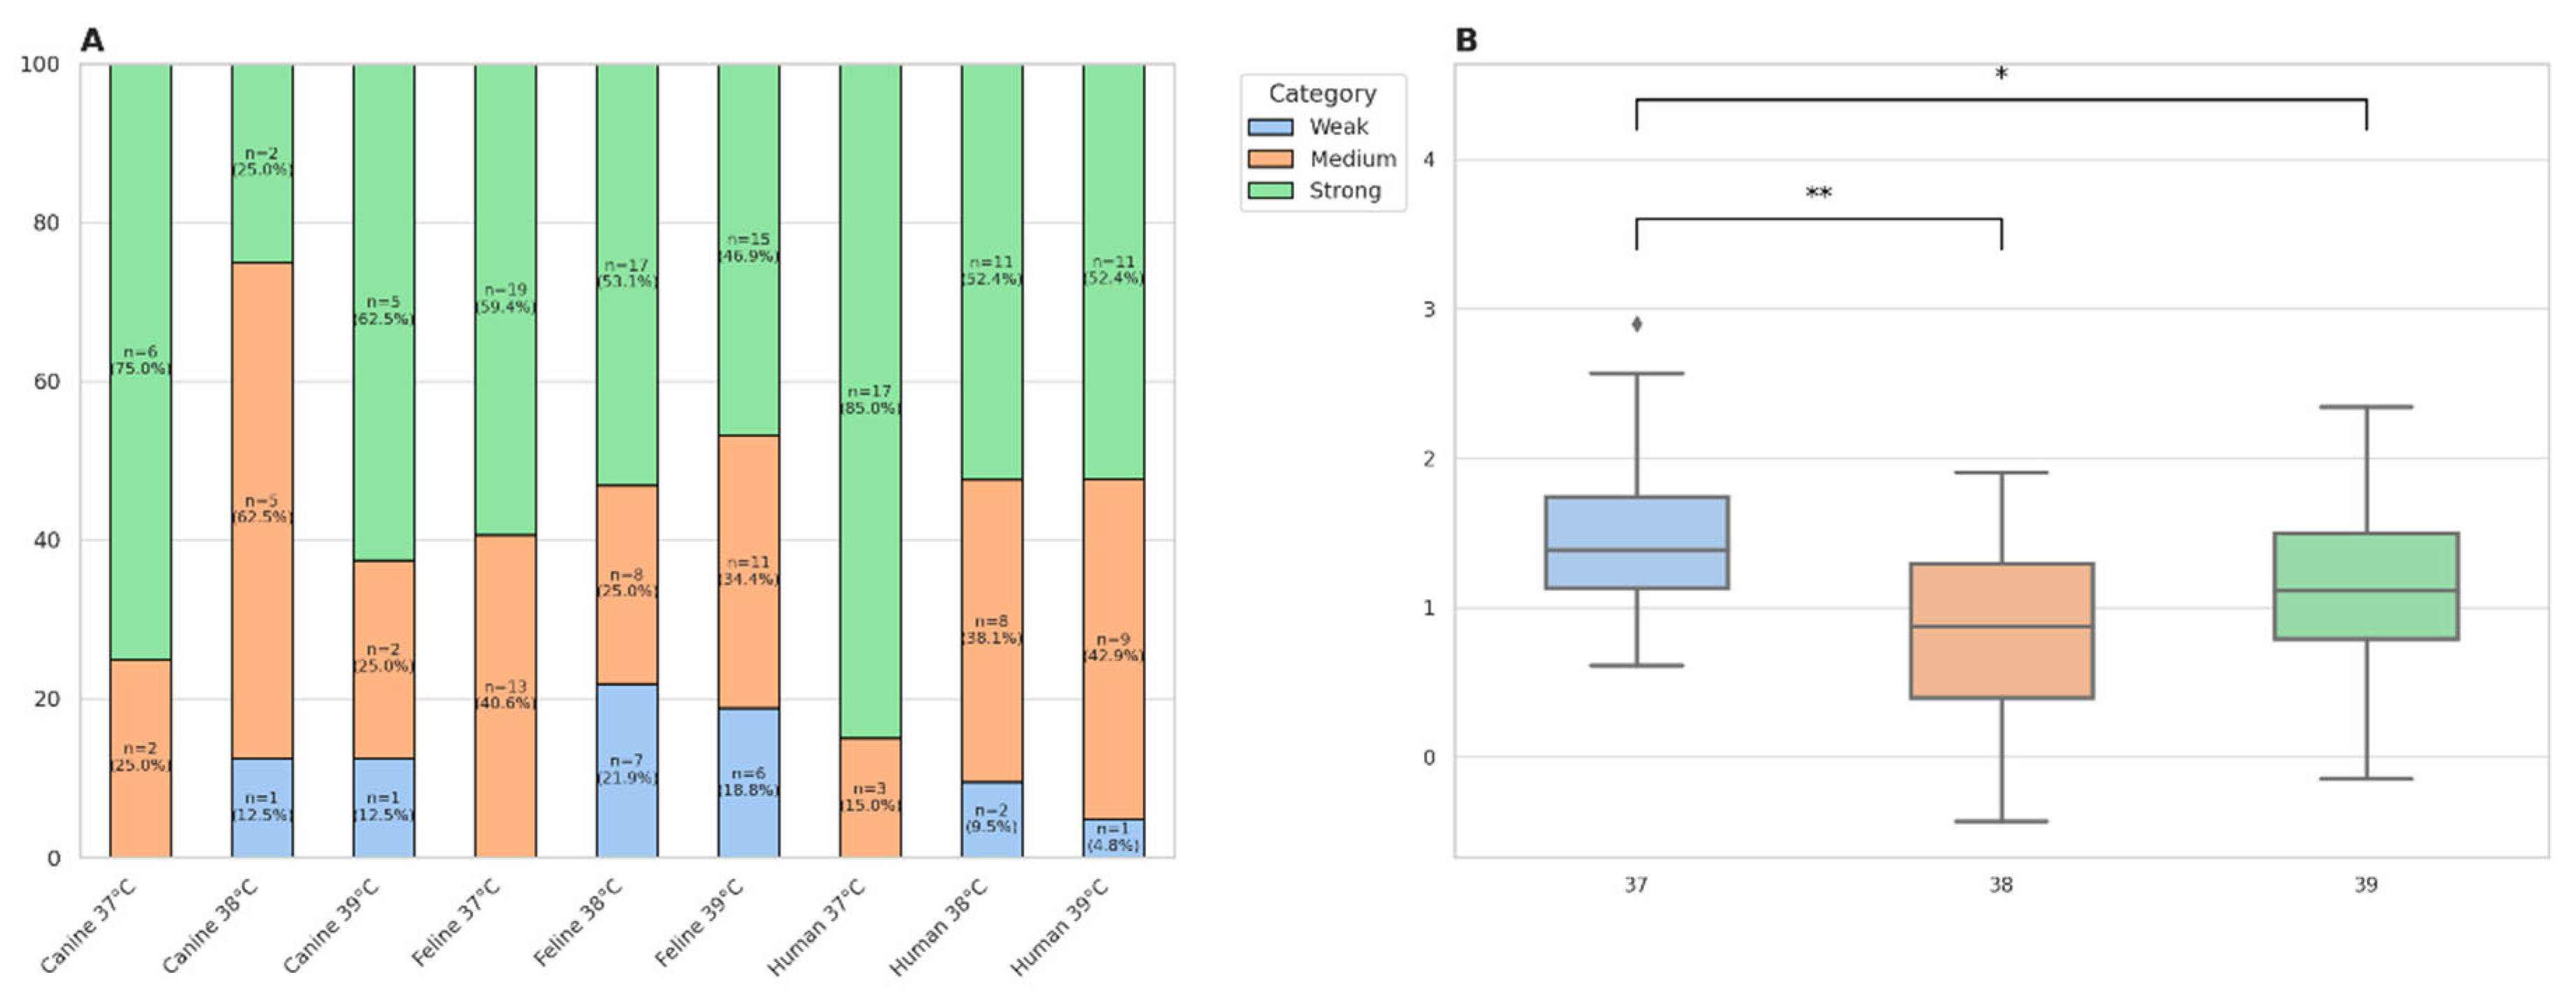

Table 1.
Resistance (%) to selected antibiotics of S. saprophyticus strains from humans and animals determined by the disk–diffusion method. A bar chart comparing resistance to a given antibiotic in each of the group studied.
Table 1.
Resistance (%) to selected antibiotics of S. saprophyticus strains from humans and animals determined by the disk–diffusion method. A bar chart comparing resistance to a given antibiotic in each of the group studied.
| Antimicrobial agent tested | |||||||||||||||||
|---|---|---|---|---|---|---|---|---|---|---|---|---|---|---|---|---|---|
| Group | AMP | AMC | MUP | P | FD | MAR | CIP | OX | LZD | DA | E | C | RD | CN | SXT | TGC | TET |
| Healthy humans (n=14) |
7 (50.0%) |
2 (14.29%) |
0 (0.0%) |
5 (35.71%) |
4 (28.57%) |
1 (7.14%) |
0 (0.0%) |
6 (42.86%) |
0 (0.0%) |
1 (7.14%) |
7 (50.0%) |
2 (14.29%) |
0 (0.0%) |
1 (7.14%) |
0 (0.0%) |
1 (7.14%) |
0 (0.0%) |
| Sick humans (n=7) |
3 (42.86%) |
0 (0.0%) |
0 (0.0%) |
1 (14.29%) |
3 (42.86%) |
0 (0.0%) |
1 (14.29%) |
3 (42.86%) |
0 (0.0%) |
0 (0.0%) |
4 (57.14%) |
0 (0.0%) |
0 (0.0%) |
0 (0.0%) |
0 (0.0%) |
0 (0.0%) |
1 (14.29%) |
| Healthy cats (n=29) |
6 (20.69%) |
2 (6.9%) |
2 (6.9%) |
7 (24.14%) |
5 (17.24%) |
2 (6.9%) |
4 (13.79%) |
9 (31.03%) |
1 (3.45%) |
3 (10.34%) |
9 (31.03%) |
2 (6.9%) |
1 (3.45%) |
2 (6.9%) |
0 (0.0%) |
0 (0.0%) |
5 (17.24%) |
| Sick cats (n=3) |
0 (0.0%) |
0 (0.0%) |
0 (0.0%) |
0 (0.0%) |
1 (33.33%) |
0 (0.0%) |
0 (0.0%) |
2 (66.66%) |
0 (0.0%) |
1 (33.33%) |
1 (33.33%) |
0 (0.0%) |
0 (0.0%) |
0 (0.0%) |
0 (0.0%) |
0 (0.0%) |
1 (33.3%) |
| Healthy dogs (n=1) |
0 (0.0%) |
0 (0.0%) |
0 (0.0%) |
0 (0.0%) |
0 (0.0%) |
0 (0.0%) |
0 (0.0%) |
0 (0.0%) |
0 (0.0%) |
1 (100.0%) |
1 (100.0%) |
0 (0.0%) |
0 (0.0%) |
0 (0.0%) |
0 (0.0%) |
0 (0.0%) |
0 (0.0%) |
| Sick dogs (n=7) |
1 (14.29%) |
0 (0.0%) |
0 (0.0%) |
0 (0.0%) |
2 (28.57%) |
0 (0.0%) |
0 (0.0%) |
6 (85.71%) |
0 (0.0%) |
3 (42.86%) |
7 (100.0%) |
1 (14.29%) |
0 (0.0%) |
0 (0.0%) |
0 (0.0%) |
0 (0.0%) |
1 (14.29%) |
| All (n=61) |
17 (27.87%) |
4 (6.56%) |
2 (3.28%) |
13 (21.31%) |
15 (24.59%) |
3 (4.92%) |
5 (8.20%) |
26 (42.62%) |
1 (1.64%) |
9 (14.75%) |
29 (47.54%) |
5 (8.20%) |
1 (1.64%) |
3 (4.92%) |
0 (0.0%) |
1 (1.64%) |
8 (13.11%) |
AMP = ampicillin, AMC = amoxicillin/clavulanic acid, MUP = mupirocin, P = penicillin, FD = fusid acid, MAR = marbofloxacin, CIP = ciprofloxacin, OX = oxacillin, LZD = linezolid, DA = clindamycin, E = erythromycin, C = chloramphenicol, RD = rimfampicin, CN = gentamicin, SXT = trimetoprim/sulfamethoxazole, TGC = tigecycline, TET = tetracycline.
Table 2.
Occurrence of selected antibiotic resistance genes among S. saprophyticus strains from humans and animals (%).
Table 2.
Occurrence of selected antibiotic resistance genes among S. saprophyticus strains from humans and animals (%).
| Antimicrobial resistance gene tested | |||||||||||||||
|---|---|---|---|---|---|---|---|---|---|---|---|---|---|---|---|
| Group | blaZ | mecA | mecC | aac* | ermA | ermB | ermC | tetK | tetL | tetM | tetO | fusB | vanA | vanB | mupA |
| Healthy humans(n=14) |
14 (100%) |
14 (100%) |
0 (0%) |
0 (0%) |
13 (92.86%) |
13 (92,86%) |
0 (0%) |
0 (0.0%) |
10 (71.43%) |
14 (100%) |
0 (0%) |
0 (0%) |
0 (0%) |
1 (7,14%) |
0 (0%) |
| Sick humans(n=7) |
7 (100%) |
7 (100%) |
0 (0%) |
0 (0%) |
6 (85,71%) |
4 (57.14%) |
0 (0%) |
0 (0%) |
7 (100%) |
7 (100%) |
2 (28,57%) |
0 (0%) |
0 (0%) |
0 (0%) |
0 (0%) |
| Healthy cats(n=29) |
29 (100%) |
29 (100%) |
0 (0%) |
4 (13.79%) |
25 (86,21%) |
20 (68,97%) |
4 (13,79%) |
0 (0%) |
8 (27.59%) |
28 (96.55%) |
5 (17.24%) |
4 (13.79%) |
0 (0%) |
0 (0%) |
2 (6,9%) |
| Sick cats(n=3) |
3 (100%) |
3 (100%) |
0 (0%) |
0 (0%) |
3 (100%) |
1 (33,3%) |
0 (0%) |
0 (0%) |
2 (66.67%) |
3 (100%) |
1 (33.33%) |
0 (0%) |
0 (0%) |
0 (0%) |
0 (0%) |
| Healthy dogs(n=1) |
1 (100%) |
1 (100%) |
0 (0%) |
0 (0%) |
1 (100%) |
0 (0%) |
0 (0%) |
0 (0%) |
0 (0%) |
1 (100%) |
0 (0%) |
0 (0%) |
0 (0%) |
0 (0%) |
0 (0%) |
| Sick dogs(n=7) |
7 (100%) |
7 (100%) |
0 (0%) |
0 (0%) |
6 (85,71%) |
3 (42,86%) |
0 (0%) |
0 (0%) |
5 (71.43%) |
7 (100%) |
1 (14.29%) |
0 (0%) |
0 (0%) |
1 (14.29%) |
0 (0%) |
|
All (n=61) |
61 (100.0%) |
61 (100%) |
0 (0.0%) |
4 (6.56%) |
54 (88.52%) |
41 (67.21%) |
4 (6.56%) |
0 (0%) |
32 (52.46%) |
60 (98.36%) |
11 (18.03%) |
4 (6.6%) |
0 (0.0%) |
2 (3.28%) |
2 (3.28%) |
Table 3.
The table shows a detailed breakdown of the data relating to the number of samples taken from a given location for each group of patients and volunteers.
Table 3.
The table shows a detailed breakdown of the data relating to the number of samples taken from a given location for each group of patients and volunteers.
| Groups | No data |
Oral cavity |
Nostrils | Anus | Wound | Skin |
Ear canal |
Conjunctival sac |
Total |
|---|---|---|---|---|---|---|---|---|---|
|
Healthy humans Sick humans Healthy cats Sick cats Healthy dogs Sick dogs |
0 5 0 0 0 0 |
2 0 2 0 0 0 |
4 1 6 3 0 1 |
0 0 2 0 0 0 |
0 0 0 0 0 1 |
4 1 6 0 0 0 |
4 0 5 0 0 2 |
0 0 8 0 1 3 |
14 7 29 3 1 7 |
| All | 5 | 4 | 15 | 2 | 1 | 11 | 11 | 12 | 61 |
Disclaimer/Publisher’s Note: The statements, opinions and data contained in all publications are solely those of the individual author(s) and contributor(s) and not of MDPI and/or the editor(s). MDPI and/or the editor(s) disclaim responsibility for any injury to people or property resulting from any ideas, methods, instructions or products referred to in the content. |
© 2025 by the authors. Licensee MDPI, Basel, Switzerland. This article is an open access article distributed under the terms and conditions of the Creative Commons Attribution (CC BY) license (http://creativecommons.org/licenses/by/4.0/).
Copyright: This open access article is published under a Creative Commons CC BY 4.0 license, which permit the free download, distribution, and reuse, provided that the author and preprint are cited in any reuse.


