
Submitted:
12 June 2025
Posted:
18 June 2025
You are already at the latest version
Abstract
In alpine ecosystems, where low temperatures dominate, prostrate growth forms play a crucial role in thermal resistance by enabling thermal decoupling from ambient conditions, creating a warmer microclimate. However, this strategy could be maladaptive during the heatwaves driven by climate change. This study combined microclimatic and plant characterization, infrared thermal imaging, and leaf photoinactivation to evaluate how thermal decoupling affects heat resistance (LT50) in six alpine species from the Nevados de Chillán volcano complex in the Andes of south-central Chile. Results showed plant temperature increased with solar radiation, air, and soil temperatures, but decreased with increasing humidity. Most species exhibited negative thermal decoupling (TD), remaining 6.7K cooler than the air, with variations across species, time of day, and growth form - shorter, rounded plants showed stronger negative TD. Notably, despite negative TD, all species exhibited high heat resistance (Mean LT50 = 46°C), with LT50 positively correlated with TD, but only in shrubs. These findings highlight the intricate relationships among thermal decoupling, environmental factors, and plant traits in shaping heat resistance. This study provides insights into how alpine plants may respond to the increasing heat stress associated with climate change, emphasizing the adaptive significance of thermal decoupling in these environments.
Keywords:
alpine
; heat resistance
; microclimate
; short plants
; thermal decoupling
1. Introduction
Temperature is the major environmental driver of plant distribution and diversity across various ecosystems, with its influence particularly pronounced in alpine habitats due to their unique climatic conditions [1]. Temperature plays a critical role in all plant life processes, such as plant metabolism and energy balance, including membrane properties, enzyme activity, the rate of chemical reactions and diffusion, and physical processes such as transpiration and the volatilization of specific compounds [2,3,4,5,6]. Temperature also controls the pattern and timing of plant development and reproduction, accounting for plant phenological processes such as the timing of germination and flowering, and the length of the flower lifespan, which is critical to the probability of pollination [7,8,9,10,11]. Given the pivotal role of temperature in plant growth and development, it is critical to understand the factors that determine temperature experienced by plants.
In alpine habitats, temperature and plant architecture interactions lead to complex thermal dynamics. Plant temperature is determined by the interplay between air temperature, wind speed, relative humidity, and solar irradiance [12,13], all of which vary substantially according to site-specific factors such as exposure, topography, and substrate [1,14,15,16,17,18]. For example, thermal gradients commonly develop near the ground as the soil absorbs solar radiation and warms the adjacent air through conduction and convection during the day [1]. This warming is intensified by reduced wind speed close to the surface, which limits convective heat exchange and allows heat to accumulate [19,20]. In addition, small-scale topographic features—such as depressions, rocks, bare soils, dark or rough surfaces—can generate localized microclimates by trapping air or altering radiation exposure [14].
The temperature experienced by plants is also shaped by intrinsic factors, such as growth form, height, and leaf morphology [1,16,21,22], which directly influence biophysical processes, such as boundary layer resistance to convective heat transfer and transpiration cooling [23,24,25,26,27]. As a result, the temperature experienced by a plant can vary significantly from that of the surrounding air [12,13,23,24,28], a phenomenon termed “thermal decoupling” (i.e. thermal offset, 29-34).
Unlike in hot and arid climates, where plants are often cooler than the air (with leaf temperatures dropping up to 17 K below ambient [35,36,37]), positive thermal decoupling (plant temperature > air temperature) has been widely documented in alpine plants [1]. This “extra heat phenomenon” is largely driven by plant dwarfism—a functional syndrome encompassing low stature, compact canopy architecture, and small leaves [1,21,33,38,39,40,41]. This effect is particularly strong in compact plant growth forms such as cushion plants and rosettes, and progressively weaker in taller or more open architectures [1,16,18].
The mechanisms underlying this positive thermal decoupling are primarily related to the structural capacity of alpine plants to reduce heat loss. Dense, low-stature canopies reduce wind penetration, minimizing convective heat loss and buffering internal temperatures [6,42,43,44]. Rounded canopy architecture—typical among alpine plant growth forms—further limits thermal dissipation due to their low surface area-to-volume ratio, reducing exposure to wind and enhancing heat conservation [45,46,47]. Although small leaves promote convective exchange through thinner boundary layers [36,37,48], in alpine species, they contribute to compact, thermally buffered canopies that trap heat near the ground [1,13]. These structural traits collectively reduce heat loss and facilitate positive thermal decoupling from the ambient air, supporting the prevalence of growth forms such as dwarf shrubs, rosettes, graminoids, and cushion plants in high-mountain ecosystems [1,13,32].
While a heat-trapping plant architecture benefits alpine plants at low temperatures, it can become detrimental during high-temperature events, increasing the risk of heat damage [49,50,51]. Additionally, site characteristics such as wind sheltering, soil water scarcity, and dark substrates can further intensify plant heating, causing plant temperatures to exceed 30°C and occasionally reach 40°C [51,52,53,54,55]. This is particularly relevant in alpine ecosystems, which are among the most severely and rapidly affected by climate change [56,57]. For example, an increase of 0.25 °C per decade in air temperature has been reported in the Chilean Andes [58]. Simultaneously, an upward trend of more than one heat wave event per decade has been reported across the Andes between 20° S and 36°S since 1980 [59]. Therefore, heat stress is likely to be common in alpine species, especially for PGFs where the leaves are near the ground or arranged in a dense canopy where temperature tends to be higher [60,61]. In alpine ecosystems, particularly those influenced by a Mediterranean-type climate, where daytime temperature extremes can be very high, the risk of heat stress may be exceptionally high and pose a significant challenge for plant survival [33,62].
Paradoxically, while positive thermal decoupling in alpine plants is beneficial for facing low temperatures, the possibility of overheating is expected to force alpine plants to invest in heat resistance mechanisms. In other words, alpine plants must withstand both low and high temperatures [1,33,52,63]. Neuner and Buchner (2012), studying 79 alpine species from temperate regions, reported heat resistance ranging from 43 to 64 ºC [53]. Similar results were found by León-García and Lasso (2019) studying 21 species from the tropical Andes [64], and Sumner and Venn (2022) in 11 Australian alpine species [65]. In all these cases, heat resistance varied according to PGF, where grasses and plant rosettes were the most heat resistant. Although these studies suggest that heat resistance is strongly influenced by the temperatures experienced by the plant because of their growth form [66,67,68], to our knowledge, no study has directly evaluated the impact of thermal decoupling, as a result of growth form, on heat resistance capacity of alpine plants.
Our main goal was to explore the effects of thermal decoupling shaped by environmental factors and plant architectural traits on the heat resistance of common alpine species from the Nevados de Chillán volcanic complex in the Andes of south-central Chile. Our specific goals were to: 1) assess the importance of environmental variables on plant temperature; 2) determine the extent to which plant temperature is decoupled from air temperature at the microclimatic scale; 3) test the importance of plant architecture traits in explaining thermal decoupling, and 4) assess the relationship between plant thermal decoupling and heat resistance. We expect that thermal decoupling is a key determinant of heat resistance in alpine plant species. In particular, rosette species—characterized by a growth form that promotes stronger positive thermal decoupling (i.e., canopy temperatures exceeding ambient air temperatures)—are expected to exhibit higher heat resistance. In contrast, dwarf shrub species, thermally coupled with ambient conditions due to their more elevated and exposed architectures, are expected to display lower heat resistance.
The alpine flora of the Nevados de Chillán volcanic complex encompasses the primary alpine PGFs, ranging in height from 1 to 90 cm, exhibiting diverse canopy architectures [69]. As the season progresses, air and soil moisture decrease, with heat events up to 41°C becoming increasingly frequent [70]. Projections indicate that summer temperatures could rise by 2–5°C, and the frequency of heat waves may increase by up to 20 days by the end of the century [58,71]. The increasing frequency and intensity of heat events, aggravated by the plant microclimate, present a significant physiological challenge. This raises the question of how alpine plants on this mountain range, adapted morphologically and physiologically to cold conditions, can withstand high temperatures. Results from this study could inform conservation strategies and predictive models for alpine plant responses to climate change.
2. Results
2.1. Environmental Variables Affecting Plant Temperature
High collinearity characterized most of the environmental variables, except for the combinations of wind speed (WS)–soil temperature (ST), and WS–Photosynthetic Active Radiation (PAR) (Figure S1). The highest correlations were found between air temperature AT–ST (0.68), PAR–AT (0.64), and PAR–relative humidity (RH) (-0.64). The lowest correlations were found between WS–AT (-0.25) and WS–RH (-0.22) (Figure S1). Due to high collinearity between the explanatory variables, principal component analysis (PCA) was performed. Then, we used the principal factors PC1 and PC2 to summarize the data to model plant temperature. PC1 and PC2 account for about 60% and 22% of the variability of the environmental variables used (Figure 1A).
PC1 was negatively related to AT, ST, and PAR. To a lesser extent, it was positively correlated to RH. PC2 was negatively correlated to WS and positively correlated to RH (Figure 1B). Hence, PC1 reflected the input of solar energy and heat transfer, whilst PC2 reflected the heat loss through the WS.
The generalized additive model (GAM) explained a substantial proportion of the variance in plant temperature (adjusted R² = 0.80, p <0.0001; Table 1).
The model identified a significant non-linear relationship between PC1 and plant temperature (edf = 6.89, F = 57.32, p <0.0001), indicating that PC1 captures most of the variation explained by the model. In contrast, the effect of PC2 was not statistically significant (p = 0.11). Based on the correlations between environmental variables and PC1 (negatively related to air and soil temperature and PAR; positively related to relative humidity), the results suggest that higher solar radiation and warmer air and soil temperatures increase plant temperature, whereas higher relative humidity reduces it.
2.2. Plant Thermal Decoupling
Negative thermal decoupling (TD = PT-AT) was observed in five of the six studied species (Figure 2), with plant temperature (PT) averaging 6.7K lower than air temperature (AT) (blue bars in Figure 3).
A strong sampling-day effect on TD was detected, with species measured on the same day exhibiting similar TD patterns (Figure 3). In H. tenuifolia and A. prolifera, TD occurred only in the morning (P1), with PT averaging 6.2 ± 2.1 °C (t₁₀ = 2.71, p = 0.02) and 7.9 ± 1.1 °C (t₁₀ = 8.79, p <0.0001) lower than AT, respectively (Figure 3). A similar pattern was observed in P. secunda, where PT was, on average, 6.3 ± 2.6 °C lower than AT at P1 (U = 4, p = 0.02). Although TD in B. empetrifolia was measured the same day as in P. secunda, PT and AT in the former species remained coupled throughout the day (P1–P3) (Figure 3; P1: t₆ = -0.3; P2: t₁₀ = -0.8; P3: t₁₀ = 1.1, p >0.05). The apparent TD difference at P1 between B. empetrifolia and P. secunda may result from the time shift of P1 (12:00–13:00) in B. empetrifolia, which aligned more closely with P2 in P. secunda.
In Senecio pachyphyllos and Viola aizoon, TD occurred throughout the day, with PT being consistently lower than AT across all periods (Figure 3). In S. pachyphyllos, PT was 6.9 ± 2 °C lower than AT (P1: t₁₂ = 13.1; P2: t₁₂ = 11.2; P3: t₁₂ = 7.5, p <0.0001). Similarly, in V. aizoon, PT was 6.2 ± 2.4 °C lower than AT (P1: t₁₂ = 6.5; P2: t₁₂ = 7.3; P3: t₁₂ = 7.2, p <0.0001). Thermal decoupling (TD), calculated as daily mean values per species across the three measurement periods, did not differ significantly between growth forms. Rosette species had a mean TD of –4.56 K (± 2.34 SD), while dwarf shrubs had a mean TD of –3.76 K (± 3.16 SD) (t₃₄ = –0.86, p = 0.396).
2.3. Thermal Decoupling (TD) and Architecture Plant Traits
The relationship between plant architectural traits and TD was analyzed by averaging TD per species during daytime hours (P1-P3). A linear model (LM) was fitted with plant height (PH), circularity index (CI), and porosity index (PI) as predictors, and sampling date as a fixed cofactor. The overall model was significant (F5, 21 = 11.55, p <0.0001) and explained 67% of the variability in TD (Table 2).
PH had a significant effect, accounting for 24% of the variance in TD (F1, 21 = 18.80, p = 0.0003), while CI explained 19.2% (F1, 21 = 15.12, p = 0.0008). These results suggest that smaller, more rounded plants exhibited more negative thermal decoupling (TD) values than taller, less rounded individuals, indicating stronger cooling relative to air temperature. Sampling date also contributed significantly, explaining 25.2% of the variance (F₁,₂₁ = 19.82, p = 0.0002), reinforcing the pattern shown in Figure 3.
2.4. Relationship Between Thermal Decoupling (TD) and Heat Resistance (LT50)
Mean LT50 varied significantly among species (F5,40 = 13.8, p <0.0001), ranging from 35.2 ± 0.3 ºC in S. pachyphyllos to 54.2 ± 1.9 ºC in B. empetrifolia. Notable differences in LT50 were observed among shrub species, which exhibited a range of 19K (Figure 4).
In contrast, there was little variation in heat resistance among rosette species (Figure 4). Interestingly, LT50 for rosette species was 4K higher than that of dwarf shrubs (H1,40 = 4.68, p = 0.03), with a mean LT50 of 47.9 ± 1.2 °C and 43.9 ± 8.7 °C for plant rosettes and dwarf shrubs, respectively.
3. Discussion
We studied the ability of plants to decouple from environmental temperatures using microclimatic and plant trait characterization combined with infrared thermal images. Our findings provide new insights into plant thermal behavior and heat resistance, highlighting the complex interactions between microclimatic conditions and plant traits in alpine environments. Despite the heat-trapping design traditionally associated with alpine species, most of the plants studied in the Mediterranean-type climate alpine area studied here were, on average, 7 °C cooler than the ambient temperature. The negative thermal decoupling varied throughout the day and species. Interestingly, species with stronger negative thermal decoupling tended to be less heat resistant, although this pattern was evident only in shrub species. Nevertheless, most species exhibited high levels of heat resistance, suggesting that heat stress imposes a strong adaptive pressure in this alpine region. Although this study was limited to six species, our results challenge the assumption that alpine plants are consistently positively decoupled during the day and underscore the importance of considering microclimatic influences when assessing plant thermal responses. At the same time, our results contribute to a better understanding of how alpine plants cope with heat stress, an aspect often overlooked in alpine ecosystems due to the predominant focus on cold temperatures.
As was expected, plant temperature resulted from the combined effects of solar irradiance, microclimate air temperatures, and relative humidity. This pattern is aligned with the energy balance theory [45], which posits that solar radiation absorption primarily drives the energy balance in leaves [5,16,34,72]. In addition, plants gain heat through convection from the surrounding air, infrared radiation from the soil, and heat conduction between soil and plant parts in contact [12,73,74,75]. On the other hand, the observed decrease in plant temperature with increasing relative humidity could be attributed to the higher water vapor content in the air, increasing the probability of cloud formation [76]. Water vapor and clouds absorb and scatter solar radiation, reducing direct solar radiation reaching the plants. This relationship is further supported by a negative correlation between photosynthetic Active Radiation (PAR) and relative humidity (RH) identified in this study (Figure S1). Despite most of the variance (77%) in plant temperature being explained by air/soil temperature and PAR, interspecific traits, such as plant height and plant architecture, exerted a significant effect on the temperature experienced by plants and contributed to their ability to decouple from environmental temperatures.
The finding that species had a negative thermal decoupling is contrary to what is expected in alpine growth forms, particularly for dwarf shrubs and rosettes, which have been described as heat traps, i.e., with positive thermal decoupling, PT > AT [1,12,13,21,33,54]. Interestingly, negative thermal decoupling has been described for plants inhabiting hot and arid climates where heat stress is prevalent [35,36,37,77]. This has been explained by latent heat loss by transpiration, which provokes a cooling effect in these species [73,78]. Although stomatal conductance was not assessed in this study, vapor pressure deficits (VPD) registered during thermal decoupling field measurement, i.e., mean VPD = 1.5 ± 0.7 kPa (Figure S2), indicate a moderate to high potential for stomatal transpiration rates [79,80]. Under moderate VPD levels (<1.5 kPa), thermal decoupling was negatively correlated to VPD (Figure S3; R2 = -0.48; p <0.0001); therefore, plant temperature decreased when VPD increased. However, at higher levels of VPD (2.3 ± 0.5 kPa), as those observed during TD measurements for Berberis empetrifolia and Phacelia secunda, plant temperatures were generally coupled with air temperature, likely due to stomatal closure to reduce water loss and enhance water-use efficiency [81]. Exceptions to this trend were noted for A. prolifera and H. tenuifolia, where negative TD does not solely respond to VPD. These varying responses among species might be related to specific traits influencing transpiration sensitivity to changes in VPD [82,83,84,85], such as anatomical features, like variations in stomatal size, density, and guard cell activity [86,87,88]—as well as environmental factors, such as differences in soil water availability across species’ habitats [89].
Our findings on negative thermal decoupling shed light on a critical methodological issue: most studies on thermal decoupling have assessed this phenomenon using weather stations located two meters above ground, with a few notable exceptions in tropical [90,91], and temperate alpine species [92]. These studies have concluded that alpine plants function as heat traps [32,93,94,95,96]. However, the use of weather station data is debatable given that the short stature of alpine plants exposes them to a microclimate that can differ significantly from the conditions recorded at standard meteorological heights [16,60,67,97]. In this regard, when our results for plant temperature are compared with air temperature at the macroscale, PT averages 2.3K higher than AT (Figure S4). This evidence suggests that the direction of thermal decoupling—positive or negative—depends on the location where the air temperature is measured, highlighting the need for careful interpretation of results and adequate representation of the real temperature of the air around plants. Although our results of TD measurements were taken at particular times of the day and would have benefited from broader sampling, they suggest that alpine plants do not systematically act as heat traps. Instead, the cooling of alpine plants by latent heat loss becomes evident when TD is based on more realistic air temperature measurements at plant height.
Despite a strong sampling-day effect on TD, where TD patterns were similar among species measured on the same day, plant architecture played a significant role in thermal decoupling, where smaller and rounded plants exhibited the strongest negative thermal decoupling. Shorter species like Viola aizoon and Phacelia secunda exhibited stronger negative TD than taller plants like Berberis empetrifolia, which suggests shorter plants may be more influenced by soil temperature. Stronger negative thermal decoupling in shorter species may help maintain leaf temperatures within the optimal carbon assimilation and growth temperature range. This is particularly relevant since their closer thermal coupling with near-ground conditions can expose them to rapid temperature increases in high irradiance conditions. In fact, soil temperatures close to 40 °C have been recorded in the study site [98]. Conversely, B. empetrifolia, the tallest shrub, appeared less influenced by soil temperature and more correlated with air temperature, and it was the only species where wind speed correlated with plant temperature (R2 = 0.41, p = 0.005). Furthermore, the canopy form estimated as circularity index (CI) explained 16.3% of the variance in thermal decoupling. Interestingly, species at both extremes of plant height coincided with variations in circularity: V. aizoon and P. secunda ranked as the most rounded, while B. empetrifolia was the least rounded. The stronger negative TD observed in rounded plants may be associated with compact leaf arrangement, low self-shading, and horizontal leaf orientation. These traits could provoke leaf heating by enhancing solar radiation absorption [92,99,100], thereby driving higher transpiration rates and a stronger negative TD. These findings underscore that while environmental factors affect plant temperature, whole plant/leaf traits can mitigate or amplify these effects [23].
We initially expected alpine plants to overheat due to positive TD, requiring them to maintain high heat resistance. Contrary to this expectation, most species displayed relatively high heat resistance (mean LT50 of 46 °C) while exhibiting negative TD. In general, the LT50 values observed in our study aligned well with those reported for other alpine plants [53,55,64,65,101]. Heat resistance was particularly variable among dwarf shrubs, ranging from 35 to 54 °C. The low LT50 of 35 °C in Senecio pachyphyllos is notably below the mean LT50 of alpine shrub species from tropical and temperate mountains, reported at 47 °C [101]. In contrast, Berberis empetrifolia exhibited an exceptionally high heat resistance of 54 °C compared to other shrub species [101]. In dwarf shrubs, TD partially explained variation in LT50 S. pachyphyllos, which exhibited the strongest negative TD, also had the lowest LT50, while B. empetrifolia, closely tracking air temperature, had the highest LT50. Rosette species, by contrast, showed consistently high LT50 values, averaging 48 °C, comparable to those found in erect (47.8 °C) and acaulescent (49.5 °C) rosette species from tropical and temperate alpine habitats [101]. Unlike shrubs, no correlation was found between TD and LT50 in rosette species.
The lack of a consistent pattern in the correlation between thermal decoupling (TD) and LT50 suggests that cooling via transpiration is not a targeted heat resistance mechanism, but rather a byproduct of water loss associated with the stomatal opening required to sustain photosynthesis [89]. In this context, it is likely that leaf traits—such as thickness, width, and surface area—play a more decisive role in determining the range of temperatures experienced by leaves, through their influence on heat storage and boundary layer properties [22,27,102,103]. Rosette plants, which are exposed to more intense and prolonged thermal extremes than taller species [61,104], likely rely on these morphological traits, together with robust physiological mechanisms of heat tolerance (e.g., heat shock proteins, osmotic adjustment, antioxidant production), to cope with such thermal conditions. Negative thermal decoupling alone may not ensure survival under extreme heat stress; however, this requires further investigation.
Rosette species and B. empetrifolia have a wide safety margin to cope with heat events. Their mean heat resistance is approximately 50°C (Figure 4), which is 16°C above the average heat intensity recorded during the growing season at the study site, i.e., 33.5 °C [70]. In contrast, the shrub species Senecio pachyphyllos (LT50 = 35 °C) and Azorella prolifera (LT50 = 42°C) have narrow safety margins, making them more vulnerable to extreme heat. Given that air temperature exceeded 30 °C for 73 days during the growing season in our study site, with peaks reaching 41 °C at the microclimate scale [70], the cooling effect from TD becomes critical for these species to withstand heat events. However, relying on TD as a “heat avoidance mechanism” poses risks, especially as future projections indicate that this alpine zone will become hotter and drier [58,105], making it harder for plants to cool down by transpiration [106,107]. Increased temperatures and water shortage could trigger stomatal closure to prevent excessive water loss [81,108], resulting in negative carbon balances and carbohydrate depletion [109]. Furthermore, a combination of water shortages and high evaporative demand might lead to cavitation and plant mortality [110,111]. Thus, maintaining high levels of heat resistance and taking advantage of thermal decoupling as a “heat avoidance mechanism” may be essential for plant survival in the face of climate change in this and other alpine systems experiencing heat and drought events.
In conclusion this study, conducted in an alpine ecosystem influenced by a Mediterranean-type climate, enhances our understanding of plant survival strategies in extreme environments. It highlights that alpine plant responses to climate change likely vary considerably depending on the specific alpine climate, species identity, and the unique microclimatic conditions they experience. Our findings demonstrate that multiple environmental factors and whole-plant traits influence temperatures experienced by plants and their ability to cope with heat events. Despite the negative thermal decoupling observed in most species, this study highlights that plant temperature regulation is complex and does not always correlate with heat resistance. Given the strong dependence of plant temperature on water availability, future studies should incorporate seasonal variation in thermal decoupling and heat resistance, particularly in alpine regions prone to summer droughts, as is the case in the central Chilean Andes. Moreover, a more comprehensive temporal sampling—spanning different times of day, stages of the growing season, and slope aspects—is needed to characterize thermo-decoupling patterns under diverse climatic conditions fully. Finally, it remains essential to examine whether the thermal behavior observed in these species also contributes to their ability to withstand freezing temperatures, a key environmental filter in alpine ecosystems.
4. Materials and Methods
4.1. Study Site and Plant Species
Research was conducted in the Aguas Calientes Valley, located within the Nevados de Chillán Volcano complex, approximately 80 km east of Chillán (Región del Ñuble, Chile). This valley lies in the southern part of the mediterranean-type climate zone of central Chile, transitioning into the southern temperate forest region [112]. The area is characterized by both past and ongoing volcanic activity, resulting in complex topography, geology, and a variety of substrate types [113,114]. These climatic and geomorphological conditions contribute to exceptional plant diversity and endemism [115]. The vegetation consists of dwarf shrubs, rosette herbs, grasses, and geophytes [116,117]. Our study site was on a north-facing slope at elevations ranging from 1941 to 2003 meters above sea level (36° 54' 22.46" S, 71° 24' 10.30" W), just above the treeline. The vegetation is dominated by dwarf shrubs (e.g., Azorella prolifera, Berberis empetrifolia, Discaria chacaye), rosette perennial herbs (e.g., Viola cotyledon, Perezia pilifera, Phacelia secunda), and grasses (e.g., Koeleria barbinodis, Poa denudata) [116,118].
The nearest meteorological station (Termas de Chillán, CN360042; 1708 m; https://climatologia.meteochile.gob.cl/) reports an average annual precipitation ranging from 615 to 1012 mm over the past decade, most of which falls during winter as snow. During the growing season, mean minimum and maximum air temperatures were 0.8 °C and 23 °C, with recorded extremes ranging from –6.6 °C to 28.5 °C. At the microclimatic scale, particularly on the north-facing slope where the study site was located, average minimum and maximum air temperatures reached 2.4 °C and 26 °C, with absolute extremes ranging from –9.9 °C to 41.3 °C [70]. At 15 cm above ground level, the mean temperature of heat events was 34 °C, and 49% of days during the growing season experienced temperatures above 30 °C for at least three consecutive hours. Additionally, soil moisture decreased 2.5-fold from October to March, exposing plants to progressive water limitation [70]. North-facing slopes in this region experience higher maximum temperatures and more frequent and intense heat events than their south-facing counterparts [70]. This selection minimized variation associated with the slope aspect and ensured consistent microclimatic exposure across sampling sites.
Six native species of two PGFs, plant rosettes, and dwarf shrubs were studied (Figure 6).
The plant rosette species were Hypochaeris tenuifolia (Hook. & Arn.) Griseb (Asteraceae), Phacelia secunda J.F. Gmel. (Boraginaceae), and Viola aizoon Reiche (Violaceae). H. tenuifolia is a perennial herb, rhizomatous, with rosette leaves 3–21 cm tall, leaves glabrous, entire to pinnate 5–10 cm in length [119]. P. secunda is a perennial herb with a basal rosette 6–7 cm tall, with an upright rhizome; basal leaves long petiolate, hairy on both sides and up to 8 cm long [120]. V. aizoon is a perennial herb with succulent, glabrous, semi-spreading leaves that form 4 cm tall rosettes. The leaves are stiff and membranous, with short petioles [121]. The dwarf shrub species were Azorella prolifera (Cav.) G.M. Plunkett & A.N. Nicolas (Apiaceae), Berberis empetrifolia Lam. (Berberidaceae), and Senecio pachyphyllos J. Remy (Asteraceae). A. prolifera is a dwarf shrub <100 cm tall that forms lax cushions. Its leaves are 1–5 cm in length, numerous, alternate, and petiolate [122]. B. empetrifolia is a small-thorny, mostly prostrate shrub <50 cm tall with angular, glabrous, spiny branches and scaly bark in mature plant stages [123]. S. pachyphyllos is a much-branched dwarf shrub, 15–20 cm tall, with creeping rooting stems and leaves crowded at the base of the plant [124]. The six species were selected based on their high relative abundance on the north-facing slope [118] and their clearly defined individual structure, which enabled accurate measurement of whole-plant temperature using infrared thermography. Species forming spatial associations were excluded to avoid temperature and canopy overlap. The selected species also represent the dominant alpine growth forms (rosettes and dwarf shrubs), and their inclusion allowed us to examine contrasting thermal and morphological strategies.
4.2. Environmental Variables, Plant Temperature, and Thermal Decoupling
A thermal imaging camera (Testo 885, Testo INC, Lenzkirch, Germany), featuring a thermal sensitivity (NETD) of <30 mK at 30 °C and a temperature accuracy of ± 2 °C, was used to measure the temperature of six individuals per species. Infrared images (IR) were taken three times during the daylight hours (P1: 10–12 h, P2: 13–15 h, and P3: 16–18 h) on March 7 (B. empetrifolia and P. secunda), March 8 (A. prolifera and H. tenuifolia), and April 12 (S. pachyphyllos and V. aizoon), 2023. Infrared images were captured at the closest focal plane to ensure a comprehensive representation of the entire plant. The plant emissivity in the infrared camera was set to 0.98 [125,126,127]. IR images were taken on clear or partly cloudy days (37% mean RH; Table A1). The distance and angle of capture were adjusted according to species size, with distances less than 10 cm for rosettes and up to 50 cm for dwarf shrubs. The transmissivity of the atmosphere was not set during measurements because the camera was positioned close to the plants. As a result, this parameter would have a minimal effect on the thermography data [127].
Concomitantly with plant temperature measurements, three environmental variables were measured at the level of the target plant (microclimate) using a Kestrel 3000 Pocket Weather meter (Nielsen-Kellerman Co, USA): Air Temperature (AT, °C; accuracy ± 0.5 °C), Relative Humidity (RH, %; accuracy ± 3%), and Wind Speed (WS, km h-1; accuracy ± 3%). Thus, these variables were measured at different distances from the ground, depending on plant height. Simultaneously, Photosynthetic Active Radiation (PAR, µmol m-2 s-1) was measured using a LI-250Q Light Meter (Li-Cor, Lincoln, Nebraska, USA). The light meter was aligned parallel with the leaf surfaces, ensuring that the orientation matched that of the leaves, particularly those located at the upper canopy level in dwarf shrub species. This alignment was critical for capturing the accurate light conditions experienced by the photosynthetic tissues. All measurements were executed within a 10-second interval per plant to minimize any effect of solar radiation on air temperature measurements.
A sample size of six individuals per species was selected to provide sufficient replication to capture thermographic images and simultaneous environmental measurements under standardized conditions. Data was collected on two species per session, with 16 individuals measured over two hours, resulting in 36 daily replicates. This design ensured comparable sampling conditions across replicates and species and reflected the availability of clearly distinguishable individuals in the field.
To determine plant temperature (PT, ºC), IR image analysis was performed using IRSoft version 5.0 software (Testo INC, Germany). The plant area, including all vegetative parts, was contoured manually to obtain plant surface temperature. Soil temperature (ST, °C) was estimated from the free-plant soil area of the same infrared images used to estimate PT. Thermal decoupling (TD, °C) was calculated for each plant by determining the difference between plant temperature (PT) and air temperature (AT).
4.3. Plant Architecture Traits
Plant height, circularity, and porosity were measured for each species (i.e., 6 species × 4–5 replicates). Plant Height (PH, cm) was measured as the shortest distance between the upper boundary of leaves (excluding inflorescences) and the ground level using a tape measure [128]. The Porosity Index (PI) and Circularity Index (CI) were estimated through images analyzed with ImageJ software (Figure S1; v1.53t, Wayne Rasband, NIH, Bethesda, Maryland, USA). PI is a modification of the gap fraction proposed by Pérez-Harguindeguy et al. (2016) [128]. Due to the prostrate nature of alpine plants, photos were taken above the canopy rather than below it, as is done with the gap fraction.
PI was estimated as:
PI = 1 – ((Σ Plant areas)/ (height* width))
PI corresponds to the fraction of the plant canopy occupied by air space, where a value of 0 indicates no free spaces in the plant canopy, hence a dense canopy. As the value approaches 1, free spaces increase in the canopy. Dense canopies, from a functional perspective, reduce light and wind penetration and can provide insulation against extreme temperature fluctuations, creating a more stable microclimate inside the canopy [6,42,43,44].
The circularity index (CI) was estimated as:
CI = 4π (Plant area)/ (Plant perimeter^2)
A CI value equal to 1 indicates a perfect circle, while values approaching 0 indicate an increasingly elongated canopy. Rounded shapes have a smaller surface area relative to their volume than other sharp forms [47], which means less surface exposure to the surrounding air, reducing heat loss by convection [45]. In addition, a rounded shape reduces direct radiation exchange by decreasing the plant's exposed surface area to sunlight, thus minimizing heat absorption [46].
4.4. Heat Resistance Assessment
For heat resistance determination, six fully expanded and healthy leaves were collected from each of the seven haphazardly selected individuals per species. In the case of dwarf shrubs, small branches were collected from the outer canopy, and leaves were then detached before determinations. Each leaf/branch was covered with a moist paper towel and immediately placed inside a plastic-sealed bag. Samples were stored inside a cooler to avoid changes in tissue water status and senescence. All plant samples were maintained at a domestic refrigerator (approximately 4 °C) until heat treatments were carried out in a field laboratory. Heat resistance was determined within 40 hours of sample collection.
A cryostat (F34-ME, Julabo Labortechnik GmbH, Germany) with a thermostable solution (Polycool HC-50, Polyscience, Illinois, USA) was used to expose leaves to five independent heating treatments: 25, 35, 45, 55, and 60 °C. These temperature treatments were selected to cover the full range of physiological heat responses, from control conditions to critical thresholds of tissue damage, as commonly reported in previous studies assessing thermal tolerance in alpine species [51,52,64,101,129]. Six leaves from seven different individuals per species were used for each treatment, including the control. Leaves were cut near the base of the petiole, placed inside hermetically sealed plastic bags, and introduced into the cryostat. Heat simulations began at 15 °C, with a heating rate of 10 K h−1, and each target temperature was reached within 1–4.5 hours. After reaching the target temperature, the samples were maintained for 2 hours at that temperature, then returned to 15 °C at the same heating rate of 10 K h−1 within the cryostat. Previous studies have used heating rates ranging from 2 K h−1 [130] to 60 K h−1 [55], indicating a lack of consensus on the most appropriate rate for assessing heat resistance in plants. We selected a rate of 10 K h−1, a common heating rate in the study area [70,98]. The control leaves were stored in a domestic refrigerator at approximately 4°C for 17 hours, matching the duration of the longest heating treatment (60 °C), ensuring adequate time for leaf damage expression. Even after this period, the Fv/Fm values, which measure photosynthetic efficiency, remained above 0.8 in the control samples, indicating that the photosynthetic tissues remained active and undamaged [131].
Temperature-induced leaf damage was assessed 6 hours after the completion of each heating treatment. During this period, leaves were kept in darkness inside a domestic refrigerator at approximately 4 °C to prevent further physiological activity and allow dark adaptation. A chlorophyll fluorimeter (Plant Efficiency Analyzer, Hansatech, Germany) was used to measure the ratio of variable to maximum fluorescence (Fv/Fm) in dark-adapted leaves [131]. Damage was quantified as the percentage of photoinactivation (PhI), as calculated using Equation 3:
PhI = (1-FhT/Fmax) *100
Where FhT is the Fv/Fm of the sample exposed to a heating temperature T, and Fmax is the Fv/Fm value of the control sample. Including Fmax in the equation allows to the incorporation of any effect of manipulation and storage time, allowing heat-induced damage to be isolated and directly quantified.
Based on the response curve of Fv/Fm to heating treatments (Figure S5), the lethal temperature at which 50% damage occurs (LT50) was estimated by linear interpolation between the highest temperature at which the photosynthetic index (PhI) remained below 50% and the lowest temperature at which it exceeded 50%, following a modified approach from [132,133]. LT50 was estimated for each of the seven individuals per species, and then the mean and variability were calculated at the species level.
4.5. Statistical Analysis
All statistical analyses were performed in R (version 4.2.3, 2023-03-15 ucrt). To evaluate the influence of environmental variables on plant temperature, we performed a Principal Component Analysis (PCA) using the prcomp function in R [134], to reduce dimensionality and summarize the variation in air and soil temperature, photosynthetically active radiation (PAR), relative humidity (RH), and wind speed. The first two principal components (PC1 and PC2) were used as predictors in a Generalized Additive Model (GAM), fitted with the gam function from the mgcv package [135], using a Gaussian distribution and identity link function. PC1 and PC2 were included as smooth terms for potential non-linear effects. Model assumptions were evaluated using both graphical and statistical approaches. The normality of residuals was assessed with the Shapiro–Wilk test (W = 0.978, p = 0.053), and homoscedasticity was evaluated using the studentized Breusch–Pagan test (p = 0.945) and the non-constant variance test (p = 0.885). The basis dimension (k) for each smoothing term was tested using the gam.check function. The k-index values (PC1: 1.13, p = 0.86; PC2: 0.91, p = 0.15) indicated that the selected basis dimensions were appropriate, and diagnostic plots confirmed a good model fit.
To determine the extent of plant thermal decoupling from air temperature at the microclimatic scale, we evaluated differences between plant and air temperature (AT) per species and hour using paired t-tests. In cases where normality assumptions were not met—specifically for P. secunda at P1 and A. prolifera at P2—we used the non-parametric Mann-Whitney U-test.
To test the importance of plant architectural traits in explaining thermal decoupling, we performed a linear model including plant height, circularity index, porosity index, sampling date, and the interaction between height and circularity. In this linear model (LM), we included the interaction between height and circularity, as height represents the vertical dimension, and circularity reflects biomass distribution in three-dimensional space. Together, these variables provide an estimate of plant volume. Additionally, the species studied exhibit short stature and relatively consistent volume, enhancing the accuracy of this estimation. The linear model assumed a Gaussian distribution. Residuals were assessed for normality using the Shapiro–Wilk test (W = 0.959, p = 0.350) and homoscedasticity and linearity by inspecting residuals vs. fitted values plots, which showed no evident patterns or deviations. Additionally, we applied the Breusch–Pagan test (bptest() function from the lmtest package [136]), which indicated no significant heteroscedasticity (BP = 9.76, df = 5, p = 0.082). This result was supported by the non-constant variance score test (ncvTest() from the car package; [137]), which also showed no evidence of heteroscedasticity (χ² = 0.54, df = 1, p = 0.461).
To assess interspecific differences in LT50, we performed a one-way ANOVA. Differences in LT50 between rosettes and shrubs growth forms were assessed using Mann-Whitney U-tests. Finally, to test the association between thermal decoupling and heat resistance we used Spearman’s rank correlation between mean daytime thermal decoupling (TD) – averaged per individual across the three measurement periods from 10:00 to 18:00 – and LT50.
Supplementary Materials
The following supporting information can be downloaded at the website of this paper posted on Preprints.org, Figure S1: Spearman rank correlation matrix for all environmental variables measured; Figure S2: Vapor pressure deficit during three measurement periods; Figure S3: Pearson’s correlation between thermal decoupling (TD, ºC) and vapor-pressure deficit (VPD, kPa); Figure S4: Macroclimate air (blue), microclimate air (green), and plant (red) temperatures were measured during three different periods; Figure S5: The relationship between temperature (ºC) and heat damage (%). Table S1: Environmental variables measured at plant height in 6 alpine species from Nevados de Chillán.
Author Contributions
Conceptualization, L.V.M. and A. S.-A.; methodology L.V.M. and A. S.-A.; validation, L.V.M., A. S.-A. and C. S.-U.; formal analysis, L.V.M. and A. S.-A.; investigation, L.V.M. and A. S.-A.; resources, A. S.-A. and M.T.K.A. ; data curation, L.V.M. and C. S.-U.; writing—original draft preparation, L.V.M., A. S.-A. and C. S.-U.; writing—review and editing, L.V.M., A. S.-A. and M.T.K.A.; visualization, L.V.M., A. S.-A.; supervision, A.S.-A.; project administration, A.S.-A; funding acquisition, A. S.-A. and M.T.K.A. All authors have read and agreed to the published version of the manuscript.
Funding
This research was funded by VRID-UdeC, grant number 2021000184INV, CONAF-FIBN grant number 2020/043, Postdoctoral Fondecyt 3240033, ANID PIA/BASAL Grant PFB210018 to the Cape Horn International Center (CHIC), and ANID PIA/BASAL Grant FB210006 to Institute of Ecology and Biodiversity (IEB). C.S.-U. holds CHIC Summer Grant 79983.
Data Availability Statement
The datasets presented in this study can be found in the online repository: Mendeley Data, V1, doi: 10.17632/ywpygww5fk.1. A preprint is available at SSRN: https://ssrn.com/abstract=5217600.
Acknowledgments
We thank Diego González and Esteban Urrutia for technical help in the field, CONC Herbarium specialists for plant determinations, and Alfredo Saldaña and Luisa Bascuñan for the loan of PAR sensors. Also thank the anonymous reviewers whose comments contributed to the final version of this manuscript.
Conflicts of Interest
The authors declare no conflicts of interest.
Abbreviations
The following abbreviations are used in this manuscript:
| LT50 | Lethal temperature that produces 50% tissue damage (ºC) |
| TD | Thermal Decoupling (ºC) |
| WS | Wind Speed (km h-1) |
| ST | Soil Temperature (ºC) |
| PAR | Photosynthetic Active Radiation (µmol m-2 s-1) |
| AT | Air Temperature (ºC) |
| RH | Relative Humidity (%) |
| PCA | Principal Component Analysis |
| GAM | Generalized Additive Model |
| PT | Plant Temperature (ºC) |
| LM | Linear Model |
| PH | Plant Height (cm) |
| CI | Circularity Index |
| PI | Porosity Index |
| PGF | Plant Growth Form |
| IR | Infrared image |
| Fv/Fm | the ratio of variable to maximum fluorescence in dark-adapted leaves |
| PhI | Photoinactivation (%) |
| VPD | Vapor Pressure Deficit (kPa) |
References
- Körner, C. Alpine Plant Life: Functional Plant Ecology of High Mountain Ecosystems; 3rd ed.; Springer: Cham, 2021. [Google Scholar] [CrossRef]
- Sung, D. Y.; Kaplan, F.; Lee, K. J.; Guy, C. L. Acquired Tolerance to Temperature Extremes. Trends Plant Sci. 2003, 8, 179–187. [Google Scholar] [CrossRef] [PubMed]
- Kleier, C.; Rundel, P. W. Energy Balance and Temperature Relations of Azorella compacta, a High-Elevation Cushion Plant of the Central Andes. Plant Biol. 2009, 11, 351–358. [Google Scholar] [CrossRef] [PubMed]
- Baptist, F.; Aranjuelo, I. Interaction of Carbon and Nitrogen Metabolisms in Alpine Plants. In Plants. In Plants in Alpine Regions: Cell Physiology of Adaptation and Survival Strategies; Lütz, C., Ed.; Springer-Verlag: Berlin, 2012. [Google Scholar] [CrossRef]
- Blonder, B.; Michaletz, S. T. A Model for Leaf Temperature Decoupling from Air Temperature. Agric. For. Meteorol. 2018, 262, 354–360. [Google Scholar] [CrossRef]
- Grossman, J. J. Phenological Physiology: Seasonal Patterns of Plant Stress Tolerance in a Changing Climate. New Phytol. 2022, 237, 1508–1524. [Google Scholar] [CrossRef]
- Arroyo, M. T. K.; Dudley, L. S.; Jespersen, G.; Pacheco, D. A.; Cavieres, L. A. Temperature-Driven Flower Longevity in a High-Alpine Species of Oxalis Influences Reproductive Assurance. New Phytol. 2013, 200, 1260–1268. [Google Scholar] [CrossRef]
- Sklenář, P.; Kučerová, A.; Macková, J.; Romoleroux, K. Temperature Microclimates of Plants in a Tropical Alpine Environment: How Much Does Growth Form Matter? Arct. Antarct. Alp. Res. 2016, 48, 61–78. [Google Scholar] [CrossRef]
- Cavieres, L. A.; Sierra-Almeida, A. Assessing the Importance of Cold-Stratification for Seed Germination in Alpine Plant Species of the High-Andes of Central Chile. Perspect. Plant Ecol. Evol. Syst. 2018, 30, 125–131. [Google Scholar] [CrossRef]
- Dudley, L. S.; Arroyo, M. T.; Fernández-Murillo, M. P. Physiological and Fitness Response of Flowers to Temperature and Water Augmentation in a High Andean Geophyte. Environ. Exp. Bot. 2018, 150, 1–8. [Google Scholar] [CrossRef]
- Dolezal, J.; Kurnotova, M.; Stastna, P.; Klimesova, J. Alpine Plant Growth and Reproduction Dynamics in a Warmer World. New Phytol. 2020, 228, 1295–1305. [Google Scholar] [CrossRef]
- Gates, D. M. Biophysical Ecology; Springer Advanced Texts in Life Sciences: New York, NY, 1980. [Google Scholar] [CrossRef]
- Grace, J. Climatic Tolerance and the Distribution of Plants. New Phytol. 1987, 106, 113–130. [Google Scholar] [CrossRef]
- Scherrer, D.; Körner, C. Topographically controlled thermal-habitat differentiation buffers alpine plant diversity against climate warming. J. Biogeogr. 2011, 38, 406–416. [Google Scholar] [CrossRef]
- Graham, E. A.; Rundel, P. W.; Kaiser, W.; Lam, Y.; Stealey, M.; Yuen, E. M. Fine-Scale Patterns of Soil and Plant Surface Temperatures in an Alpine Fellfield Habitat, White Mountains, California. Arct. Antarct. Alp. Res. 2012, 44, 288–295. [Google Scholar] [CrossRef]
- Germino, M. J. Plants in Alpine Environments. In Monson, R. K. (Ed.), Ecology and the Environment, The Plant Sciences; Springer: 2014; Vol. 8, pp 327–362. [CrossRef]
- Sklenář, P.; Hedberg, I.; Cleef, A. M. Island Biogeography of Tropical Alpine Floras. J. Biogeogr. 2014, 41, 287–297. [Google Scholar] [CrossRef]
- Winkler, D. E.; Lubetkin, K. C.; Carrell, A. A.; Jabis, M. D.; Yangk, Y.; Kueppers, L. M. Responses of Alpine Plant Communities to Climate Warming. In Ecosystem Consequences of Soil Warming. Microbes, Vegetation, Fauna and Soil Biochemistry; Mohan, J. E., Ed.; Academic Press, 2019; pp 298–346.
- Leigh, A.; Sevanto, S.; Ball, M. C.; Close, J. D.; Ellsworth, D. S.; Knight, C. A.; Nicotra, A. B.; Vogel, S. Do Thick Leaves Avoid Thermal Damage in Critically Low Wind Speeds? New Phytol. 2012, 194, 477–487. [Google Scholar] [CrossRef]
- Marcante, S.; Erschbamer, B.; Buchner, O.; Neuner, G. Heat Tolerance of Early Developmental Stages of Glacier Foreland Species in the Growth Chamber and in the Field. Plant Ecol. 2014, 215, 747–758. [Google Scholar] [CrossRef] [PubMed]
- Salisbury, F.B.; Spomer, G.G. Leaf temperatures of alpine plants in the field. Planta 1964, 60, 497–505. [Google Scholar] [CrossRef]
- Leigh, A.; Sevanto, S.; Close, J. D.; Nicotra, A. B. The Influence of Leaf Size and Shape on Leaf Thermal Dynamics: Does Theory Hold Up under Natural Conditions? Plant Cell Environ. 2017, 40, 237–248. [Google Scholar] [CrossRef] [PubMed]
- Michaletz, S. T.; Weiser, D.; Zhou, J.; Kaspari, M.; Helliker, B. R.; Enquist, B. J. Plant Thermoregulation: Energetics, Trait–Environment Interactions, and Carbon Economics. Trends Ecol. Evol. 2015, 30, 714–724. [Google Scholar] [CrossRef]
- Michaletz, S. T.; Weiser, M. D.; McDowell, N. G.; Zhou, J.; Kaspari, M.; Helliker, B. R.; Enquist, B. J. The Energetic and Carbon Economic Origins of Leaf Thermoregulation. Nat. Plants 2016, 2, 16129. [Google Scholar] [CrossRef]
- Dong, N.; Prentice, I. C.; Harrison, S. P.; Song, Q. H.; Zhang, Y. P.; Collatz, G. J. Biophysical Homoeostasis of Leaf Temperature: A Neglected Process for Vegetation and Land-Surface Modelling. Glob. Ecol. Biogeogr. 2017, 26, 998–1007. [Google Scholar] [CrossRef]
- Liancourt, P.; Song, X.; Macek, M.; Santrucek, J.; Dolezal, J. Plant’s-Eye View of Temperature Governs Elevational Distributions. Glob. Change Biol. 2020, 26, 4094–4103. [Google Scholar] [CrossRef]
- Bison, N. N.; Michaletz, S. T. Variation in Leaf Carbon Economics, Energy Balance, and Heat Tolerance Traits Highlights Differing Timescales of Adaptation and Acclimation. New Phytol. 2024, 242, 1919–1931. [Google Scholar] [CrossRef] [PubMed]
- Körner, C.; Paulsen, J. A Climate-Based Model to Predict Potential Treeline Position around the Globe. Alp. Bot. 2014, 124, 1–12. [Google Scholar] [CrossRef]
- Meinzer, F. C.; Goldstein, G.; Rada, F. Páramo Microclimate and Leaf Thermal Balance of Andean Giant Rosette Plants. In Rundel, P. W.; Smith, A. P., Meinzer, F. C., Eds.; Tropical Alpine Environments: Plant Form and Function; Cambridge University Press: Cambridge, 1994. [Google Scholar]
- Monasterio, M.; Sarmiento, L. Adaptive Radiation of Espeletia in the Cold Andean Tropics. Trends Ecol. Evol. 1991, 6, 387–391. [Google Scholar] [CrossRef]
- Beck, E. Cold Tolerance in Tropical Alpine Plants. In Tropical Alpine Environments: Plant Form and Function; Rundel, P. W., Smith, A. P., Meinzer, F. C., Eds.; Cambridge University Press: Cambridge, 1994. [Google Scholar]
- Ramsay, P.M. Diurnal temperature variation in the major growth forms of an Ecuadorian páramo plant community. In The Ecology of Volcán Chiles: High-Altitude Ecosystems on the Ecuador-Colombia Border; Ramsay, P.M., Ed.; 2001; pp. 101–112.
- Larcher, W. Bioclimatic Temperatures in the High Alps. In Lütz, C., Ed.; Plants in Alpine Regions; Springer: Vienna, 2012. [Google Scholar] [CrossRef]
- Blonder, B.; Escobar, S.; Kapás, R. E.; Michaletz, S. T. Low Predictability of Energy Balance Traits and Leaf Temperature Metrics in Desert, Montane and Alpine Plant Communities. Funct. Ecol. 2020, 34, 1882–1897. [Google Scholar] [CrossRef]
- Lange, O. L. Untersuchungen über Wärmehaushalt und Hitzeresistenz Mauretanischer Wüsten- und Savannenpflanzen. Flora 1959, 147, 595–651. [Google Scholar] [CrossRef]
- Smith, W. K. Temperatures of Desert Plants—Another Perspective on Adaptability of Leaf Size. Science 1978, 201, 614–616. [Google Scholar] [CrossRef]
- Lin, H.; Chen, Y.; Zhang, H.; Fu, P.; Fan, Z. Stronger Cooling Effects of Transpiration and Leaf Physical Traits of Plants from a Hot Dry Habitat than from a Hot Wet Habitat. Funct. Ecol. 2017, 31, 2202–2211. [Google Scholar] [CrossRef]
- Larcher, W.; Wagner, J. Temperatures in the Life Zones of the Tyrolean Alps. Sitzungsber. Abt. I 2010, 213, 31–51. [Google Scholar] [CrossRef]
- Dvorský, M.; Doležal, J.; de Bello, F.; Klimešová, J.; Klimeš, L. Vegetation Types of East Ladakh: Species and Growth Form Composition along Main Environmental Gradients. Appl. Veg. Sci. 2011, 14, 132–147. [Google Scholar] [CrossRef]
- Luo, Y.; Dong, X.; Yu, T.; Shi, X.; Li, Z.; Yang, W.; Widmer, A.; Karrenberg, S. A Single Nucleotide Deletion in Gibberellin20-oxidase1 Causes Alpine Dwarfism in Arabidopsis. Plant Physiol. 2015, 168, 930–937. [Google Scholar] [CrossRef] [PubMed]
- Roos, R.E.; van Zuijlen, K.; Birkemoe, T.; Klanderud, K.; Lang, S.I.; Bokhorst, S.; Wardle, D.A.; Asplund, J. Contrasting drivers of community-level trait variation for vascular plants, lichens and bryophytes across an elevational gradient. Funct. Ecol. 2019, 33, 2430–2446. [Google Scholar] [CrossRef]
- Valladares, F. Light Heterogeneity and Plants: From Ecophysiology to Species Coexistence and Biodiversity. In Prog. Bot.; Esser, K., Lüttge, U., Beyschlag, W., Hellwig, F., Eds.; Springer, 2003; Vol. 64, pp 1–17.
- Niinemets, Ü.; Valladares, F. Photosynthetic acclimation to simultaneous and interacting environmental stresses along natural light gradients: Optimality and constraints. Plant Biol. 2004, 6, 254–268. [Google Scholar] [CrossRef] [PubMed]
- Baldocchi, D. D.; Keeney, R.; Rey-Sánchez, A. C.; Fisher, J. B. Atmospheric Humidity Deficits Tell Us How Soil Moisture Deficits Down-Regulate Ecosystem Evaporation. Adv. Water Resour. 2022, 159, 104100. [Google Scholar] [CrossRef]
- Jones, H. G.; Rotenberg, E. Energy, Radiation and Temperature Regulation in Plants. Encyclopedia of Life Sciences 2001, 8. [Google Scholar] [CrossRef]
- Monteith, J. L.; Unsworth, M. H. Principles of Environmental Physics, 2nd ed.; Elsevier: Oxford, 1990. [Google Scholar]
- Lewis, M. Physical Concepts. In Food Process Engineering Principles and Data; Cambridge University Press: Cambridge, 2023. [Google Scholar]
- Yates, M. J.; Verboom, G. A.; Rebelo, A. G.; Cramer, M. D. Ecophysiological Significance of Leaf Size Variation in Proteaceae from the Cape Floristic Region. Funct. Ecol. 2010, 24, 485–492. [Google Scholar] [CrossRef]
- Gauslaa, Y. Heat Resistance and Energy Budget in Different Scandinavian Plants. Ecography 1984, 7, 5–6. [Google Scholar] [CrossRef]
- Neuner, G.; Braun, V.; Buchner, O.; Taschler, D. Leaf Rosette Closure in the Alpine Rock Species Saxifraga paniculata Mill.: Significance for Survival of Drought and Heat under High Irradiation. Plant Cell Environ. 1999, 22, 1539–1548. [Google Scholar] [CrossRef]
- Buchner, O.; Neuner, G. Variability of Heat Tolerance in Alpine Plant Species Measured at Different Altitudes. Arct. Antarct. Alp. Res. 2003, 35, 411–420. [Google Scholar] [CrossRef]
- Larcher, W.; Kainmüller, C.; Wagner, J. Survival Types of High Mountain Plants under Extreme Temperatures. Flora 2010, 205, 3–18. [Google Scholar] [CrossRef]
- Neuner, G.; Buchner, O. Dynamics of Tissue Heat Tolerance and Thermotolerance of PS II in Alpine Plants. In Lütz, C., Ed.; Plants. In Lütz, C., Ed.; Plants in Alpine Regions; Springer-Verlag: Vienna, 2012. [Google Scholar] [CrossRef]
- Buchner, O.; Stoll, M.; Karadar, M.; Kranner, I.; Neuner, G. Application of Heat Stress In Situ Demonstrates a Protective Role of Irradiation on Photosynthetic Performance in Alpine Plants. Plant Cell Environ. 2015, 38, 812–826. [Google Scholar] [CrossRef]
- Notarnicola, R.F.; Nicotra, A.B.; Kruuk, L.E.B.; Arnold, P.A. Tolerance of warmer temperatures does not confer resilience to heatwaves in an alpine herb. Front. Ecol. Evol. 2021, 9, 615119. [Google Scholar] [CrossRef]
- Spehn, E. M.; Rudmann-Maurer, K.; Körner, C.; Maselli, D. Climate Change and Its Link to Diversity. In Mountain Biodiversity and Global Change; Rudmann-Maurer, K., Körner, C., Maselli, D., Eds.; GMBA-DIVERSITAS, 2010; pp 33–41.
- Inouye, D. W. Effects of Climate Change on Alpine Plants and Their Pollinators. Ann. N. Y. Acad. Sci. 2020, 1469, 26–37. [Google Scholar] [CrossRef]
- Garreaud, R. Cambio Climático: Bases Físicas e Impactos en Chile. Rev. Tierra Adentro-INIA 2011, 93, 1–14. [Google Scholar]
- González-Reyes, Á.; Jacques-Coper, M.; Bravo, C.; Rojas, M.; Garreaud, R. Evolution of Heatwaves in Chile since 1980. Weather Clim. Extrem. 2023, 41, 100588. [Google Scholar] [CrossRef]
- Arroyo, M. T.; Till-Bottraud, I.; Torres, C.; Henríquez, C. A.; Martínez, J. Display Size Preferences and Foraging Habits of High Andean Butterflies Pollinating Chaetanthera lycopodioides (Asteraceae) in the Subnival of the Central Chilean Andes. Arct. Antarct. Alp. Res. 2007, 39, 347–352. [Google Scholar] [CrossRef]
- Sierra-Almeida, A.; Cavieres, L.A.; Bravo, L.A. Freezing resistance of high-elevation plant species is not related to their height or growth-form in the Central Chilean Andes. Environ. Exp. Bot. 2010, 69, 273–278. [Google Scholar] [CrossRef]
- Wilson, C.; Grace, J.; Allen, S.; Slack, F. Temperature and Stature: A Study of Temperatures in Montane Vegetation. Funct. Ecol. 1987, 1, 405–413. [Google Scholar] [CrossRef]
- Kuhn, M. Rain and Snow at High Elevation. In Lütz, C., Ed.; Plants in Alpine Regions; Springer: 2012; pp 103–113. [CrossRef]
- León-García, I. V.; Lasso, E. High Heat Tolerance in Plants from the Andean Highlands: Implications for Paramos in a Warmer World. PLoS ONE 2019, 14, e0224218. [Google Scholar] [CrossRef]
- Sumner, E. E.; Venn, S. E. Thermal Tolerance and Growth Responses to In Situ Soil Water Reductions among Alpine Plants. Plant Ecol. Divers. 2022, 15, 297–308. [Google Scholar] [CrossRef]
- O’Sullivan, O.S.; Heskel, M.A.; Reich, P.B.; Tjoelker, M.G.; Weerasinghe, L.K.; Penillard, A.; Zhu, L.; Egerton, J.J.G.; Bloomfield, K.J.; Creek, D.; Bahar, N.H.A.; Griffin, K.L.; Hurry, V.; Meir, P.; Turnbull, M.H.; Atkin, O.K. Thermal limits of leaf metabolism across biomes. Glob. Change Biol. 2017, 23, 209–223. [Google Scholar] [CrossRef] [PubMed]
- Körner, C.; Hiltbrunner, E. The 90 Ways to Describe Plant Temperature. Perspect. Plant Ecol. Evol. Syst. 2018, 30, 16–21. [Google Scholar] [CrossRef]
- Pérez, T.; Feeley, K. Photosynthetic heat tolerances and extreme leaf temperatures. Funct. Ecol. 2020, 34, 2236–2245. [Google Scholar] [CrossRef]
- Sandoval-Urzúa, C. (Universidad de Concepción, Concepción, Chile). Personal Communication, 2023. [Google Scholar]
- Aguilera-Torres, C.; Riveros, G.; Morales, L. V.; Sierra-Almeida, A.; Schoebitz, M.; Hasbún, R. Relieving Your Stress: PGPB Associated with Andean Xerophytic Plants Are Most Abundant and Active on the Most Extreme Slopes. Front. Microbiol. 2023, 13, 1062414. [Google Scholar] [CrossRef]
- Pica-Téllez, A.; Garreaud, R.; Meza, F.; Bustos, S.; Falvey, M.; Ibarra, M.; Duarte, K.; Ormazábal, R.; Dittborn, R.; Silva, I. Informe Proyecto ARClim: Atlas de Riesgos Climáticos para Chile; Centro de Ciencia del Clima y la Resiliencia, Centro de Cambio Global UC y Meteodata: Santiago, Chile, 2020. [Google Scholar]
- Jones, H. G.; Vaughan, R. A. Remote Sensing of Vegetation: Principles, Techniques, and Applications; Oxford University Press: Oxford, 2010. [Google Scholar]
- Campbell, G. S.; Norman, J. M. An Introduction to Environmental Biophysics, 2nd ed.; Springer+Business Media: New York, 1998. [Google Scholar] [CrossRef]
- Monteith, J. L.; Unsworth, M. H. Principles of Environmental Physics, 3rd ed.; Academic Press: Oxford, 2008. [Google Scholar]
- Jones, H. G. Plants and Microclimate: A Quantitative Approach to Environmental Plant Physiology; 3rd ed.; Cambridge University Press: Cambridge, 2014. [Google Scholar]
- McIlveen, R. Fundamentals of Weather and Climate; Oxford University Press: Oxford, 1998. [Google Scholar]
- Arnold, P. A.; White, M. J.; Cook, A. M.; Leigh, A.; Briceño, V. F.; Nicotra, A. B. Plants Originating from More Extreme Biomes Have Improved Leaf Thermoregulation. Ann. Bot. 2025, mcaf080. [Google Scholar] [CrossRef] [PubMed]
- Raven, J.A. Transpiration: how many functions? New Phytol. 2008, 180, 905–907. [Google Scholar] [CrossRef]
- Kholová, J.; Nepolean, T.; Hash, C. T.; Supriya, A.; Rajaram, V.; Senthilvel, S.; Kakkera, A.; Yadav, R. S.; Vadez, V. Water Saving Traits Co-Map with a Major Terminal Drought Tolerance Quantitative Trait Locus in Pearl Millet [Pennisetum glaucum (L.) R. Br.]. Mol. Breed. 2012, 30, 1337–1353. [Google Scholar] [CrossRef]
- Belko, N.; Zaman-Allah, M.; Diop, N. N.; Cisse, N.; Zombre, G.; Ehlers, J. D.; Vadez, V. Restriction of Transpiration Rate under High Vapour Pressure Deficit and Non-Limiting Water Conditions Is Important for Terminal Drought Tolerance in Cowpea. Plant Biol. 2013, 15, 304–316. [Google Scholar] [CrossRef]
- Brodribb, T. J.; McAdam, S. A. Passive Origins of Stomatal Control in Vascular Plants. Science 2011, 331, 582–585. [Google Scholar] [CrossRef]
- Running, S.W. Environmental control of leaf water conductance in conifers. Can. J. For. Res. 1976, 6, 104–112. [Google Scholar] [CrossRef]
- Farquhar, G. Feedforward Responses of Stomata to Humidity. Funct. Plant Biol. 1978, 5, 787. [Google Scholar] [CrossRef]
- Franks, P. J.; Cowan, I. R.; Farquhar, G. D. The Apparent Feedforward Response of Stomata to Air Vapour Pressure Deficit: Information Revealed by Different Experimental Procedures with Two Rainforest Trees. Plant Cell Environ. 1997, 20, 142–145. [Google Scholar] [CrossRef]
- Grossiord, C.; Buckley, T. N.; Cernusak, L. A.; Novick, K. A.; Poulter, B.; Siegwolf, R. T. W.; Sperry, J. S.; McDowell, N. G. Plant Responses to Rising Vapor Pressure Deficit. New Phytol. 2020, 226, 1550–1566. [Google Scholar] [CrossRef]
- Drake, P. L.; Froend, R. H.; Franks, P. J. Smaller, Faster Stomata: Scaling of Stomatal Size, Rate of Response, and Stomatal Conductance. J. Exp. Bot. 2013, 64, 495–505. [Google Scholar] [CrossRef] [PubMed]
- Raven, J.A. Speedy small stomata? J. Exp. Bot. 2014, 65, 1415–1424. [Google Scholar] [CrossRef] [PubMed]
- McAusland, L.; Vialet-Chabrand, S.; Davey, P.; Baker, N. R.; Brendel, O.; Lawson, T. Effects of Kinetics of Light-Induced Stomatal Responses on Photosynthesis and Water-Use Efficiency. New Phytol. 2016, 211, 1209–1220. [Google Scholar] [CrossRef]
- Lambers, H.; Oliveira, R.S. Plant Physiological Ecology, 3rd ed.Springer: Cham, 2019. [Google Scholar] [CrossRef]
- Diemer, M. Microclimatic Convergence of High-Elevation Tropical Páramo and Temperate-Zone Alpine Environments. J. Veg. Sci. 1996, 7, 821–830. [Google Scholar] [CrossRef]
- Fetene, M.; Gashaw, M.; Nauke, P.; Beck, E. Microclimate and Ecophysiological Significance of the Tree-like Life-form of Lobelia rhynchopetalum in a Tropical Alpine Environment. Oecologia 1998, 113, 332–340. [Google Scholar] [CrossRef]
- Germino, M. J.; Smith, W. K. Relative Importance of Microhabitat, Plant Form and Photosynthetic Physiology to Carbon Gain in Two Alpine Herbs. Funct. Ecol. 2001, 15, 243–251. [Google Scholar] [CrossRef]
- Cernusca, A. Standörtliche Variabilität in Mikroklima und Energiehaushalt Alpiner Zwergstrauchbestände. Verh. Ges. Ökologie Wien 1976, 9–21, 9–21. [Google Scholar]
- Moser, W.; Brzoska, W.; Zachhuber, K.; Larcher, W. Ergebnisse des IBP-Projekts “Hoher Nebelkogel 3184 m”. Sitzungsber. Oesterr. Akad. Wiss. (Wien) Math. Naturwiss. Kl. Abt. I 1977, 186, 387–419. [Google Scholar]
- Körner, C.; De Moraes, J. A. P. V. Water Potential and Diffusion Resistance in Alpine Cushion Plants on Clear Summer Days. Oecol. Plant. 1979, 14, 109–120. [Google Scholar]
- Körner, C.; Allison, A.; Hilscher, H. Altitudinal Variation of Leaf Diffusive Conductance and Leaf Anatomy in Heliophytes of Montane New Guinea and Their Interrelation with Microclimate. Flora 1983, 174, 91–135. [Google Scholar] [CrossRef]
- Larcher, W. (2003). Physiological Plant Ecology: Ecophysiology and stress physiology of functional group. Verlag, Germany: Springer-Verlag.
- Sierra-Almeida, A. (Universidad de Concepción, Concepción, Chile). Personal Communication, 2024. [Google Scholar]
- Falster, D. S.; Westoby, M. Plant Height and Evolutionary Games. Trends Ecol. Evol. 2003, 18, 337–343. [Google Scholar] [CrossRef]
- Niinemets, Ü. A review of light interception in plant stands from leaf to canopy in different plant functional types and in species with varying shade tolerance. Ecol. Res. 2010, 25, 693–714. [Google Scholar] [CrossRef]
- Sklenář, P.; Jaramillo, R.; Sivila Wojtasiak, S.; Meneses, R. I.; Muriel, P.; Klimeš, A. Thermal Tolerance of Tropical and Temperate Alpine Plants Suggests That ‘Mountain Passes Are Not Higher in the Tropics’. Glob. Ecol. Biogeogr. 2023, 32, 1073–1086. [Google Scholar] [CrossRef]
- Halbritter, A. H.; De Boeck, H. J.; Eycott, A. E.; Reinsch, S.; Robinson, D. A.; Vicca, S.; Berauer, B.; et al. The Handbook for Standardized Field and Laboratory Measurements in Terrestrial Climate Change Experiments and Observational Studies (ClimEx). Methods Ecol. Evol. 2020, 11, 22–37. [Google Scholar] [CrossRef]
- Michaletz, S. T.; Blonder, B. Leaf Thermal Traits. In The Handbook for Standardised Field and Laboratory Measurements in Terrestrial Climate-Change Experiments and Observational Studies (ClimEx); Halbritter, A. H.; De Boeck, H.; Eycott, A.; Reinsch, S.; Robinson, D. A.; Vicca, S.; Berauer, B.; Christiansen, C. T.; Estiarte, M.; Grunzweig, J. M., Eds.; 2020; pp 450–457.
- Sierra-Almeida, A.; Cavieres, L. A. Summer Freezing Resistance of High-Elevation Plant Species Changes with Ontogeny. Environ. Exp. Bot. 2012, 80, 10–15. [Google Scholar] [CrossRef]
- Araya-Osses, D.; Casanueva, A.; Román-Figueroa, C.; Uribe, J. M.; Paneque, M. Climate Change Projections of Temperature and Precipitation in Chile Based on Statistical Downscaling. Clim. Dyn. 2020, 54, 4309–4330. [Google Scholar] [CrossRef]
- Cook, A. M.; Berry, N.; Milner, K. V.; Leigh, A. Water Availability Influences Thermal Safety Margins for Leaves. Funct. Ecol. 2021, 35, 2179–2189. [Google Scholar] [CrossRef]
- Milner, K. V.; French, K.; Krix, D. W.; Valenzuela, S. M.; Leigh, A. The Effects of Spring versus Summer Heat Events on Two Arid Zone Plant Species under Field Conditions. Funct. Plant Biol. 2023, 50, 455–469. [Google Scholar] [CrossRef]
- Sanfuentes, C.; Sierra-Almeida, A.; Cavieres, L.A. Effect of the increase in temperature in the photosynthesis of a high-Andean species at two elevations. Gayana Bot. 2012, 69, 37–45. [Google Scholar] [CrossRef]
- McDowell, N. G.; Sevanto, S. The Mechanisms of Carbon Starvation: How, When, or Does It Even Occur at All? New Phytol. 2010, 186, 264–266. [Google Scholar] [CrossRef] [PubMed]
- Davis, S. D.; Ewers, F. W.; Sperry, J. S.; Portwood, K. A.; Crocker, M. C.; Adams, G. C. Shoot Dieback during Prolonged Drought in Ceanothus (Rhamnaceae) Chaparral of California: A Possible Case of Hydraulic Failure. Am. J. Bot. 2002, 89, 820–828. [Google Scholar] [CrossRef] [PubMed]
- Tyree, M. T.; Vargas, G.; Engelbrecht, B. M.; Kursar, T. A. Drought until Death Do Us Part: A Case Study of the Desiccation-Tolerance of a Tropical Moist Forest Seedling-Tree, Licania platypus (Hemsl.) Fritsch. J. Exp. Bot. 2002, 53, 2239–2247. [Google Scholar] [CrossRef]
- Arroyo, M. T. K.; Squeo, F.; Cavieres, L. A.; Marticorena, C. Chilenische Anden. In Gebirge der Erde. Landschaft, Klima, Pflanzenwelt; Burga, C. A., Klötzli, F., Grabherr, G., Eds.; Ulmer GmbH & Co.: Stuttgart, 2004; pp. 210–219. [Google Scholar]
- González-Ferrán, O. Volcanes de Chile; Instituto Geográfico Militar: Santiago, 1995. [Google Scholar]
- Dixon, H. J.; Murphy, M. D.; Sparks, R. J.; Chávez, R.; Naranjo, J. A.; Dunkley, P. N.; Young, S. R.; Gilbert, J. S.; Pringle, M. R. The Geology of Nevados de Chillán Volcano, Chile. Rev. Geol. Chile 1999, 26, 227–253. [Google Scholar] [CrossRef]
- Rodríguez, R.; Grau, J.; Baeza, C.; Davies, A. Lista comentada de las plantas vasculares de los Nevados de Chillán, Chile. Gayana Bot. 2008, 65, 153–197. [Google Scholar] [CrossRef]
- Pfanzelt, S.; Grau, J.; Rodríguez, R. Vegetation mapping of the Nevados de Chillán volcanic complex, Biobío Region, Chile. Gayana Bot. 2008, 65, 209–219. [Google Scholar] [CrossRef]
- Sierra-Almeida, A.; Aguilera-Torres, C.; Sandoval-Urzúa, C.; Morales, L. V.; González-Concha, D.; Urrutia-Lozano, E.; Marticorena, A.; Teillier, S.; Baeza, C.; Finot, V. Guía de Campo: Plantas de Alta Montaña en el Corredor Biológico Nevados de Chillán-Laguna del Laja; Ediciones Corporación Chilena de la Madera: Concepción, Chile, 2022. [Google Scholar]
- González-Concha, D. Diversidad Florística y Funcional en Nevados de Chillán: Importancia del Microclima en Explicar Contrastes entre Laderas; Undergraduate Thesis, Universidad de Concepción: Concepción, Chile, 2023. [Google Scholar]
- Urtubey, E.; Baeza, C. M.; López-Sepúlveda, P.; König, C.; Samuel, R.; Weiss-Schneeweiss, H.; Stuessy, T. F.; Ortiz, M. A.; Talavera, M.; Talavera, S.; Terrab, A.; Ruas, C. F.; Muellner-Riehl, A. N.; Guo, Y. P. Systematics of Hypochaeris Section Phanoderis (Asteraceae, Cichorieae); Syst. Bot. Monogr. 2019, 106, 1–204. [Google Scholar]
- Deginani, N. B. Revisión de las Especies Argentinas del Género Phacelia (Hydrophyllaceae). Darwiniana 1982, 24, 405–496. [Google Scholar]
- Watson, J. M.; Flores, A. R.; Nicola, M. V.; Marcussen, T. Viola Subgenus Andinium, Preliminary Monograph; Scottish Rock Garden Club with International Rock Gardener: Glasgow, UK, 2021. [Google Scholar]
- Fernández, M.; Calviño, C. I. Nueva Clasificación Infragenérica de Azorella (Apiaceae, Azorelloideae) y Sinopsis del Subgénero Andinae. Darwiniana 2019, 7, 289–304. [Google Scholar] [CrossRef]
- Ferreyra, M.; Ezcurra, C.; Marticorena, C.; Morrone, J. J.; Roig-Juñent, S.; Roig, F. A.; Aizen, M. A.; Ezcurra, I. Flores de Alta Montaña de los Andes Patagónicos: Guía para el Reconocimiento de las Principales Especies de Plantas Vasculares Altoandinas, 1st ed.; L.O.L.A: Buenos Aires, 2005. [Google Scholar]
- Cabrera, A. L. El Género Senecio en Chile. Lilloa 1949, 15, 27–501. [Google Scholar]
- López, A.; Molina-Aiz, F. D.; Valera, D. L.; Peña, A. Determining the Emissivity of the Leaves of Nine Horticultural Crops by Means of Infrared Thermography. Sci. Hortic. 2012, 137, 49–58. [Google Scholar] [CrossRef]
- Chen, C. Determining the Leaf Emissivity of Three Crops by Infrared Thermometry. Sensors (Basel) 2015, 15, 11387–11401. [Google Scholar] [CrossRef]
- Harrap, M. J. M.; Hempel de Ibarra, N.; Whitney, H. M.; Rands, S. A. Reporting of Thermography Parameters in Biology: A Systematic Review of Thermal Imaging Literature. R. Soc. Open Sci. 2018, 5, 181281. [Google Scholar] [CrossRef]
- Pérez-Harguindeguy, N.; Díaz, S.; Garnier, E.; Lavorel, S.; Poorter, H.; Jaureguiberry, P.; Bret-Harte, M.S.; Cornwell, W.K.; Craine, J.M.
- Cook, A. M.; Rezende, E. L.; Petrou, K.; Leigh, A. Beyond a Single Temperature Threshold: Applying a Cumulative Thermal Stress Framework to Plant Heat Tolerance. Ecol. Lett. 2024, 27. [Google Scholar] [CrossRef]
- Buchner, O.; Karadar, M.; Bauer, I.; Neuner, G. A Novel System for In Situ Determination of Heat Tolerance of Plants: First Results on Alpine Dwarf Shrubs. Plant Methods 2013, 9, 7. [Google Scholar] [CrossRef] [PubMed]
- Maxwell, K.; Johnson, G. N. Chlorophyll Fluorescence—A Practical Guide. J. Exp. Bot. 2000, 51, 659–668. [Google Scholar] [CrossRef] [PubMed]
- Bannister, P.; Colhoun, C. M.; Jameson, P. E. The Winter Hardening and Foliar Frost Resistance of Some New Zealand Species of Pittosporum. N. Z. J. Bot. 1995, 33, 409–414. [Google Scholar] [CrossRef]
- Bannister, P.; Maegli, T.; Dickinson, K.; Halloy, S.; Knight, A.; Lord, J. Will Loss of Snow Cover during Climatic Warming Expose New Zealand Alpine Plants to Increased Frost Damage? Oecologia 2005, 144, 245–256. [Google Scholar] [CrossRef]
- R Core Team. R: A Language and Environment for Statistical Computing; R Foundation for Statistical Computing: Vienna, Austria, 2023. [Google Scholar]
- Wood, S. N. Generalized Additive Models: An Introduction with R, 2nd ed.; CRC Press: Boca Raton, FL, 2017. [Google Scholar]
- Hothorn, T.; Zeileis, A.; Farebrother, R. W.; Cummins, C.; Millo, G.; Mitchell, D. lmtest: Testing Linear Regression Models (Version 0.9-34) [R package]. Available online: https://cran.r-project.org/package=lmtest.
- Fox, J.; Weisberg, S. An R Companion to Applied Regression, 3rd ed.; Sage Publications: Thousand Oaks, CA, 2019. [Google Scholar]
Figure 1.
Principal component analysis (PCA) of environmental factors that control plant temperature. (A) Principal components (PC1 and PC2) were defined by the combination of air temperature (AT), photosynthetically active radiation (PAR), relative humidity (RH), soil temperature (ST), and wind speed (WS). (B) The contribution of environmental variables (%) to PC1 and PC2 is shown on the right. The variance explained by PC1 and PC2 is shown in brackets.
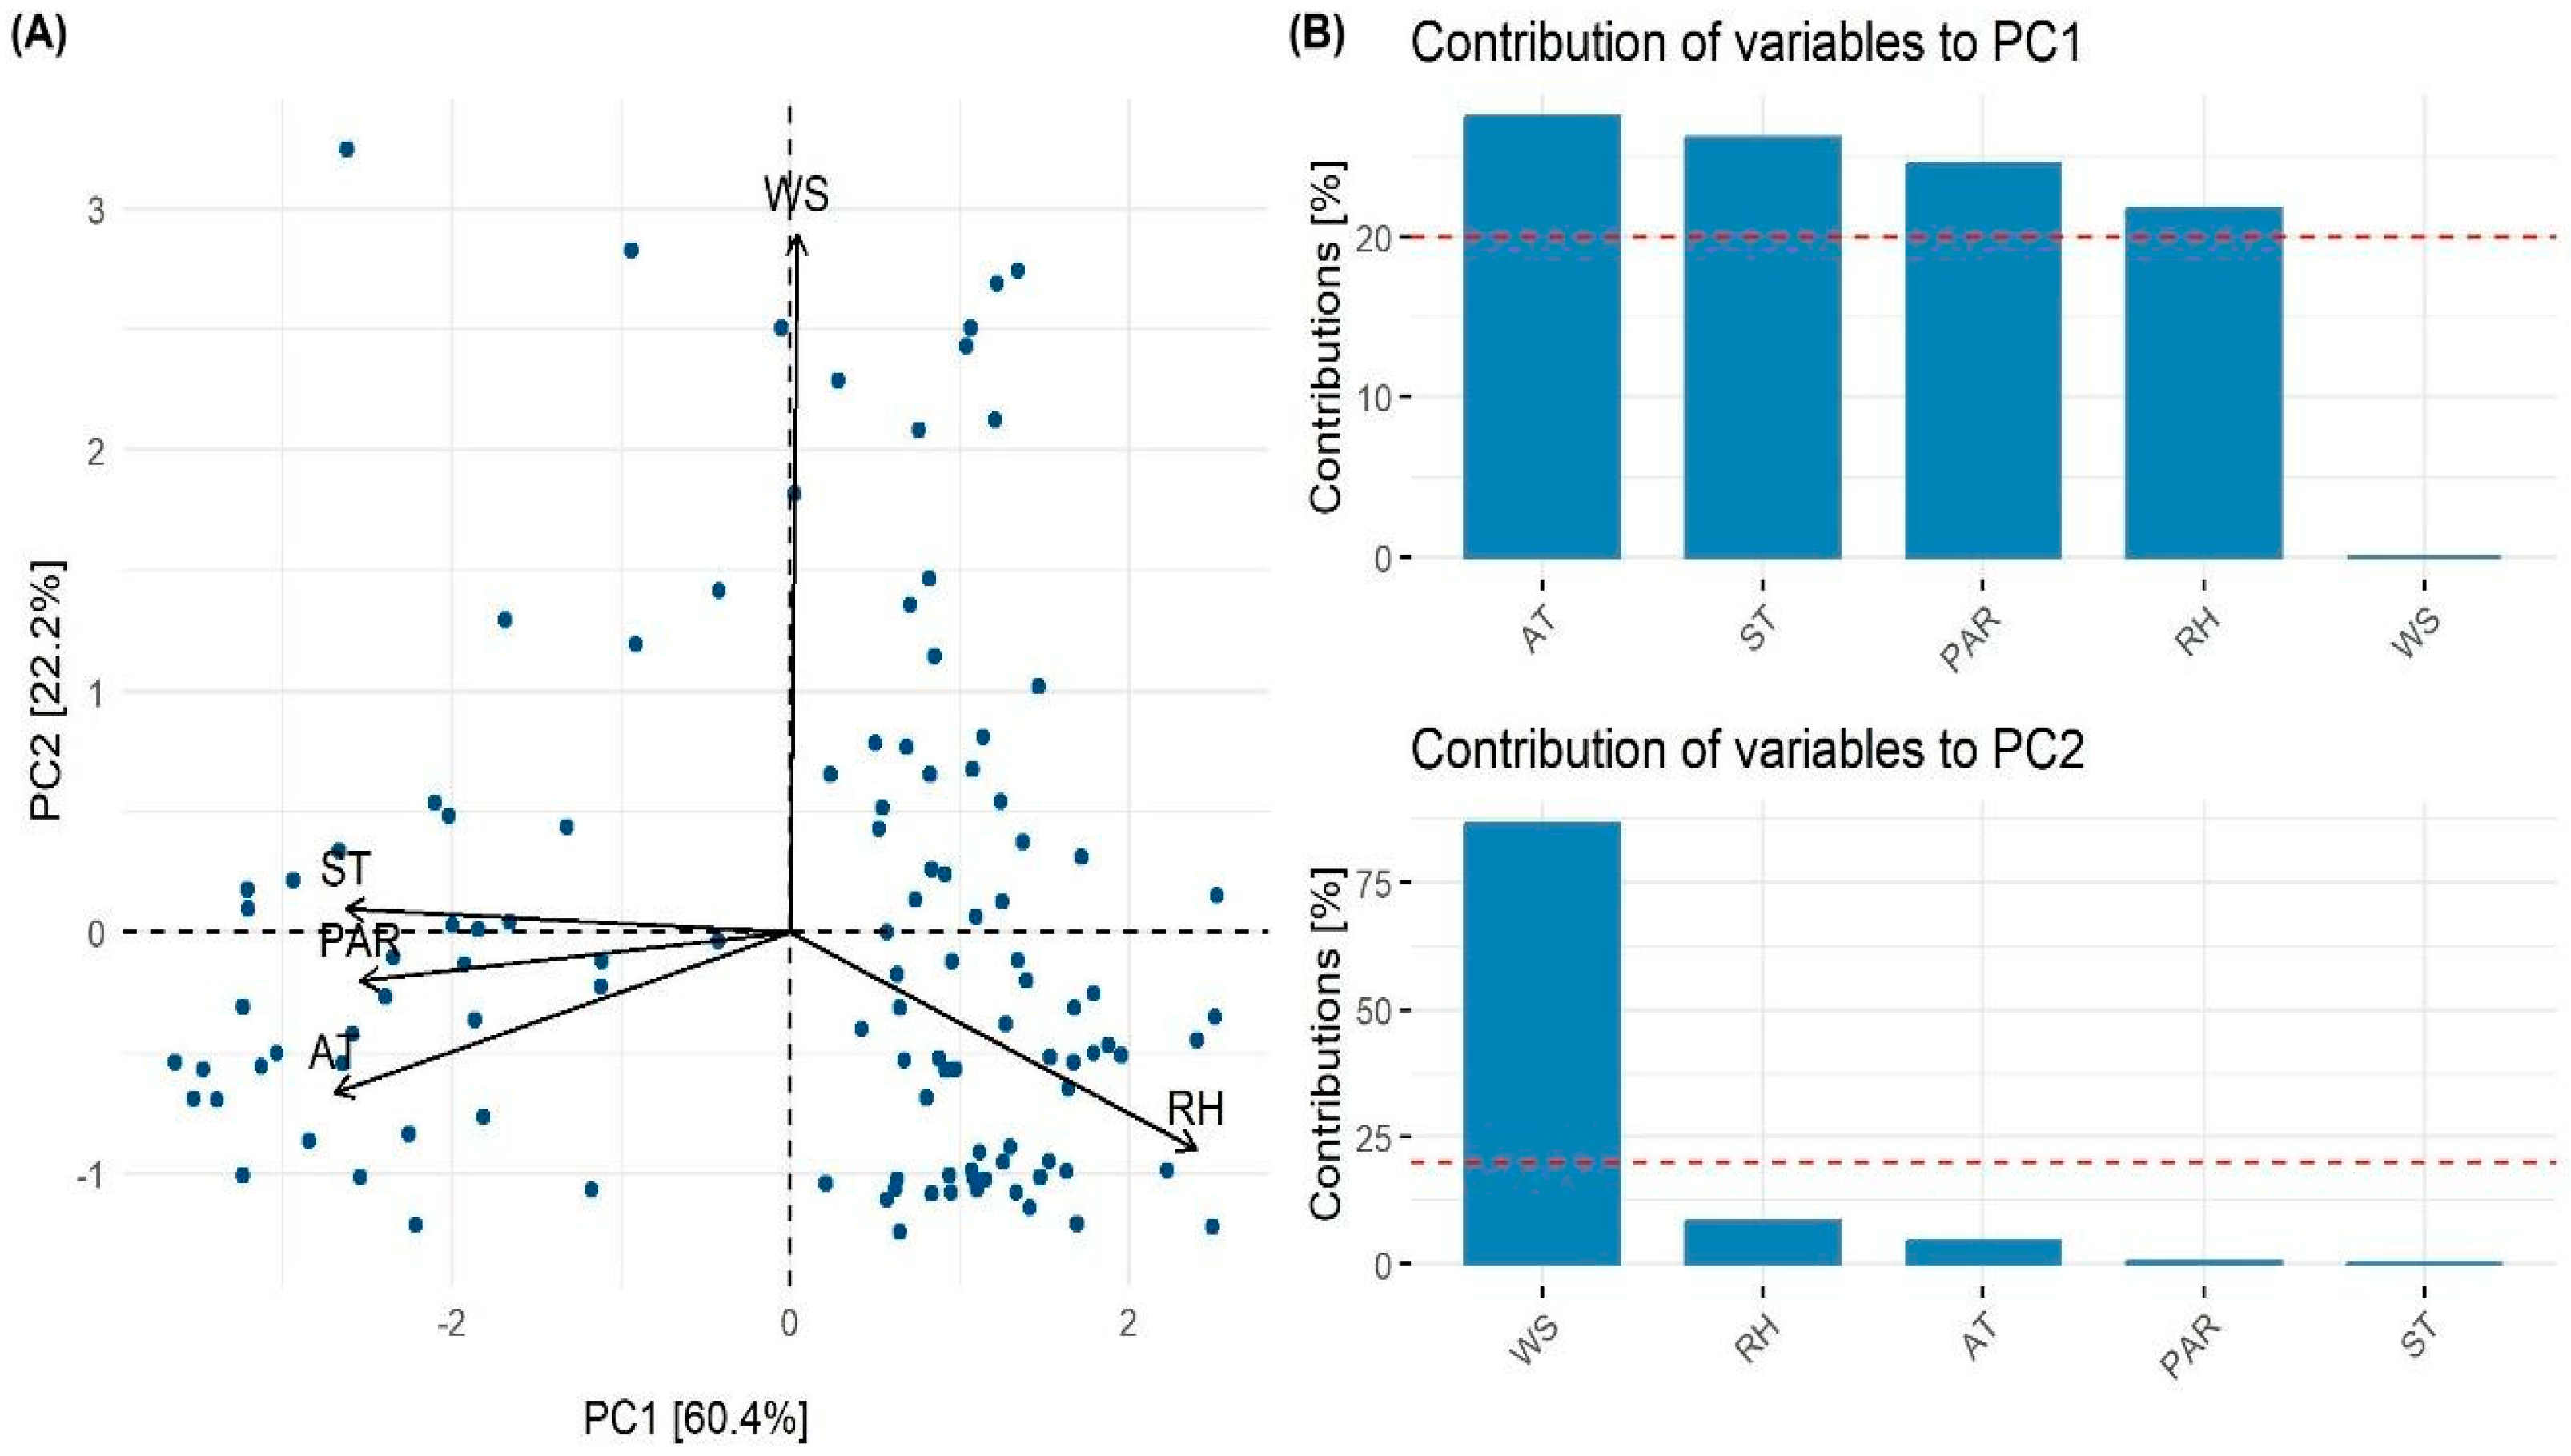
Figure 2.
Infrared images of the plant study species. IR images were taken between 14-15 h (P2) on a north-facing slope on three individual days: March 7, 8, and April 12, 2023. In the upper section are the rosette species: H. tenuifolia, P. secunda, and V. aizoon. In the lower section are the shrub species: A. prolifera, B. empetrifolia, and S. pachyphyllos.
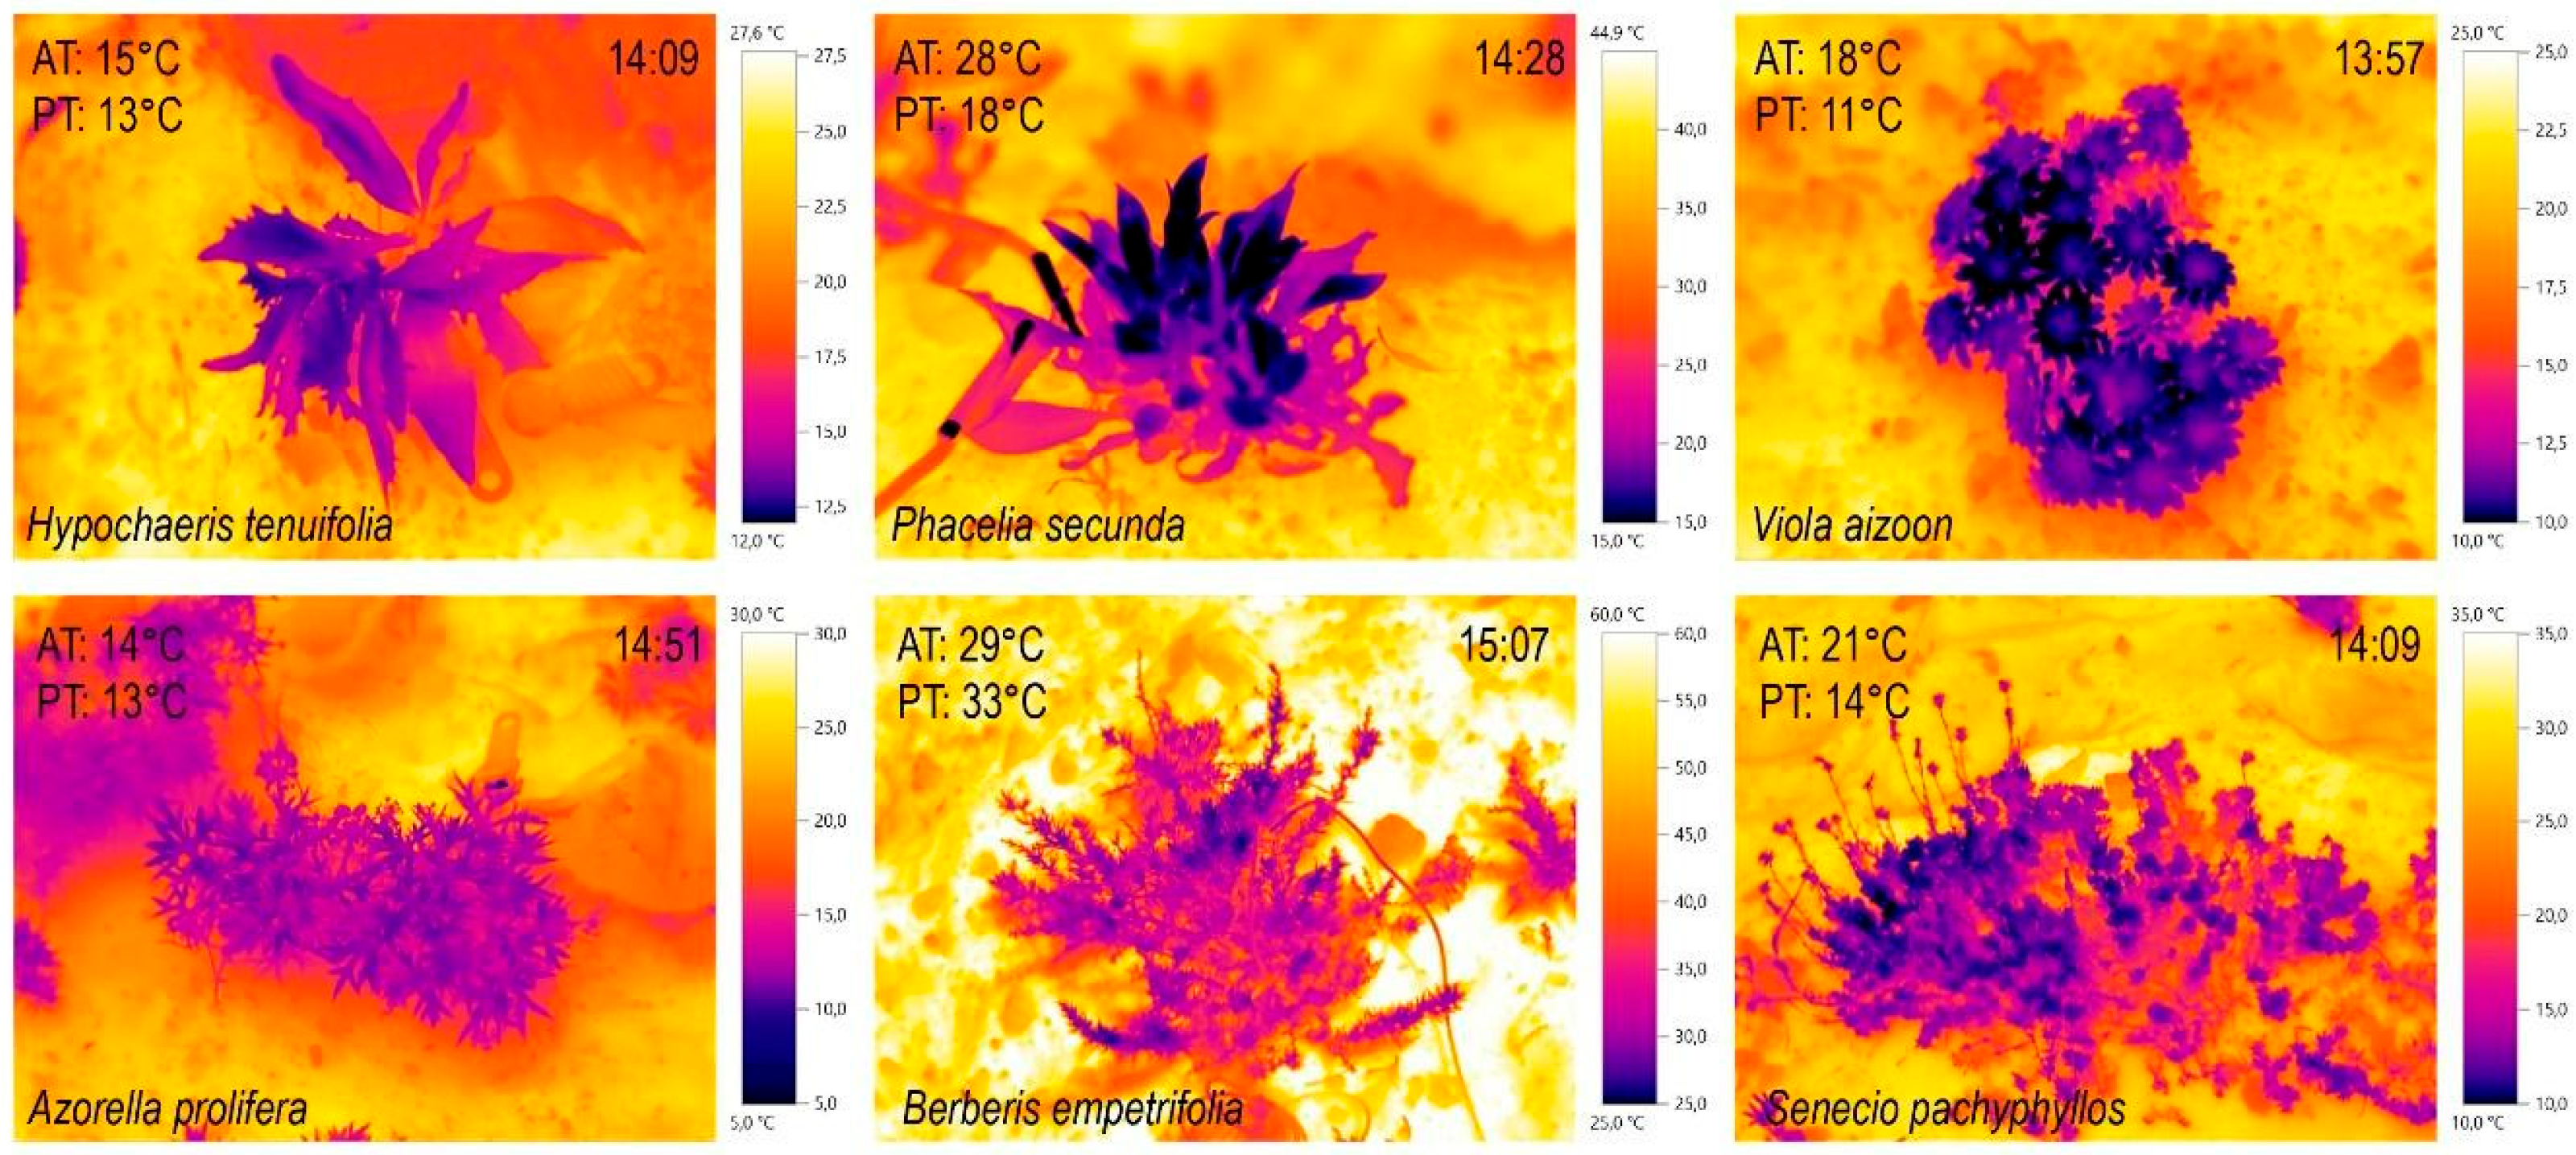
Figure 3.
Air (blue) and plant (green) temperatures were measured during three different periods: P1, 10:00-12:00; P2, 13:00-15:00; P3, 16:00-18:00 hours. For B. empetrifolia, P1 represents 12:00-13:00 hours. Species abbreviations correspond to plant rosettes: Ht, Hypochaeris tenuifolia; Ps, Phacelia secunda; and Va, Viola aizoon; and dwarf shrubs: Ap, Azorella prolifera; Be, Berberis empetrifolia; and Sp, Senecio pachyphyllos. Circles represent mean values, and the whiskers show the standard deviation. Blue bars represent mean thermal decoupling (TD), and the whiskers show the standard deviation. The significance level is indicated by p-values 0.001***, 0.01** or 0.05*; n.s. indicates non-significant differences.
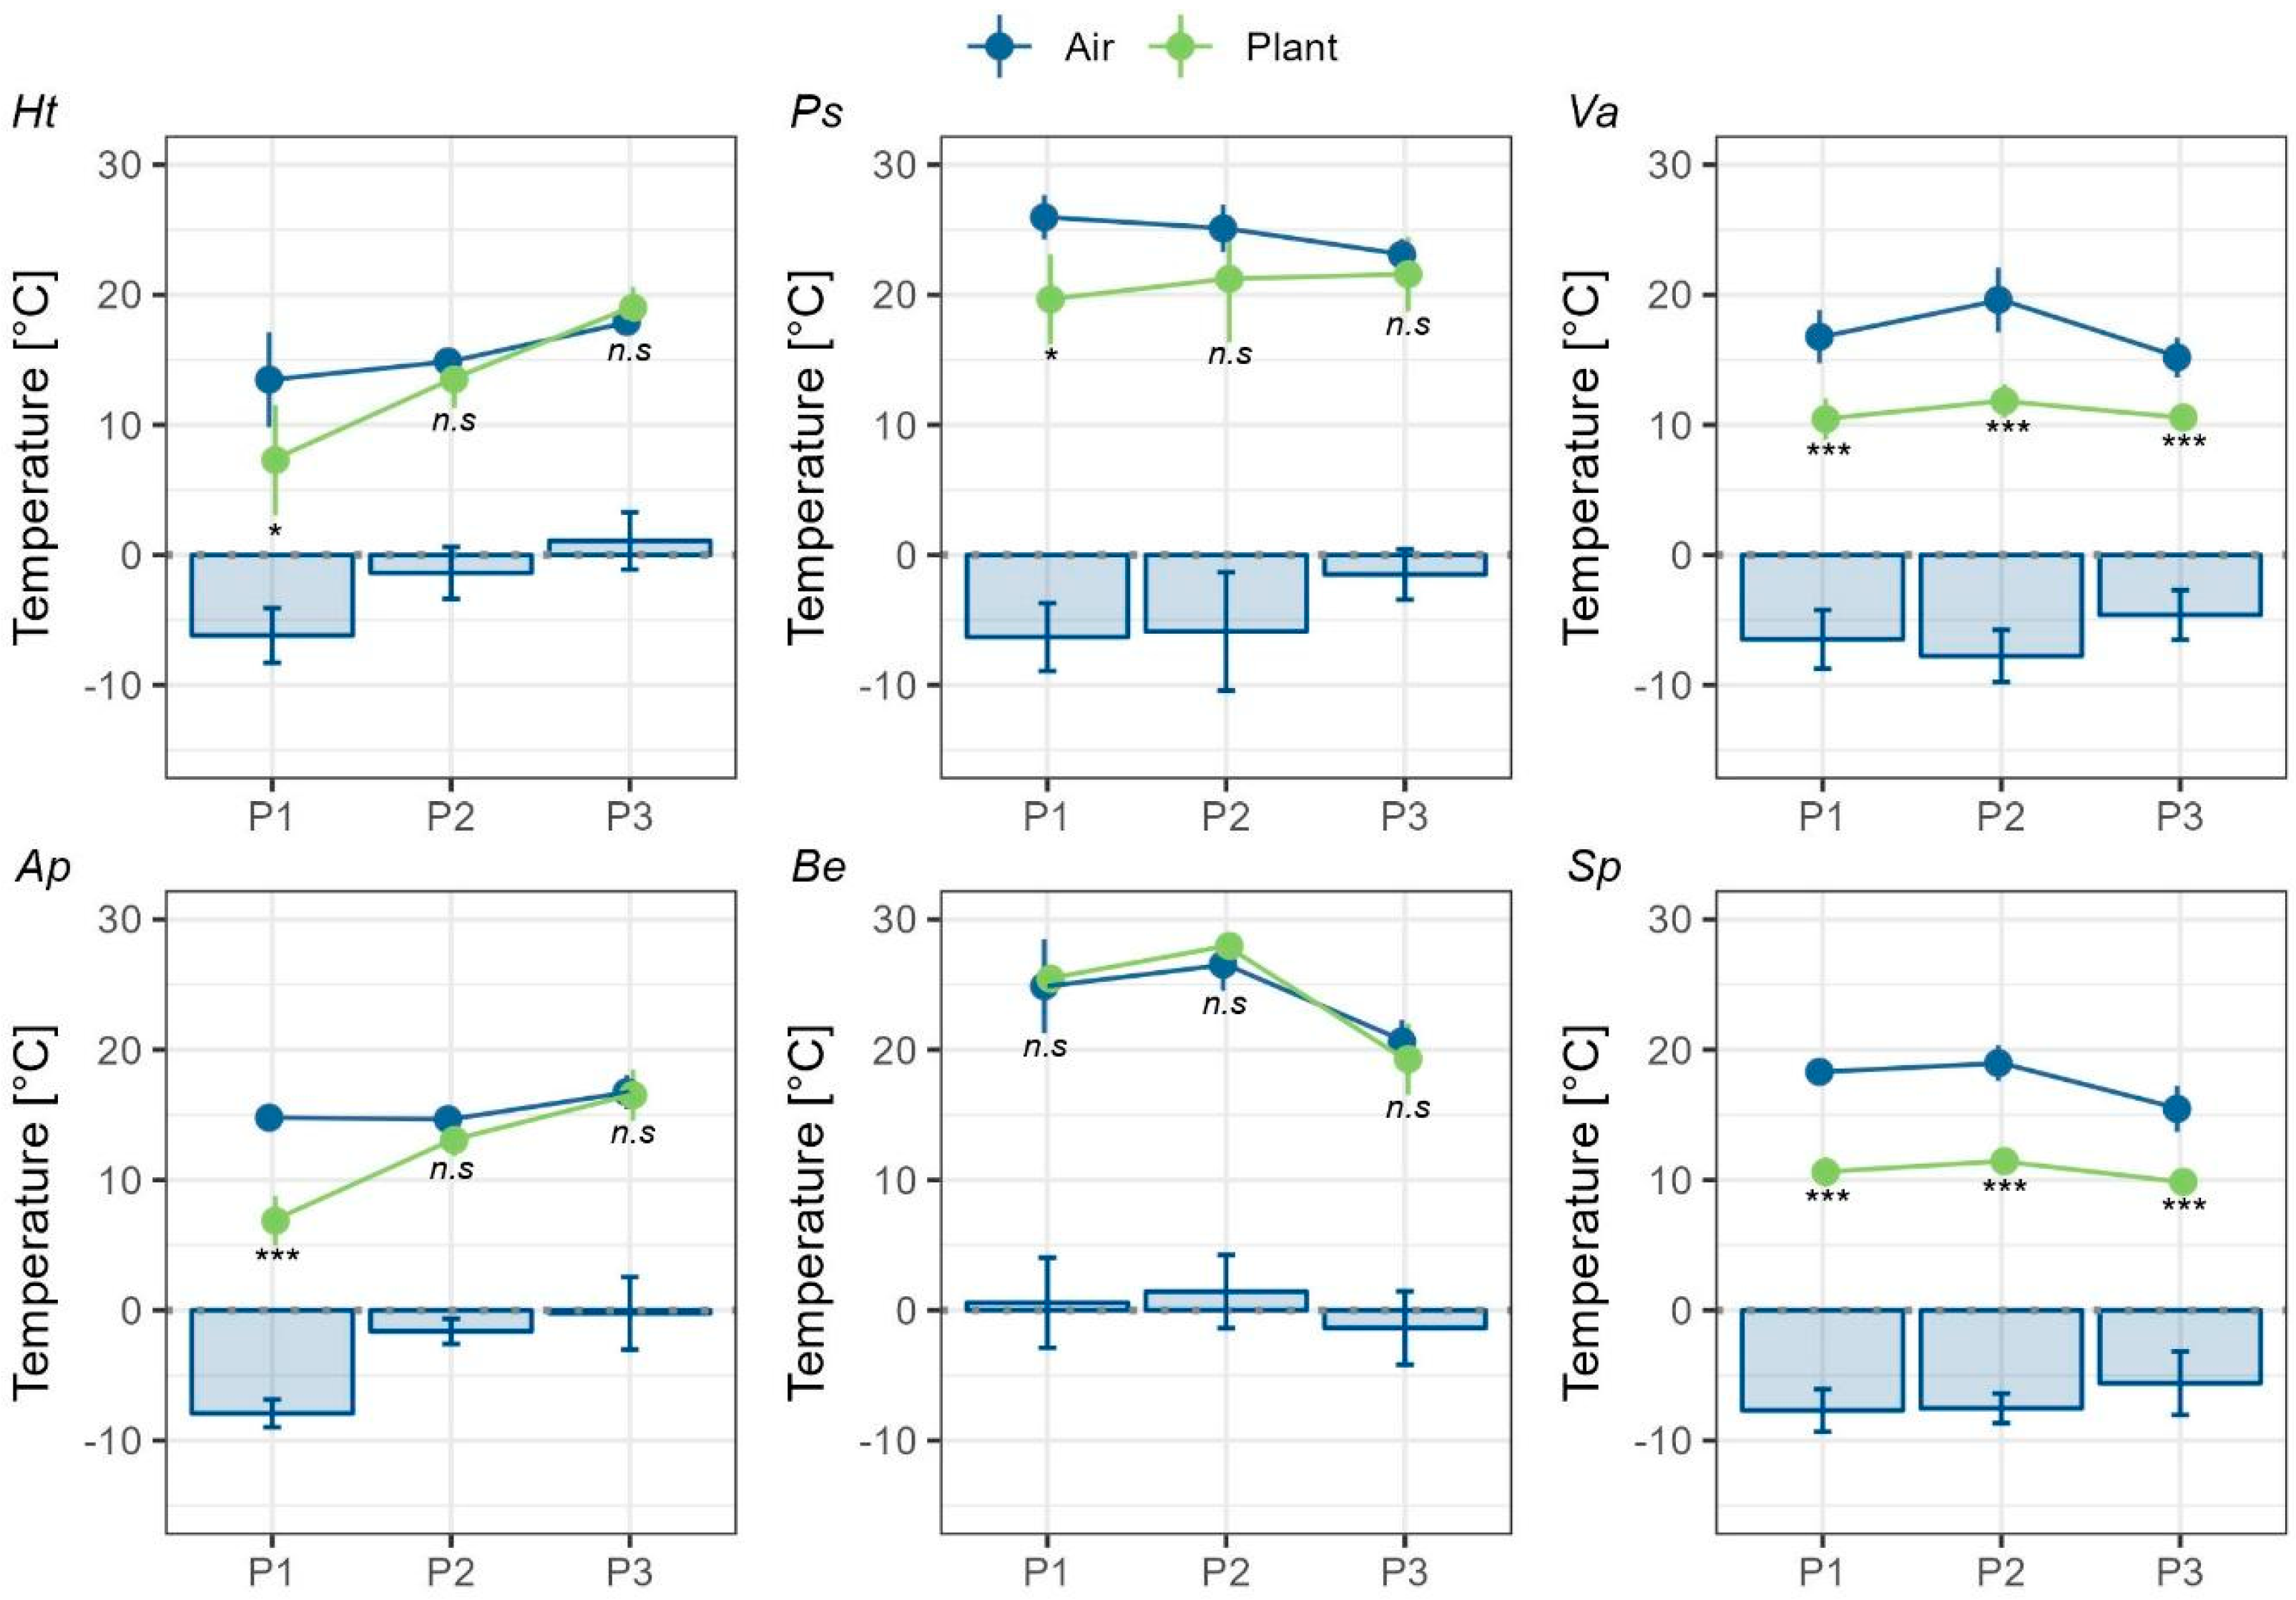
Figure 4.
Heat resistance (LT50, ºC) measured in leaves. LT50 was estimated in plant rosettes: Ht, Hypochaeris tenuifolia; Ps, Phacelia secunda; and Va, Viola aizoon; and dwarf shrub species: Ap, Azorella prolifera; Be, Berberis empetrifolia; and Sp, Senecio pachyphyllos. Boxes indicate the median (= second quartile; line inside the box) and extend from the first to the third quartile. The whiskers show at maximum the 1.5-fold interquartile range. Circles represent mean values. Different superscripts indicate significant differences in LT50 among species (p <0.05).
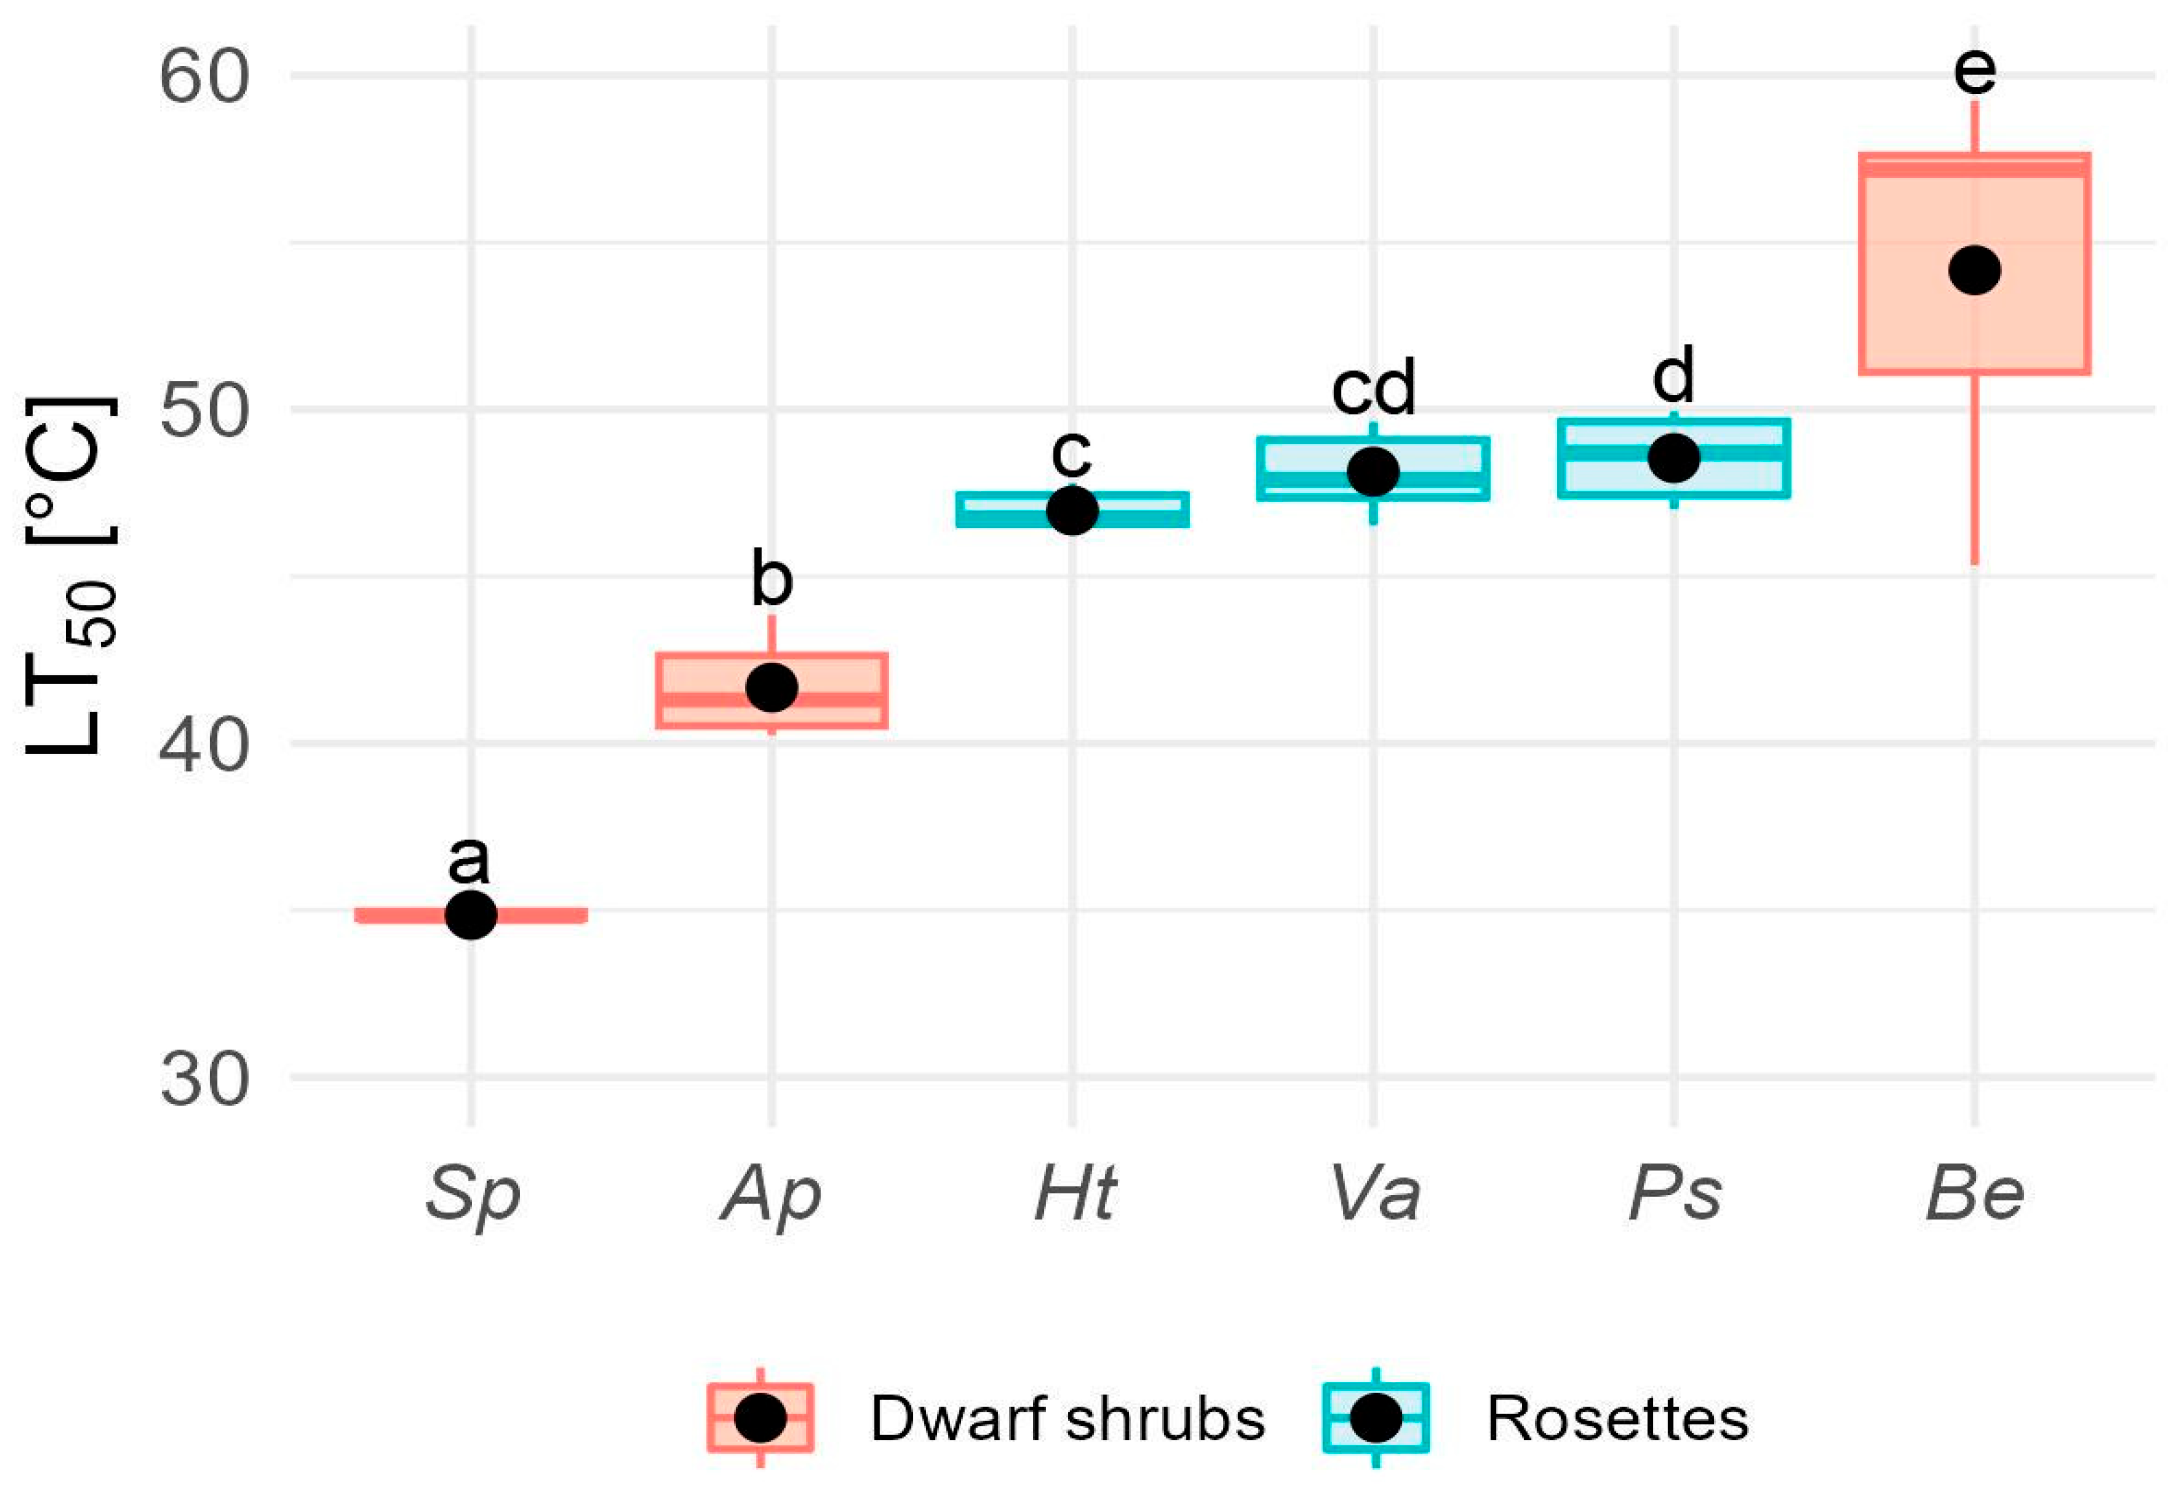
Figure 5.
Relationship between thermal decoupling (TD) and heat resistance (LT50) of (A) all studied species; (B) TD-LT50 correlations of plant rosettes (circles); (C) and dwarf shrubs (triangles) separately. Spearman’s correlation coefficient is shown at the top of every plot.
Figure 5.
Relationship between thermal decoupling (TD) and heat resistance (LT50) of (A) all studied species; (B) TD-LT50 correlations of plant rosettes (circles); (C) and dwarf shrubs (triangles) separately. Spearman’s correlation coefficient is shown at the top of every plot.
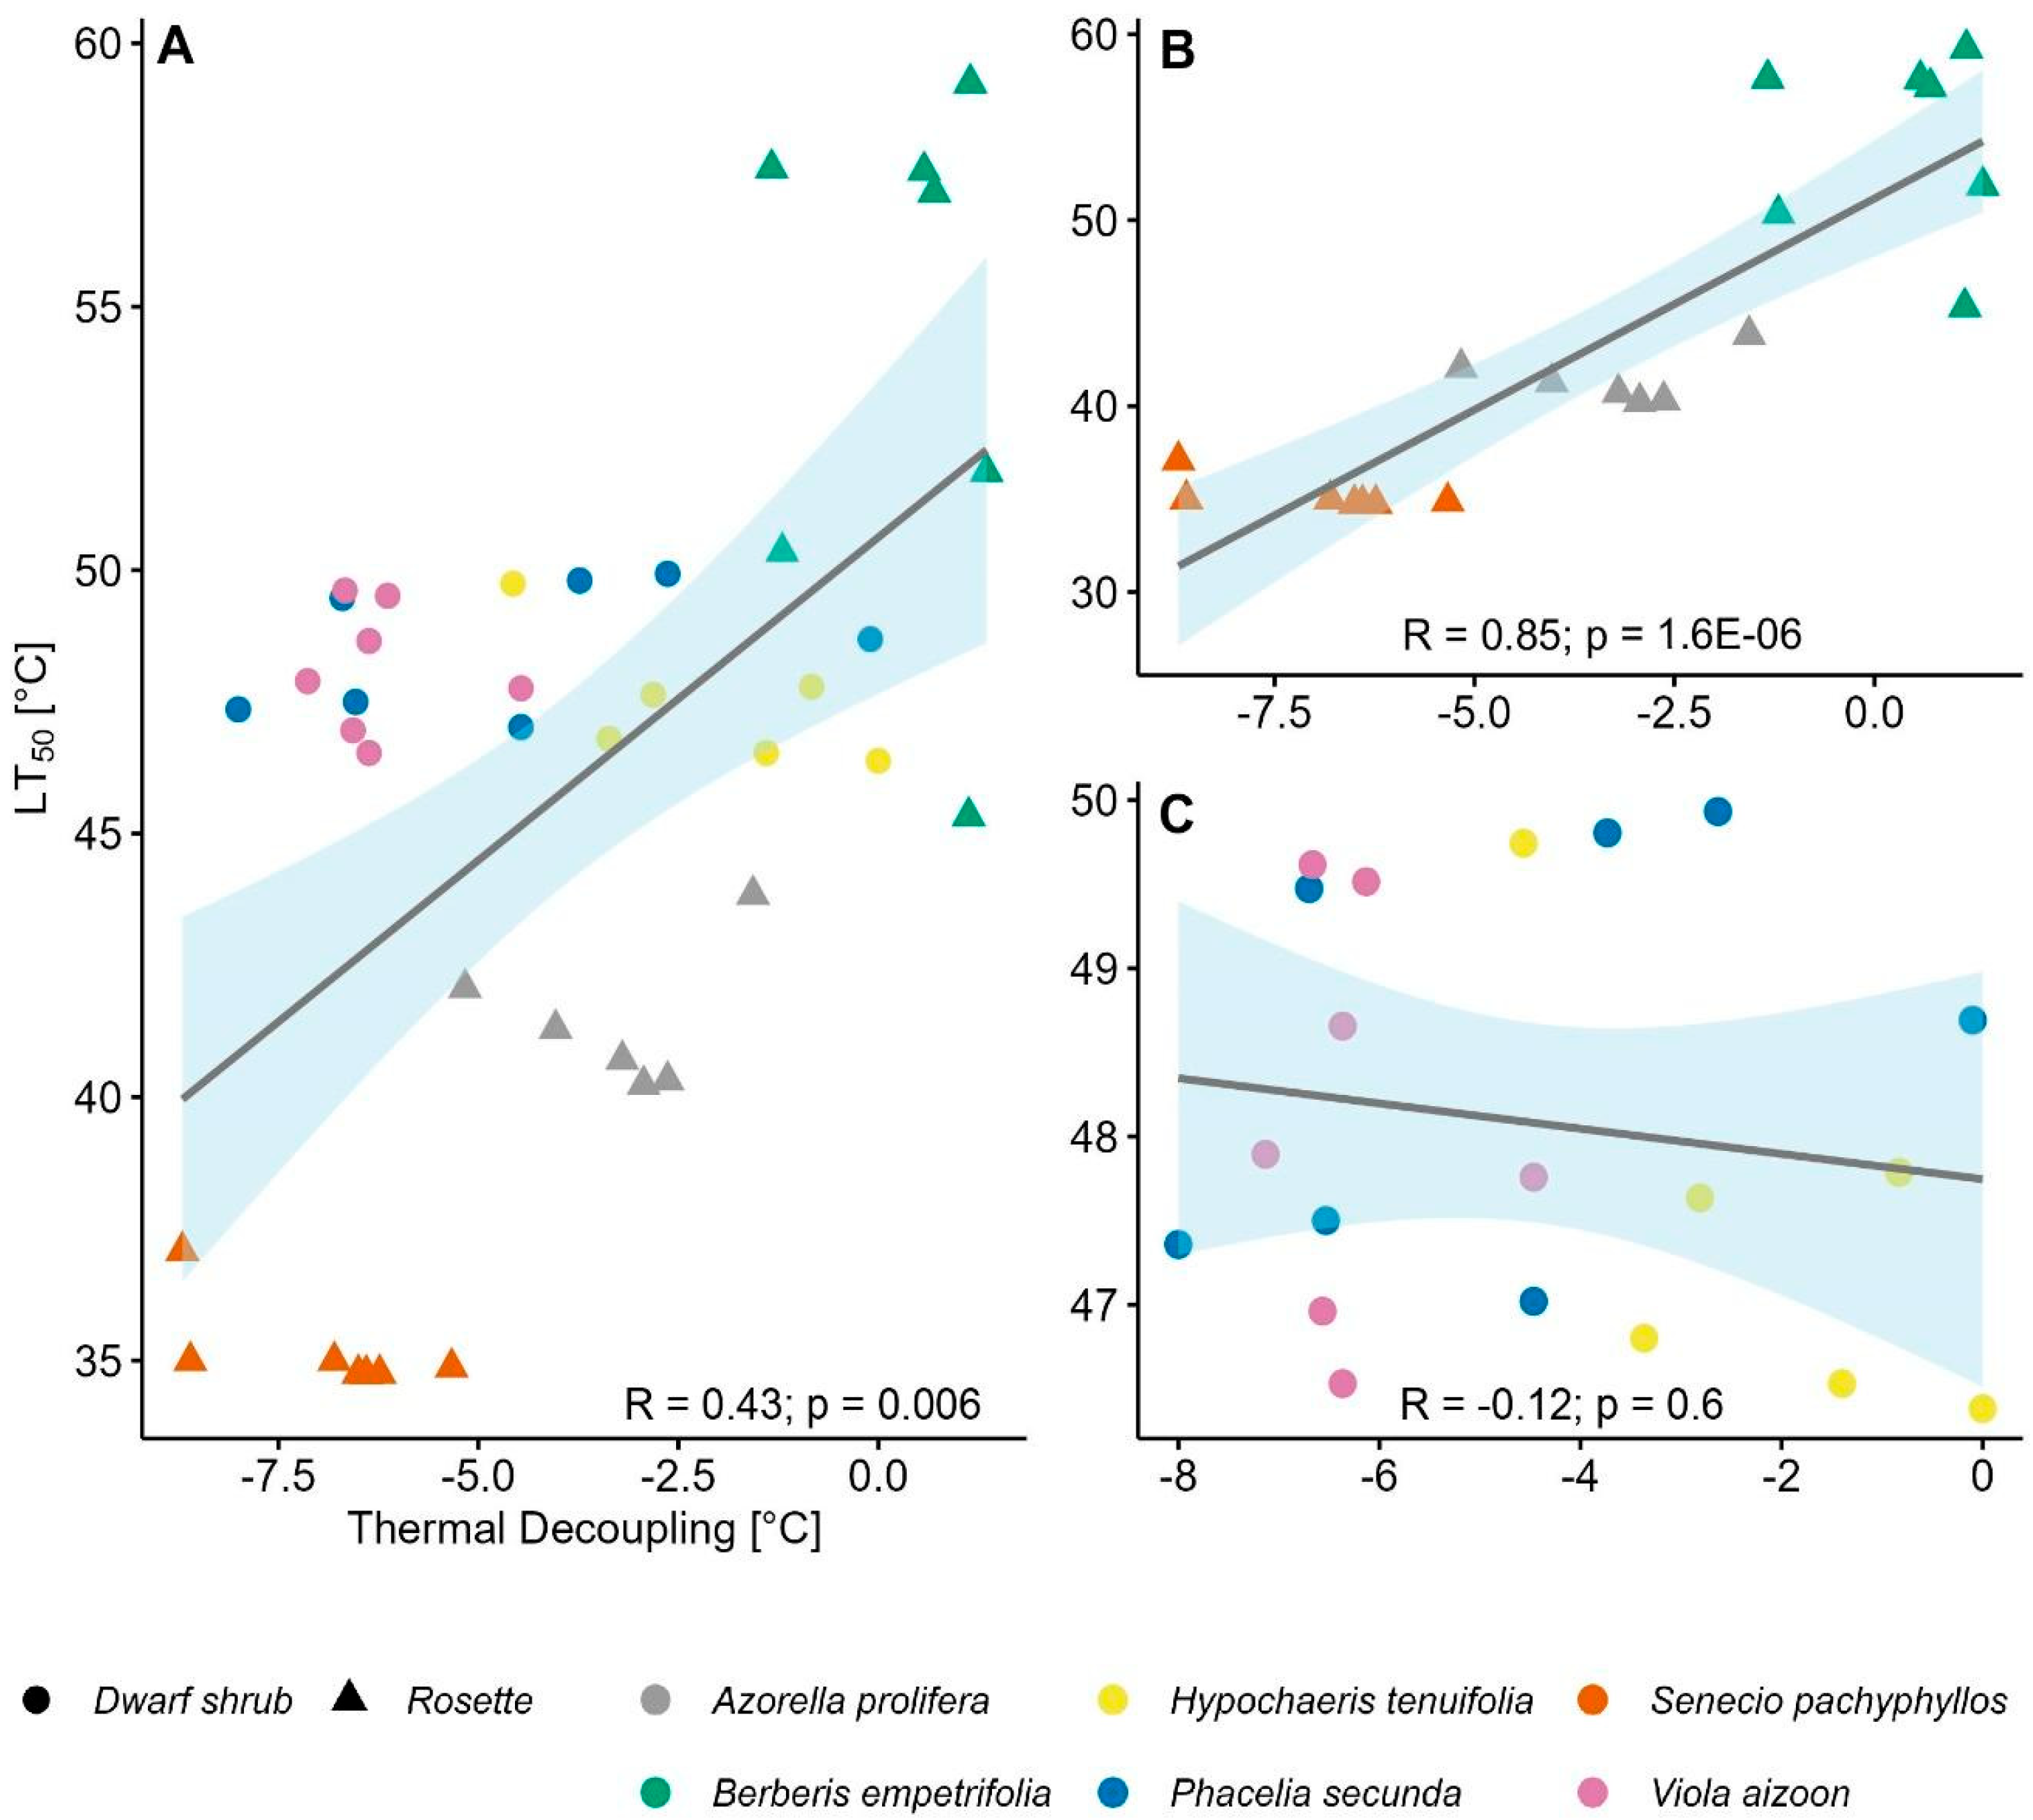
Figure 6.
Plants studied species in the alpine belt of the Nevados de Chillán Volcano complex. In the upper section, the plant rosette species are: (A) Hypochaeris tenuifolia, (B) Phacelia secunda, and (C) Viola aizoon. In the lower section, the dwarf shrub species: (D) Azorella prolifera, (E) Berberis empetrifolia, and (F) Senecio pachyphyllos.
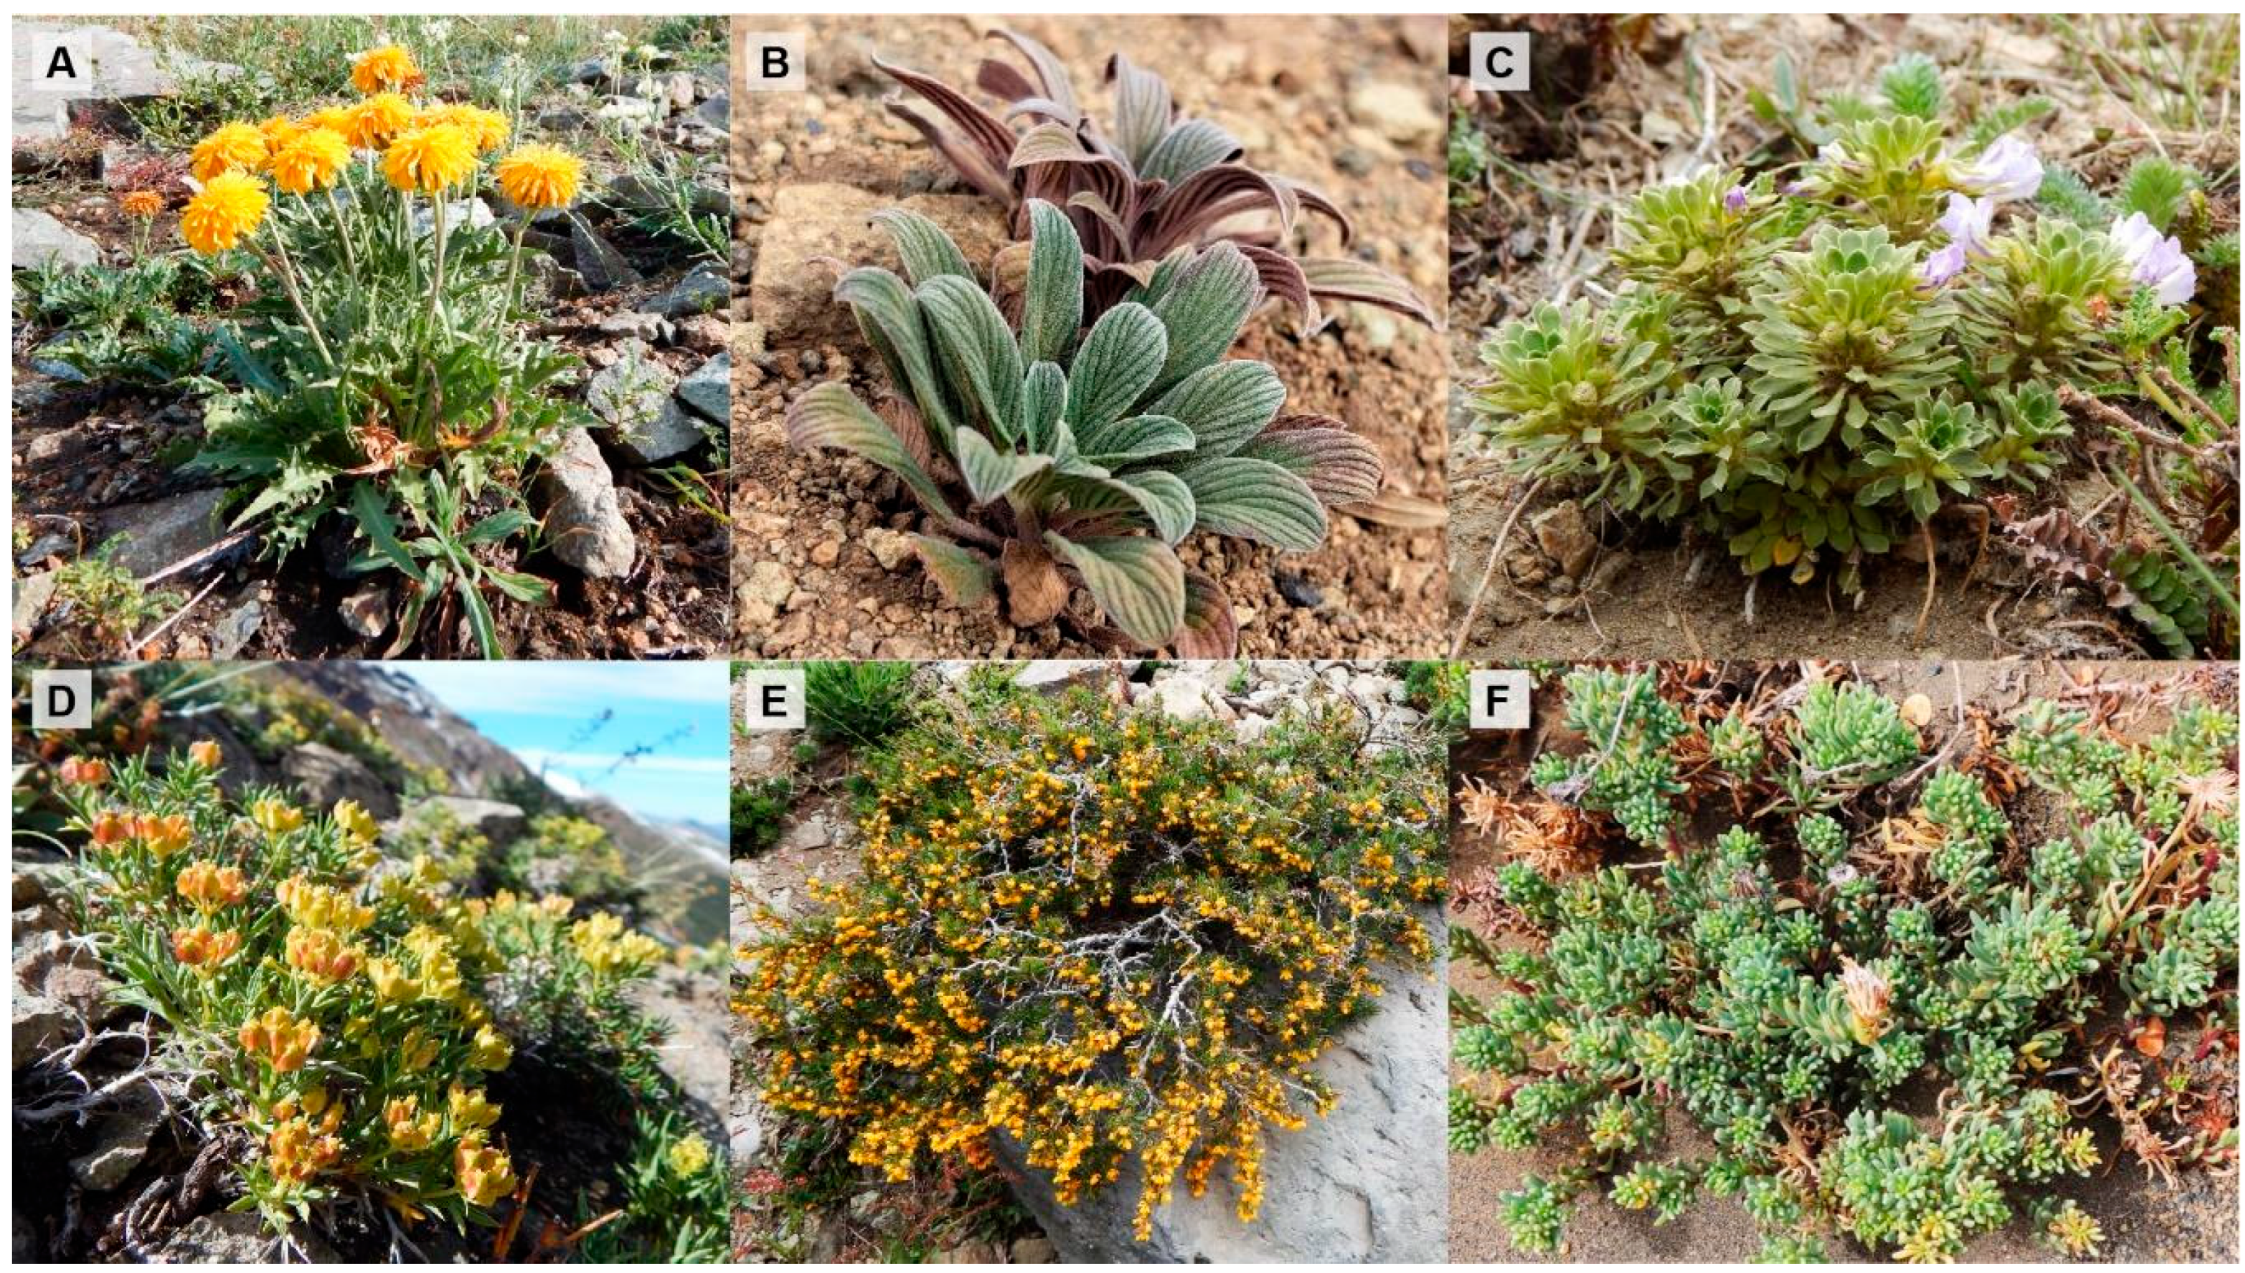

Table 1.
Summary of the generalized additive model (GAM) explaining plant temperature as a function of the first two principal components (PC1 and PC2) derived from environmental variables. The model includes smooth terms for PC1 and PC2. Edf = estimated degrees of freedom; Ref.df = reference degrees of freedom used for approximate F-tests. Significant p-values are highlighted in bold.
| Effect | Edf | Red.df | F value | p-value |
|---|---|---|---|---|
| PC1 | 6.89 | 7.96 | 57.32 | < 2.2e-16 |
| PC2 | 1 | 1 | 2.54 | 0.114 |
Table 2.
Results of the linear model testing the effects of plant architectural traits and sampling date on thermal decoupling (TD). The model includes plant height (PH), circularity index (CI), porosity index (PI), and the interaction between PH and CI, with sampling date as a fixed effect. Degrees of freedom are shown as numerator (numDF) and denominator (denDF) for each term. The proportion of variance explained by each term is calculated as the sum of squares of the term divided by the total sum of squares (188.53). Significant p-values are highlighted in bold.
| Effect | numDF | denDF | Sum Sq | Mean Sq | F value | p-value | Explained variance |
|---|---|---|---|---|---|---|---|
| Height | 1 | 21 | 45.02 | 45.02 | 18.8 | 0.0003 | 23.88% |
| Circularity index | 1 | 21 | 36.21 | 36.21 | 15.12 | 0.0008 | 19.21% |
| Porosity index | 1 | 21 | 2.57 | 2.57 | 1.07 | 0.3123 | 1.36% |
| Height and Circularity index interaction | 1 | 21 | 7.00 | 7.00 | 2.93 | 0.1020 | 3.71% |
| Sampling date | 1 | 21 | 47.44 | 47.44 | 19.82 | 0.0002 | 25.17% |
| Residuals | 21 | - | 50.28 | 2.39 |
Disclaimer/Publisher’s Note: The statements, opinions and data contained in all publications are solely those of the individual author(s) and contributor(s) and not of MDPI and/or the editor(s). MDPI and/or the editor(s) disclaim responsibility for any injury to people or property resulting from any ideas, methods, instructions or products referred to in the content. |
© 2025 by the authors. Licensee MDPI, Basel, Switzerland. This article is an open access article distributed under the terms and conditions of the Creative Commons Attribution (CC BY) license (http://creativecommons.org/licenses/by/4.0/).
Copyright: This open access article is published under a Creative Commons CC BY 4.0 license, which permit the free download, distribution, and reuse, provided that the author and preprint are cited in any reuse.


