
Submitted:
13 June 2025
Posted:
13 June 2025
You are already at the latest version
Abstract
This study focuses on the assessment of positive personality traits through the High Five Inventory (HFI) among Ecuadorian university students. The instrument is based on the High Factors Model (HFM), which includes five dimensions: erudition, peace, joviality, honesty, and tenacity. Objective: To validate the factorial structure, reliability, and convergent and discriminant validity of the HFI in Ecuador; to analyze its invariance across three cities (Quito, Guayaquil, and Cuenca) and academic disciplines; and to conduct a network analysis to explore inter-item relationships. Method: A total of 1,555 students participated. The HFI was linguistically adapted, and statistical analyses were applied, including Confirmatory Factor Analysis (CFA), reliability estimates (α and ω), Average Variance Extracted (AVE), and factorial invariance tests (from configural to structural levels). Results: The HFI demonstrated strong internal consistency (α and ω > 0.80), sound structural validity (CFI > 0.99; RMSEA = 0.031), and evidence of invariance at configural, metric, and scalar levels. Network analysis revealed differences between cities in terms of attribute centrality and clustering, with traits such as dedication and ingenuity standing out. Conclusion: The HFI is a psychometrically robust tool for evaluating positive personality traits in Ecuadorian university students, with applications in both educational and psychological contexts. Further cross-cultural research is encouraged.
Keywords:
High Five Inventory
; Network Analysis
; Invariance
1. Introduction
Personality is constituted as a dynamic structure that encompasses various psychic systems and is reflected in behavior and forms of expression. These enduring patterns influence how we perceive and interpret reality and how we relate to others in different social contexts. Personality traits are also evident in how individuals adapt to their environment and resolve conflicts. Understanding personality patterns and mental processes at the individual level facilitates the evaluation of broader implications regarding clinical criteria (Suciu, 2021).
The development of personality is essential because it facilitates the understanding of behavior both at the individual level and within the broader social context. Consequently, personality theory emerges to emphasize the importance of studying human nature, as it forms a fundamental pillar for understanding various disciplines (Hogan & Sherman, 2020a). Among the most relevant theories that explore this concept are the psychodynamic theory, trait theory, and interpersonal theory. Psychodynamic theory, mainly linked to clinical psychology, argues that childhood experiences have a decisive impact on the configuration of adult personality. In contrast, trait theory focuses on classifying and measuring individual differences, providing a framework to understand human diversity through stable personality dimensions. Lastly, interpersonal theory centers on the role of social interactions within personality, analyzing how relationships and group dynamics influence future interactions (Hogan & Sherman, 2020b).
Within this conceptual framework, personality psychology has played a crucial role in analyzing the distinctive traits that define it. However, some researchers, such as DeYoung (2010), point out that there are still limitations in studies related to the biological foundations of personality. His research has achieved significant progress by examining how neuroscience contributes to a better understanding of the biological systems underlying the five major personality traits: extraversion, neuroticism, agreeableness, conscientiousness, and openness to experience. In turn, authors like Peterson & Seligman (2004) highlight the relevance of personality research from a positive psychology perspective, emphasizing how psychological strengths and virtues can influence the well-being and optimal functioning of individuals, groups, and institutions. This approach underscores the importance of positive characteristics within the structure of personality.
This study aims to go beyond previous research that has explored in greater depth the psychometric properties of the High Five Inventory (HFI) (Cosentino & Castro Solano, 2017), particularly within the Ecuadorian context (Quito-Calle et al., 2025). Therefore, the objectives of the present study are focused on demonstrating the reliability and the convergent and discriminant validity of the HFI model, as well as identifying the invariance of the HFI across the three main cities of Ecuador (Quito, Guayaquil, and Cuenca) in relation to the students' areas of knowledge. It is also necessary to analyze the item networks of the instrument based on the three Ecuadorian cities and, finally, to detect differences in high factors based on cities and academic fields. Although this approach has received limited attention so far, the model has proven to be more effective than traditional models in terms of its psychometric properties (Quito-Calle & Cosentino, 2024), considering that the integration of these properties could enrich the understanding of personality.
The importance of this test lies in its adaptation to the Ecuadorian context, given that psychological tests created in a specific cultural environment may not be appropriate for another. Differences in values, customs, norms, and language can influence how individuals interpret and respond to test items. Adaptation ensures that the questions are relevant and comprehensible to the intended audience. It is essential to adapt psychological tests to national contexts to ensure the accuracy, fairness, and effectiveness of assessments, which, in turn, promotes a deeper understanding and better support for individuals within their respective cultural settings.
This article is structured as follows: Section 2 offers a detailed explanation of the development of the positive personality traits that define them, integrating statistical and syntactic criteria through a comprehensive description of the High Five Personality Model and its factors. Section 3 reviews various studies related to the HFI, as well as the findings and adaptations derived from these investigations. Section 4 highlights the implications of four studies conducted with the Ecuadorian population, underscoring their relevance despite the limited number of previous studies, and proposes the hypothesis that the Big Five Inventory supports the construct’s validity and quality based on an invariance analysis. Section 5 presents the study participants, the instrument used, and the procedure followed to test the hypothesis. Section 6 outlines the results obtained through a confirmatory factor analysis, evaluating the reliability of the instrument. Finally, in Section 7, the results are compared with other empirical studies in the field, and Section 8 concludes with a summary of the objectives and overall findings of the study.
Theoretical Background
Personality is understood as a complex and constantly evolving structure that influences behavior patterns, thoughts, and individuals’ ability to adapt to their surroundings (Mischel, 2009). Within this framework, the Big Five Model (BFM), formulated by McCrae & John (1992), stands out as a key theoretical model for exploring the fundamental dimensions of personality and is among the most studied topics in contemporary psychology (McCrae & John, 1992). This approach has been widely supported by numerous empirical studies that highlight its applicability across various cultures and contexts (Gosling et al., 2003).
Costa and McCrae argue that the five major personality traits (neuroticism, extraversion, openness, agreeableness, and conscientiousness) manifest through four key dimensions: a) these factors can be observed in external behavior patterns, b) traits are associated with different personality systems and are expressed through everyday language, and c) these attributes are influenced by individual variables such as age, gender, race, language, and culture. Finally, the traits have a biological basis. These five factors also facilitate the analysis of scales related to personality disorders and other associated issues. In a similar context, Smith & Williams (2012) highlight the impact of personality on health, emphasizing how personal characteristics can influence physiological and emotional aspects of health. Recent research suggests that personality traits not only affect how individuals respond to physical and psychological stressors altering the frequency, duration, and intensity of physiological responses but also influence the predisposition to experience negative and positive emotional states (Carver & Connor-Smith, 2010).
Within the Big Five Personality Model (BFM), the work of Whiteside & Lynam (2001) underscores the relevance of impulsivity within the personality structure. Their research emphasizes that impulsivity is key to understanding the internal interactions of personality and plays an essential role in the study of various forms of psychopathology. This trait is so fundamental that it has been included in the Diagnostic and Statistical Manual of Mental Disorders (DSM-5-TR), where diagnostic criteria directly related to impulsivity are detailed. In contrast, Chavira Trujillo & Celis de la Rosa (2015) stress the importance of using the Big Five model to assess the positive aspects of personality, particularly in specific cultural contexts, such as those in Latin America. This approach offers an alternative perspective on personality studies, suggesting that identifying and enhancing positive factors could open new opportunities for personal development and psychological well-being. The diversity in the application and interpretation of these models reflects the inherent complexity of human personality and the need to adapt assessment methods to different cultural and clinical contexts (Ryff & Keyes, 1999; Schimmack & Oishi, 2005).
In response to these needs, Castro Solano & Cosentino (2017) created the High Factors Model (HFM), which facilitates the identification of positive personality attributes from the perspective of ordinary people. The HFM introduces a framework of five positive traits: erudition, peace, joviality, honesty, and tenacity, referred to as "high factors," which are conceptually and empirically close to the Big Five factors: extraversion, agreeableness, conscientiousness, neuroticism, and openness to experience. However, while there is a relationship between the two models, the HFM's high factors represent a positive version of the Big Five without being a simple replication. Thus, the wisdom factor is linked to openness to experience; calmness is associated with emotional stability (as opposed to neuroticism); joy relates to extraversion; integrity connects with agreeableness, and determination aligns with conscientiousness. According to the authors, the HFM factors are relatively constant in each individual and are represented by positive psychological qualities. Additionally, these traits possess notable characteristics: a) they are quantifiable, b) they vary among individuals, and c) they can fluctuate due to internal and external factors. The term "high" was chosen to denote that these factors are associated with characteristics highly valued by people in general.
The High Five Inventory (HFI), based on the High Factors Model (HFM), was adapted in Argentina by Castro Solano and Cosentino (2019) to assess the five positive personality traits: erudition, peace, joviality, honesty, and tenacity. This instrument was designed using an inductive psycholexical approach that began from the perspective of ordinary individuals regarding positive traits (whether moral or not). An initial list of 854 items was developed, forming the primary pool of words. This corpus consisted of terms commonly used by people in daily life. No restrictions were placed on the types of positive traits that could be included, allowing the list to encompass moral traits (e.g., trustworthiness), abilities (such as intelligence), and traits not necessarily morally connoted (such as calmness). In this way, the HFM, by relying on statistical and syntactic criteria rather than semantic ones, avoids theoretical influence from an academic perspective, aiming to enable replicability across different populations (Castro Solano & Cosentino, 2017). As previously mentioned, the HFM factors are organized into five subscales that cover socially valued and shared positive personality characteristics. These are described in detail in the corresponding section.
Simultaneously, research conducted by Castro and Cosentino (2017) on individual positive characteristics revealed that the High Factors Model (HFM) correlates with indicators of illness, the risk of developing non-communicable diseases, as well as with symptoms and psychopathological personality traits. Moreover, it has been linked to optimal mental health and emotional, psychological, and social well-being, both from philosophical approaches and in relation to academic performance among university students.
Related Works on the High Five Inventory (HFI)
In the field of research on the HFM model, scientific production is still limited due to the recent adoption of this theoretical framework. Nevertheless, the studies conducted so far have shown promising results, identifying stable relationships that support the creation of tools to assess positive personality characteristics. The research by Cosentino & Castro Solano (2017) delved into the external validity of the High Five model using the High Five Inventory to measure five positive personality traits: erudition, peace, joviality, honesty, and tenacity. This questionnaire includes 23 items with Likert-type scales ranging from 1 (never) to 7 (always) and was administered to 1,032 participants (512 men, 49.6%, and 519 women, 50.3%), with an average age of 39.42 years (SD = 14.33), residing in the Autonomous City of Buenos Aires (n = 702, 68%) and the Buenos Aires Metropolitan Area (n = 330, 32%). Among the main findings, good model fit was observed in both the generation sample (e.g., CFI = 0.968) and the confirmation sample (e.g., CFI = 0.963). Finally, the alpha and omega reliability coefficients for each factor were above 0.80, validating the internal consistency of the instrument.
In the same line of research, Solano and Cosentino (2019) conducted a factor analysis with the aim of refining the tool by reducing the number of items without compromising its psychometric robustness. The main objective of their study was to establish a factorial model that included at least four items per factor, ensuring a reliability coefficient (omega) of ≥ 0.80 and achieving a good fit with the data. The sample used in this analysis consisted of 516 individuals (286 women, M = 35.2, SD = 13.5, with ages ranging from 18 to 80 years), who rated the extent to which the items represented their characteristics on a scale from 1 to 7. To identify the underlying structures of the questionnaire, an Exploratory Factor Analysis (EFA) was conducted, which resulted in the selection of an initial set of 57 items grouped into five factors related to positive personality traits.
Later, the researchers reported that the sample used to refine the model consisted of 484 participants (285 women, M = 35.1, SD = 14.0, with ages ranging from 18 to 79 years), who, as in the previous phase, rated the extent to which the items represented their positive characteristics on the same scale. To improve the factorial structure and reduce the number of items, a new Exploratory Factor Analysis (EFA) was conducted, ensuring that each factor included at least four items, with an omega reliability coefficient ≥ 0.80 and a good model fit. As a result, the High Five Inventory (HFI) was completed with 23 items organized into subscales representing socially shared positive personality traits. Psychometric analyses, performed using robust diagonally weighted least squares estimators, showed excellent model fit (CFI > 0.95, SRMR < 0.05, RMSEA < 0.06), with an omega coefficient of 0.80 for each factor, validating its internal consistency. To test the stability of the model, an additional sample of 1,118 participants (564 women, M = 40.4, SD = 14.2, ranging from 18 to 92 years) was examined, once again confirming a good fit through robust analyses (CFI > 0.96, SRMR < 0.05, RMSEA < 0.07) and high reliability levels across all subscales (omega > 0.80). Thus, the High Five Inventory (HFI) was consolidated as a solid psychometric tool, composed of 23 items organized into five subscales that reflect socially shared positive human characteristics, with responses rated on a scale ranging from 1 (never) to 7 (always).
Bringing together the aforementioned, this research established the objective to analyze the factorial invariance and the relational structure through network analysis of the High Five Inventory (HFI) in Ecuadorian university students, with the aim of evaluating the structural validity of the instrument in this population.
2. Materials and Methods
2.1. Research Design
The instrumental research was carried out in two phases, adhering to current standards for the validation of educational and psychological tests (Arias & Sireci, 2021), as well as the guidelines for the adaptation and translation of existing tests (Brauer et al., 2023; Cruchinho et al., 2024; Muñiz et al., 2013; Moore et al., 2021). In the first phase, the linguistic adaptation of the original test was conducted through an iterative translation process carried out by experts (Elosua et al., 2014). In the second phase, evidence of reliability, validity, and measurement invariance High Five Inventory (HFI) in Ecuadorian university students
2.2. Participants
The study included a total of 1,555 participants, with a diverse representation in terms of age, residence, city, and gender. Regarding age, the largest group was composed of participants aged 18 to 19 years, making up 38.6% of the sample (600 individuals). The second largest group consisted of individuals aged 19 to 20 years, accounting for 21.9% (341 participants). A smaller portion of the sample, 14.7% (229 participants), was between 20 and 21 years old. The remaining 24.8% (385 participants) were aged 22 years or older. The average age of the participants was 20.62 years, with a standard deviation of 2.75, indicating a consistent age distribution. However, the data showed a positively skewed distribution (skewness of 3.01), suggesting that the majority of participants were younger. The high kurtosis value of 16.5 further indicated that the age distribution was highly peaked, with a concentration of participants around the younger age groups. Additionally, the Shapiro-Wilk test for normality revealed a significant departure from normality, as evidenced by the p-value of less than 0.001.
In terms of residence, the majority of participants lived in urban areas, comprising 83.1% of the sample (1,292 individuals). In contrast, 16.9% (263 participants) resided in rural areas. For the city distribution, the study participants came from three major cities in Ecuador. The largest proportion, 52.3% (814 participants), were from Quito, followed by 23.9% (371 participants) from Guayaquil, and 23.8% (370 participants) from Cuenca. Finally, the gender distribution was balanced, with 51% of participants identifying as male and 49% as female, indicating a nearly equal representation of both genders.}
2.3. Instrument
2.3.1. High Five Inventory (HFI)
Castro Solano and Cosentino (2017) developed an instrument to assess the factors of the HFM: erudition, peace, joviality, honesty, and tenacity. This pencil-and-paper questionnaire consists of 23 items, with a response scale ranging from 1 (never) to 7 (always). A higher score on each subscale indicates a greater presence of the corresponding positive factor. The HFI demonstrated a good fit to the data both in the initial sample (e.g., Comparative Fit Index [CFI] = 0.968) and in the confirmation samples (CFI = 0.963). Additionally, the alpha and omega reliability coefficients for each factor exceeded 0.80.
2.4. Procedure
The linguistic review process of the instrument was carried out in two stages. First, a group of university researchers analyzed the questionnaires and provided feedback, which was considered before applying them in a pilot study with students. Since no items or factors needed to be removed, an additional content validation process was not required. In the second stage, the instrument was administered to a group of ten students, who independently evaluated the linguistic comprehension of the items. As a result, the elements were adjusted for linguistic and cultural adaptation to the Ecuadorian population, leading to the Ecuadorian version of the High Five Inventory (HFI-E, Quito Calle et al., 2024; 2025).
2.5. Statistical Analysis
All statistical analyses were conducted using R (version 4.4.3; R Core Team, 2022) and JASP (version 0.19.3). For the first aim assessing the reliability of the HFI among Ecuadorian university students, descriptive statistics for each item (mean, standard deviation, skewness, and kurtosis) were computed. Normality of the item distributions was examined using the Shapiro–Wilk test (Shapiro & Wilk, 1965; Demir, 2022; Monter-Pozos & González-Estrada, 2024). Internal consistency was evaluated using reliability indices such as Guttman’s lambda-2 (λ2), lambda-6 (λ6), and the Greatest Lower Bound (GLB), which consider total score variance, inter-item covariances, and measurement errors (Malkewitz et al., 2023). In addition, the average inter-item correlation (AIC) was calculated to assess overall item coherence. Descriptive indicators for these reliability measures, including means, standard deviations, and 95% confidence intervals, were reported to evaluate the precision and robustness of the estimates.
To address the second objective assessing the structural validity of the HFI a confirmatory factor analysis (CFA) was performed using the lavaan package in R (Rosseel et al., 2025). Given the data's deviation from multivariate normality (DiStefano et al., 2021; Shi et al., 2021), the diagonally weighted least squares (DWLS) estimator was employed (Du & Bentler, 2022). Model fit was evaluated using established thresholds: Comparative Fit Index (CFI) ≥ 0.95 and Standardized Root Mean Square Residual (SRMR) ≤ 0.08 (Hu & Bentler, 1999; Cho et al., 2020; Ramírez et al., 2025, Shi & Maydeu-Olivares, 2020). Reliability of the latent factors was further supported by Cronbach’s alpha and McDonald’s omega (Revelle, 2019).
For the third objective evaluating the convergent and discriminant validity of the HFI two key metrics were used: Average Variance Extracted (AVE ≥ 0.50) and the Heterotrait–Monotrait Ratio of correlations (HTMT ≤ 0.95), following guidelines by Cheung and Wang (2017). Composite Reliability (CR > 0.70) and the Variance Inflation Factor (VIF < 10) were also computed to assess construct reliability and multicollinearity (Kalnins & Praitis Hill, 2025). Spearman’s correlation coefficient (De Winter et al., 2016) was used to explore associations between theoretically linked subscales, such as interpersonal strengths and emotional resilience, ensuring conceptual distinction and accurate measurement of different positive personality dimensions.
Regarding the fourth objective examining measurement invariance across sex a series of multi-group CFAs were carried out to test configural, metric, scalar, and strict invariance (Hu & Bentler, 1999; Shi et al., 2021). This approach enabled verification that the HFI measures the same constructs equivalently in both male and female participants. Measurement invariance ensures that any group comparisons are statistically valid and free from gender-based measurement bias (Shi & Maydeu-Olivares, 2020).
Future studies should also consider how cultural factors in Ecuador may influence the appropriateness and interpretation of instruments like the HFI compared to other strengths-based assessments. Cultural norms related to self-expression, individual achievement, and interpersonal behavior may shape preferences among researchers and clinicians for one tool over another. Additionally, social stigma or traditional values might impact participants' comfort with reporting specific traits, influencing data quality and validity.
Thus, it would be worthwhile to investigate how cultural expectations, and social dynamics affect the perception and reporting of character strengths. Qualitative research, such as in-depth interviews or focus groups, could shed light on how Ecuadorian students understand and experience positive personality traits. These insights could inform adaptations of the HFI, such as modifying item language or adding culturally relevant dimensions to enhance its validity and cultural sensitivity.
Finally, a network analysis was conducted to examine the structure of inter-item relationships within the HFI. Centrality metrics (betweenness, closeness, strength, and expected influence) and clustering algorithms (e.g., Barrat, Onnela, WS, and Zhang) were employed to identify the most influential traits and how items group together (Borsboom et al., 2021; Christodoulou et al., 2019; Epskamp et al., 2018). These analyses offer deeper insights into the internal structure of the HFI and its psychometric robustness, supporting its use in Ecuadorian university populations.
3. Results
The study on the application of the High Five Inventory (HFI) among Ecuadorian university students (n = 1555) revealed various characteristics in the distribution of responses across its 23 items. In general, the average item scores ranged from 5.206 to 6.688 on a scale of 1 to 7, indicating a tendency toward higher values in most responses. The standard deviation varied between 0.698 and 1.565, reflecting different levels of dispersion in the participants' responses. In terms of skewness, most items showed negative values, indicating that responses tended to cluster around the higher end of the scale. Items such as 4 (-2.763), 8 (-2.635), and 15 (-3.245) exhibited particularly high levels of negative skewness, suggesting that many students scored in the upper range of the scale. Regarding kurtosis, some items displayed very high values, such as item 4 (8.824), item 8 (7.997), and item 15 (13.179), indicating a highly concentrated distribution around the mean with thinner tails than expected in a normal distribution. In contrast, several items showed negative kurtosis values, such as item 3 (-0.778) and item 14 (-0.567), suggesting a flatter distribution with greater dispersion in responses. The minimum and maximum values for all items ranged from 1 to 7, indicating that participants used the entire available scale. This descriptive analysis helped identify response patterns and trends in students' perceptions regarding the items assessed in the HFI, which could be useful for future studies on the validity and reliability of this measure among Ecuadorian university populations (Supplementary table 1).
The analysis of the High Five Inventory (HFI) in Ecuadorian university students (n = 1555) revealed important insights into the factor structure, reliability, and validity of the instrument. The factor loadings for each item were statistically significant (p < .001), with standardized estimates ranging from 0.494 to 0.859 across the five identified factors: Erudition, Peace, Joviality, Honesty, and Tenacity. The Erudition factor included six items, with loadings between 0.494 (Item 9) and 0.757 (Item 20). The composite reliability (CR) for this factor was 0.808, and Cronbach’s Alpha (α) was 0.802, indicating good internal consistency. The average variance extracted (AVE) was 0.419, suggesting that a moderate proportion of variance in the items was explained by the factor.
The Peace factor consisted of four items, with loadings ranging from 0.617 (Item 10) to 0.859 (Item 17). The CR was 0.807, and α was 0.810, reflecting good reliability. The AVE for this factor was 0.512, indicating an acceptable level of variance explained. The Joviality factor showed strong factor loadings, ranging from 0.701 (Item 2) to 0.834 (Item 6). This factor had the highest reliability metrics, with a CR of 0.863 and α of 0.861. The AVE was 0.611, suggesting that more than 60% of the variance in the items was explained by the factor, indicating strong convergent validity (Table 1).
The Honesty factor included five items, with lower loadings compared to other factors, ranging from 0.546 (Item 4) to 0.727 (Item 22). The reliability measures were lower than the other factors, with a CR of 0.757 and α of 0.754. The AVE was 0.405, suggesting that less than half of the variance in the items was explained by the factor, which may indicate a need for further refinement. The Tenacity factor showed high factor loadings, ranging from 0.726 (Item 7) to 0.806 (Item 21). The CR was 0.851, and α was 0.919, indicating excellent internal consistency. The AVE was 0.586, reflecting strong convergent validity. The global model fit indices demonstrated a good fit: CFI = 0.990, TLI = 0.988, NFI = 0.988, and GFI = 0.999. Additionally, RMSEA was 0.031 (90% CI [0.028 – 0.035]), and SRMR was 0.043, both indicating an excellent model fit. The overall reliability measures were also strong, with McDonald's Omega total = 0.937, Cronbach’s Alpha total = 0.919, and Composite Reliability total = 0.956 (Table 1).
Figure 1 showed that the High Five Inventory (HFI), administered to Ecuadorian university students, exhibited standardized estimates indicating a moderate to high internal consistency for the items corresponding to the factors Erudition, Peace, Joviality, Honesty, and Tenacity. These results suggested that the instrument was reliable and effectively measured the intended constructs, with values ranging from 0.494 to 0.859, reflecting strong consistency in the assessment of each factor.
The Table 2 presented the results of the measurement invariance analysis of the High Five Inventory (HFI) based on the city of residence (Cuenca, Guayaquil, and Quito) and the area of knowledge of Ecuadorian university students. Five levels of invariance were assessed: configural (CO), metric (ME), scalar (SC), strict (ST), and structural (STR), using fit indices such as chi-square (X²), degrees of freedom (df), statistical significance (p), comparative fit index (CFI), Tucker-Lewis index (TLI), root mean square error of approximation (RMSEA), and standardized root mean square residual (SRMR).
For the invariance by city, the results showed adequate fit values in the configural, metric, scalar, and strict levels, with CFI and TLI above .997, RMSEA lower than .018, and SRMR in acceptable ranges (between .049 and .056). However, at the structural level (STR), the fit was slightly lower (CFI and TLI = .992), and the RMSEA increased to .026, suggesting that the structural equivalence might have been weaker compared to the previous levels.
Regarding invariance by area of knowledge, the results also reflected good fit in the configural, metric, and scalar models, with CFI and TLI higher than .997 and very low RMSEA values. However, at the structural level (STR), a decrease in CFI to .963 and an increase in RMSEA to .053 were observed, indicating lower stability in the factorial structure of the HFI across different areas of knowledge.
Overall, the results indicated that the HFI maintained a consistent factorial structure across cities and areas of knowledge at the configural, metric, scalar, and strict levels. However, structural invariance showed some variability, which might imply differences in the relationships between HFI factors depending on the geographic or academic context of the students.
In the first Supplementary Table 2, we observe how the factor loadings vary between the cities. In Cuenca, the items under the Erudition factor (e.g., Item 1, Item 3, Item 9) show consistently high factor loadings, with estimates ranging from 0.47 to 0.73, all statistically significant with p-values below 0.001. The Peace dimension also demonstrates strong item loadings, particularly Item 17, which has a loading of 0.90, indicating a very strong relationship between the item and the factor. Similarly, the Joviality factor shows substantial loadings, with Item 14 showing the highest loading at 0.85. In Cuenca, the loadings for all factors appear robust, suggesting that the HFI items are consistently related to their respective factors across the city.
When we look at Guayaquil, the pattern is similar, with strong factor loadings across all items. For the Erudition factor, Item 1 and Item 16 show loadings of 0.65 and 0.78, respectively, indicating a significant relationship. The Peace factor also shows strong relationships, with Item 17 having a loading of 0.84. For Joviality, Item 6 has the highest loading at 0.82, indicating that joviality-related traits are strongly captured by this item. In general, the results for Guayaquil show high consistency, with all items having significant factor loadings, suggesting a strong relationship between the items and the respective dimensions of the HFI. Finally, in Quito, the factor loadings are similarly strong, particularly for the Erudition factor. Items 1, 3, and 16 have loadings of 0.60, 0.69, and 0.69, respectively. The Peace factor also shows high loadings, especially with Item 17 at 0.85, reflecting a strong connection between this item and the peace dimension. The Joviality and Tenacity factors also exhibit robust loadings, with Item 21 for Tenacity having the highest loading at 0.83, indicating the strength of the relationship between tenacity-related traits and the items in the Quito sample.
In Supplementary Table 3, we shift the focus to knowledge areas, showing how the factor loadings vary across different academic fields. For the Social and Behavioral Sciences and Humanities groups, the items consistently show high loadings. For example, under the Erudition factor, Item 1 and Item 3 have loadings of 0.66 and 0.72, respectively, indicating that these items are strongly aligned with intellectual capacity in these disciplines. The Peace dimension shows similarly high loadings, with Item 17 showing a particularly strong loading of 0.86. Likewise, the Joviality factor items (especially Item 14) show high loadings, all above 0.80, indicating that jovial traits are strongly represented in this academic context.
Across both tables, the consistent high factor loadings across different cities and knowledge areas suggest that the High Five Inventory is a reliable tool for measuring dimensions like Erudition, Peace, Joviality, Honesty, and Tenacity among university students in Ecuador. This suggests that the instrument is robust across different contexts, making it suitable for broad application in academic and research settings.
The network analysis presented in Figure 2 examined the centrality and clustering of the elements in the High Five Inventory (HFI) among Ecuadorian university students from three cities: Cuenca, Guayaquil, and Quito. Significant differences were identified in the structure and density of the connections between attributes, suggesting variations in the perception and importance of certain traits across different contexts.
Regarding the network structure, all three cities exhibited 23 nodes, corresponding to the attributes analyzed. However, the number of connections between these nodes varied. In Quito and Cuenca, the network displayed higher interconnectivity, with 117 and 116 connections, respectively, whereas Guayaquil had 106 connections, reflecting a lower density of relationships among attributes. Additionally, the network sparsity analysis indicated that Guayaquil (0.581) had the most dispersed network compared to Cuenca (0.542) and Quito (0.538), suggesting weaker cohesion in its network structure.
In terms of centrality measures, certain attributes played more prominent roles in different cities. For instance, the trait “talent” (E16) showed a high betweenness centrality in Cuenca (2.564), indicating that this attribute served as a key bridge within the network. While it also had a relevant presence in Quito (0.282), its influence was lower in Guayaquil (0.480). Similarly, the attribute ingenuity (E20) demonstrated high expected influence in Guayaquil (1.789) and Quito (1.598), highlighting its importance in students’ self-perception in these cities.
On the other hand, the strength of connections revealed that certain attributes were more strongly associated with others within the network. “Effort” (T19) was particularly relevant in Quito (1.947) and Guayaquil (1.706), suggesting that this trait had strong associations with other elements in these cities. Likewise, “dedication” (T7) showed strong connections in Guayaquil (3.286) and Cuenca (1.774), reflecting the importance of this trait in shaping students’ identities in these contexts.
The clustering analysis revealed the formation of attribute groupings within the network, allowing for the identification of association patterns. It was observed that "fun" (J6) had a high clustering tendency in Cuenca and Guayaquil, whereas in Quito, negative values indicated a weaker connection of this trait with other attributes in the network. Similarly, the trait “dedication” (T7) exhibited a strong clustering tendency in Guayaquil and Cuenca, further reinforcing its central role in these cities' network configurations.
In conclusion, the study revealed that the perception of certain attributes varied depending on the city analyzed. While Quito and Cuenca exhibited more interconnected and cohesive networks, Guayaquil showed a more dispersed structure, suggesting weaker associations among the evaluated traits. Additionally, attributes such as ingenuity (E20), effort (T19), and dedication (T7) emerged as key elements in students' identities across different contexts. These findings suggest differences in how Ecuadorian university students construct their self-perception based on their geographical location.
4. Discussion
The findings of this study reaffirm the relevance of the High Five Inventory (HFI) as an instrument for assessing positive personality traits among university students, specifically within the Ecuadorian context. This research aligns with the principles of positive psychology, which aim to highlight and value human virtues as essential components of psychological development, following the theoretical framework proposed by Peterson and Seligman (2004). In line with this approach, the five HFI factors erudition, peace, joviality, honesty, and tenacity provide a comprehensive lens through which socially valued traits that contribute to well-being, interpersonal harmony, and academic development can be assessed.
The results show that the five-factor model is empirically supported with high internal consistency and a good model fit, echoing the findings of Cosentino and Castro Solano (2017, 2019). This supports the HFI as an effective alternative to the traditional Big Five model by McCrae and John (1992), which, although widely validated, has been criticized for neglecting positively connoted traits. In contrast, the HFI emphasizes characteristics that are socially praised and encouraged, making it particularly useful in educational settings and preventive psychological interventions.
Moreover, the results of the factorial invariance analysis indicated that the instrument functions equivalently across Ecuador's three major cities (Quito, Guayaquil, and Cuenca) and across various academic disciplines. The confirmation of configural, metric, scalar, and strict invariance levels suggests that the instrument maintains its psychometric structure across different groups. However, the slight drop in fit at the structural level suggests that the relationships between the factors may vary depending on cultural or academic context, echoing Ryff and Keyes (1999) and Chavira Trujillo and Celis de la Rosa (2015), who emphasized the influence of sociocultural context on the formation and expression of personality.
A major contribution of this study is the use of network analysis, which allowed for a more dynamic visualization of how different HFI items interrelate across each city. The denser and more cohesive network structures found in Quito and Cuenca suggest more integrated self-perceptions of personality traits, while the more dispersed structure observed in Guayaquil may reflect contextual differences such as educational approaches, social expectations, or regional values. Attributes such as dedication, ingenuity, and effort emerged as central nodes across different cities, indicating their pivotal role in students’ identity construction and value systems. These regional differences further emphasize the importance of considering local context when interpreting personality data and designing educational or psychological strategies.
It is also worth noting that these findings align with DeYoung’s (2010) proposal for a more integrative understanding of personality that includes biological, cognitive, and social dimensions. By focusing on culturally valued and socially appreciated traits, the HFI contributes to a more comprehensive personality model that addresses not only individual or clinical aspects but also collective and developmental dimensions. Furthermore, previous research (e.g., Smith & Williams, 2012; Carver & Connor-Smith, 2010) has established a connection between personality traits and physical and mental health, suggesting that the HFI could potentially be used to predict broader well-being outcomes and inform educational interventions.
Finally, because the HFI was developed using an inductive lexical approach rooted in how people describe virtues in everyday language, it avoids the imposition of academic or theoretical biases. This enhances its cultural adaptability and accessibility, as demonstrated by its successful implementation and linguistic adjustment for the Ecuadorian population. The strength of this adaptation lies in preserving the original model while also reflecting the cultural and linguistic nuances of the local context, thereby increasing its relevance and legitimacy in applied settings.
Future Research
Considering these findings, several future research directions are recommended. First, validating the HFI in other Latin American countries would help determine whether the factorial structure holds across different cultural contexts. Such cross-cultural comparisons would offer insights into the model’s robustness and its sensitivity to regional variations in the expression of personality traits. Second, longitudinal studies are needed to assess the stability of these traits over time and their relationship with key life events, including academic transitions, psychological stressors, and personal achievements.
Another promising direction involves exploring the associations between HFI traits and external variables such as academic performance, mental health, perceived stress, intrinsic motivation, and student engagement. Such studies could establish the instrument’s predictive power and potential for guiding interventions. Researchers could also design educational programs that use HFI results to foster personal strengths and reduce psychological risk factors.
Additionally, future work could deepen the use of network analysis by incorporating contextual variables such as teaching styles, family dynamics, extracurricular involvement, or institutional climate. This approach would help build more complex explanatory models that integrate personality traits with students' immediate environments. Lastly, adapting the HFI for other age groups (e.g., adolescents or older adults) or professional contexts could further expand its applicability and value.
Limitations
Despite its contributions, this study has certain limitations that should be acknowledged. First, the sample consisted exclusively of university students, which limits the generalizability of the findings to other populations such as adolescents, working adults, older adults, or clinical groups. Second, the cross-sectional design prevents any causal inferences from being drawn regarding the relationships between personality traits and other variables, such as academic or psychological outcomes.
Third, although a careful linguistic and cultural adaptation process was undertaken, some semantic or dialectical nuances may not have been fully captured, particularly in rural areas or among participants with less academic exposure. Such variations may influence how participants interpret specific items, potentially affecting the validity of responses. Additionally, while factorial invariance was confirmed at multiple levels, the reduced model fit at the structural level suggests that factor relationships may not be entirely equivalent across subgroups, warranting further refinement.
Lastly, while network analysis offers valuable insights into item interconnections and trait dynamics, its interpretation should be approached with caution, as results may vary depending on the chosen algorithms and data quality. Future research should include cross-validation and comparisons with alternative models to ensure the robustness of findings derived from network techniques.
5. Conclusions
In summary, the findings of this study allow us to conclude that the High Five Inventory (HFI) is a valid, reliable, and culturally appropriate tool for assessing positive personality traits among Ecuadorian university students. Its factorial structure was successfully replicated, showing excellent psychometric indicators, including internal consistency and convergent validity. Beyond its diagnostic utility, the HFI can serve as a valuable resource for promoting well-being in educational contexts by identifying individual strengths that may be leveraged to enhance academic performance, emotional self-regulation, and social interaction.
The confirmation of invariance across cities and academic areas supports its broader applicability in various institutional contexts. Despite some variability at the structural level, the overall results are robust enough to recommend the instrument for extended use. The inclusion of network analysis offers a novel perspective, allowing researchers to visualize the dynamic interrelationships among traits and to identify which attributes are most central depending on the context.
Supplementary Materials
The following supporting information can be downloaded at the website of this paper posted on Preprints.org.
Author Contributions
Contribution to the conception and design: J.V.Q.- C.; contribution to data collection: J.V.Q.- C. contribution to data analysis and interpretation: J.V.Q.-C., A.C.C., L.E.Q.-C., A.R., and L.B.-B.; drafting and/or revising the article: J.V.Q.-C., A.C.C., approval of the final version for publication: J.V.Q.-C., A.C.C., A.R.; Obtaining authorization for the scale: J.V.Q.-C., All authors have read and agreed to the published version of the manuscript.
Funding
This research was financed by the Universidad Politécnica Salesiana Sede Cuenca, Ecuador. Institutional Review Board Statement: All procedures conducted in this study involving human participants adhered to the ethical standards established by the ethics committee., with the support of the Applied Clinical Neuroscience Research Group (Grupo de Investigación en Neurociencia Clínica Aplicada [GINCA]) of the Salesian Polytechnic University (Universidad Politécnica Salesiana), Cuenca, Ecuador.
Informed Consent Statement
Informed consent was obtained from all subjects involved in this study.
Data Availability Statement
The data supporting this research are publicly available and can be obtained by emailing the first author of this article.
Acknowledgments
The authors would like to thank the Universidad Politécnica Salesiana, Ecuador, and especially Juan Cárdenas Tapia. Conflicts of Interest: The authors declare no conflicts of interest.
References
- Arias, A., & Sireci, S. (2021). Validez y validación para pruebas educativas y psicológicas: Teoría y recomendaciones. Revista Iberoamericana de Psicología, 14(1), 11–22. [CrossRef]
- Brauer, K., Ranger, J., & Ziegler, M. (2023). Confirmatory factor analyses in psychological test adaptation and development: A nontechnical discussion of the WLSMV estimator. Psychological Test Adaptation and Development, 4(1), 4–12.
- Carver, C. S., & Connor-Smith, J. K. (2010). Personality and coping. Annual Review of Psychology, 61, 679-704.
- Castro Solano, A., & Cosentino, A. (2017). El modelo de los factores altos de personalidad: Un enfoque positivo para el estudio de los rasgos humanos. Revista Latinoamericana de Psicología, 49(3), 211-223.
- Castro Solano, A., & Cosentino, A. (2019). El modelo de los factores altos de personalidad y su aplicación en la medición de características positivas. Psicología y Sociedad, 28(2), 153-165.
- Chavira Trujillo, C., & Celis de la Rosa, M. (2015). La evaluación de los rasgos positivos de la personalidad en América Latina: un enfoque culturalmente específico. Psicología Iberoamericana, 22(1), 35-49.
- Cho, G., Hwang, H., Sarstedt, M., & Ringle, C. M. (2020). Cutoff criteria for overall model fit indexes in generalized structured component analysis. Journal of Marketing Analytics, 8(4), 189–202.
- Castro Solano, A., & Cosentino, A. C. (2019). The High Five Model: Associations of the High Factors With Complete Mental Well-Being and Academic Adjustment in University Students. Europe's journal of psychology, 15(4), 656–670. [CrossRef]
- Cosentino, A., & Castro Solano, A. (2017). High Five Inventory: A new tool for personality assessment. Journal of Personality Assessment, 99(3), 314-324.
- Cruchinho, P., López-Franco, M. D., Capelas, M. L., Almeida, S., Bennett, P. M., Miranda da Silva, M., & Gaspar, F. (2024). Translation, cross-cultural adaptation, and validation of measurement instruments: A practical guideline for novice researchers. Journal of Multidisciplinary Healthcare, 17, 2701–2728.
- Demir, S. (2022). Comparison of normality tests in terms of sample sizes under different skewness and kurtosis coefficients. International Journal of Assessment Tools in Education, 9(2), 397–409.
- DeYoung, C. G. (2010). Personality neuroscience and the biology of traits. Current Directions in Psychological Science, 19(6), 307-312.
- De Winter, J. C., Gosling, S. D., & Potter, J. (2016). Comparing the Pearson and Spearman correlation coefficients across distributions and sample sizes: A tutorial using simulations and empirical data. Psychological Methods, 21, 273.
- DiStefano, C., Shi, D., & Morgan, G. B. (2021). Collapsing categories is often more advantageous than modeling sparse data: Investigations in the CFA framework. Structural Equation Modeling, 28, 237–249.
- Du, H., & Bentler, P. M. (2022). Distributionally weighted least squares in structural equation modeling. Psychological Methods, 27(4), 519–540.
- Elosua, P., Mujika, J., Almeida, L. S., & Hermosilla, D. (2014). Judgmental-analytical procedures for adapting tests: Adaptation to Spanish of the reasoning tests battery. Revista Latinoamericana de Psicología, 46(2), 117–126.
- Gosling, S. D., Rentfrow, P. J., & Swann, W. B. (2003). A very brief measure of the Big-Five personality domains. Journal of Research in Personality, 37(6), 504-528.
- Hogan, R., and Sherman, R. (2020a). Personality theory and the nature of human nature. Personality and Individual Differences, 152:109561. [CrossRef]
- Hogan, R., and Sherman, R. A. (2020b). Personality theory and the nature of human nature. Personality and Individual Differences, 152, 109561.
- Hu, L., & Bentler, P. M. (1999). Cutoff criteria for fit indexes in covariance structure analysis: Conventional criteria versus new alternatives. Structural Equation Modeling: A Multidisciplinary Journal, 6(1), 1–55.
- Malkewitz, C. P., Schwall, P., Meesters, C., & Hardt, J. (2023). Estimating reliability: A comparison of Cronbach’s α, McDonald’s ωt and the greatest lower bound. Social Sciences & Humanities Open, 7(1), 100368.
- McCrae, R. R., & John, O. P. (1992). An introduction to the five-factor model and its applications. Journal of Personality, 60(2), 175-215.
- Mischel, W. (2009). Personality and Assessment. Psychology Press.
- Moore, G., Campbell, M., Copeland, L., Craig, P., Movsisyan, A., Hoddinott, P., & Evans, R. (2021). Adapting interventions to new contexts—The ADAPT guidance. BMJ, 374, n1679.
- Monter-Pozos, A., & González-Estrada, E. (2024). On testing the skew normal distribution by using shapiro–wilk test. Journal of Computational and Applied Mathematics, 440, 115649.
- Muñiz, J., Elosua, P., & Hambleton, R. K. (2013). Directrices para la traducción y adaptación de los tests: Segunda edición. Psicothema, 25(2), 151–157.
- Peterson, C., & Seligman, M. E. (2004). Character strengths and virtues: A handbook and classification. Oxford University Press.
- Quito-Calle, J. V., & Cosentino, A. C. (2024). The High Five Model as a predictor of academic performance over conventional psychological predictors in university students. Frontiers in Psychology, 15, 1383154.
- Quito-Calle, J. V., Cosentino, A., González-González, D. M., & Guerrero-Vásquez, L. F. (2025). Psychometric Properties of the High Five Inventory in University Students in Ecuador. Frontiers in Psychology, 1490889.
- Ramírez, A., Burgos-Benavides, L., Sinchi, H., Quito-Calle, J. V., Herrero Díez, F., & Rodríguez-Díaz, F. J. (2025). Adaptation and validation of psychological assessment questionnaires using confirmatory factor analysis: A tutorial for planning and reporting analysis. Preprints. [CrossRef]
- R Core Team. (2022). R: A lenguage and environment for statistical computing. (Version 4.1) [Computer software]. R Core Team. Available online: https://www.r-project.org/ (accessed on 10 June 2025).
- Revelle, W. (2019). Psych: Procedures for psychological, psychometric, and personality research [R package]. Northwestern University; Evanston.
- Rosseel, Y., Burghgraeve, E., Loh, W. W., & Schermelleh-Engel, K. (2025). Structural after measurement (SAM) approaches for accommodating latent quadratic and interaction effects. Behavior Research Methods, 57, 101.
- Ryff, C. D., & Keyes, C. L. (1999). The structure of psychological well-being revisited. Journal of Personality and Social Psychology, 69(4), 719-727.
- Schimmack, U., & Oishi, S. (2005). The influence of personality on subjective well-being. In Handbook of personality and subjective well-being (pp. 83-98). Oxford University Press.
- Shapiro, S. S. , & Wilk, M. B. (1965). An analysis of variance test for normality (complete samples). Biometrika, 52(3–4), 591–611.
- Shi, D., & Maydeu-Olivares, A. (2020). The effect of estimation methods on SEM fit indices. Educational and Psychological Measurement, 80(3), 421–445.
- Smith, T. W., & Williams, S. L. (2012). Personality and health: The role of personal traits in the physiological and emotional aspects of health. Health Psychology Review, 6(3), 275-290.
- (2021). A Holistic Approach Suciu, N. M. (2021). A Holistic Approach of Personality Traits in Medical Students: An Integrative Review. International journal of environmental research and public health, 23(18)Personality Traits in Medical Students: An Integrative Review. International journal of environmental research and public health, 23(18). [CrossRef]
- Whiteside, S. P., & Lynam, D. R. (2001). The Five-Factor Model and Impulsivity: Using a Structural Model of Personality to Understand the Personality-Disorder Spectrum. Journal of Personality, 69(4), 475-491.
Figure 1.
Standardized Estimate High Five Inventory (HFI) in Ecuadorian university students. Note: CFI = 0.990, TLI = 0.988; NFI = 0.988; GFI = 0.999; RMSEA = 0.031 [0.028 – 0.035]; SRMR = 0.043; McDonald's Omega total = 0.937; Cronbach's Alpha total = 0.919; Composite Reliability total = 0.956. The factor model demonstrates an excellent fit to the data, as the CFI, TLI, NNFI, and NFI indices are all above 0.95. Additionally, the RMSEA and SRMR indicate a good fit (< 0.05 and < 0.08, respectively).
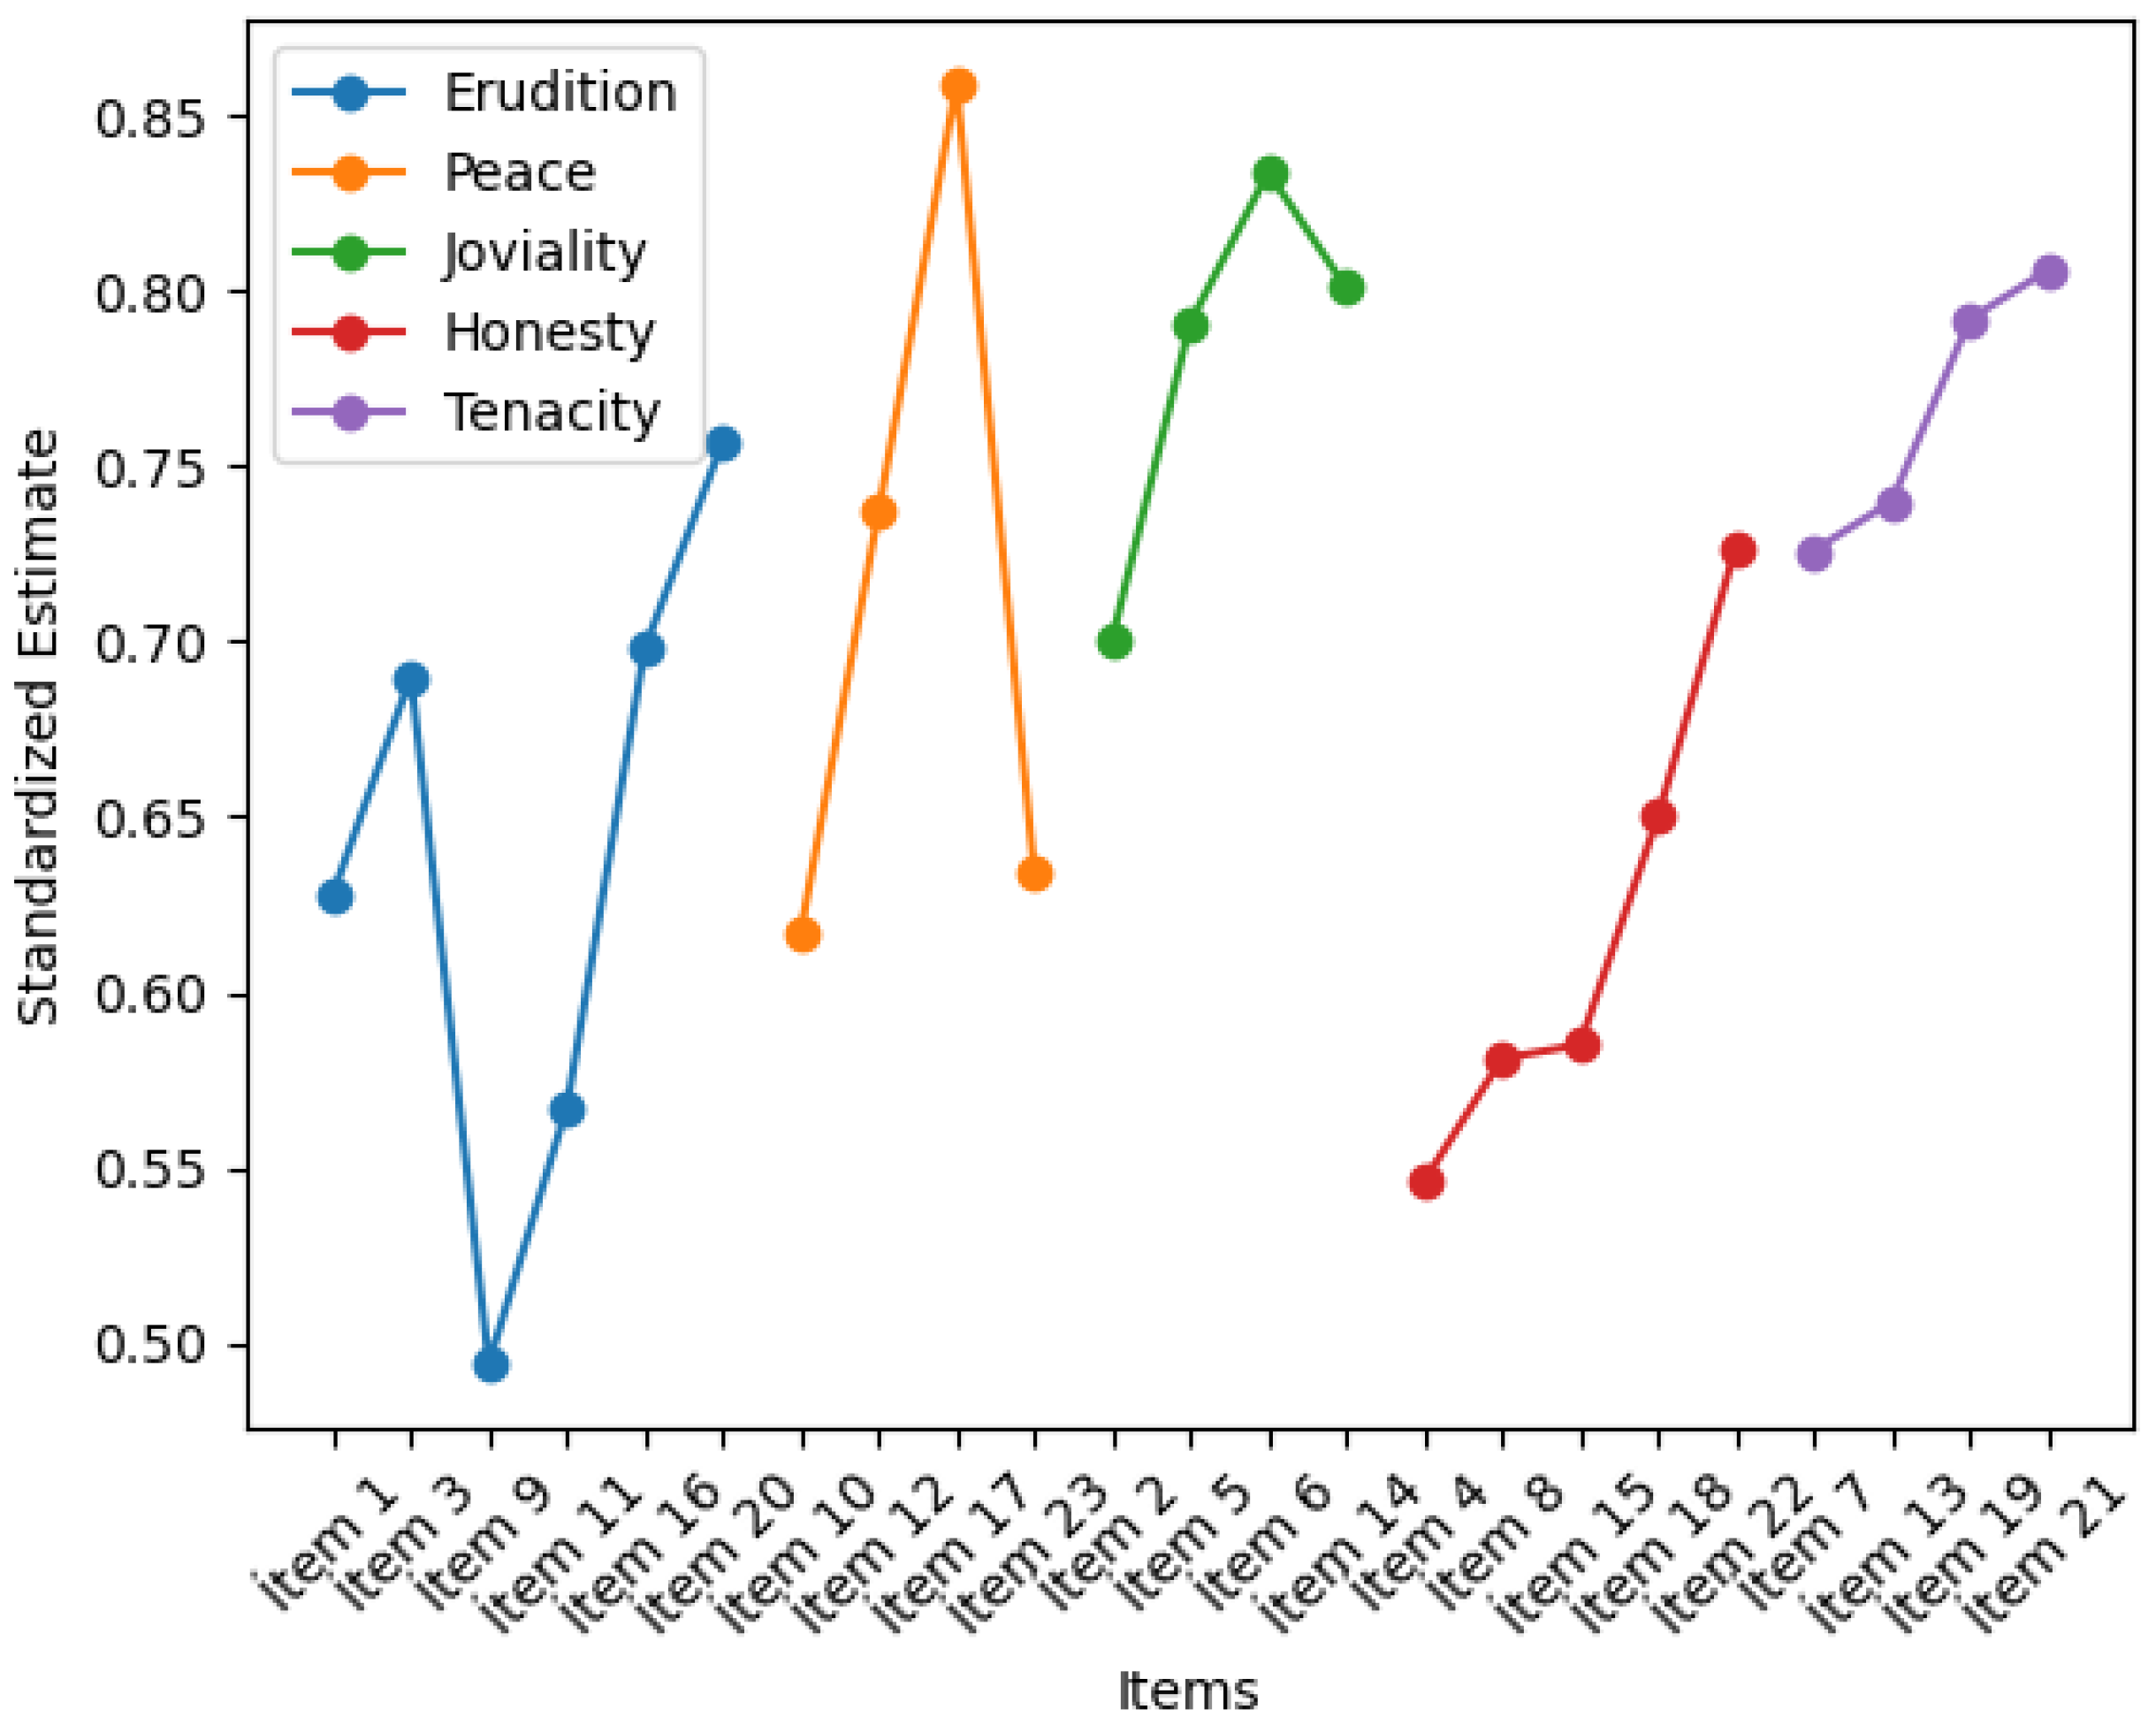
Figure 2.
Network Analysis, Centrality, and Clustering of the Items of the High Five Inventory (HFI) Among Ecuadorian University Students by City. Note: The questions related to intelligence include: I am intelligent (E1), I have wisdom (E3), I am imaginative (E9), I am cultured (E11), I have talent (E16), and I am ingenious (E20). Regarding patience and tranquility, the following are considered: I am tolerant (P10), I have tranquility (P12), I have serenity (P17), and I have patience (P23). Concerning humor and friendliness, they include: I have a sense of humor (J2), I am friendly (J5), I am fun (J6), and I am funny (J14). Loyalty and transparency are reflected in: I have loyalty (H4), I am trustworthy (H8), I have values (H15), I am transparent (H18), and I am truthful (H22). Finally, dedication and effort are represented in: I have dedication (T7), I am persistent (T13), I have effort (T19), and I am hardworking (T21).
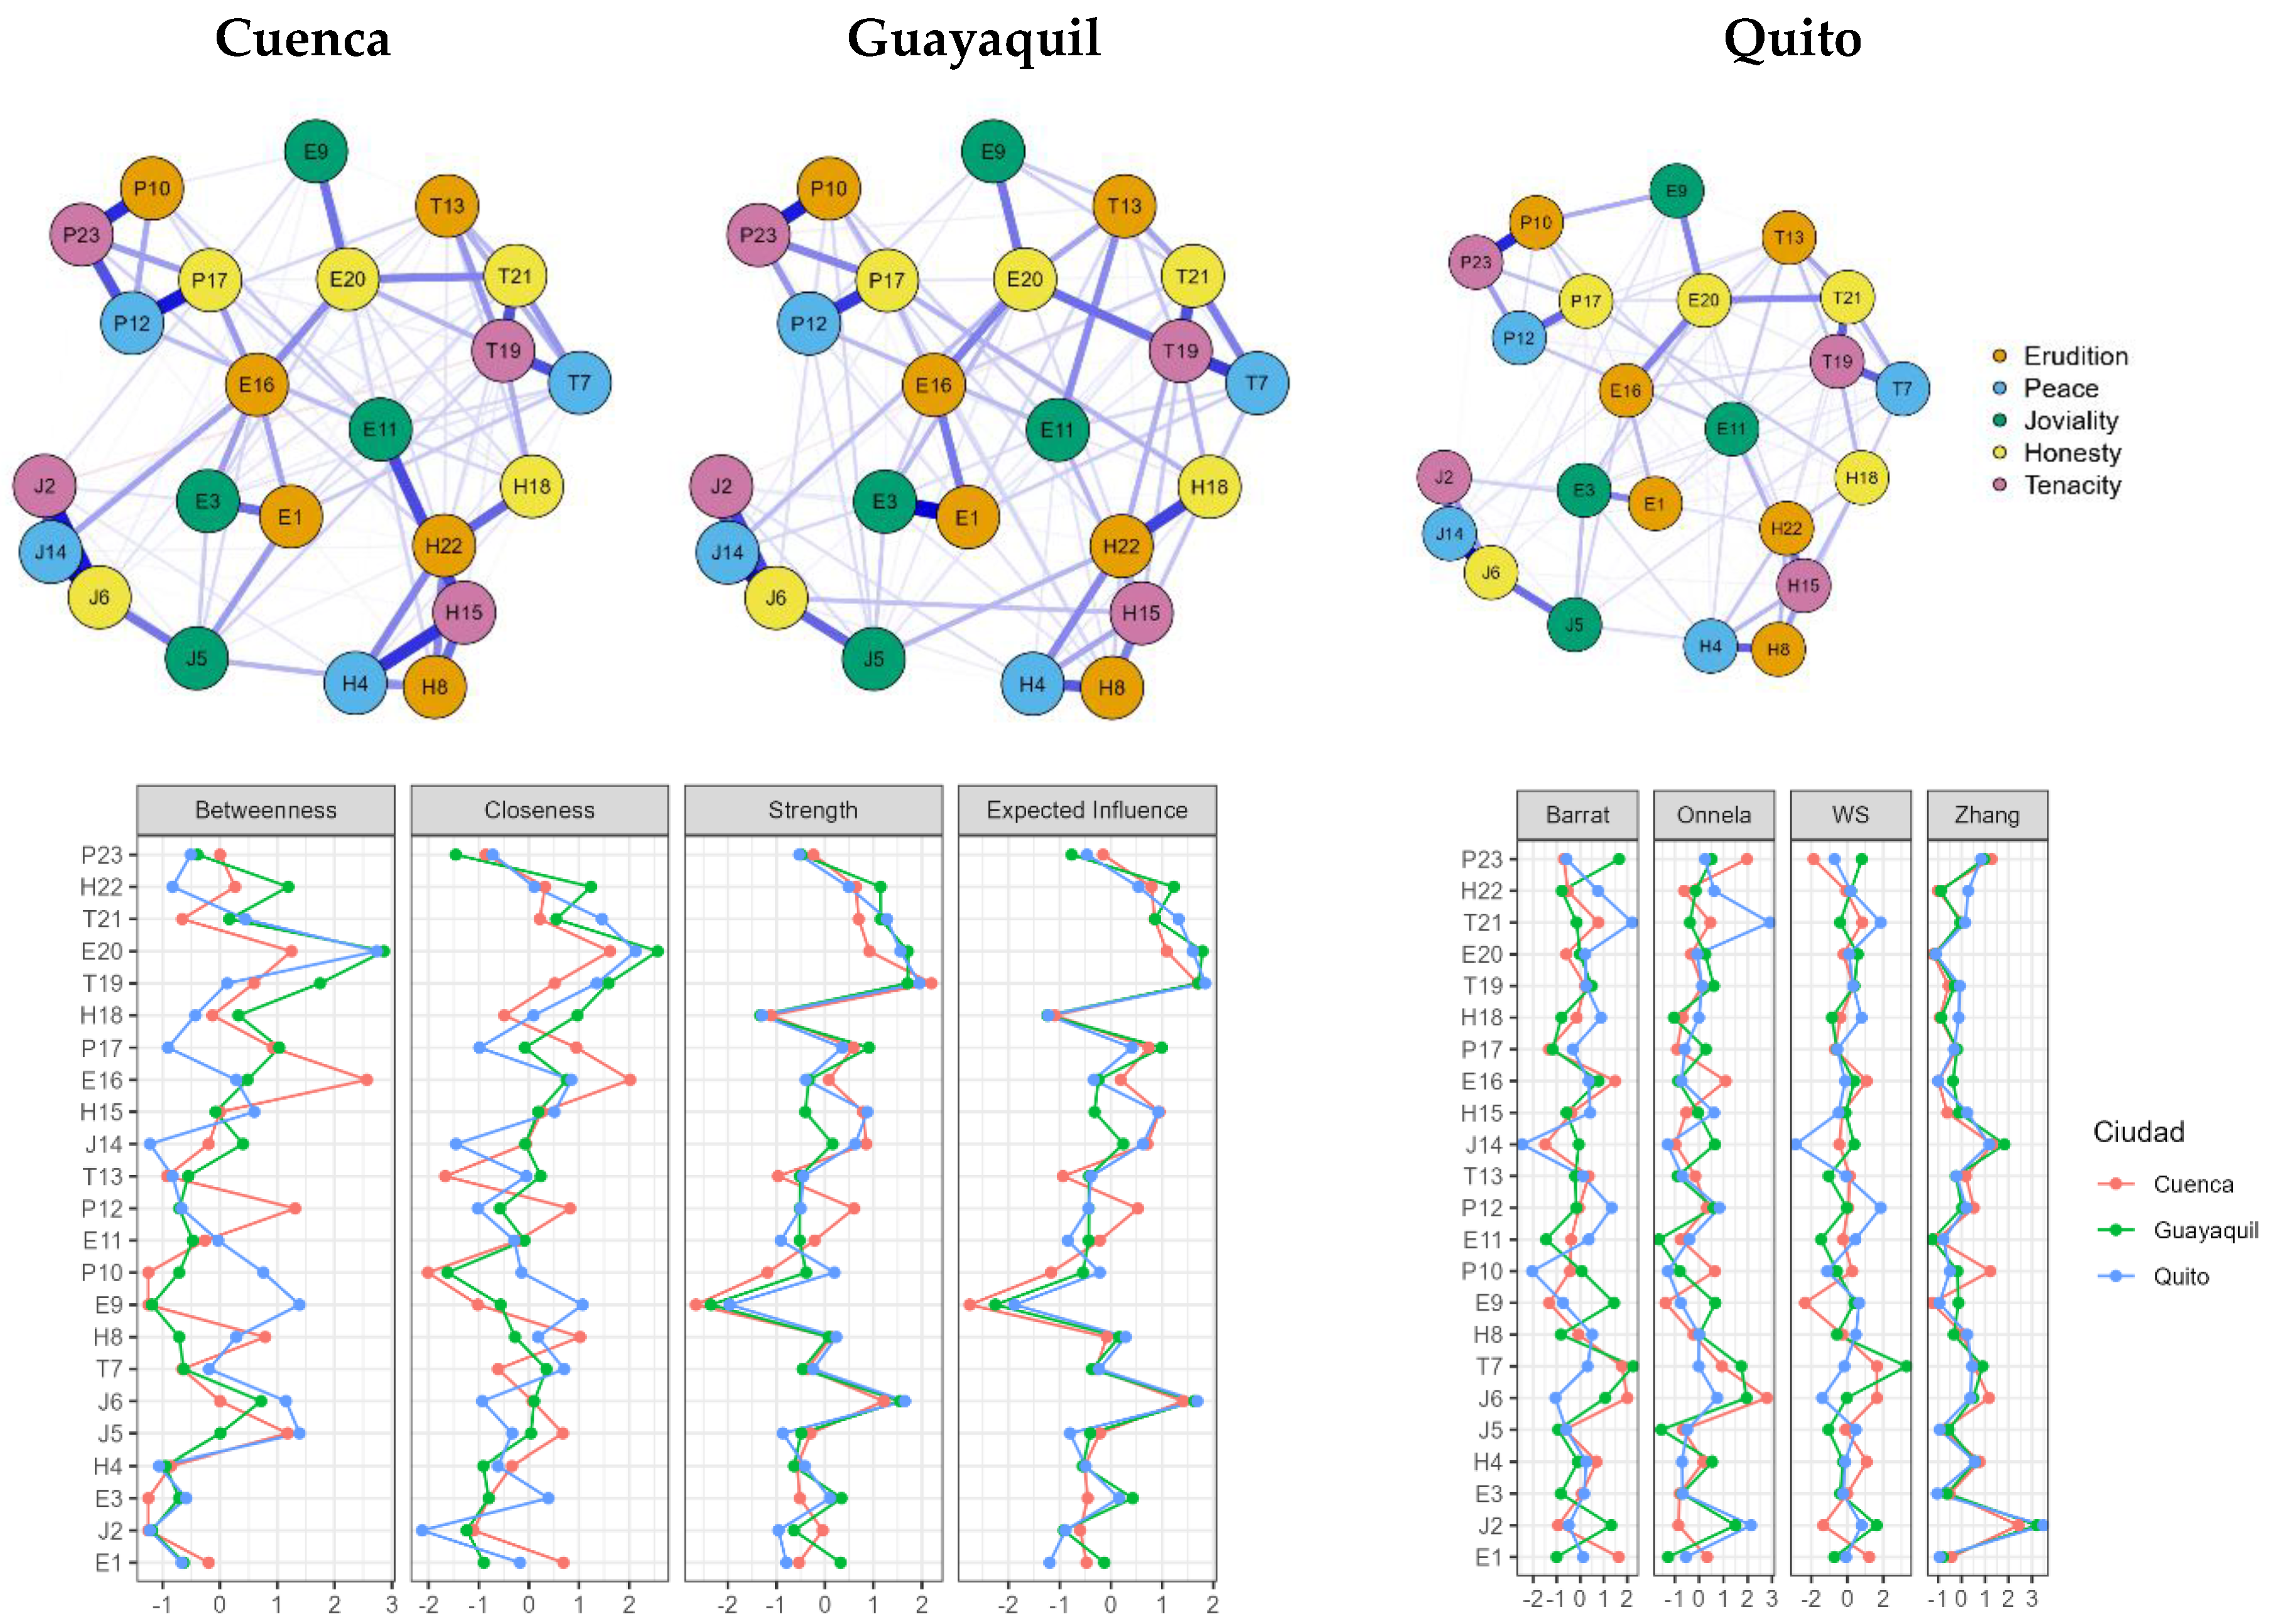

Table 1.
Factor loadings, reliability and validity of the High Five Inventory (HFI) in Ecuadorian university students.
Table 1.
Factor loadings, reliability and validity of the High Five Inventory (HFI) in Ecuadorian university students.
| Factor | Std. estimate | Std. Error | z-value | p | Lower* | Upper* | CR | ω | α | G6 | VIF | AVE | |
| Erudition | Ítem 1 | 0.628 | 0.015 | 42.321 | < .001 | 0.599 | 0.657 | 0.808 | 0.811 | 0.802 | 0.794 | 1.567 | 0.419 |
| Ítem 3 | 0.690 | 0.015 | 44.663 | < .001 | 0.660 | 0.720 | |||||||
| Ítem 9 | 0.494 | 0.015 | 31.992 | < .001 | 0.463 | 0.524 | |||||||
| Ítem 11 | 0.567 | 0.017 | 32.557 | < .001 | 0.533 | 0.601 | |||||||
| Ítem 16 | 0.698 | 0.017 | 42.003 | < .001 | 0.665 | 0.731 | |||||||
| Ítem 20 | 0.757 | 0.018 | 41.395 | < .001 | 0.721 | 0.793 | |||||||
| Peace | Ítem 10 | 0.617 | 0.018 | 33.385 | < .001 | 0.581 | 0.653 | 0.807 | 0.791 | 0.810 | 0.803 | 1.421 | 0.512 |
| Ítem 12 | 0.737 | 0.020 | 36.505 | < .001 | 0.698 | 0.777 | |||||||
| Ítem 17 | 0.859 | 0.022 | 38.925 | < .001 | 0.816 | 0.902 | |||||||
| Ítem 23 | 0.634 | 0.018 | 34.798 | < .001 | 0.598 | 0.669 | |||||||
| Joviality | Ítem 2 | 0.701 | 0.017 | 41.564 | < .001 | 0.668 | 0.734 | 0.863 | 0.865 | 0.861 | 0.853 | 1.702 | 0.611 |
| Ítem 5 | 0.791 | 0.020 | 39.392 | < .001 | 0.751 | 0.830 | |||||||
| Ítem 6 | 0.834 | 0.020 | 42.030 | < .001 | 0.795 | 0.873 | |||||||
| Ítem 14 | 0.801 | 0.019 | 42.422 | < .001 | 0.764 | 0.838 | |||||||
| Honesty | Ítem 4 | 0.546 | 0.029 | 18.993 | < .001 | 0.490 | 0.602 | 0.757 | 0.737 | 0.754 | 0.746 | 1.362 | 0.405 |
| Ítem 8 | 0.581 | 0.029 | 19.695 | < .001 | 0.523 | 0.639 | |||||||
| Ítem 15 | 0.585 | 0.034 | 17.003 | < .001 | 0.517 | 0.652 | |||||||
| Ítem 18 | 0.650 | 0.022 | 29.273 | < .001 | 0.606 | 0.693 | |||||||
| Ítem 22 | 0.727 | 0.030 | 24.142 | < .001 | 0.668 | 0.786 | |||||||
| Tenacity | Ítem 7 | 0.726 | 0.020 | 36.898 | < .001 | 0.688 | 0.765 | 0.851 | 0.848 | 0.919 | 0.911 | 1.634 | 0.586 |
| Ítem 13 | 0.740 | 0.020 | 37.096 | < .001 | 0.701 | 0.779 | |||||||
| Ítem 19 | 0.792 | 0.023 | 34.660 | < .001 | 0.748 | 0.837 | |||||||
| Ítem 21 | 0.806 | 0.022 | 36.758 | < .001 | 0.763 | 0.849 |
Note: * = 95% Confidence Interval; CR = Composite Reliability; ω = McDonald's Omega; α = Cronbach's Alpha; G6 = Guttman's Lambda 6; VIF = Variance Inflation Factor; AVE = Average Variance Extracted.
Table 2.
Measurement Invariance Across City and knowledge Area of the High Five Inventory (HFI) Among Ecuadorian University Students.
Table 2.
Measurement Invariance Across City and knowledge Area of the High Five Inventory (HFI) Among Ecuadorian University Students.
| Model | X2 | df | p | CFI | TLI | RMSEA | SRMR |
|---|---|---|---|---|---|---|---|
| City (Cuenca, Guayaquil and Quito) | |||||||
| MI ↔ CO | 731.779 | 660 | .027 | .998 | .998 | .014 (.005 - .020) | .049 |
| MI ↔ ME | 811.47 | 666 | .002 | .997 | .996 | .018 (.012 - .023) | .052 |
| MI ↔ SC | 841.732 | 732 | .003 | .997 | .997 | .017 (.011 - .022) | .049 |
| MI ↔ ST | 891.625 | 778 | .003 | .997 | .997 | .017 (.010 - .022) | .056 |
| MI ↔ STR | 1102.424 | 818 | < .001 | .992 | .992 | .026 (.022 - .030) | .061 |
| knowledge Area (Social and Behavioral Sciences Human-Humanities, Life Sciences, Science and Technology, Administration and Economics and Education) | |||||||
| MI ↔ CO | 998.020 | 1100 | .987 | .999 | .999 | .000 (.000 - .000) | .050 |
| MI ↔ ME | 1262.519 | 1172 | .033 | .997 | .997 | .016 (.005 - .022) | .062 |
| MI ↔ SC | 1310.763 | 1244 | .092 | .998 | .998 | .013 (.000 - .020) | .049 |
| MI ↔ STR | 2664.331 | 1416 | < .001 | .963 | .967 | .053 (.050 - .056) | .095 |
Note: MI = Measures of Invariance, CO = Configural, ME = Metric, SC = Scalar, ST = Strict, STR = Structural.
Disclaimer/Publisher’s Note: The statements, opinions and data contained in all publications are solely those of the individual author(s) and contributor(s) and not of MDPI and/or the editor(s). MDPI and/or the editor(s) disclaim responsibility for any injury to people or property resulting from any ideas, methods, instructions or products referred to in the content. |
© 2025 by the authors. Licensee MDPI, Basel, Switzerland. This article is an open access article distributed under the terms and conditions of the Creative Commons Attribution (CC BY) license (http://creativecommons.org/licenses/by/4.0/).
Copyright: This open access article is published under a Creative Commons CC BY 4.0 license, which permit the free download, distribution, and reuse, provided that the author and preprint are cited in any reuse.


