
Submitted:
14 February 2025
Posted:
18 February 2025
You are already at the latest version
Abstract
Social desirability is a widely studied phenomenon due to its impact on the validity of self-reported data. This study evaluated the psychometric properties of the Brief Social Desirability Scale (BSSD-4) in Ecuadorian youth, analyzing its reliability, factorial and convergent validity, and measurement invariance by sex, age group, and experiences of dating violence. An instrumental study was conducted with 836 participants (aged 14–26). Reliability was adequate (Ω = 0.75, α = 0.81, CR = 0.759). Confirmatory Factor Analysis showed good fit indices (CFI = 0.98, TLI = 0.97, RMSEA = 0.056, SRMR = 0.037). Convergent validity was acceptable (AVE = 0.50, VIF < 2.01). A network analysis confirmed the unidimensionality of the scale and structural differences between groups. Measurement invariance by sex and age was verified, but differences in the network structure were found based on victimization and perpetration of violence. The BSSD-4 is a valid and reliable instrument for assessing social desirability in Ecuadorian youth, useful for population studies and intergroup comparisons. Further research is recommended to explore its invariance in populations with a history of violence, as differences in scalar invariance were observed.
Keywords:
1. Introduction
Reliability
Validity
Measurement Invariance
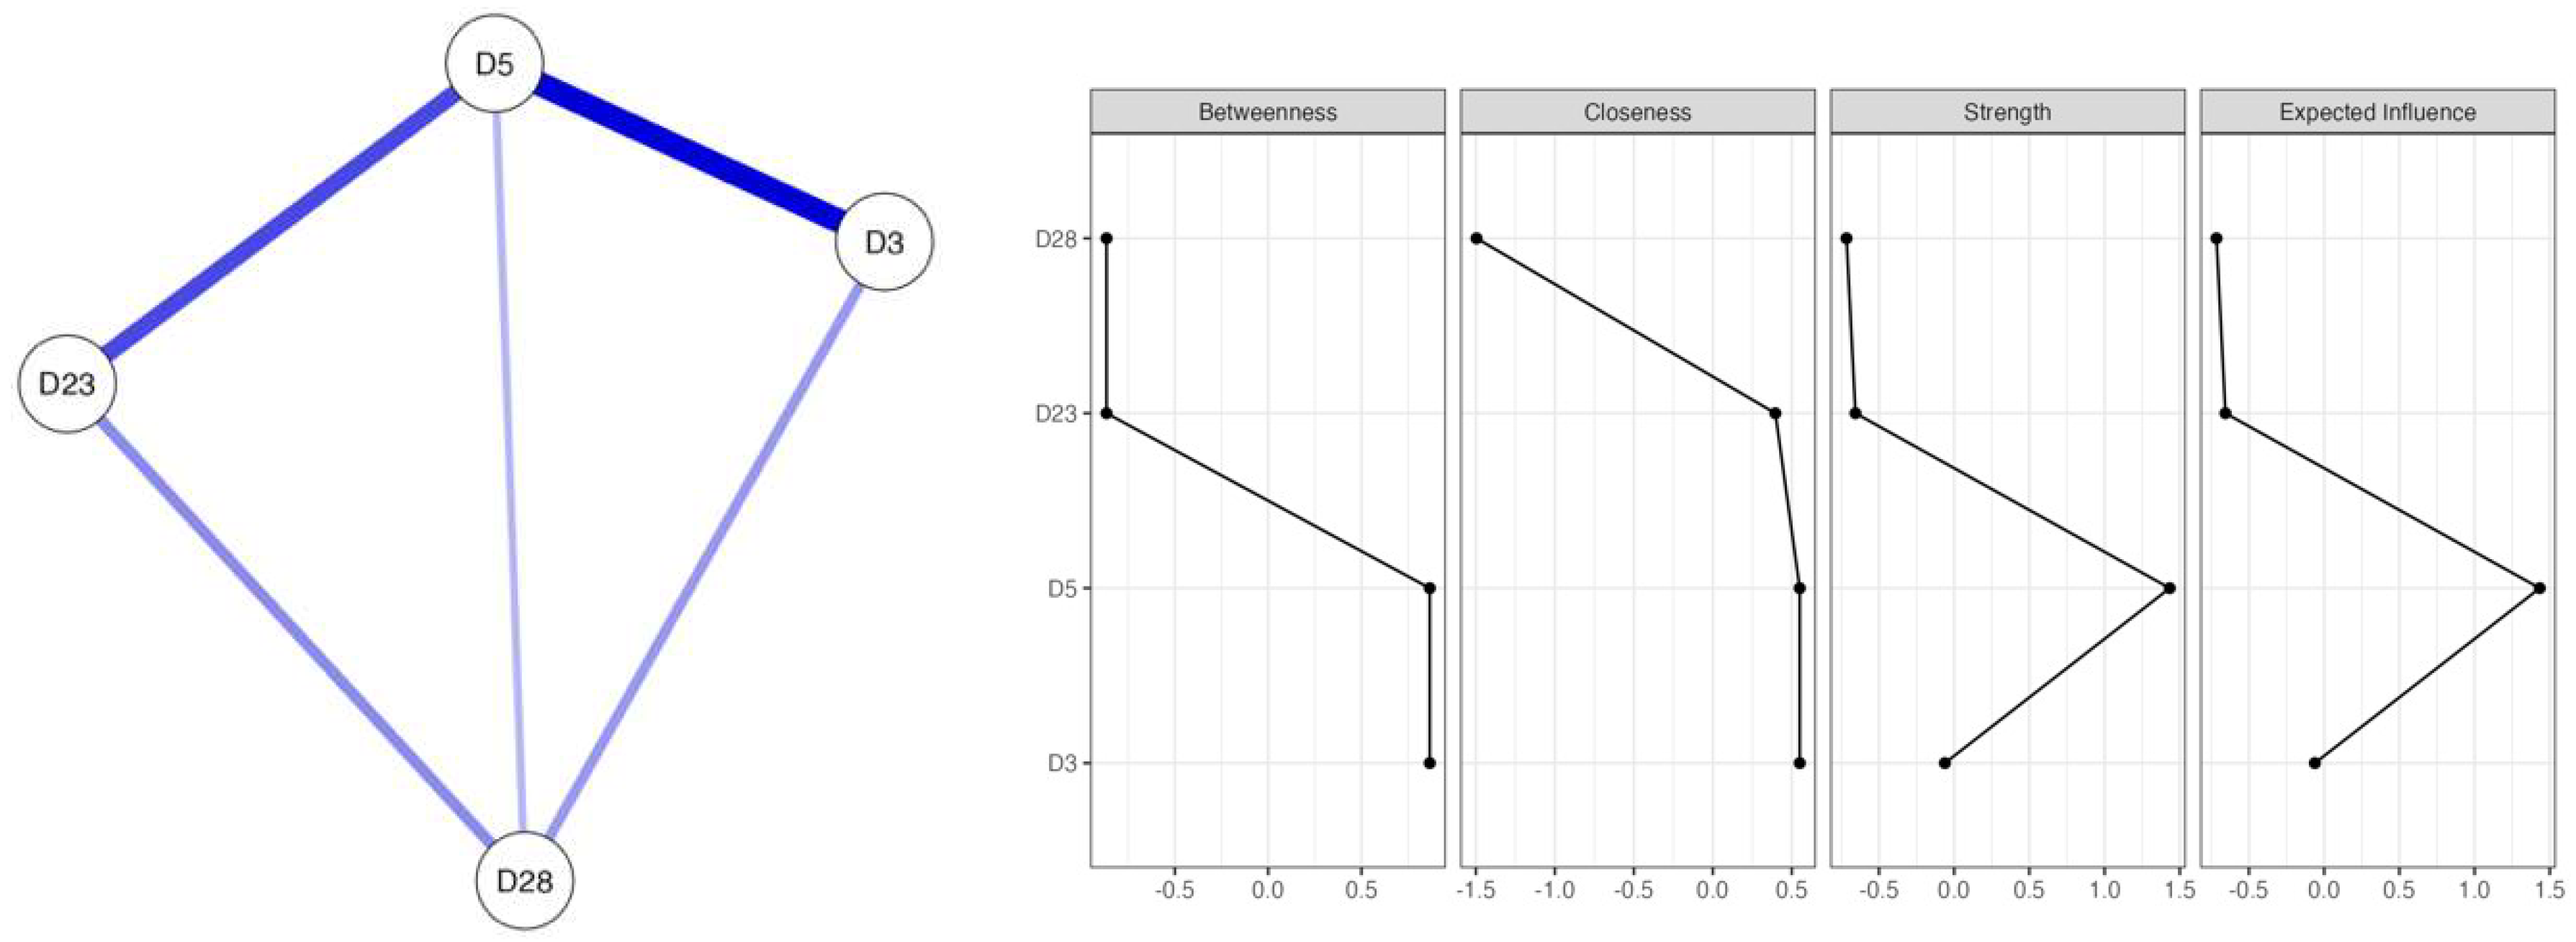
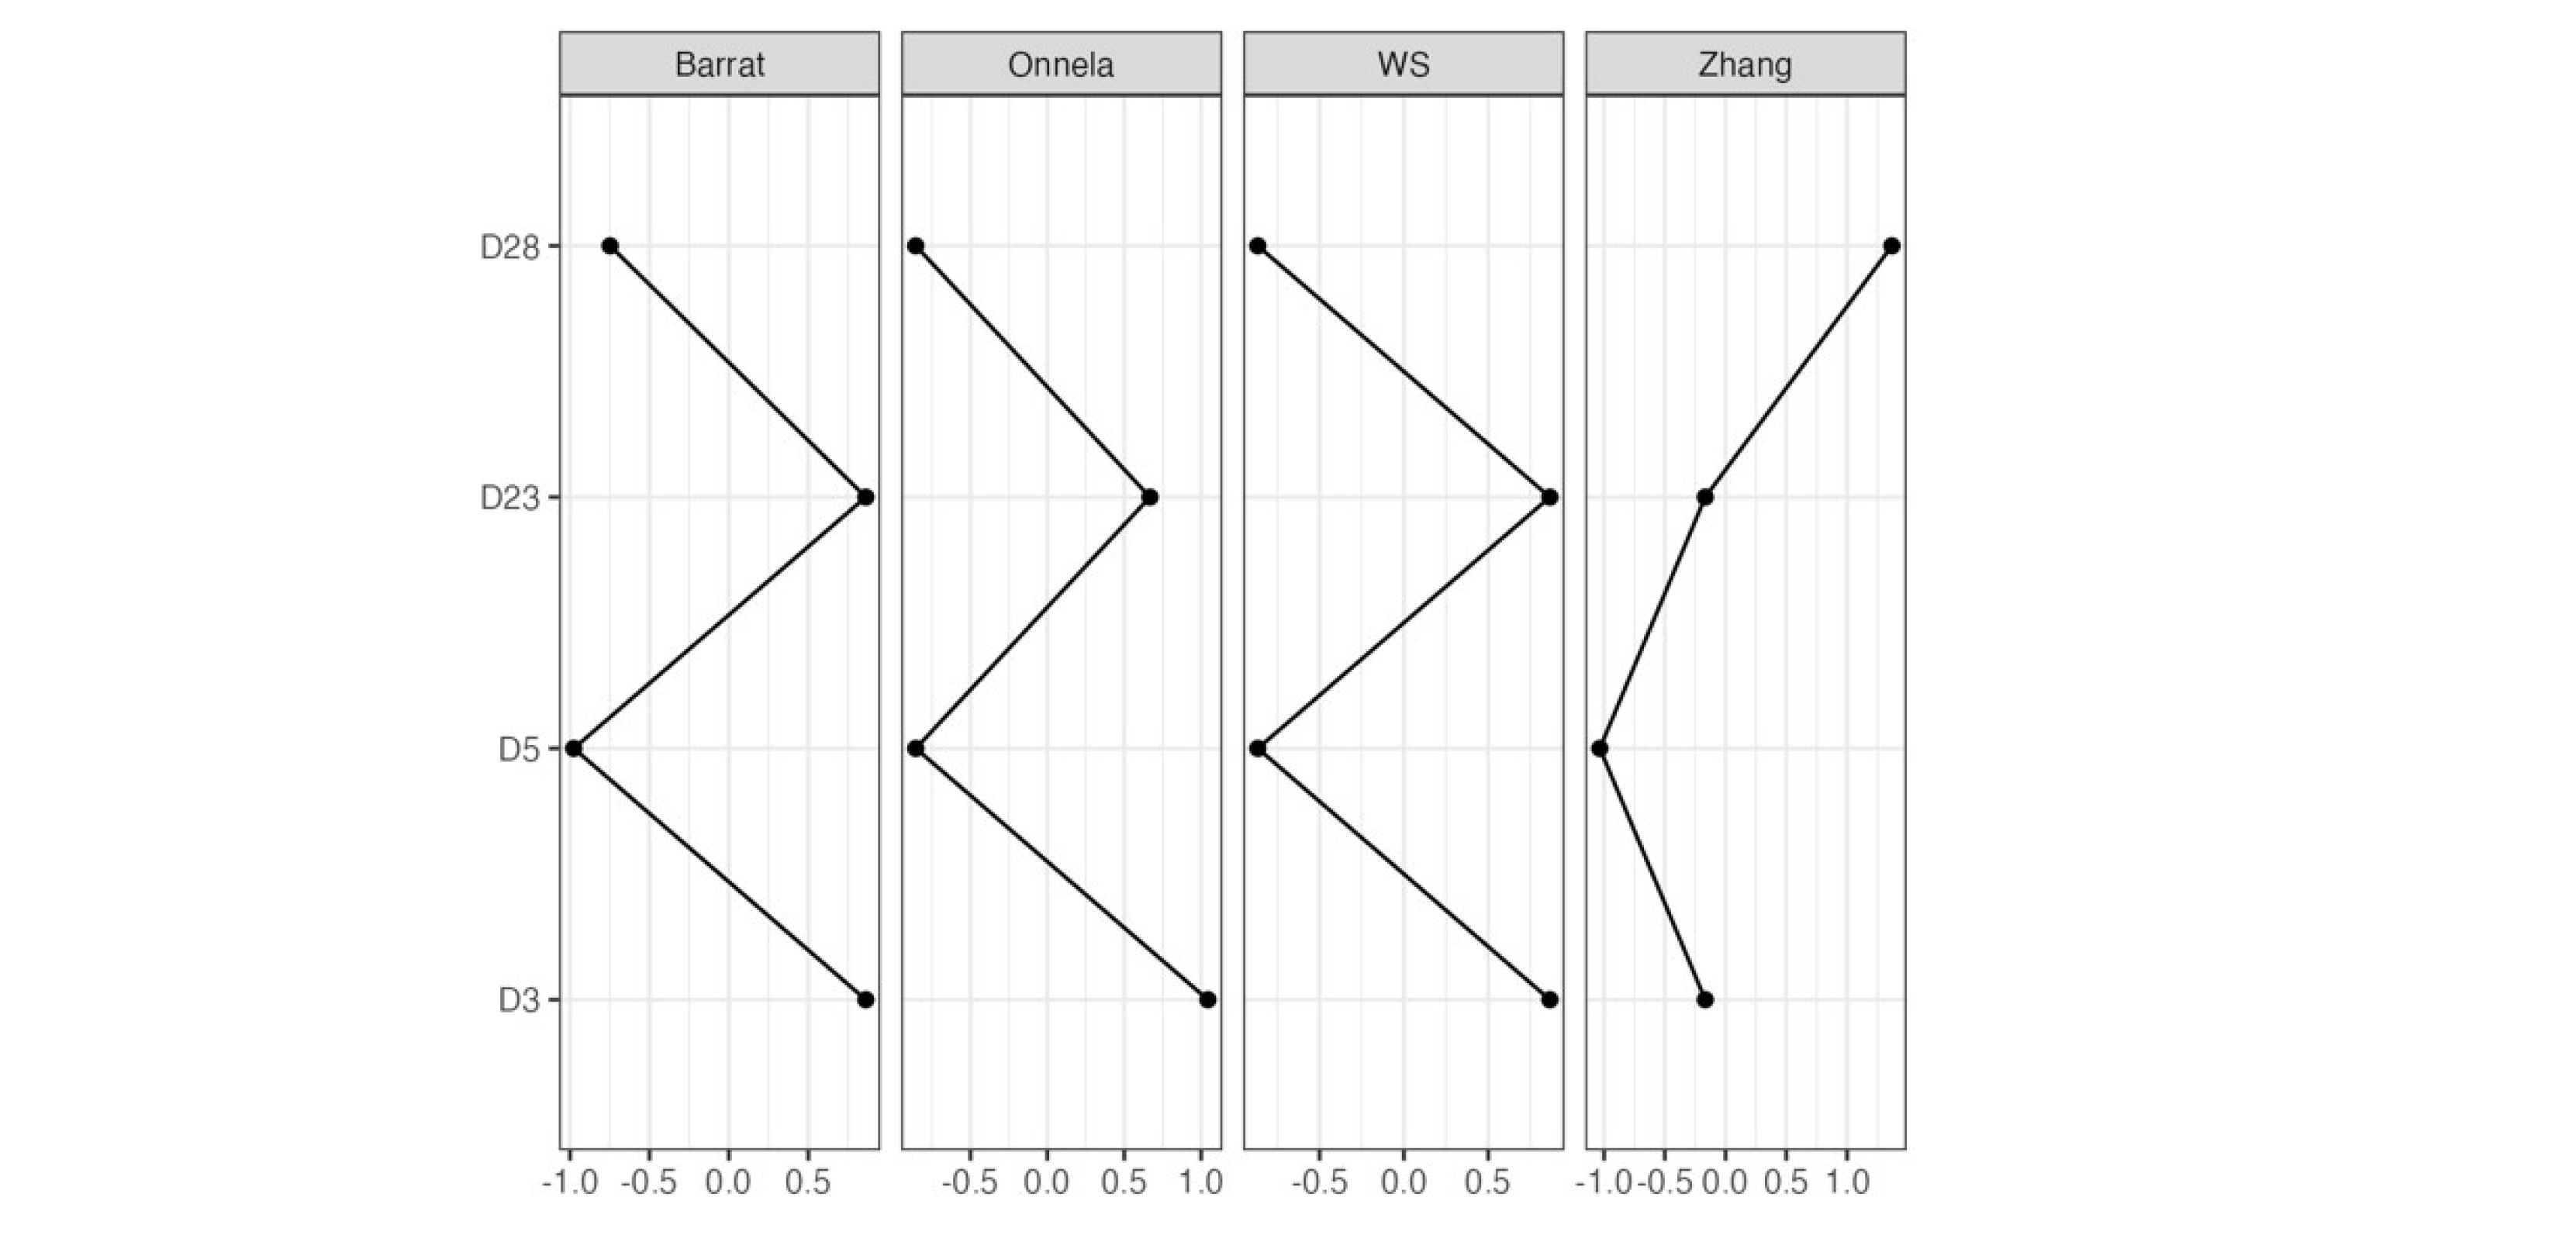
Network
Objectives and Hypotheses
2. Materials and Methods
2.1. Research Design
2.2. Participants
2.3. Measures
2.3.1. Ad-Hoc Sociodemographic Survey
2.3.2. Scale of Social Desirability
2.3.3. Dating Violence Questionnaire for Victimization and Perpetration (DVQ-VP)
2.3.4. Adverse Childhood Experiences Abuse Short Form (ACE-ASF)
2.4. Linguistic Equivalence of the Scale of Social Desirability
2.5. Procedure
2.6. Statistical Analysis
3. Results
4. Discussion
Reliability
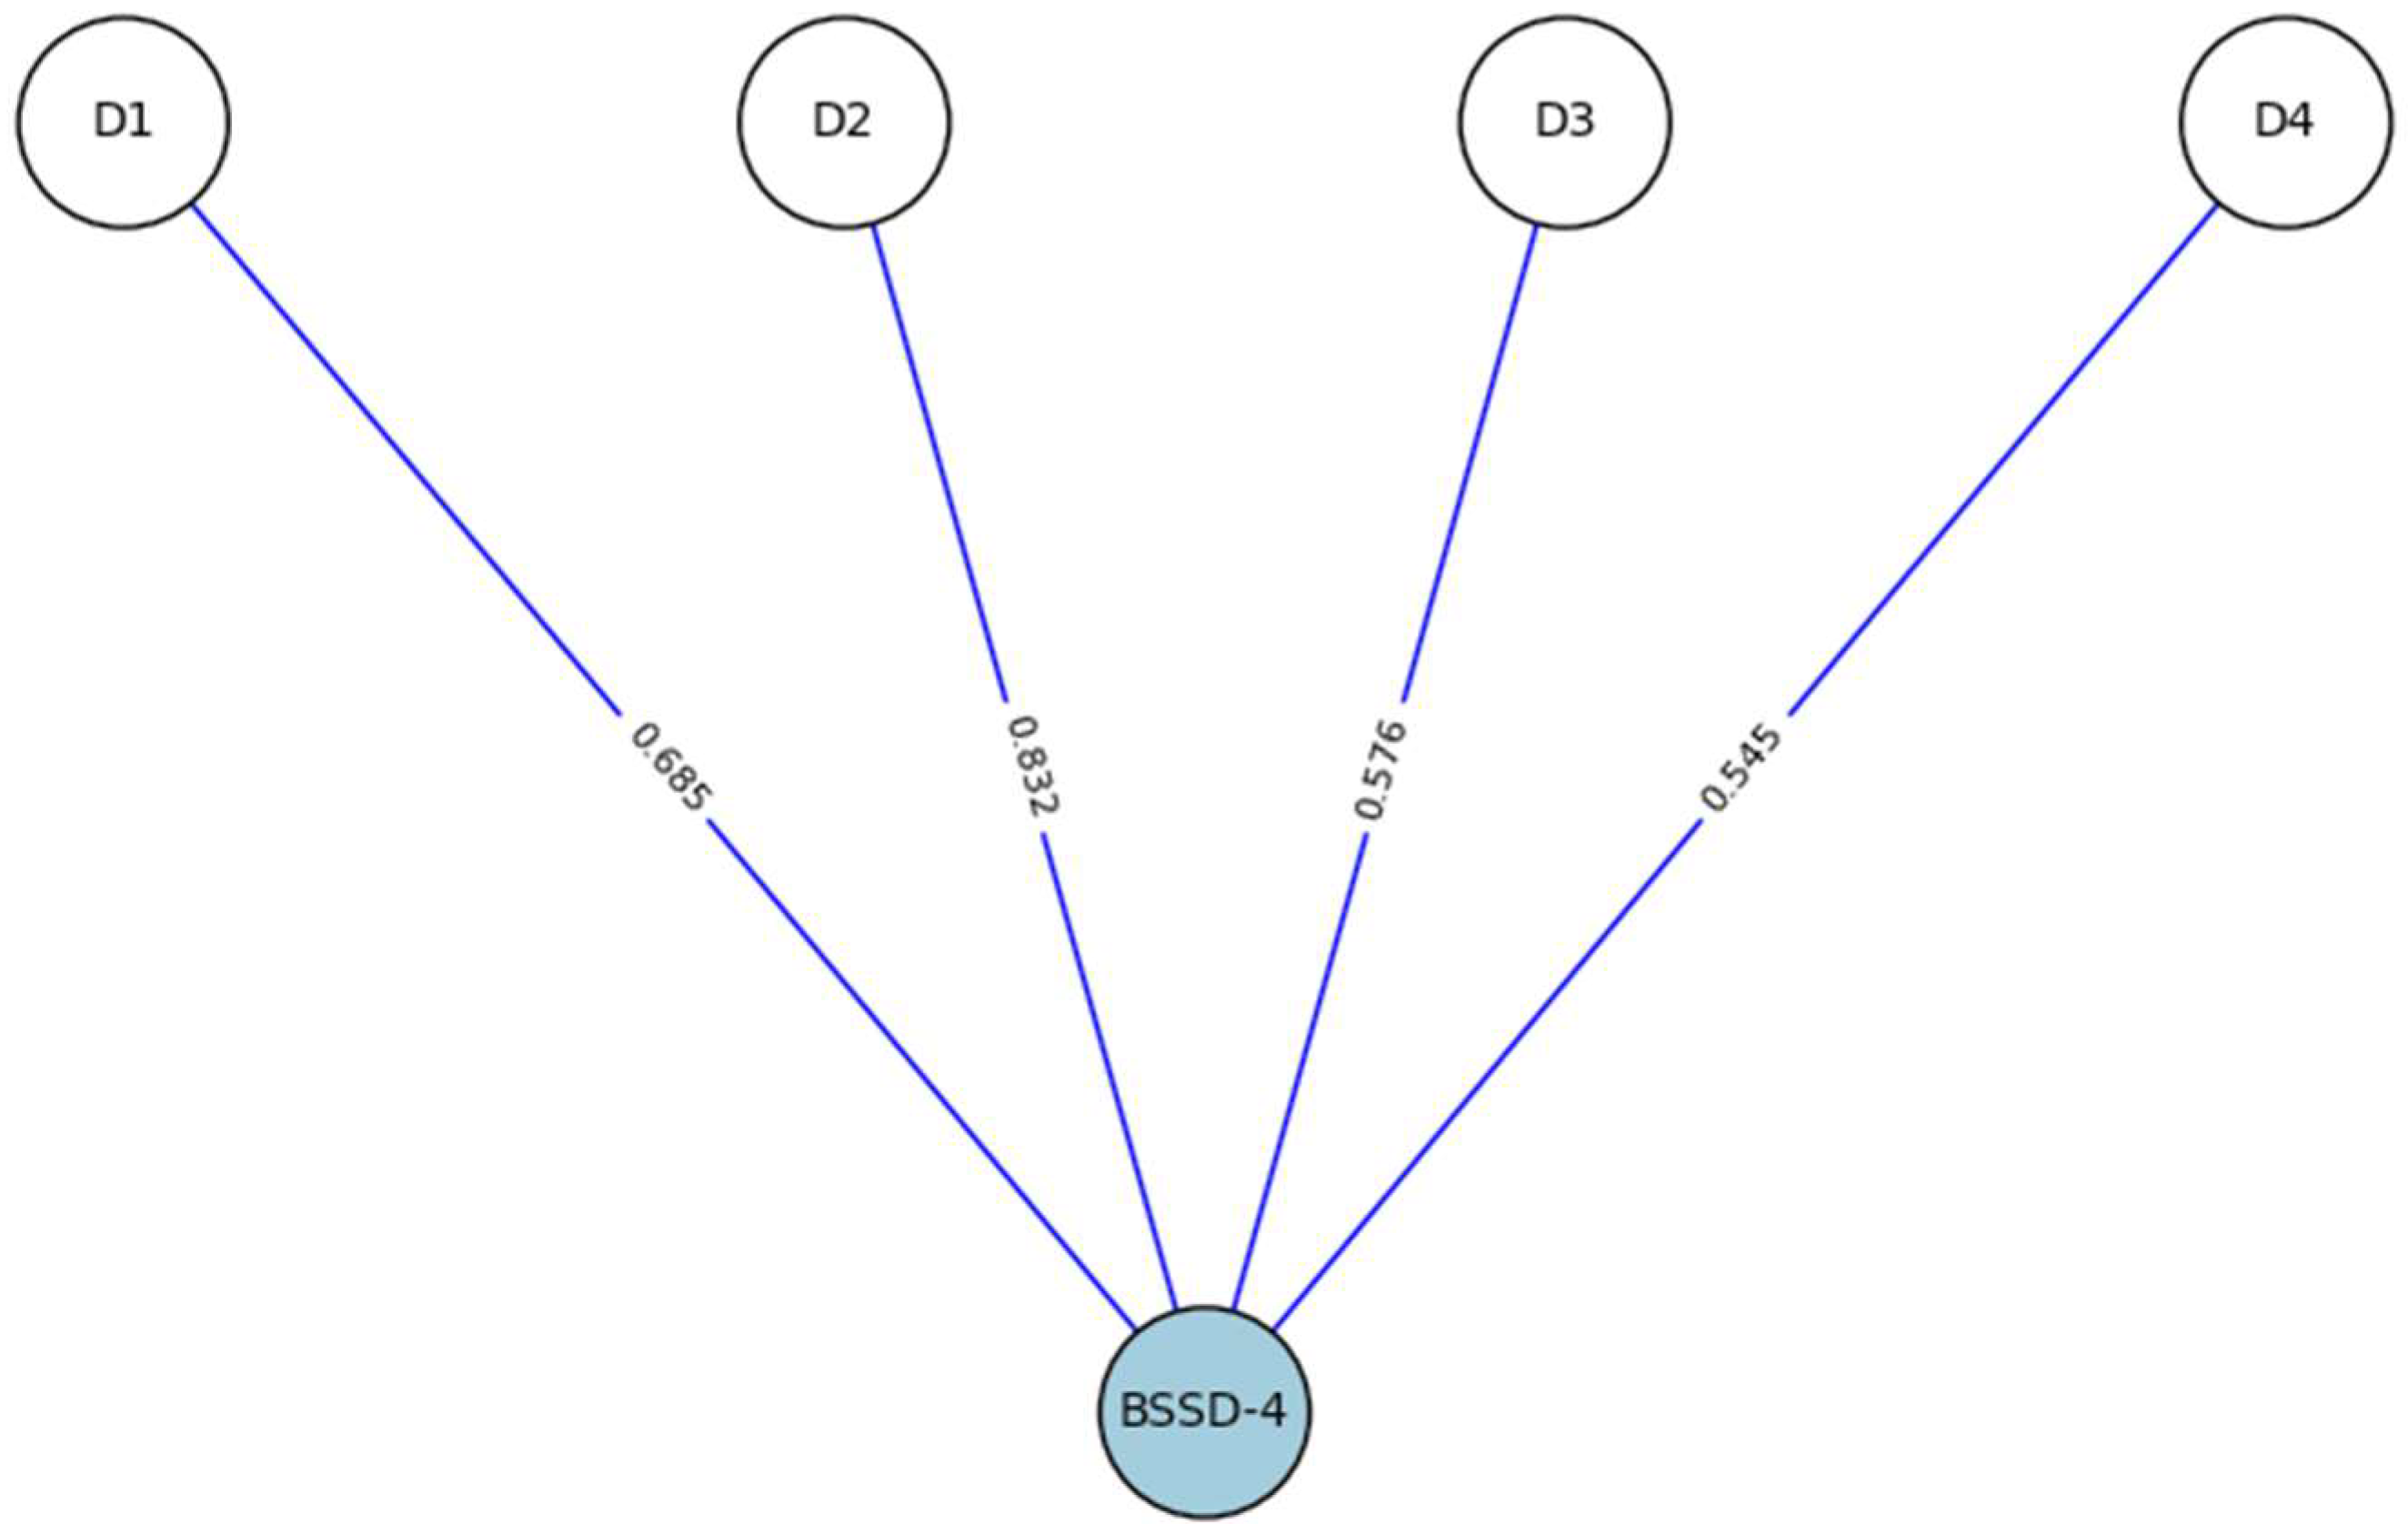
Unidimensionality and Factor Fit
Convergent Validity
Invariance
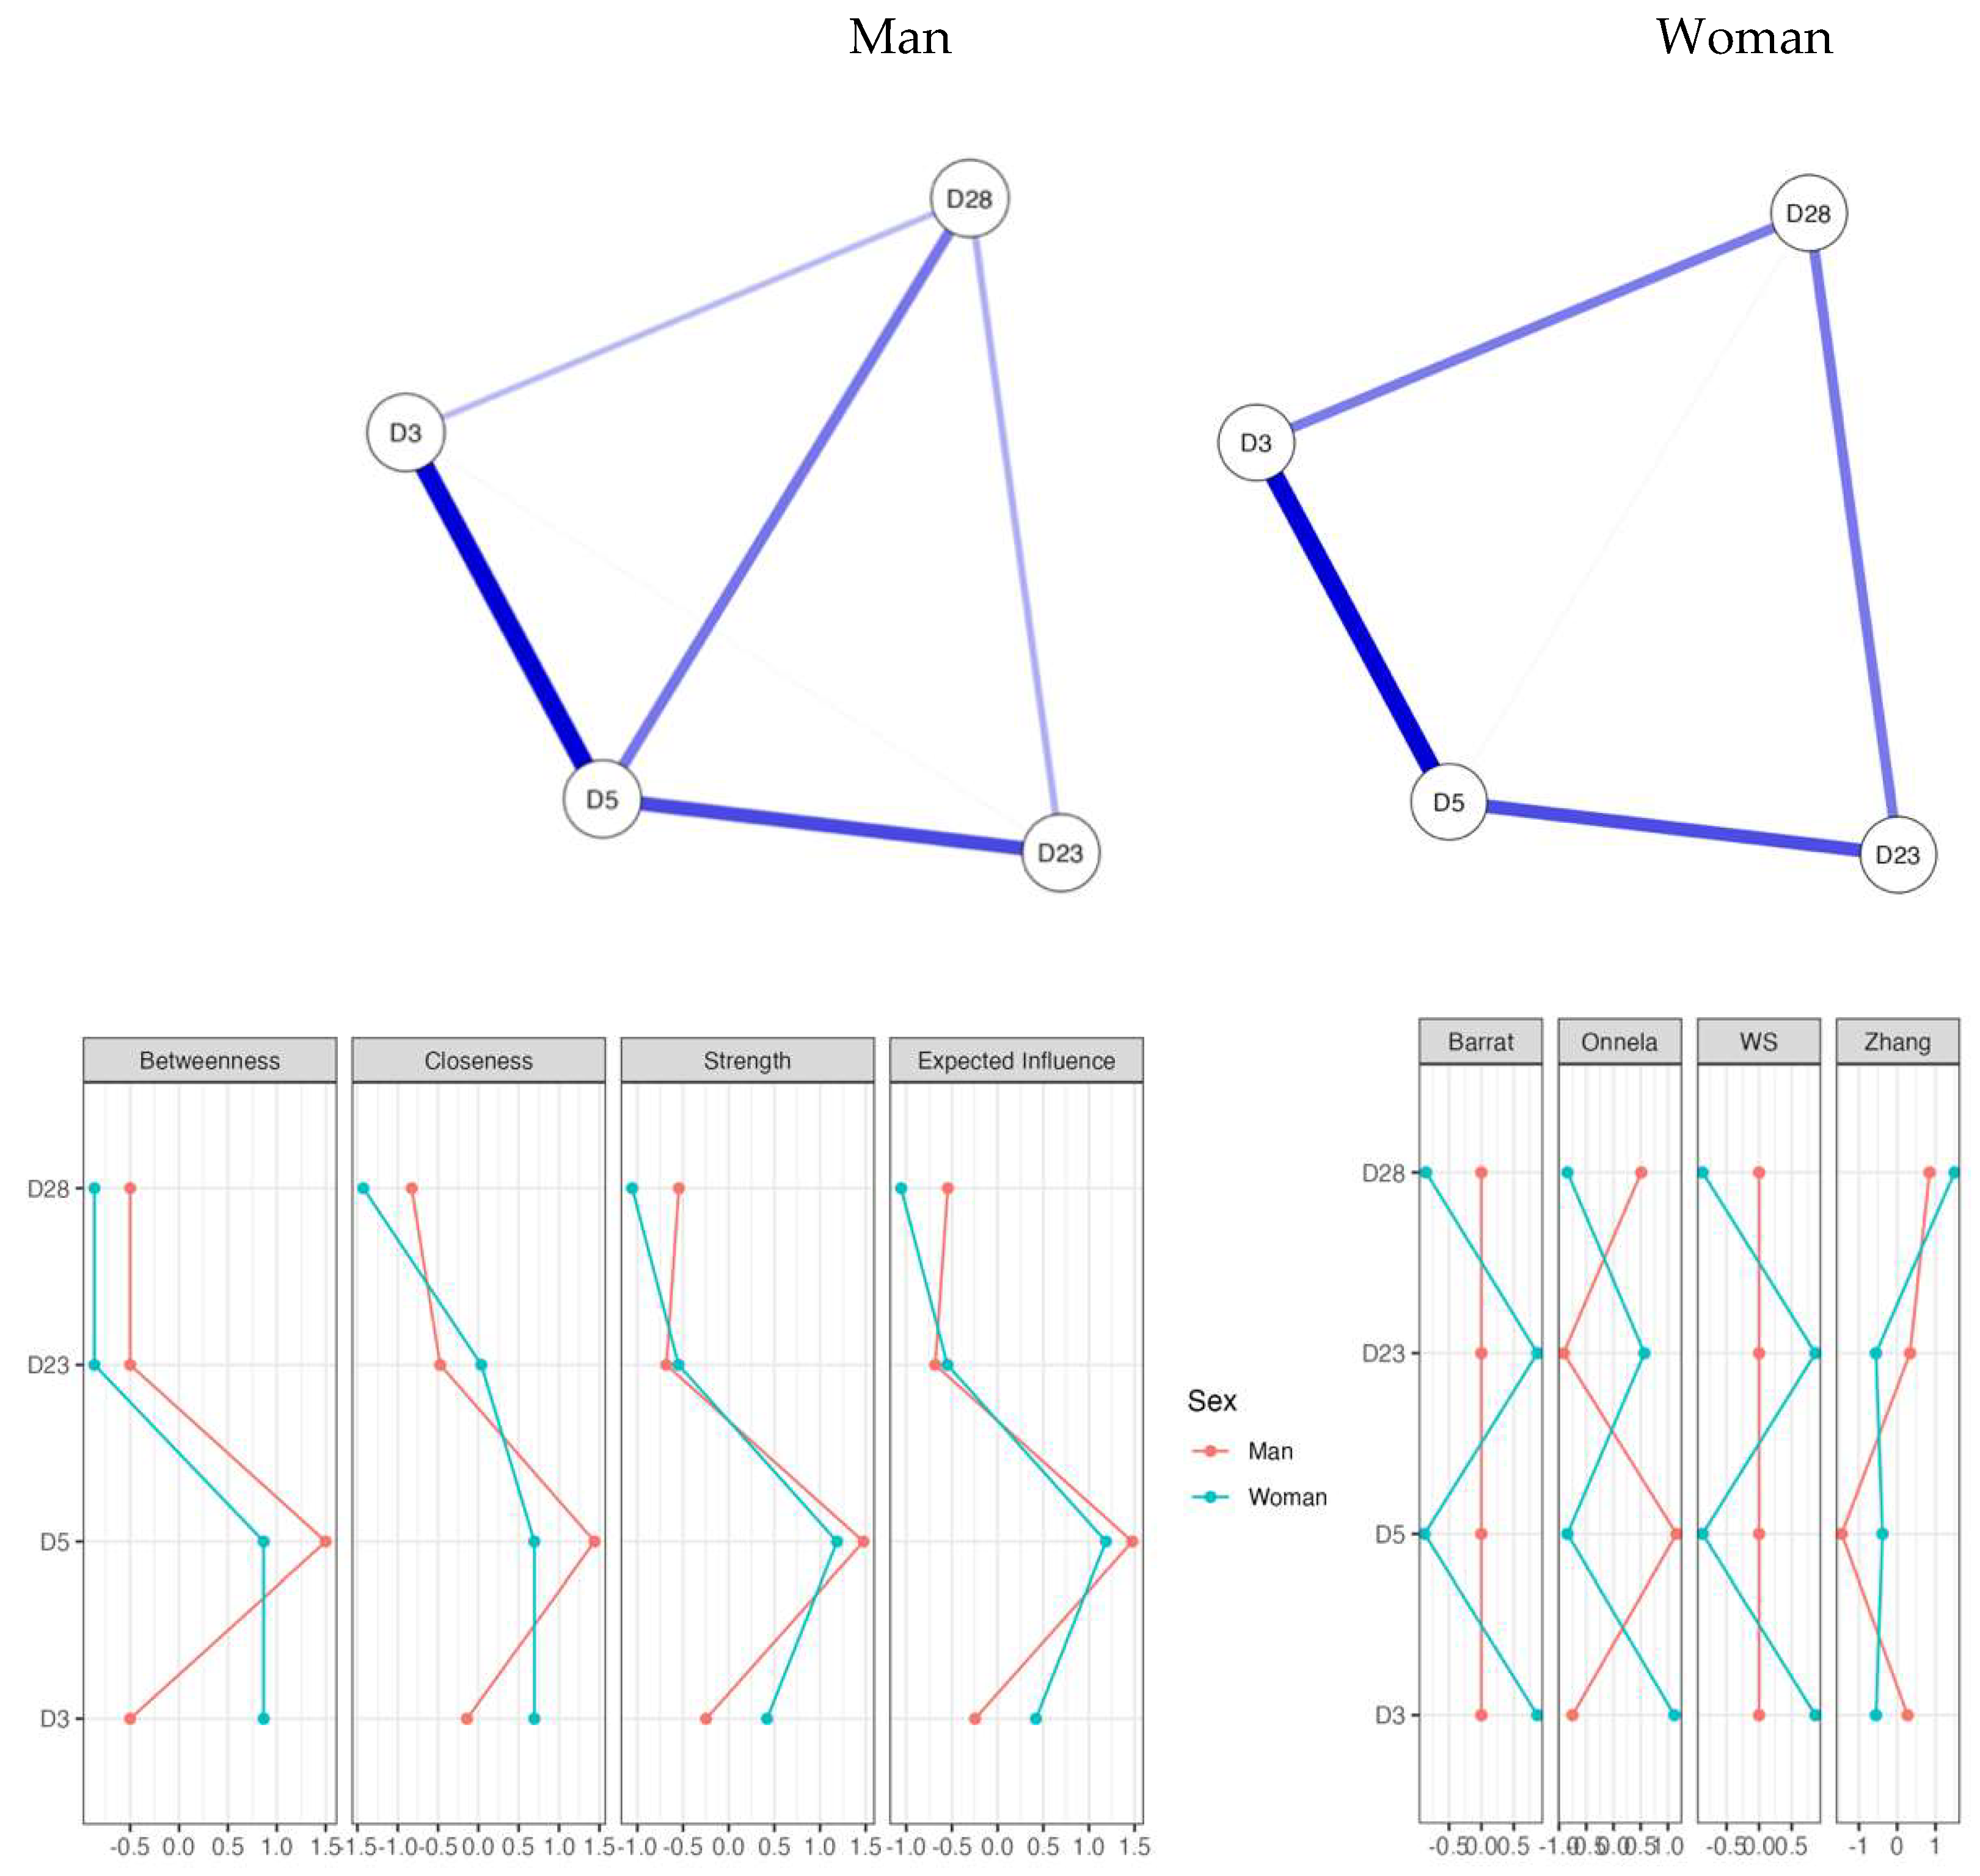
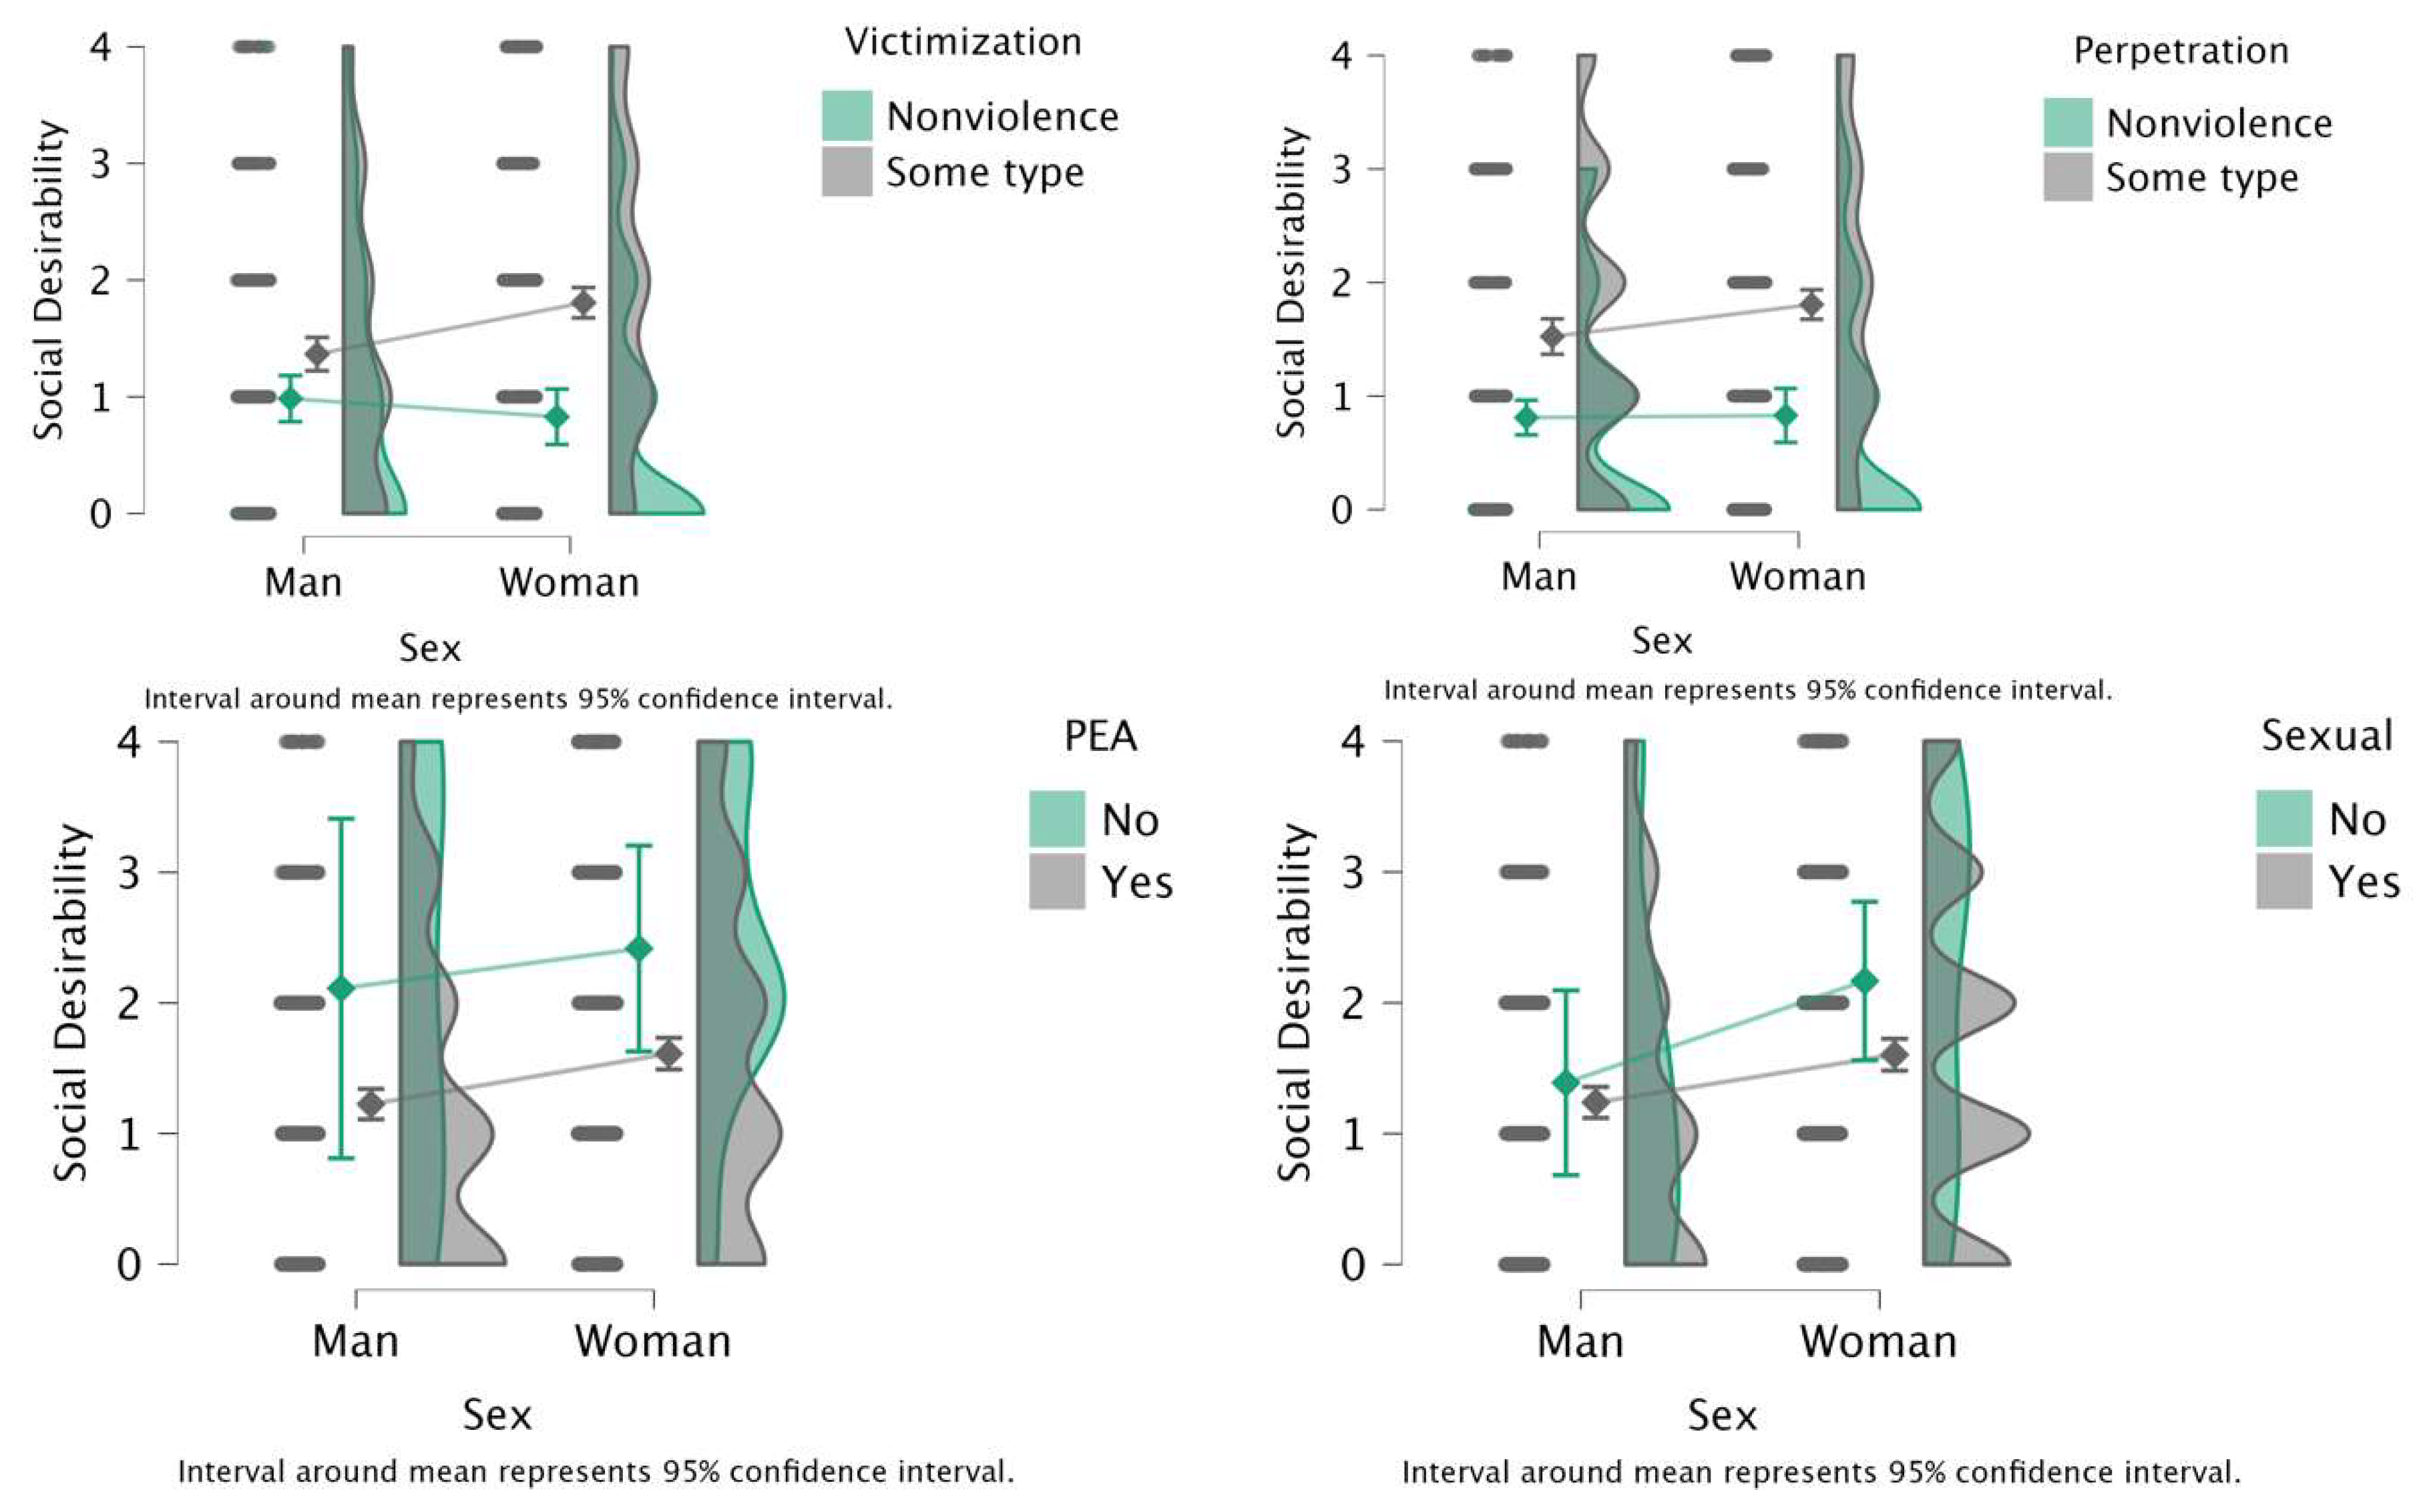
Differences in Network Structure by Sex
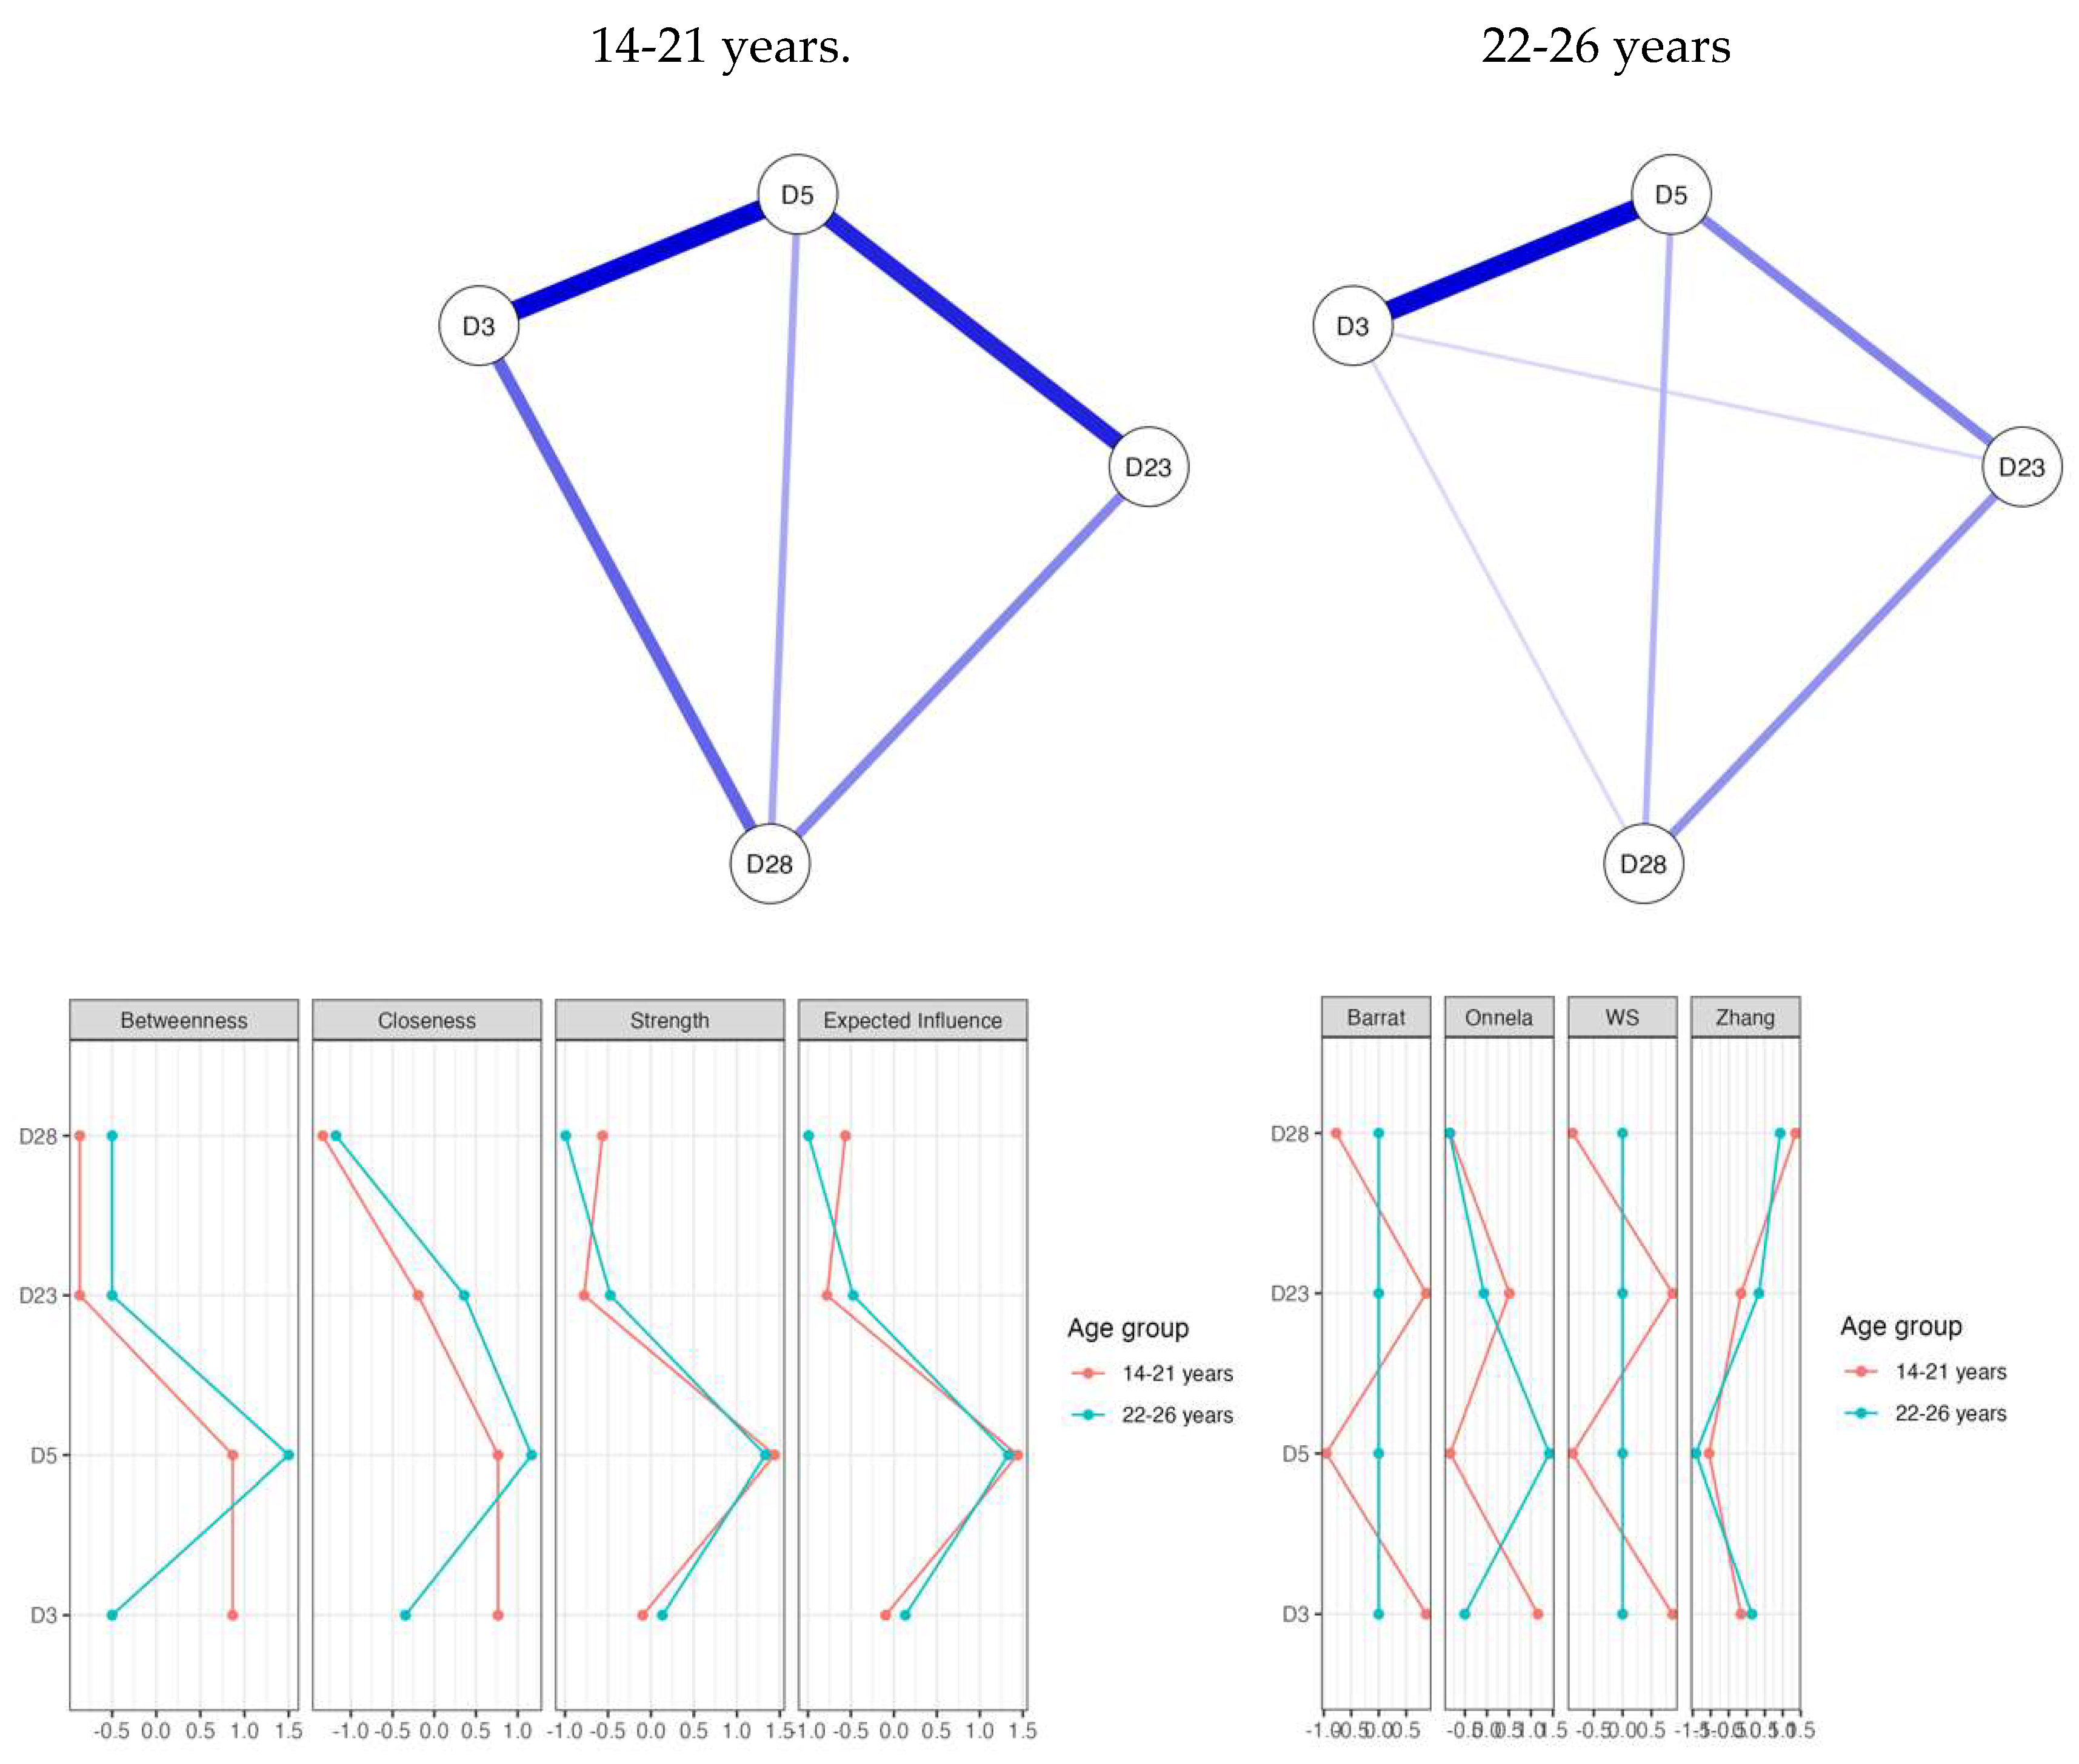
Variability in Network Structure by Age Group
Limitations and Future Research
5. Conclusions
Supplementary Materials
Author Contributions
Funding
Institutional Review Board Statement
Informed Consent Statement
Data Availability Statement
Acknowledgments
Conflicts of Interest
Abbreviations
| BSD-5 | Brief Scale of Social Desirability |
| AVE | Average Variance Extracted |
| HTMT | Heterotrait-Monotrait Ratio |
| CR | Composite Reliability |
| VIF | Variance Inflation Factor |
| CFI | Comparative ft index |
| TLI: | Tucker-Lewis Index |
| GFI | Goodness of Fit Index |
| RMSEA | Root Mean Square Error of Approximation |
| SRMR | Standardized Root Mean Square Residual |
Appendix A
Brief Scale of Social Desirability (BSD-5) in Young Ecuadorians
| Ítems | Question | Falso | True |
| 1 | A veces me cuesta ponerme a trabajar si no me encuentro con ánimos. | ||
| 2 | Algunas veces dudo de mi habilidad para triunfar en la vida. | ||
| 3 | En algunas ocasiones siento que soy torpe. | ||
| 4 | En algunas ocasiones me he sentido bastante celoso de la buena fortuna de los demás. | ||
| Note. The items were taken from the original version [42]. For the version that presented the best factorial adjustment Brief Scale of Social Desirability (BSD-5) in young Ecuadorians, the items with the highest factor loadings were selected. | |||
References
- Vergés, A. On the Desirability of Social Desirability Measures in Substance Use Research. J. Stud. Alcohol Drugs 2022, 83, 582–586. [Google Scholar] [CrossRef] [PubMed]
- Leng, C.H.; Huang, H.Y.; Yao, G. A Social Desirability Item Response Theory Model: Retrieve-Deceive-Transfer. Psychometrika 2020, 85, 56–74. [Google Scholar] [CrossRef]
- Nazari, S.; Leite, W.L.; Huggins-Manley, A.C. A Comparison of Person-Fit Indices to Detect Social Desirability Bias. Educ. Psychol. Meas. 2023, 83, 907–928. [Google Scholar] [CrossRef]
- Vesely, S.; Klöckner, C.A. Social Desirability in Environmental Psychology Research: Three Meta-Analyses. Front. Psychol. 2020, 11, 1395. [Google Scholar] [CrossRef] [PubMed]
- Yang, J.; Ming, X.; Wang, Z.; Adams, S.M. Are Sex Effects on Ethical Decision-Making Fake or Real? A Meta-Analysis on the Contaminating Role of Social Desirability Response Bias. Psychol. Rep. 2017, 120, 25–48. [Google Scholar] [CrossRef]
- Payne, B.A. The Problem of Social Desirability Bias When Measuring Desire for Adolescent Pregnancy. BJOG 2018, 125, 1337. [Google Scholar] [CrossRef]
- King, B.M. The Influence of Social Desirability on Sexual Behavior Surveys: A Review. Arch. Sex Behav. 2022, 51, 1495–1501. [Google Scholar] [CrossRef] [PubMed]
- Perinelli, E.; Gremigni, P. Use of Social Desirability Scales in Clinical Psychology: A Systematic Review. J. Clin. Psychol. 2016, 72, 534–551. [Google Scholar] [CrossRef]
- Bou Malham, P.; Saucier, G. The Conceptual Link between Social Desirability and Cultural Normativity. Int. J. Psychol. 2016, 51, 474–480. [Google Scholar] [CrossRef]
- Nurumov, K.; Hernández-Torrano, D.; Ait Si Mhamed, A.; Ospanova, U. Measuring Social Desirability in Collectivist Countries: A Psychometric Study in a Representative Sample From Kazakhstan. Front. Psychol. 2022, 13, 822931. [Google Scholar] [CrossRef]
- Busch, H. Evidence of an Indirect Effect of Generativity on Fear of Death Through Ego-Integrity Considering Social Desirability. Omega (Westport) 2024, 88, 998–1015. [Google Scholar] [CrossRef]
- Tang, J.S.; Haslam, R.L.; Ashton, L.M.; Fenton, S.; Collins, C.E. Gender Differences in Social Desirability and Approval Biases, and Associations with Diet Quality in Young Adults. Appetite 2022, 175, 106035. [Google Scholar] [CrossRef] [PubMed]
- Adong, J.; Fatch, R.; Emenyonu, N.I.; Cheng, D.M.; Muyindike, W.R.; Ngabirano, C.; Kekibiina, A.; Woolf-King, S.E.; Samet, J.H.; Hahn, J.A. Social Desirability Bias Impacts Self-Reported Alcohol Use Among Persons With HIV in Uganda. Alcohol Clin. Exp. Res. 2019, 43, 2591–2598. [Google Scholar] [CrossRef] [PubMed]
- Chin, C.L.; Yao, G. Convergent Validity. In Encyclopedia of Quality of Life and Well-Being Research; Maggino, F., Ed.; Springer: Cham, Switzerland, 2023. [Google Scholar] [CrossRef]
- Cheung, G.W.; Cooper-Thomas, H.D.; Lau, R.S.; Wang, L.C. Reporting reliability, convergent and discriminant validity with structural equation modeling: A review and best-practice recommendations. Asia Pac. J. Manag. 2024, 41, 745–783. [Google Scholar] [CrossRef]
- Thorne-Lyman, A.L.; Lama, T.P.; Heidkamp, R.A.; Munos, M.K.; Manandhar, P.; Khatry, S.K.; Bryce, E.; LeClerq, S.C.; Katz, J. How Does Social Desirability Bias Influence Survey-Based Estimates of the Use of Antenatal Care in Rural Nepal? A Validation Study. BMJ Open 2023, 13, e071511. [Google Scholar] [CrossRef]
- Fernández, E.; Kiageri, V.; Guharajan, D.; Day, A. Social Desirability Bias Against Admitting Anger: Bias in the Test-Taker or Bias in the Test? J. Pers. Assess. 2019, 101, 644–652. [Google Scholar] [CrossRef] [PubMed]
- Ng, Z.J.; Lin, S.; Niu, L.; Cipriano, C. Measurement Invariance of the Children's Social Desirability Scale-Short Version (CSD-S) Across Gender, Grade Level, and Race/Ethnicity. Assessment 2024. [Google Scholar] [CrossRef]
- Teh, W.L.; Abdin, E.; P.V., A.; Siva Kumar, F.D.; Roystonn, K.; Wang, P.; Shafie, S.; Chang, S.; Jeyagurunathan, A.; Vaingankar, J.A.; et al. Measuring Social Desirability Bias in a Multi-Ethnic Cohort Sample: Its Relationship with Self-Reported Physical Activity, Dietary Habits, and Factor Structure. BMC Public Health 2023, 23, 415. [Google Scholar] [CrossRef]
- Lanz, L.; Thielmann, I.; Gerpott, F.H. Are Social Desirability Scales Desirable? A Meta-Analytic Test of the Validity of Social Desirability Scales in the Context of Prosocial Behavior. J. Pers. 2022, 90, 203–221. [Google Scholar] [CrossRef]
- Leng, C.-H.; He, J.; Cai, L.; Xie, K. A Social Desirability Item Response Theory Model: Retrieve-Deceive-Transfer. Psychometrika 2020, 85, 56–74. [Google Scholar] [CrossRef]
- Wu, L.; Ren, L.; Wang, Y.; Zhang, K.; Fang, P.; Liu, X.; Yang, Q.; Wang, X.; Wu, S.; Peng, J. The Item Network and Domain Network of Burnout in Chinese Nurses. BMC Nurs. 2021, 20, 147. [Google Scholar] [CrossRef] [PubMed]
- Caycho-Rodríguez, T.; Travezaño-Cabrera, A.; Ventura-León, J.; Vilca, L.W.; Baños-Chaparro, J.; Yupanqui-Lorenzo, D.E.; Valencia, P.D.; Torales, J.; Carbajal-León, C.; Lobos-Rivera, M.E.; et al. New Psychometric Evidence of the Grief Impairment Scale (GIS) in People Who Have Experienced the Death of a Loved One From a Network Psychometric Approach in Two Latin American Countries. Omega (Westport) 2024, 31. [Google Scholar] [CrossRef] [PubMed]
- Northcott, S.; Hilari, K. Stroke Social Network Scale: Development and Psychometric Evaluation of a New Patient-Reported Measure. Clin. Rehabil. 2013, 27, 823–833. [Google Scholar] [CrossRef]
- Guyon, H.; Falissard, B.; Kop, J.L. Modeling psychological attributes in psychology—An epistemological discussion: Network analysis vs. latent variables. Front. Psychol. 2017, 8, 798. [Google Scholar] [CrossRef] [PubMed]
- Choi, K.W.; Batchelder, A.W.; Ehlinger, P.P.; Safren, S.A.; O'Cleirigh, C. Applying network analysis to psychological comorbidity and health behavior: Depression, PTSD, and sexual risk in sexual minority men with trauma histories. J. Consult. Clin. Psychol. 2017, 85, 1158–1170. [Google Scholar] [CrossRef]
- McNally, R.J. Network analysis of psychopathology: controversies and challenges. Annu. Rev. Clin. Psychol. 2021, 17, 31–53. [Google Scholar] [CrossRef]
- Azadi, F.; Dayri, S.; Kordbagheri, A.; et al. Psychometric properties of the Mindfulness in Teaching Scale in a sample of Iranian teachers: Insight from a network analysis approach. Mindfulness 2024, 15, 2277–2290. [Google Scholar] [CrossRef]
- Bulut, H.C.; Bulut, O.; Clelland, A. A psychometric network analysis approach for detecting item wording effects in self-report measures across subgroups. Field Methods 2024, 1–13. [Google Scholar] [CrossRef]
- Caycho-Rodríguez, T.; Travezaño-Cabrera, A.; Torales, J.; Barrios, I.; Vilca, L.W.; Samaniego-Pinho, A.; et al. Psychometric network analysis of the Patient Health Questionnaire-4 (PHQ-4) in Paraguayan general population. Psicologia: Reflexão e Crítica 2024, 37, 15. [Google Scholar] [CrossRef]
- Thompson, A.; Pollet, T.V. An exploratory psychometric network analysis of loneliness scales in a sample of older adults. Curr. Psychol. 2024, 43, 5428–5442. [Google Scholar] [CrossRef]
- Chen, Y.; Liu, T.H.; Xia, Y.; Ma, Z. Psychometric properties of the Chinese version of 20-item Zimbardo Time Perspective Inventory (C-ZTPI-20) in Chinese adolescent population. Psychol. Res. Behav. Manag. 2024, 17, 1271–1282. [Google Scholar] [CrossRef] [PubMed]
- Arias, A.; Sireci, S. Validez y Validación para Pruebas Educativas y Psicológicas: Teoría y Recomendaciones. Rev. Iberoam. Psicol. 2021, 14, 11–22. [Google Scholar] [CrossRef]
- Muñiz, J.; Elosua, P.; Hambleton, R.K. Directrices para la traducción y adaptación de los tests: Segunda edición. Psicothema 2013, 25, 151–157. [Google Scholar] [CrossRef]
- Cruchinho, P.; López-Franco, M.D.; Capelas, M.L.; Almeida, S.; Bennett, P.M.; Miranda da Silva, M.; Gaspar, F. Translation, Cross-Cultural Adaptation, and Validation of Measurement Instruments: A Practical Guideline for Novice Researchers. J. Multidiscip. Healthc. 2024, 17, 2701–2728. [Google Scholar] [CrossRef]
- Moore, G.; Campbell, M.; Copeland, L.; Craig, P.; Movsisyan, A.; Hoddinott, P.; Evans, R. Adapting Interventions to New Contexts—The ADAPT Guidance. BMJ 2021, 374, n1679. [Google Scholar] [CrossRef]
- Brauer, K.; Ranger, J.; Ziegler, M. Confirmatory Factor Analyses in Psychological Test Adaptation and Development: A Nontechnical Discussion of the WLSMV Estimator. Psychol. Test Adapt. Dev. 2023, 4, 4–12. [Google Scholar] [CrossRef]
- Elosua, P.; Mujika, J.; Almeida, L.S.; Hermosilla, D. Judgmental-Analytical Procedures for Adapting Tests: Adaptation to Spanish of the Reasoning Tests Battery. Rev. Latinoam. Psicol. 2014, 46, 117–126. [Google Scholar] [CrossRef]
- Teodoro Dantas Sartori, J. Determining the Confidence Interval for Non-Probabilistic Surveys: Method Proposal and Validation. Commun. Stat.-Theory Methods 2024, 1–9. [Google Scholar] [CrossRef]
- Ferrando, P.J.; Chico, E. Adaptación y análisis psicométrico de la escala de deseabilidad social de Marlowe y Crowne. Psicothema 2000, 12, 383–389. [Google Scholar]
- Rodríguez-Franco, L.; Juarros-Basterretxea, J.; Paíno Quesada, S.; Herrero, J.; Rodríguez-Díaz, F.J. Dating Violence Questionnaire for Victimization and Perpetration (DVQ-VP): An interdependence analysis of self-reports. Int. J. Clin. Health Psychol. 2022, 22, 100276. [Google Scholar] [CrossRef]
- Meinck, F.; Cosma, A.P.; Mikton, C.; Baban, A. Psychometric Properties of the Adverse Childhood Experiences Abuse Short Form (ACE-ASF) Among Romanian High School Students. Child Abuse & Neglect 2017, 72, 326–337. [Google Scholar] [CrossRef]
- R Core Team. R: A language and environment for statistical computing. (Version 4.1) [Computer software]. 2022; Retrieved from (R packages retrieved from CRAN snapshot 2023-04-07). [Google Scholar]
- Shapiro, S.S.; Wilk, M.B. An analysis of variance test for normality (complete samples). Biometrika 1965, 52, 591–611. [Google Scholar] [CrossRef]
- Monter-Pozos, A.; González-Estrada, E. On Testing the Skew Normal Distribution by Using Shapiro–Wilk Test. J. Comput. Appl. Math. 2024, 440, 115649. [Google Scholar] [CrossRef]
- Demir, S. Comparison of Normality Tests in Terms of Sample Sizes under Different Skewness and Kurtosis Coefficients. Int. J. Assess. Tools Educ. 2022, 9, 397–409. [Google Scholar] [CrossRef]
- Malkewitz, C.P.; Schwall, P.; Meesters, C.; Hardt, J. Estimating reliability: A comparison of Cronbach's α, McDonald's ωt and the greatest lower bound. Soc. Sci. Human. Open 2023, 7, 100368. [Google Scholar] [CrossRef]
- Pfadt, J.M.; Sijtsma, K. Statistical Properties of Lower Bounds and Factor Analysis Methods for Reliability Estimation. In Quantitative Psychology. IMPS 2021, Springer Proceedings in Mathematics & Statistics; Wiberg, M., Molenaar, D., González, J., Kim, J.S., Hwang, H., Eds.; Springer: Cham, 2022; Volume 393, pp. 57–71. [Google Scholar] [CrossRef]
- Rosseel, Y.; Loh, W.W. A structural after measurement approach to structural equation modeling. Psychol. Methods 2024, 29, 561–588. [Google Scholar] [CrossRef]
- DiStefano, C.; Shi, D.; Morgan, G.B. Collapsing categories is often more advantageous than modeling sparse data: Investigations in the CFA framework. Struct. Equ. Modeling 2021, 28, 237–249. [Google Scholar] [CrossRef]
- Shi, D.; DiStefano, C.; Zheng, X.; Liu, R.; Jiang, Z. Fitting latent growth models with small sample sizes and non-normal missing data. Int. J. Behav. Dev. 2021, 45, 179–192. [Google Scholar] [CrossRef]
- Du, H.; Bentler, P.M. Distributionally weighted least squares in structural equation modeling. Psychol. Methods 2022, 27, 519–540. [Google Scholar] [CrossRef]
- Cho, G.; Hwang, H.; Sarstedt, M.; Ringle, C.M. Cutoff criteria for overall model fit indexes in generalized structured component analysis. J. Mark. Anal. 2020, 8, 189–202. [Google Scholar] [CrossRef]
- Hu, L.; Bentler, P.M. Cutoff criteria for fit indexes in covariance structure analysis: Conventional criteria versus new alternatives. Struct. Equ. Model. 1999, 6, 1–55. [Google Scholar] [CrossRef]
- Shi, D.; Maydeu-Olivares, A. The Effect of Estimation Methods on SEM Fit Indices. Educ. Psychol. Meas. 2020, 80, 421–445. [Google Scholar] [CrossRef] [PubMed]
- Revelle, W. Psych: Procedures for psychological, psychometric, and personality research [R package]. 2019. [Google Scholar]
- Cheung, G.W.; Wang, C. Current Approaches for Assessing Convergent and Discriminant Validity with SEM: Issues and Solutions. Acad. Manag. Proc. 2017, 2017, 12706. [Google Scholar] [CrossRef]
- Kalnins, A.; Praitis Hill, K. The VIF Score. What Is It Good For? Absolutely Nothing. Organizational Research Methods 2025, 28, 58–75. [Google Scholar] [CrossRef]
- De Winter, J.C.; Gosling, S.D.; Potter, J. Comparing the Pearson and Spearman correlation coefficients across distributions and sample sizes: A tutorial using simulations and empirical data. Psychol. Methods 2016, 21, 273. [Google Scholar] [CrossRef]
- Christodoulou, A.; Michaelides, M.; Karekla, M. Network analysis: A new psychometric approach to examine the underlying ACT model components. J. Contextual Behav. Sci. 2019, 12, 285–289. [Google Scholar] [CrossRef]
- Borsboom, D.; Deserno, M.K.; Rhemtulla, M.; et al. Network analysis of multivariate data in psychological science. Nat. Rev. Methods Primers 2021, 1, 58. [Google Scholar] [CrossRef]
- Epskamp, S.; Maris, G.; Waldorp, L.J.; Borsboom, D. Network psychometrics. In The Wiley Handbook of Psychometric Testing: A Multidisciplinary Reference on Survey, Scale and Test Development; 2018; pp. 953–986. [Google Scholar] [CrossRef]
- Hevey, D. Network analysis: A brief overview and tutorial. Health Psychol. Behav. Med. 2018, 6, 301–328. [Google Scholar] [CrossRef]
- Bernardi, R.A.; Guptill, S.T. Social Desirability Response Bias, Gender, and Factors Influencing Organizational Commitment: An International Study. J. Bus. Ethics 2008, 81, 797–809. [Google Scholar] [CrossRef]
- Piedmont, R.L. Social Desirability Bias. In Encyclopedia of Quality of Life and Well-Being Research; Maggino, F., Ed.; Springer: Cham, 2023. [Google Scholar] [CrossRef]
- Latkin, C.A.; Edwards, C.; Davey-Rothwell, M.A.; Tobin, K.E. The Relationship between Social Desirability Bias and Self-Reports of Health, Substance Use, and Social Network Factors among Urban Substance Users in Baltimore, Maryland. Addict. Behav. 2017, 73, 133–136. [Google Scholar] [CrossRef]
- Burgos-Benavides, L.; Cano-Lozano, M.C.; Ramírez, A.; Rodríguez-Díaz, F.J. Instruments of Child-to-Parent Violence: Systematic Review and Meta-Analysis. Healthcare 2023, 11, 3192. [Google Scholar] [CrossRef] [PubMed]
- Burgos-Benavides, L.; Cano-Lozano, M.C.; Ramírez, A.; Contreras, L.; Rodríguez-Díaz, F.J. To What Extent is Child-to-Parent Violence Known in Latin America? A Systematic Review and Meta-analysis. Rev. Iberoam. Psicol. Salud 2024, 15, 80–95. [Google Scholar] [CrossRef]
- Burgos-Benavides, L.; Cano-Lozano, M.C.; Ramírez, A.; León, S.P.; Medina-Maldonado, V.; Rodríguez-Díaz, F.J. Assessment of Adolescents in Child-to-Parent Violence: Invariance, Prevalence, and Reasons. Children 2024, 11, 845. [Google Scholar] [CrossRef] [PubMed]
- Millsap, R.E.; Olivera-Aguilar, M. Investigating measurement invariance using confirmatory factor analysis. In Handbook of Structural Equation Modeling; Hoyle, R.H., Ed.; The Guilford Press: New York, NY, USA, 2012; pp. 380–392. [Google Scholar]
- Ramírez, A.; Medina-Maldonado, V.; Burgos-Benavides, L.; Alfaro-Urquiola, A.L.; Sinchi, H.; Herrero Díez, J.; Rodríguez-Diaz, F.J. Validation of the Psychometric Properties of the Conflict Resolution Styles Inventory in the University Population. Soc. Sci. 2024, 13, 615. [Google Scholar] [CrossRef]

| Mean | Std. Deviation | Std. Est. (all) | CR | ωo | αo | G6 | VIF | AVE | |
|---|---|---|---|---|---|---|---|---|---|
| D1 | 0.252 | 0.435 | 0.685 | .759 | 0.750 | .809 | .711 | 2.01 | .500 |
| D2 | 0.371 | 0.483 | 0.832 | ||||||
| D3 | 0.273 | 0.446 | 0.576 | ||||||
| D4 | 0.550 | 0.498 | 0.545 |
| Model | X2 | df | p | CFI | TLI | RMSEA | SRMR |
|---|---|---|---|---|---|---|---|
| SEX (Man and Woman) | |||||||
| MI ↔ CO | 4.804 | 2 | .091 | .993 | .959 | .058 (.000 - .127) | .037 |
| MI ↔ ME | 7.966 | 7 | .336 | .998 | .996 | .018 (.000 - .065) | .042 |
| MI ↔ SC | 10.845 | 6 | .093 | .988 | .977 | .044 (.000 - .085) | .043 |
| AGE GROUP (14 -21 years and 22 - 26 years) | |||||||
| MI ↔ CO | 5.339 | 2 | .069 | .992 | .954 | .063 (.000 - .131) | .041 |
| MI ↔ ME | 9.523 | 7 | .217 | .994 | .990 | .029 (.000 - .071) | .046 |
| MI ↔ SC | 8.463 | 6 | .206 | .994 | .989 | .031 (.000 - .076) | .041 |
| COERCIÓN - VICTIMIZATION (Sporadic, Repeated and Nonviolent) | |||||||
| MI ↔ CO | 5.676 | 2 | .059 | .992 | .931 | .079 (.000 - .158) | .038 |
| MI ↔ ME | 19.560 | 12 | .076 | .984 | .976 | .046 (.000 - .082) | .059 |
| MI ↔ SC | 16.830 | 10 | .078 | .986 | .974 | .048 (.000 - .087) | .045 |
| DETACHMENT -VICTIMIZATION (Sporadic, Repeated and Nonviolent) | |||||||
| MI ↔ CO | 4.299 | 2 | .117 | .995 | .957 | .062 (.000 - .145) | .041 |
| MI ↔ SC | 11.374 | 10 | .329 | .997 | .995 | .002 (.000 - .069) | .044 |
| COERCIÓN - PERPETRATION (Sporadic, Repeated and Nonviolent) | |||||||
| MI ↔ CO | 5.569 | 2 | .062 | .993 | .935 | .078 (.000 - .157) | .043 |
| MI ↔ ME | 24.371 | 12 | .018 | .975 | .962 | .059 (.024 - .093) | .054 |
| MI ↔ SC | 13.185 | 10 | .214 | .994 | .988 | .033 (.000 - .075) | .045 |
| VICTIMIZATION (Some type of victimization and non-violence) | |||||||
| MI ↔ ME | 8.422 | 7 | .297 | .996 | .994 | .021 (.000 - .065) | .047 |
| MI ↔ SC | 17.667 | 6 | .007 | .971 | .942 | .066 (.032 - .103) | .054 |
| HUMILIATION - PERPETRATION (Sporadic, Repeated and Nonviolent) | |||||||
| MI ↔ CO | 4.438 | 2 | .109 | .995 | .955 | .064 (.000 - .146) | .038 |
| MI ↔ ME | 19.514 | 12 | .077 | .985 | .977 | .046 (.000 - .082) | .038 |
| DETACHMENT - PERPETRATION (Sporadic, Repeated and Nonviolent) | |||||||
| MI ↔ ME | 13.499 | 12 | .334 | .997 | .995 | .021 (.000 - .064) | .049 |
| MI ↔ SC | 11.715 | 10 | .305 | .996 | .993 | .024 (.000 - .070) | .043 |
| PHYSICAL - PERPETRATION (Sporadic, Repeated and Nonviolent) | |||||||
| MI ↔ CO | 4.513 | 2 | .105 | .995 | .952 | .065 (.000 - .147) | .041 |
| MI ↔ SC | 10.093 | 10 | .432 | .999 | .999 | .006 (.000 - .063) | .042 |
| PERPETRATION (Some type of victimization and non-violence) | |||||||
| MI ↔ ME | 7.999 | 7 | .333 | .997 | .995 | .018 (.000 - .063) | .050 |
| MI ↔ SC | 13.293 | 6 | .039 | .979 | .958 | .052 (.011 - .090) | .059 |
Disclaimer/Publisher’s Note: The statements, opinions and data contained in all publications are solely those of the individual author(s) and contributor(s) and not of MDPI and/or the editor(s). MDPI and/or the editor(s) disclaim responsibility for any injury to people or property resulting from any ideas, methods, instructions or products referred to in the content. |
© 2025 by the authors. Licensee MDPI, Basel, Switzerland. This article is an open access article distributed under the terms and conditions of the Creative Commons Attribution (CC BY) license (http://creativecommons.org/licenses/by/4.0/).


