Submitted:
12 June 2025
Posted:
13 June 2025
You are already at the latest version
Abstract
Hemi-boreal forests are subjected to increasing pressures from hotter and longer droughts followed by heatwaves over vegetation periods and warmer winters related to climate warming. Via physiological adjustments, they show different degrees of adaptation, resistance, and tolerance to their extremes, which can push forests beyond their resilience thresholds, especially at highly arid growing sites like Lithuania’s Curonian Spit which characterized by wind-made sandy dune. This study addresses the threshold of the adaptive capacity of Scots pine (Pinus sylvestris L.) as the main species in hemi-boreal forest, to these meteorological extremes, what is critical for pine forest management at different growing conditions. Using stem sap flow and dendrometer measurements (2018–2024) at hourly scale, we assessed sap flow density, stem volume increment, and water use efficiency (WUE) over different period to detect key period most significant affecting their annual values. Multiple linear regression revealed that, during the vegetation period, elevated temperatures reduced WUE, whereas higher mean temperatures during the dormant period, combined with increased precipitation in the growing season, significantly enhanced stem volume increment and WUE in general, explaining up to 75% of their variation. When winter meteorological effects were excluded, the explained variation in stem volume increment and WUE decreased by nearly twofold, highlighting the critical role of dormant-season conditions in Scots pine resilience. The hypothesis about the heightened susceptibility of Scots pine to summer drought conditions after warm winters was rejected. These findings provide tools for risk assessment and environmental compliance control to evaluate Scots pine capacity to adapt to and mitigate new threats of climate change.
Keywords:
Scots pine
; sap flow density
; stem volume increment
; water use efficiency
; adaptive capacity
1. Introduction
Forests are increasingly exposed to intensified climatic pressures, particularly prolonged and severe droughts driven by global warming [1]. These conditions have been linked to reduced forest productivity and increased tree mortality [2,3,4,5]. Forest ecosystems show varying degrees of resistance, tolerance, and adaptation to these stresses, which can result from structural, physiological, or combined adjustments. However, the increasing frequency and intensity of extreme events—such as droughts, heatwaves, and unseasonal temperature fluctuations—may push forest ecosystems beyond their resilience thresholds. In temperate regions, repeated drought events have been shown to reduce gross primary productivity and compromise tree vitality [6,7].
In response to aridification, forest productivity and tree growth may also become more dependent on soil moisture [8] and water evaporative demand [9]. Additionally, severe drought can reduce growth resilience and increase tree mortality risk [10,11]. In this context, water use efficiency (WUE)—the ratio of carbon gained through photosynthesis to water lost via transpiration—has become a key parameter for evaluating forest responses to climate change. The WUE of Scots pine (Pinus sylvestris L.), in particular, is influenced by climatic variables such as temperature, precipitation, and vapor pressure deficit (VPD), all of which interact to shape tree physiological processes.
The relationship between winter temperatures and Scots pine growth has also attracted increasing scientific interest. Harvey et al. [12] demonstrated that rising winter temperatures can stimulate growth in northern temperate forests by enabling the earlier resumption of physiological activity. However, these potential benefits are often offset by increased susceptibility to summer droughts. Therefore, the interplay between winter warming and drought vulnerability is critical to understanding the health and productivity of Scots pine forests, in which rising winter temperatures may heighten the susceptibility of Scots pine to summer drought conditions [13]. Such conditions are exemplified by Lithuania’s Curonian Spit pine forest.
The Curonian Spit National Park, situated between the Baltic Sea to the west and the Curonian Lagoon to the east. Pine forest growing there at wind-made sandy dunes is characterized by nutrient-poor sandy soils, an extended vegetation period, and unusual warm winters due effect by surrounding waters. These conditions offer a unique opportunity to investigate the adaptive strategies of Scots pine under shifting climatic regimes. In this study, we aimed to assess transpiration dynamics, stem growth patterns, and WUE in Scots pine trees in this region from 2018 to 2024, with particular focus on their response to warmer winters and subsequent summer droughts.
Given current knowledge gaps—especially regarding the effects of milder winters—we hypothesized that rising winter temperatures enhance stem growth and WUE in Scots pine, thereby reducing vulnerability to heat and drought stress during the growing season.
To test this hypothesis, we address the following objectives in this study:
- Identify the key meteorological factors influencing sap flow density in Scots pine under arid conditions.
- Examine the effects of extreme meteorological events on seasonal stem growth.
- Explore the interrelationships among transpiration, stem increment, and WUE.
- Assess the physiological responses of Scots pine to heat and drought following mild winters.
- Evaluate the adaptive capacity of Scots pine to climate-induced extremes in nutrient-poor soils in the hemi-boreal zone.
The insights gained from this research enhance our understanding of Scots pine ecophysiological responses to extreme weather and its resistance thresholds, thereby informing forest management and supporting climate change adaptation strategies in hemi-boreal ecosystems.
2. Material and Methods
2.1. Location and Study Characteristics
This study was conducted on Scots pine (Pinus sylvestris L.) trees growing in the coastal forests of the Lithuanian Curonian Spit National Park, within the Nida Forest Enterprise area [14]. Four subplots, each containing at least three 60-year-old Scots pine (Pinus sylvestris L.) trees, were selected for monitoring to meet the objectives of the study. This site is characterized by extremely nutrient-poor, wind-formed sandy soils, among the poorest in the region for tree growth (Figure 1). The ecophysiological responses of the trees were investigated over the period from 2018 to 2024.
2.2. Forest Type
Forest type: oligotrophic mineral soil site. The soil is classified as haplic arenosol, with the groundwater table located deeper than 2 meters. Scots pine dominates the upper canopy layer. The herbaceous layer includes Vaccinium vitis-idaea and Pleurozium schreberi.
2.3. Meteorological Conditions
Meteorological data were obtained from the Nida Meteorological Station, operated by the Lithuanian Hydrometeorological Service [15]. The following parameters were recorded at one-hour intervals: wind speed and direction, atmospheric pressure, precipitation, relative humidity, air temperature (mean, maximum, minimum), and solar radiation.
To estimate the drying power of the air, the vapor pressure deficit (VPD) was calculated based on relative humidity (RH) and temperature (Tm), using the following equation:
where RH is relative humidity, and SVP is the saturated vapor pressure.
VPD = ((100 - RH)/100) × SVP
SVP (es) was calculated using the Magnus formula as follows [16]:
es (t)=6.11*107.45×Tm /(237.3+Tm) (hPa) when t > 0°C
es (t)=6.11*109.5×Tm /(265.5+Tm) (hPa) when t < 0°C
2.4. Heat-Pulse Method
Xylem sap flow was measured using the heat ratio method (HRM) described by Burgess et al. [17], employing a sap flow meter from ICT International [18]. Sensors were installed at approximately 120 cm above ground level and were covered with aluminum foil to minimize external temperature effects. Bark thickness was measured on each sample tree using a bark depth gauge, and sensor needles were inserted into the sapwood at two different depths, with the bark either removed or adjusted using a spacer for a standard depth of 10 mm. The HRM technique involves inserting probes into the tree’s xylem: one generates a heat pulse, while adjacent probes measure the temperature response (Figure 2). The time required for heat to travel between probes is used to calculate sap flow velocity. This method can measure both high and low sap flow rates, making it highly adaptable for various research applications [19].
This method is relatively non-invasive, allowing for repeated measurements without causing significant damage to the tree. It provides real-time data on sap flow, enabling researchers to monitor changes in water transport in response to environmental conditions.
The SFM1 sap flow sensors stored data as raw temperature values. These were converted into the sap density rate, and total plant water use was determined using the ICT International Sap Flow Tool software (for HFD and HRM data) [18], calibrated for Scots pine sapwood properties.
2.5. Tree Seasonal Growth
Stem seasonal growth at a height of 1.3 meters was measured using both manual and high-resolution dendrometers (DRL26, EMS Brno), with accuracies of ±0.1 mm and ±0.001 mm. The annual increment in the tree stem perimeter was calculated using the following formula:
ZP = P2 - P1,
P₁ = stem circumference at a 1.3 m height at the beginning of the vegetation period.
P₂ = stem circumference at the end of the vegetation period (mm).
The annual volume increment in the monitored pine trees was detected based on data on the diameter increase, tree height, and stem form index. The breast-height diameter of the monitored pine trees varied between 19 and 29 cm at breast height, tree height between 15 and 16 m, and volume between 0.2 and 0.4 m3.
2.6. Statistical Analysis
The significance of differences between the mean values of sap flow, stem increment, and water use efficiency across different periods was evaluated using analysis of variance (ANOVA) and correlation analysis, performed in using STATISTICA 10 software. The level of significance for the F-test was set at p < 0.05. Relationships between physiological parameters and meteorological variables were assessed using Pearson’s linear correlation. Multiple linear regression models were developed to identify the key meteorological predictors of stem increment, sap flow, and WUE, while ensuring minimal multicollinearity. A significance threshold of p < 0.05 was adopted for all statistical tests.
3. Results
3.1. Meteorological Conditions
The analysis of meteorological data from the past 15 years enabled the identification of the most contrasting and extreme weather events, with particular attention focused on the study period from 2018 to 2024 (Figure 3). This approach allowed for the evaluation of short-term trends in the study period in relation to longer-term patterns.
No significant regular changes in precipitation were observed during the 15-year period, when the amount of precipitation showed a tendency to decrease by -12 mm per year. During the period of investigation, there was a tendency for it to increase by +16 mm per year (p>0.05).
A substantial increase in air temperature was detected over both the 7-year study and the longer 15-year period, indicating a pronounced significant warming trend. The calculated warming rate exceeded 17°C per 100 years for this region.
Between 2010 and 2024, average monthly temperatures in June and October increased at a rate of over 20°C per 100 years, while January and February saw an even steeper rise—exceeding 40°C per 100 years (Figure 4). If this trend continues, forest ecosystems in the region may face catastrophic consequences. Notably, the mean temperatures in January and February rose from approximately −5°C in 2010 to +1°C in 2023–2024—an increase of 6°C in just 15 years, far exceeding existing climate projections.
In parallel, this rapid temperature increase was accompanied by declining precipitation, particularly in May, June, September, and December. Reductions of 3–5 mm per year were observed, with near-significant trends (p ≈ 0.05). These decreases in rainfall may amplify the negative effects of heatwaves during the growing season, intensifying water stress and further challenging forest stability (Figure 3).
The highest annual precipitation was recorded in 2017, one year before the start of this study (Table 1). During the investigation period (2018–2024), annual precipitation ranged from 600 to 700 mm, which was close to the long-term average. In terms of mean annual temperature, 2020 and 2024 were the warmest years, both with values exceeding 10°C. The most intense heatwave occurred in 2021, which paradoxically also ranked among the coldest years in this study, with a mean annual temperature below 9°C and a recorded minimum of −21.4°C (Figure 5).
The mean monthly meteorological values indicated that June to August were the warmest months at the study site, with average temperatures ranging from 18°C to 19°C and the highest mean temperatures occurring in July. Based on these values, the vegetation period in this region extends from April to October (Figure 6).
Precipitation data showed that the driest period occurred from March to June, with especially minimal rainfall in March and April, when some periods had no precipitation. In contrast, the period from July to October was the most humid, with peak precipitation in July and August. During these months, monthly totals often exceeded 150 mm (Figure 6).
The period from June to August had the lowest wind speeds, while November to January exhibited the highest wind activity. Periods with the highest precipitation generally coincided with the lowest atmospheric pressure, particularly from December to January. The lowest relative humidity values were recorded in April, while the lowest monthly mean humidity occurred in May.
Variations in cloud cover directly influenced solar radiation levels, which closely reflected temperature trends—peaking in June when cloud cover was at its minimum (Figure 6).
The observed meteorological patterns revealed that the months from June to August were characterized by the highest vapor pressure deficit (VPD). On average, the VPD values during this period reached up to 6 hPa, with maximum values approaching 8 hPa—particularly in June (Figure 5 and 6).
The meteorological data identified the following extreme periods relevant to pine tree growth:
Air temperature: Cold occurred in January in 2018, 2021, and 2024. Heatwaves were recorded in June in 2019, 2021, 2022, and 2024. The warmest winter period occurred from December to February in 2020.
Relative humidity: Notably low RH values due to drought occurred in May and June in 2018, 2019, and 2023.
Precipitation: Significant deficits were observed in May and June in 2021 and 2024, as well as in July and August in 2020 and 2022.
Vapor pressure deficit (VPD): The highest VPD was recorded in June 2021, exceeding 8 hPa.
These meteorological extremes, recorded during specific months and years, were carefully considered in the analysis of the ecophysiological responses of Scots pine trees.
3.2. Pine Transpiration
The highest transpiration rate of pine trees growing under extremely dry and nutrient-poor soil conditions was recorded in 2024, significantly exceeding values from previous years (Figure 7). In that year, the maximum daily transpiration rate approached 35,000 mm³ per day, with a total annual volume of approximately 3,840 liters. In contrast, the years 2019 and—especially—2022 were marked by exceptionally low transpiration levels, with daily rates reaching only 25,000 mm³ and 20,000 mm³ and annual totals of 2,290 and 2,100 liters, respectively.
Seasonal variation in pine transpiration showed that the highest rates occurred between April and September, with peak monthly values recorded from May to August (Figure 8). During this period, transpiration rates averaged around 450 liters per month. The data indicate that ecophysiological activity at the study site typically begins in early March and continues until mid-November.
The results show that the highest transpiration rates were recorded in 2018, 2020–2021, and, especially, 2024. During these years, annual transpiration volumes exceeded or approached 3,000 liters per season (Figure 9).
The maximum transpiration rate recorded in 2024 extended from January to December. High values were particularly observed between April and September and again from May to October. Throughout the entire study period, no negative mean monthly transpiration rates were recorded for the observed pine trees.
Analysis of transpiration data across various periods revealed that the monthly values from April to November were significantly correlated with overall transpiration, including annual totals. Among these, transpiration in August showed the strongest relationship with both annual and vegetation-period values, explaining more than 80% of their variation (Table 2). As a result, in this study, we focused on transpiration during the annual period, the vegetation period, and specifically August, the month in which one of the highest stem volume increments was notably observed. These findings thus highlight August as a key period for forecasting water use efficiency (WUE) and evaluating the adaptive capacity of Scots pine under climate change scenarios.
3.3. Pine Stem Increment
Using electronic DRL dendrometers, seasonal changes in pine stem circumference were recorded at an hourly resolution with 1 µm accuracy. These high-resolution measurements captured not only stem increment but also short-term fluctuations in stem size due to shrinkage and swelling driven by changes in stem water balance [22].
The highest stem growth was observed in 2020 and especially in 2022, while the lowest occurred during 2018 and 2019 (Figure 10). Data on the diurnal rate of stem volume increment revealed that both the maximum and minimum (negative) values were most frequently recorded during the dormant period, reflecting stem swelling and shrinking processes. During the vegetation period, the daily increment rate typically fluctuated around 500 mm³ per day. In exceptional cases, values approached 1,000 mm³ per day.
Monthly data on pine stem volume increment indicated that the growth season during the study period extended from mid-May to the end of September (Figure 11). The monthly rate of 500 cm³ observed in October may be attributed to stem swelling associated with increased precipitation, which frequently occurs during this month. From November to April, only stem swelling and shrinking were recorded, reflecting solely water balance fluctuations.
The largest increase in stem volume was observed in May, resulting from a combination of swelling due to elevated humidity and active growth at the onset of the vegetation period. A slightly lower volume increment was recorded in June, notwithstanding the effects of drought and heatwaves, which typically occur during this month.
Generalizing the data, the maximum annual stem volume increment occurred during the period from May to October (V–X), reaching approximately 7.8 dm³ (Figure 12). Slightly lower values were observed for the full calendar year (January to December) and the main growing season (April to September), with volume increases of about 7.6 dm³ and 7.3 dm³, respectively. These reductions are attributed to stem shrinkage and swelling effects outside the core growth period.
Analysis of monthly contributions to annual stem increment revealed that volume growth in June was the most representative of overall stem increase across various time frames, including the annual total. The strongest correlation was observed for the combined period of May–June (r = 0.877), with slightly lower but still strong correlations for the January–December and May–October periods (r ≈ 0.800) (Table 3). This means that changes in the increment during June alone explained more than 65% of the variation in annual pine stem growth, despite the maximum increase being recorded in May. As a result, identifying the key factors influencing June stem growth received particular attention in this study.
3.4. Water Use Efficiency
Water use efficiency (WUE) serves as a key linkage between the carbon and water cycles and is a vital indicator of how efficiently plants convert water into biomass under specific environmental conditions [23,24,25]. As trees absorb CO₂ through stomata, they also lose water through transpiration—making WUE an essential metric for evaluating growth potential under climate stress [26]. Therefore, WUE has become a key indicator of trees’ adaptive capacity to cope with recent environmental changes.
Variations in WUE across different periods revealed that the lowest values were observed when analyzing annual data (January to December), averaging around 3 cm³ per liter of water (Figure 13). Slightly higher WUE was recorded during the entire vegetation period (May to September), reaching approximately 3.6 cm³/L. The highest WUE was observed in the middle of the vegetation season, specifically in May–June, when it peaked at around 5 cm³/L.
Variation in monthly WUE values confirmed that stem volume increment in Scots pine primarily occurred between May and September (Figure 14). The highest WUE was recorded in June, averaging approximately 6 cm³ per liter of water. The growing season concluded in October as stem swelling began in response to increased precipitation, continuing into November. This was followed by a period of stem shrinkage that lasted until the onset of the next growing season in May. These patterns clearly illustrate the duration and timing of the growing season for pine trees in the coastal region of Lithuania.
3.5. Interaction Among Considered Parameters
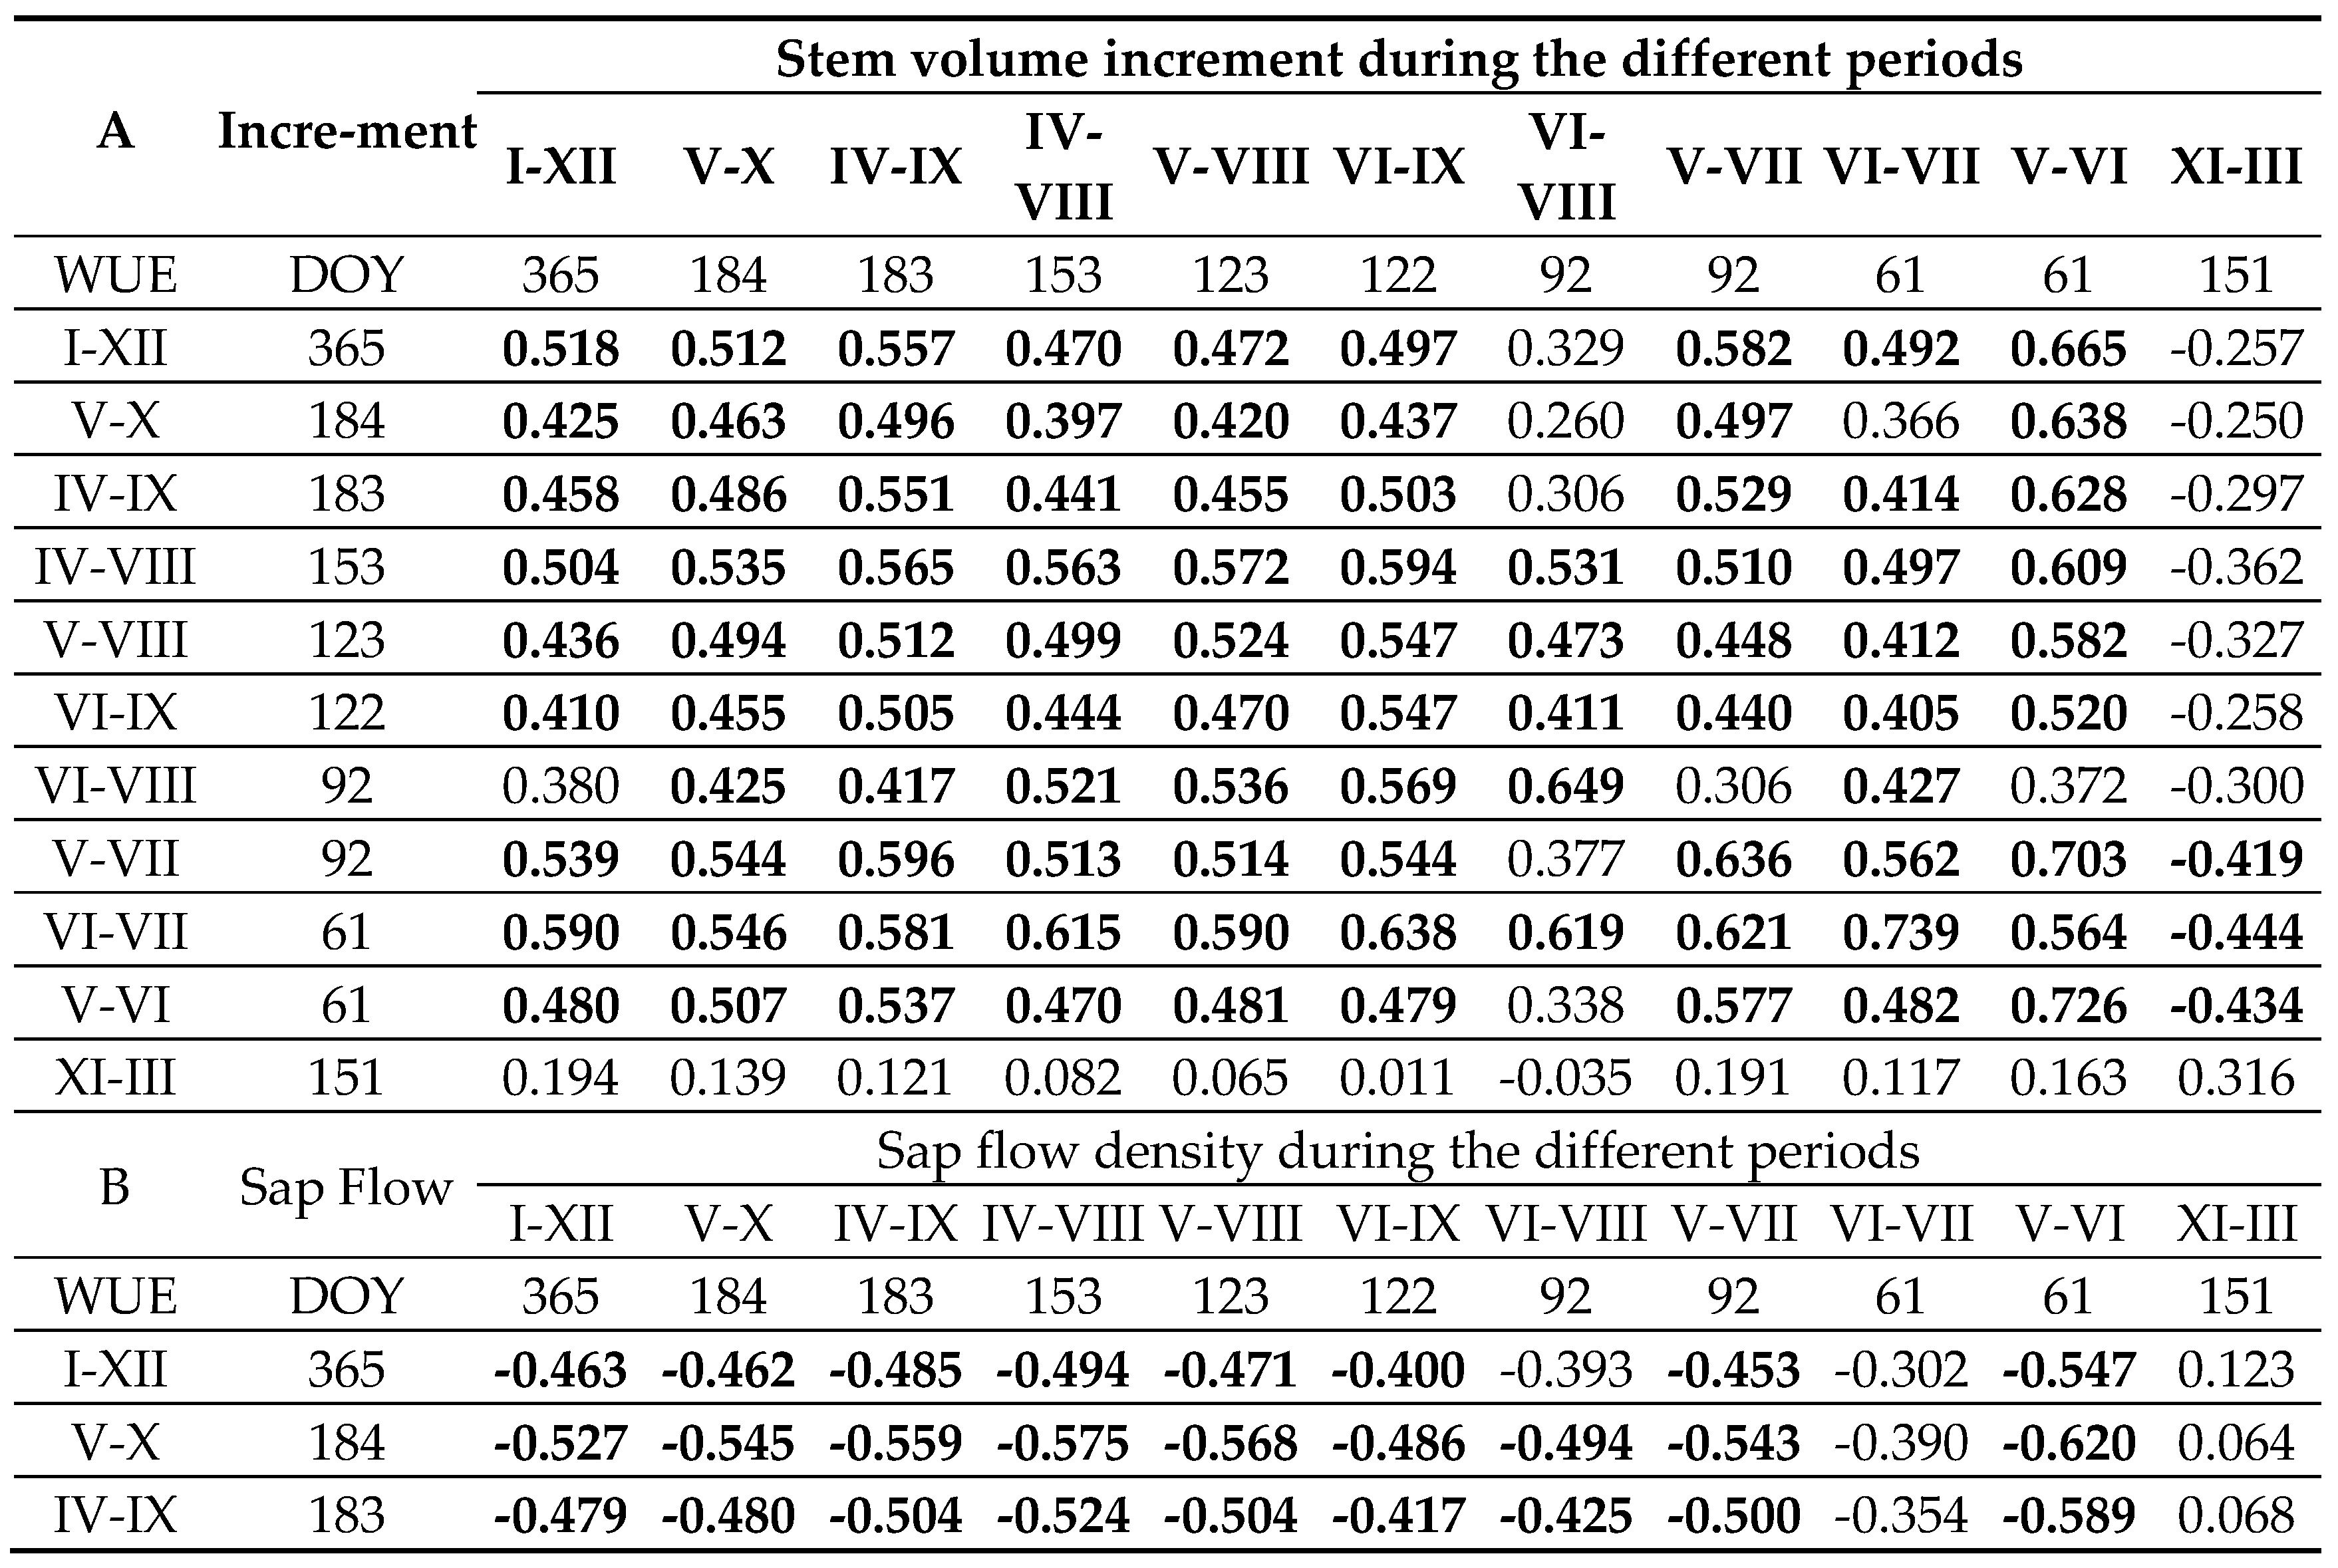
Interrelationships among the measured parameters in pine trees revealed that sap flow density had a direct effect on increasing in stem volume across all investigated periods (Table 4). Notably, the former during the dormant season was positively correlated with the latter during both the dormant and vegetation periods. These data indicate that ecophysiological activity during dormancy contributes positively to annual stem volume growth, particularly during the peak period in May–June. The correlation coefficient between sap flow density and stem increment exceeded 0.7.
Furthermore, higher sap flow density during the dormant season appeared to reduce stem shrinkage, potentially resulting in greater volume increment during the subsequent growing season. These findings provide strong evidence that warm winters, which support higher sap flow activity, can positively influence tree growth in the following vegetation period.
An increase in stem volume increment was positively associated with WUE (Table 5a). Stem growth during the most intensive period explained up to 50% of the variation in WUE. However, during the full annual or vegetation periods, this explanatory power declined to just over 20%. Only stem swelling during the dormant season reduced WUE during the main growth phase (May to August), suggesting that warmer dormant periods with higher stem swelling rates may decrease WUE due to increased water storage in the xylem.
Sap flow density, by contrast, had a negative effect on WUE, reducing its values across different periods (Table 5b). Compared to stem increment, sap flow density explained slightly less variation in WUE; during the period of peak transpiration (May to July), it accounted for only about 25% of the variation in WUE. This explanatory rate remained relatively stable when extended to the full annual or vegetation periods.
During the dormant season, when sap flow was still detected in warmer winters, its density had no statistically significant effect on WUE variation. However, there was a tendency for higher dormant-season transpiration to slightly increase WUE during periods of peak ecophysiological activity.
3.6. Effect of Meteorology on Variation in Considered Parameters
Our earlier studies revealed that meteorological variables—including mean, maximum, and minimum air temperatures, solar radiation, relative humidity (particularly minimum values), precipitation, and integrated vapor pressure deficit (VPD)—most accurately reflect changes in transpiration rate and stem increment in Scots pine trees [16,20,21,22,27].
To assess the influence of these meteorological parameters on pine growth, transpiration, and WUE, three key periods were analyzed:
- The full vegetation period (May to September).
- The peak ecophysiological activity period (May–June).
- The dormant period (November to March).
The data showed that air temperature (mean and max. values) and solar radiation significantly reduced stem volume increment (p < 0.05), while relative humidity and precipitation tended to increase it, though their effects were not statistically significant (p > 0.05) (Figure 15). Only rises in minimum relative humidity values had a significant positive effect on annual stem volume growth.
These relationships remained largely unchanged during the intensive growth period (May–June), except for maximum air temperature, which had the strongest inhibitory effect on annual increment during this period.
Interestingly, during the dormant season, the relationships reversed. Meteorological factors which over the vegetation period inhibited pine volume annual increment, during dormant period stimulated it and vice versa, which stimulated - inhibited. The only exception was precipitation during the dormant season, which had no significant effect. All other meteorological variables during dormancy were significantly related to growth, explaining up to 25% of the variation in annual stem increment.
The influence of the selected meteorological parameters on sap flow density variation was slightly less significant than their effect on stem volume increment (Figure 15). Among the variables considered, only air temperature (mean, maximum, and minimum) and solar radiation were found to stimulate water losses due to transpiration intensity, with only minimum and maximum temperatures reaching statistical significance. During the peak growing period, this pattern remained consistent with that observed for stem increment. However, during the dormant season, these relationships reversed: solar radiation had an inhibitory effect on transpiration, while relative humidity had a significant stimulatory effect, explaining up to 20% of the variation in annual sap flow density.
The effect of meteorological parameters on pine water use efficiency (WUE) was the strongest among all the relationships analyzed, closely mirroring their influence on stem increment and explaining up to 30% of the variation in WUE (Figure 15).
Vapor pressure deficit (VPD) was identified as one of the main environmental drivers of tree transpiration. It exhibited a non-linear relationship with sap flow density, the nature of which depended on interactions with other meteorological variables that varied substantially throughout the season [16,28]. This may explain why VPD had the highest explanatory power for both annual stem volume increment during the vegetation period and WUE, accounting for up to 50% of the variation in the latter.
3.7. Multilinear Regression Analysis of Variation in Pine Stem Volume Increment, Transpiration Density, and Water Use Efficiency
A multiple linear regression analysis was conducted using the multiregression function in STATISTICA software. Models were constructed based on the most significant independent variables affecting the selected response variables, while minimizing the impact of multicollinearity.
Model No. 1, which focused on annual stem volume increment, revealed that air temperature during the vegetation and dormant periods (considered separately), along with precipitation and VPD during the former period, best explained variation in stem growth. The model accounted for over 39% of the variation in annual stem increment. Specifically, higher temperatures and increased VPD during the vegetation period inhibited pine growth, while higher mean temperatures during the dormant period and greater precipitation during the vegetation period had a positive effect, enhancing annual stem volume increment at the study site.
ZVannual = 125506.9-282.2 × Tm_veg+734.42 × Tm_dor + 22.3162 × Pr_veg – 2431.32 × VPDveg;
Regression summary for dependent variable: R²= 0.394; p<0.021; std. err. est: 2318.9.
Model No. 2, developed for the annual transpiration rate, revealed that only air temperature and cloud cover intensity during the vegetation period significantly explained its variation. The model accounted for 32% of the variability. An increase in temperature during the vegetation period led to higher transpiration rates, while increased cloudiness was associated with their reduction.
SFannual = -4959.2 + 496.5 × Tm_veg - 407.3 × Claudveg;
Regression summary for dependent variable: R²= 0.316; p<0.010; std. err. est.: 748.2.
Model No. 3, developed for annual water use efficiency (WUE), revealed that air temperature during the vegetation and dormant periods (considered separately), along with precipitation during the vegetation period, best explained variation in WUE. The model accounted for more than 75% of the variation.
In this model, only increased temperatures during the vegetation period had a negative effect on WUE, primarily via inhibiting pine growth. In contrast, higher mean temperatures during the dormant period and increased precipitation during the vegetation period had a positive effect, enhancing WUE by supporting greater stem volume increment under the studied forest conditions.
WUE veg = 37.02 – 2.073 × Tm_veg + 0.015 × Pr_veg + 0.304 × Tm_dorm;
Regression summary for dependent variable: R²= 0.755; p<0.000; std. err. est.: 0.710.
In summary, the observed changes in the response variables of Scots pine trees were the result of the integrated effects of detected predictive meteorological variables, which often had opposing influences—either inhibiting or stimulating physiological responses. Consequently, annual parameters such as stem increment and water loss through transpiration, both of which are closely reflected in WUE values, depended largely on the balance between these predict factors and, most importantly, on their temporal trends.
4. Discussion
The Scots pine (Pinus sylvestris L.) in this study was located near the center of its natural distribution range in Lithuania [14]. Its exceptionally wide geographic scope and ability to modify morphometric traits reflect its strong adaptive capacity and tolerance to diverse environmental stressors. However, some authors predict that, like Norway spruce, Scots pine may be particularly sensitive to climate change and thus among the most vulnerable tree species in the region [29,30,31]. Nevertheless, our research shows that Scots pine remains one of the most productive tree species in hemi-boreal forests [32]. Due to their deep root systems and high sensitivity to both favorable and unfavorable environmental factors, pine trees have demonstrated high tolerance to recent meteorological conditions—exhibited by restricted transpiration rate, consistently high annual stem volume increment and WUE [16,22,27]. These adaptations allow Scots pine to balance water conservation with carbon assimilation, supporting their survival in an increasingly unpredictable climate [33].
However, there remains a lack of knowledge regarding the critical thresholds beyond which Scots pine undergoes ecophysiological changes that significantly increase the risk of mortality due to pests or diseases. Therefore, the present study was designed to investigate the responses of Scots pine to environmental stress on highly oligotrophic, wind-formed sandy dune soils in the seaside region of the Curonian Spit National Park, where Scots pine dominates the forest stands Exceptional meteorological changes were recorded over the past 15 years, and especially during the most recent 7-year period. The intensity of climate warming exceeded all previously predicted values—surpassing 10°C per 100 years on an annual scale and even more than 20°C per 100 years on a monthly scale (Figure 5). Exceptionally warm winters also provided an opportunity to investigate a key question regarding the adaptive capacity of Scots pine: its ability to survive summer drought and heatwaves, particularly those occurring in June. As our data shown, this month is the critical for analyzing not only annual increment of pine trees but also their total condition [22,27,32]. In this context, the obtained data revealed substantial structural, physiological, or combined adjustments in Scots pine trees, which resulted in relatively stable WUE under unfavorable environmental conditions and demonstrated a broad threshold for surviving climatic stress. Understanding the variation in WUE is therefore critical for assessing how Scots pine forests respond to drought and other climate-induced stressors.
With global warming and drought events becoming more frequent and severe, attention to WUE dynamics is more pressing than ever. Under dry soil conditions, Scots pine experiences a significant reduction in soil moisture, which negatively impacts transpiration rates and WUE. Gazol et al. [4] reported that drought-induced declines in soil water availability increase stress in trees, heightening vulnerability to pests and diseases and potentially leading to forest dieback. However, studies by Liu et al. [34] found that co-occurring pine species in the Great Basin showed improved WUE following periods of drought relief, indicating physiological adaptability. This suggests that some pine species can adjust WUE strategies to cope with climate variability—a key trait for resilience in increasingly arid conditions.
Our findings show that heatwaves and droughts during the vegetation period increased sap flow density, while stem increment rates during this interval remained at or above the monthly average. This resulted in elevated WUE, indicating that pine trees may enhance water use efficiency during environmental stress to survive in adverse conditions such as drought, air pollution, and the presence of forest pests. This interaction between moisture limitation and growth capacity underlines the importance of monitoring WUE under shifting climatic regimes and highlights how winter warming and drought stress affect tree performance together.
WUE thus emerges as a central factor in evaluating Scots pine resilience. Its dynamics offer critical insight into forest health and productivity. While warmer winters can stimulate growth, this benefit may be offset by intensified summer drought. Misi and Náfrádi [35] noted that although rising winter temperatures can enhance early-season growth, this effect is often diminished by reduced summer moisture—an increasingly common outcome due to climate change. The interplay between winter warming and summer drought underscores the complex climate response of Scots pine, where potential growth gains are vulnerable to seasonal water limitations.
Kellomäki et al. [36] note that while minor climate warming may enhance growth and survival in northern populations of Scots pine, it can reduce growth in southern areas, where drought conditions are more frequent. In such regions, moisture availability becomes a critical determinant of pine growth, which is enhanced via increased soil moisture reducing competition among trees [37]. These emerging meteorological changes provide a unique opportunity to investigate the adaptive capacity of Scots pine under extreme, unfavorable conditions at arid growing sites and to assess the species’ potential to mitigate future climate change-related threats.
New insights into the effects of warmer winters on the resilience of pine trees—particularly their ability to withstand drought and heatwaves in mid-summer (e.g., June)—allow us to address the central aims of this study. Based on the earlier finding that the stem volume increment in June is the best predictor of the annual increase and that this month is critical for radial growth in the northeastern hemi-boreal forest region [38,39], we chose values in this month to evaluate the significance of winter temperature on their variation.
An analysis of long-term climate data from the Curonian Spit National Park revealed alarming warming trends, especially in January-February as well in June and October. Our analysis showed that February temperature and May–June precipitation were excluded from the final model due to high multicollinearity with January and June temperatures, respectively. Similarly, increased temperatures in August–September and decreased precipitation in December contributed negligibly to variation in June stem increment. The final multiple regression model identified January and June air temperature and September precipitation as the most influential predictors, explaining more than 74% of the variation in June stem increase:
ZV_VI = 10396.4 + 376.3 × Tm_I – 425.0 × Tm_VI – 13.27 × Pr_IX ;
Model summary: R² = 0.741; p < 0.0000; std. error = 646.1.
To evaluate the specific role of winter temperature, January was excluded from the model. The determination coefficient (R²) dropped by nearly half, underscoring the strong influence of January temperature on pine stem increment:
ZV_VI = 15387.0 – 688.5 × Tm_VI – 11.87 × Pr_IX ;
Model Summary: R² = 0.369, p < 0.004, Std. Error = 988.0
These results indicate that, during drought conditions in June, Scots pine can physiologically adjust to conserve water during heatwaves. Previous research has shown that, under drought stress, Scots pine reduces stomatal conductance and increases osmotic adjustment, helping to maintain internal water pressure and reduce water loss, while still permitting CO₂ uptake for photosynthesis [40]. This aligns with our findings, as June exhibited the highest WUE (6 cm³ per liter of water) and the highest stem volume increment (17 dm³ per month) when swelling effects were excluded. Therefore, our hypothesis that Scots pine is more vulnerable to summer drought following a warm winter was rejected.
Finally, our results suggest that forecasting future changes in Scots pine resilience will depend on the trajectory of several key climatic variables. Over the past 15 years, significant increases in air temperature during January, February, June, and October (p < 0.05), along with decreasing precipitation in May, June, September, and December (p < 0.1), have emerged as important trends.
Despite these climatic shifts, the absence of a clearly defined threshold beyond which Scots pine fails to survive indicates that this species remains among the most suitable for silvicultural use in hemi-boreal forests. Adaptive, close-to-natural silvicultural treatments—based on maintaining continuous forest cover with Scots pine as the dominant canopy species—should ensure the long-term sustainability of coniferous forests and strengthen their capacity to withstand and mitigate emerging climate-related threats. These findings provide a solid foundation for informing future forest research and management strategies.
5. Conclusions
Generalizing the obtained results, first of all, we would like to emphasize a very intensive and significant warming process that occurred recently in northeastern part of Europe and an exceptional intensive process—in the seaside part of Lithuania, especially in Curonian Spit National Park. There, during the past 15 years, its intensity exceeded 10 °C per 100 years. The key parameters that could essentially change the sustainability of Scots pine forest are the mean monthly temperatures in October, January, February, and June, which increased much more intensively, exceeding catastrophic levels, i.e., 20°C per 100 years. A decrease in the precipitation amount in May–June and September and December could reinforce the problem of pine’s adaptive capacity to survive under such conditions. However, not all of these mentioned parameters negatively affected the growth and condition of pine trees. Meteorological factors which over the vegetation period inhibited pine annual volume increment, during dormant period stimulated it and vice versa, which stimulated - inhibited. Finaly, warm winters and gradual increases in precipitation, as detected over the last 7 years, reduced most of the significant negative effects of drought and heatwaves in June, which became the main drivers of forest conditions not only in Lithuania, but also over the northeastern hemi-boreal forest region in Europe. Therefore, despite such extremely intensive changes in climatic conditions, pine forest demonstrated a rather large stem volume increment, high water use efficiency, and adaptive capacity to mitigate the new threats of climate changes in the future. Vital threshold beyond which Scots pine trees suffer such ecophysiological changes, after which probability of dying become inevitable was not detected.
Apprehensions that rising winter temperatures may heighten the susceptibility of Scots pine to summer drought conditions are rejected. Therefore, the sustainability of Scots pine forest in the future will depend on the character and intensity of changes in key meteorological parameters and their balance, which will integrally affect the Scots pine forest’s condition and growth what creates the new direction in forest future research.
Funding
This research paper has received funding from Horizon Europe Framework Programme (HORIZON), called Teaming for Excellence (HORIZON-WIDERA-2022-ACCESS-01-two-stage)—Creation of the Center of excellence in smart forestry “Forest 4.0” No. 101,059,985—and co-funded by the European Union under the project “FOREST 4.0—Center of excellence for the development of a sustainable forest bioeconomy”, No. 10-042-P-0002.
Data Availability Statement
The part of the data presented in this study are openly available in [21] Baumgarten et al., 2019; https://doi.org/10.2480/agrmet.D-18-00008. and [16] Augustaitis and Pivoras, 2024; https://doi.org/10.3390/f15071158. A The datasets presented in this article are not readily available because the data are part of an ongoing study of the European Union under the project “FOREST 4.0.
References
- IPCC. 2021. Summary for policymakers. In: Masson-Delmotte, V., Zhai, P., Pirani, a., Connors, S.L., P’ean, C. Et al., eds. Climate change 2021: the physical science basis. Contribution of working group I to the sixth assessment report of the intergovernmental panel on climate change. Cambridge (UK): Cambridge University Press, p. 3–32.
- Allen, C.D.; Breshears, D.D.; McDowell, N.G. On underestimation of global vulnerability to tree mortality and forest die-off from hotter drought in the Anthropocene. Ecosphere. 2015, 6, art129. [CrossRef]
- Allen, C. D.; Macalady, A. K.; Chenchouni, H.; Bachelet, D.; McDowell, N.; Vennetier, M.; Kitzberger, T.; Rigling, A.; Breshears, D. D.; Hogg, E. H. (Ted).; Gonzalez, P.; Fensham, R.; Zhang, Z.; Castro, J.; Demidova, N.; Lim, J.-H.; Allard, G.; Running, S. W.; Semerci, A.; Cobb, N. A global overview of drought and heat-induced tree mortality reveals emerging climate change risks for forests. For. Ecol. Manag. 2010, 259, 660-684. [CrossRef]
- Gazol, A.; Camarero, J.J. Compound climate events increase tree drought mortality across European forests. Sci. Total Environ. 2022, 816, 151604.
- Hammond, W.M.; Williams, A.P.; Abatzoglou, J.T.; Adams, H.D.; Klein, T.; Lopez, ’ R.; Allen, C.D. Global field observations of tree die-off reveal hotter-drought fingerprint for Earth’s forests. Nature Comm. 2022, 13, 1761.
- Bréda, N.; Huc, R.; Granier, A.; Dreyer, E. Temperate forest trees and stands under severe drought: A review of ecophysiological responses, adaptation processes and long-term consequences. Annals of Forest Science, 2006, 63(6), 625–644.
- Wei, S.; Qiao, L.; Xia, H.The impact of drought time scales and characteristics on gross primary productivity in China from 2001 to 2020. Geo-spatial Information Science, 2024, 27(5), 651–669.
- Babst, F.; Bouriaud, O.; Poulter, B.; Trouet, V.; Girardin, M.P.; Frank, D.C. Twentieth-century redistribution in climatic drivers of global tree growth. Sci. Adv. 2019, 5, eaat4313.
- Grossiord, C.; Buckley, T.N.; Cernusak, L.A.; Novick, K.A.; Poulter, B., Siegwolf, R.T.W.; Sperry, J.S.; Mcdowell, N.G. Plant responses to rising vapor pressure deficit. New Phytol. 2020, 226, 1550–1566.
- DeSoto, L.; Cailleret, M.; Sterck, F.; Jansen, S.; Kramer, K.; Robert, E.M.R.; Aakala, T.; Amoroso, M.M.; Bigler, C.; Camarero, J.J.; Cufar, ˇ K.; et al. Low growth resilience to drought is related to future mortality risk in trees. Nat. Commun. 2020, 11, 1–9.
- Williams, A.P.; Allen, C.D.; Macalady, A.K.; Griffin, D.; Woodhouse, C.A.; Meko, D.M.; et al. Temperature as a potent driver of regional forest drought stress and tree mortality. Nat. Clim. Chang. 2013, 3, 292–297.
- Harvey, J.E.; Smiljanić, M.; Scharnweber, T.; et al. Tree growth influenced by warming winter climate and summer moisture availability in northern temperate forests. Glob Change Biol. 2020, 26, 2505–2518. [CrossRef]
- Fu, Y,; Liu, Ch,; He, H.S.; Wang, S.; Wang, L.; Xie, Z. Assessing the impact of climate warming on tree species composition and distribution in the forest region of Northeast China. Front. Plant Sci. 2024, 15, 1430025. [CrossRef]
- Ozolinčius, R.; Lekevičius, E.; Stakėnas, V.; Galvonaitė, A.; Samas, A.; Valiukas, D. Lithuanian forests and climate change: Possible effects on tree species composition. European Journal of Forest Research. 2014, 133(1), 51–60. [CrossRef]
- LHMT (Lithuanian hydrometeoservice), 2024. https://www.meteo.lt/.
- Augustaitis, A.; Pivoras, A. Sap flow density of the prevailing tree species in a hemiboreal forest under contrasting meteorological and growing conditions. Forests, 2024, 15 (7), 1 – 19.
- Burgess, S.S.O; Adams, M.A.; Turner, N.C.; Beverly, C.R.; Ong C.K.; Khan A.A.H.; Bleby T.M. An improved heat pulse method to measure low and reverse rates of sap flow in woody plants. Tree Physiology, 2001, 21, 589-598.
- ICT International. Sap Flow Tool. Analysis and Visualization of Sap Flow Data. User manual. 2016. Version 1.4 http://www.sapflowtool.com/SapFlowToolManual.html> (2016).
- Deng, Z.; Vice, H.K.; Gilbert, M.E.; Adams, M.A.; Buckley, T.N. A double – ratio method to measure fast, slow and reverse sap flows. Tree Physiology, 2021, 41, 2438 – 2453. [CrossRef]
- Baumgarten, M.; Weis, W.; Kühn, A.; May, M.; Matyssek, R. Forest transpiration targeted through xylem sap flux assessment versus hydrological modeling. European Journal of Forest Research 2014, 133, 677-690.
- Baumgarten, M.; Hesse, B. D.; Augustaitienė, I.; Marozas, V.; Mozgeris, G.; Byčenkienė, S.; Mordas, G.; Pivoras, A.; Pivoras, G.; Juonytė, D.; Ulevičius, V.; Augustaitis, A.; Matyssek, R. Responses of species-specific sap flux, transpiration and water use efficiency of pine, spruce and birch trees to temporarily moderate dry periods in mixed forests at a dry and wet forest site in the hemi-boreal zone. Journal of Agricultural Meteorology, 2019, 75(1), 13–29. [CrossRef]
- Augustaitis, A. Intra-annual variation of stem circumference of tree species prevailing in hemi-boreal forest on hourly scale in relation to meteorology, solar radiation and surface ozone fluxes. Atmosphere, 2021, 12 (8), 1 – 25.
- Lu, C.; Cao, J.; Yao, C.; Wang, Z.; Yang, J.; Zhang, Y.; Tuo, W.; Dong, W.; Tong, X.; Wu, F. Water use efficiency of trees planted on abandoned farmland and influencing factors in a Loess Hilly Area J. Soil Sci. Plant Nutr. 2024, 24, Issue 2, 2972-2984. 10.1007/s42729-024-01722-z.
- Cernusak, L.A. Gas exchange and water-use efficiency in plant canopies Plant Biol., 2020, 22, 52-67.
- Huang, M.; Piao, S.; Sun, Y.; Ciais, P.; Cheng, L.; Mao, J.; Poulter, B.; Shi, X.; Zeng, Z.; Wang, Y. Change in terrestrial ecosystem water-use efficiency over the last three decades. Glob. Change Biol. 2015, 21, 2366-2378.
- Anderegg, W.R.L.; Schwalm, C.; Biondi, F.; Camarero, J.J.; Koch, G.; Litvak, M.; Ogle, K.; Shaw, J.D.; Shevliakova, E.; Williams, A.P.; Wolf, A.; Ziaco, E.; Pacala, FOREST ECOLOGY. Pervasive drought legacies in forest ecosystems and their implications for carbon cycle models. Science, 2015, 349(6247), 528-32. [CrossRef]
- Augustaitis, A.; Augustaitienė, I.; Baumgarten, M.; Bičenkienė, S.; Girgždienė, R.; Kulbokas, G.; Linkevičius, E.; Marozas, V.; Mikalajūnas, M.; Mordas, G.; Mozgeris, G.; Petrauskas, E.; Pivoras, A.; Šidlauskas, G.; Ulevičius, V.; Vitas, A.; Matyssek, R. Tree-ring formation as an indicator of forest capacity to adapt to the main threats of environmental changes in Lithuania. Science of the Total Environment, 2018, 615, 1247-1261. [CrossRef]
- Oogathoo, S.; Houle, D.; Duchesne, L.; Kneeshaw, D. Vapor pressure deficit and solar radiation are the major drivers of transpiration of balsam fir and black spruce tree species in humid boreal regions, even during a short-term drought. Agricultural and Forest Meteorology 2020, 291, 108063. [CrossRef]
- Ozolinčius, R.; Lekevičius, E.; Stakėnas, V.; Galvonaitė, A.; Samas, A.; Valiukas, D. Lithuanian forests and climate change: Possible effects on tree species composition. European Journal of Forest Research, 2014, 133(1), 51–60. [CrossRef]
- Hanewinkel, M.; Cullmann, D. A.; Schelhaas, M. J.; Nabuurs, G. J.; Zimmermann N. E. Climate change may cause severe loss in the economic value of European forest land. Nature Climate Change, 2013, 3(3), 203–207. [CrossRef]
- Briceño-Elizondo, E.; Garcia-Gonzalo, J.; Peltola, H.; Matala, J.; Kellomäki S. Sensitivity of growth of Scots pine, Norway spruce and silver birch to climate change and forest management in boreal conditions. Forest Ecology and Management, 2006, 232(1–3), 152–167. [CrossRef]
- Mikalajūnas, M.; Pretzsch, H.; Mozgeris, G.; Linkevičius, E.; Augustaitienė, I.; Augustaitis, A. Scots pine’s capacity to adapt to climate change in hemi-boreal forests in relation to dominating tree increment and site condition. iForest. 2021, 14, 473-482. [CrossRef]
- Tarin, M.W.K.; Fan, L. L.; Shen, L.; Lai, J. L.; Tayyab, M.; Sarfraz, R.; Chen, L.Y.; Ye, J.; He, T.Y.; Rong, J.D.; Chen, L.G.; Zheng, Y.S. Effects of different biochars ammendments on physiochemical properties of soil and root morphological attributes of Fokenia hodginsii (Fujian Cypress). Applied ecology and environmental research, 2019, 17(5), 11107-11120.
- Liu, B.; Liu, Q.; Zhou, Z.; Yin, H.; Xie, Y.; Wei, Y. Plant Cell & Environment. Two terpene synthases in resistant Pinus massoniana contribute to defence against Bursaphelenchus xylophilus. Plant Cell Environ. 2021, 44(1), 257-274. [CrossRef]
- Misi, D.; Náfrádi, K. Growth response of Scots pine to changing climatic conditions over the last 100 years: a case study from Western Hungary. 2017, Trees, 31(3), 919-928. [CrossRef]
- Kellomäki, S.; Strandman, H.; Heinonen, T.; Asikainen, A.; Venäläinen, A.; Peltola, H. Temporal and Spatial Change in Diameter Growth of Boreal Scots Pine, Norway Spruce, and Birch under Recent-Generation (CMIP5) Global Climate Model Projections for the 21st Century. Forests, 2018, 9(3), 118. [CrossRef]
- Bayat, M.; Knoke, T.; Heidari, S.; Hamidi, S.K.; Burkhart, H.; Jaafari, A. Modeling tree growth responses to climate change: a case study in natural deciduous mountain forests. Forests, 2022, 13 (2022), 1816, 10.3390/f13111816.
- Merlin, M.; Hylen, G.; Vergarechea, M.; Bright, R.M.; Eisner, S.; Solberg, S. Climate-growth relationships for Norway spruce and Scots pine remained relatively stable in Norway over the past 60 years despite significant warming trends. Forest Ecology and Management, 2024, 569, 122180.
- Ogana, F.N.; Holmstrom, E.; Aldea, J.; Liziniewicz, M. Growth response of Pinus sylvestris L. and Picea abies [L.] H. Karst to climate conditions across a latitudinal gradient in Sweden. Agricultural and Forest Meteorology, 2024, 353, 110062.
- Peguero, C.; López-Fernández, J.; & Solla, A. “Physiological Responses and Adaptation Mechanisms of Scots Pine to Drought Stress.” Tree Physiology, 2023. 43(1), 78-90. [CrossRef]
Figure 1.
The location of the monitored Scots pine trees in Lithuania.
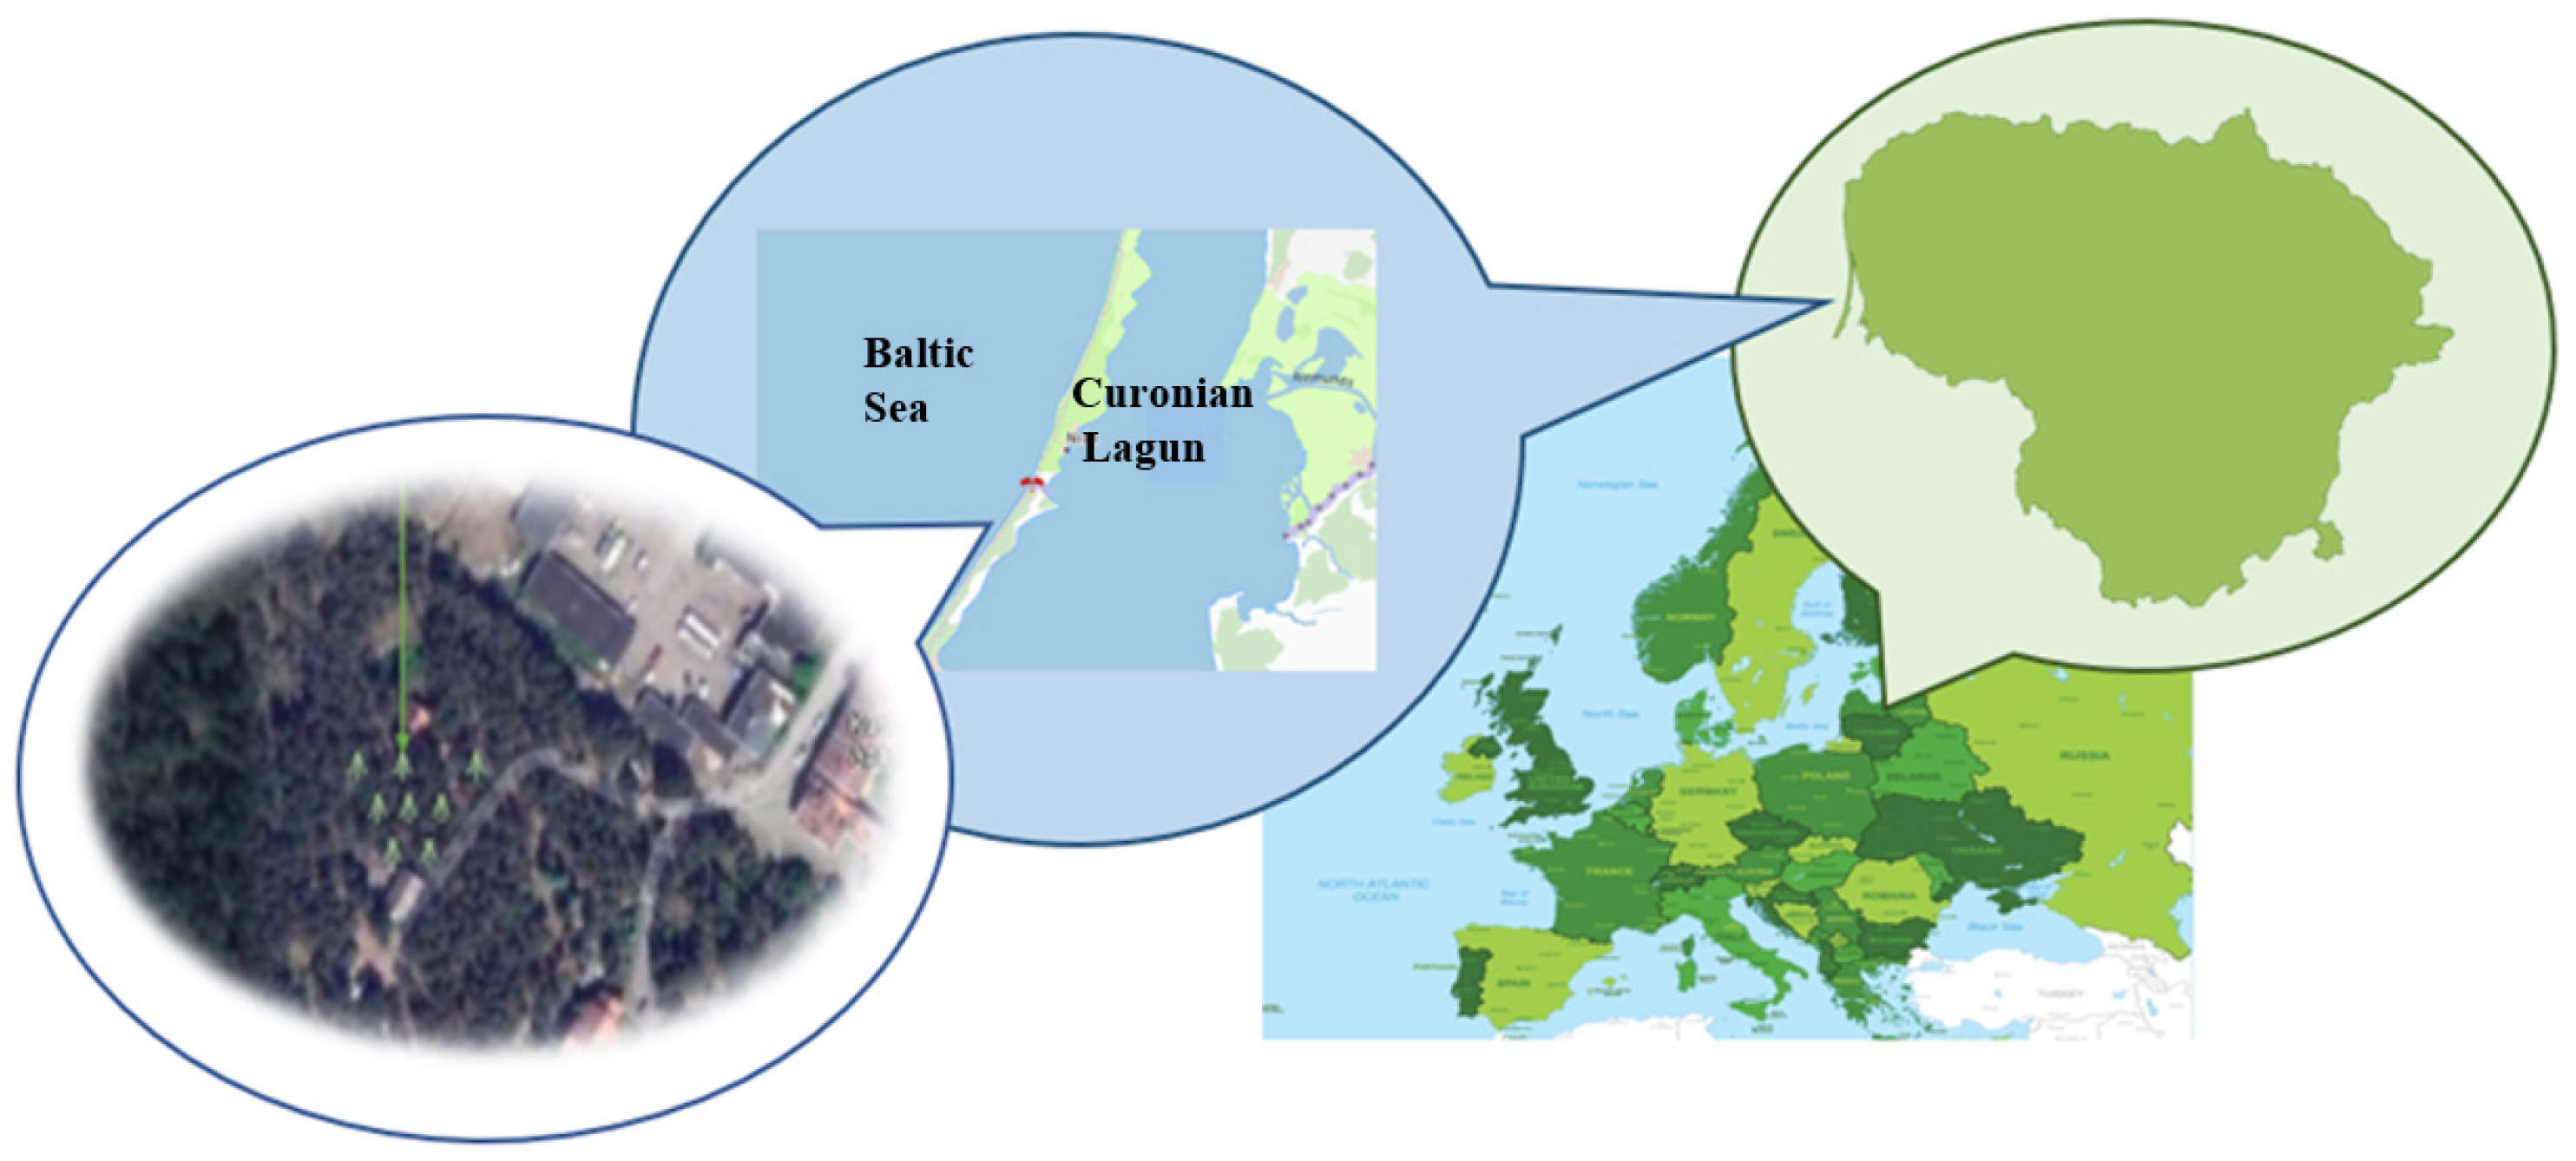
Figure 2.
Heat ratio-pulse method (HRM) (Burgess et al. 2001).
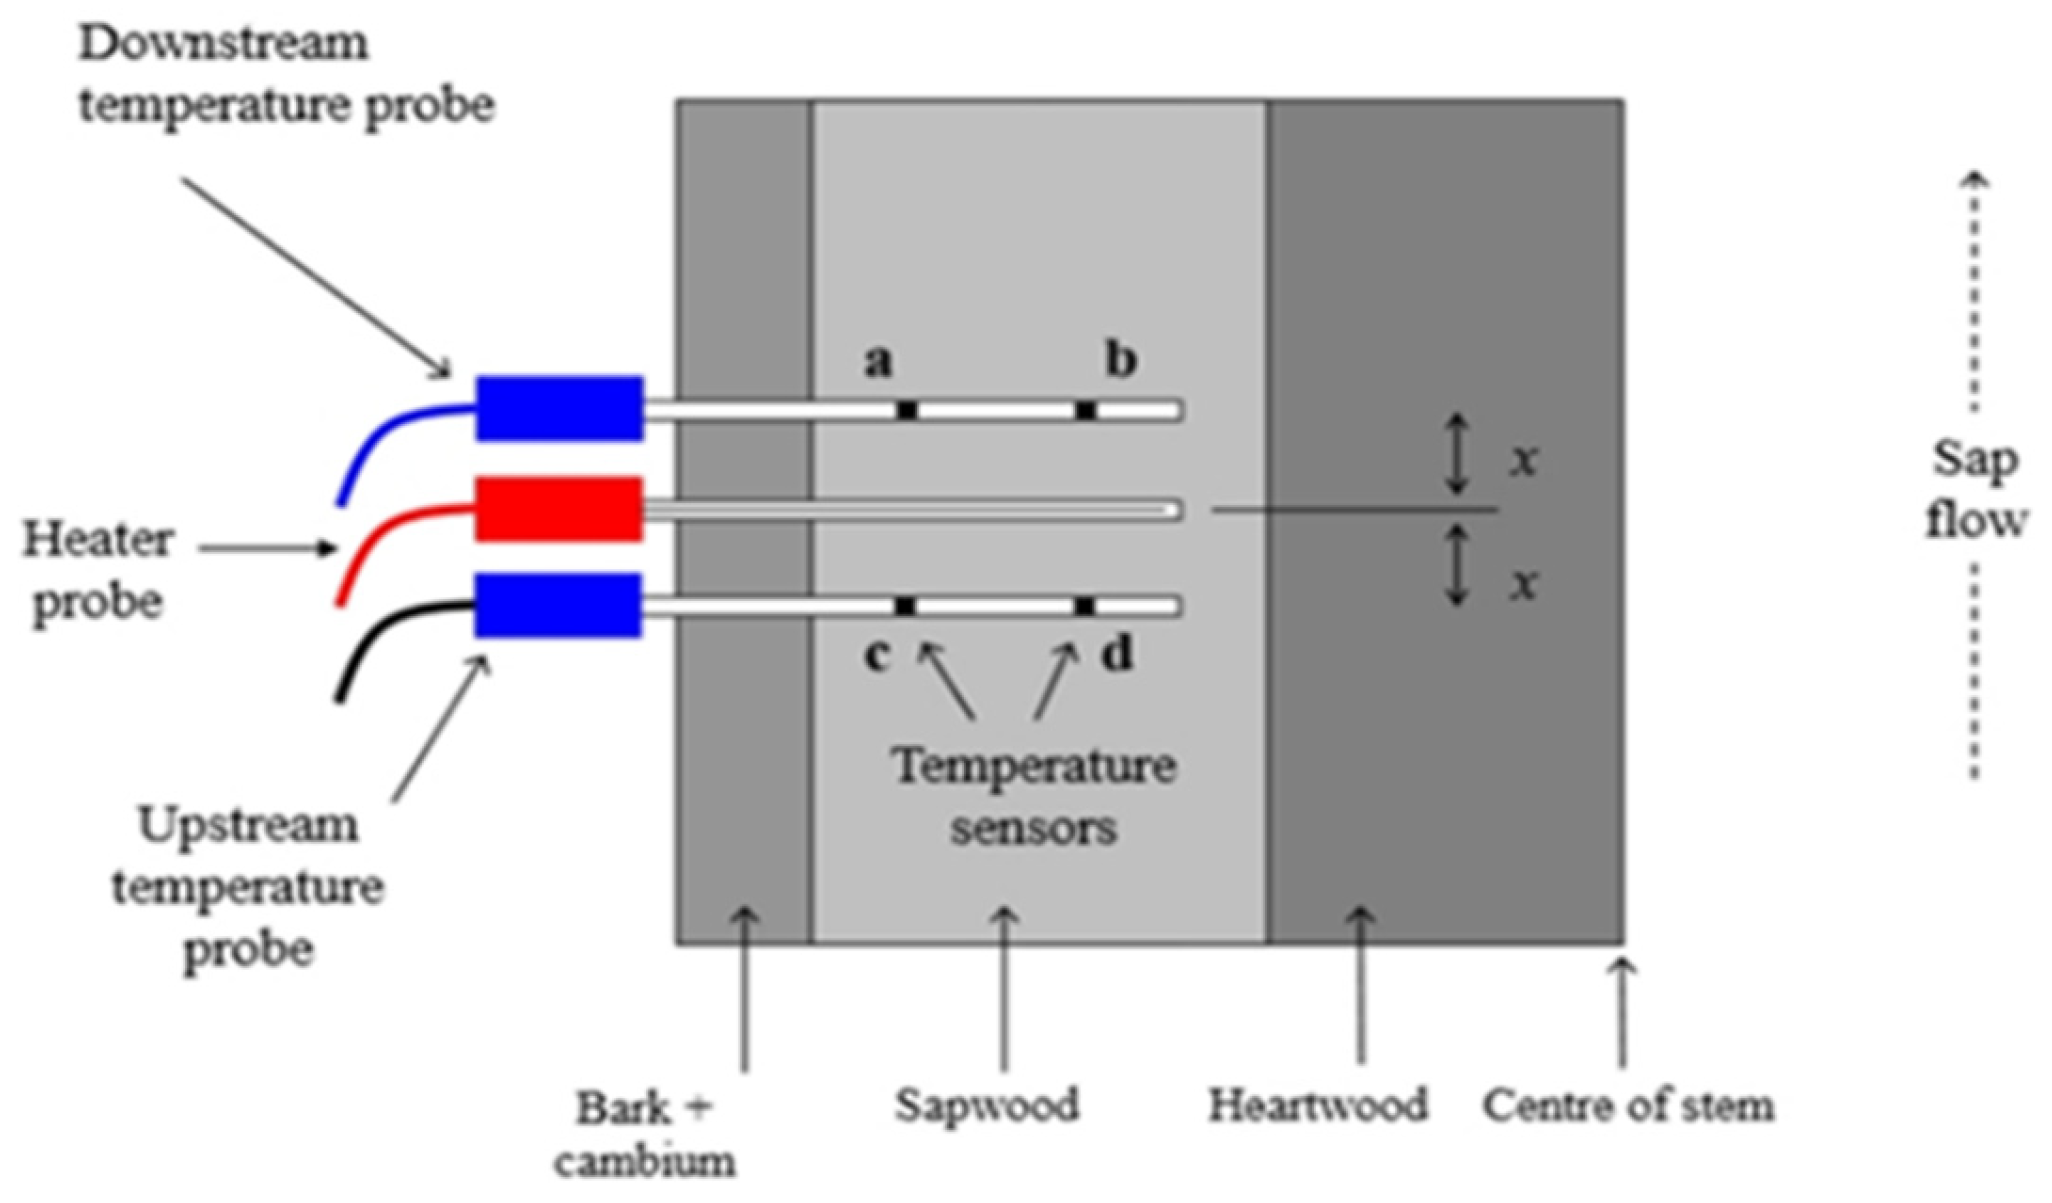
Figure 3.
Meteorological conditions in Curonian Spit National Park over 2010-2024 period based on data from the Nida Meteorological Station [15].
Figure 3.
Meteorological conditions in Curonian Spit National Park over 2010-2024 period based on data from the Nida Meteorological Station [15].
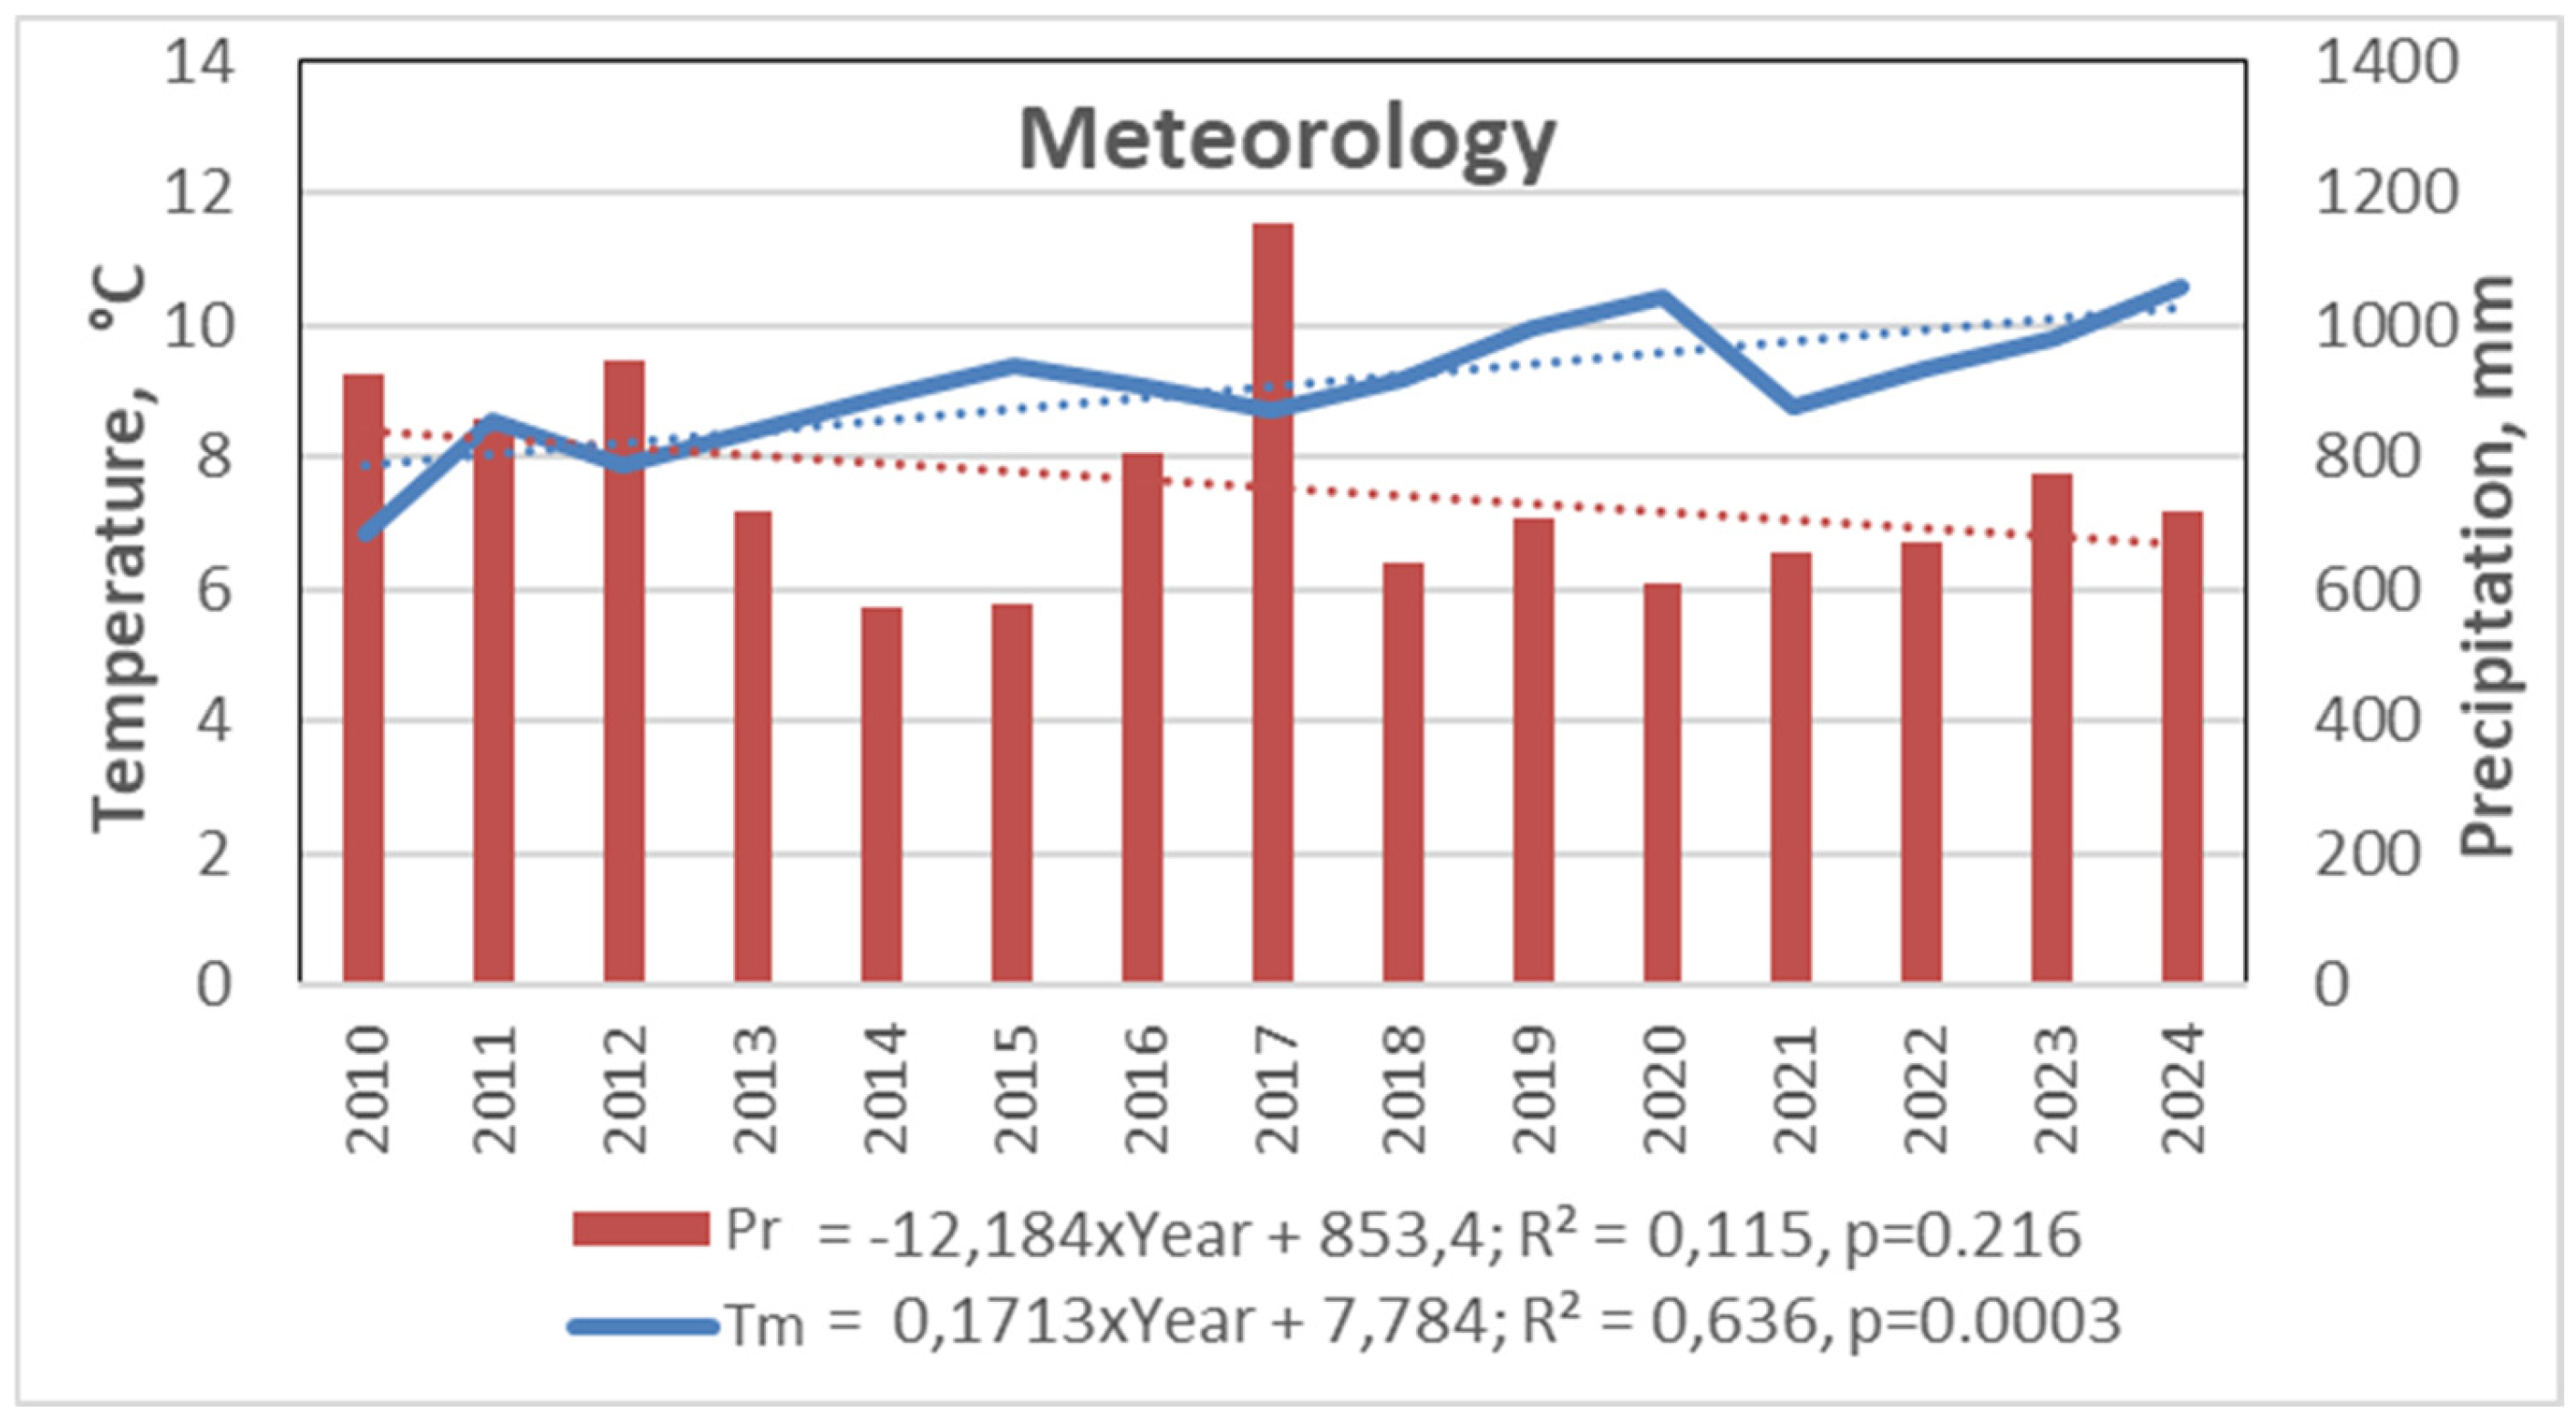
Figure 4.
The intensity of the changes in mean monthly temperature and precipitation (B coefficient and its significance, p) over the last 15-year period (2010-2024) at the Curonian Spit National Park, based on data from the Nida Meteorological Station [15].
Figure 4.
The intensity of the changes in mean monthly temperature and precipitation (B coefficient and its significance, p) over the last 15-year period (2010-2024) at the Curonian Spit National Park, based on data from the Nida Meteorological Station [15].
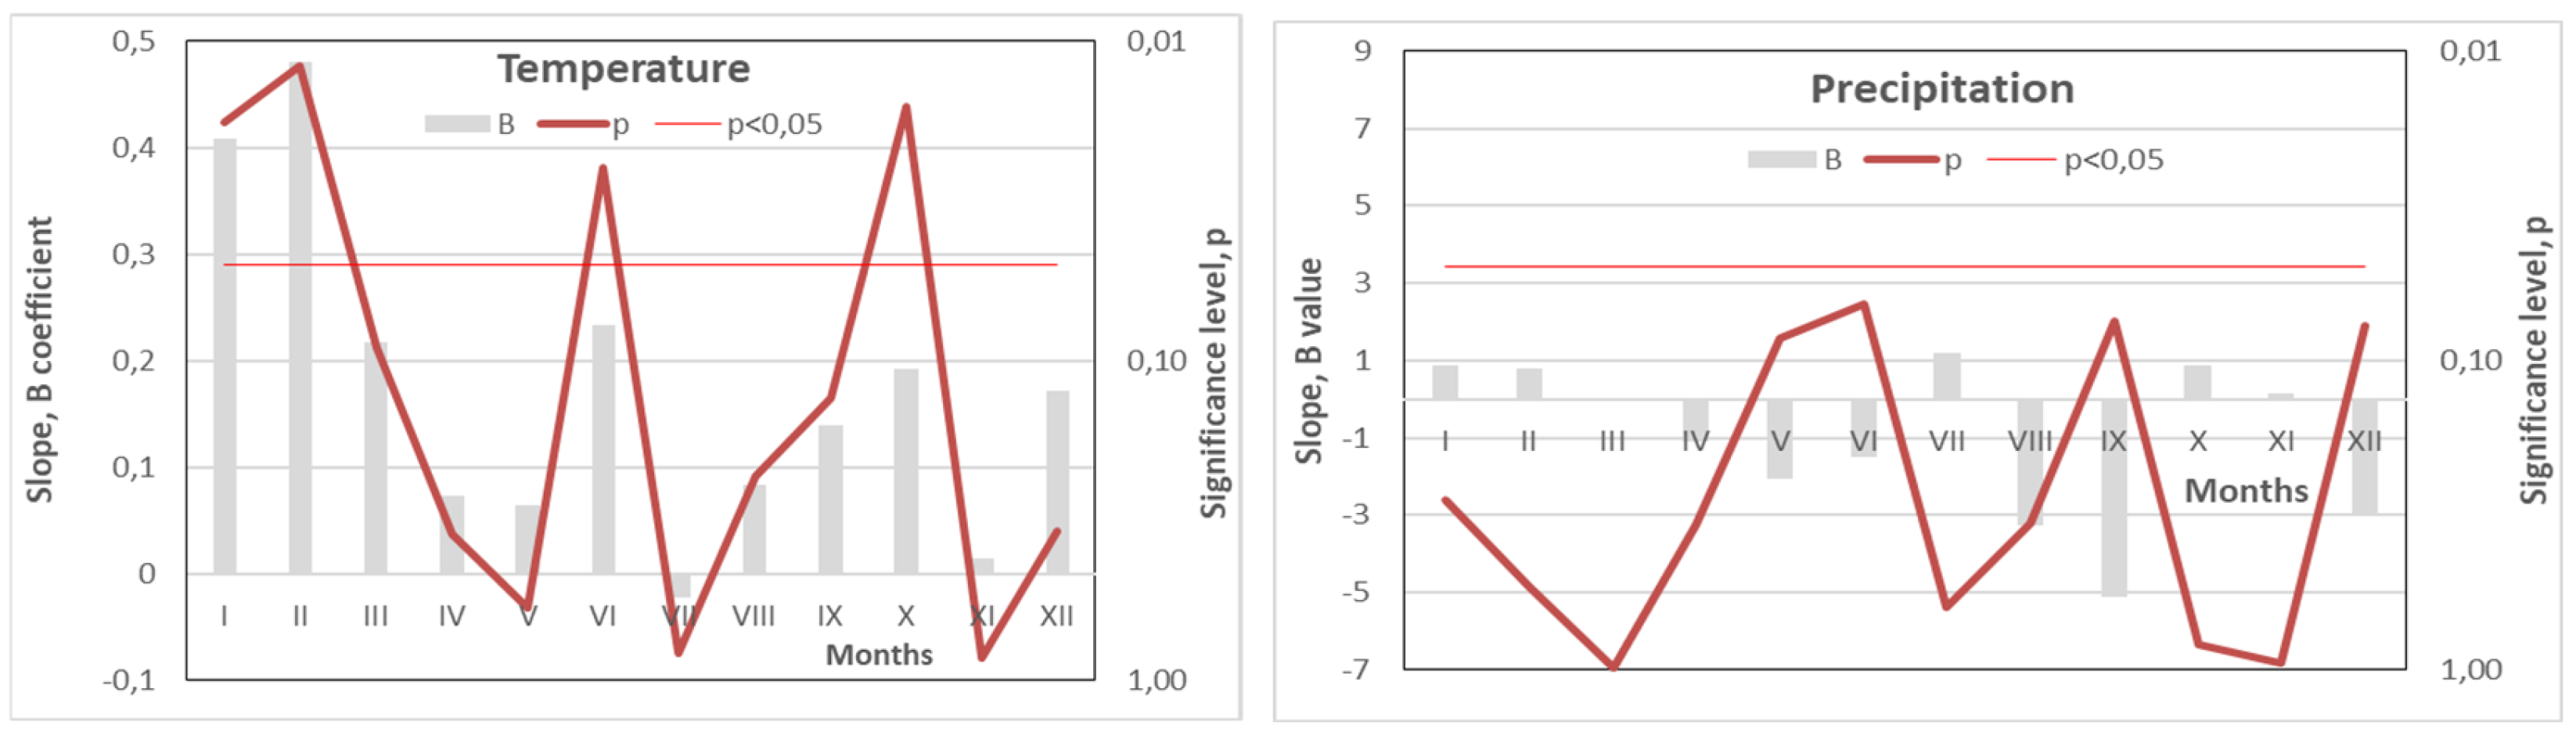
Figure 5.
Seasonal variation in temperature, precipitation, relative humidity, VPD, sun radiation and cloud cover intensity over the 2018-2024 period.
Figure 5.
Seasonal variation in temperature, precipitation, relative humidity, VPD, sun radiation and cloud cover intensity over the 2018-2024 period.
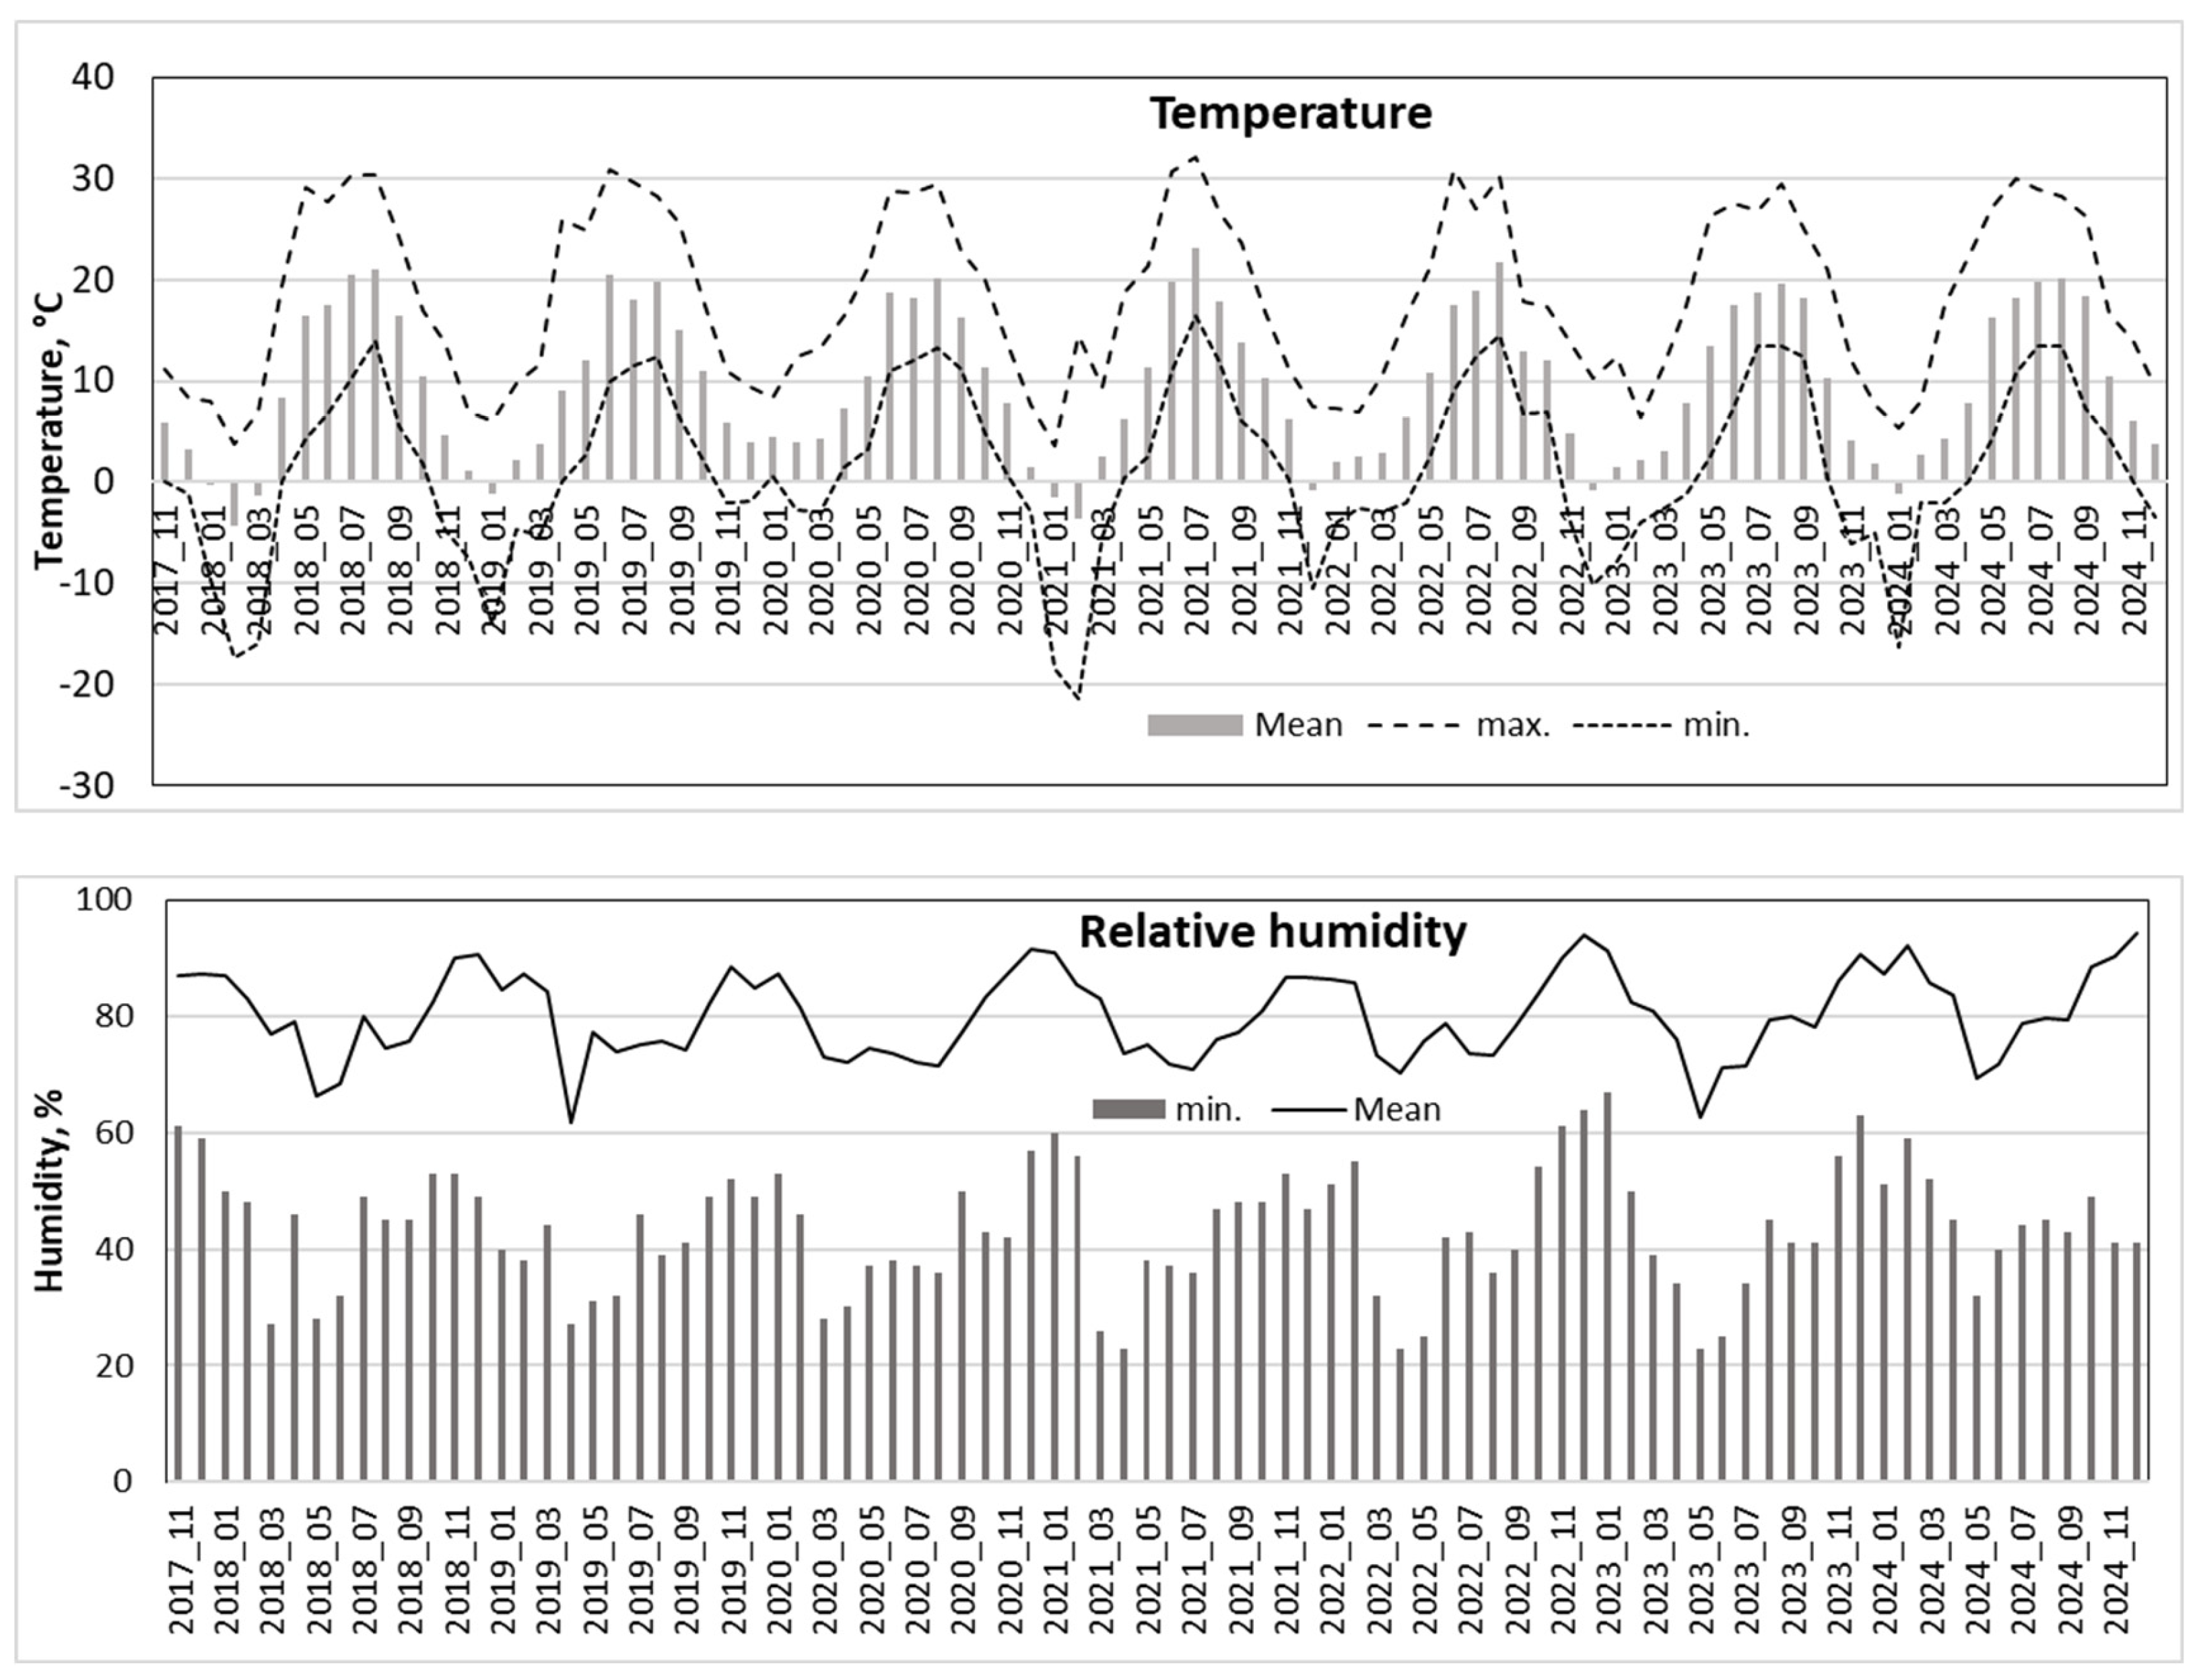
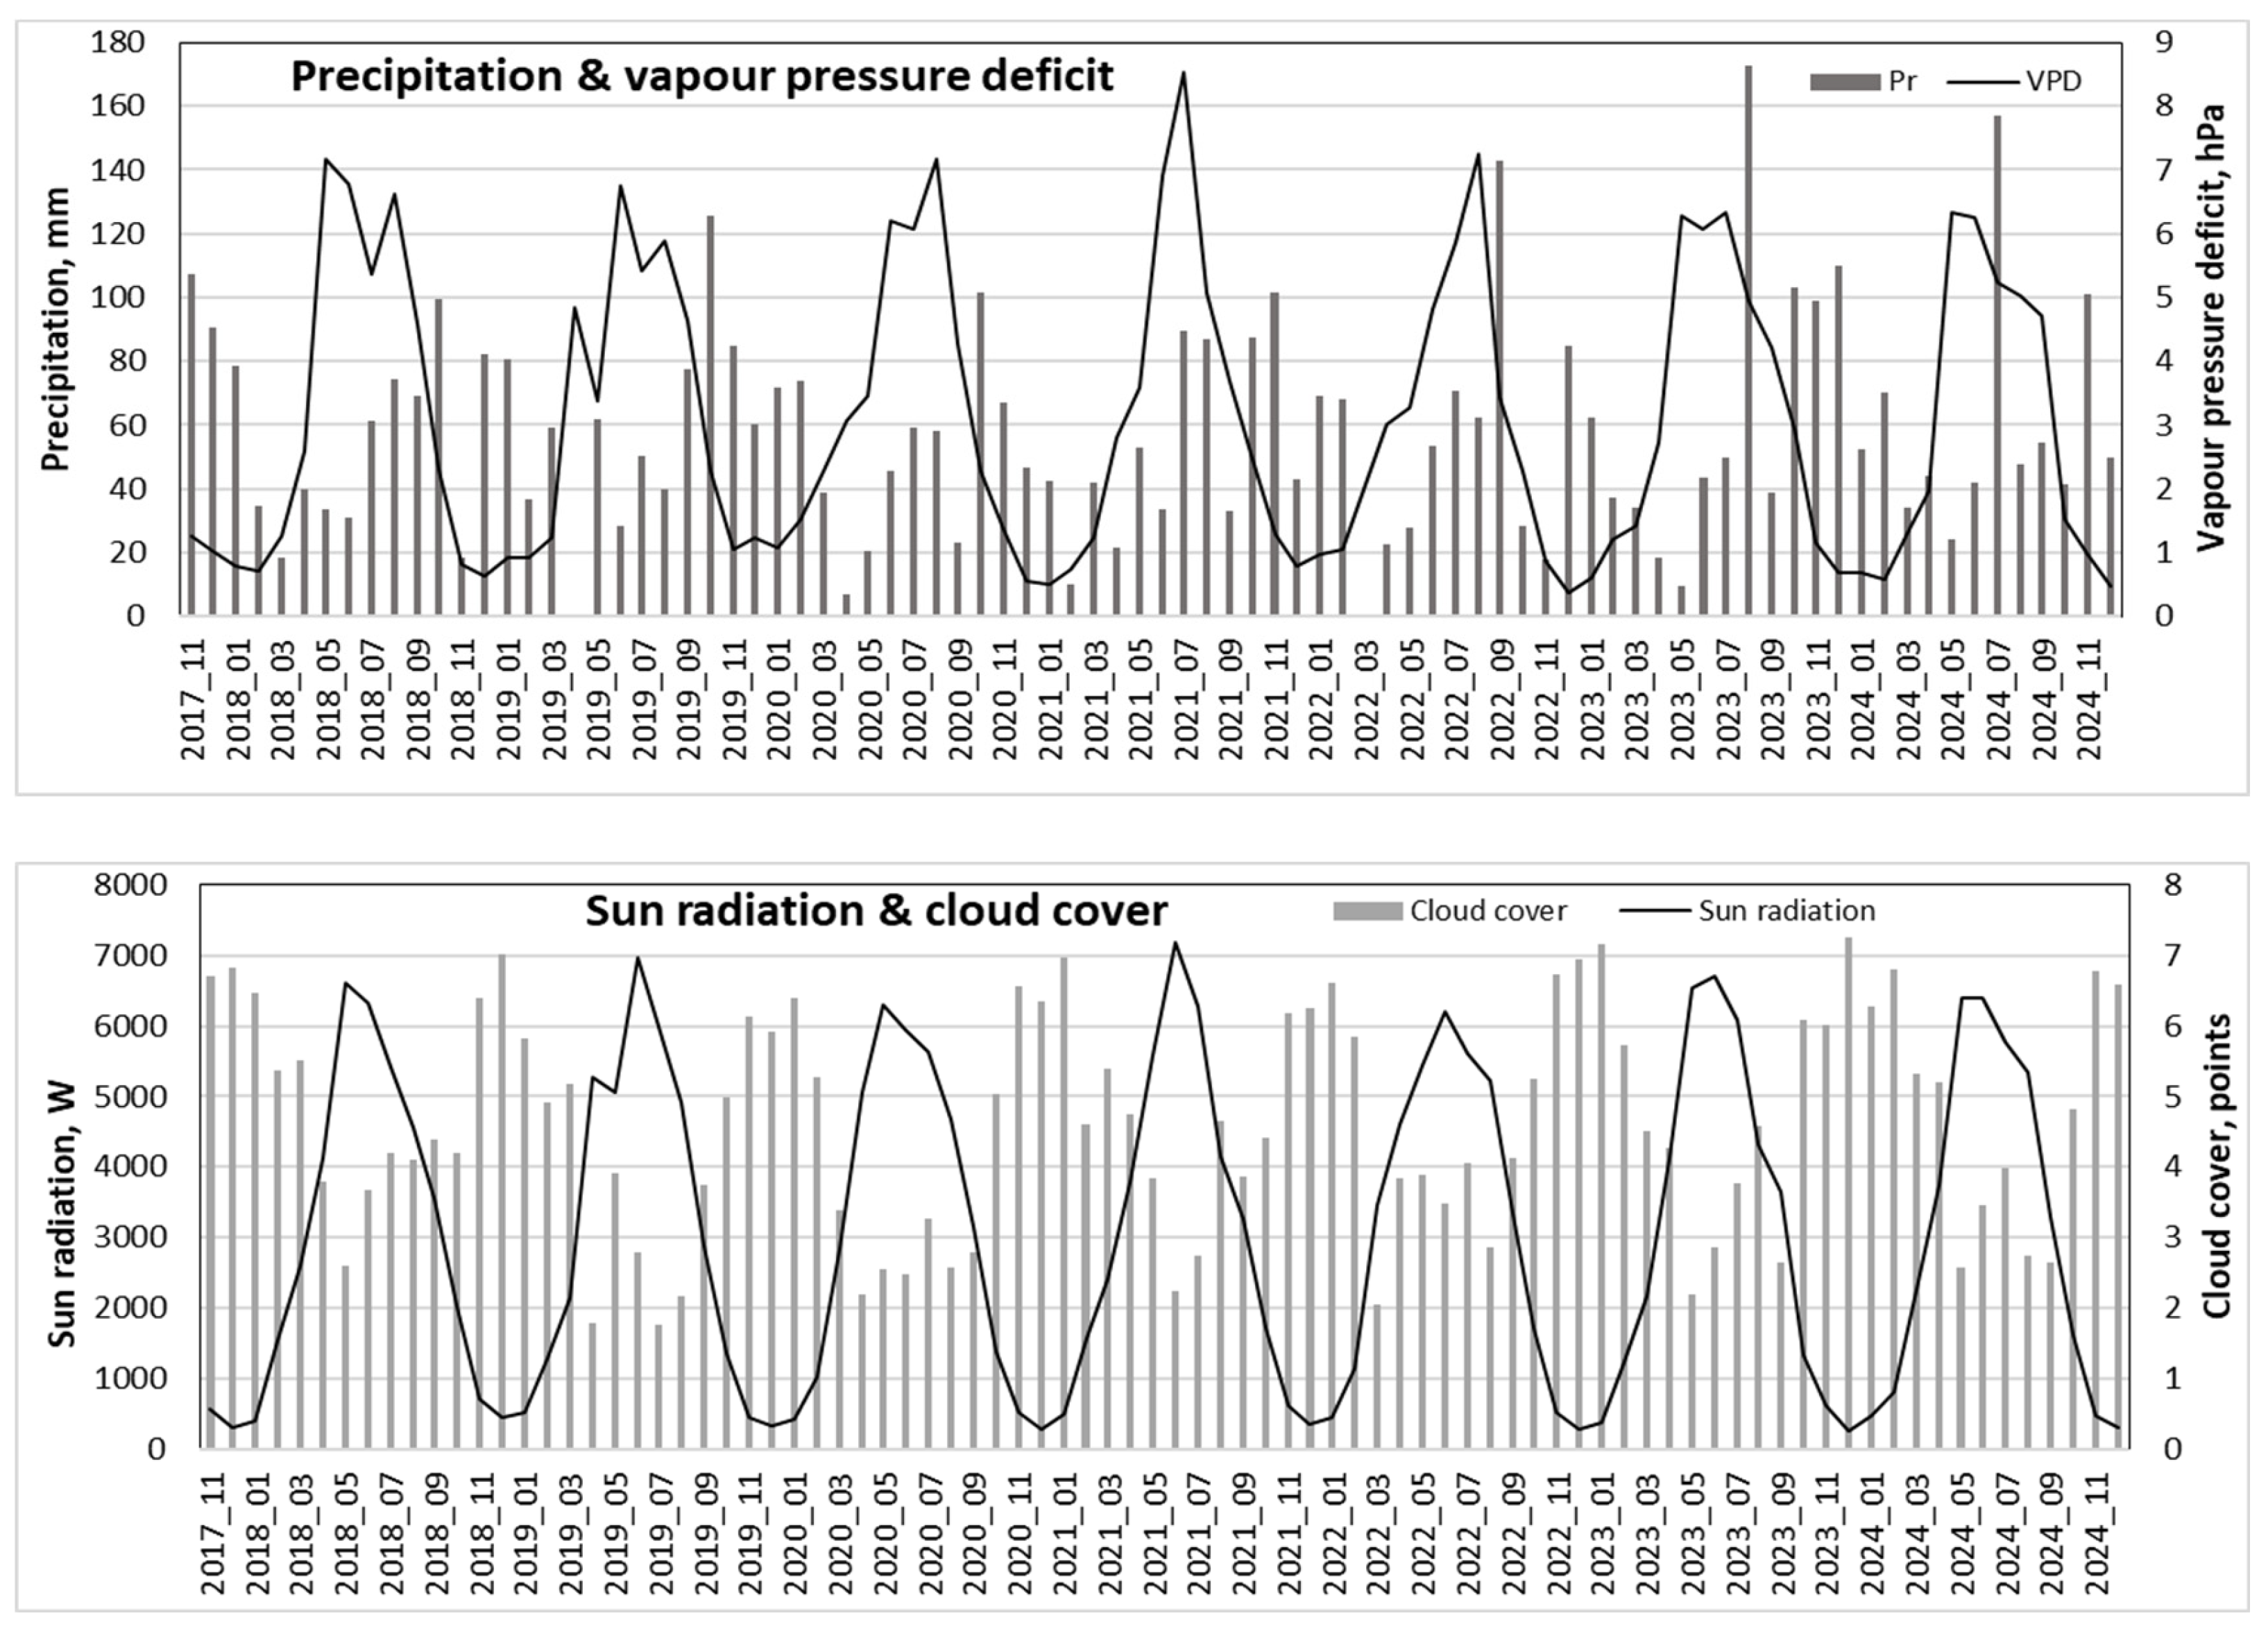
Figure 6.
Seasonal variation in monthly values with standard errors for the main considered meteorological parameters and their minimal (min.) and maximal (max.) mean daily values per month over the 2018-2024 period.
Figure 6.
Seasonal variation in monthly values with standard errors for the main considered meteorological parameters and their minimal (min.) and maximal (max.) mean daily values per month over the 2018-2024 period.
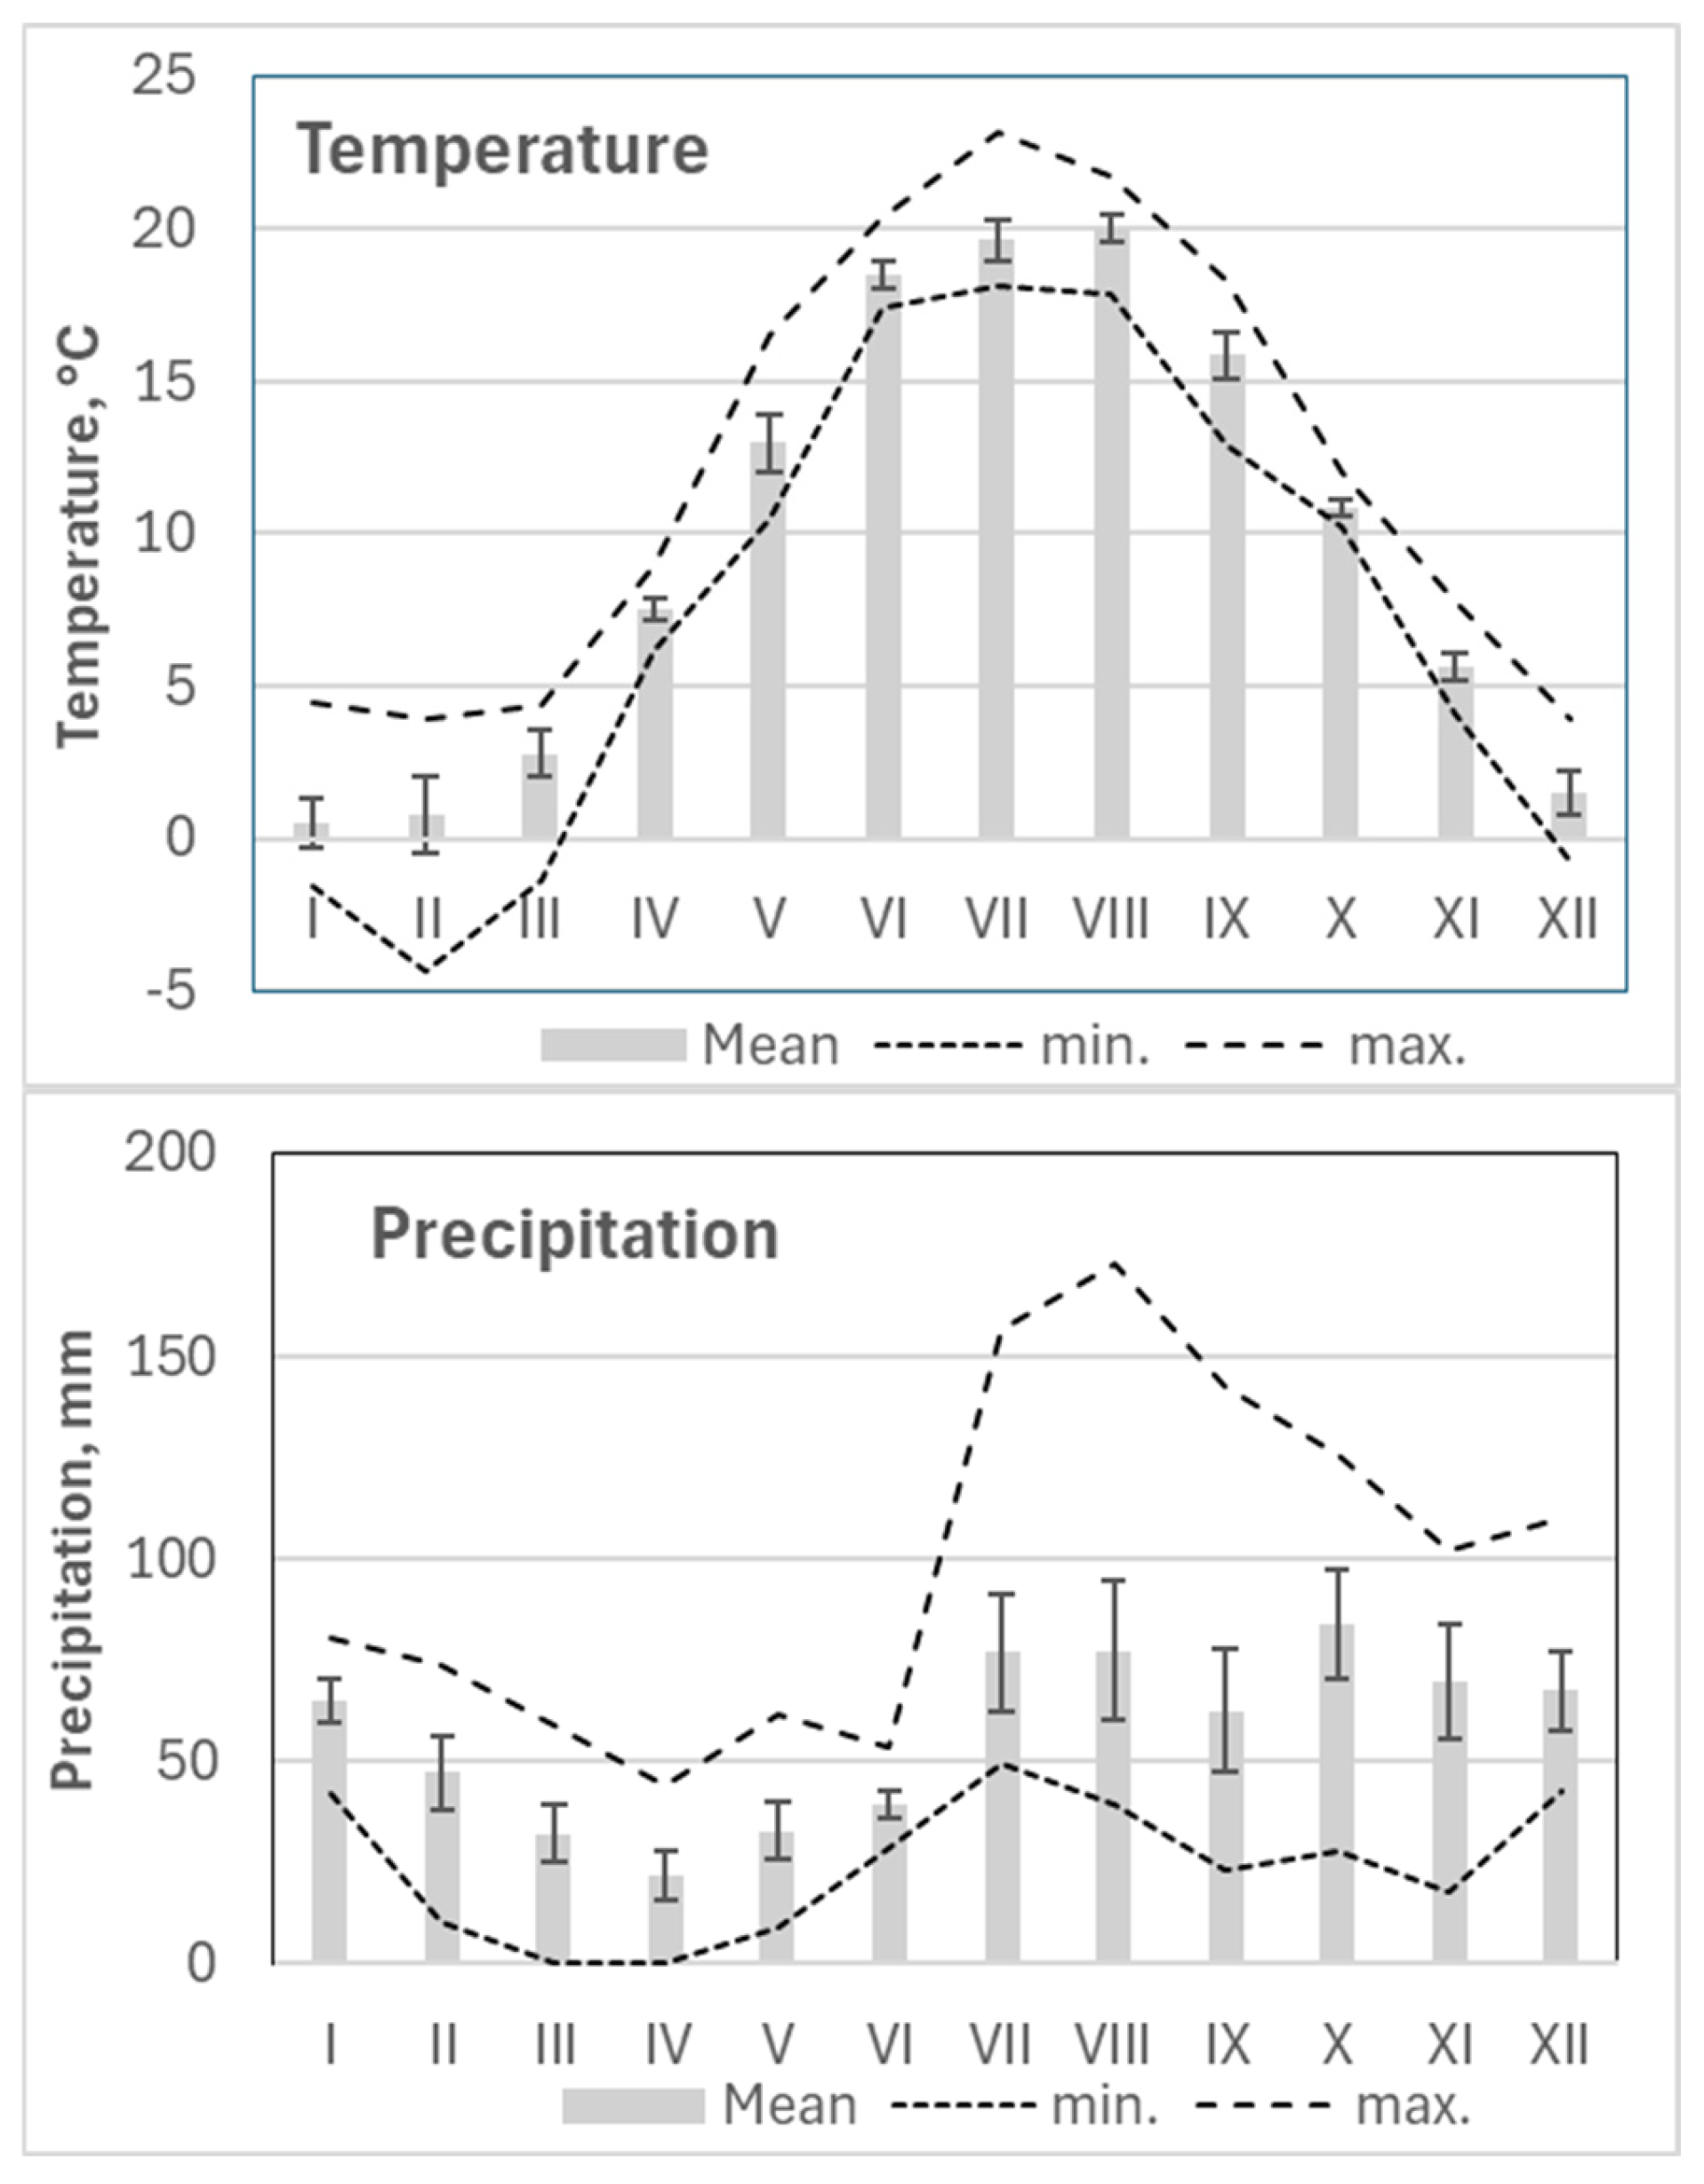
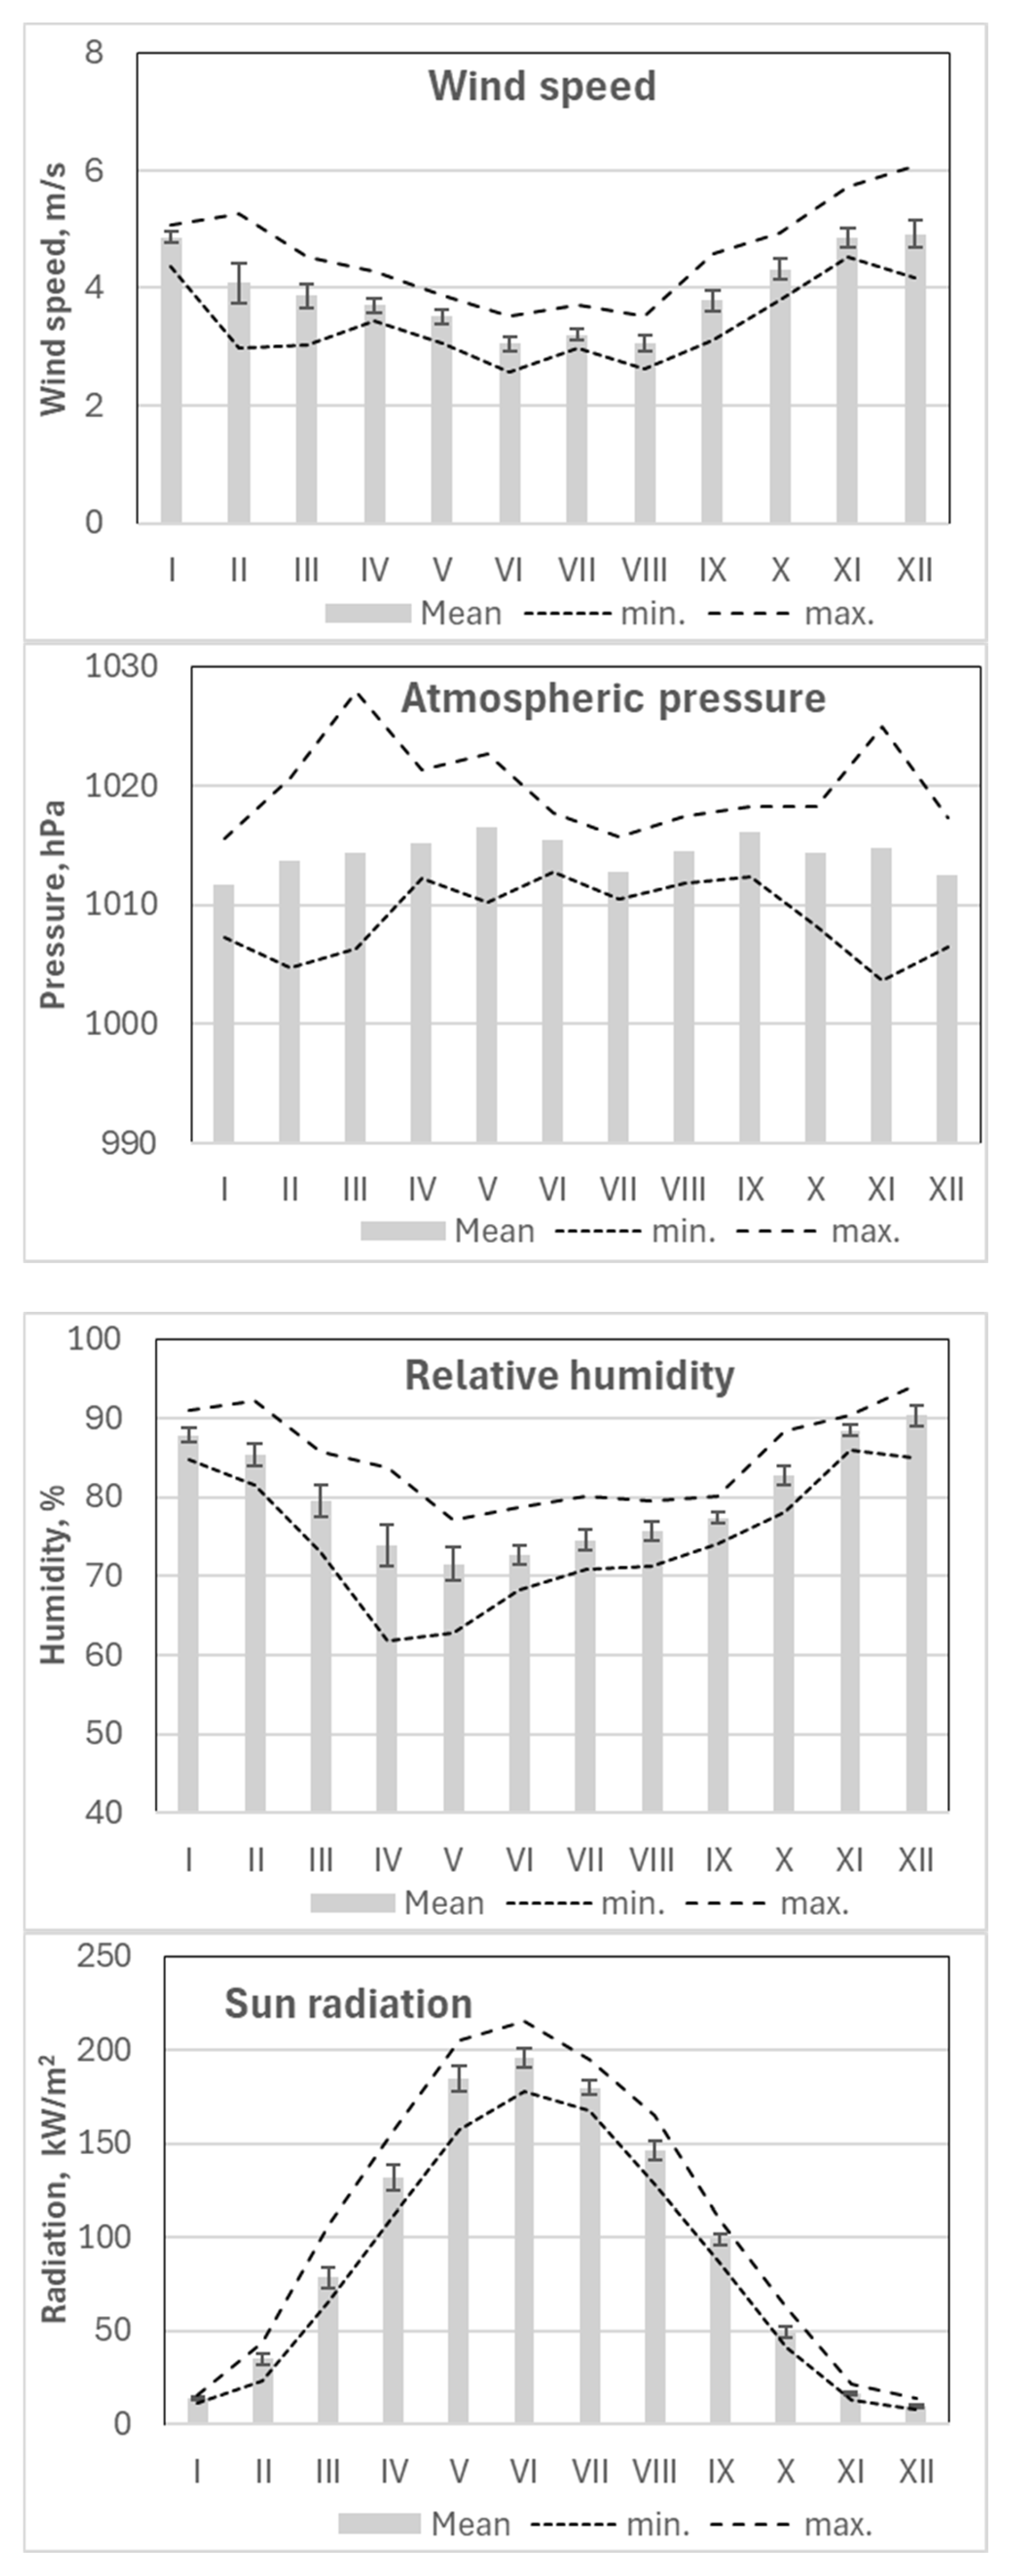
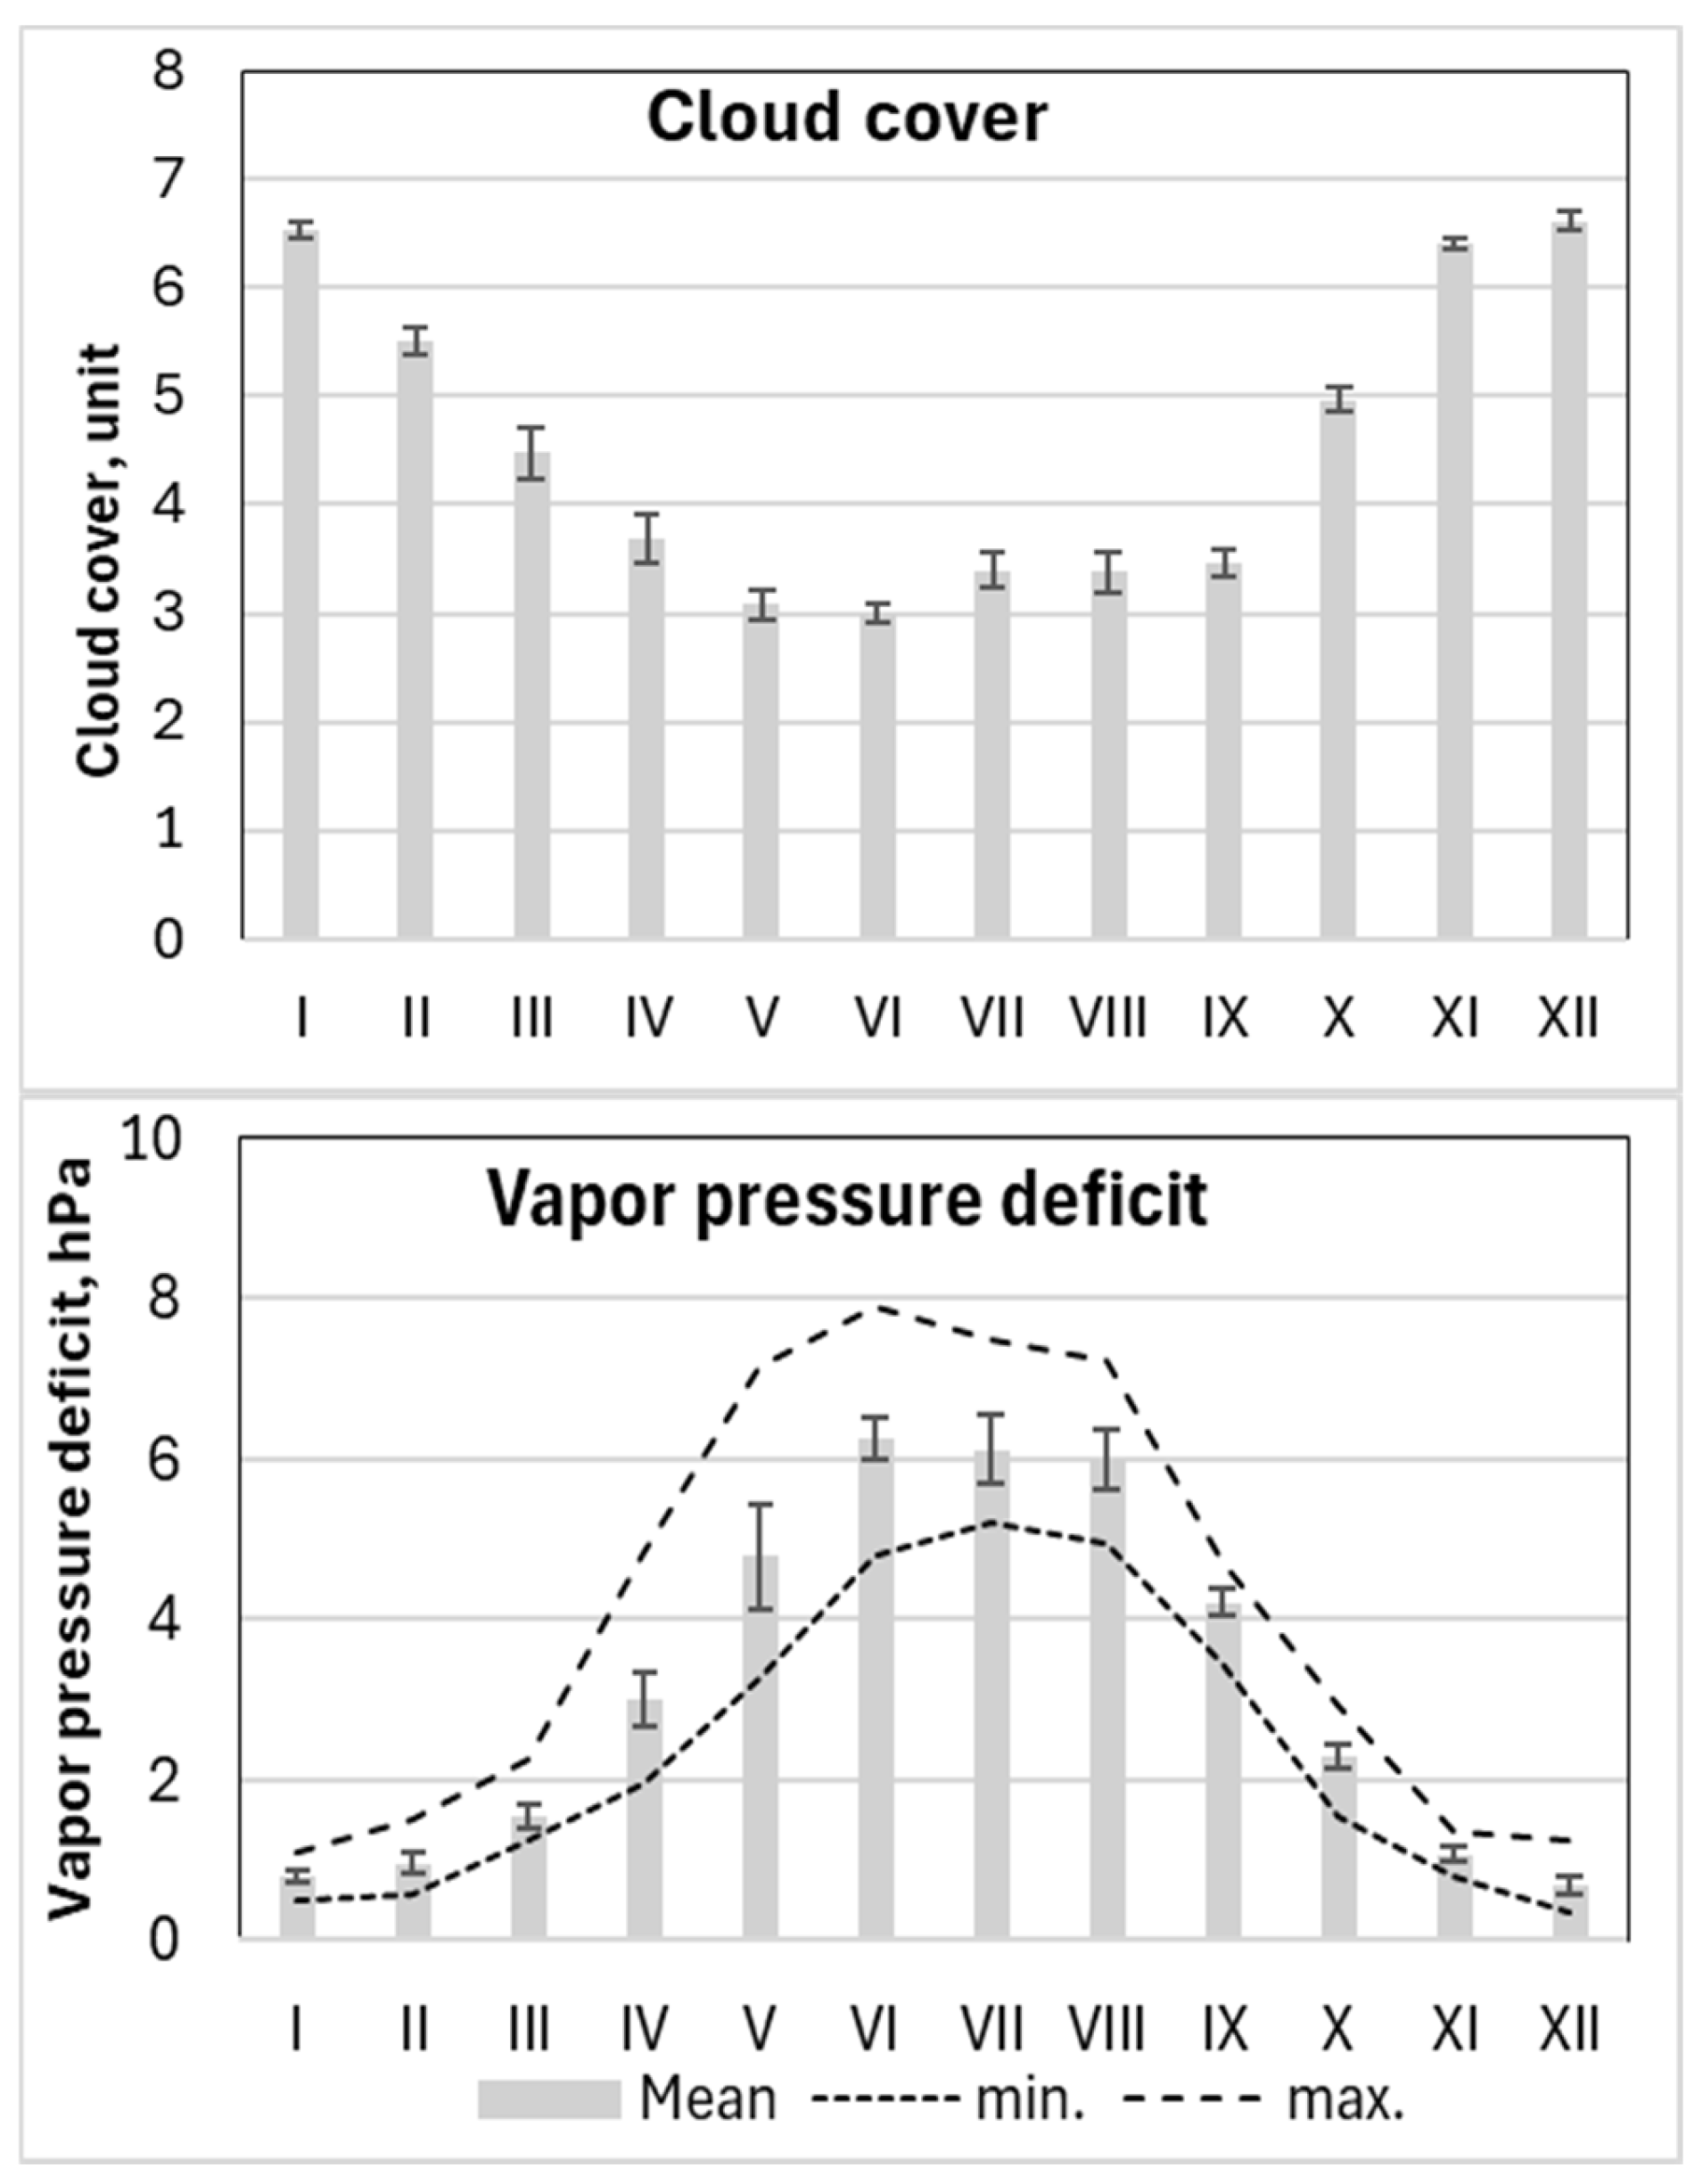
Figure 7.
Mean values of pine seasonal transpiration rate on diurnal scale (2018-2024).
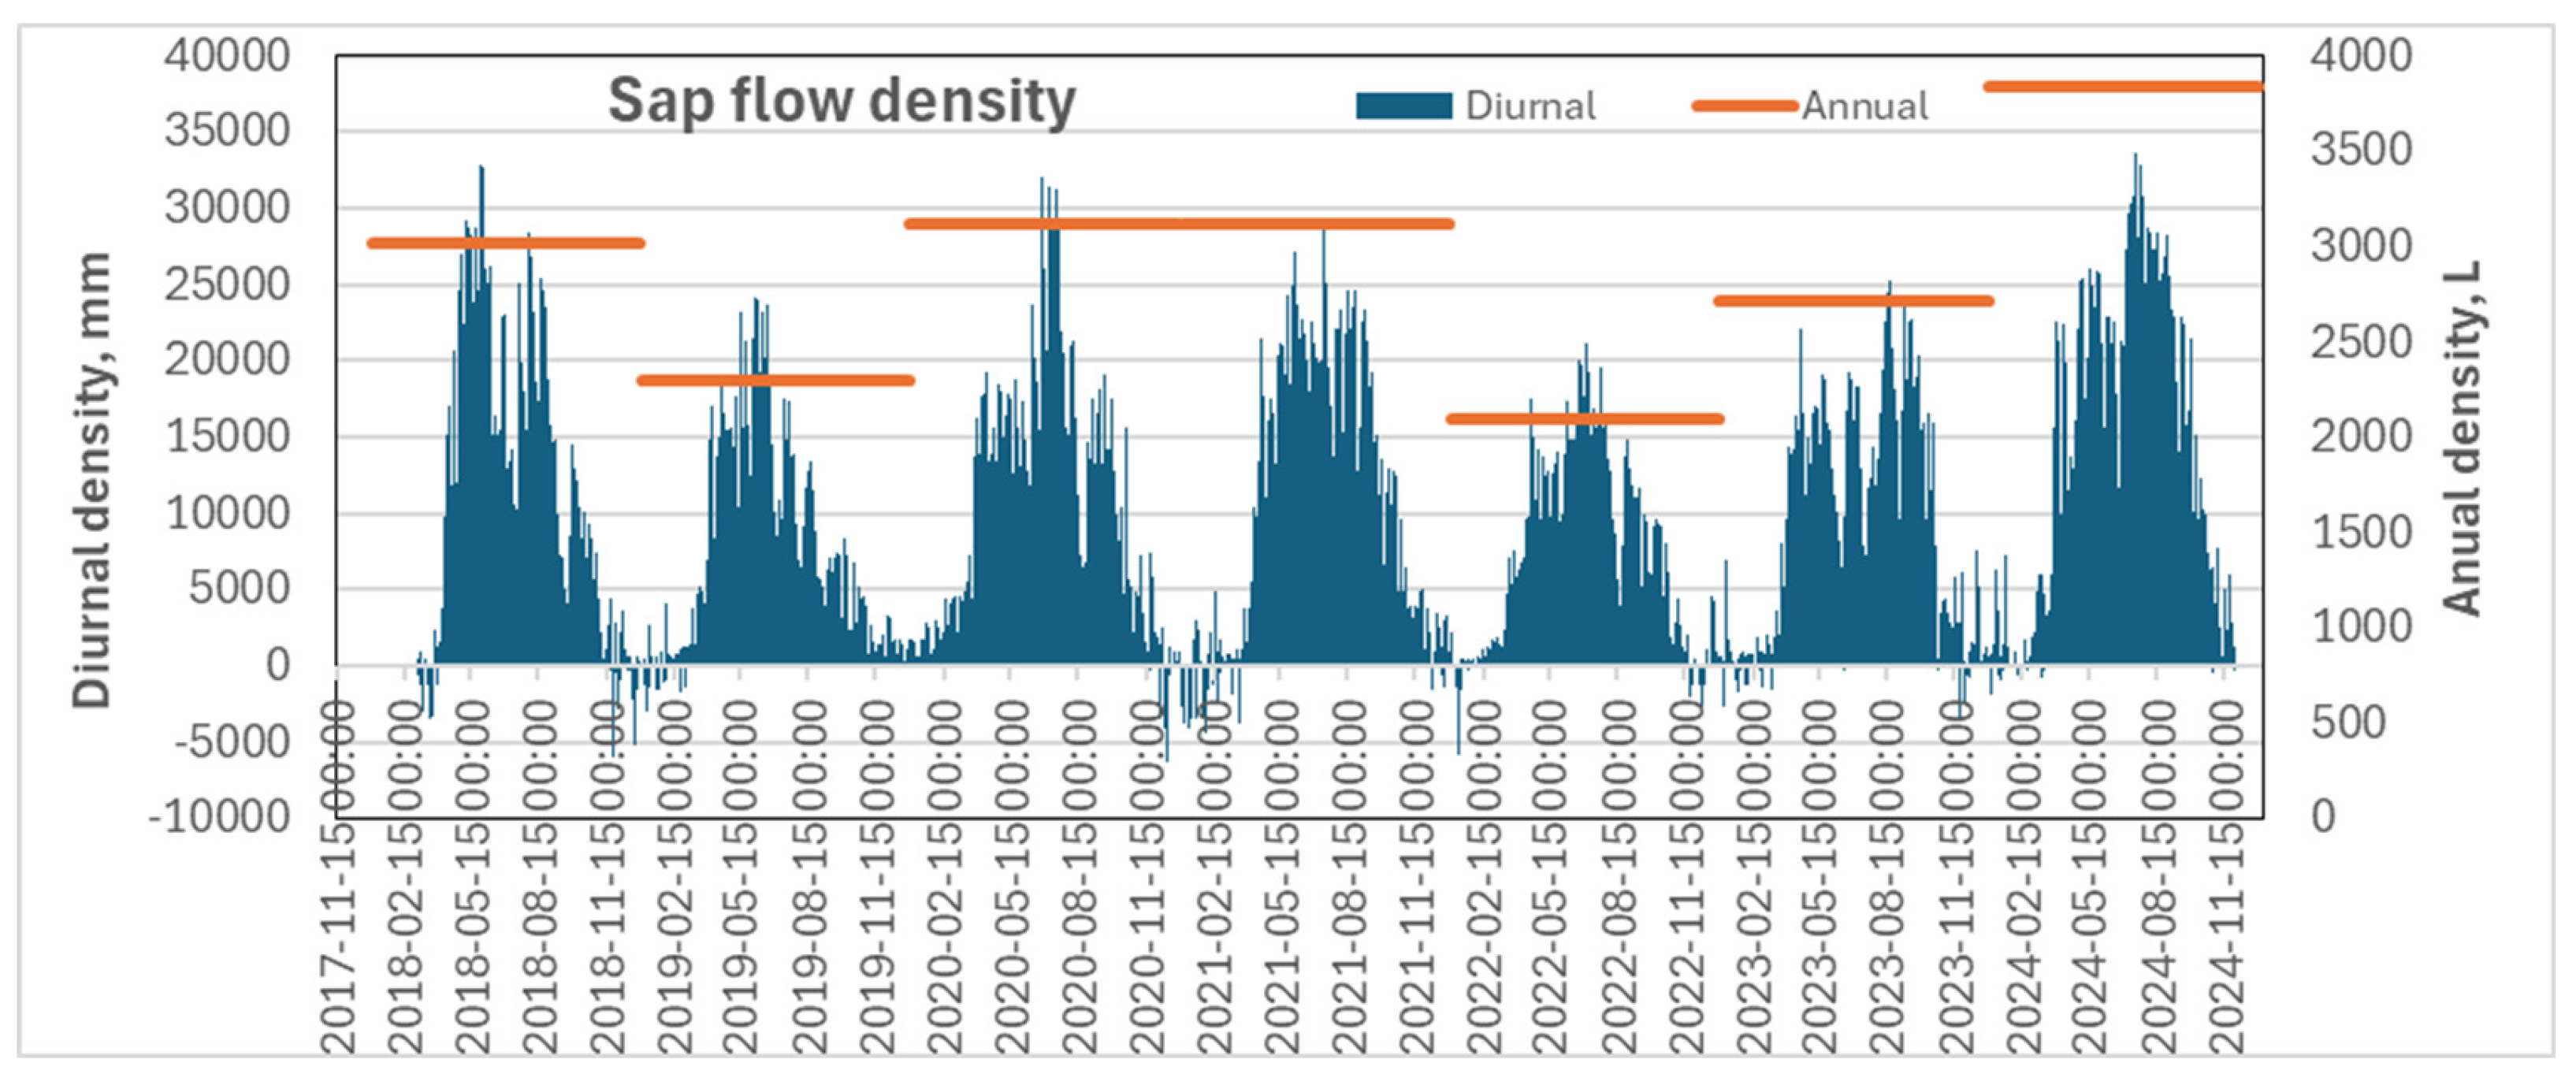
Figure 8.
Mean values with standard errors for pine monthly transpiration rate over the 2018-2024 period.
Figure 8.
Mean values with standard errors for pine monthly transpiration rate over the 2018-2024 period.
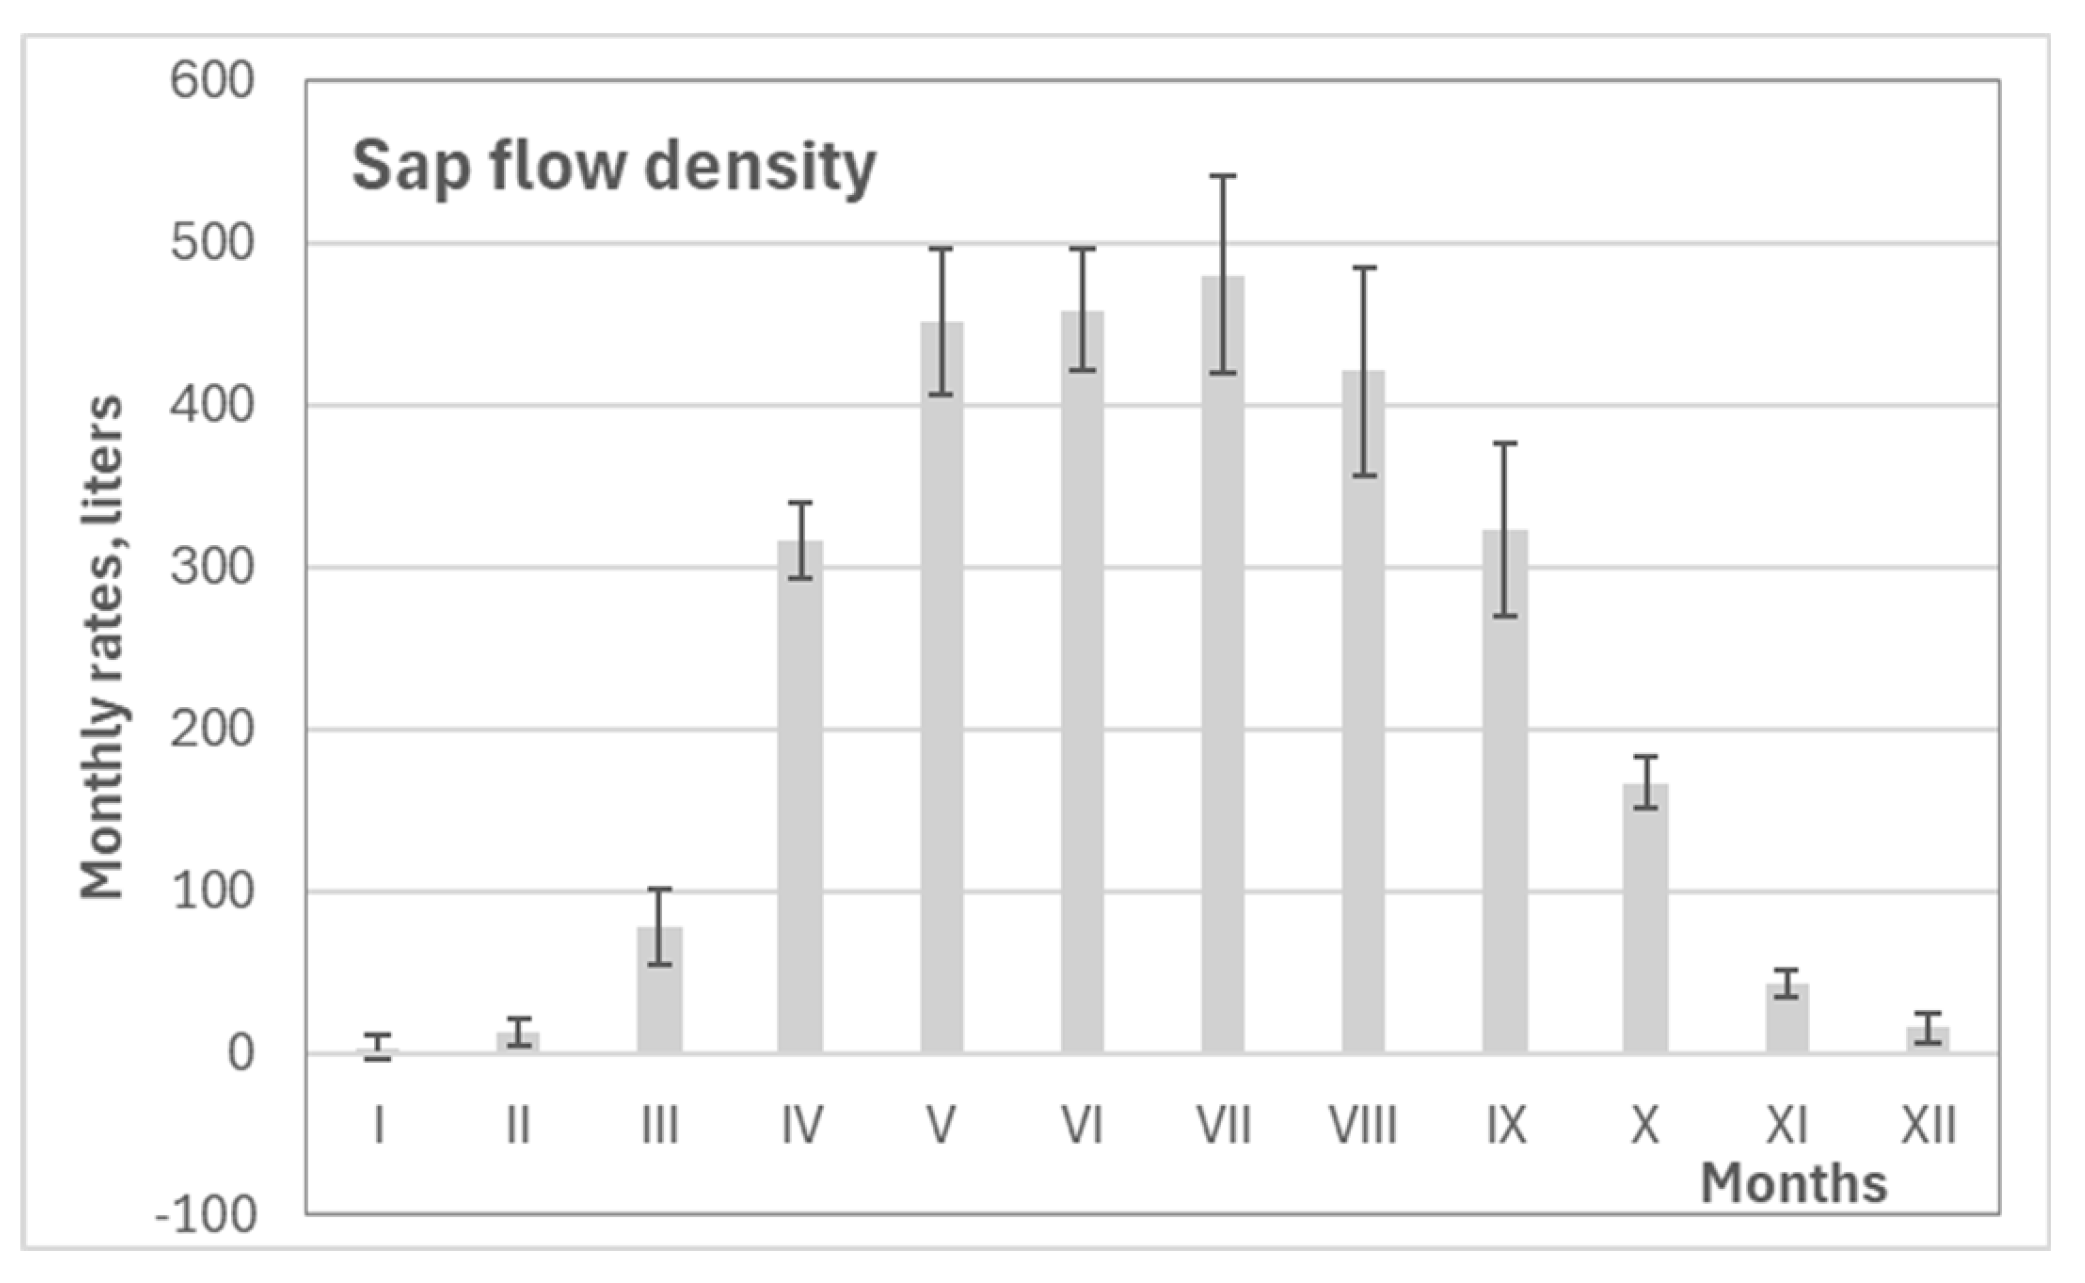
Figure 9.
Pine transpiration rates in different periods during 2018-2024 and their mean values.
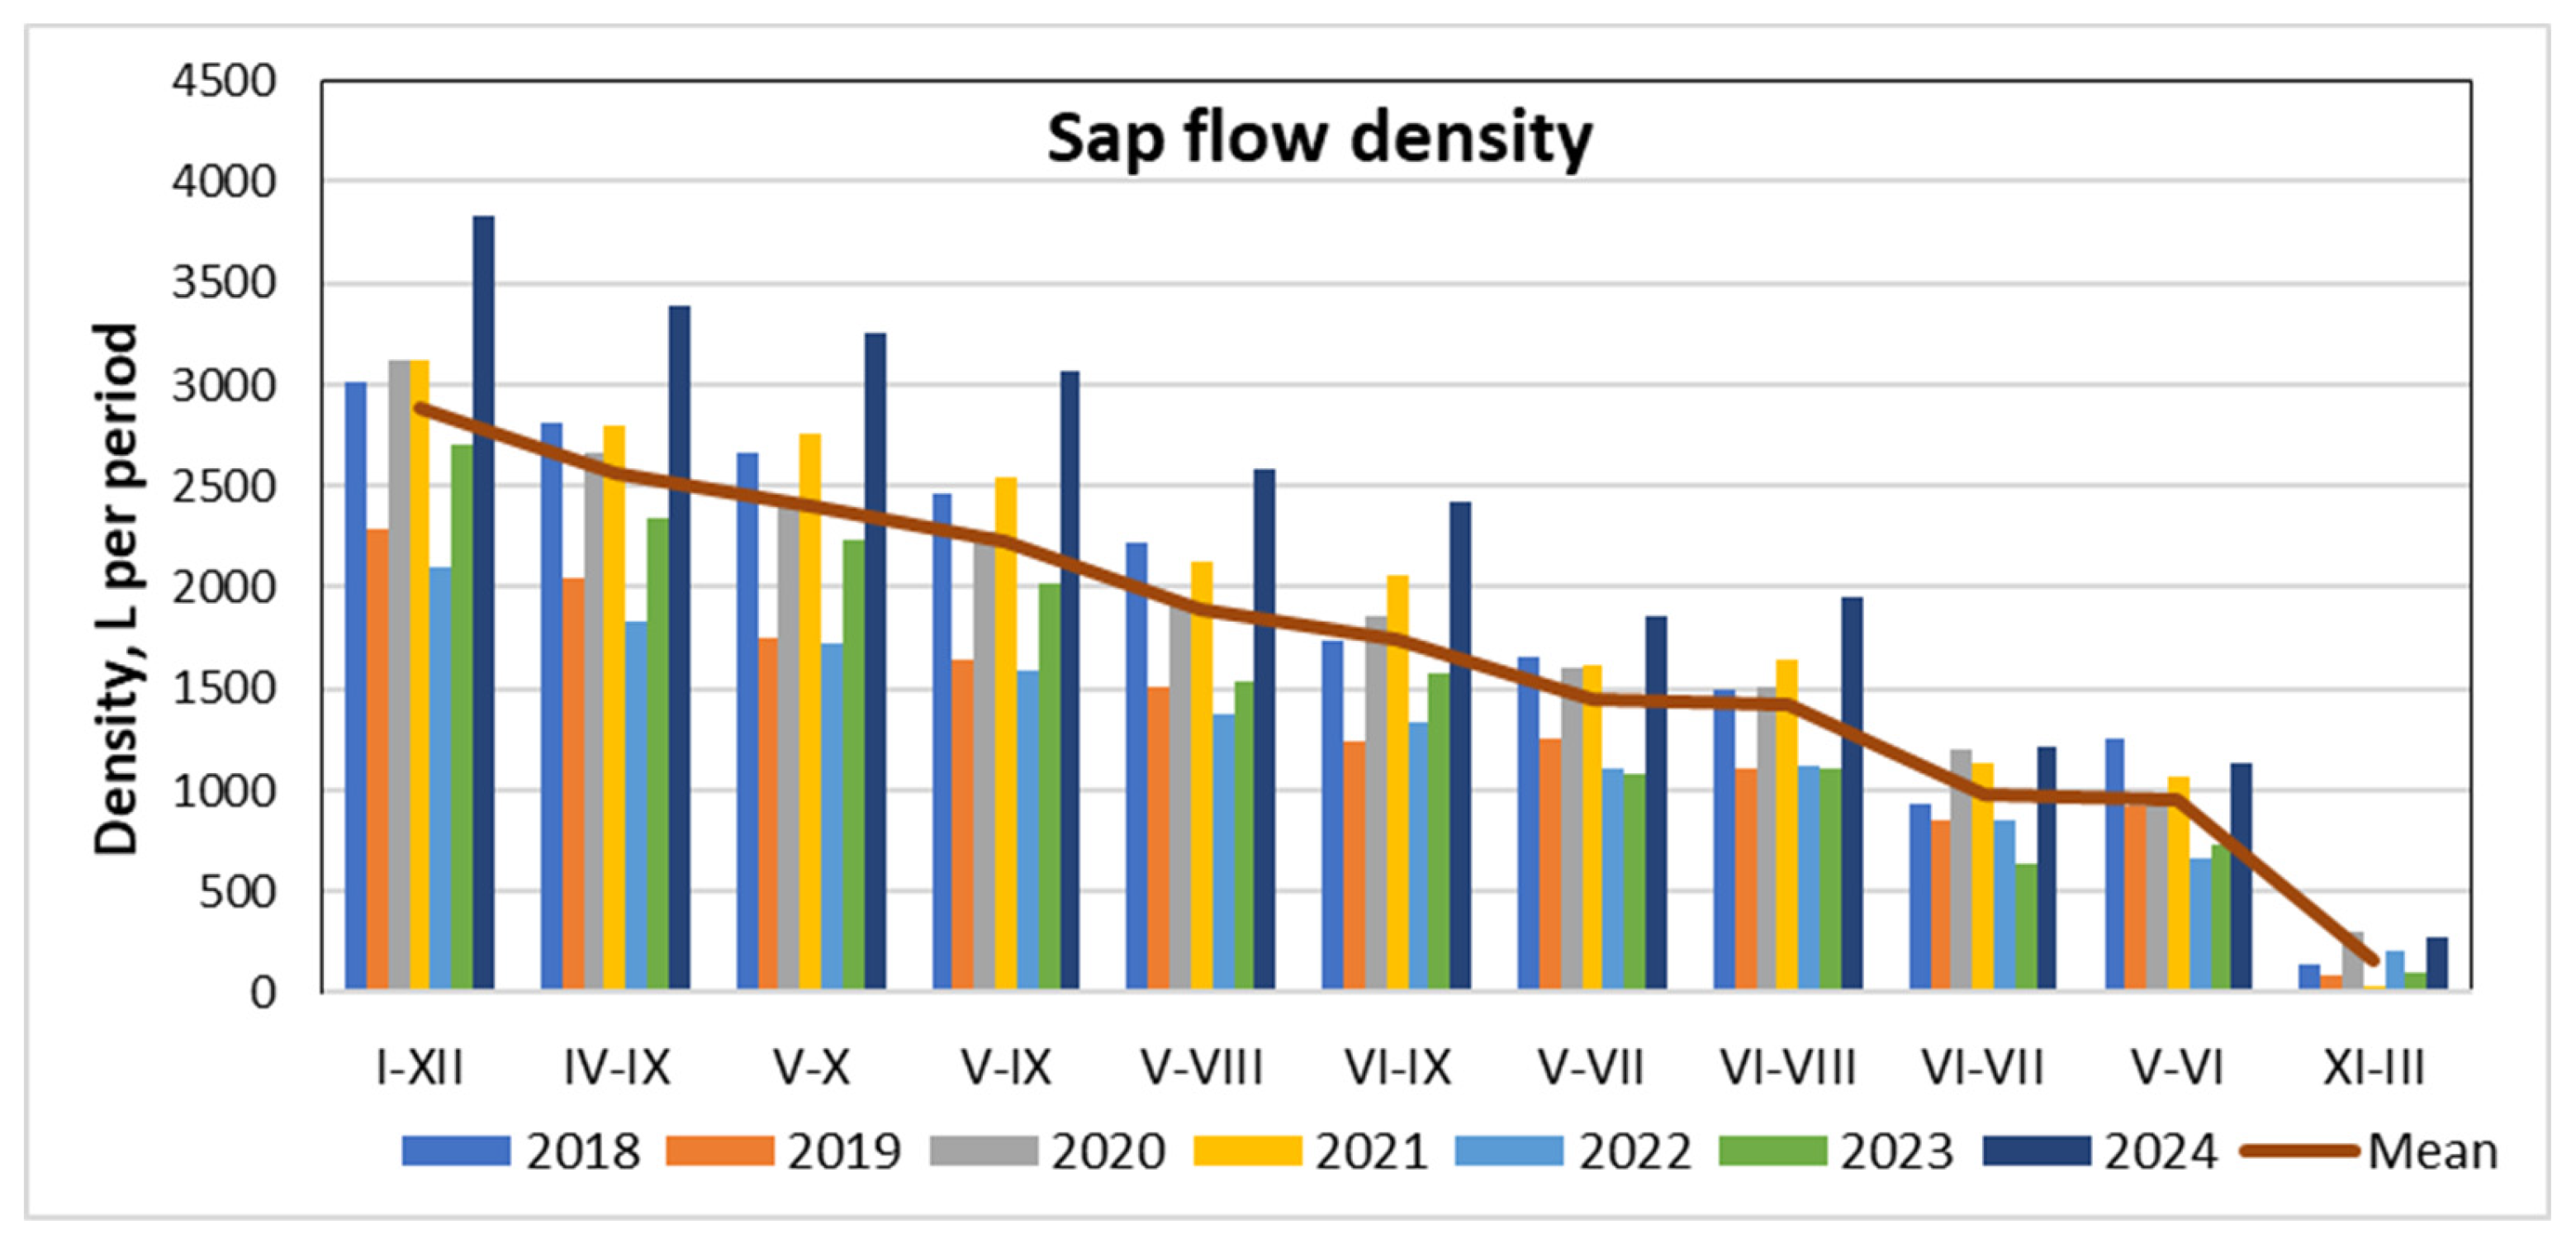
Figure 10.
Formation of pine stem circumference over 2018-2024 period.
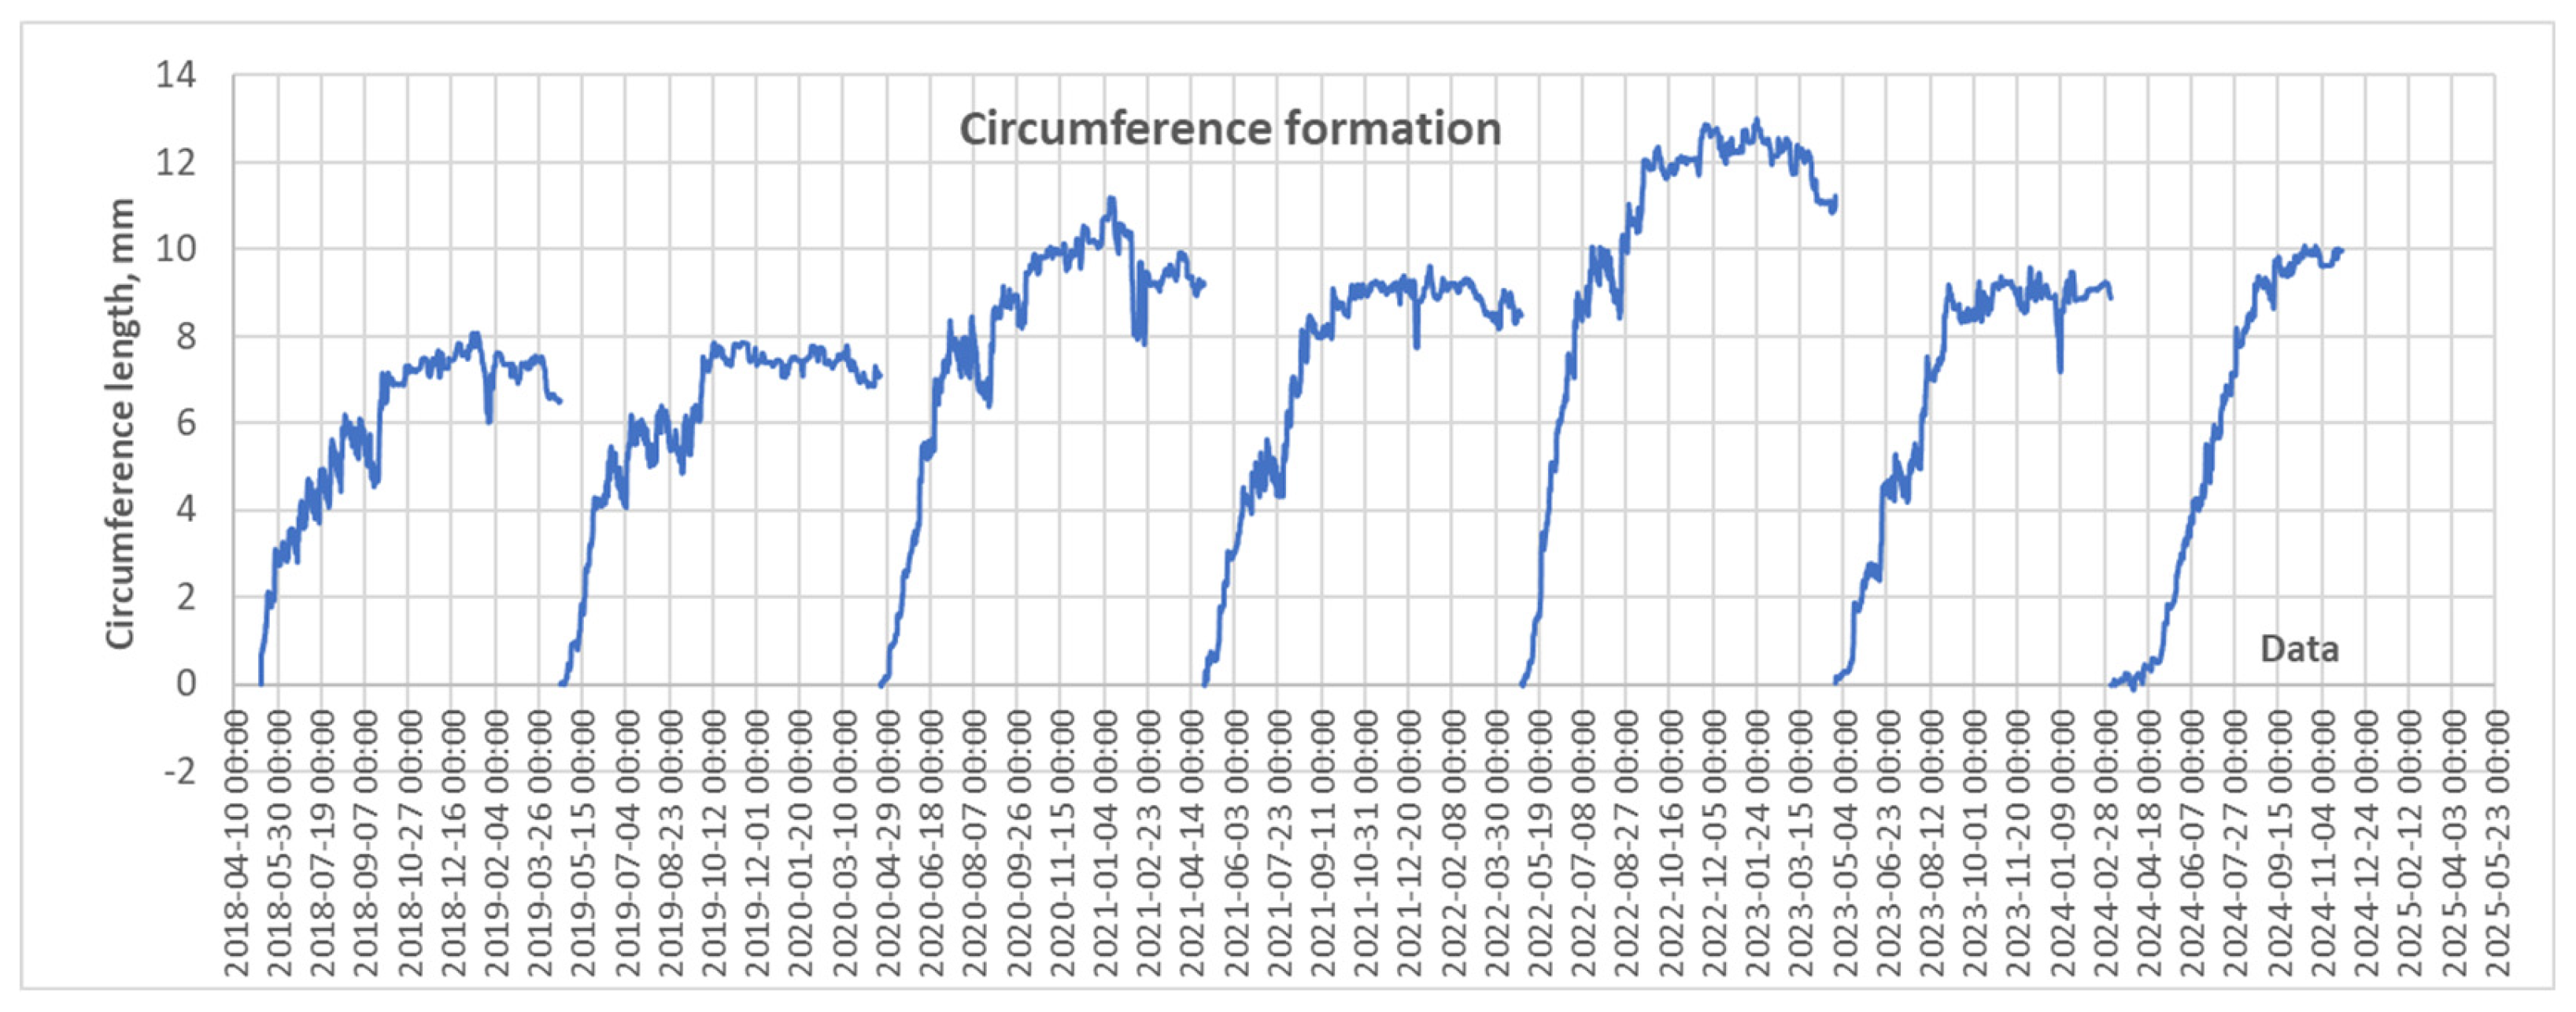
Figure 11.
Mean values of monthly changes in pine stem volume with their standard errors over the 2018-2024 period.
Figure 11.
Mean values of monthly changes in pine stem volume with their standard errors over the 2018-2024 period.
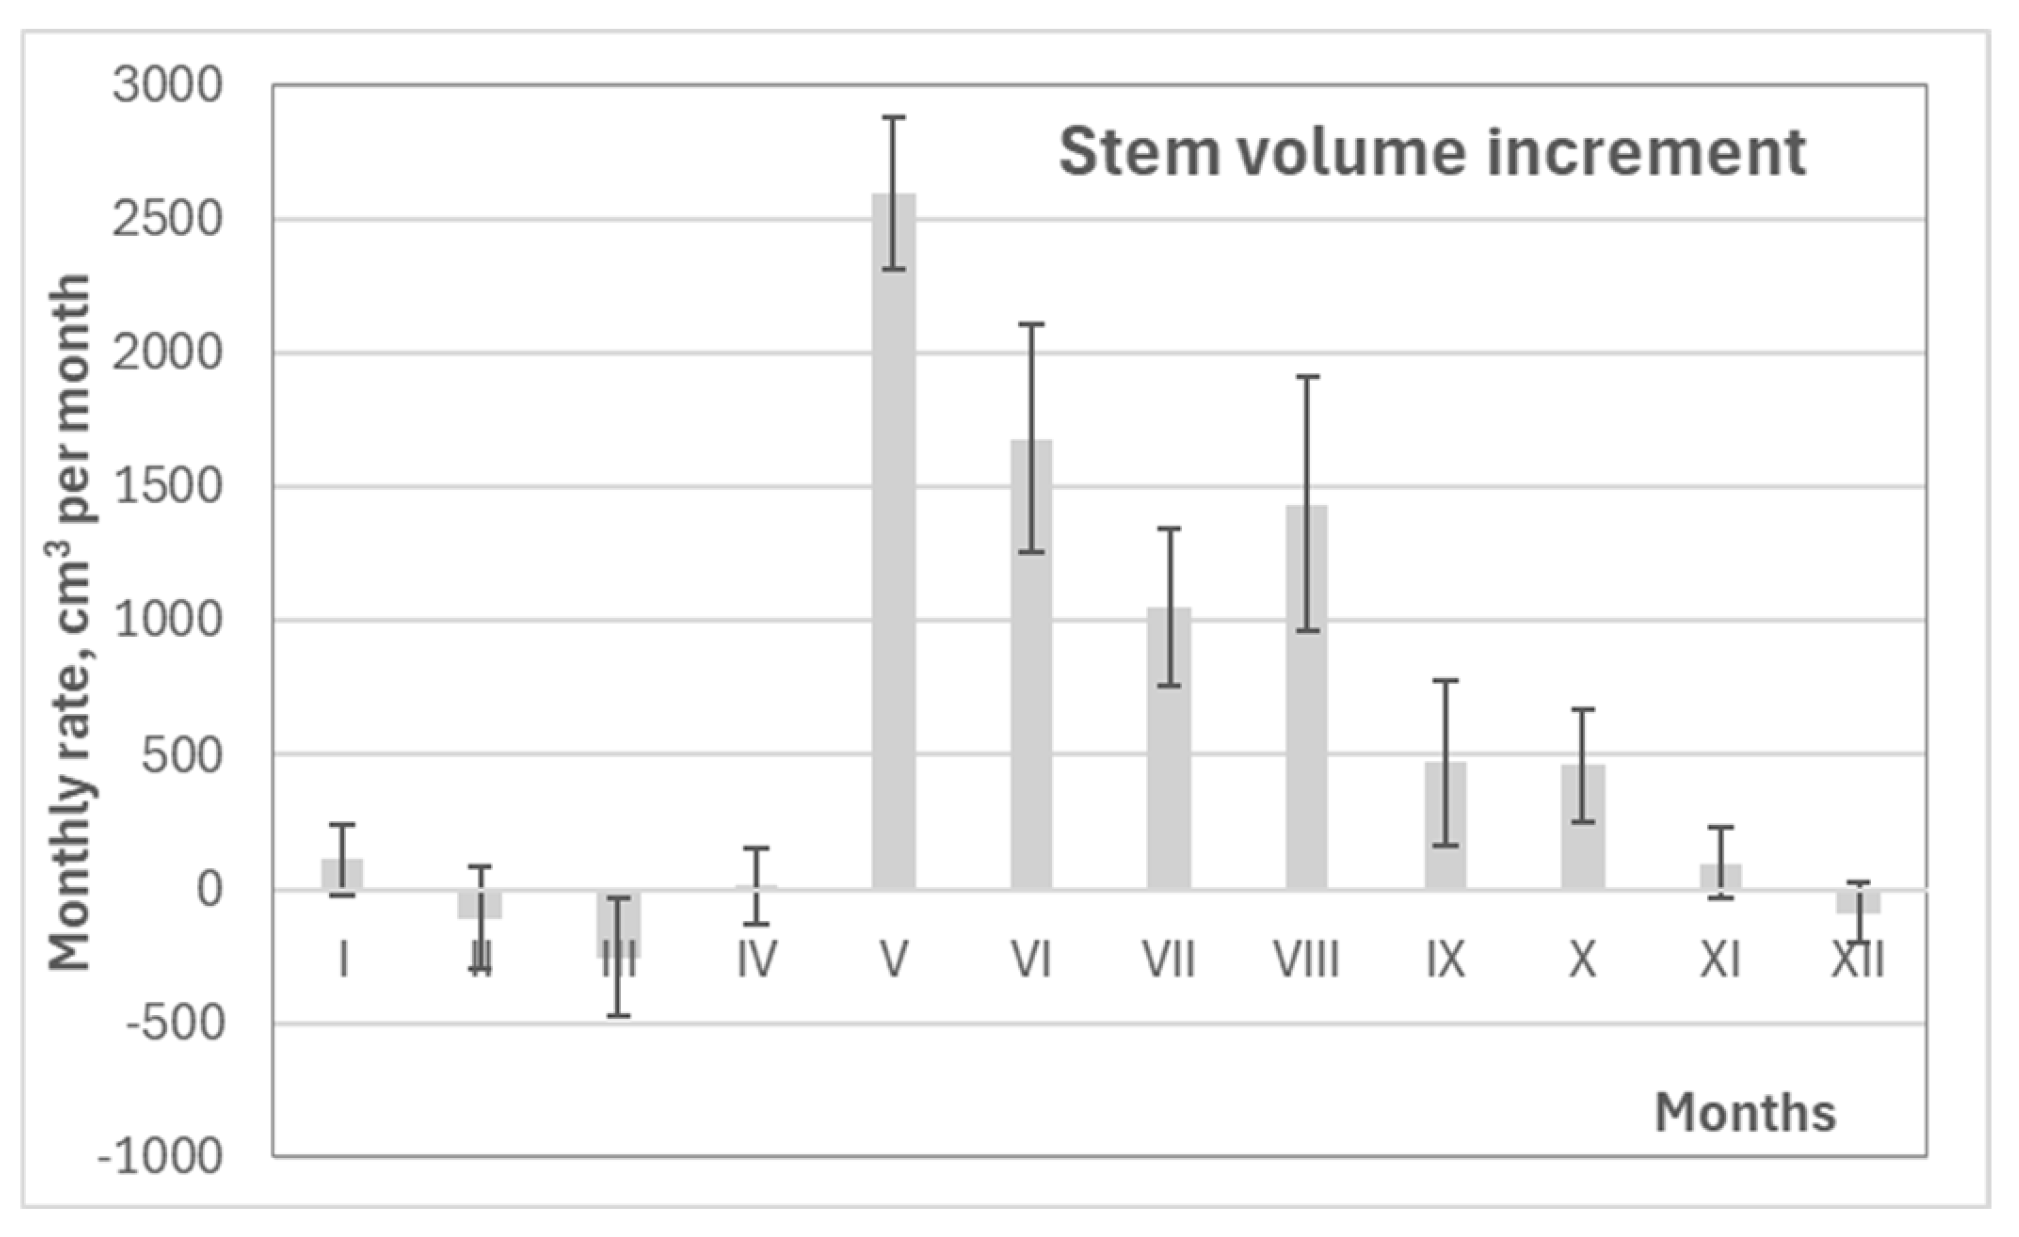
Figure 12.
Variation in pine growth increment during different periods over 2018 – 2024 period.
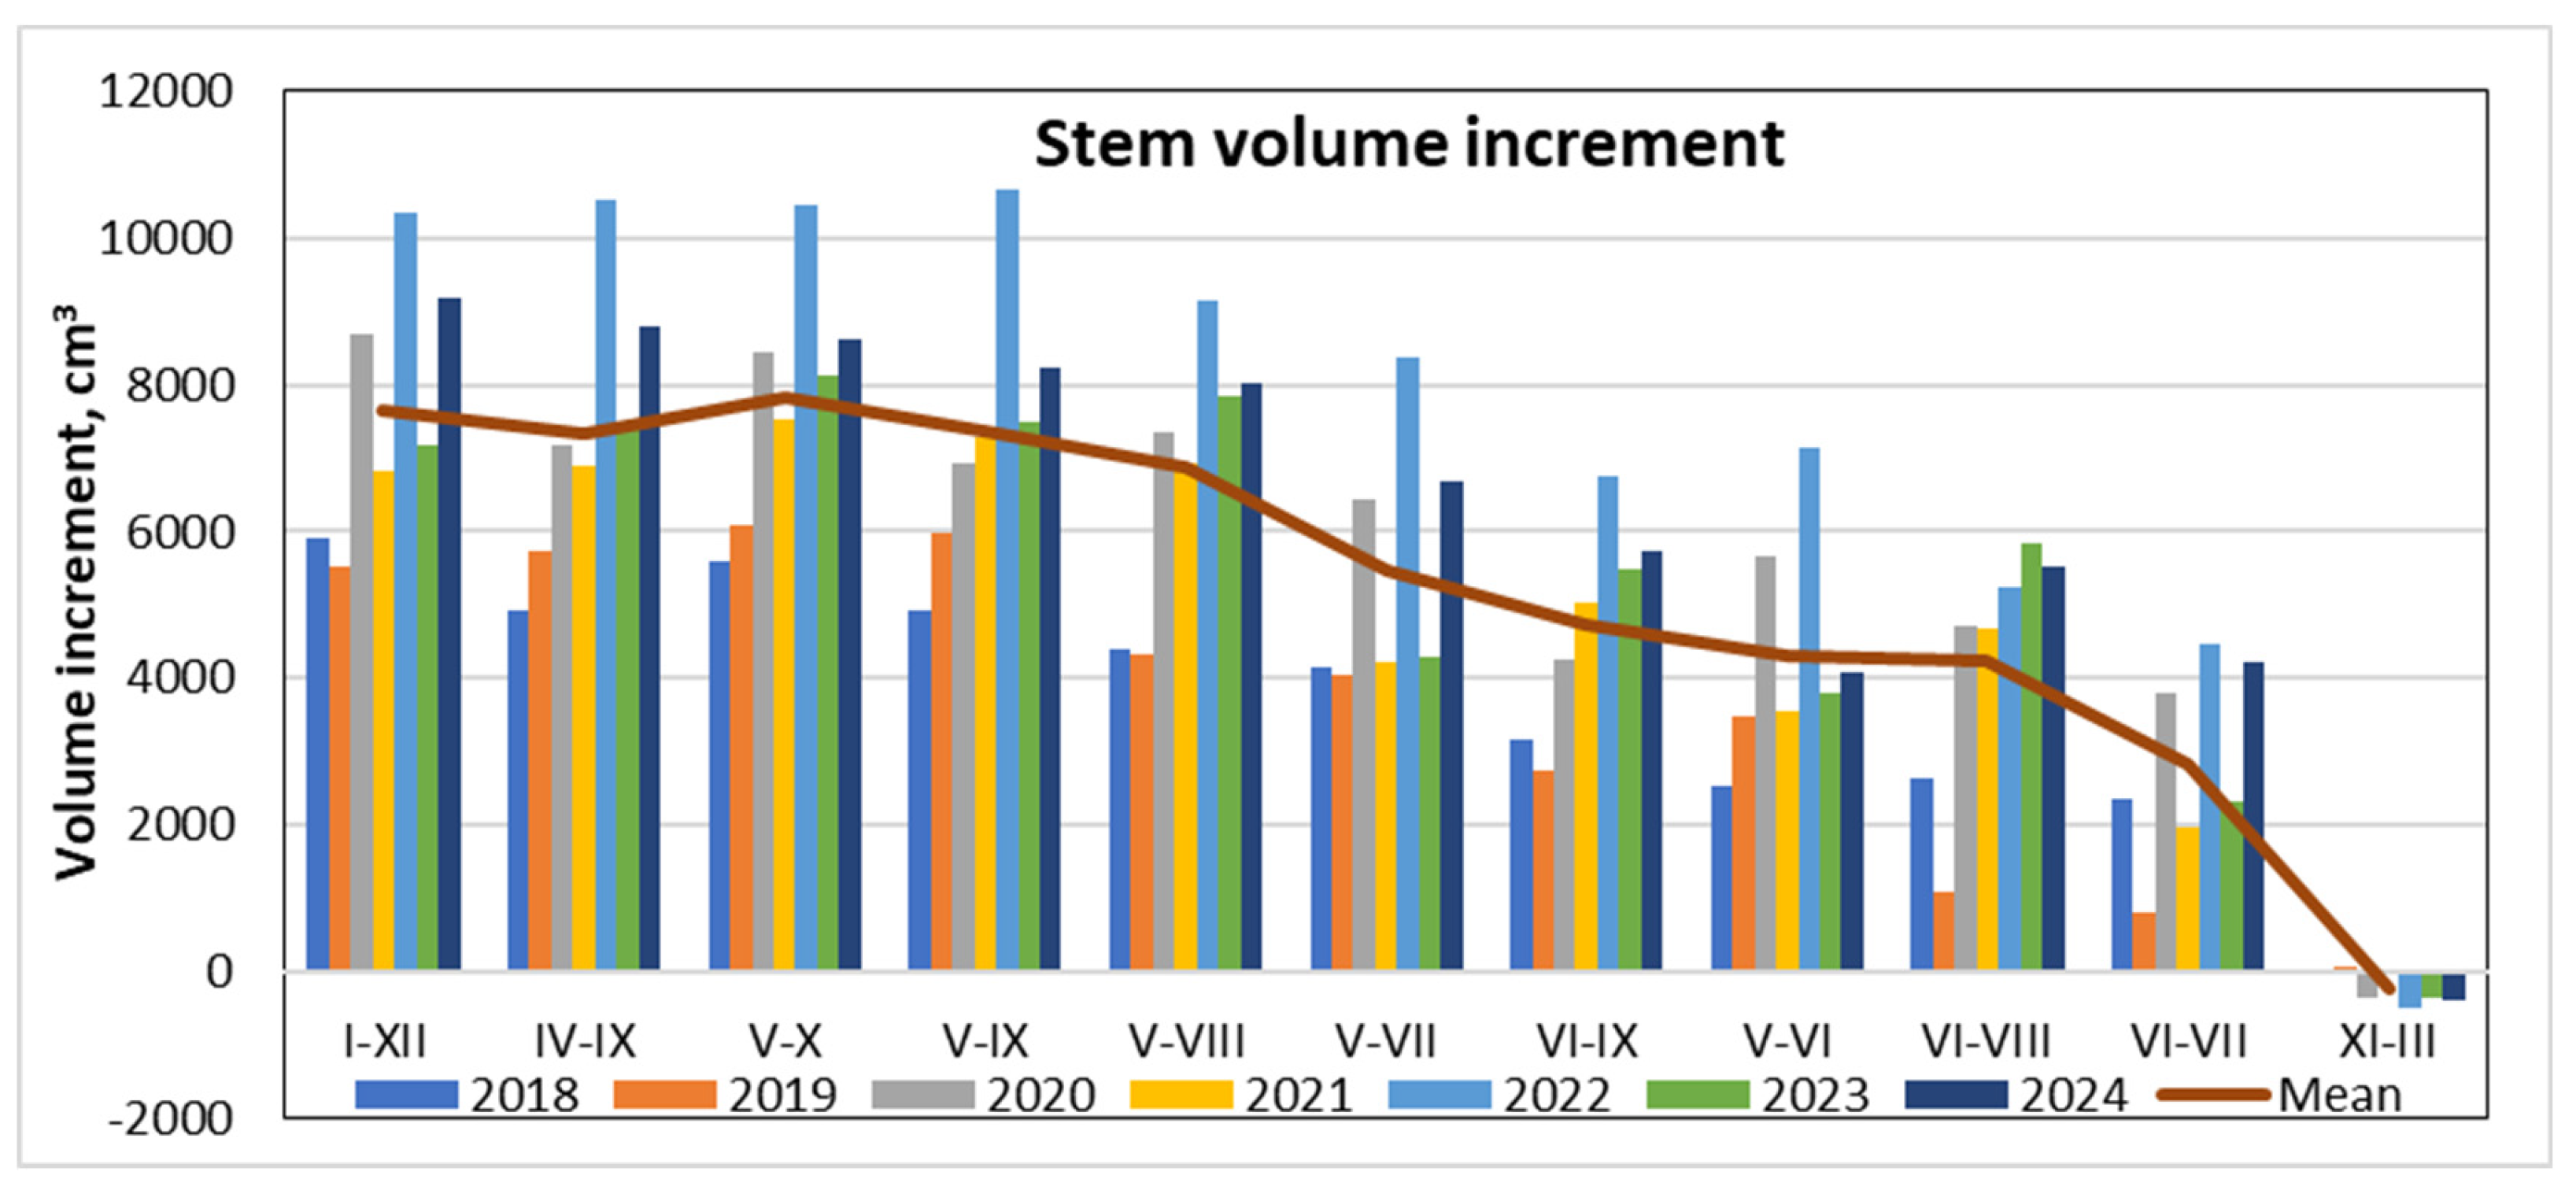
Figure 13.
Variation in water use efficiency from 2018 to 2024.
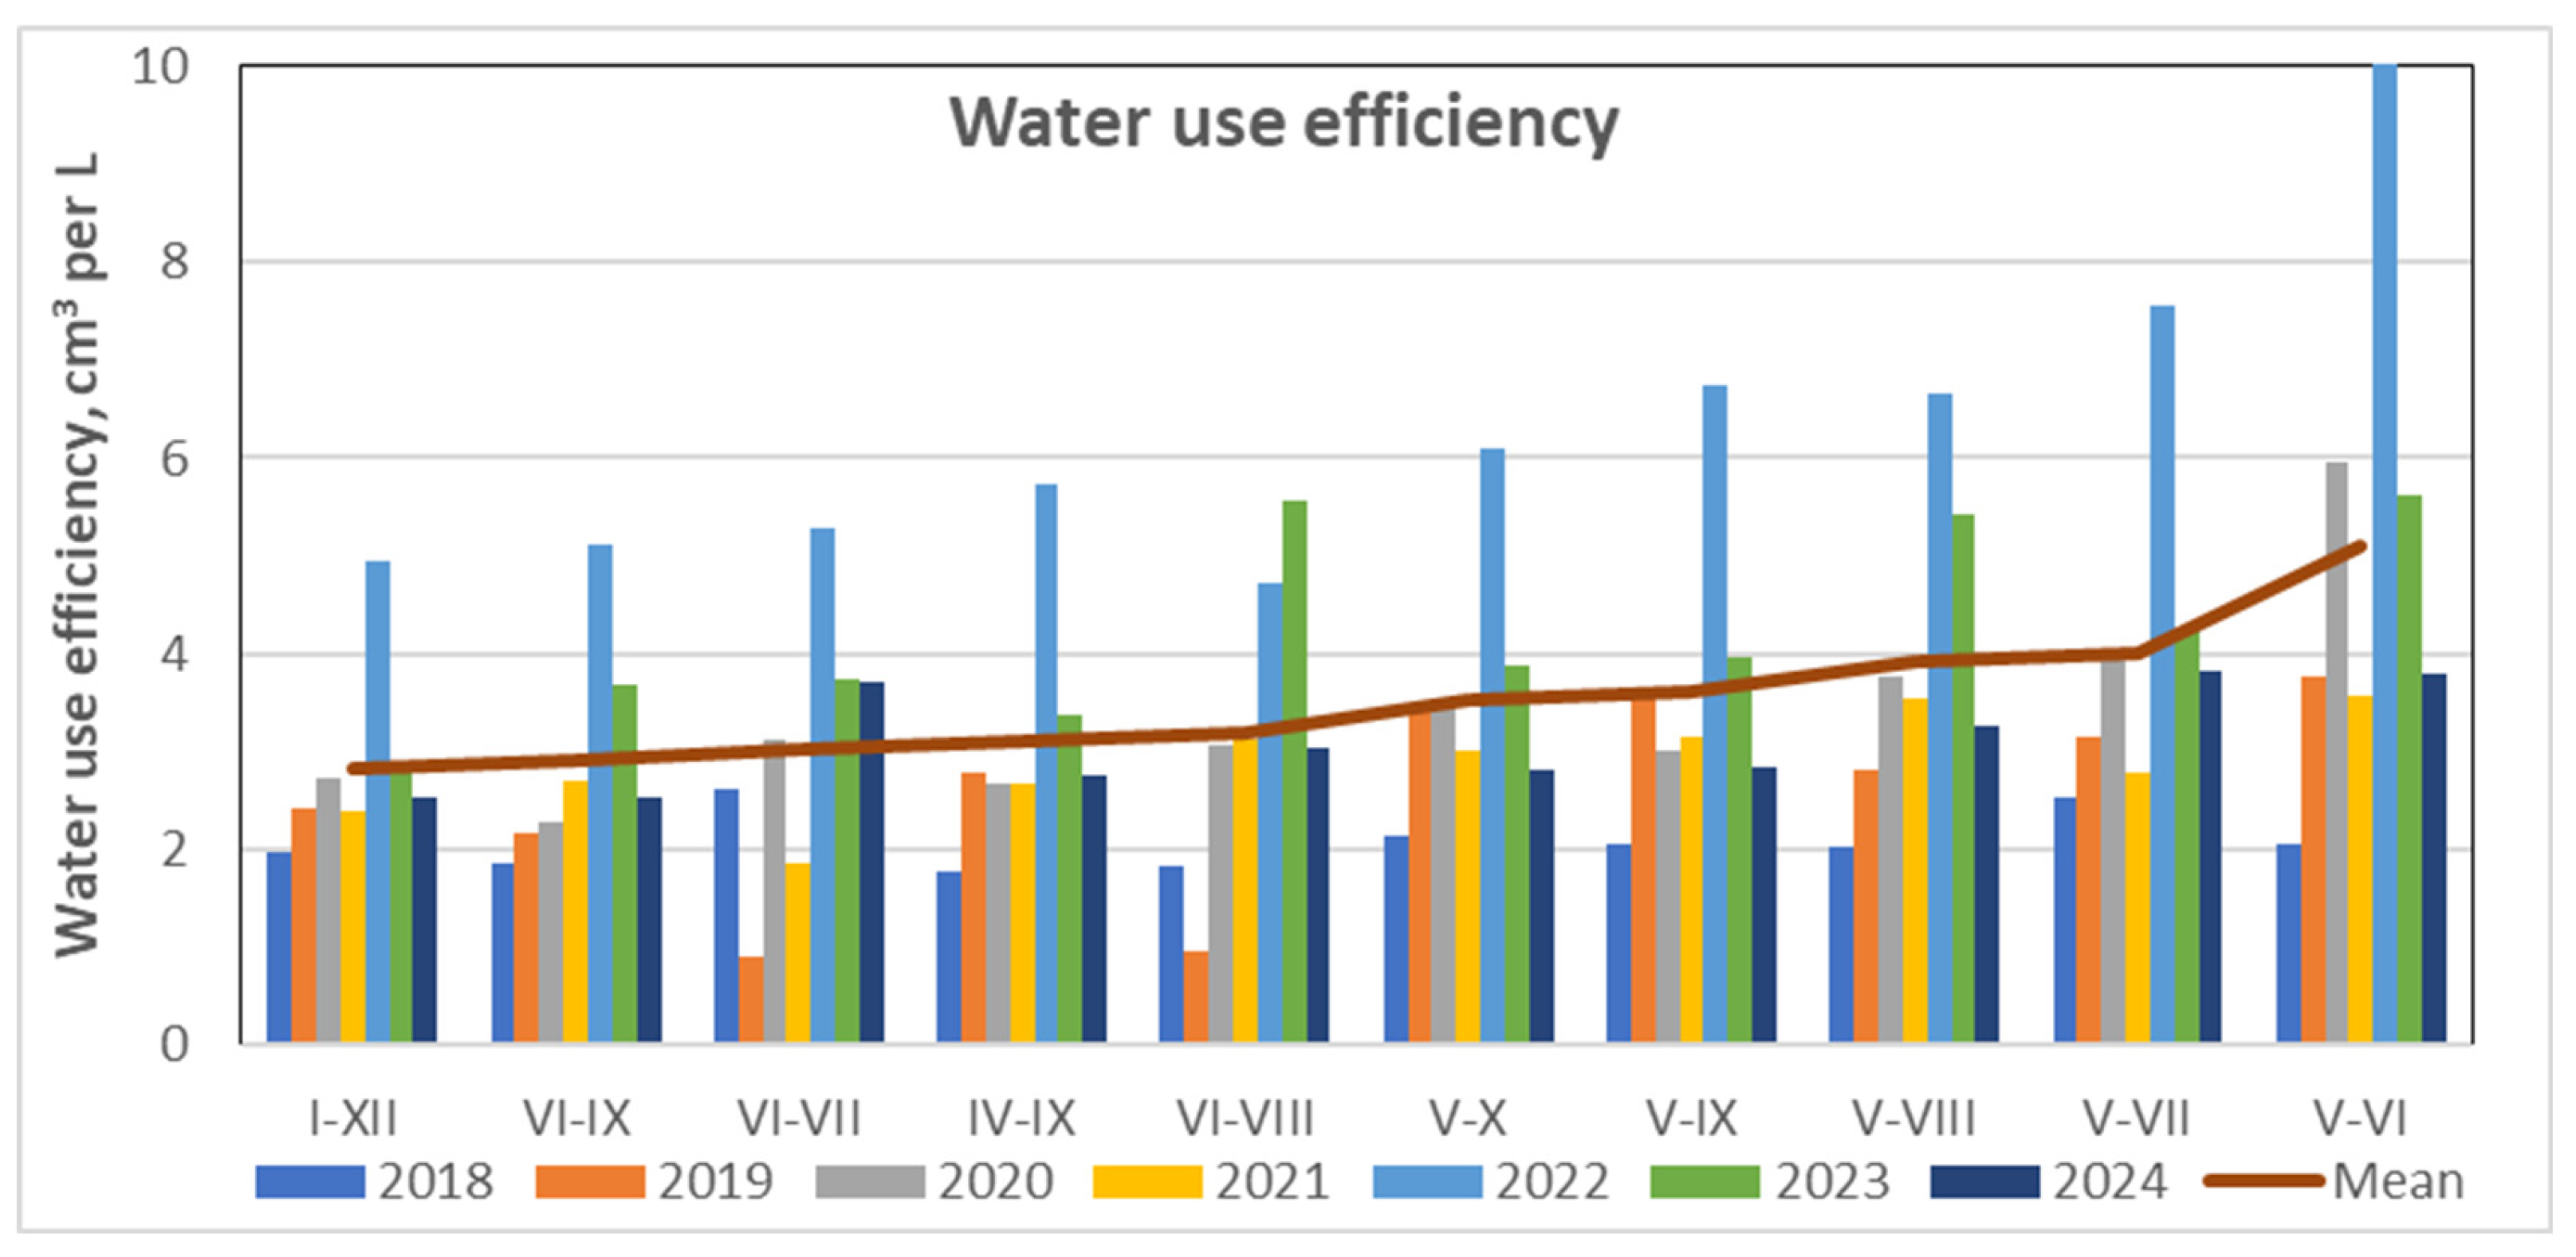
Figure 14.
Monthly values of water use efficiency over the 2018-2024 period.
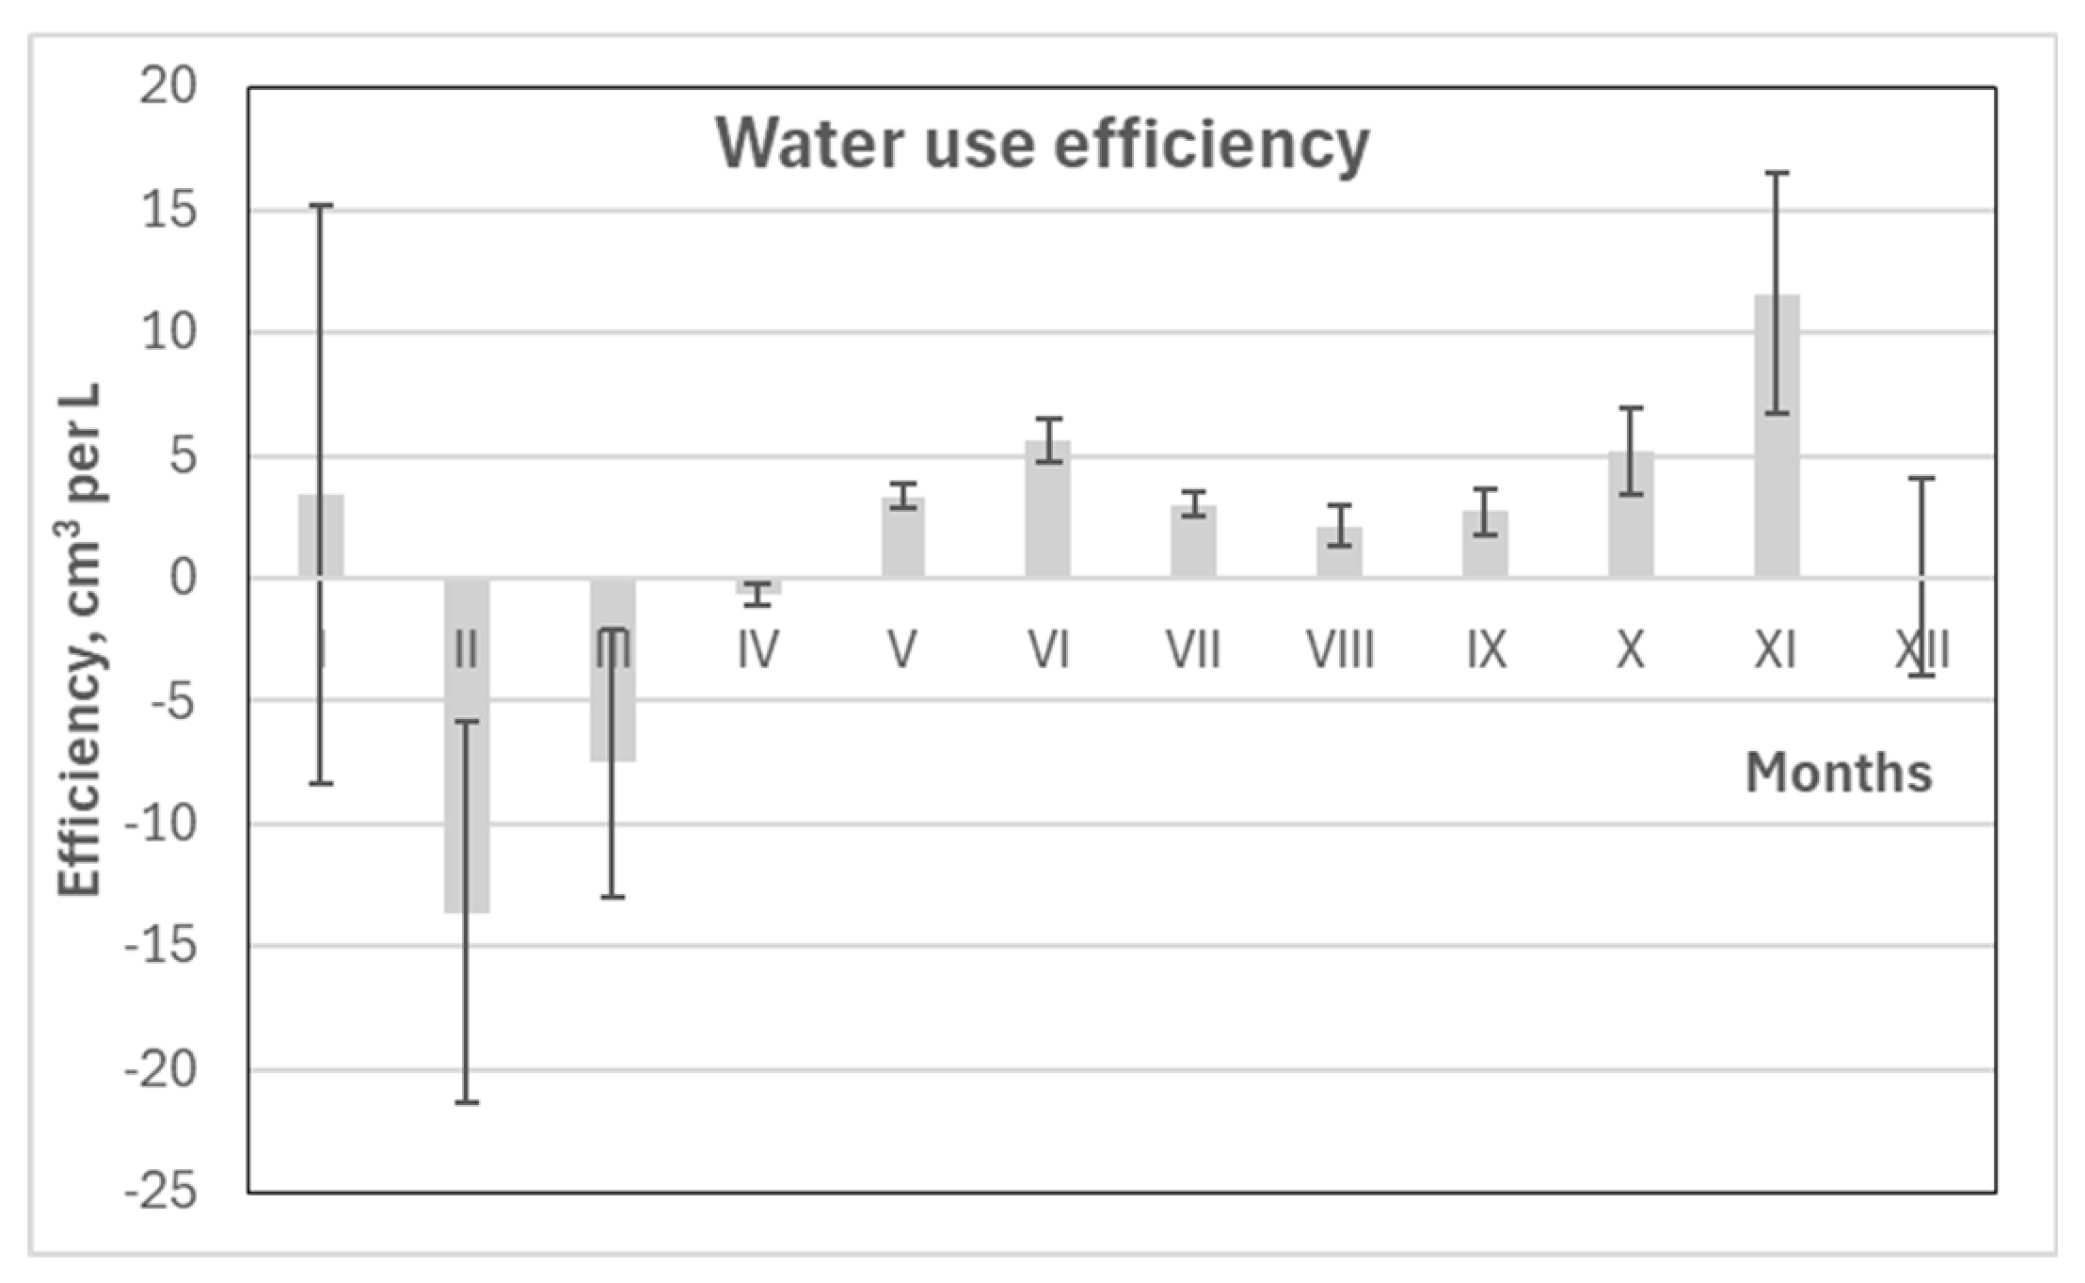
Figure 15.
Relationships between considered meteorological parameters over the different periods and annual values of the main variables of pine tree response: volume increment, sap flow density, and water use efficiency. There: VPD—vapor pressure deficit; Tm—mean temperature; Tm max—mean daily maximal temperature; Sun rad—solar radiation; RH—relative humidity; RH min—mean daily minimal relative humidity; Prec—precipitation amount.
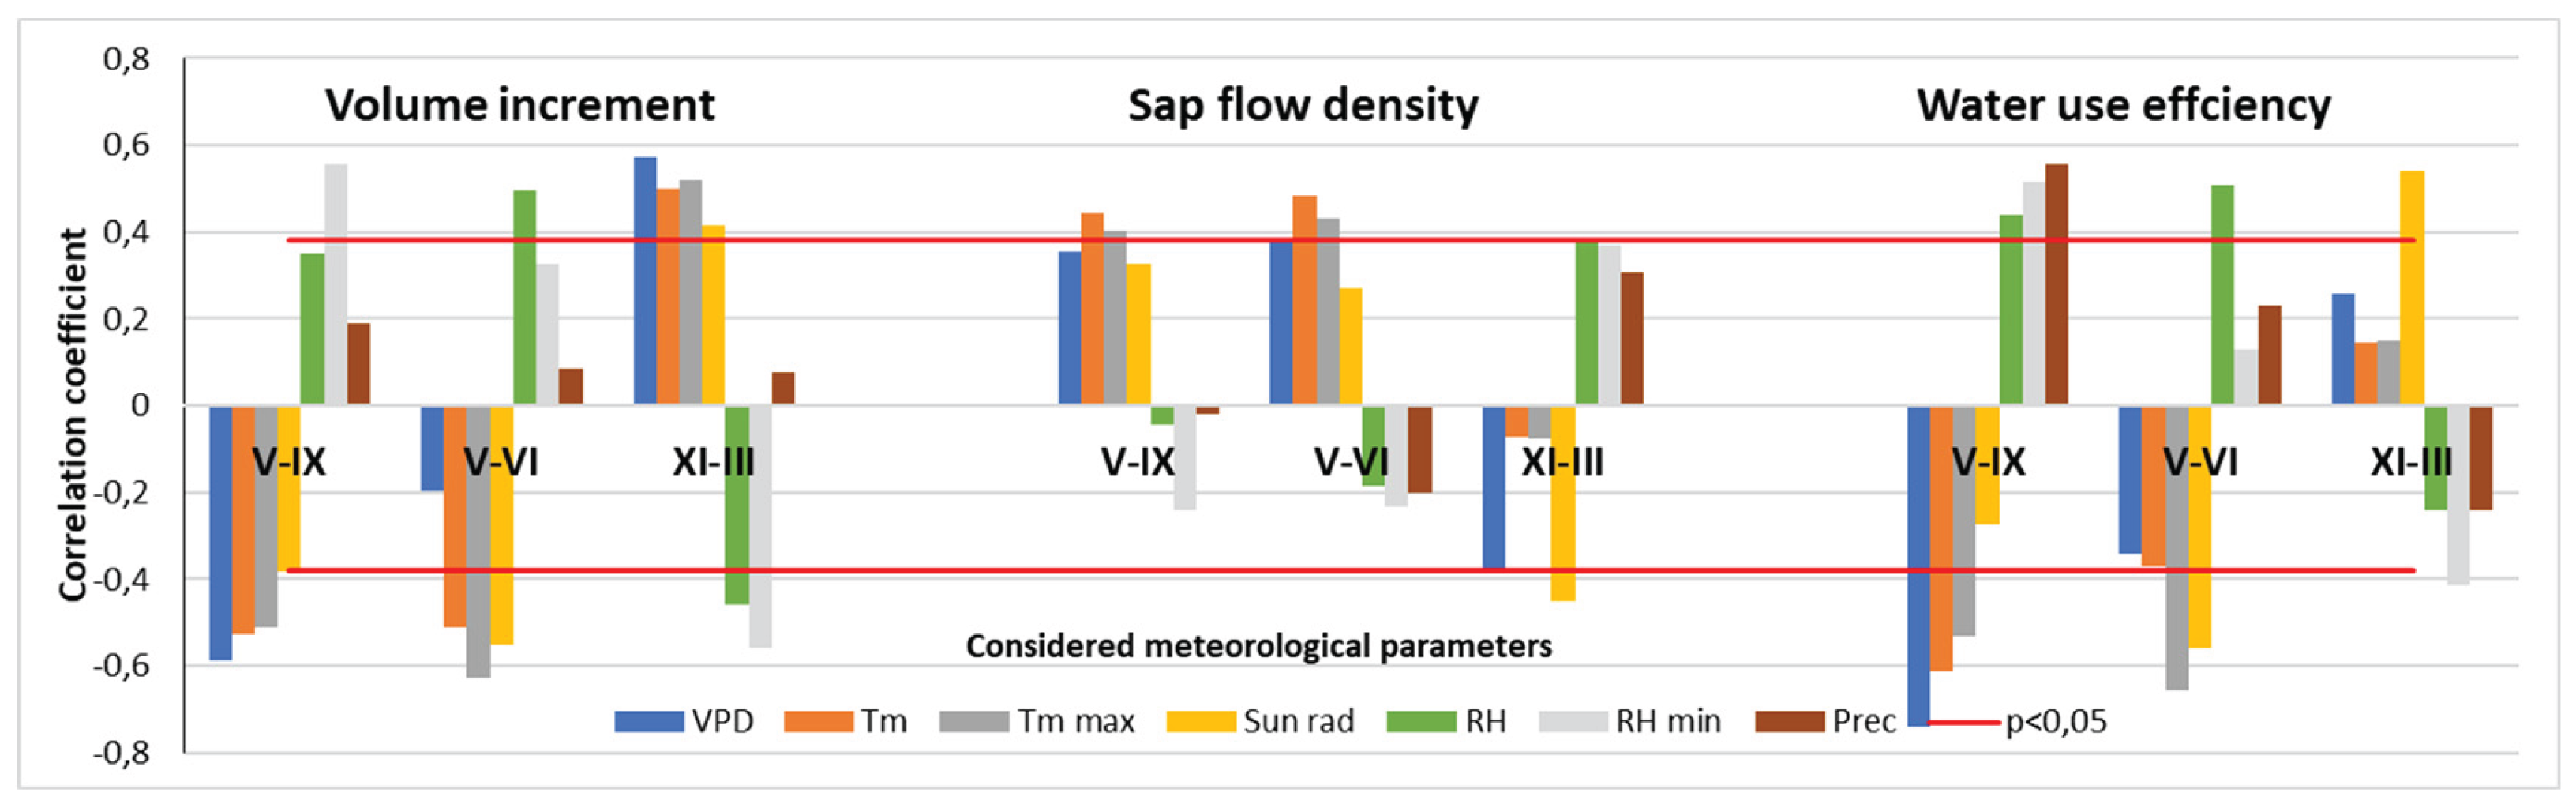

Table 1.
Annual values of the main meteorological parameters during the 2018-2024 period.
| Year | Temperature | Precipitation | Relative humidity | VPD | |||
|---|---|---|---|---|---|---|---|
| Mean | Max. | Min. | Mean | Min. | |||
| °C | °C | °C | mm | % | % | hPa | |
| 2018 | 9.21 | 30.4 | -7.5 | 640.2 | 78.5 | 43.7 | 3.30 |
| 2019 | 9.98 | 30.8 | -14.0 | 704.2 | 79.1 | 40.7 | 3.21 |
| 2020 | 10.39 | 29.5 | -3.0 | 608.1 | 78.6 | 41.4 | 3.27 |
| 2021 | 8.75 | 32.1 | -21.4 | 643.1 | 79.8 | 43.2 | 3.13 |
| 2022 | 9.32 | 30.8 | -10.1 | 647.2 | 80.3 | 43.8 | 2.94 |
| 2023 | 9.83 | 29.4 | -7.8 | 777.7 | 79.2 | 43.2 | 3.21 |
| 2024 | 10.58 | 30.0 | -16.3 | 717.0 | 83.5 | 45.2 | 2.92 |
Table 2.
Significance of Monthly Transpiration Rates in Relation to Tree Transpiration Across Different Periods.
Table 2.
Significance of Monthly Transpiration Rates in Relation to Tree Transpiration Across Different Periods.
| Periods | Months | |||||||||||
|---|---|---|---|---|---|---|---|---|---|---|---|---|
| I | II | III | IV | V | VI | VII | VIII | IX | X | XI | XII | |
| I-XII | 0.308 | 0.106 | 0.416 | 0.672 | 0.857 | 0.807 | 0.863 | 0.898 | 0.858 | 0.845 | 0.777 | 0.158 |
| IV-VIII | 0.269 | 0.046 | 0.358 | 0.664 | 0.901 | 0.861 | 0.845 | 0.899 | 0.762 | 0.792 | 0.711 | 0.112 |
| V-VIII | 0.244 | -0.003 | 0.326 | 0.577 | 0.892 | 0.853 | 0.855 | 0.922 | 0.766 | 0.790 | 0.693 | 0.090 |
| VI-IX | 0.229 | 0.053 | 0.384 | 0.531 | 0.791 | 0.804 | 0.904 | 0.916 | 0.871 | 0.840 | 0.757 | 0.129 |
| VI-VIII | 0.216 | 0.057 | 0.384 | 0.529 | 0.803 | 0.862 | 0.918 | 0.894 | 0.777 | 0.773 | 0.701 | 0.074 |
| IV-IX | 0.272 | 0.045 | 0.364 | 0.647 | 0.881 | 0.822 | 0.851 | 0.919 | 0.839 | 0.844 | 0.755 | 0.147 |
| V-VII | 0.254 | 0.121 | 0.369 | 0.628 | 0.858 | 0.916 | 0.877 | 0.837 | 0.699 | 0.736 | 0.698 | 0.064 |
| V-VI | 0.192 | -0.012 | 0.180 | 0.657 | 0.937 | 0.907 | 0.701 | 0.816 | 0.613 | 0.728 | 0.632 | 0.138 |
| VI-VII | 0.203 | 0.270 | 0.464 | 0.553 | 0.667 | 0.922 | 0.949 | 0.716 | 0.654 | 0.653 | 0.683 | 0.024 |
| V-X | 0.237 | -0.002 | 0.319 | 0.574 | 0.869 | 0.805 | 0.849 | 0.939 | 0.860 | 0.866 | 0.751 | 0.148 |
Note: correlation is significant p<0.05 when r>0.4; significant correlation in bold; the largest values are underlined.
Table 3.
Significance of Monthly Stem Volume Increment in Relation to Stem Volume Increment Across Different Periods.
Table 3.
Significance of Monthly Stem Volume Increment in Relation to Stem Volume Increment Across Different Periods.
| Periods | Months | |||||||||||
|---|---|---|---|---|---|---|---|---|---|---|---|---|
| I | II | III | IV | V | VI | VII | VIII | IX | X | XI | XII | |
| I-XII | 0.375 | 0.140 | -0.363 | 0.450 | 0.681 | 0.818 | 0.565 | 0.234 | -0.019 | 0.260 | 0.326 | -0.063 |
| IV-VIII | 0.409 | 0.170 | -0.445 | 0.462 | 0.543 | 0.819 | 0.518 | 0.443 | -0.165 | 0.242 | 0.139 | 0.046 |
| V-VIII | 0.397 | 0.089 | -0.389 | 0.334 | 0.574 | 0.809 | 0.479 | 0.477 | -0.131 | 0.220 | 0.146 | 0.018 |
| VI-IX | 0.348 | 0.095 | -0.358 | 0.303 | 0.518 | 0.751 | 0.536 | 0.471 | -0.035 | 0.029 | 0.173 | -0.093 |
| VI-VIII | 0.474 | 0.047 | -0.363 | 0.387 | 0.234 | 0.770 | 0.440 | 0.659 | -0.424 | 0.311 | -0.077 | 0.220 |
| IV-IX | 0.284 | 0.201 | -0.415 | 0.375 | 0.732 | 0.750 | 0.556 | 0.259 | 0.146 | 0.016 | 0.325 | -0.195 |
| V-VII | 0.296 | 0.187 | -0.369 | 0.402 | 0.770 | 0.783 | 0.628 | -0.023 | 0.186 | 0.110 | 0.498 | -0.181 |
| V-VI | 0.376 | 0.168 | -0.438 | 0.266 | 0.808 | 0.877 | 0.271 | 0.047 | 0.171 | 0.178 | 0.417 | -0.174 |
| VI-VII | 0.412 | 0.180 | -0.379 | 0.543 | 0.472 | 0.831 | 0.699 | 0.091 | -0.099 | 0.217 | 0.357 | 0.012 |
| V-X | 0.336 | 0.089 | -0.355 | 0.284 | 0.723 | 0.792 | 0.481 | 0.329 | 0.029 | 0.207 | 0.260 | -0.071 |
Note: correlation is significant p<0.05 when r>0.4, Significant correlation in bold, the largest values are underlined.
Table 4.
Relationships Between Stem Volume Increment and Sap Flow Density Across Different Periods.
| Variables | Sap flow |
Sap flow density during the different periods | ||||||||||
|---|---|---|---|---|---|---|---|---|---|---|---|---|
| I-XII | V-X | IV-IX | IV-VIII | V-VIII | VI-IX | VI-VIII | V-VII | VI-VII | V-VI | XI-III | ||
| Increment | DOY | 365 | 184 | 183 | 153 | 123 | 122 | 92 | 92 | 61 | 61 | 151 |
| I-XII | 365 | 0.457 | 0.432 | 0.428 | 0.410 | 0.412 | 0.479 | 0.472 | 0.426 | 0.509 | 0.281 | 0.594 |
| V-X | 184 | 0.446 | 0.418 | 0.412 | 0.381 | 0.376 | 0.464 | 0.437 | 0.386 | 0.470 | 0.256 | 0.494 |
| IV-IX | 183 | 0.413 | 0.392 | 0.383 | 0.355 | 0.357 | 0.442 | 0.422 | 0.353 | 0.436 | 0.215 | 0.500 |
| IV-VIII | 153 | 0.490 | 0.470 | 0.454 | 0.405 | 0.411 | 0.522 | 0.475 | 0.393 | 0.468 | 0.231 | 0.552 |
| V-VIII | 123 | 0.476 | 0.457 | 0.439 | 0.387 | 0.391 | 0.507 | 0.454 | 0.376 | 0.451 | 0.228 | 0.487 |
| VI-IX | 122 | 0.425 | 0.424 | 0.396 | 0.342 | 0.356 | 0.465 | 0.412 | 0.314 | 0.368 | 0.183 | 0.399 |
| VI-VIII | 92 | 0.497 | 0.495 | 0.462 | 0.386 | 0.403 | 0.537 | 0.452 | 0.348 | 0.384 | 0.198 | 0.433 |
| V-VII | 92 | 0.364 | 0.329 | 0.334 | 0.336 | 0.332 | 0.379 | 0.397 | 0.366 | 0.468 | 0.215 | 0.659 |
| VI-VII | 61 | 0.403 | 0.382 | 0.374 | 0.360 | 0.370 | 0.427 | 0.424 | 0.369 | 0.438 | 0.197 | 0.712 |
| V-VI | 61 | 0.203 | 0.155 | 0.162 | 0.151 | 0.137 | 0.220 | 0.223 | 0.203 | 0.361 | 0.053 | 0.557 |
| XI-III | 151 | -0.166 | -0.140 | -0.131 | -0.089 | -0.091 | -0.170 | -0.122 | -0.068 | -0.103 | 0.059 | -0.447 |
Note: correlation is significant p<0.05 when r>0.4, Significant correlation in bold.
Table 5.
Effect of stem volume increment (A) and sap flow density (B) on WUE variation over different periods.
Table 5.
Effect of stem volume increment (A) and sap flow density (B) on WUE variation over different periods.
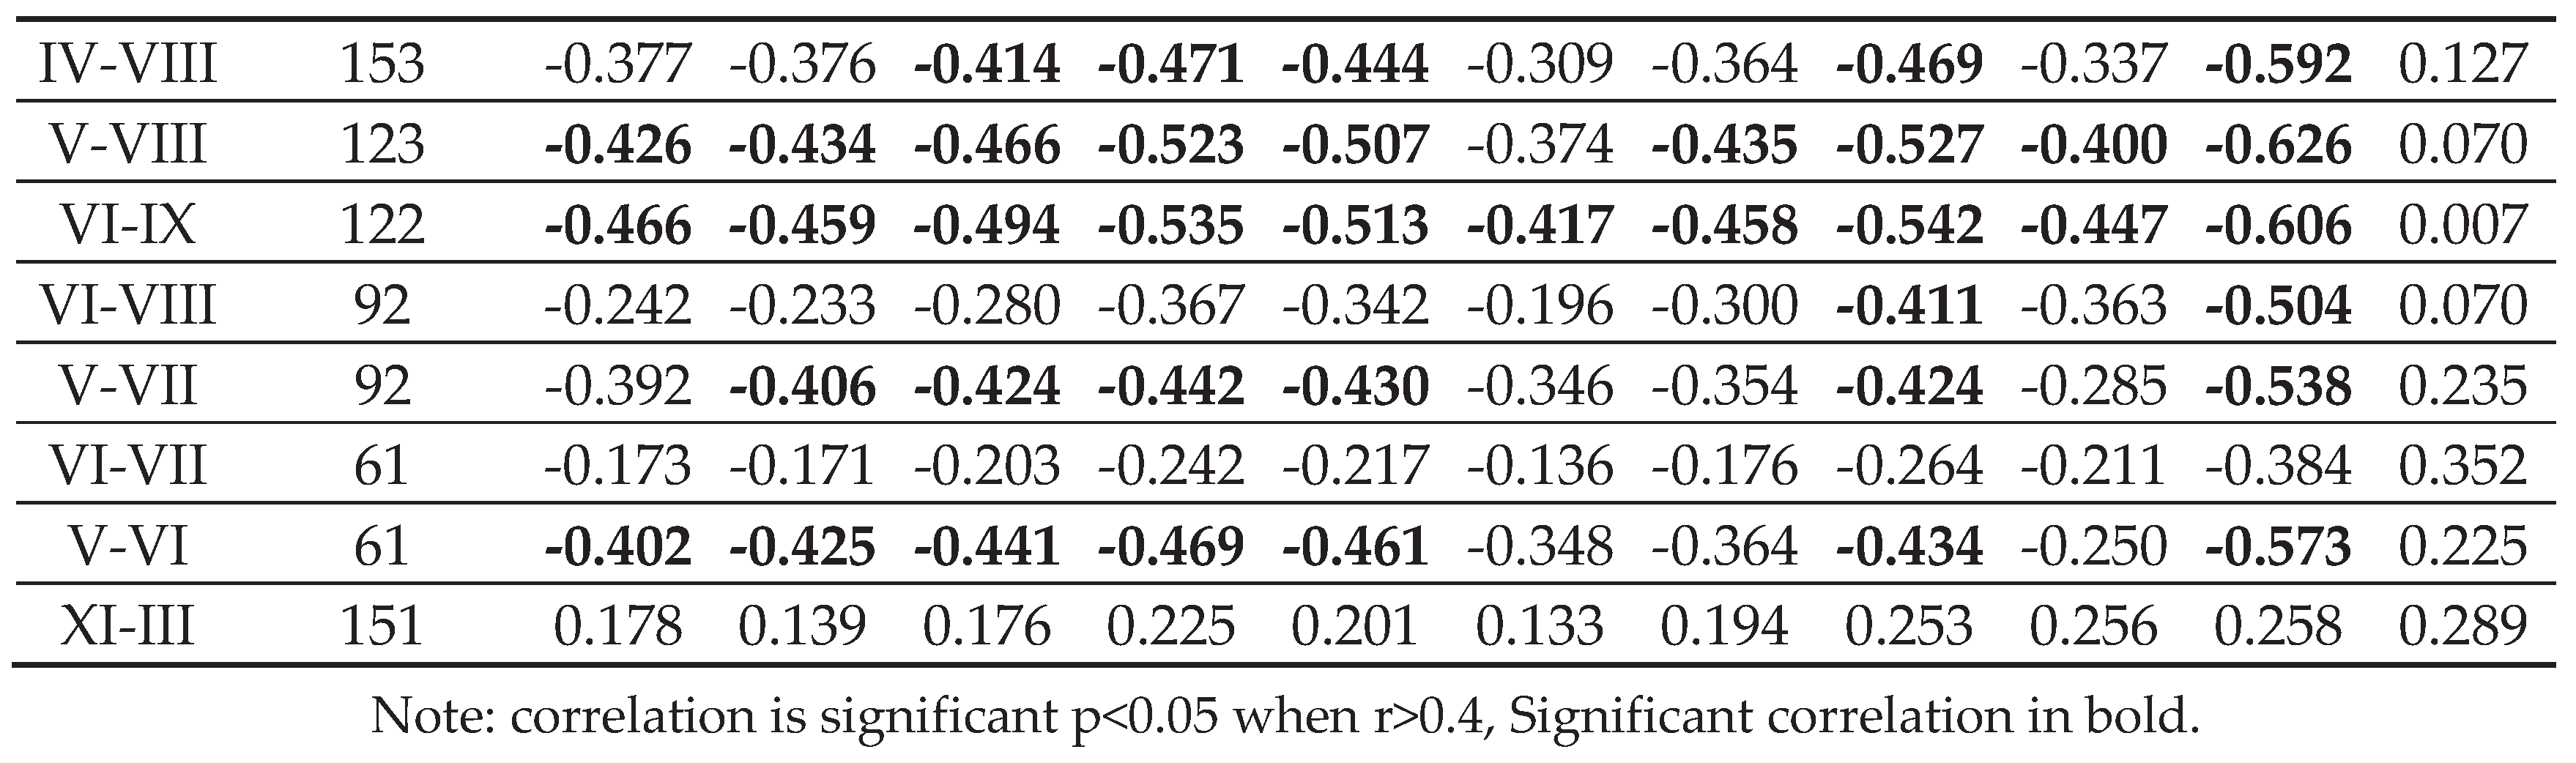
Note: correlation is significant p<0.05 when r>0.4, Significant correlation in bold.
Disclaimer/Publisher’s Note: The statements, opinions and data contained in all publications are solely those of the individual author(s) and contributor(s) and not of MDPI and/or the editor(s). MDPI and/or the editor(s) disclaim responsibility for any injury to people or property resulting from any ideas, methods, instructions or products referred to in the content. |
© 2025 by the authors. Licensee MDPI, Basel, Switzerland. This article is an open access article distributed under the terms and conditions of the Creative Commons Attribution (CC BY) license (http://creativecommons.org/licenses/by/4.0/).
Copyright: This open access article is published under a Creative Commons CC BY 4.0 license, which permit the free download, distribution, and reuse, provided that the author and preprint are cited in any reuse.


