
Submitted:
27 March 2025
Posted:
28 March 2025
You are already at the latest version
Abstract
Climate models predicted changes in the woody plants’ growth, vitality, and species distribution. Those changes are expected mainly within the boundaries of the species ranges. We studied the influence of changing hydrothermal and burning rate regimes on relict pine stands at the southern edge of the Pinus sylvestris range in Siberia. We found that the increase in air temperature, combined with the decrease in soil and air drought, stimulated the growth of pine trees. Since the “warming restart” in the c. 2000 y, the growth index (GI) of pines has exceeded its historical value by 1.4 times. The GI strongly correlated with the GPP and NPP of pine stands (r = 0.82). Despite the increased fire rate, the GPP and NPP of both pine stands and surrounding bush-steppes are increasing, i.e., the pine habitat is “greening” since warming restart. These results support the prediction (by climatic scenarios SSP4.5, SSP7.0, and SSP8.5) of improvement in trees’ habitat in the Siberian South. The density of seedlings on burns (c. 10,000 per ha) is potentially sufficient for pine recovery. However, warming also leads to a reduction in the fire return interval (up to 3–5 y). Currently, repeated surface fires have eliminated the majority of the undergrowth and afforestation. In a changing climate, the preservation of relict pine forests depends on a combination of moisture supply, burning rate, and fire suppression.
Keywords:
conifers’ range
; Scot pine range
; pines in warming climate
; conifers burning
; warming and pine growth
; relict pine forests
; regeneration burning
; tree species preservation
; forest-steppe ecotone
1. Introduction
Observed and predicted changes in the thermal and hydrology regimes lead to the redistribution of tree species ranges and affect trees’ vigor and growth [1,2]. Thus, conifers in the boreal zone have large-scale mortality caused by the combined impact of droughts, pathogen attacks, and fire influence. Conifer mortality was observed in North American forests, where a synergy of droughts, fires and bark-beetle attacks caused pine stands’ mortality over vast areas [3,4,5]. Low precipitation and low humidity of the root zone, together with bark-beetles attacks, lead to the spruce (Picea abies L.) decline and mortality in Western and Eastern Europe and Picea obovata L. in the European part of Russia [6,7,8,9]. In the Mediterranean zone, the future of the endemic pines is strongly dependent on the combined effect of droughts and fires [10]. Alongside conifers, softwood and hardwood species have also experienced negative consequences climate warming in North America and Eurasia [11,12,13].
In Siberia, precipitation-sensitive (Siberian pine (Pinus sibirica Du Tour), fir (Abies sibirica Ledeb.), and spruce (Picea obovata) experienced growth decline and mortality within the areas of low precipitation (i.e., taiga forests in the lowlands) [14,15]. On the contrary, elevating air temperatures drive uphill migration of those species to areas of sufficient moisture supply, e.g., into the mountain tundra [16].
Scot pine (Pinus sylvestris L.), can survive in habitats with limited water supplies, including semidesert areas. In addition, this pyrophytic species adapted to the periodic surface fires. However, recent year data indicated a negative influence of the burning rate on the growth and area of pine stands, especially within the southern part of pine range [17,18,19,20]. Similarly, the other Siberian pyrophytic and drought-resistant species, larch (Larix spp.), experienced thinning and mortality of stands within the southern edge of its habitat in the Trans Baikal area [21,22,23,24]. Most of the observed warming-driven decline and mortality of trees referred to the so-called period of the “warming restart”, i.e., a pronounced increase in the warming rate since ca. 1998–2000 [25].
Prognostic models suggest that most evident changes in trees vigor and species range should occur within the transition zones (ecotones) between forest and non-forest communities [1]. This study focuses on the response of Scots pine trees growth and pine stands burning during the “warming restart” in the 21st century. For our study, we selected relict pine stands at the southern edge of Pinus sylvestris range in Siberia, and analyzed dependence of the radial growth index (GI) of trees on climate variables and the influence of wildfires on pine forests.
Checked hypothesis:
- Warming-driven air temperature increase stimulated the growth of Pinus sylvestris in condition of sufficient moisture supply;
- Warning-driven increase of burning rate is a threat for Pinus sylvestris habitat within its southern range in Siberia.
We are seeking the answers to the following questions:
- How do changing hydrothermal regimes influence growth index of trees?
- How does the changing burning rate influence pine stands and pine regeneration?
2. Materials and Methods
The research based on remote sensing data, fieldwork, and GIS technologies.
2.1. Study Area
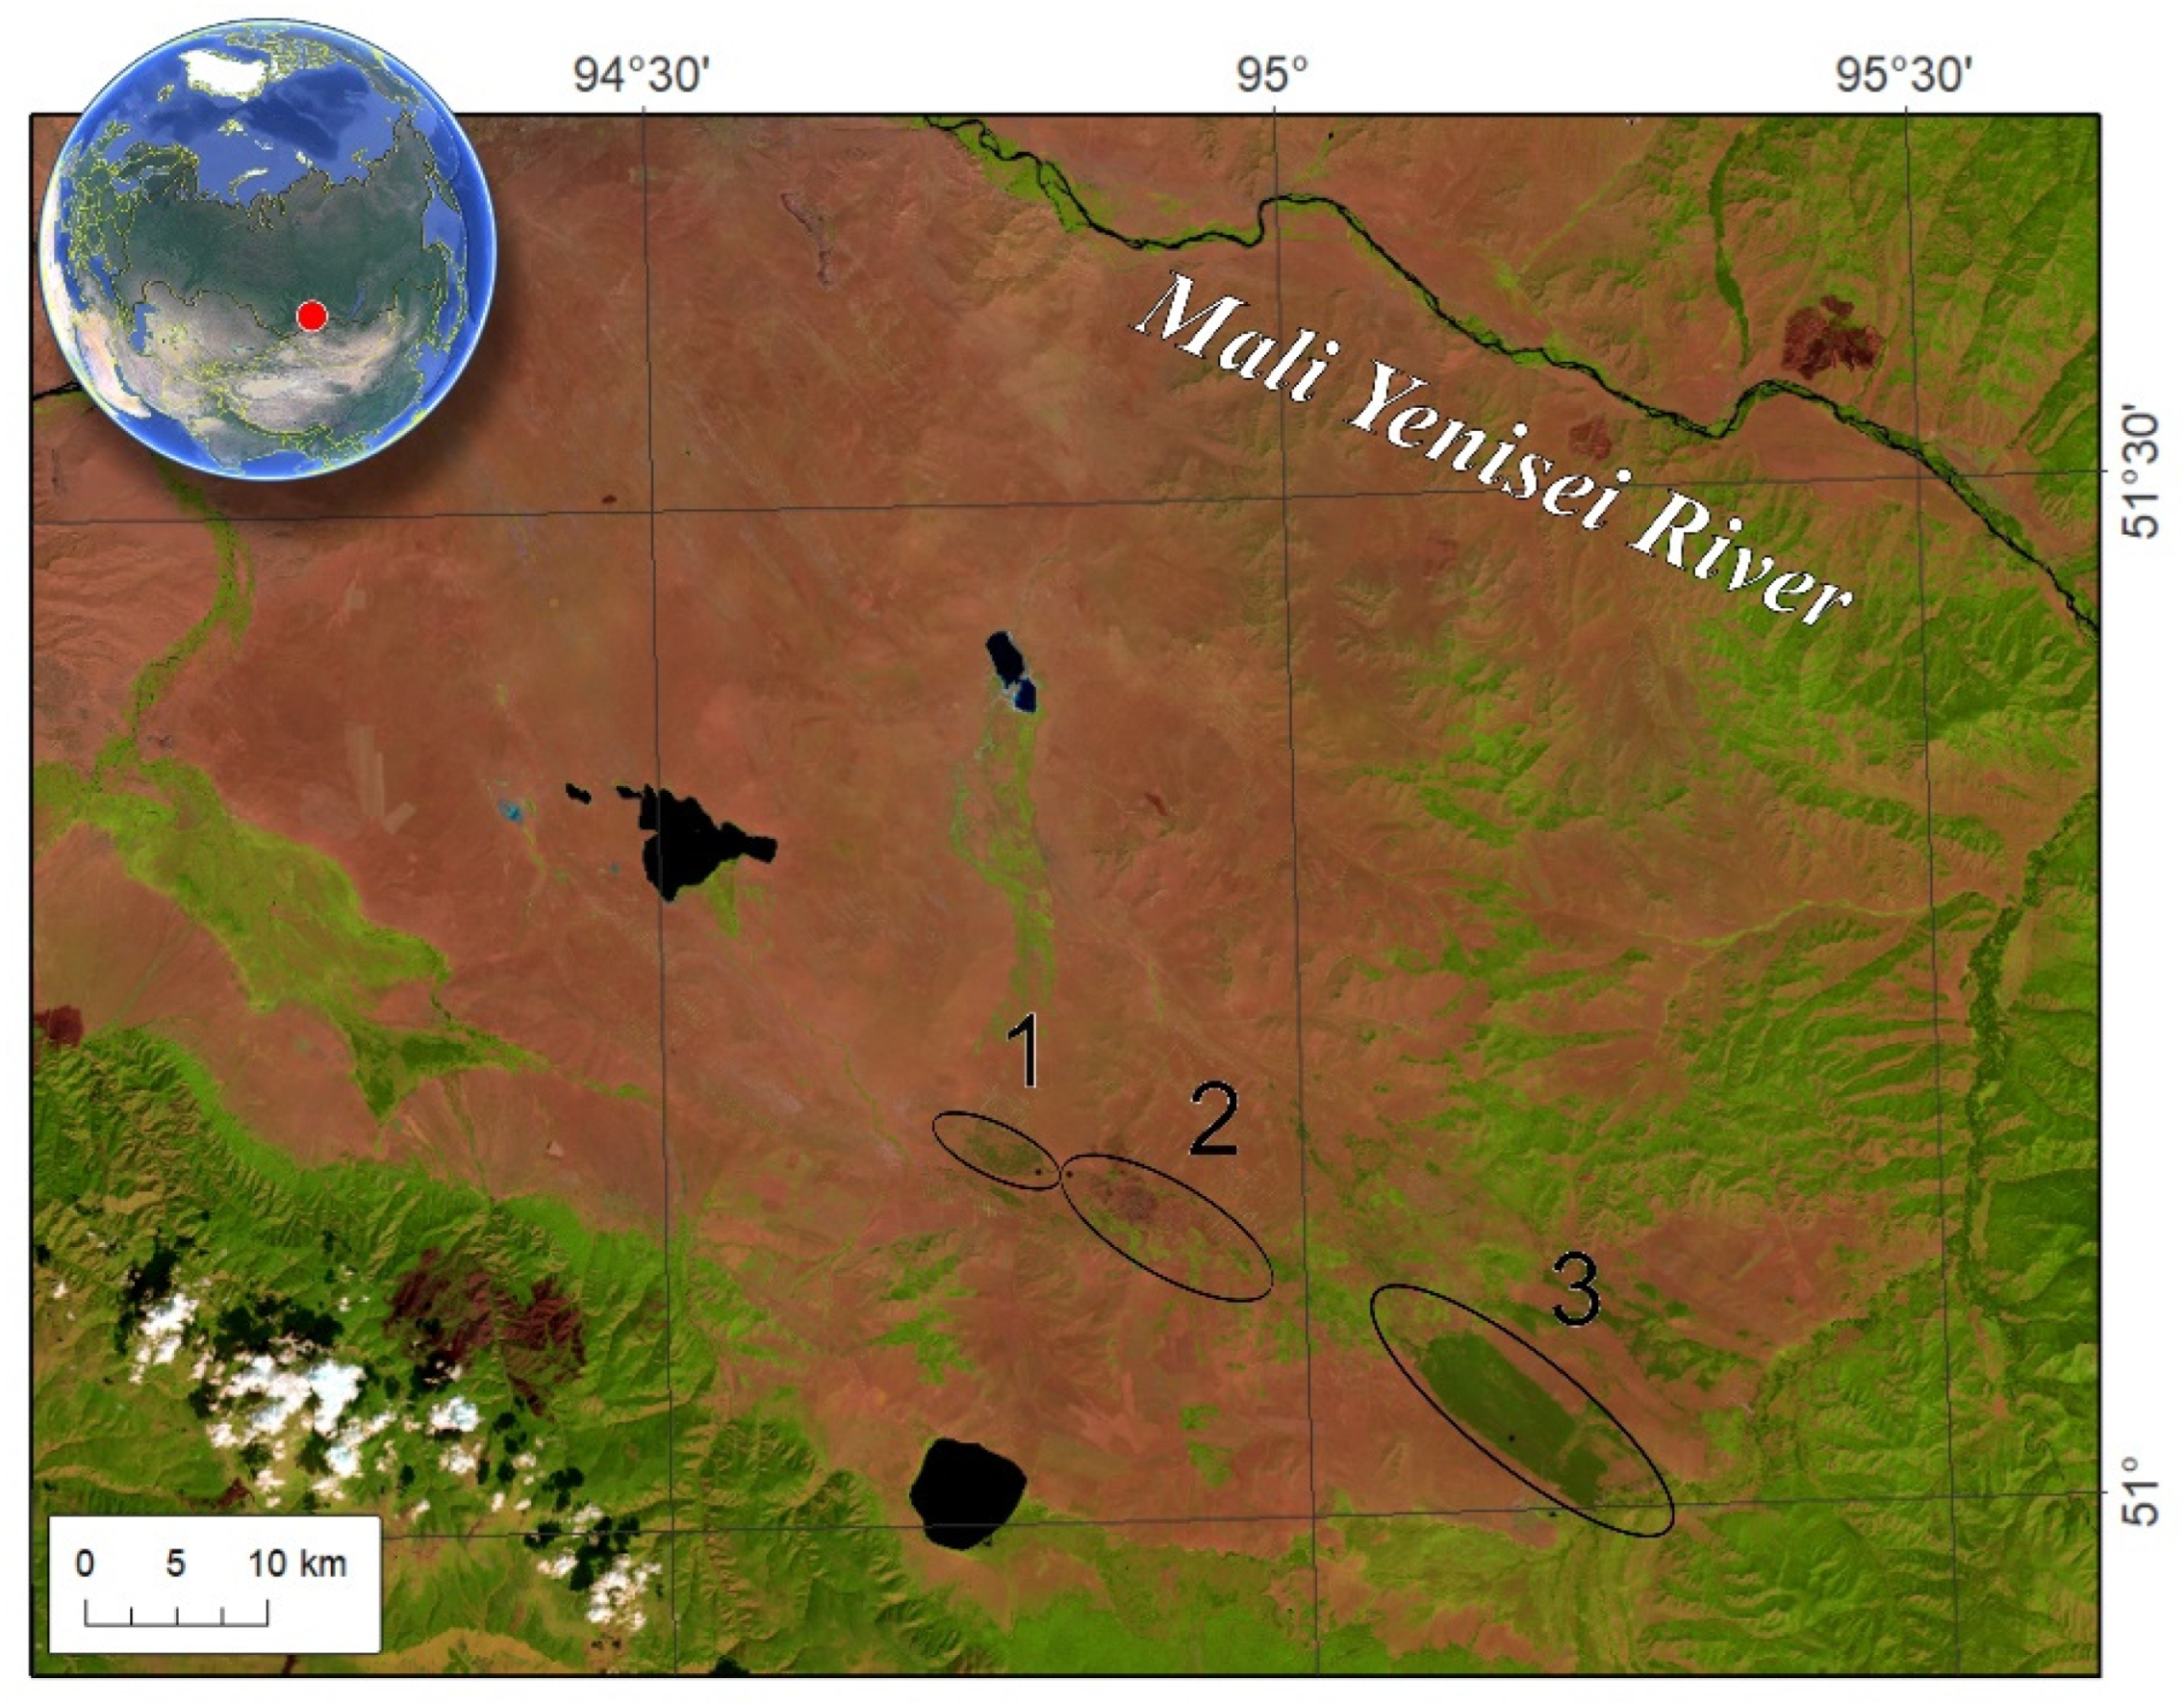
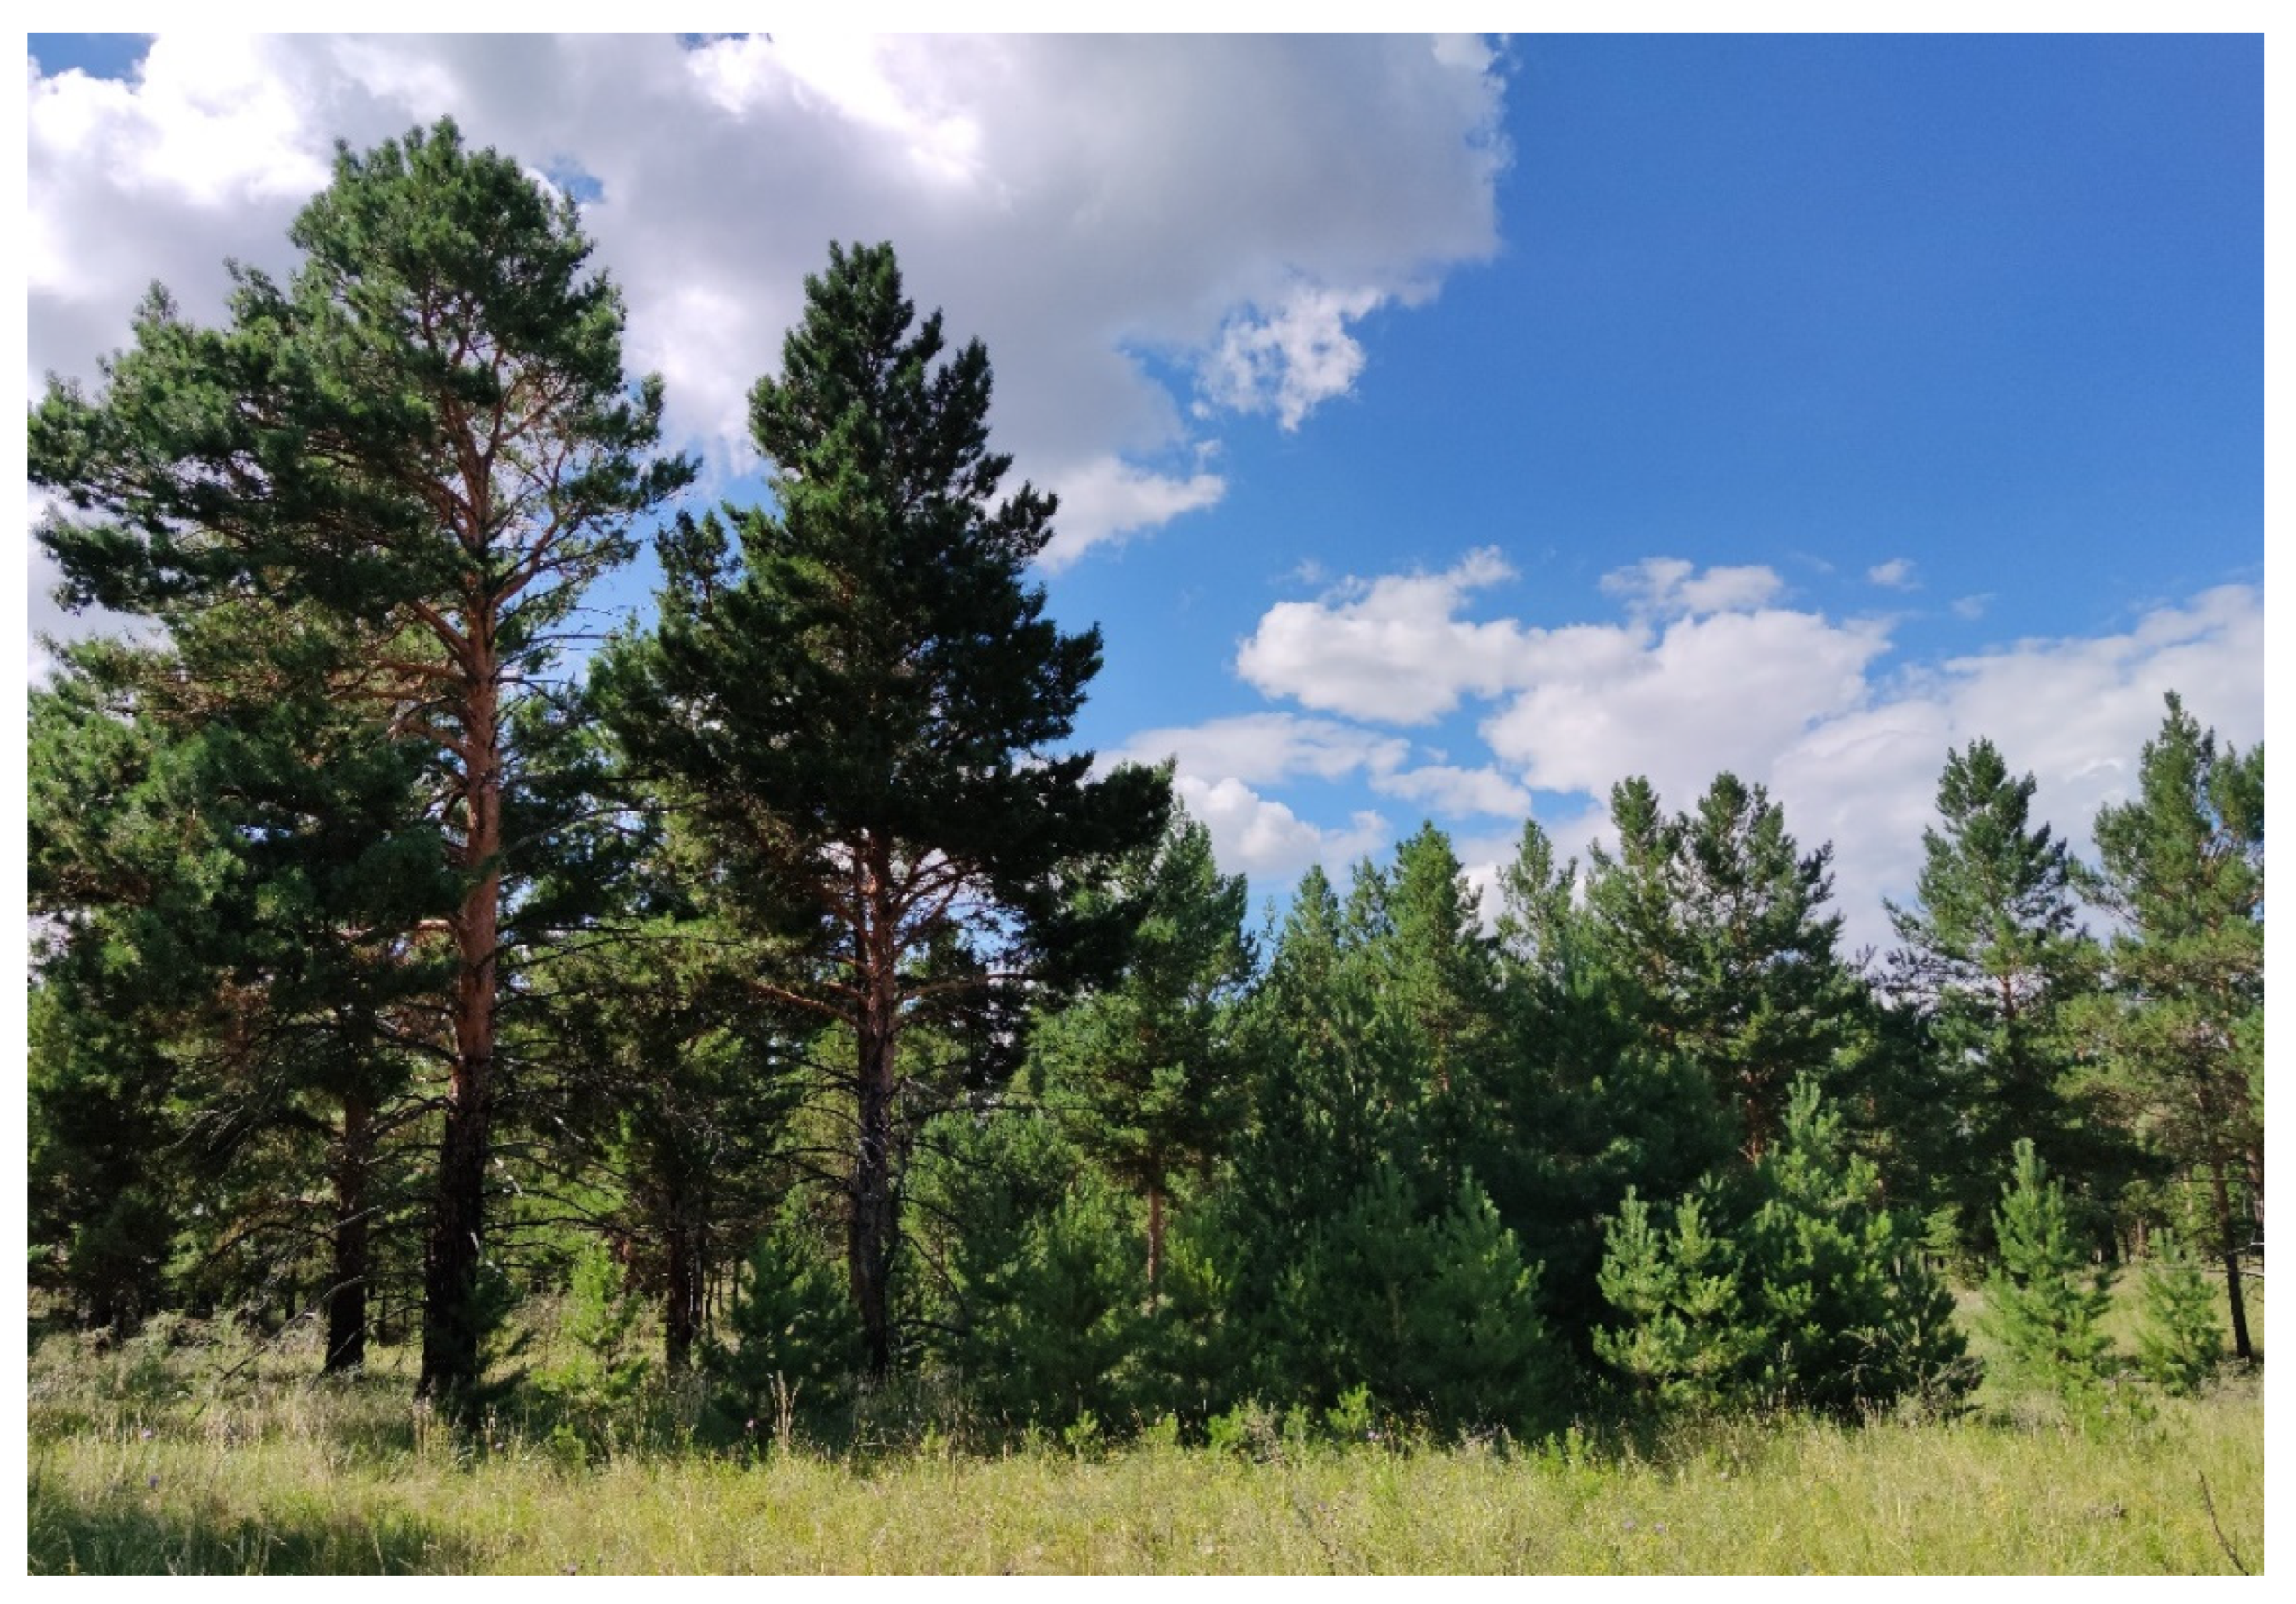
The study area is located in the Tuva basin, the Mid Siberia (elevations are about 850–950 m above s. l.). That is the southern edge of the Pinus sylvestris range. The climate within study is dry with warm summer and cold winters. The average summer and annual temperatures and precipitation are +16°C and –1.7°C and 180 mm and 350 mm, respectively. We studied “Ulug-Hady” or Big Pines, “Biche-Hady” or Minor Pines, and “Balgazyn” pine forests (Figure 1). Forest areas were 600, 3000 and 5500 ha, respectively (according to Landsat-5 scene taken in 1986). These are the forest conservation areas. All stands are growing on sandy soils with poor organic horizon. The surface fires are typical in those areas.
Figure 1.
Studied pine stands location (1 – Biche-Hady, 2 – Ulug-Hady, 3 – Balgazyn).
2.2. Ground Survey Data
Fieldworks were conducted in 2024 y on the temporary test plots with a radius of 9.8 m (S ~0.03 ha; N = 6). We obtained the forest inventory, soil type, and geobotanical data as well as slope steepness and aspect values. The seedlings were counted on plots with 2 × 2, 3 × 3, or 5 × 5 m2 size, depending on the density of seedlings. Seedlings without signs of damage or replaced apical shoot or partial yellowing of the crown or reduced growth were considered viable, whereas seedlings with a crown density of < 70% and little or no growth were considered as declining. For dendrochronological analysis, trees were randomly selected on an area of about 0.5 ha around the centerpoint of test plots. Wood samples were collected at a height of 1.3 m using an increment borer (Figure A1).
2.3. Dendrochronological Analysis
Tree-ring chronologies of pine trees were developed for the studied areas. Since Biche-Hady, Ulug-Hady, and Balgazyn are in similar conditions (in fact, they represent fragments of a former pine forest), and given the high synchronicity of chronologies in these areas (inter-series correlations are 0.66), a combined chronology (based on 127 model trees) was used in further analysis.
Measurements of wood cores were taken using the LINTAB 6 platform with an accuracy of 0.01 mm. Time series of the tree ring width in mm were obtained for each sample. The quality of measurements was assessed based on cross-dating methods using the COFECHA and TSAP software [26,27]. The initial tree ring width values (in mm) were converted into a dimensionless growth index (GI) using a negative exponential function or a linear regression with a negative slope in the ARSTAN program [28]. We used "residual" chronologies due to the absence of an autocorrelation component in the latter to significantly improve the climatic signal.
2.4. The Burning Rate Analysis
The dynamics of fires was determined using MODIS MCD64A1 data (https://modis-fire.umd.edu/ba.html), fire monitoring data (FIRMS) (https://firms.modaps.eosdis.nasa.gov) and Landsat time series (https://landsat.gsfc.nasa.gov) (83 scenes covering the period from 1986 to 2024 with a spatial resolution of 30 m; https://earthexplorer.usgs.gov). For expert analysis of burnt areas, high-resolution images (2–3.7 m; QuickBird, WorldView-3, and Pléiades satellites) were used (https://earth.google.com/web).
The MCD64A1 product is vector polygons of burnt areas with a spatial resolution of 500 m (period: 2001–2024) (https://search.earthdata.nasa.gov/search?q=mcd64a1). The FIRMS data are the point vector data of temperature anomalies (hotspots) with a spatial resolution of 1 km × 1 km (https://firms.modaps.eosdis.nasa.gov). Based on these data, burnt area maps were generated. Burnt areas in Landsat images were identified using the ISODATA method [29] and expert knowledge. The following parameters were used for clustering: the number of classes is 30…40; the number of iterations is 500; minimum class sizes and intervals between samples are 100 and 25 pixels, respectively.
2.5. Vegetation Productivity Data
The net (NPP) and gross (GPP) primary productivity of vegetation cover was estimated using the MODIS MOD17A3HGF product (2001–2024) [30]. These data represent raster composites of NPP and GPP values (kgC/m2) with a spatial resolution of 500 meters (https://lpdaac.usgs.gov/products/mod17a2hv006). Time series of these data were obtained from the EarthData geoportal (https://www.earthdata.nasa.gov). The original NPP and GPP data were converted into multi-band images, and average annual values for specific areas were determined.
Maps of NPP and GPP changes (p < 0.05) were calculated between two periods (2001–2009 and 2010–2024) using the Mann-Whitney U-test. Maps of trends (p < 0.05) in GPP and NPP dynamics were created for 2001–2024 using the Theil-Sen algorithm. Theil-Sen estimator is a non-parametric method that fits a regression line through the median of slopes determined by all pairs of sample points. It is more robust than simple linear regression [31].
2.6. Climate Data
Air temperatures and precipitation amounts were obtained from the Sosnovka weather station (WMO index 36099, distance to test sites is 20–30 km) using the AISORI online database [32]. Climate aridity was estimated based on the Palmer’s scPDSI (Self-Calibrated Palmer Drought Severity Index) and SPEI (Standardized Precipitation Evaporation Index) indexes [33]. The scPDSI is sensitive to soil and air moisture. Negative values of scPDSI indicate drought conditions, and positive values indicate wet conditions [34]. The scPDSI calculation was performed in the R-Studio v.2024.09.0 build 375 (https://posit.co/download/rstudio-desktop) using the R v.4.1.3 programming language. (https://cran.rstudio.com) and based on the scPDSI v0.1.3 library (https://github.com/Sibada/scPDSI). The input parameters were the data on total monthly precipitation and potential evapotranspiration for 1950–2024 extracted from the ERA5-Land database [35,36]. The SPEI estimated an atmospheric drought [37]. SPEI increase, similar to Palmer’s one, indicated air drought decrease, and vice versa. The SPEI and potential evapotranspiration (PET) were calculated based on precipitation and evaporation data extracted from the ERA5-Land database and using the SPEI R library (https://cran.r-project.org/web/packages/SPEI) scripting in the R-Studio) [36,37].
Figure 2.
Dynamics of the annual and summer temperatures (a) and precipitation (b), summer Palmer (scPDSI) (c) and SPEI (d) drought indexes. The beginning of the climate warming (i.e., the increase in summer temperatures (a)) coincided with a decrease in the Palmer index (c) (i.e., soil drought increase, 1985 y) indicated by the arrows. Precipitation increase in c. 2010–2023 (b) coincided with soil drought decrease (c). The beginning of air drought (SPEI) decrease (d) shifted to the early dates in comparison with soil drought. Note: an increase in the SPEI and scPDSI indicates a decrease in drought, and vice versa.
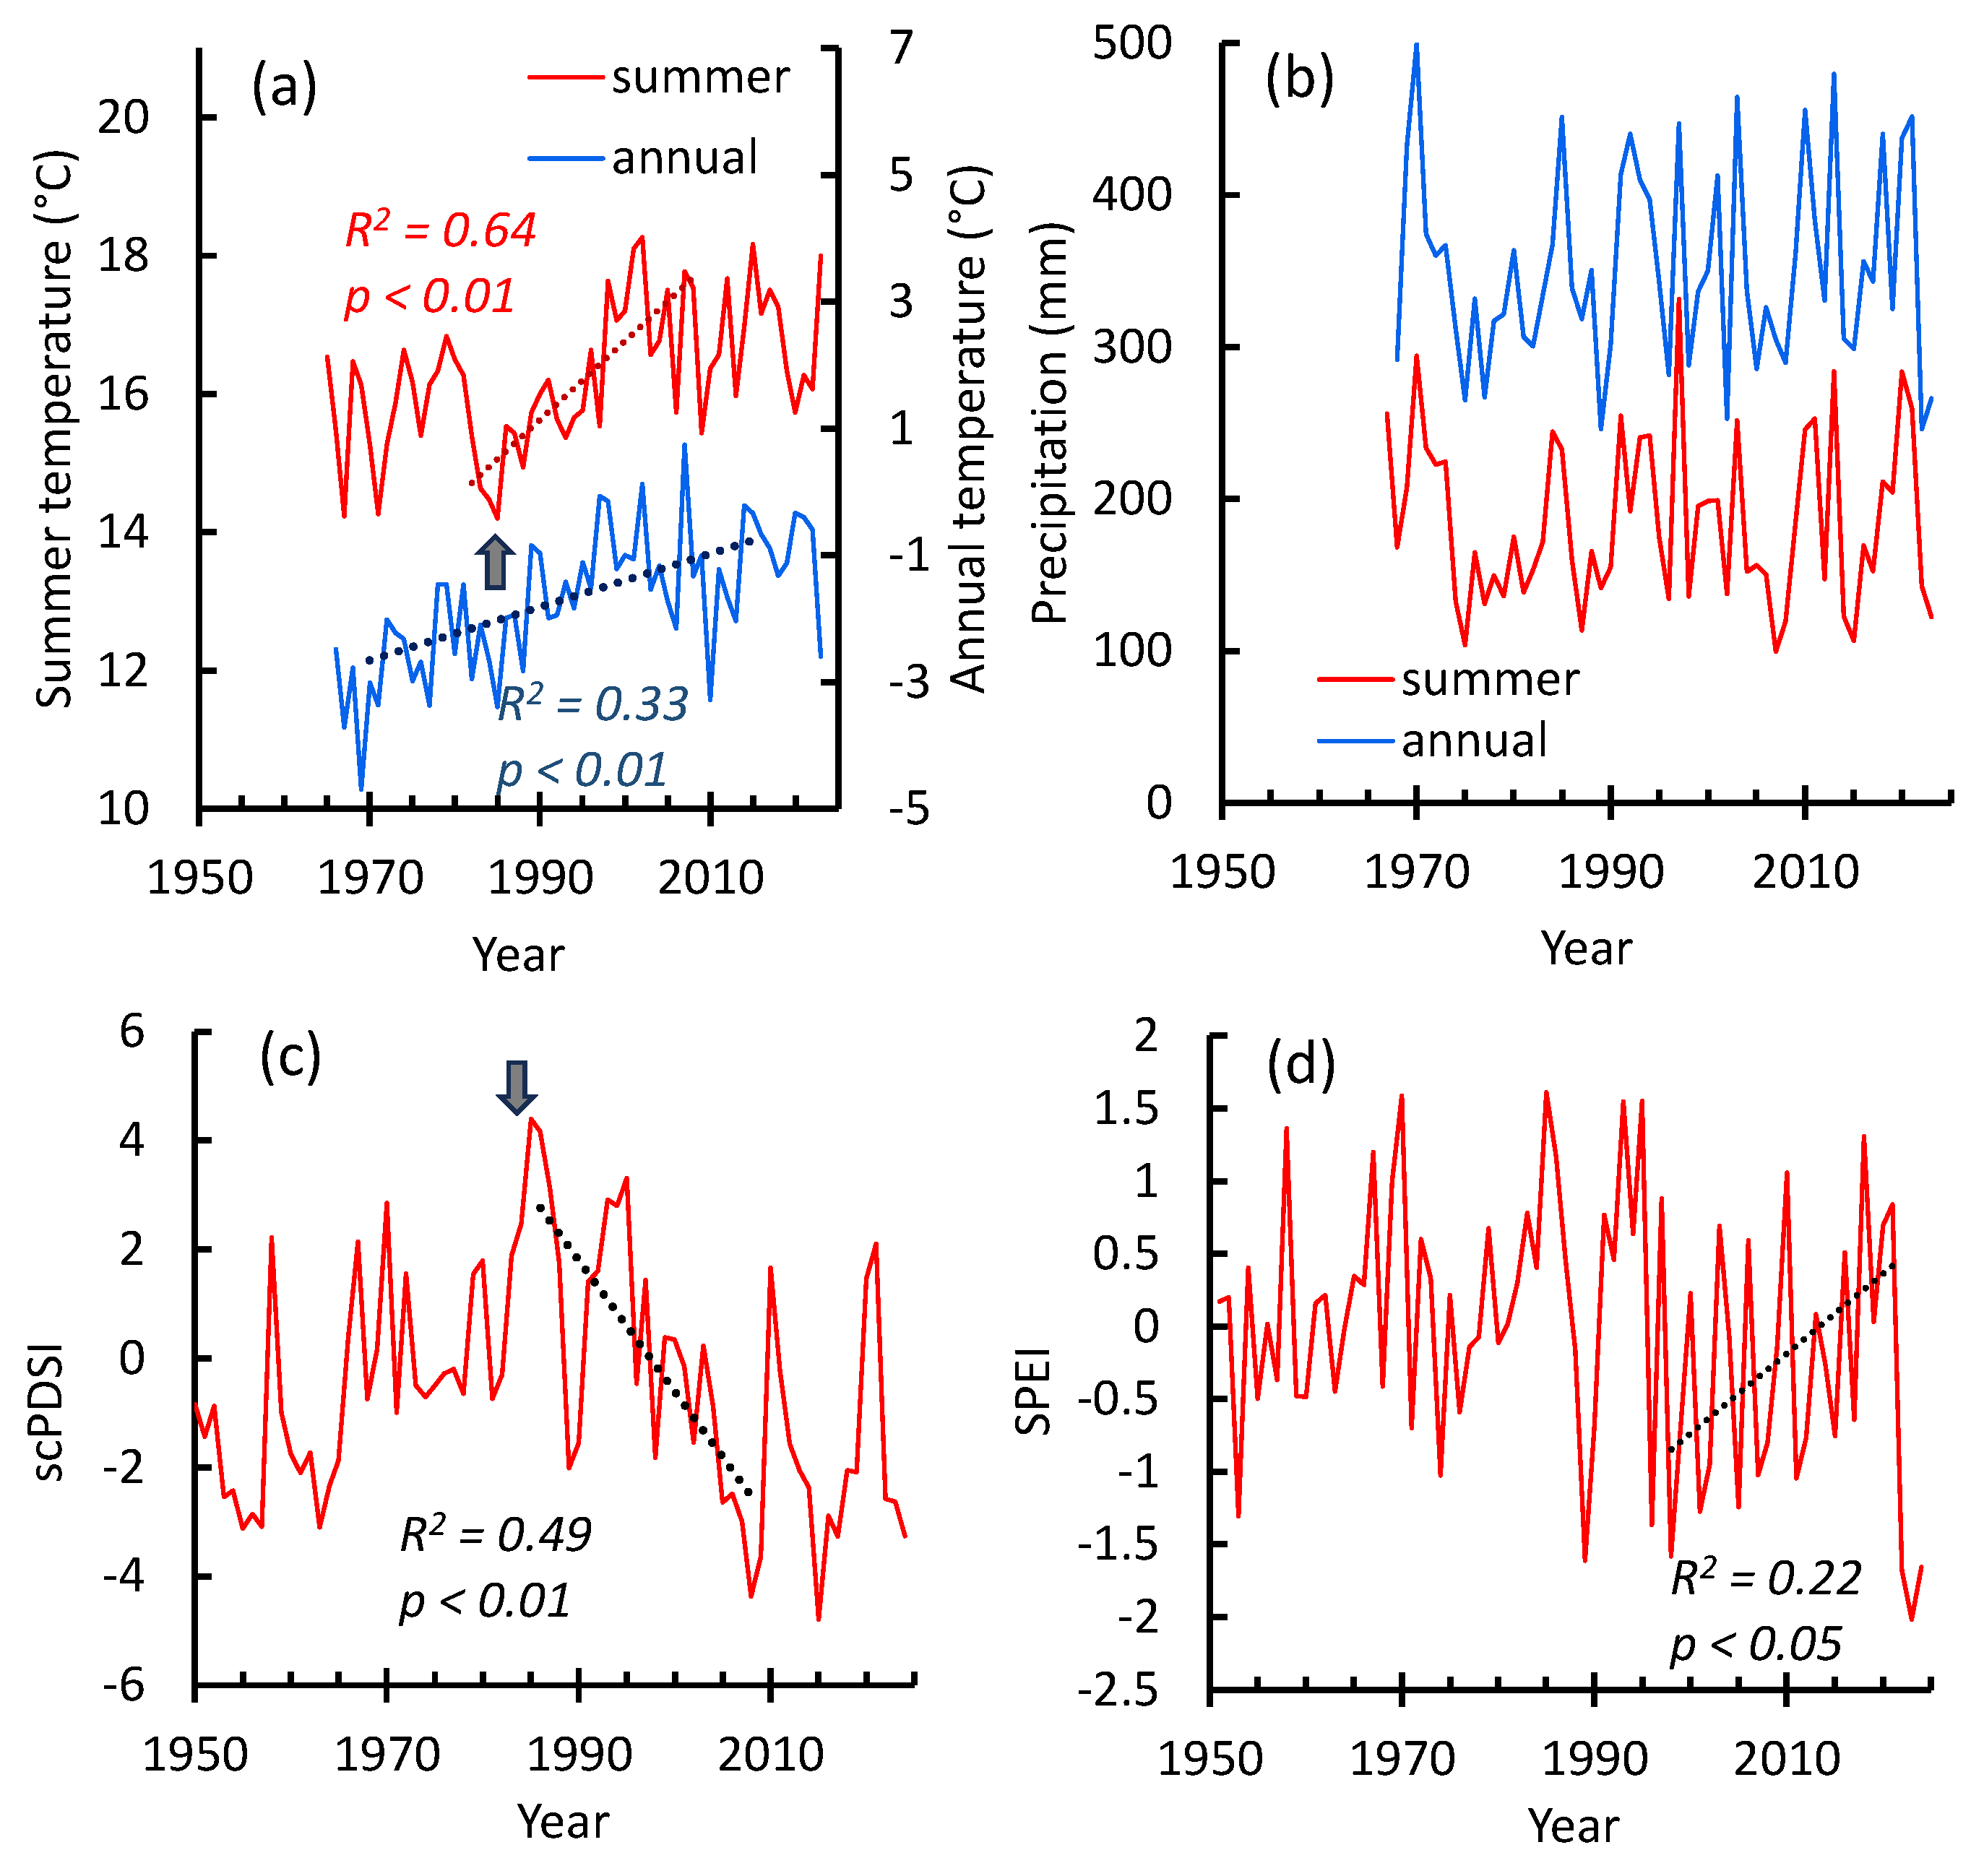
An increase in summer air temperature occurred from 1985 until c. 1998 y following its high fluctuations (Figure 2a). In the 21st century, mean summer temperature surpassed former values on about +1.3ºС. The annual air temperature has increased since the 1970s until c. 2010 (Figure 2a). No significant precipitation trends were found, although local significant maximums occurred in the 2010–2013 and 2020–2023 years (Figure 2b). Warming-driven summer temperature increase (1985 y) coincided with soil drought increase (indicated by the decrease in the Palmer index (Figures 2c,d)). In the recent years (c. 2010–2023) was a period of increased precipitation and decreased soil and air drought (Figures 2b,c,d).
2.8. Statistical Analysis
Spatial data was processed using the ESRI ArcGIS software package (https://www.esri.com/ru-ru/arcgis/geospatial-platform/overview). Microsoft Excel and Statsoft Statistica (https://statsoftai.ru) software were used for statistical calculations. Standard correlation (Pearson and Spearman) and regression (simple linear and Theil-Sen) analyses were used to identify the relationships between dendrochronological series, satellite data, and climate variables.
3. Results
3.1. Field Data
Stands inventory data are given in Table 1. Stands in Ulug-Hady and Biche-Hady mostly low closed (crown closure about 0.3). The crown closure in the Balgazyn site was about 0.6. All study pine stands are growing on poor organic sandy soils. The ground cover formed by Poaceae species, Artemisia spp. and Orostachys spinosa L., Centaurea sp., Caragana sp.). All stands were influenced by periodic surface fires, which caused partial mortality of the mother canopy and severe mortality of the young cohort of Scot pine (Figure 3).
Figure 3.
Felled trees and post-fire regeneration at the Biche-Hady site (indicated by the arrows on (a) and (b)). (a), (b) – satellite scenes taken in 1999 and 2024, (c) – taken in 2024. Severe surface fire occurred in 1999 y.
Figure 3.
Felled trees and post-fire regeneration at the Biche-Hady site (indicated by the arrows on (a) and (b)). (a), (b) – satellite scenes taken in 1999 and 2024, (c) – taken in 2024. Severe surface fire occurred in 1999 y.
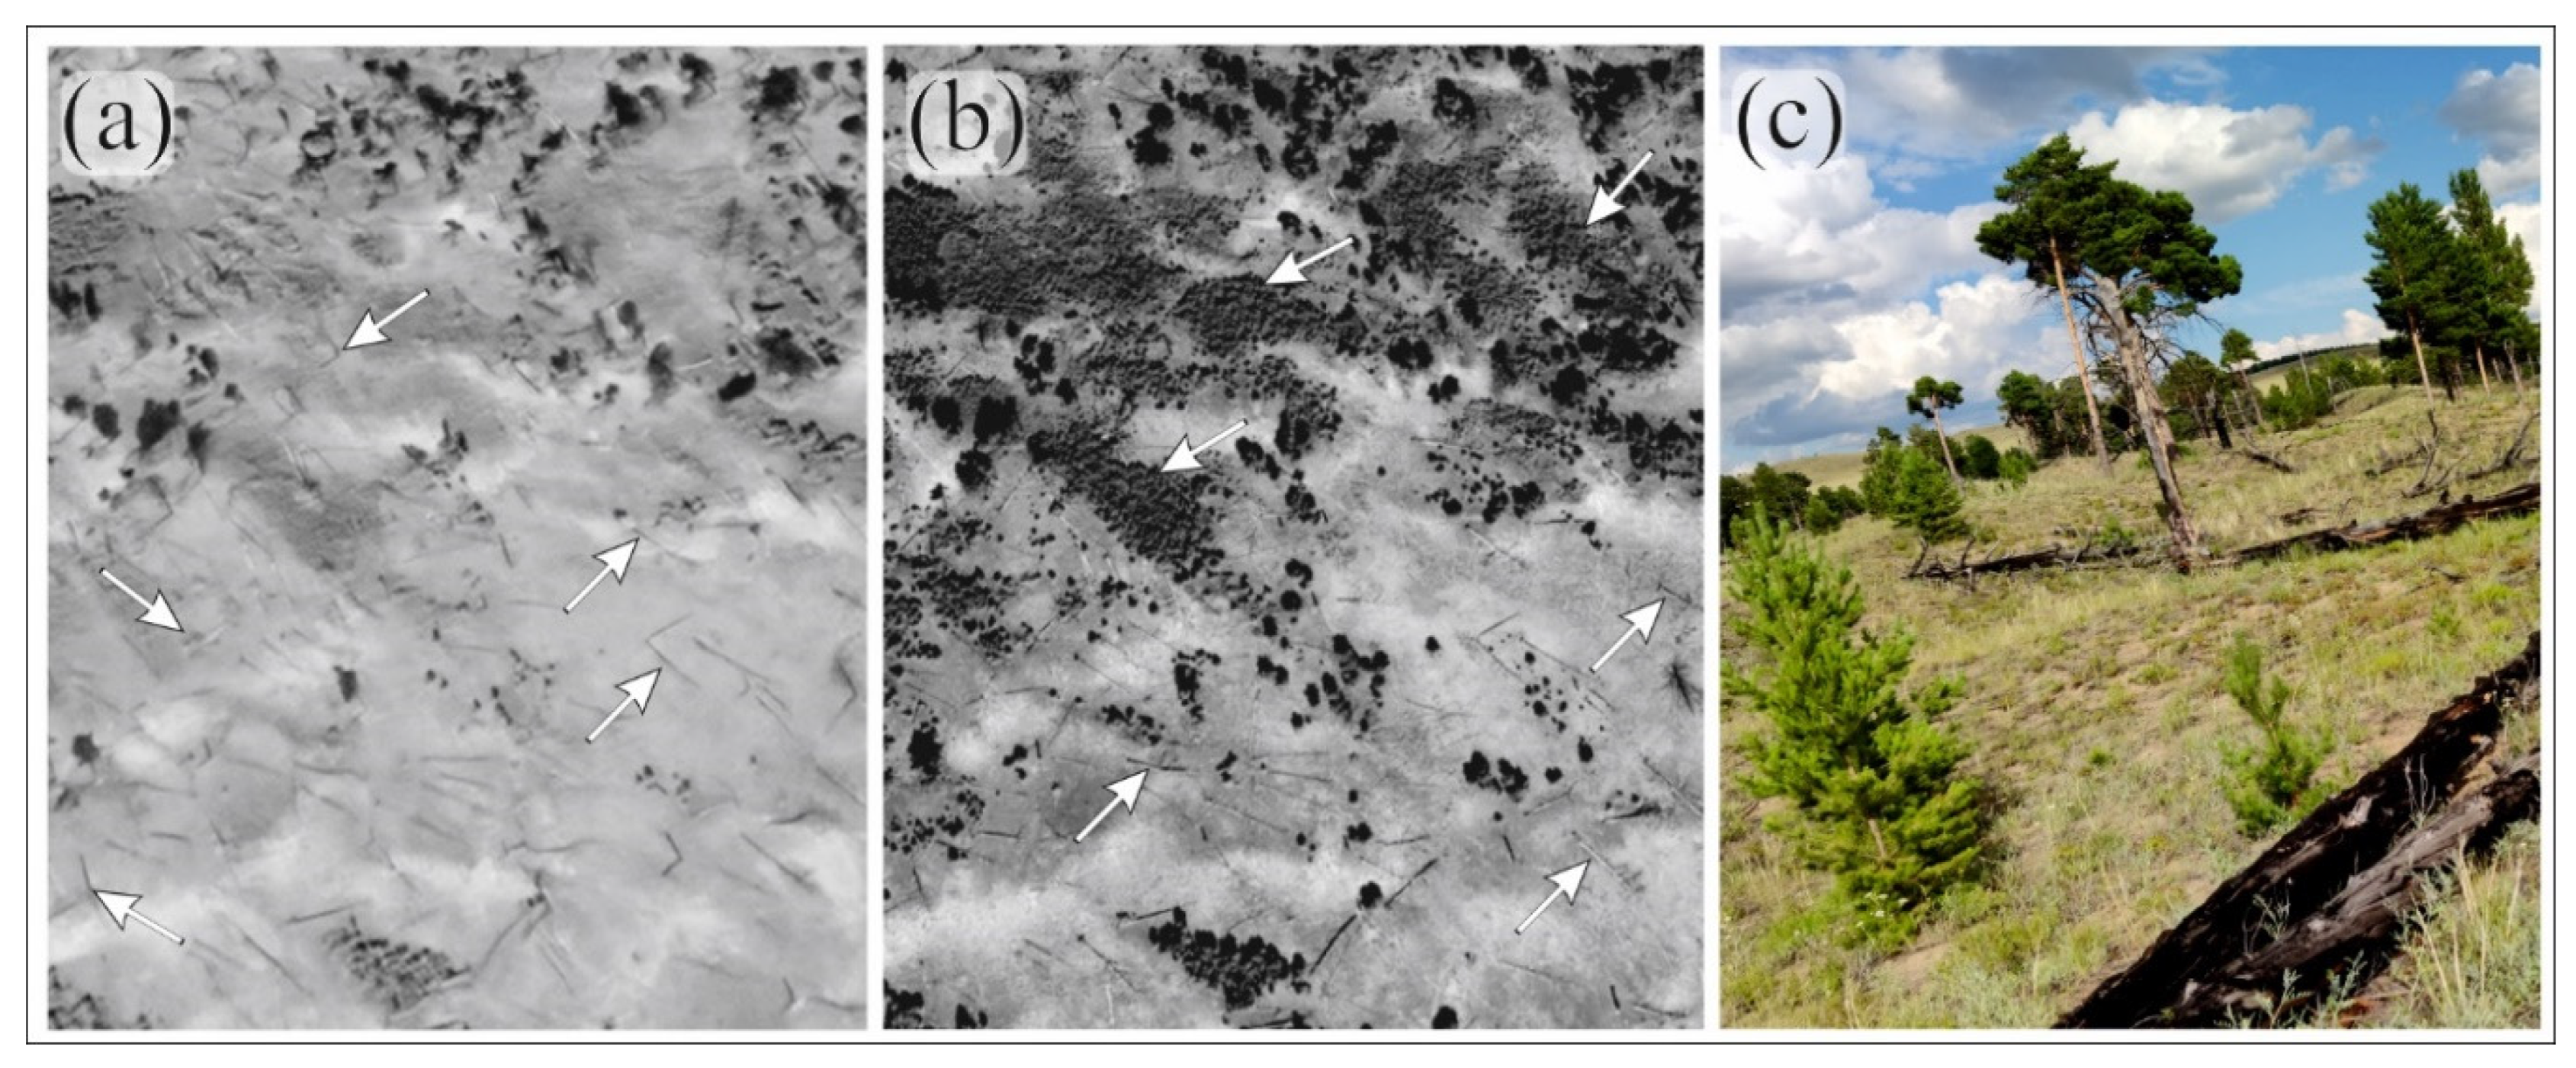

Table 1.
Study pine stands inventory data.
| Sites | Coordinates | Age, y | Height, m | Diameter, cm | Seedlings, thousands/ha | Crown closure |
|---|---|---|---|---|---|---|
| Balgazyn | 51° 02´/95° 09´ | 106±6 | 12–17 | 25-35 | 7 | 0.6 |
| Ulug-Hady | 51° 10´/94° 49´ | 119±25 | 13 | 30-35 | 8 | 0.3 |
| Biche-Hady | 51° 10´/94° 47´ | 94±7 | 18 | 35-40 | 10 | 0.3 |
3.2. Chronology of Pine Trees Growth Index
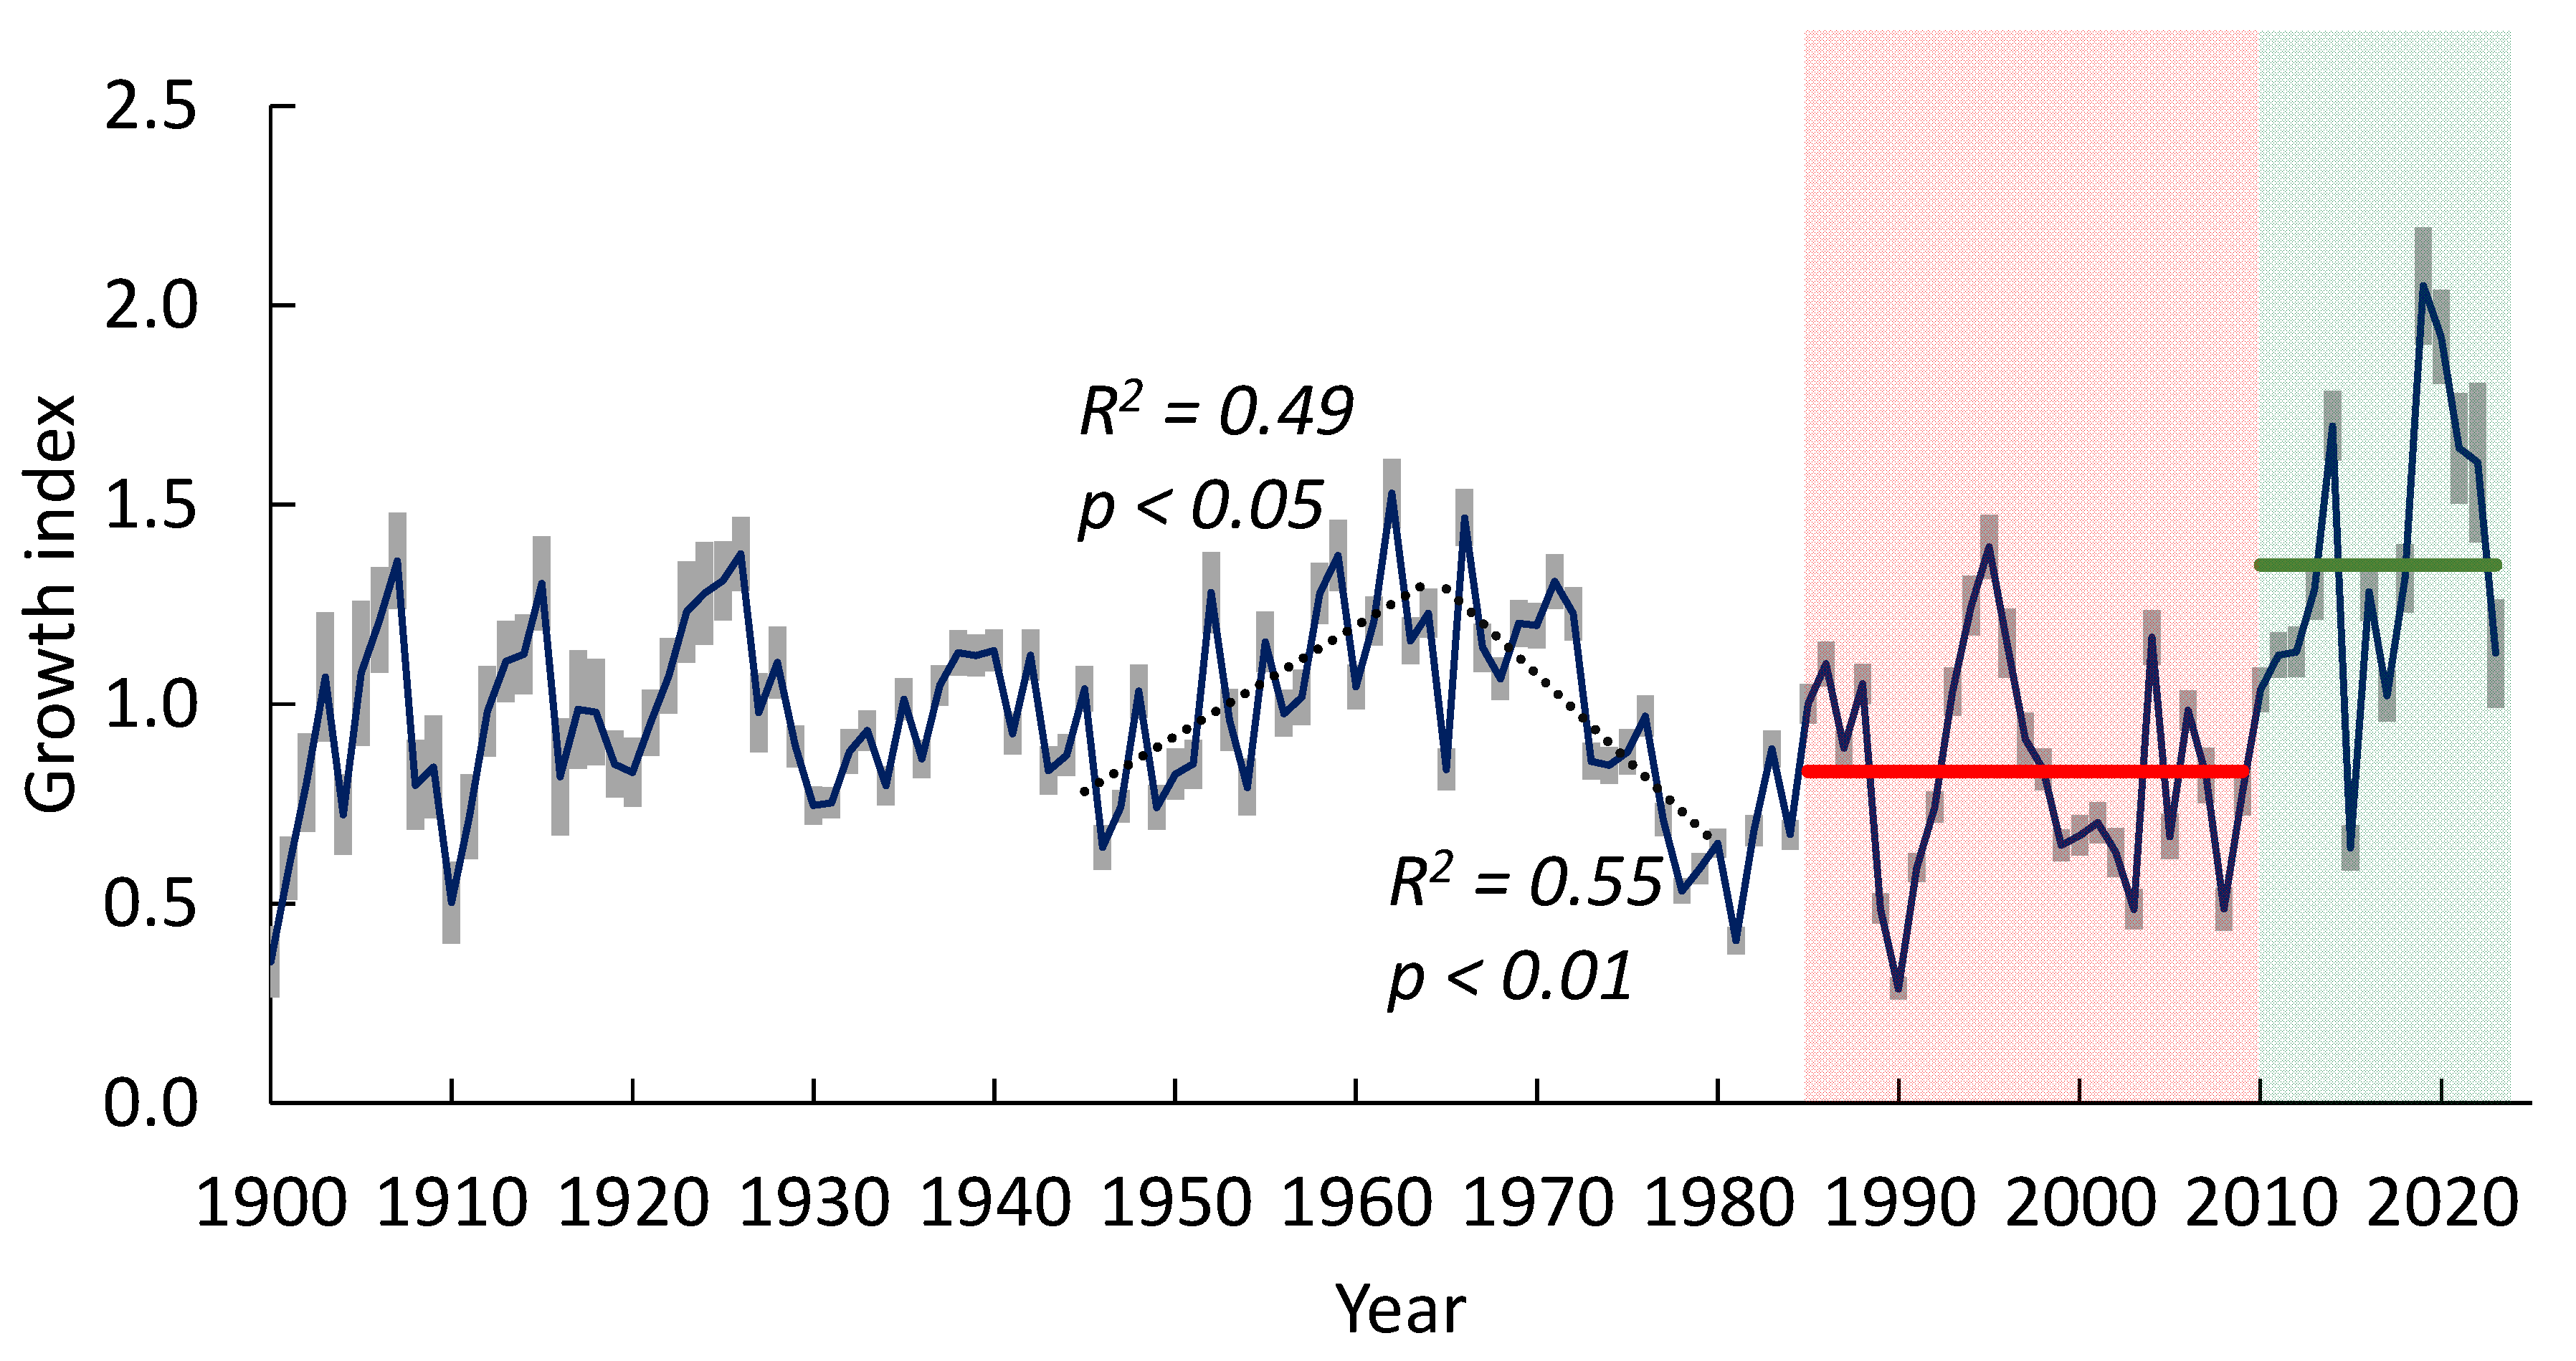
The GI chronologies of all sites were synchronized (inter-serials correlation r = 0.66). Therefore, we used a generalized chronology for all sites. The GI was increasing from the 1940s to the 1960s followed by a decrease until the beginning of the1980s. Since the warming onset (c. 1985), the GI has experienced periods of increase and decrease. The period of the “warming restart” (since c. 1998-2000) is characterized by an increase in the GI. The maximal GI values (in 2018–2022) exceeded its historical values by about 1.4 times (Figure 4). There no chronical decreasing trends in the GI, which are predictors of the trees’ decline [38].
Figure 4.
The tree-ring chronology of pine trees at all sites. The maximum of GI values in 2014 and 2019 exceeded its historical values by 1.4 times. The red and green lines indicate mean GI values for the years 1985–2009 (0.83±0.11) and 2010–2023 (1.35±0.20), respectively. “Green” and “red” periods were used in further dendroclimatic analysis. The grey bars indicate a confidence level of p < 0.05.
3.3. Pine Trees Growth Index: Relationship with Climate Variables
3.3.1. Correlations Between the Growth Index and Climate Variables
In this paragraph, we compared two period of trees growth: (1) since warming-driven summer temperature increase (c. 1985, Figure 2a) until beginning of soil drought decrease (2009), and (2) since soil and air drought decrease (2010) until 2024 y (Figure 2c). Those periods indicated by red and green bars on the Figure 4, respectively.
May-June air temperatures negatively influenced the trees’ GI during both analyzed periods. However, during increasing tree growth period (2010–2023), the influence of temperature became insignificant in July-August (Figure 5a). Maximal values of the GI dependence on precipitation shifted from May (in 1985–2009) to June (2010–2024), which referred the precipitation shift to earlier dates (Figure 6).
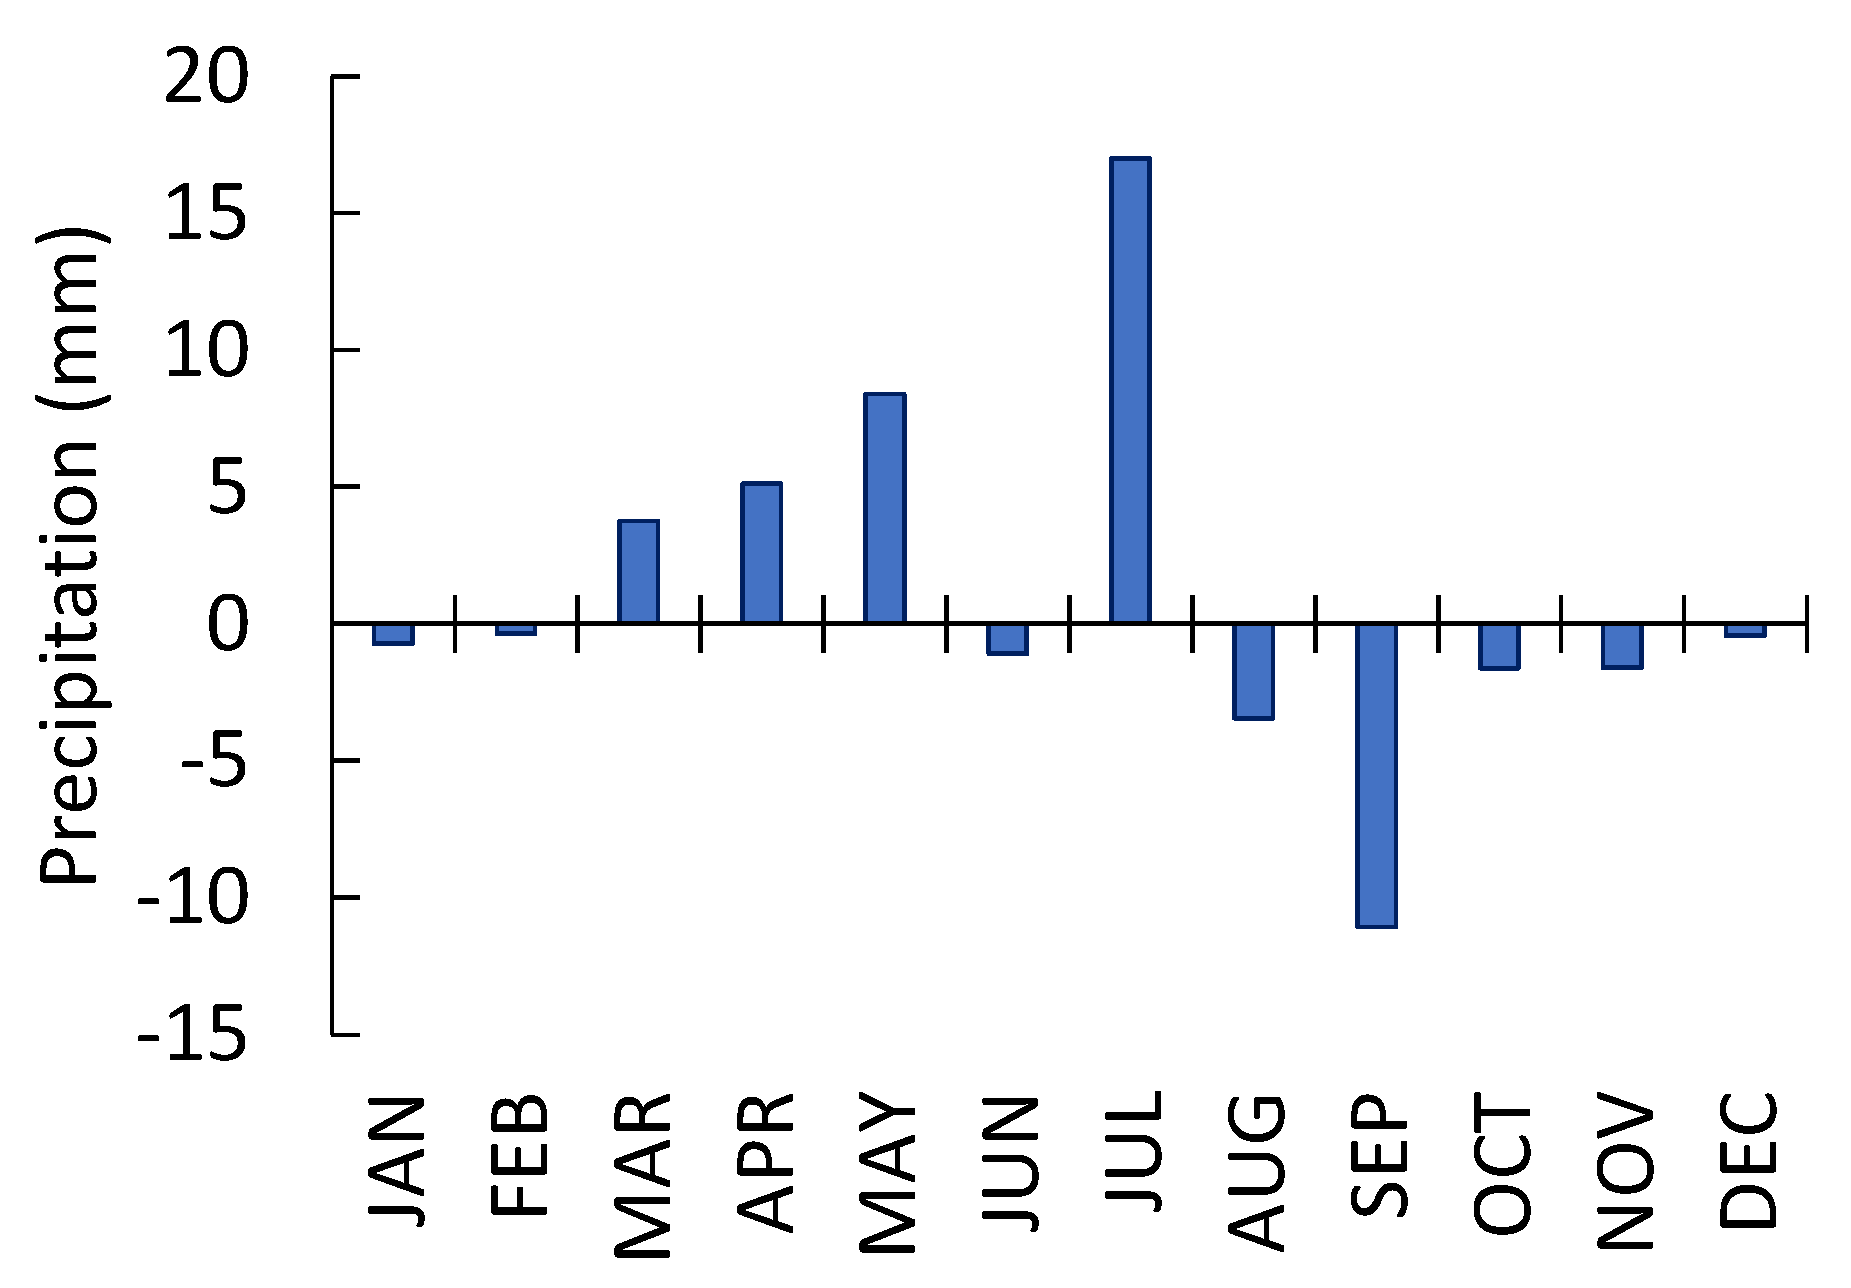
The precipitation pattern changed during the time interval 2010–2023 compared to 1985–2009. The maximum of precipitation shifted to early dates, i.e., precipitation increased in April-July and decreased in August-September. Precipitation during the cold period (October-February) did not change (Figure 6).
The dependence of the GI on the soil moisture (indicated by Palmer’s scPDSI) significantly differed between the analyzed periods. Earlier (1985–2009), the GI was correlated with soil moisture during all growth period with maximal values in May, whereas now (2010–2024) correlations with April–June soil moisture became insignificant due to both precipitation increase and precipitation shift to the earlier dates (Figure 5c, 6).
Figure 5.
Spearman’s correlations of GI with temperature (a), precipitation (b), scPDSI (c) and SPEI (d). The red and green lines indicate p-levels for for 1985–2009 and 2010–2023, respectively. Dashed and solid lines corresponded to p < 0.) and p < 0.05.
Figure 5.
Spearman’s correlations of GI with temperature (a), precipitation (b), scPDSI (c) and SPEI (d). The red and green lines indicate p-levels for for 1985–2009 and 2010–2023, respectively. Dashed and solid lines corresponded to p < 0.) and p < 0.05.
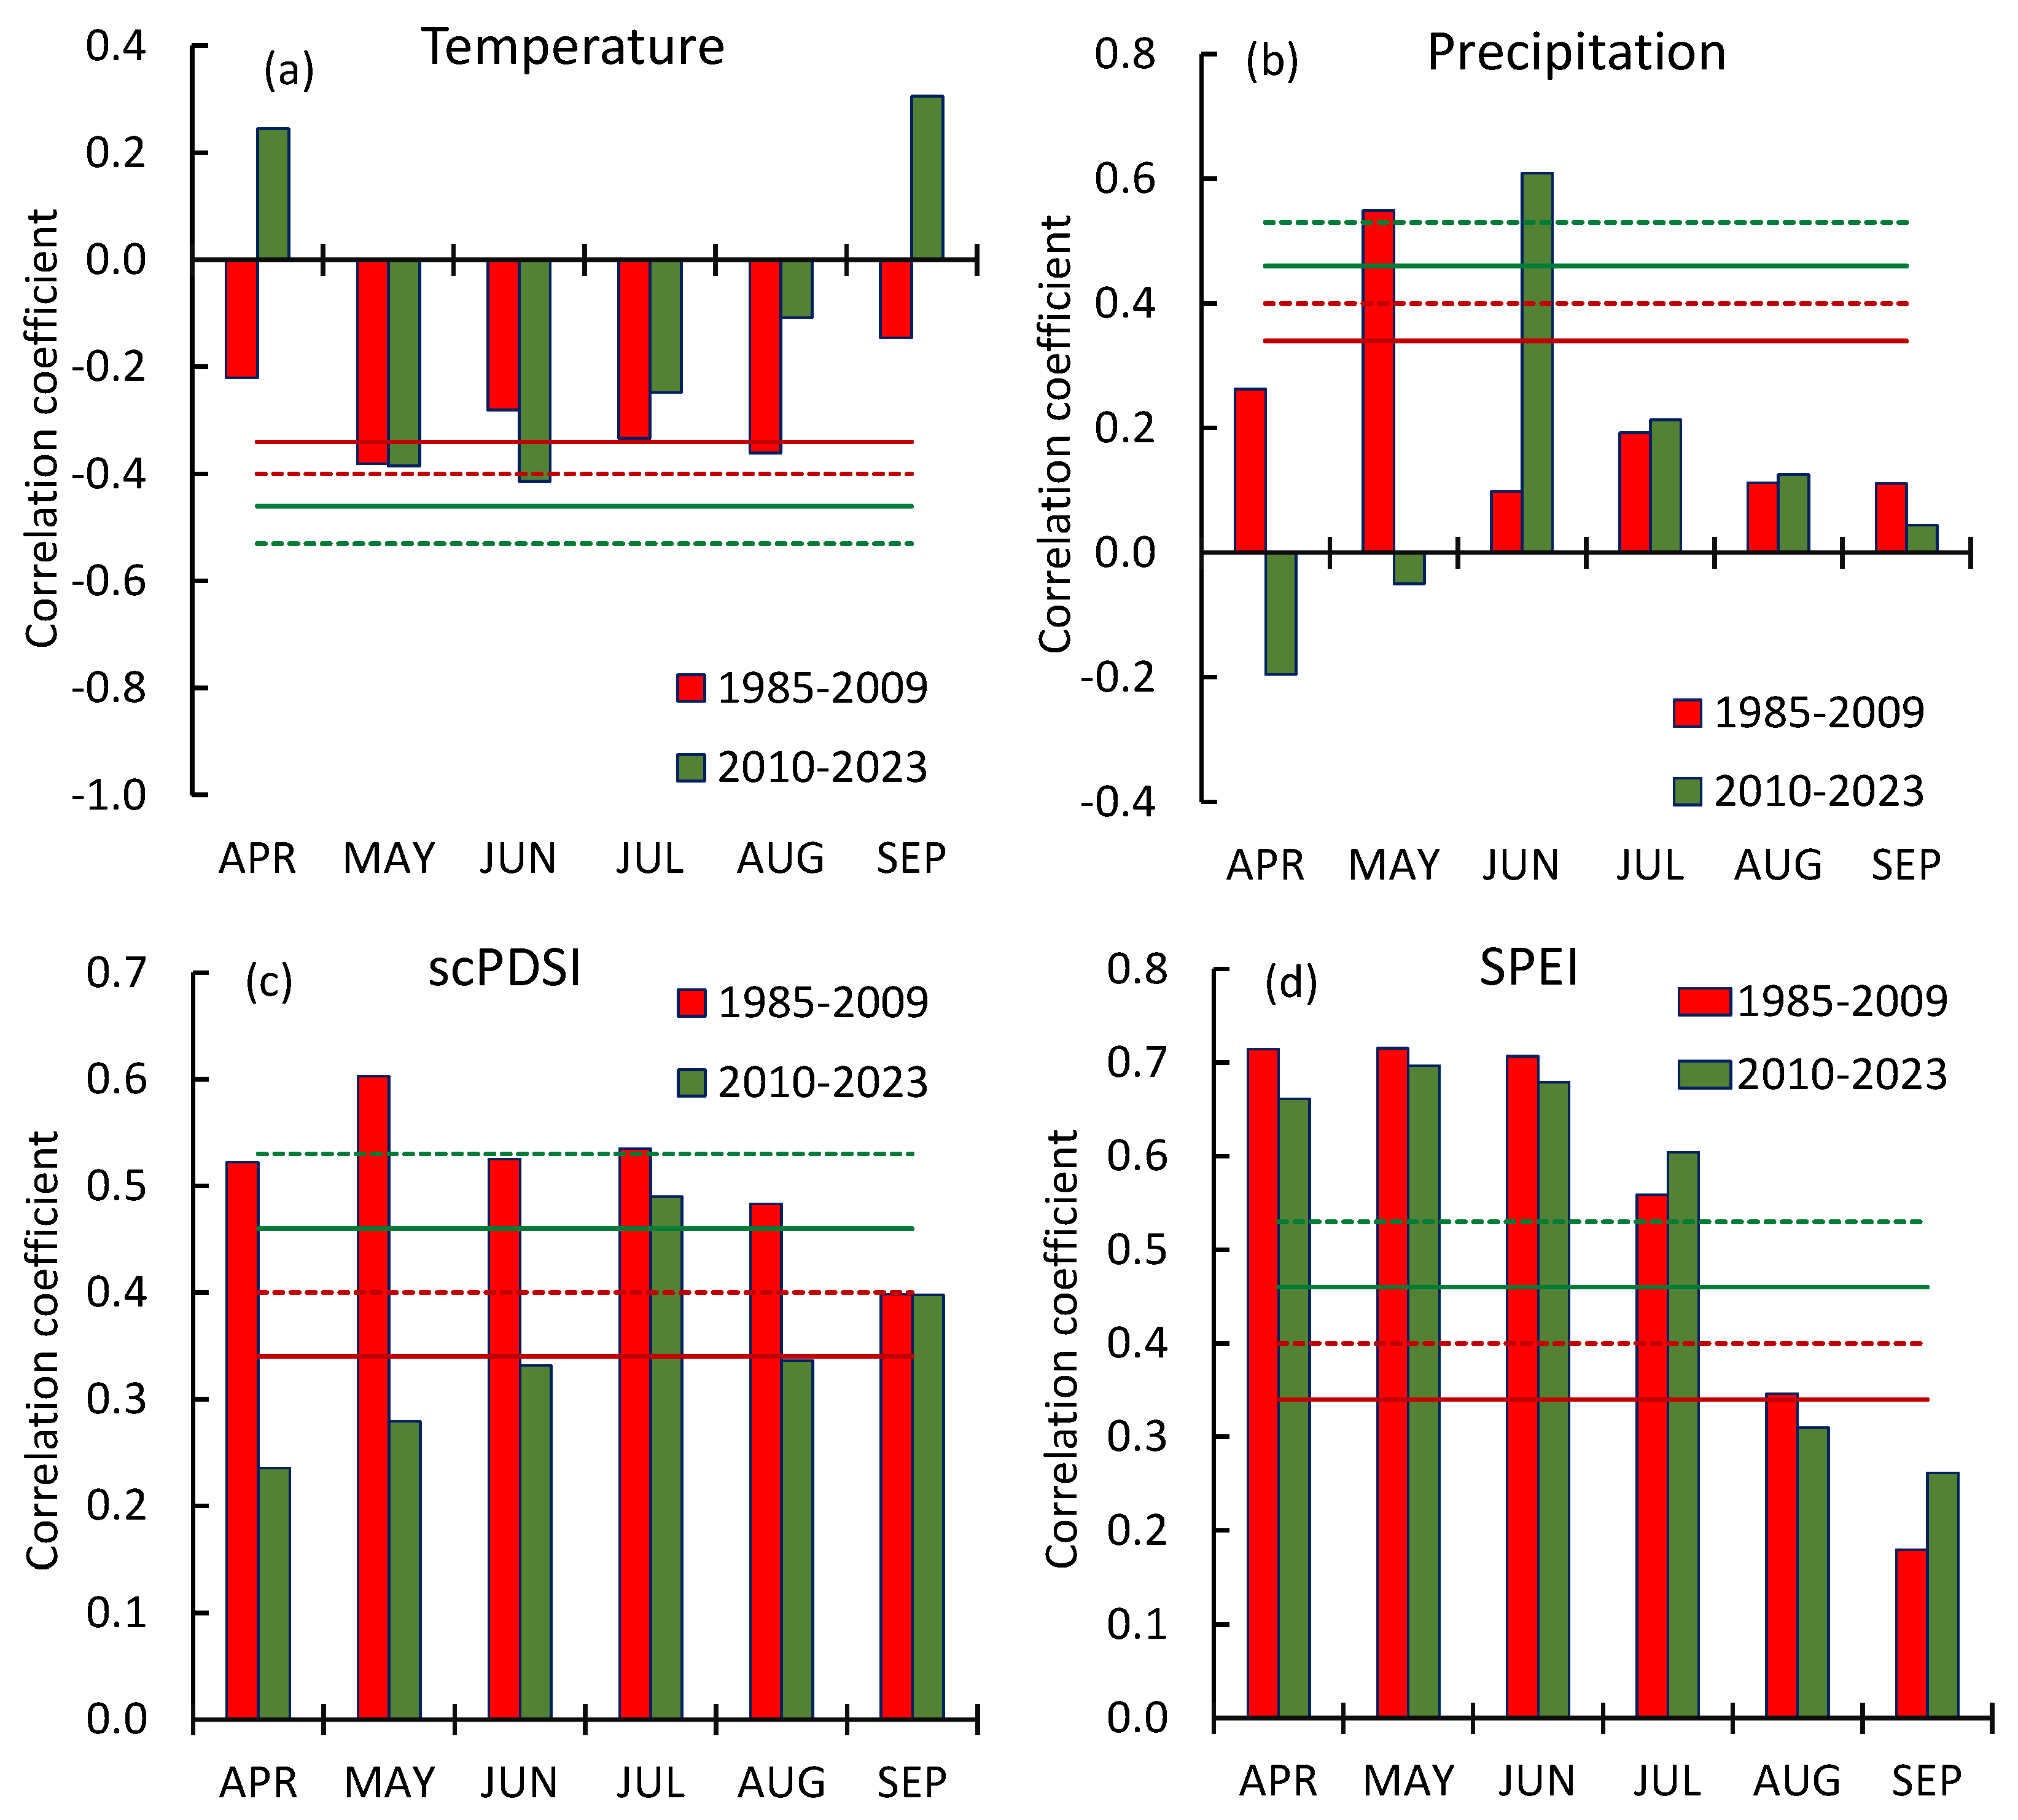
Figure 6.
The difference (delta) between precipitations in 2010–2023 and 1985–2009. The precipitation pattern changed during the time interval 2010–2023 compared to 1985–2009. The maximum of precipitation shifted to early dates, i.e., precipitation increased in April-July and decreased in August-September. Precipitation during the cold period (October-February) did not change.
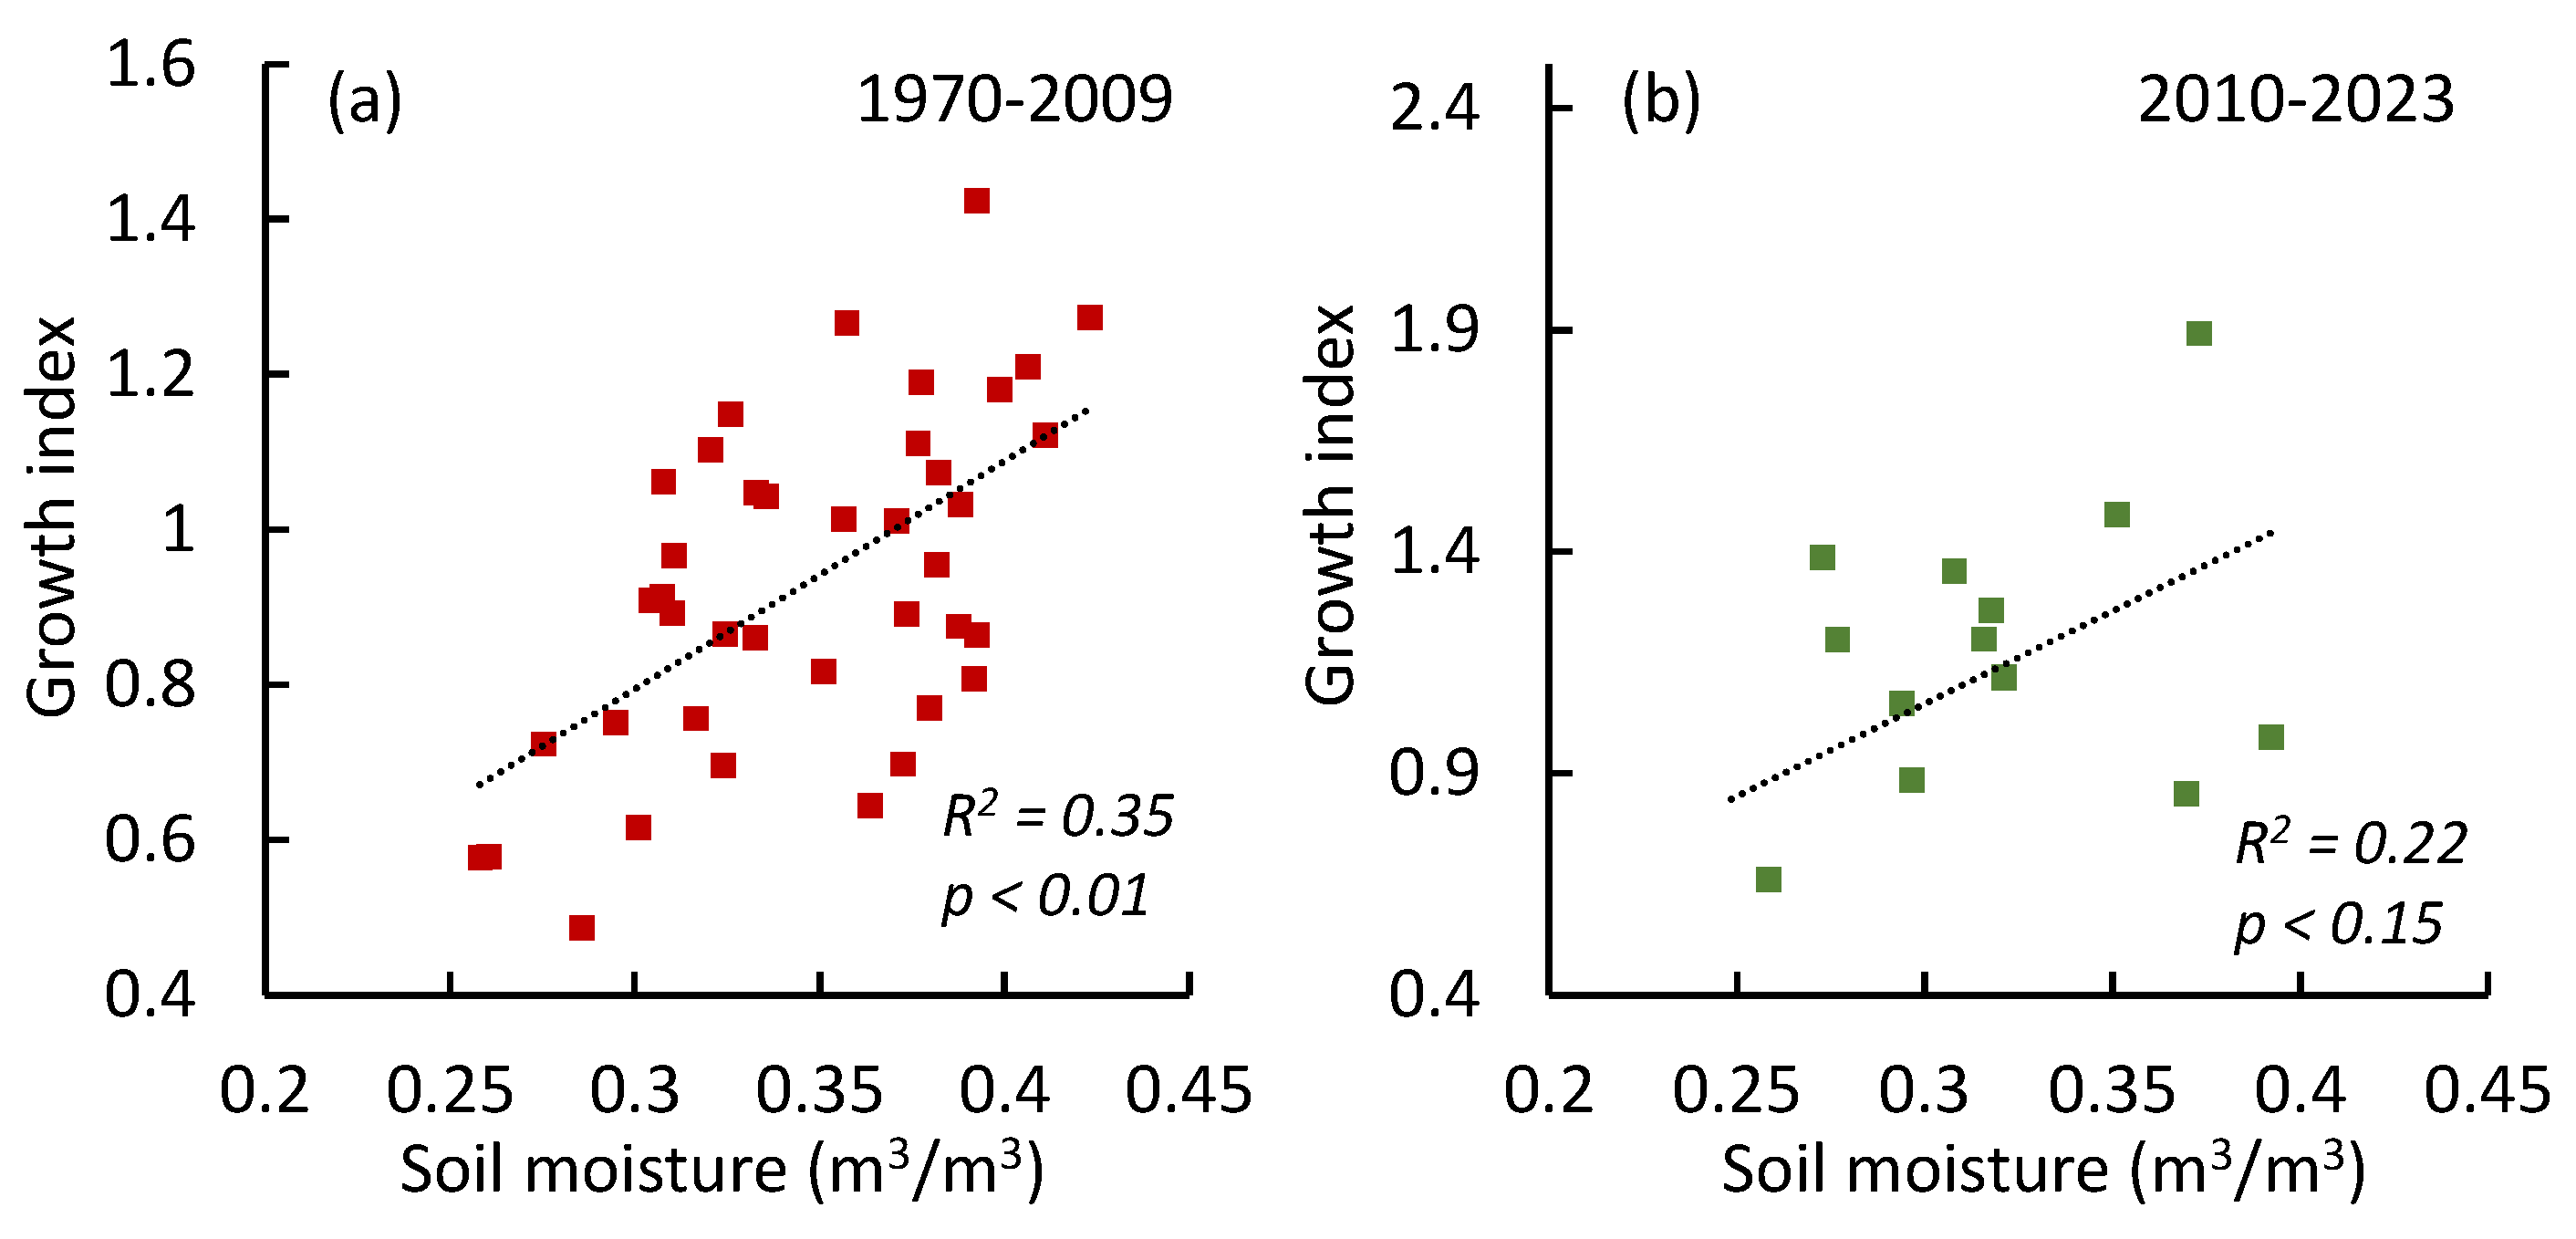
The GI correlations with air drought (indicated by SPEI) were similar for both analyzed time intervals (Figure 5d). It is worth noting that the pine GI is sensitive to the soil moisture in the last year (August-September) (Figure 7). Thus, “conserved” moisture stimulates tree growth, which is significant during “seasonal drought” in the spring. Notable that trees were more sensitive to stored water during low precipitation period compared to increased ones (Figures 7a,b).
Figure 7.
The tree GI positively correlated with the last year (August-September) soil moisture content. That dependence was higher during the period of low precipitation (a), compared to the period with increased precipitation (b).
Figure 7.
The tree GI positively correlated with the last year (August-September) soil moisture content. That dependence was higher during the period of low precipitation (a), compared to the period with increased precipitation (b).
Thus, the increase in air temperature as such does not limit but rather promotes the growth of pines in combination with a sufficient moisture supply. This phenomenon most pronounced during recent years (2018-2022) when warming was synchronized with precipitation increase and soil and air droughts decrease.
3.4. GPP and NPP Trends Within the Study Sites
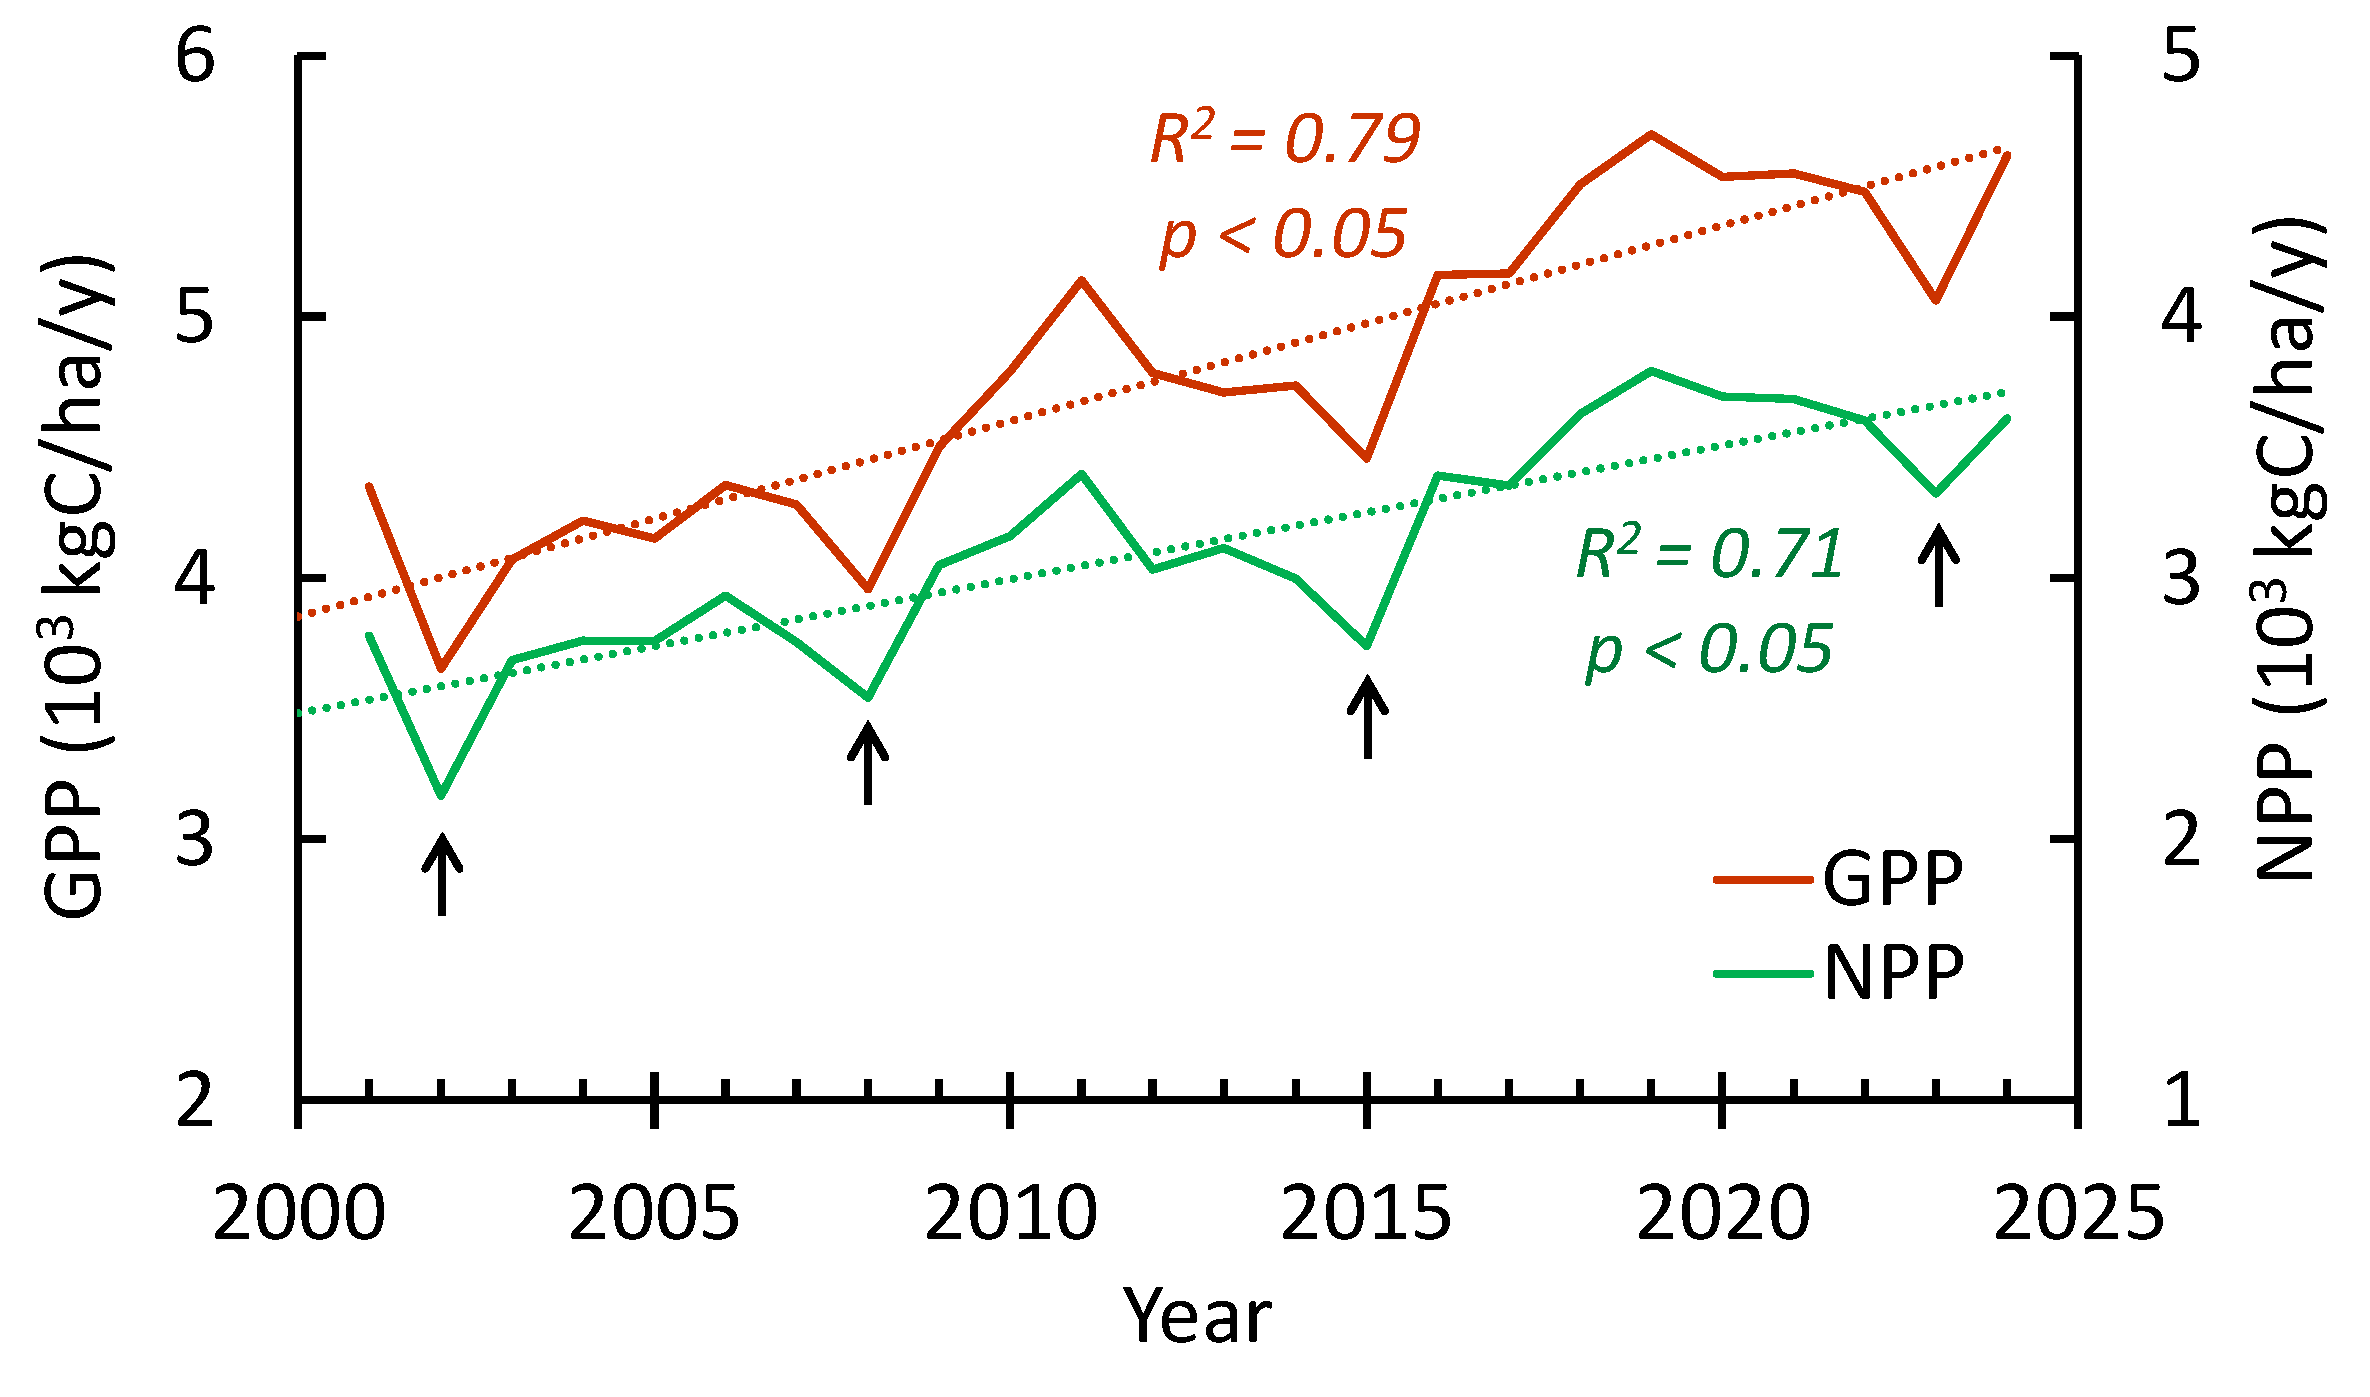
In the 21st century, gross and net primary productivity have been strongly increasing at all study sites. Similar to trees GI, maximal GPP/NPP values occurred in the last decade. Minimal GPP/NPP values corresponding to wildfire events. Despite of repeated fires, strong increasing GPP/NPP trends have been observed (Figure 8).
Figure 8.
Averaged GPP/NPP dynamics throughout all sites. Since warming restart, both GPP and NPP show a strong increase. The arrows indicate the impact of severe fires on the GPP/NPP.
Figure 8.
Averaged GPP/NPP dynamics throughout all sites. Since warming restart, both GPP and NPP show a strong increase. The arrows indicate the impact of severe fires on the GPP/NPP.
Increasing trends of GPP and NPP were also observed throughout the surrounded bush-steppe area (Figure 9).
A delta – difference between GPP/NPP during the period of increased precipitation (2010–2024) and the earlier period (2001–2009) given in Figure 10. It is notable that an increase in the GPP and NPP has been observed throughout the entire territory. In particular, in pine stands both GPP and NPP have increased by about 1.25 times.
Figure 9.
Vegetation GPP and NPP trends. Both the GPP and NPP in relict pine forests (1–3) and in bush-steppe are increasing (p > 0.05). Positive GPP and NPP trends observed in 81% and 88% of the area, respectively. Negative ones observed in less than 1% of the area. Period: 2001–2024. Elevations higher 1,000 m a.s.l. indicated by gray.
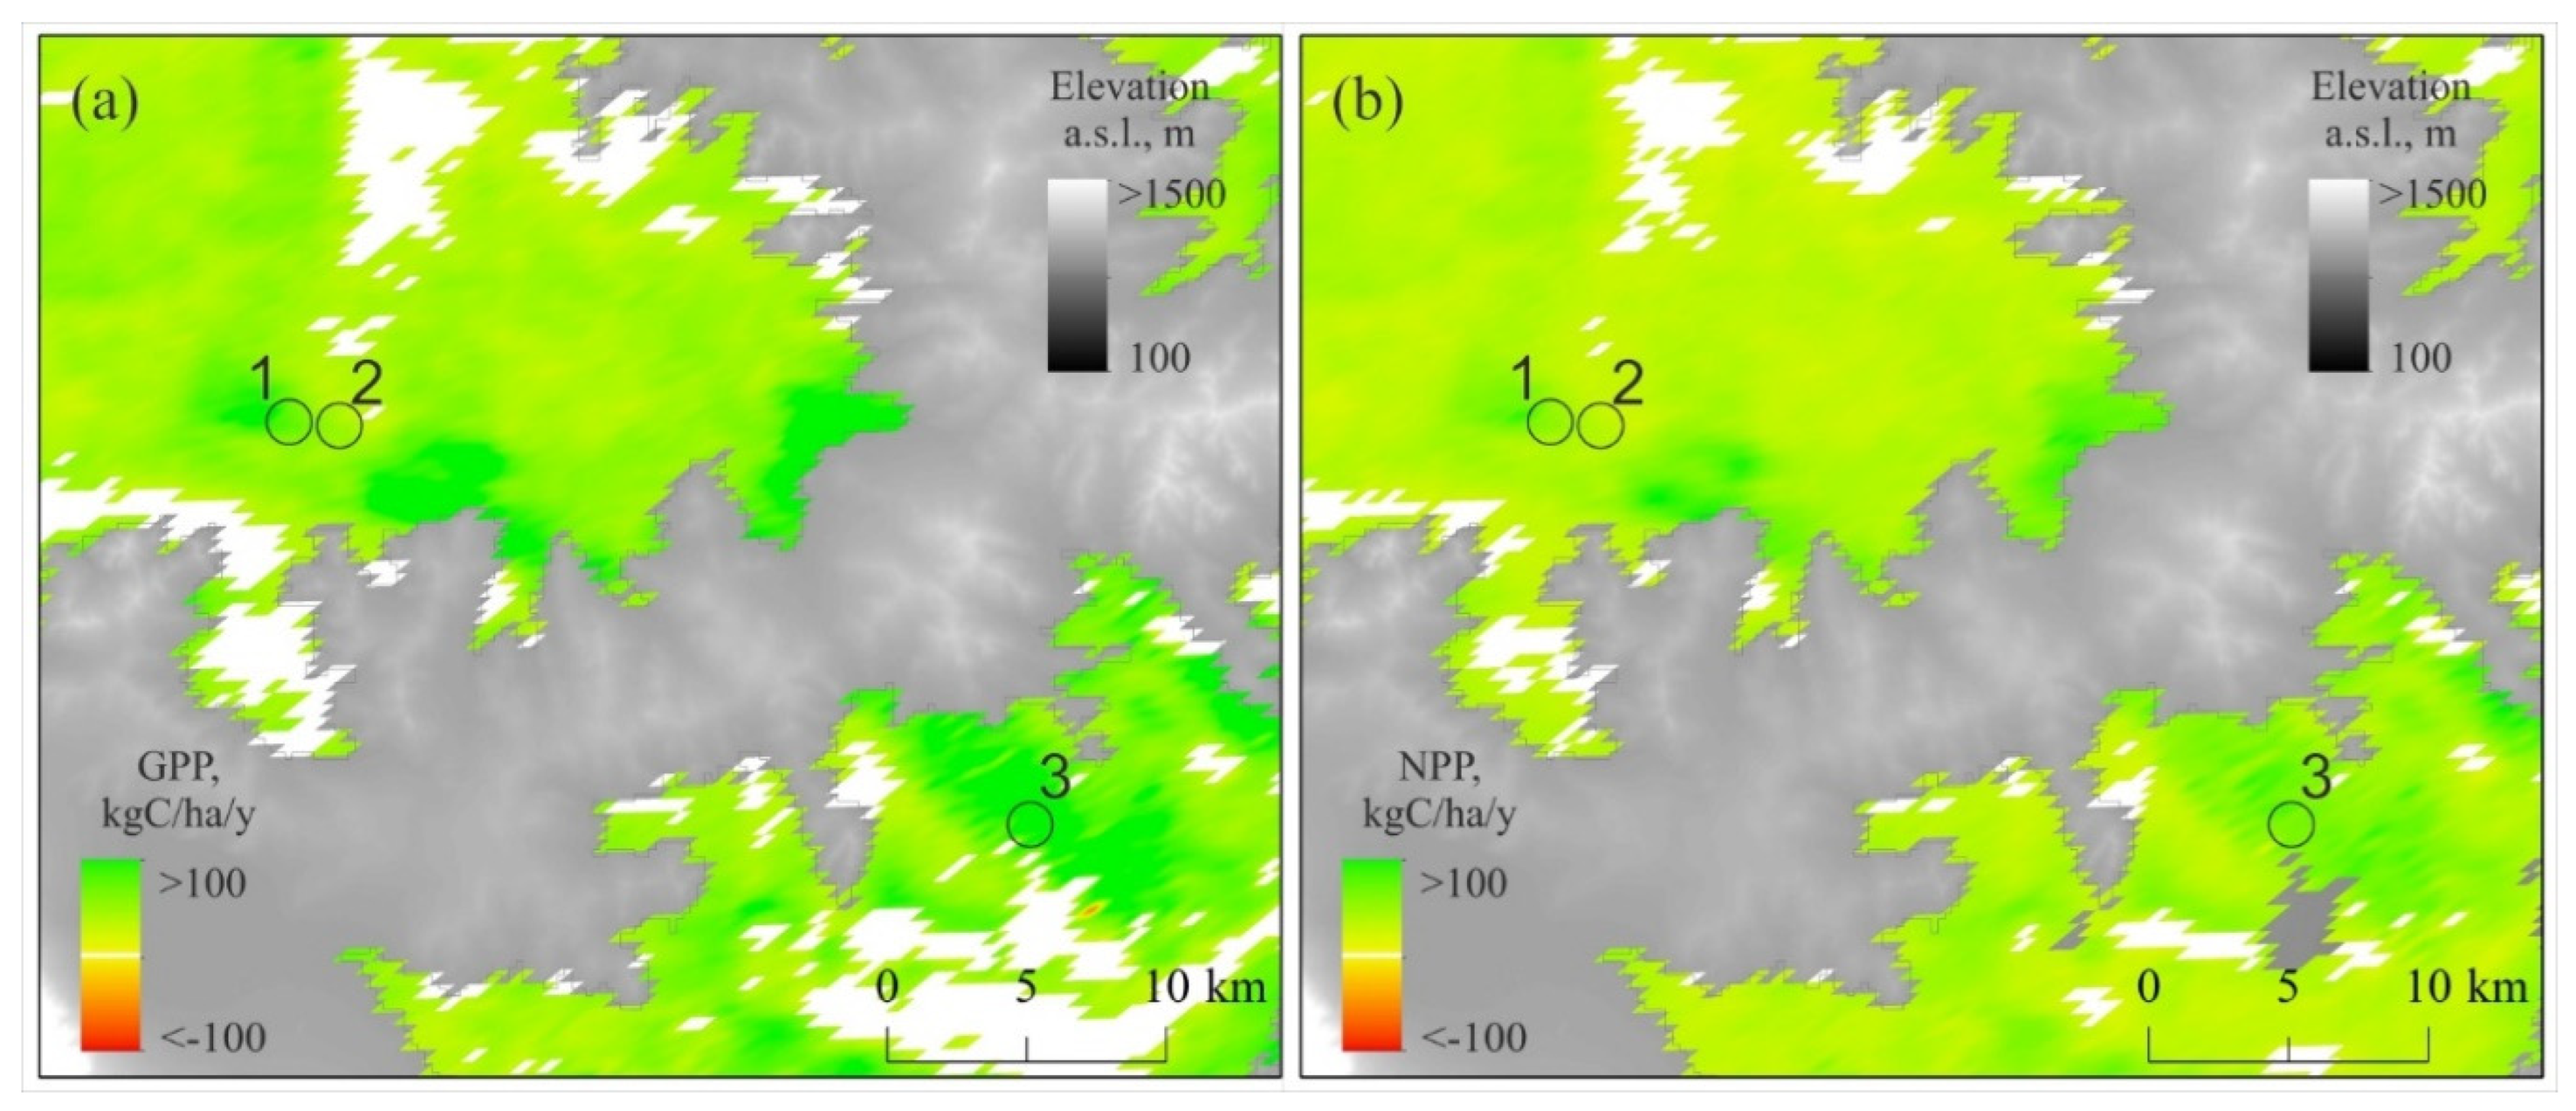
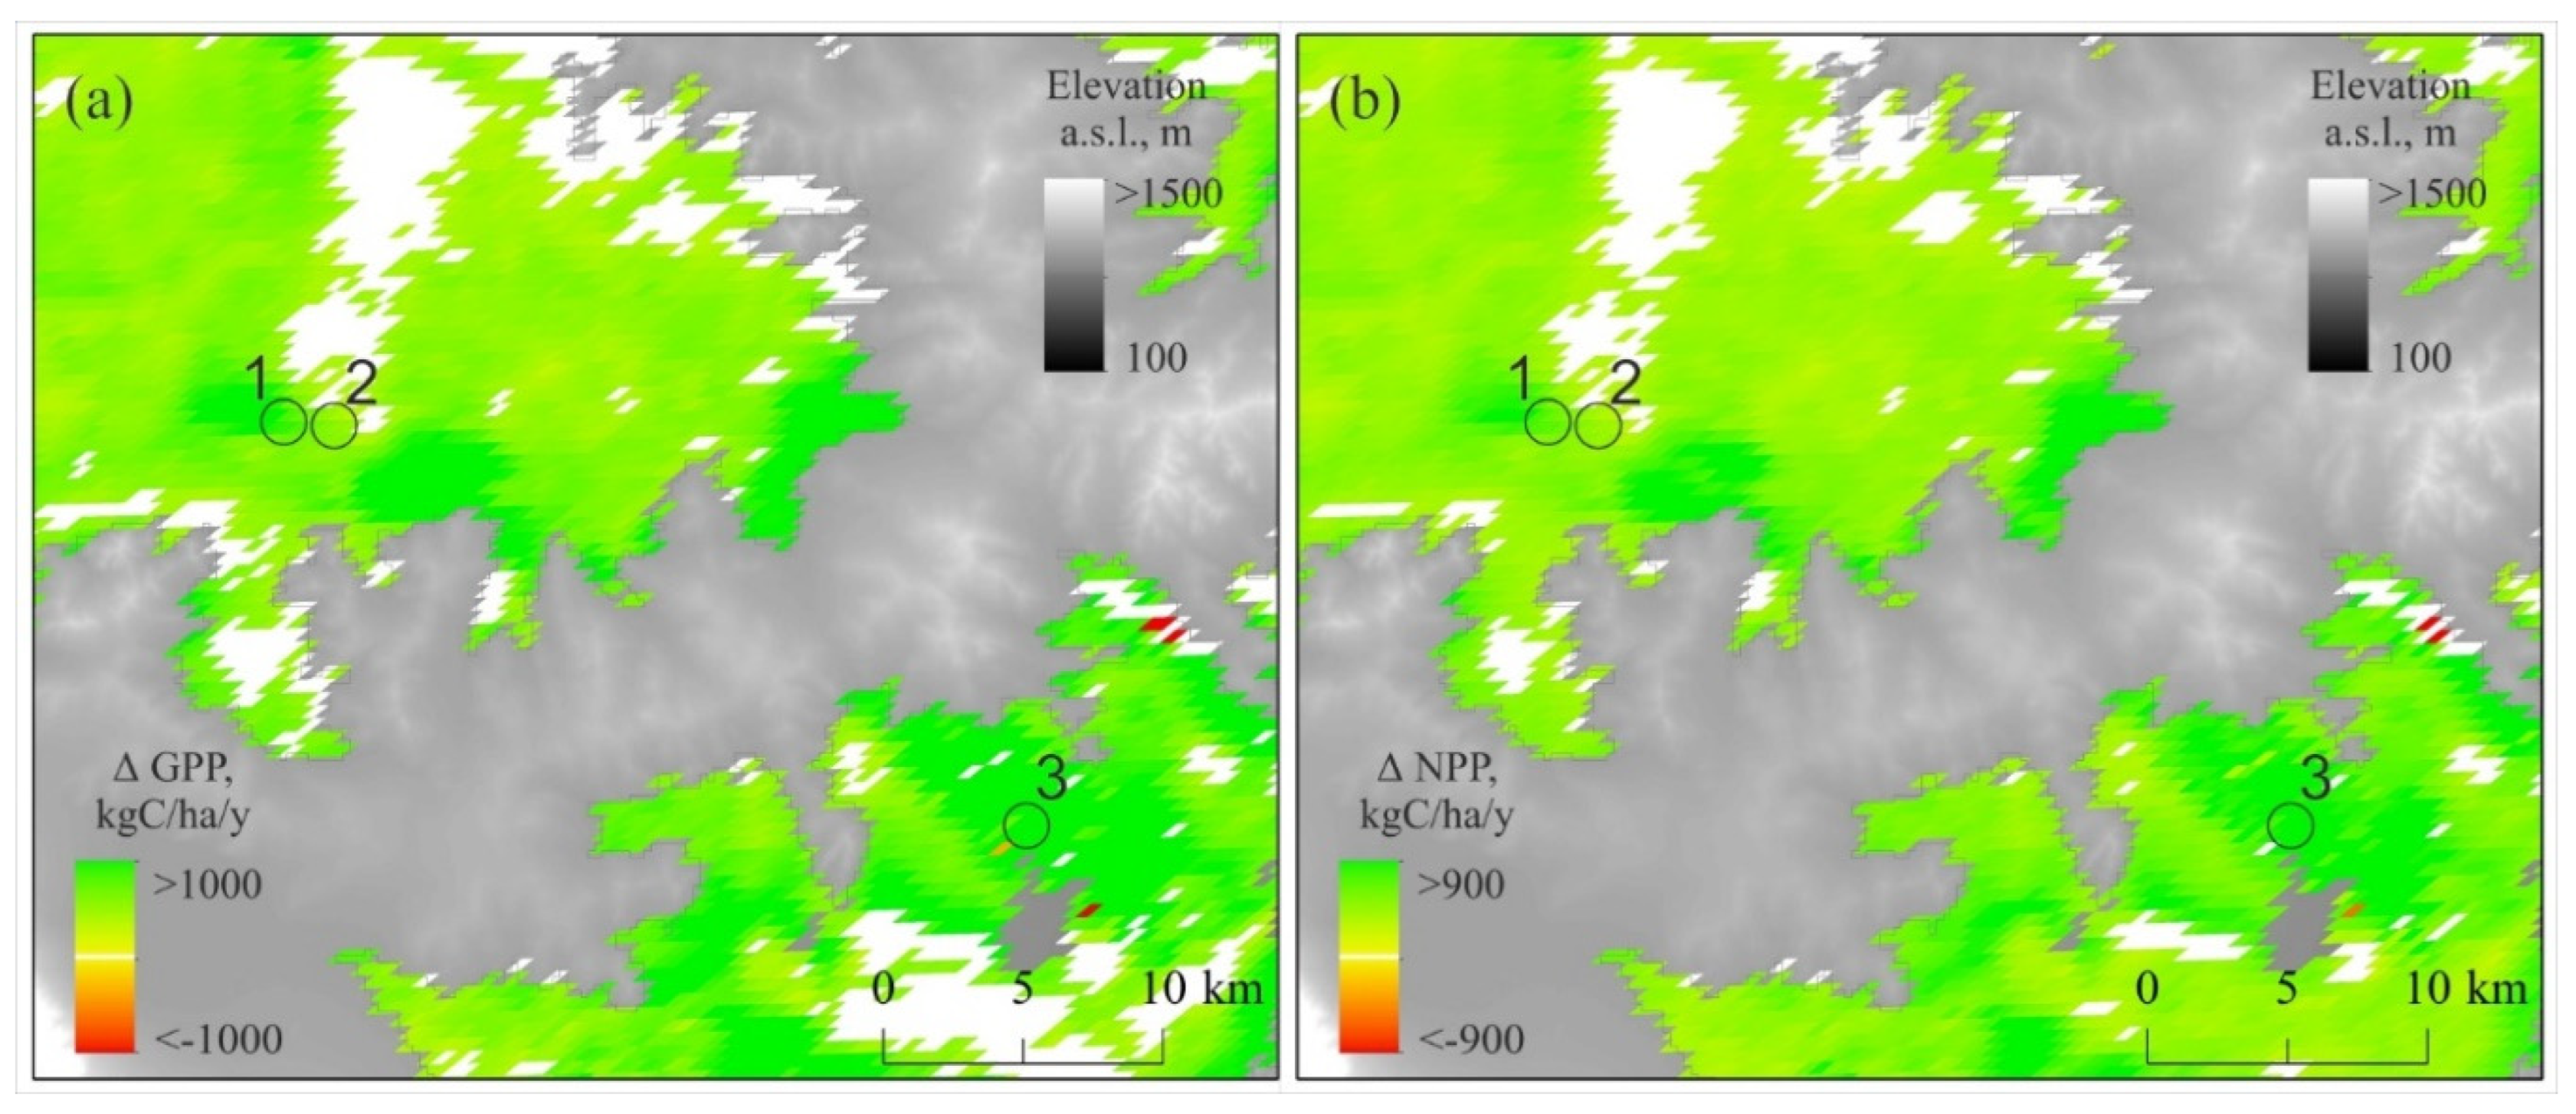
Figure 10.
The difference (delta) between vegetation GPP (a) and NPP (b) values during (2001–2009) and (2010–2024). The positive delta of GPP and NPP occurred in 82% and 93% of the area, respectively. Negative ones were observed in < 1% of the area (p > 0.05). Elevations above 1000 m indicated by gray.
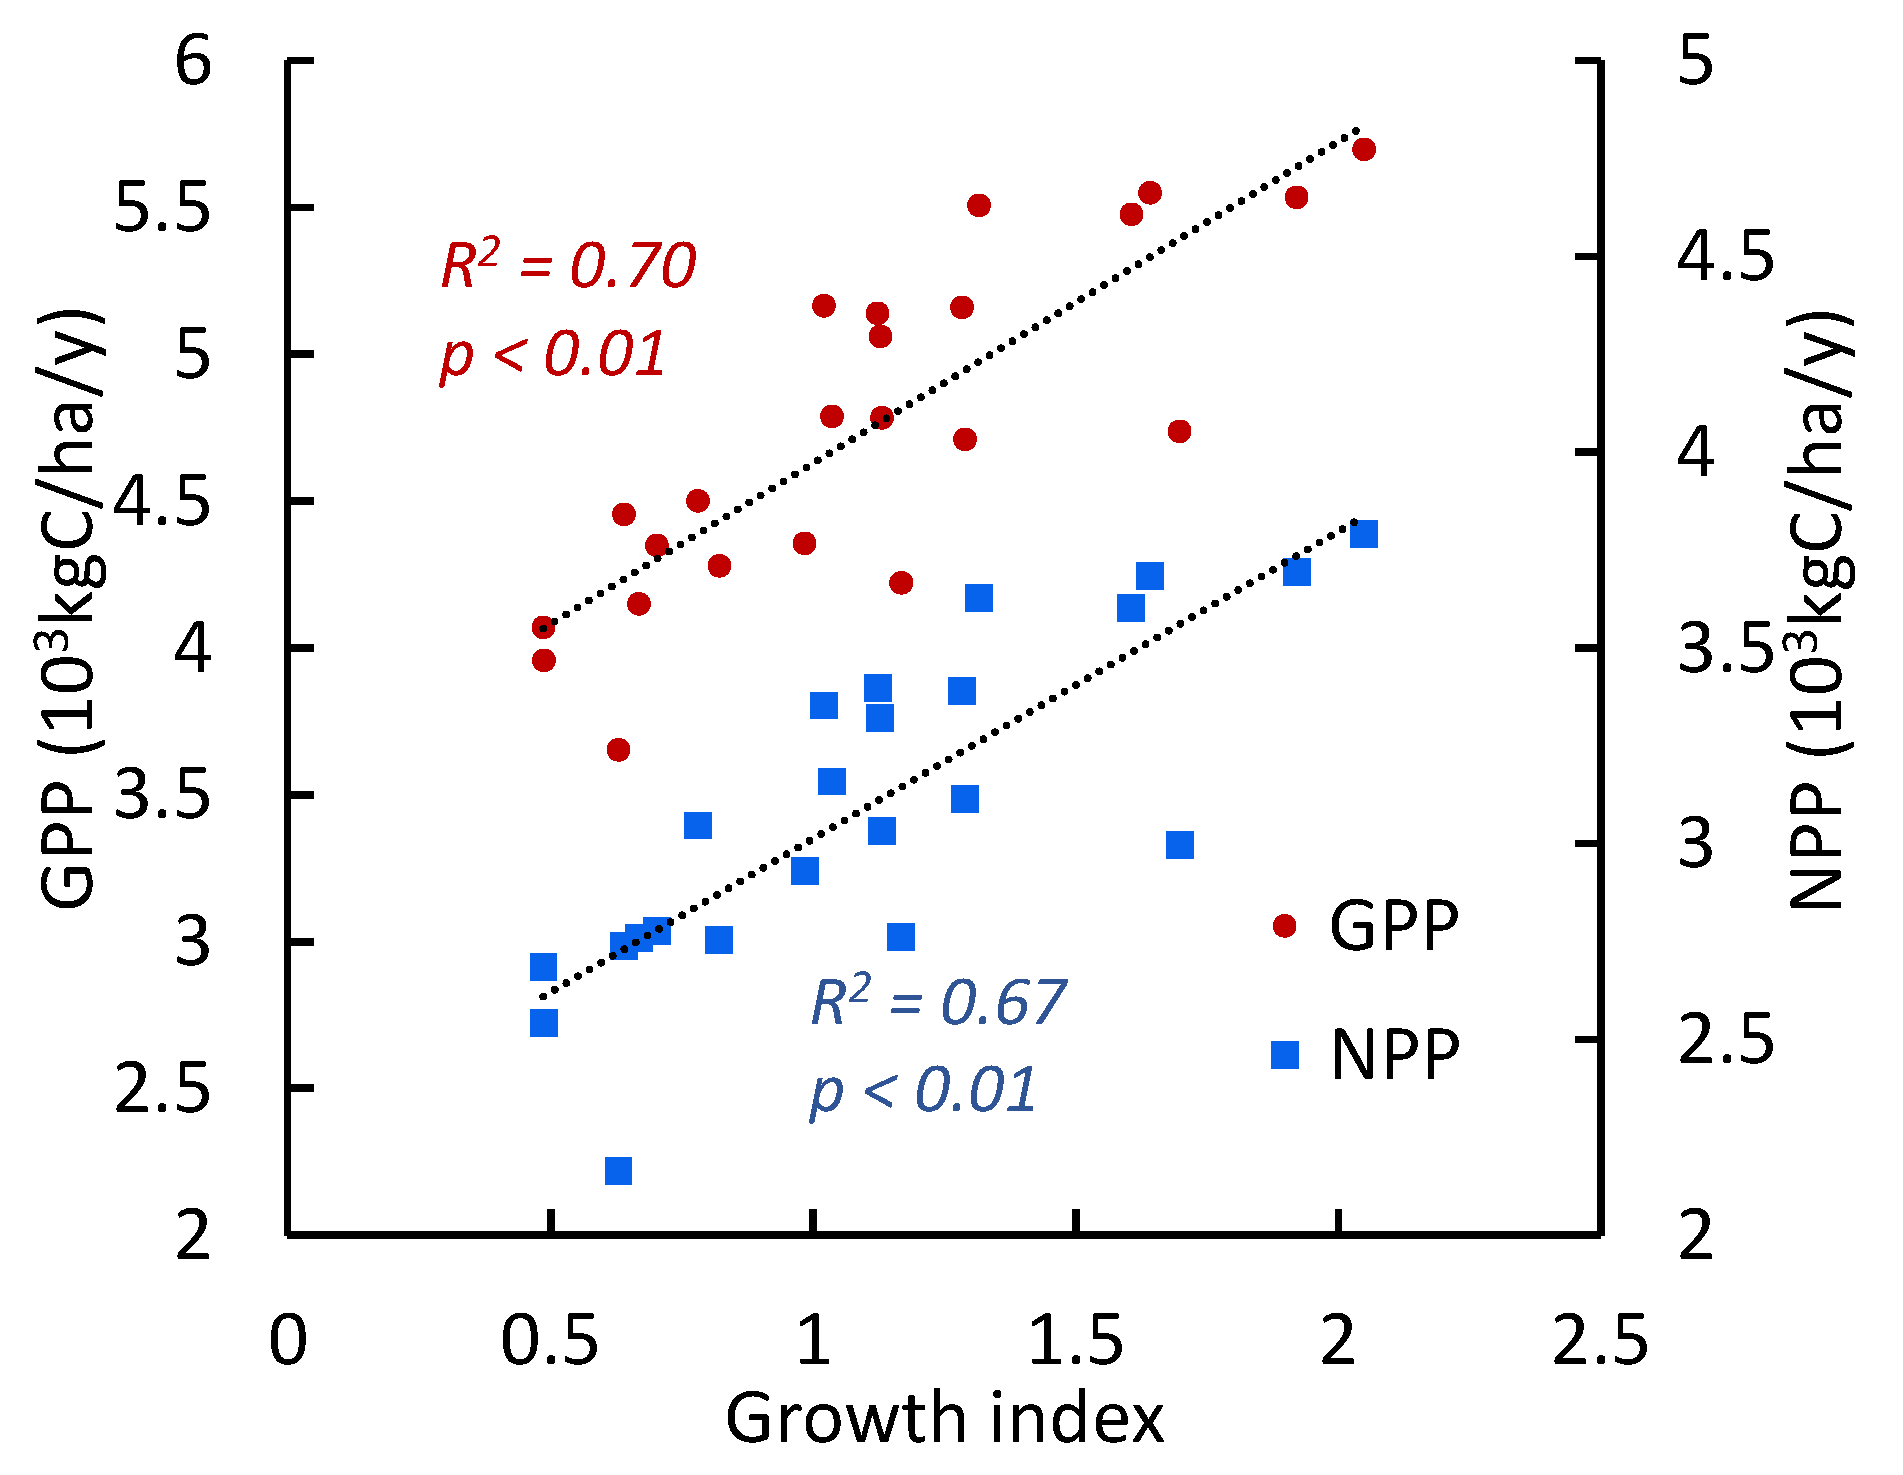
The growth of trees is strongly correlated with vegetation GPP/NPP values (r = 0.82) (Figure 11).
Figure 11.
The growth index (GI) of pine trees regressions vs GPP and NPP (mean values for all sites).
Figure 11.
The growth index (GI) of pine trees regressions vs GPP and NPP (mean values for all sites).
3.5. Fire Dynamics
The fire return intervals (FRI) since 1985 reconstructed based on satellite data and based on burn marks on tree (1835–1996 years) are shown in Figures 12 and 132. After the warming restart, the frequency of fires reached its maximum in the first decade of the 21st century followed by fires decrease. That “fires lag” can be attributed to the elimination of “fuel load” (i.e., on-ground woody debris) by previous fires. Since fuels accumulated, fires occurred again in recent years (Figure 12).
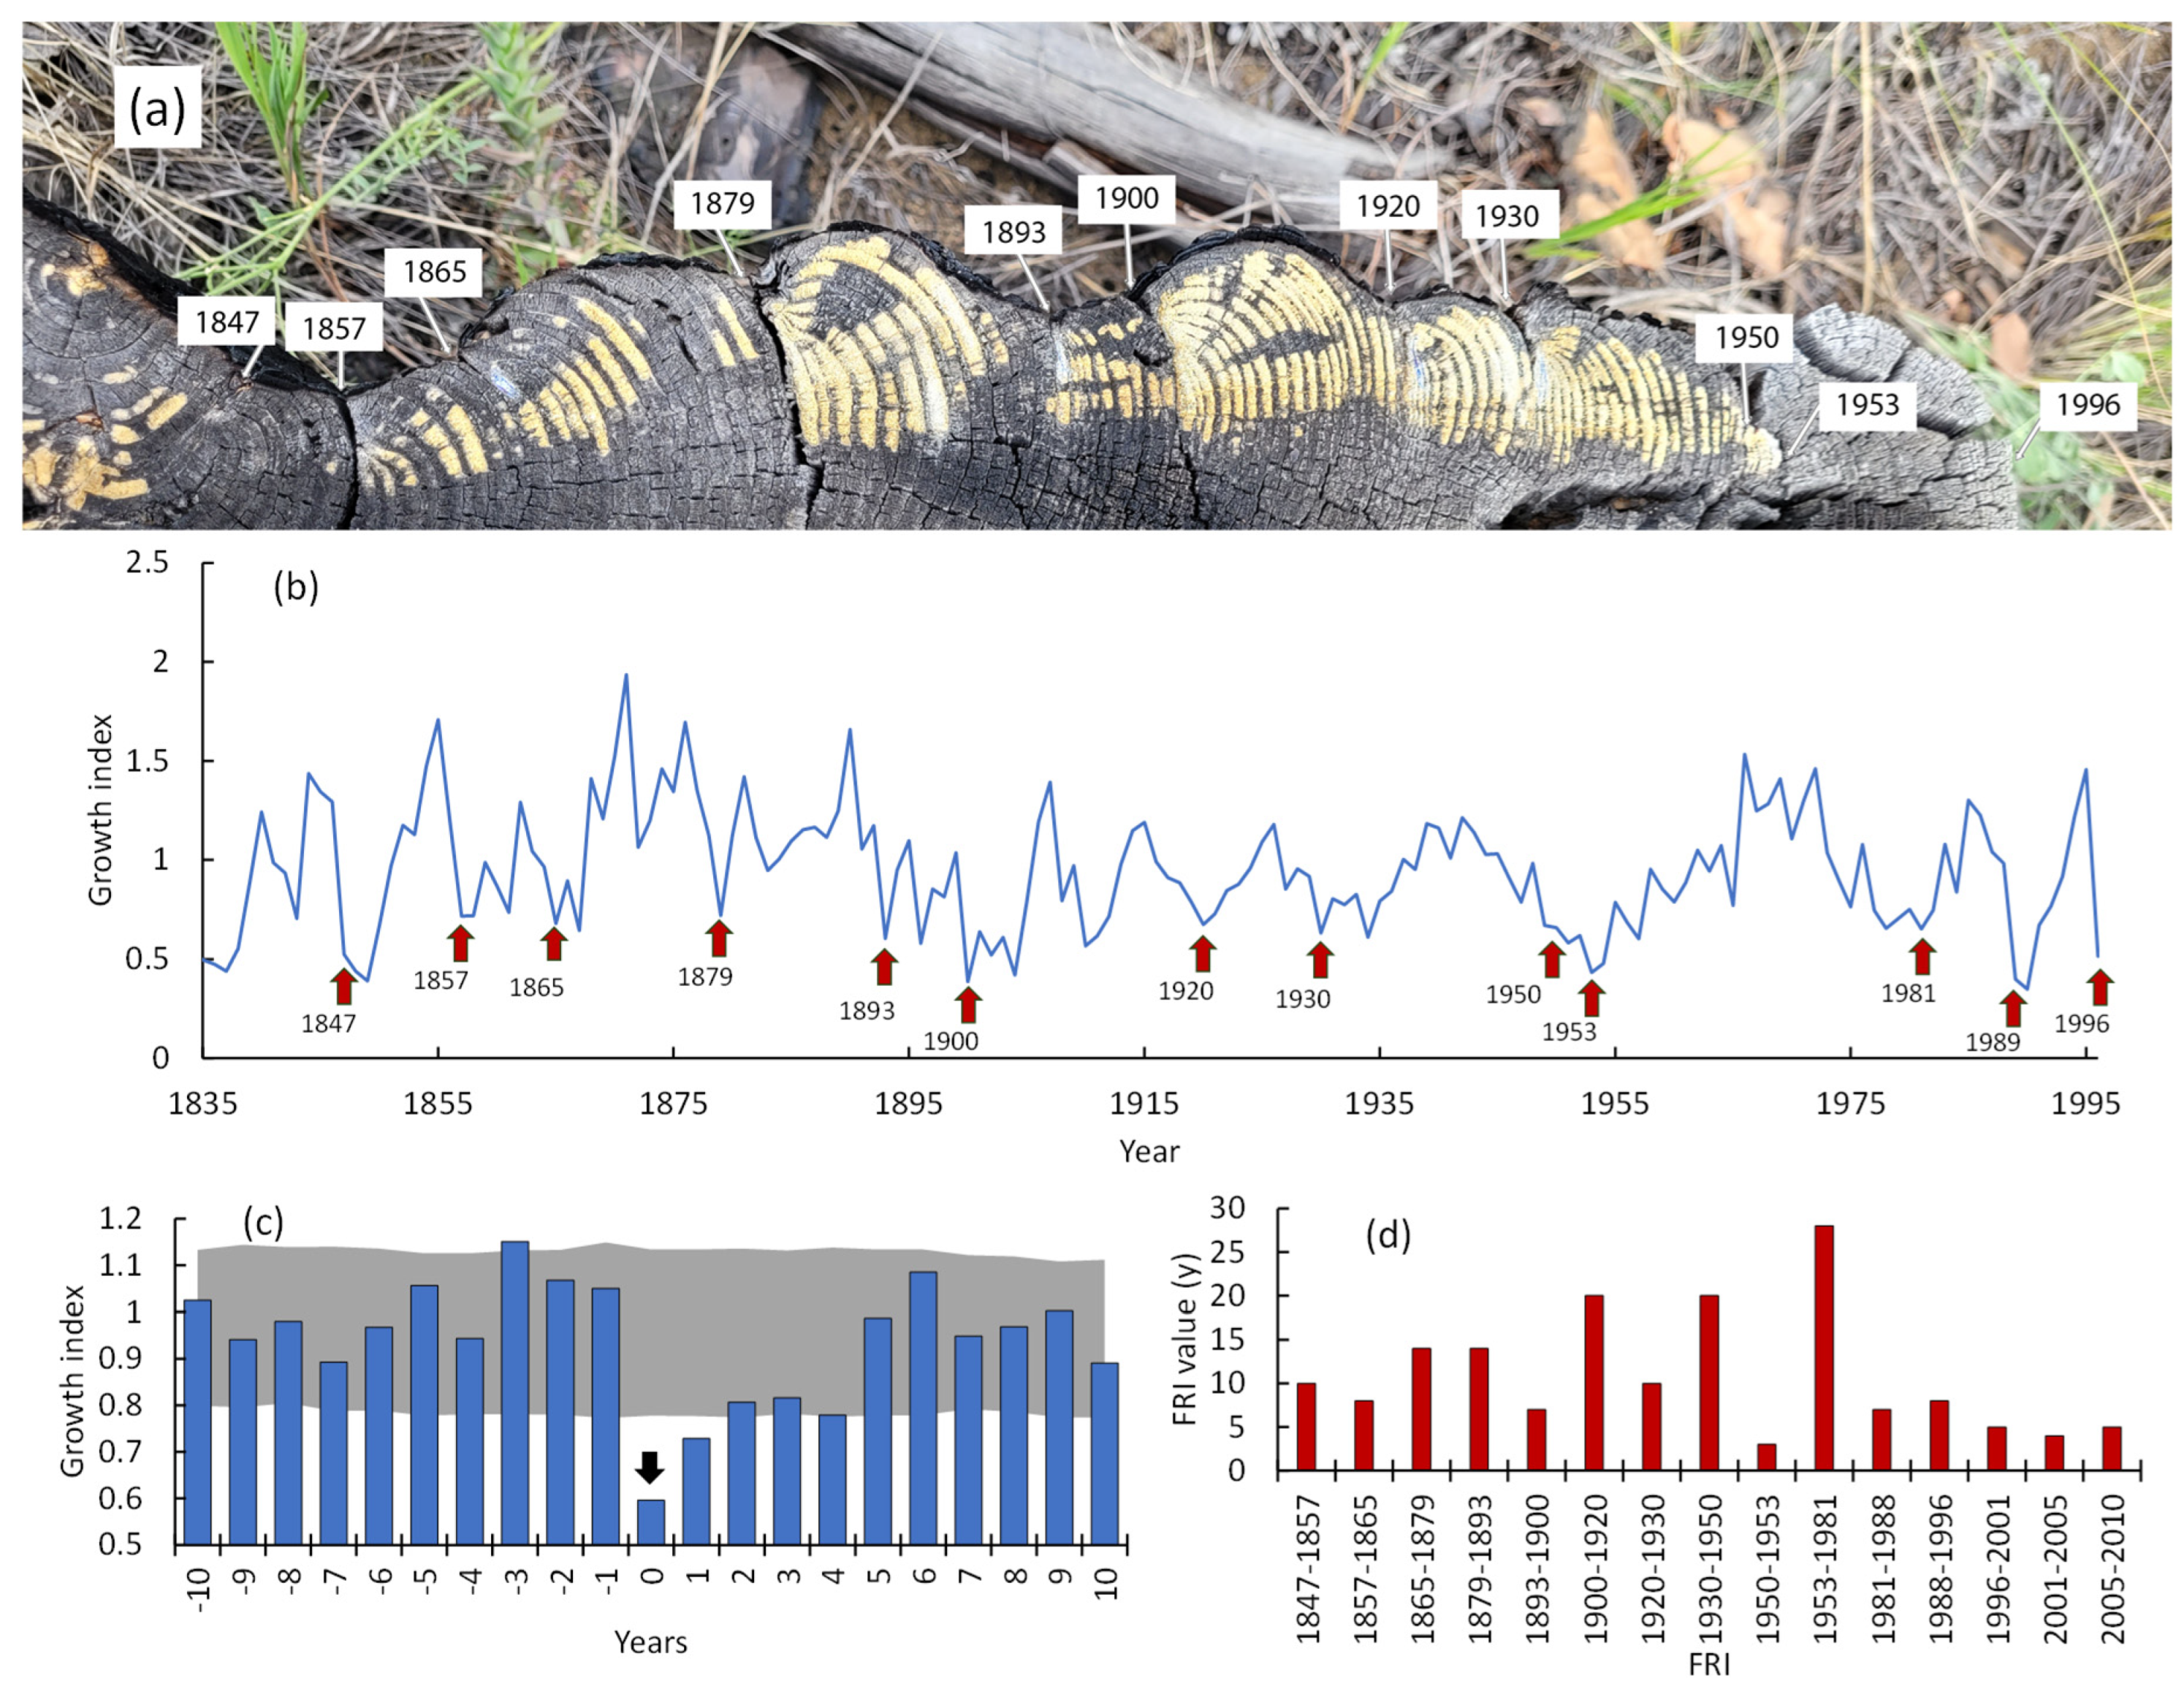
The burning rate increase led to a reduction in FRI. Thus, FRI at the Ulug-Hady site decreased to 5±1 years, i.e., more than twofold compared to its historical value (1835–1996; 12±5 years; p < 0.02). The longest FRI (c. 28 y) coincided with period of effective fire-suppression (1983-1981, Figure 13b). The FRI for the total area of all sites was 3±2 years. Note that due to the forest fragmentation, fire might not spread over the entire area. A similar FRI (2–3 years) was reported for relict pine forests in other parts of the southern pine range, including the East Trans-Baikal [18]. In pine forests located in the West Trans-Baikal region, the FRI range is 4–45 years [20]. It is worth noting that an increase in the burning rate led to a significant decrease in pine stands in the Balgazyn forestry. Specifically, from about 20,000 ha in the 1980s, to 5,900 ha at the beginning of the 2000s [17]. Similar decrease of pine forests reported in the Trans Baikal region, where fires eliminated pines on about 16,000 ha, or 2/3 of their former area. Moreover, follow-on surface fires have eliminated post-fire pine regeneration. In the northern part of the pine range (northern Siberia), a reduction in FRI was also reported [39]. Alongside with pine, larch (Larix sibirica) on its southern edge in the Trans Baikal region was partly transformed into shrub and steppe communities due to repeated fires [23].
3.6. Post Fire Regeneration
Pine regeneration located preferably within depressions and northern-faced slopes as well as under mother trees’ shadows (Figure A2). Regeneration and vegetation cover are absent on south-facing dune slopes. In general, in areas affected by fire, undergrowth is viable. The mean regeneration density within the Balgazyn, Biche-Hady, and Ulug-Hady sites is about 7-10 thous/ha, reaching up to 85 thous/ ha within clusters of seedlings. Majority of seedlings have good vigor (i.e., < 5% of declining seedlings).
Thus, the health and number of seedlings are sufficient for successful pine stand recovery. However, surface fires strongly damage regeneration as well as afforestation, thereby, thereat conservation of relict pines forests.
4. Discussion
Climate warming at the southern edge of the Scots pine range did not lead to a chronic decrease in the GI, which is the predictor of the trees’ decline and mortality [38]. Moreover, since the warming restart, pine growth surpassed its historical values. Maximal GI values occurred during the last period of decreased soil and air droughts (Figure 3). The increase in the growth of pine trees was strongly correlated with GPP/NPP increase in pine stands (r = 0.82–0.84, Figure 8). Alongside pine forests, strong positive trends in GPP/NPP have occurred in the majority (80–90%) of surround bush-steppe communities (Figure 10). Therefore, warming itself does not suppress tree growth and vegetation productivity. On the contrary, an increase in air temperature stimulates growth when it is combined with improved moisture supply. Nowadays, we are observing the “greening” of the Scot pine habitat.
According to climatic models, by the year 2100, precipitation at the study site is expected to increase to c. 560 - 570 mm (scenarios SSP4.5, SSP7.0 and SSP8.5). In addition, air temperatures are expected to rise by +2,7°С (SSP4.5), +3.6°С (SSP7.0), and +4.4°С (SSP8.5) [40,41]. Climate aridity, as it known, is estimated by the difference between precipitation and potential evapotranspiration (PET). Thus, elevated temperatures lead to an increase in PET of 505, 539, and 594 mm (according to SSP2-4.5, SSP3-7.0, and SSP5-8.5 scenarios, correspondingly). Nowadays the mean annual precipitation and PET were 369 and 533 mm, i.e., “precipitation deficit” was about 44%. According to all scenarios, that deficit will be around c. (–5% and +5%), so, it is expected zero deficit of precipitation by the year 2100. Thus, the data obtained for the period of warming restart supports predicted strong improvement in the Scot pine habitat in its southern range.
Meanwhile, warming lead to an increase in extreme weather events, including periodic severe droughts and wildfires [41]. Scot pine, a pyrophytic species, can survive multiple surface fires and live for hundred of years (Figures 14 and A1). The studied relict pine forests successfully survived wildfires throughout the Holocene period. A sufficient number of mother-trees, a positive GI, and viable and numerous seedlings in the burns indicate Scot pine’s resilience to observed warming. However, the unprecedented warming is accompanied by an unprecedented increase in burning rate. Thus, since warming restart, the FRI has been shortened to 3±2 years, which leads to the severe damage of pine seedlings and afforestation which impairs the preservation of pines forests under conditions of current fire regime. Meanwhile, it was reported that the burning rate in the Siberian taiga decreased during last decade due to an increase in precipitation [23]. That also might occurred in the southern Scots pines’ habitat.
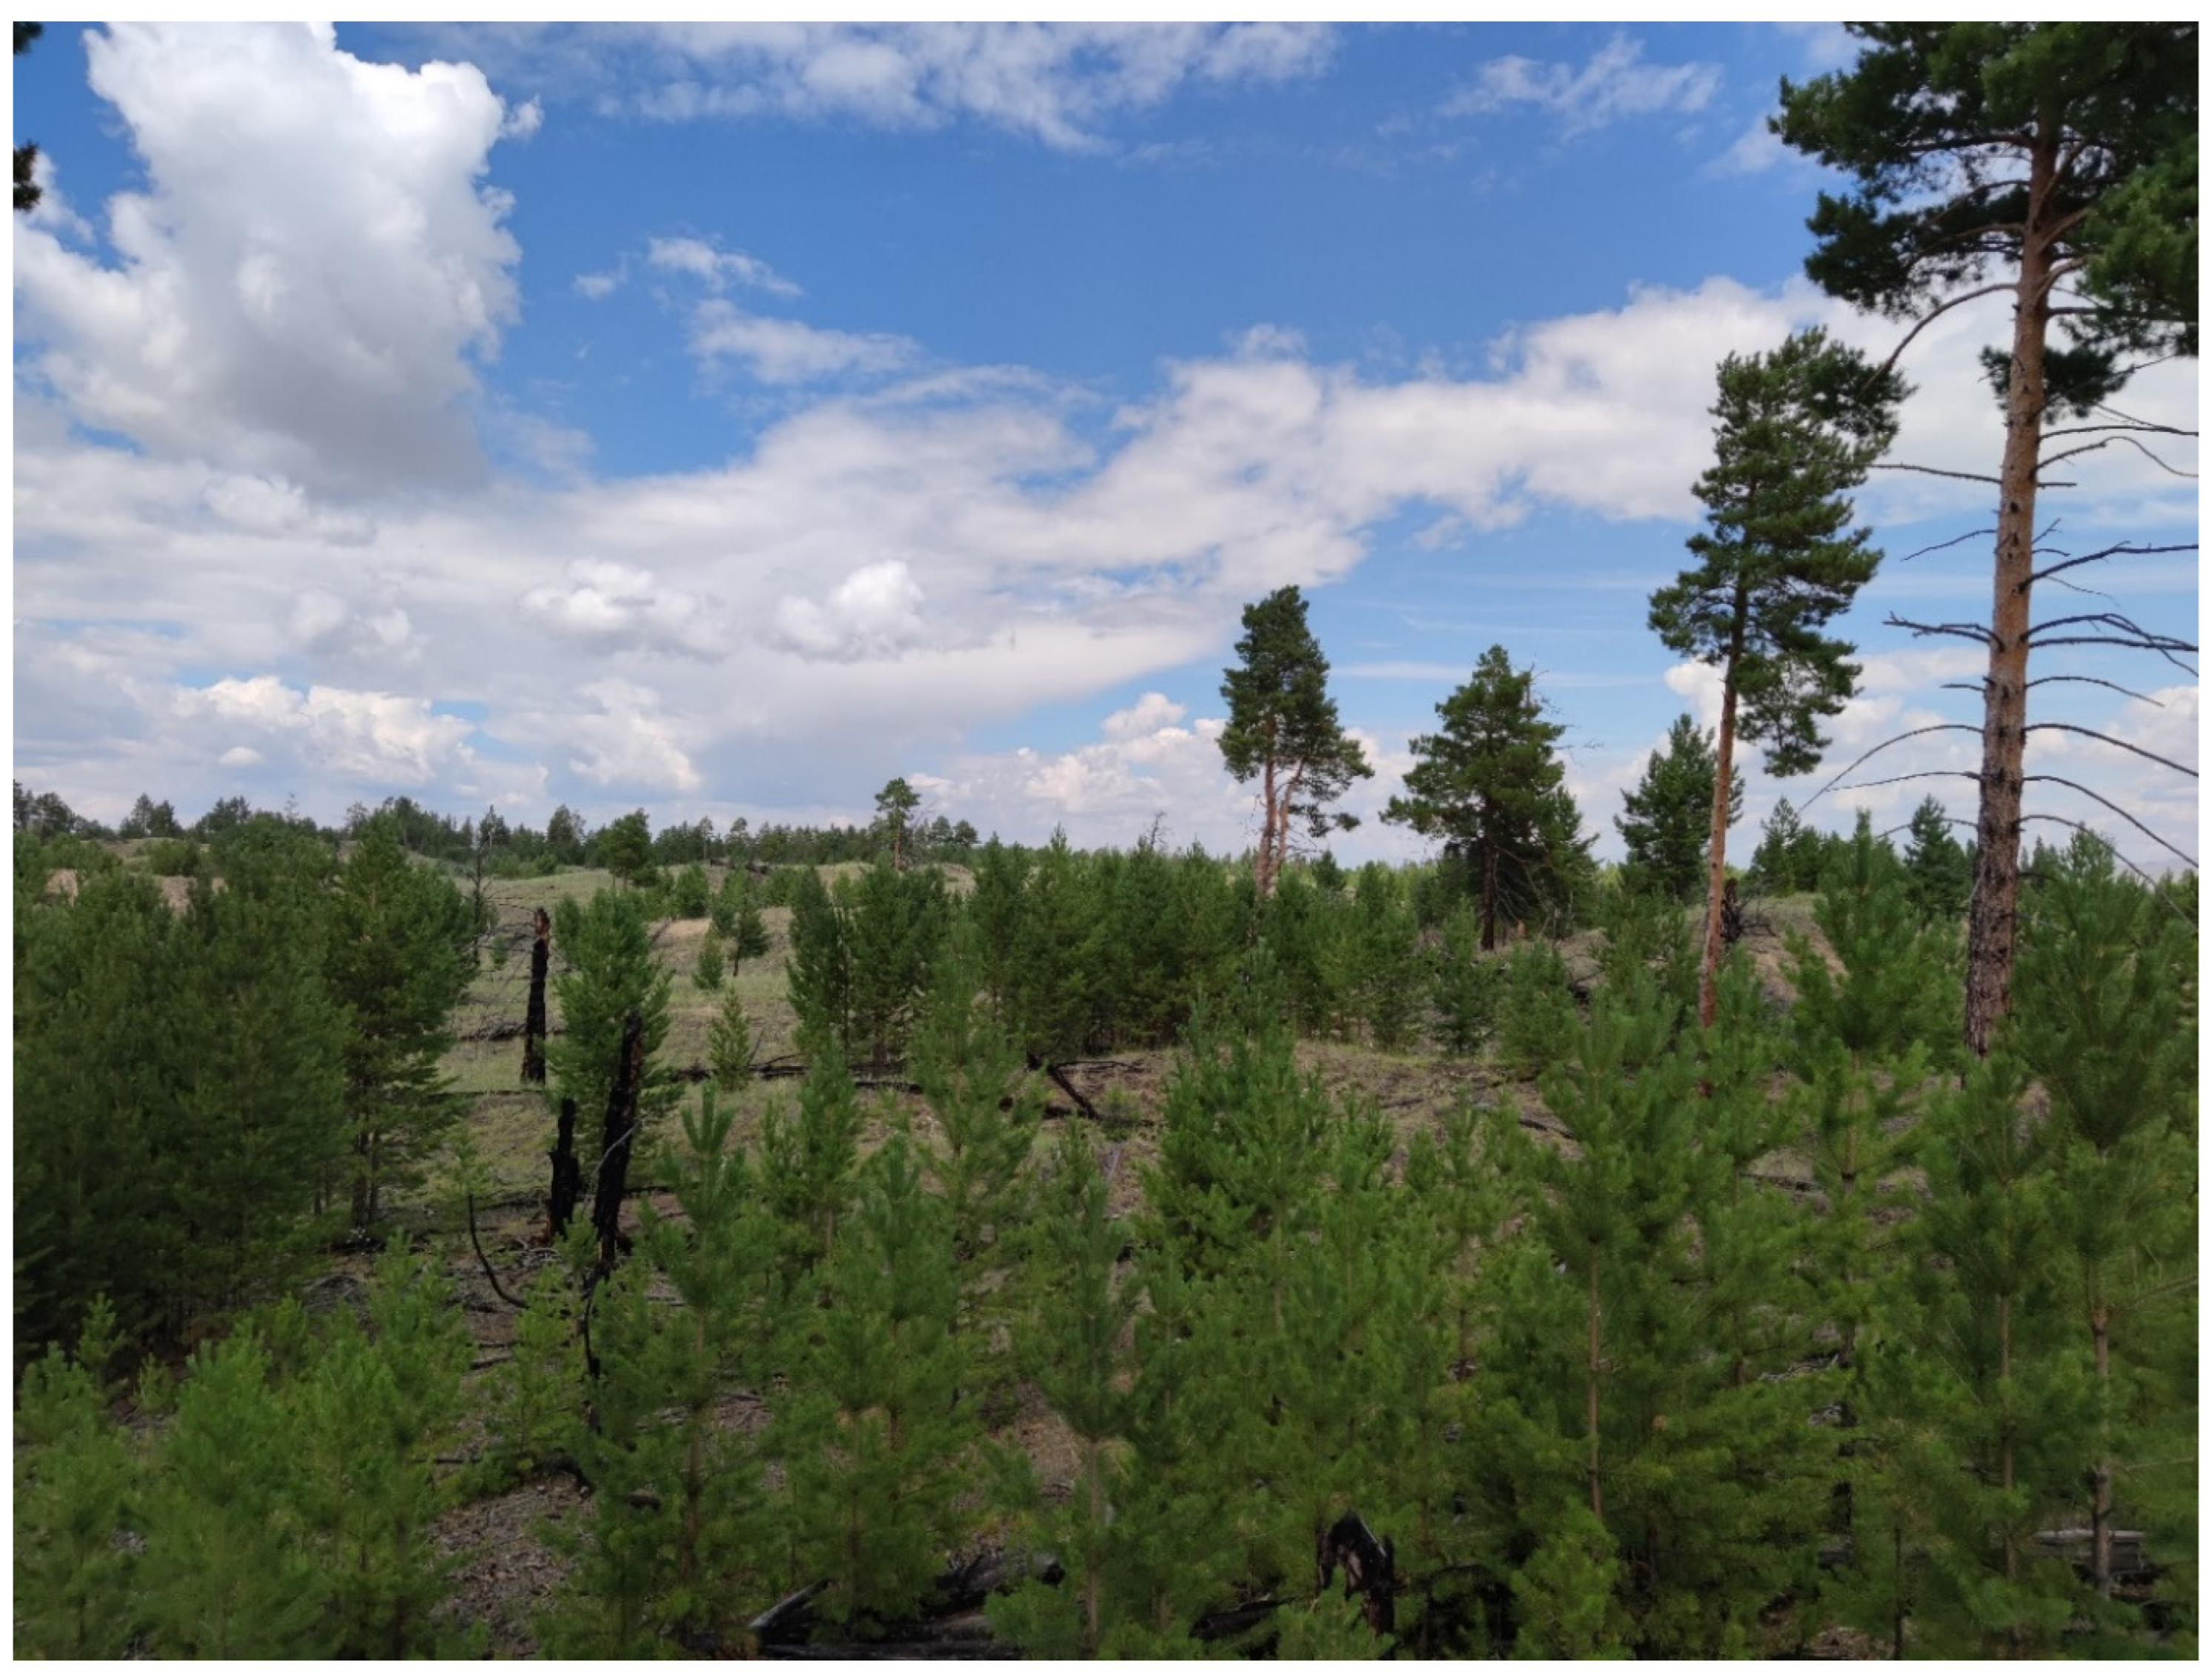
Figure 14.
A number (7-10 thous/ha) of viable is seedlings potentially sufficient for successful pine post-fire recovery. The photo taken at the Biche-Hady site.
Figure 14.
A number (7-10 thous/ha) of viable is seedlings potentially sufficient for successful pine post-fire recovery. The photo taken at the Biche-Hady site.
In general, fire regime in combination with moisture supply are major determinants of the southern pines forests preservation. Nowadays firefighting is a key factor in pines survive. Worthy to note, that during the period of intense fire suppression (1950s – 1980s), the FRI in pine stands reached its historical maximum (about 30 y). Finally, a high burning rate combined with poor fire suppression management is a serious threat to the preservation of relict pine forests.
5. Conclusions
We studied the influence of changing hydrothermal and fire regimes on relict Pinus sylvestris L. forests at the southern limit of their range in Central Siberia. We found that since the warming restart in the 2000s, the growth index of pine trees has exceeded its historical values due to a decrease in soil and air drought. In spite of periodic fires, tree growth and seedling density in burned areas (c. 10,000 per hectare) are potentially sufficient for the post-fire recovery of pine forests. Alongside that, since the warming restart, the GPP/NPP, in both pine stands and the surrounding bush-steppe areas, were increasing, i.e., that area is now greening. Thus, the increase in air temperature in synergy with the decrease in soil and air drought stimulated tree and vegetation growth. Data obtained supported the predicted improvement of the vegetation habitat in the Siberian South. However, warming has stimulated an increase in the frequency of wildfires which caused damage of the majority of seedlings and afforestation. Therefore, under the current fire regime the preservation of relict pine forests at the southern edge of the Pinus sylvestris range depends on a combination of moisture supply, fire frequency and fire suppression.
Author Contributions
conceptualization, V.I.K., I.A.P.; methodology, V.I.K., I.A.P.; validation, V.I.K., I.A.P., S.T.I, A.S.S.; formal analysis, I.A.P., A.S.S., S.T.I.; investigation, V.I.K., I.A.P.; S.T.I., A.S.S.; resources, A.S.S., S.T.I., S.O.O.; data Curation, I.A.P., A.S.S., S.T.I.; writing—original draft preparation, V.I.K., I.A.P.; visualization, I.A.P., A.S.S., S.T.I.; supervision, V.I.K. I.A.P.; project administration, V.I.K.; funding acquisition, V.I.K. Authors have read and agreed to the published version of the manuscript.
Funding
The research was funded by the Tomsk State University Development Program («Priori-ty-2030» and the Basic Project of the Federal Research Center of the Scientific Center, no. FWES-2024-0023.
Data Availability Statement
The data presented in this study are openly available: climate data in https://cds.climate.copernicus.eu/datasets (accessed on 15 February 2025); MODIS MCD64A1 and MOD17A3HGF in https://search.earthdata.nasa.gov (accessed on 15 February 2025); FIRMS in https://firms.modaps.eosdis.nasa.gov (accessed on 15 February 2025). Landsat data in https://earthexplorer.usgs.gov (accessed on 15 February 2025).
Conflicts of Interest
The authors declare no conflict of interest.
Abbreviations
The following abbreviations are used in this manuscript:
| FRI | Fire return interval |
| GI | Growth index |
| GPP | Gross primary production |
| NPP | Net primary production |
| PET | Potential evapotranspiration |
| SSP | Shared Socioeconomic Pathway |
| scPDSI | Self-Calibrated Palmer Drought Severity Index |
| SPEI | Standardized Precipitation Evaporation Index |
| TP | Test plot |
| WMO | World Meteorological Organization |
Appendix A
Figure A1.
A wood sampling by use of increment borer.
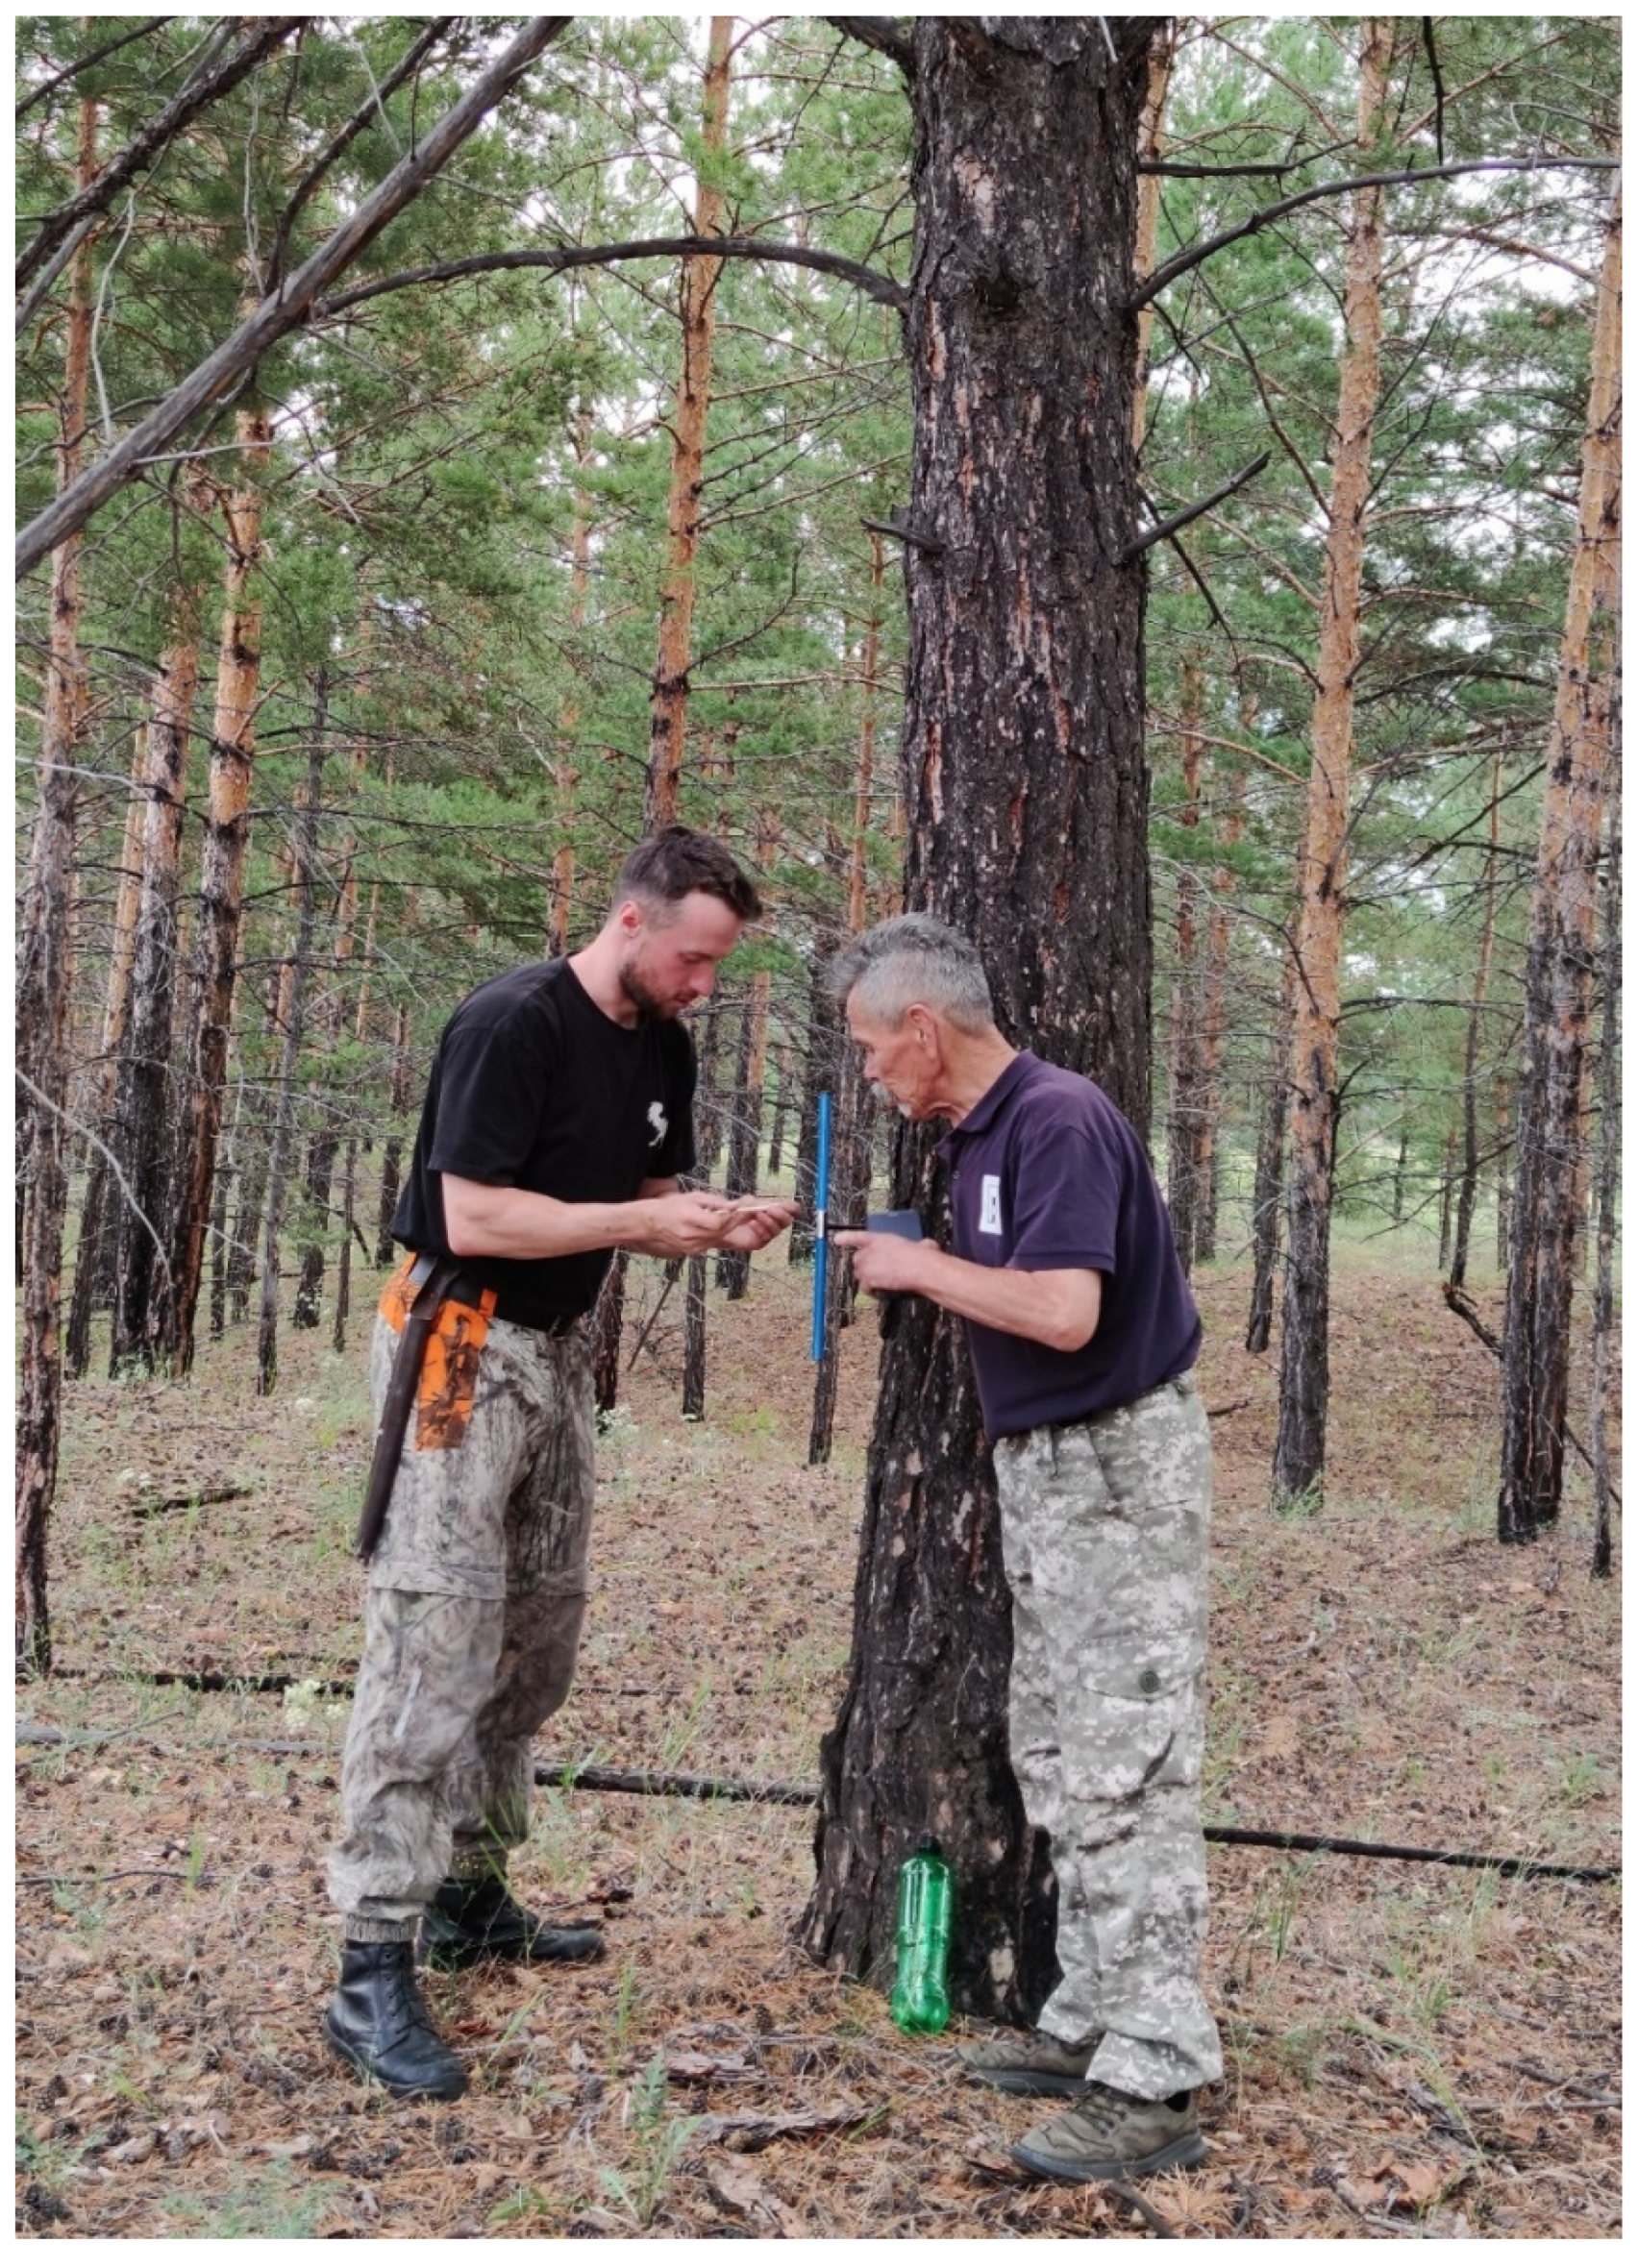
Figure A2.
Pine seedlings often located within mother trees’ shadows.
References
- Anderegg, W.R.L.; Wu, C.; Acil, N.; Carvalhais, N.; Pugh, T.A.M.; Sadler, J.P.; Seidl, R.A. climate risk analysis of Earth’s forests in the 21st century. Science 2022, 377, 1099–1103. [Google Scholar] [CrossRef] [PubMed]
- Boonman, C.C.F.; Serra-Diaz, J.M.; Hoeks, S.; Guo, W.-Y.; Enquist, B.J.; Maitner, B.; Malhi, Y.; Merow, C.; Buitenwerf, R.; Svenning, J.-C. More than 17,000 tree species are at risk from rapid global change. Nat. Commun. 2024, 15, 166. [Google Scholar] [CrossRef] [PubMed]
- Millar, C.I.; Stephenson, N.L. Temperate forest health in an era of emerging megadisturbance. Science 2015, 349(6250), 823–826. [Google Scholar] [CrossRef] [PubMed]
- Coogan, S.C.P.; Robinne, F.-N.; Jain, P.; Flannigan, M.D. Scientists’ warning on wildfire — a Canadian perspective. Can. J. For. Res. 2019, 49, 1–9. [Google Scholar] [CrossRef]
- Tymstra, C.; Stocks, B.; Cai, X.; Flannigan, M. Wildfire management in Canada: Review, challenges and opportunities. Prog. Disaster Sci. 2020, 5, 100045. [Google Scholar] [CrossRef]
- Kharuk, V.I.; Im, S.T.; Dvinskaya, M.L.; Golukov, A.S.; Ranson, K.J. Climate-induced mortality of spruce stands in Belarus. Environ. Res. Lett. 2015, 10, 125006. [Google Scholar] [CrossRef]
- Neumann, M.; Mues, V.; Moreno, A.; Hasenauer, H.; Seidl, R. Climate variability drives recent tree mortality in Europe. Glob. Chang. Biol. 2017, 23, 4788–4797. [Google Scholar] [CrossRef]
- Goulden, M.L.; Bales, R.C. California forest die-off linked to multi-year deep soil drying in 2012–2015 drought. Nat. Geosci. 2019, 12, 632–637. [Google Scholar] [CrossRef]
- Harvey, J.E.; Batllori, E.; Lloret, F.; Aakala, T.; Anderegg, W.R.L.; Aynekulu, E.; Bendixsen, D.P.; Bentouati, A.; Bigler, C.; Burk, C.J.; Camarero, J.J.; et al. Forest and woodland replacement patterns following drought-related mortality. Proc. Natl. Acad. Sci. 2020, 117(47), 29720–29729. [Google Scholar] [CrossRef]
- Davis, F.W.; Parkinson, A.-M.; Moritz, M.A.; Isaac, W.; Park, C.M.; D’Antonio, C.M. Increasing vulnerability of an endemic Mediterranean-climate conifer to changing climate and fire regime. Front. For. Glob. Change 2025, 8, 1516623. [Google Scholar] [CrossRef]
- Kharuk, V.I.; Ranson, K.J.; Oskorbin, P.A.; Im, S.T.; Dvinskaya, M.L. Climate induced birch mortality in trans-Baikal Lake region, Siberia. For. Ecol. Manag. 2013, 289, 385–392. [Google Scholar] [CrossRef]
- Verhoeven, D.; de Boer, W.F.; Henkens, R.J.H.G.; Sass-Klaassena, U.G.W. Water availability as driver of birch mortality in Hustai National Park, Mongolia. Dendrochronologia 2018, 49, 127–133. [Google Scholar] [CrossRef]
- Boyd, M.A.; Berner, L.T.; Doak,P. ; Goetz, S.J.; Rogers, B.M.; Wagner, D.; Walker, X.J.; Mack, M.C. Impacts of climate and insect herbivory on productivity and physiology of trembling aspen (Populus tremuloides) in Alaskan boreal forests. Environ. Res. Lett. 2019, 14, 085010. [Google Scholar] [CrossRef]
- Kharuk, V.I.; Im, S.T.; Petrov, I.A.; Dvinskaya, M.L.; Shushpanov, A.S.; Golyukov, A.S. Climate-driven conifer mortality in Siberia. Glob. Ecol. Biogeogr. 2021, 30(2), 543–556. [Google Scholar] [CrossRef]
- Dial, R.J.; Maher, C.T.; Hewitt, R.E.; Sullivan, P.F. Sufficient conditions for rapid range expansion of a boreal conifer. Nature 2022, 608(7923), 546–551. [Google Scholar] [CrossRef]
- Kharuk, V.I.; Petrov, I.A.; Im, S.T.; Golyukov, A.S.; Dvinskaya, M.L.; Shushpanov, A.S. Tree Clusters Migration into Alpine Tundra, Siberia. J. Mt. Sci. 2022, 19(12), 3426–3440. [Google Scholar] [CrossRef]
- Buryak, L.V.; Sukhinin, A.I.; Kalenskaya, O.P.; Ponomarev, E.I. Effects of fires in ribbon-like pine forests of southern Siberia. Contemp. Probl. Ecol. 2011, 4, 248–253. [Google Scholar] [CrossRef]
- Buryak, L.V.; Kalenskaya, O.P.; Kukavskaya, E.A.; Luzganov, A.G. Zonal and geographical features of the impact of fires on forest formation of light coniferous stands in the south of Siberia; Nauka: Novosibirsk, Russia, 2022. (In Russian) [Google Scholar]
- Ivanova, G.A.; Ivanov, V.A.; Kukavskaya, E.A. Periodicity of fires in the forests of the Republic of Tuva. Conifers of the boreal zone (Hvoiniye Borealnoi Zony). 2015, XXXIII(5–6), 204–209. (In Russian)
- Wang, Z.; Huang, J.G.; Ryzhkova, N.; Li, J.; Kryshen, A.; Voronin, V.; Li, R.; Bergeron, Y.; Drobyshev, I. 352 years long fire history of a Siberian boreal forest and its primary driving factor. Glob. Planet. Change 2021, 207, 103653. [Google Scholar] [CrossRef]
- Mamet, S.D.; Carissa, D.B.; Andrew, J.T.; Colin, P.L. Shifting global Larix distributions: Northern expansion and southern retraction as species respond to changing climate. J. Biogeogr. 2018, 46(1), 1–15. [Google Scholar] [CrossRef]
- Kharuk, V.I.; Ranson, K.J.; Petrov, I.A.; Dvinskaya, M.L.; Im, S.T.; Golyukov, A.S. Larch (Larix Dahurica Turcz) Growth Response to Climate Change in the Siberian Permafrost Zone. Reg. Environ. Chang. 2019, 19, 233–243. [Google Scholar] [CrossRef]
- Kharuk, V.I.; Shvetsov, E.G.; Buryak, L.V.; Golyukov, A.S.; Dvinskaya, M.L.; Petrov, I.A. Wildfires in the Larch Range within Permafrost, Siberia. Fire 2023, 6, 301. [Google Scholar] [CrossRef]
- Kharuk, V.I.; Petrov, I.A.; Golyukov, A.S.; Dvinskaya, M.L.; Im, S.T.; Shushpanov, A.S. Larch growth across thermal and moisture gradients in the Siberian Mountains. J. Mt. Sci. 2023b. 20(1), 101–114. [CrossRef]
- NOAA National Centers for Environmental information. Climate at a Glance: Global Time Series, 2025. Available online: https://www.ncei.noaa.gov/access/monitoring/climate-at-a-glance/global/time-series (accessed on 21 February 2025).
- Holmes, R.L. Computer-assisted quality control in tree-ring dating and measurement. Tree-Ring Bull. 1983, 44, 69–75. [Google Scholar]
- Rinn, F. Tsap V. 3.6 Reference Manual: Computer Program for Tree-Ring Analysis and Presentation; Frank Rinn Distribution: Heidelberg, Germany, 1996. [Google Scholar]
- Speer, J.H. Fundamentals of tree-ring research; University of Arizona Press: USA, 2010. [Google Scholar]
- Richards, J.A. Remote Sensing Digital Image Analysis., 6th ed.; Springer Cham: Berlin, Germany, 2022. [Google Scholar]
- Running, S.W.; Zhao, M. User’s Guide Daily GPP and Annual NPP (MOD17A2H/A3H) and Year-end Gap-Filled (MOD17A2HGF/A3HGF) Products NASA Earth Observing System MODIS Land Algorithm (For Collection 6.1); 2021. Available online: https://lpdaac.usgs.gov/documents/972/MOD17_User_Guide_V61.pdf (accessed on 21 March 2025).
- Conover, W.J. Practical nonparametric statistics. Wiley series in probability and mathematical statistics. Applied probability and statistics; Wiley: Chichester, UK, 1999. [Google Scholar]
- Specialized arrays for climate research. All-Russia Research Institute of Hydrometeorological Information – World Data Center. Available online: http://aisori-m.meteo.ru/waisori/index.xhtml?idata=2 (accessed on 21 March 2025). (In Russian).
- Liu, Q.; Yang, S.; Li, S.; Zhang, H.; Zhang, J.; Fan, H. The optimal applications of scPDSI and SPEI in characterizing meteorological drought, agricultural drought and terrestrial water availability on a global scale. Sci. Total Environ. 2024, 952, 175933. [Google Scholar] [CrossRef]
- Wells, N.; Goddard, S.; Hayes, M.J. A self-calibrating Palmer Drought Severity Index. J. Clim. 2004, 17, 2335–2351. [Google Scholar] [CrossRef]
- Muñoz Sabater, J. ERA5-Land monthly averaged data from 1950 to present. Copernicus Climate Change Service (C3S) Climate Data Store (CDS), 2019. Available online: https://cds.climate.copernicus.eu/datasets/reanalysis-era5-land-monthly-means?tab=overview (accessed on 21 February 2025).
- ERA5-Land monthly averaged data from 1950 to present. Available online: https://cds.climate.copernicus.eu/datasets/reanalysis-era5-land-monthly-means?tab=overview (accessed on 21 March 2025).
- Beguería, S.; Vicente-Serrano, S.M. SPEI: Calculation of the Standardized Precipitation-Evapotranspiration Index. 2023. Available online: https://spei.csic.es, https://github.com/sbegueria/SPEI (accessed on 21 March 2025).
- Cailleret, M.; Jansen, S.; Robert, E.M.R.; Desoto, L.; Aakala, T.; Antos, J.A.; Beikircher, B.; Bigler, C.; Bugmann, H.; Caccianiga, M.; et al. A synthesis of radial growth patterns preceding tree mortality. Glob. Chang. Biol. 2017, 23, 1675–1690. [Google Scholar] [CrossRef]
- Petrov, I.A.; Shushpanov, A.S.; Golyukov, A.S.; Dvinskaya, M.L.; Kharuk, V.I. Wildfire Dynamics in Pine Forests of Central Siberia in a Changing Climate. Contemp. Probl. Ecol. 2023, 16, 36–46. [Google Scholar] [CrossRef]
- Gutiérrez, J.M.; Jones, R.G.; Narisma, G.T.; Alves, L.M.; Amjad, M.; Gorodetskaya, I.V.; Grose, M.; Klutse, N.A.B.; Krakovska, S.; Li. J.; Martínez-Castro, D.; Mearns, L.O.; Mernild, S.H.; Ngo-Duc, T.; van den Hurk, B.; Yoon, J.H. Atlas. Climate Change 2021: The Physical Science Basis. Contribution of Working Group I to the Sixth Assessment Report of the Intergovernmental Panel on Climate Change [Masson-Delmotte, V., P. Zhai, et al. (eds.)]; Cambridge University Press: Cambridge, United Kingdom and New York, NY, USA, 2021. Interactive Atlas. Available online: http://interactive-atlas.ipcc.ch/ (accessed on 21 March 2025).
- IPCC. Climate Change 2023: Synthesis Report. Contribution of Working Groups I, II and III to the Sixth Assessment Report of the Intergovernmental Panel on Climate Change [Core Writing Team, H. Lee and J. Romero (eds.)]; IPCC: Geneva, Switzerland, 2023; Available online: https://www.ipcc.ch/report/ar6/syr/downloads/report/IPCC_AR6_SYR_FullVolume.pdf (accessed on 21 March 2025).
Figure 12.
The dynamics of burned areas caused by “single” and “multiple” (i.e., repeated) fires. The frequency of fires was maximal in the first decade of the 21s century, followed by saturation. Data were obtained for all sites.
Figure 12.
The dynamics of burned areas caused by “single” and “multiple” (i.e., repeated) fires. The frequency of fires was maximal in the first decade of the 21s century, followed by saturation. Data were obtained for all sites.
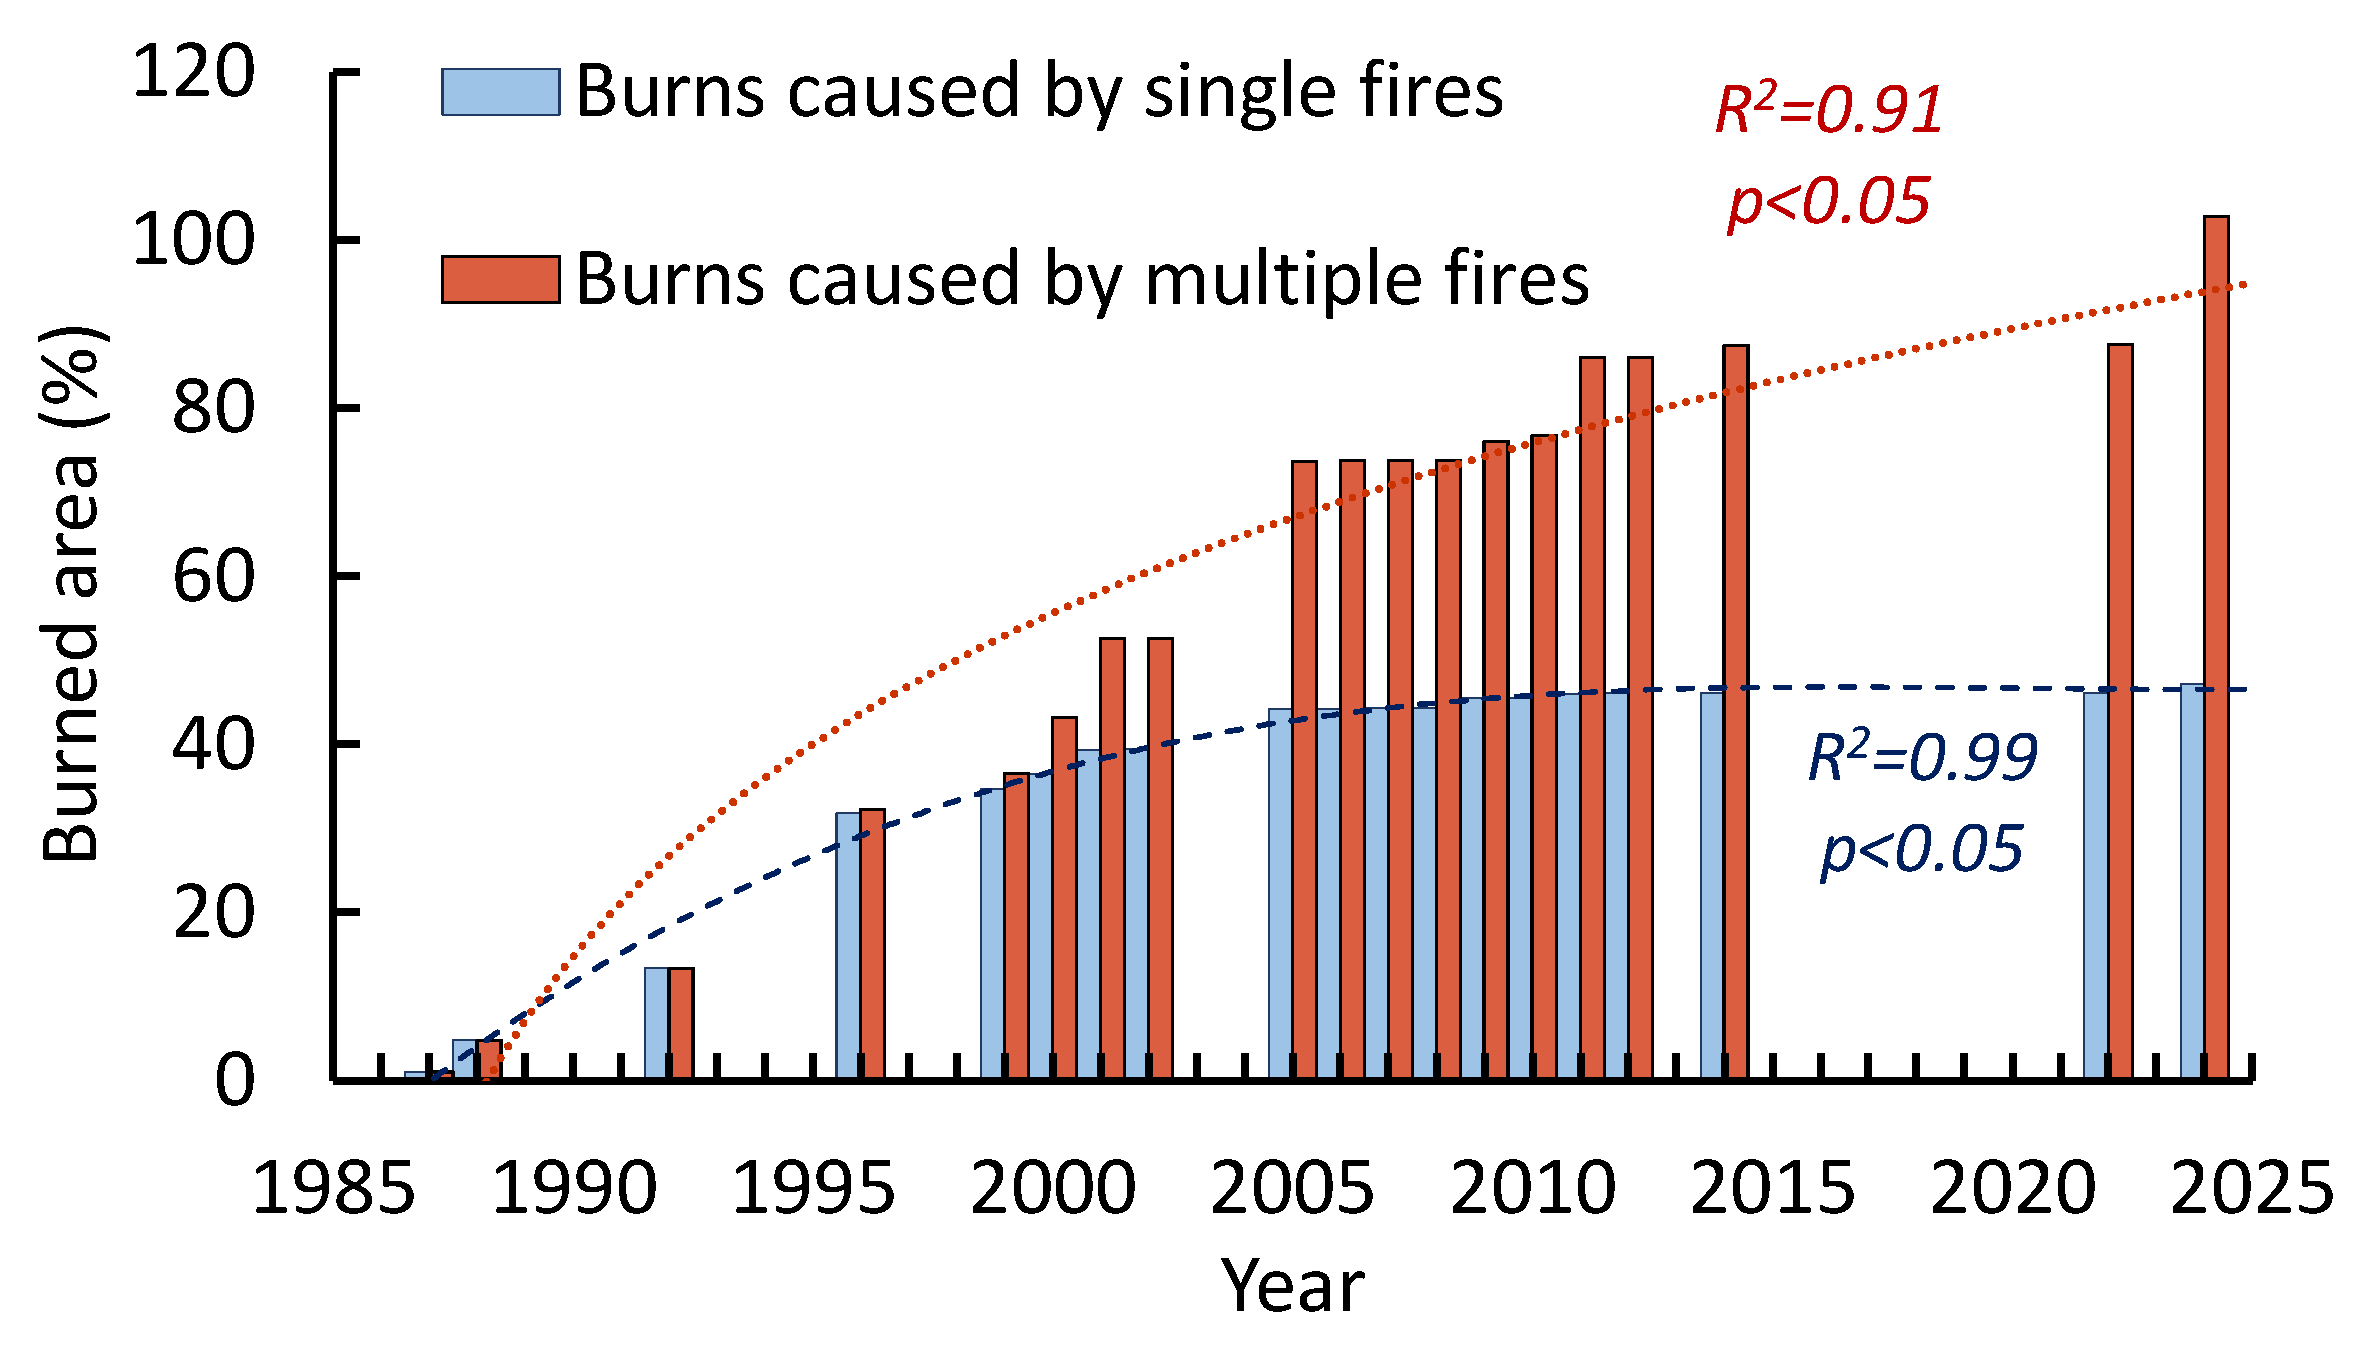
Figure 13.
(a) – Scot pine stump with multiple burns and (b) the GI chronology with fire dates. (c) The pine GI before and after the fire (date of fire marked by “0”). (d) The fire return intervals dynamics (based on the dendrochronology and Landsat data). Presented data referred to a fragment of the Ulug-Hady forest.
Disclaimer/Publisher’s Note: The statements, opinions and data contained in all publications are solely those of the individual author(s) and contributor(s) and not of MDPI and/or the editor(s). MDPI and/or the editor(s) disclaim responsibility for any injury to people or property resulting from any ideas, methods, instructions or products referred to in the content. |
© 2025 by the authors. Licensee MDPI, Basel, Switzerland. This article is an open access article distributed under the terms and conditions of the Creative Commons Attribution (CC BY) license (http://creativecommons.org/licenses/by/4.0/).
Copyright: This open access article is published under a Creative Commons CC BY 4.0 license, which permit the free download, distribution, and reuse, provided that the author and preprint are cited in any reuse.


