
Submitted:
24 April 2023
Posted:
25 April 2023
You are already at the latest version
Abstract
Regeneration is crucial for forest continuity in natural and managed stands. Analyzing intra-annual dynamics improves the understanding between growth and climate, identifying survival thresholds. The objective was to determine microclimate constraints (rainfall, air and soil temperatures) over Nothofagus antarctica regeneration growing at closed, open, and edge forests in Patagonia. We measured stand characteristics (forest structure, understory, soil properties, animal use), microclimate, and daily growth of regeneration using dendrometers (n = 6) during two growing seasons. We found significant differences in the studied variables (e.g. overstory, light, soil, understory, animal use). These changes defined microclimate across overstory gradient (e.g. soil moisture), influencing the daily growth across seasons (lag, exponential, stationary). Rainfall influenced more than temperature. Daily growth in closed forests indicating shrinkage (-0.0082 mm day-1 without rain, and -0.0008 mm day-1 with 0.0-0.2 mm day-1 rainfall), while above 0.2 mm day-1 rainfall, growth always increased. Open forests presented shrinkage during days without rain (-0.0051 mm day-1), showing positive growths according rainfall. Edge forests always presented positive daily growths. The resilience of regeneration under these changed conditions was related with overstory. Main outputs indicated that regeneration was vulnerable during non-rainy days, suggesting the needs of long-term monitoring to develop better silvicultural proposals.
Keywords:
silvopastoral systems
; regeneration growth
; daily stem dynamics
; dendrometers
; microclimate
; soil water content
1. Introduction
Forest structure of native forest stands changes across the landscape according to species ecology, climate, topography, and disturbance regimes (e.g. windstorms) [1]. At high latitudes, temperate native forests show simple horizontal and vertical structures, usually with few dominant species and with one or two overstory strata, following predictable forest dynamic paths. For example, Nothofagus antarctica (Forst. f.) Øerst. (commonly named ñire) forests in Tierra del Fuego (Argentina) grow in pure stands and regenerate from seeds or root sprouts under simple gap dynamics [2,3]. Silvopastoral system was proposed to manage these forests, where the main provisioning monetary services are firewood (ranches consumption) and livestock (e.g. sheep and cattle grazing). This proposal simplifies the forest structure by opening the canopy through thinning, maintaining homogeneous tree and age distributions [4], promoting the increase of understory biomass [5,6] for livestock production [7,8]. Forest structure values (e.g. volume, growth, and forest regeneration) have been previously informed [3,9], where several constraints during the management cycle may affect the natural regeneration of stands [8,10].
In Nothofagus forests, regeneration survival and growth are crucial to maintain the forest cover continuity over time [11]. The main variables that influence regeneration performance are the microclimate (e.g. light and water availability) regulated by the forest overstory cover [12], and other biotic factors such as animal browsing (e.g. natural populations of Lama guanicoe or domestic livestock) [8,13]. Besides, harvesting modifies the forest structure by altering ecosystem functions, microclimate and natural cycles depending on cut intensity [3], e.g. thinning stimulates seedling growth by modifying light availability and soil moisture, where the remaining canopy overstory acts as seed source and mitigates micro-climatic conditions inside the harvested stands [4,14].
These relationships among natural regeneration, forest structure and climate were described before for different seasons (e.g. [15]), however the impact over the tree-ring formation period is still uncertain. At higher latitudes, the tree-ring is developed in a short period of time (e.g. three months per year) [16], strongly depending on daily climate conditions, which greatly impacted over the growth performance [17,18]. Microclimate conditions changed among the different forest environments, where some stands are more resilient to face extreme climatic events, e.g. reducing the impact of low or high temperatures, and drought or freeze events [3,14,19,20]. The tree growth responses (increases or decreases in diameter) and mechanisms driving the productivity over the season depend on daily micro-climatic conditions [21,22]. Understanding the relationships between tree-ring formation and the climate improve the knowledge of growth dynamics (e.g. dendrochronological studies) [23,24,25], and the survival thresholds for natural regeneration under different management alternatives and the potential impact of climate change [26,27]. Therefore, the objective of the present study was to determine the impact of microclimate conditions (daily rainfall, and daily average air and soil temperatures) on the radial expansion of tree stems in the natural regeneration of Nothofagus antarctica growing at different forest environments (primary forests, open forests, and edge forests with openlands) in Tierra del Fuego (Argentina). We aim to answer the following additional questions: (i) how is the dynamics of the radial growth during the seasonal cycle in relation to the overstory characteristics? and (ii) which is the most important microclimate driver that influences the daily growth across the seasons considering different forest environments?
2. Materials and Methods
2.1. Study area characterization
The study was conducted in pure Nothofagus antarctica forests located at El Roble ranch (54º06’ SL, 67º41’ WL) in the central area of Isla Grande of Tierra del Fuego (Argentina). Four transects (1,000 m each) were located from closed forests to openlands, which included three contrasting forest environments: (i) primary forests (CF) with dominance of mature trees (>150 years-old) and closed canopies (>70%), (ii) open forests (OF) with 40-60% overstory cover generated by old thinning (>30 years) for lumber extraction and silvopastoral purposes, and (iii) edge forests with openlands (EF) where regeneration advance over tussock grasslands (mainly with Festuca gracillima and Empetrum rubrum) (Figure 1). In these environments, livestock (cows) was the main economic activity, which shares the natural environments with natural populations of Lama guanicoe (guanaco) [13]. The study plots belong to a long-term permanent plot of PEBANPA network (Parcelas de Ecología y Biodiversidad de Ambientes Naturales en Patagonia Austral, INTA UNPA CONICET, Argentina) [28].
For the study area characterization, 12 plots were surveyed (4 transects x 3 forest environments) during the middle summer (January to February) by using 50 m transects. Forest structure was characterized by two sub-plots located at the beginning and the end of each transect, using the point sampling method (BAF = 1 to 5) [29] with a Criterion RD-1000 (Laser Technology, USA). In each subplot we measured the dominant height of the stand using a TruPulse 200 laser clinometer and distance rangefinder (Laser Technology, USA) by averaging height of the two taller trees per transect, and the diameter at breast height with a forest caliper of each tree. With these data we obtained basal area (BA), tree density (TD), and total over bark volume (TOBV) following models proposed by Ivancich [30]. Overstory canopy cover (OC) and transmitted solar radiation at understory level (TR) were measured using hemispherical photographs taken in the center of each transect at ground level with an 8-mm fisheye lens (Sigma, Japan) mounted on a 35 mm digital camera (Nikon, Japan) with a tripod levelling head to ensure horizontal lens position (see details in [3,14]). Additionally, four soil samples were randomly collected along each transect using a field borer with known volume (230.9 cm³) removing the litter layer. Soil samples were weighed before and after air-drying in laboratory conditions (24°C) until constant weight. Soil bulk density (SD) was obtained from the average of the four samples. After that, coarse root debris >2 mm and soil aggregations (e.g. small stones and large sand-sized) had been removed by sieving. For chemical analyses, we pooled individual soil samples into one combined sample per subplot. Each sample was finely ground to below 2 mm using a tungsten-carbide mill, and then we determined: (i) total organic carbon (SC) from soil samples washed with HCl (50%) by an automatic analyzer (LECO CR12, USA), (ii) total nitrogen (SN) by a semi-micro Kjeldahl method, and (iii) extractable phosphorus (P) according to the method of Bray and Kurtz [31]. Data for nutrient contents were presented as kg m-2 in the first 30 cm depth, using the SD data of each sub-plot. We also recorded animal feces from native (Lama guanicoe, guanaco) and domestic animals (cows) along each transect (50 × 4 m, 200 m²). We used the number of feces as a proxy of animal use (animal ha-1) by assuming: (i) Feces was maintained in the forest floor for a period not longer than a calendar year (decomposition rates was low during summer due to low temperatures and high during winter due to mechanical effect of snow accumulation) [8,32]. (ii) Average values of defecation per day were defined as 6.0 times per day for guanacos, and 12.3 times per day for cows. (iii) The requirements of dry matter forage (palatable plants) varied according to the animals (650 kg DM yr-1 for guanacos and 3250 kg DM yr-1 for cows). Also, we considered different residual palatable biomass in the understory for further calculations of stocking rate (130 kg DM ha-1 for guanacos and 260 kg DM ha-1 for cows). And finally, (iv) we used sheep equivalent based on the animal species size (0.50 for guanaco and 0.16 for cows) to standardize the current livestock density (LD) (for more details see [8]). To characterize the understory, we used the point-intercept method with 50 intercept points (every 1 m) along each transect. In each point, we recorded intercepted vascular plant species (data not shown), bare soil or litter without vegetation (BS), and woody debris cover (DC) (>2.5 cm diameter) to calculate ground cover. With the plant data we determined understory richness (RIC) and cover (UC). Finally, we collected all live aboveground plant material in an 0.25 m² area associated with each transect, and dried in an oven at 70°C until obtaining constant weight, resulting in an estimation of understory dry biomass (UB) for each subplot.
2.2. Radial growth of the regeneration and microclimate characterization
Stem radial growth of the regeneration was monitoring using DEX70 highly precise electronic dendrometers (±0.05 mm) and DEXLOG logger systems (Dynamax, USA) recording data every 30 minutes between October and April of two consecutive growing seasons (2018-2019 and 2019-2020). For this, we selected 6 regeneration plants with height <1.3 m growing in representative areas of the studied forest treatments: CF = regeneration starting diameter at the measuring point of 0.70 and 0.95 cm, OF = 1.65 and 2.15 cm, and EF = 1.34 and 2.51 cm. Each plant was protected by individual cages (mesh 2.5 x 2.5 cm) to avoid browsing due to guanacos or domestic livestock. At the same place of the dendrometer location, soil water content (±0.1%) was recorded every 30 minutes with ECHO EC5 soil moisture probes (5 replicas per location) and ECHO Em5b dataloggers (Decagon, USA). Additionally, we collected climatic variables of the study area every 30 minutes with a portable Davis weather station model Monitor II (Davis Instruments, USA) including rainfall (±0.2 mm), air and soil temperatures (±0.1°C). The weather station was located in a nearby open field, uninfluenced by overstory forests (±50 m apart). With the surveyed data it was calculated the daily average values of: (i) diameter growth increment (GI), (ii) soil water content (SWC), (iii) rainfall, and (iv) temperatures (air and soil). Diameter growth increments were classified in three phases for further analyses: (i) early or lag phase (1 October to 15 November), (ii) medium or exponential phase (15 November to 15 February), and (iii) late or stationary phase (15 February to 30 April). Southern Oscillation Index for each month of the two studied seasons were obtained from Bureau of Meteorology of the Australian Government (www.bom.gov.au/climate/enso/soi_monthly.txt).
2.3. Statistical analyses
One-way analyses of variance (ANOVA) were conducted using the different forest treatments (CF, OF, EF) as main factor, comparing forest structure (BA, TD, TOBV, OC), abiotic variables (TR, SD, SC, SN, SP), livestock density (LD) and understory characteristics (RIC, UB, UC, DC, BS). Also, four multifactorial ANOVAs were performed: (i) for soil water content (SWC) and diameter growth increment (GI) considering forest treatments (CF, OF, EF), growth phases during the season (early, medium, late) and seasons (2018-2019 and 2019-2020) as main factors; (ii) diameter growth increment (GI) considering forest treatments (CF, OF, EF), rainfall (0.0, 0.0-0.2, 0.2-1.0, >1.0 mm day-1) and seasons (2018-2019 and 2019-2020) as main factors; (iii) diameter growth increment (GI) considering forest treatments (CF, OF, EF), air temperature (<8.0, 8.0-10.0, >10.0°C) and seasons (2018-2019 and 2019-2020) as main factors; and (iv) diameter growth increment (GI) considering forest treatments (CF, OF, EF), soil temperature (<8.0, >8.0°C) and seasons (2018-2019 and 2019-2020) as main factors. Analyses were performed in Statgraphics Centurion software (StatPoint Inc., USA).
3. Results
3.1. Changes among the forest attributes of the studied environments
Significant differences were found in forest structure (BA, TD, TOBV, OC) where CF > OF > EF (Table 1). These changes in canopy overstory greatly influenced microclimate conditions at the understory level (e.g. TR) generating a clear gradient (EF > OF > CF) and influencing plant biomass (UB). However, understory richness (RIC) and cover o (UC), as well as debris cover (DC), were higher at greater overstory covers than in openlands (CF > OF > EF). Finally, bare soil (BS) were marginally higher in the openlands than under forest covers. Despite the food offer (e.g. UB) the livestock prefer the open forest canopies (e.g. OF) compared with. CF and EF, influencing mainly the soil density (SD) and phosphorous content (SP), but not generating significant changes over the other nutrients (e.g. C and N).
These changes in the forest structure and soil properties affected soil water content (SWC) dynamics (Table 2 and Appendix Figure A1). Low values were found at the OF (highly modified soil structure) compared to the other natural environments (CF and EF), where canopy cover (CF > OF > EF) determined the effective rainfall that reached the forest floor. SWC was greater at the beginning of the growing season (early or lag phase) and then decreased over time (medium or exponential phase, and late or stationary phase), where autumn and winter season started to freeze the soil. Finally, significant differences were found in SWC for the two studied seasons (2018-2019 < 2019-2020), where the first season starting with one La Niña event (SOI = 9.3, December 2018) and presenting one El Niño event during late summer (February 2019, SOI = -13.5), and the second season starting with one El Niño event (SOI = -9.3, November 2019). These events determined different rainfall patterns (Appendix Table A1 and Table A2) that impacted on SWC (Appendix A Figure A1). Soil water content was higher during the second season for all the forest treatments along the monitoring months. Air and soil temperatures were slightly higher during the second season. There were significant interactions in climate between treatments (Appendix A Figure A1) due to curves of the different treatments being crossed several times along the both seasons.
3.2. Daily growth increments of regeneration growing at different forest environments
Daily growth increment (GI) presented marginal differences (F = 2.97, p = 0.052) among forest treatments (EF > OF > CF), but showed significant differences over the growing season. Thus, GI increased from early or lag phase to medium or exponential phase, and decreased down near zero during late or stationary phase (Table 2 and Figure 1). No significant differences were found between the studied seasons, despite the season weather differences described before. Finally, significant interactions between treatments and phases due to the closed forests presented a lower slope in the curves than the other two treatments.
The magnitude of daily rainfall differently influenced GI according to forest treatments and phases over the seasons (Table 3). In closed forests (CF) daily growth rates were negative indicating a shrinkage of the stems (-0.0082 mm GI day-1 with no rain and -0.0008 mm GI day-1 with 0.0-0.2 mm day-1 of rainfall). Above 0.2 mm day-1 of rainfall, GI increased with the amount of daily rainfall. In open forests (OF) daily growth rates were negative only during the days without rain (shrinkage of -0.0051 mm GI day-1), and showed a positive GI in relation with the amount of daily rainfall. In edge forests (EF) daily growth rates were always positive by increasing with the amount of daily rainfall. Besides, OF and EF presented significant differences among the phases across the growing seasons, being greater during the medium or exponential phase. Significant interactions were related to the different slope curves of the different phases over the growing seasons. The rainfall frequency changed among the months (Appendix 2), e.g. 33% to 66% on days with no rain, and 10% to 23% on days with more than 0.2 mm day-1 of rainfall.
Daily average air temperature did not significantly influence GI and phases according to the forest treatments (Table 4), however, higher values were found at 8.0-10.0°C for all treatments. Despite this, phases across the seasons only presented significant differences as was described before. Finally, daily average soil temperature showed significant differences only for EF, being greater for temperatures above 8.0°C (Table 5). The frequency of occurrence of each temperature category changed among the different months (Appendix 2), e.g. most air and soil temperatures in October and April were <8.0°C, while in summer (December to February) were >8.0°C.
The interactions among climate variables (daily rainfall, air and soil temperatures) affected the diameter growth increment of the regeneration in the different forest environments (Figure 2). However, it was clear that the magnitude of the climate variables influenced more than the forest environments itself. When daily rainfall was crossed with air temperatures, while higher GI values were positively correlated at higher amounts of rainfall and air temperatures. Besides, medium values of GI were found at lower amounts of daily rainfall and higher air temperatures. The lowest GI values were found at lower daily rainfall and air temperatures. In this sense, higher rainfall values only influenced over GI values when the air temperatures were higher than 9°C. When daily rainfall was crossed with soil temperatures, the higher GI values were also positively correlated (e.g. higher amounts of rainfall and soil temperatures) (Figure 3). Low and medium GI values were found at lower amounts of daily rainfalls, and high rainfall values only influenced GI values when the soil temperatures were higher than 9.4°C and rainfall higher than 1.0 mm day-1. The third comparison analyzed the cross between air and soil temperatures, where the medium and higher GI values occurred at higher values of both variables. However, in the lower GI values, the influence of soil temperatures was higher in openlands (EF) than under the different forest canopies (CF-OF).
4. Discussion
4.1. The influence of overstory cover and management over forest attributes
Natural forests of N. antarctica follow simple gap dynamics, where decay of mature trees or local wind-throw promote the development of regeneration based on seed and agamic reproduction (e.g. root sprouts) [3,12,33]. The recruitment and survival of seedlings are mainly related to the balance between light and soil moisture availability, and other abiotic factors such as animal browsing (livestock and natural populations of Lama guanicoe) [8,13,34] and understory cover [9,10,11]. In mature or secondary forests without management (CF), the overstory decreases the light availability affecting understory biomass and biodiversity values in relation with the age structure of the trees [8].
Silvopastoral systems (OF) are proposed to manage these forests, where thinning increases the understory biomass to maximize livestock production [2], but may generate richness species loss [6,35]. Animal use at high stocking rate modify some soil layer characteristics, e.g. increase soil density, as well as phosphorus and nitrogen contents due to manure depositions [8,36,37]. The ecotone environments between forests and grasslands (EF) presented greater understory biomass, with lower plant richness, and more bare soil due to greater wind exposure [38,39]. The described changes influence over livestock density, where animals prefer managed forests (OF) compared to closed forests (CF) due to better pasture allowance, and compared to open environments (EF) due to better environmental conditions [8]. Besides, the stand microclimate and soil conditions changed, and also conditioned the regeneration recruitment, growth and survival [40,41].
4.2. Regeneration growing at different forest environments
Soil water content greatly varies within the growing season and between years, which is evidence that is a limiting factor for the regeneration, and can greatly influence over annual growth. Contrary to our expectations, we found less soil water content in the managed forests (OP < CF < EP), probably due to the higher soil density in the upper soil layer from compaction [3,8]. At these high latitudes, the soil water content decreases from late spring to late summer, mainly related to the snow melt accumulated during the winter season, and which can influence over the entire growing season (e.g. higher snow accumulation during winter promotes higher water availability in soils during summer) [42]. As it was expected, the mean diameter growth of the regeneration (mm day-1) decreased with the overstory canopy, as was cited for other Nothofagus species [12,43], and follow the expected response across the different growth development phases over the season [44], but not significantly changed among years despite the described differences. However, the trend showed higher growths during the humid year compared to the drier one. The soil moisture trend across the seasons and years (Appendix 1) can be related to the regeneration growth rates (Figure 2). The first year presented a drought period during the late summer, which promoted the stop of the growth before the performance observed during the second year, which was more humid. Most of the research on growth (height, diameter, biomass) considered the full season, and relate these values with average climate values for the year or for some specific months (e.g. summer) [11,19,43]. However, the yearly growth performance can be influenced for small critical periods of time, and not necessarily for all the months during the growing season. Drought effects were previously described for many Nothofagus species, and define the structure of the future forests under climate change with more frequent drought events [45,46,47].
The daily stem dynamic studies were reported as a useful tool for several studies [48,49], where dendrometers offer a useful tool for long-term, high-resolution monitoring of tree responses to environmental fluctuations and climate change [50]. In our study, the response of the regeneration radial growth to the microclimate and resources availability was heterogeneous among the different forest environments evidencing different resilience of the regeneration growing at these different conditions to face the changes in the forest structure [15,51]. Unmanaged forests (CF) did not significantly change the regeneration growth rates over the season, compared to open environments (OF and EF) that followed the expected growing rates (e.g. early, exponential and stationary phases). These growing rates are directly related to the daily rainfall, where the amount of water that reaches the forest floor was proportional to the canopy overstory cover [14,38,40]. The unmanaged forests (CF) had lower resilience than managed stands (OF) than edge forests (EF), where negative growth (shrinking diameters) were observed (<0.2 mm day-1 in CF, and days without rainfall in OF). Negative growths associated with root mortality and tree decay was previously reported for other Nothofagus species at these latitudes [21]. The outputs suggest that regeneration growing in unmanaged forests is more vulnerable to drought periods than the more open areas. The higher mortality rates in the higher overstory canopies were described previously [2,12,30,51], but this is the first time that the growing rates of the regeneration was linked to the daily rainfall events.
The measured radial growth rates of the regeneration were not related to the air temperatures. However, some trends can be observed, e.g. lower growth rates occurred at lower and higher temperatures (maximum growing rates found in open areas were observed at daily temperatures between 8 and 10°C). Similar trend was observed for soil temperatures, however, significant differences were found in the edge forests (EF), where positive values were obtained in soil temperatures >8°C. The temperature (air and soil) can be a limiting factor in some forest ecosystems [52,53], where soil temperature determines the activity periods of the roots and in consequence of the entire plants [54]. Soil temperature has complex effects on trees and soil, which can affect carbon dynamics in forest ecosystems [55]. There were positive and negative synergies when the microclimate factors were analyzed together (Figure 3). The higher growth rate values for the three studied environments were found at high daily rainfall and temperature (both air and soil). From this, the threshold was determined at a daily rainfall of 1 mm day-1 or air temperature of 9°C. Growth dynamics were not solely driven by soil temperature, but resource competition also played a significant role [55], which can be influenced by other microclimate factors. These synergies in the growth were reported by Dantas et al. [56] who determined that rainfall, not soil temperature, limits seed germination of dry forest species. Similarly, Belyazid et al. [57] showed that reduced soil water availability in the summer seasons will strongly limit the expected gain in weathering associated with higher temperatures. These positive and negative synergies are directly related to the overstory that influence biotic and abiotic conditions, e.g. microclimate within a regenerating forest changes with increasing distance from a mature forest edge that determines the magnitude of microclimatic change varies over diurnal, seasonal and successional time scales [44]. Climatic events as the ENSO phenomena, greatly influences forest dynamics at regional level [58], and could lead positive and negative synergies at natural and managed forests [59,60].
4.3. Management implications
Climate change defines new levels of global rainfall and mean temperatures, and also the recurrence of extreme events (e.g. the length of growing periods) [61,62]. The resilience capacity of the Nothofagus forests to recover canopy cover losses are based on the seedling banks and seedlings survival for one season [63,64,65]. Contrary, seedling banks can survive for long periods of time, waiting for the canopy opening, and the resilience capacity is based on their regeneration survival capacity [11,12]. For this, consecutive drought periods over the season can lead to decreases in the growth rate, and consequently, raising numbers of seedling death rates. Other studies related to the impact of climate change over forest regeneration confirm negative, but also positive synergies, highlighting the importance of site-specific effects [38,65,66].
Silvopastoral systems in N. antarctica forests have been designed to improve the timber quality of the trees, and at the same time, increase the forage availability for livestock [4,33]. One of the main challenges is to assure the tree strata continuity, based on the tree regeneration. For this, natural regeneration must be enhanced, and protected from limiting factors (e.g. over-browsing) until trees can free develop in the managed stands [2]. This study showed that the canopy opening improves the radial growth rates of natural regeneration, and improves the resilience to face long drought periods compared to unmanaged stands. These findings provide thresholds for regeneration survival, allowing us to develop more sustainable silvicultural practices. We suggest to follow a strategy of adaptive management [33,67,68] based on long-term monitoring of local extreme climate events, e.g. PEBANPA network [28]. In this sense, this study highlights the need for more sustainable management strategies to maintain ecosystem functions and resilience by reducing forest degradation to face potential climate change impacts.
5. Conclusions
Forest dynamics and harvesting modifies the stand conditions, influencing the microclimate and natural cycles. The resilience of radial growth of the regeneration facing these changes is modified according to the overstory forest structure, including the direct relationship with the availability of light, temperature and soil moisture. The temperature (air and soil) and daily rainfall events influence over regeneration daily growth, leading to increase or decrease the diameter according to the magnitude of such events. The outputs indicate that regeneration of Nothofagus antarctica are vulnerable to non-rainy days in relation to the crown cover of the stands, and change the vulnerability across the growing season. Besides, the magnitude of these changes was also related to the year, e.g. presence of drought periods during summer. These outputs suggest the needs of long-term monitoring to develop more robust silvicultural proposals to face climate change or more frequent extreme events, due to forest-term at these latitudes exceeding hundreds of years.
Author Contributions
Conceptualization, G.M.P. and M.V.L.; methodology, G.M.P., F.A.R. and P.L.P.; software, J.M.C.; validation, J.M.C.; formal analysis, J.R.S. and M.V.L.; investigation, J.R.S., J.M.C., J.E.C and M.C.A.A.; data curation, J.R.S.; writing-original draft preparation, G.M.P.; writing-review and editing, J.R.S., M.V.L., J.M.C., J.E.C, M.C.A.A., F.A.R and P.L.P; supervision, G.M.P. and P.L.P; project administration, G.M.P. and M.V.L.; funding acquisition, P.L.P. All authors have read and agreed to the published version of the manuscript.
Funding
This research was funded by the grants: (i) PDTS-0398 (2020-2023) “Manejo sostenible de los bosques de Nothofagus y ambientes naturales de Tierra del Fuego: Compatibilizando la producción y la conservación de la biodiversidad” supported by MINCyT (Argentina), (ii) PITES-03 (2022-2023) “Propuesta de conservación multicriterio de los bosques nativos de Argentina: Funcionalidad, biodiversidad, servicios ecosistémicos y resiliencia frente al cambio climático” supported by MINCyT (Argentina), and (iii) PIP2021GI (2022-2025) “Resiliencia de los bosques manejados de Nothofagus pumilio frente a alternativas silvícolas, cambio climático y eventos extremos en Tierra del Fuego” supported by CONICET (Argentina).
Institutional Review Board Statement
Not applicable.
Informed Consent Statement
Not applicable.
Data Availability Statement
Availability of data and material: At CADIC-CONICET (Argentina) repository.
Acknowledgments
To the researchers, technicians, students and landowners (ranch and sawmill companies) that supported this research, without which it would have been impossible to obtain the valuable information used in this work.
Conflicts of Interest
The authors declare no conflict of interest. The funders had no role in the design of the study; in the collection, analyses, or interpretation of data; in the writing of the manuscript, or in the decision to publish the results.
Appendix A
Figure A1.
Soil water content (%) during the growing season (S1 = 2018-2019 in dark colors, S2 = 2019-2020 in pale colors) for the different forest treatments (CF = closed primary forests in green, OF = open forests in blue, EF = edge forests with openlands in orange). Days starting at the beginning of October of each season.
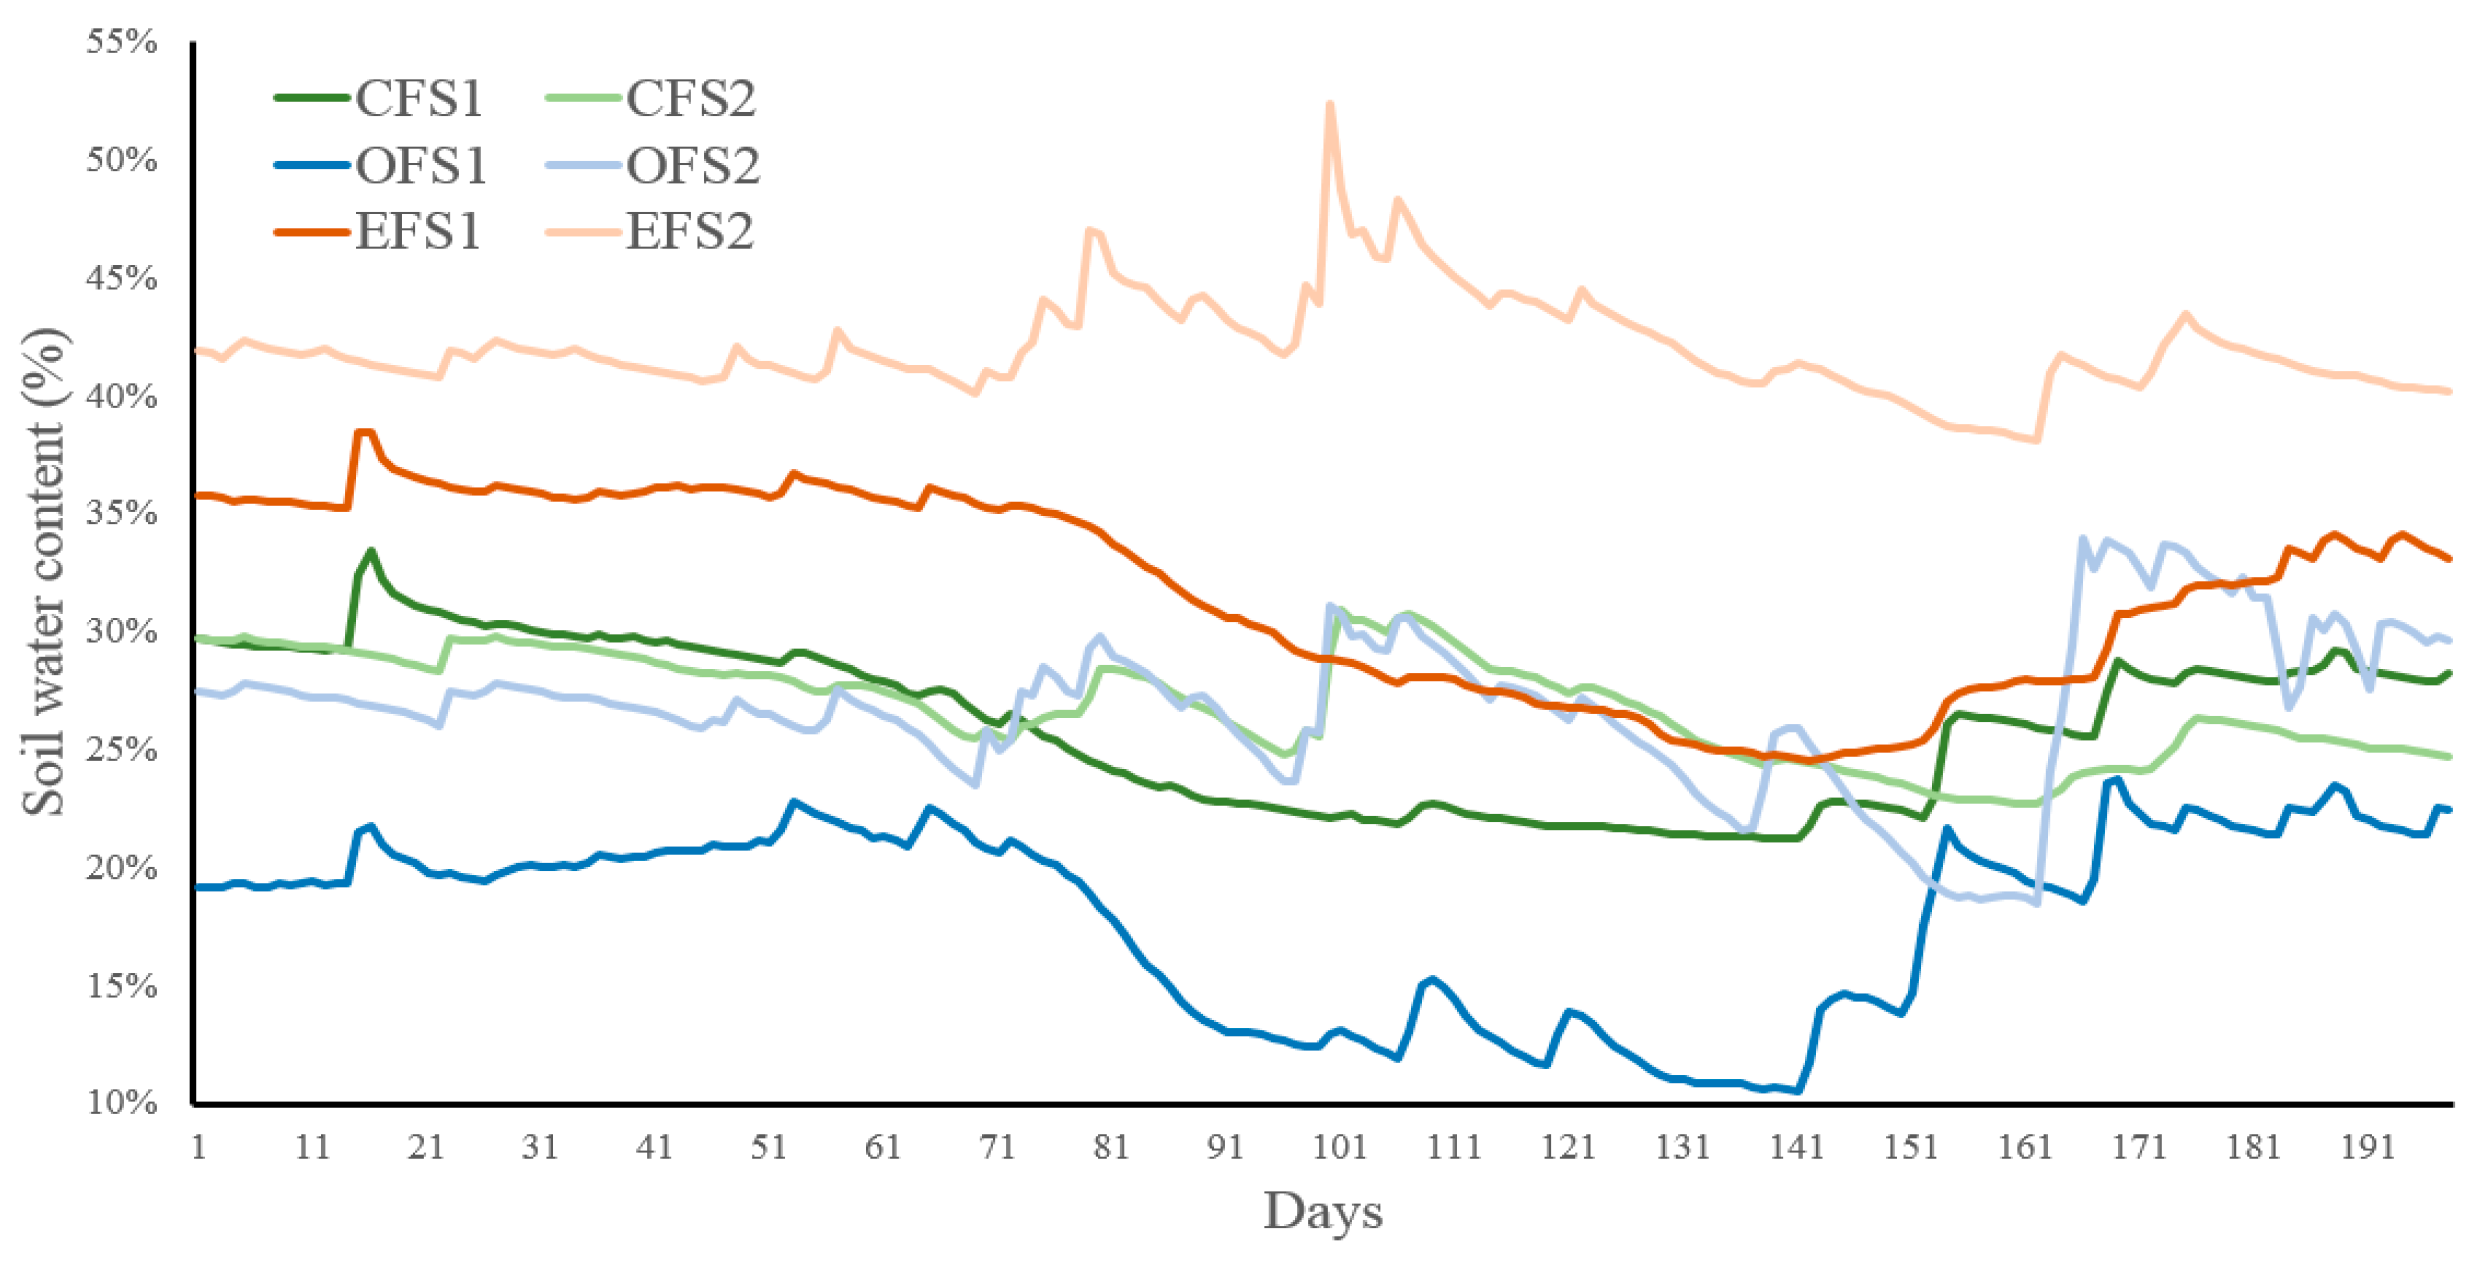

Table A1.
Weather station values by months (October to April) during both growing seasons (2018-2019, 2019-2020) for rainfall (RAIN, mm month-1), average air temperature (°C) and average soil temperature (°C).
Table A1.
Weather station values by months (October to April) during both growing seasons (2018-2019, 2019-2020) for rainfall (RAIN, mm month-1), average air temperature (°C) and average soil temperature (°C).
| Season | Month | RAIN | AT | ST |
|---|---|---|---|---|
| 2018-2019 | OCT | 32.8 | 5.2 | 4.6 |
| NOV | 16.4 | 8.5 | 8.2 | |
| DEC | 27.6 | 10.7 | 10.6 | |
| JAN | 20.4 | 9.9 | 10.8 | |
| FEB | 20.2 | 9.4 | 10.7 | |
| MAR | 33.8 | 8.5 | 9.1 | |
| APR | 40.4 | 4.8 | 5.8 | |
| 2019-2020 | OCT | 12.6 | 5.5 | 5.3 |
| NOV | 31.0 | 7.7 | 7.9 | |
| DEC | 45.6 | 10.3 | 10.5 | |
| JAN | 52.0 | 10.8 | 11.4 | |
| FEB | 14.0 | 10.8 | 11.7 | |
| MAR | 20.8 | 8.4 | 9.5 | |
| APR | 3.1 | 4.6 | 5.5 |
Table A2.
Frequency of days by months and full season (October to April) during both growing seasons (2018-2019, 2019-2020) according to the studied levels of daily rainfall (mm), daily average air temperature (°C) and daily average soil temperature (°C).
Table A2.
Frequency of days by months and full season (October to April) during both growing seasons (2018-2019, 2019-2020) according to the studied levels of daily rainfall (mm), daily average air temperature (°C) and daily average soil temperature (°C).
| Rainfall | 0.0 | 0.0-0.2 | 0.2-1.0 | >1.0 |
|---|---|---|---|---|
| OCT | 64.5% | 16.1% | 9.7% | 9.7% |
| NOV | 60.0% | 10.0% | 11.7% | 18.3% |
| DEC | 66.1% | 9.7% | 12.9% | 11.3% |
| JAN | 50.0% | 16.1% | 14.5% | 19.4% |
| FEB | 51.3% | 25.6% | 12.8% | 10.3% |
| MAR | 51.6% | 12.9% | 12.9% | 22.6% |
| APR | 33.3% | 33.3% | 13.3% | 20.0% |
| SEASON | 56.1% | 16.2% | 12.4% | 15.3% |
| Air temperature | <8.0 | 8.0-10.0 | >10.0 | |
| OCT | 88.7% | 4.8% | 6.5% | |
| NOV | 46.7% | 33.3% | 20.0% | |
| DEC | 12.9% | 19.4% | 67.7% | |
| JAN | 12.9% | 32.3% | 54.8% | |
| FEB | 33.3% | 17.9% | 48.7% | |
| MAR | 41.9% | 25.8% | 32.3% | |
| APR | 90.0% | 10.0% | 0.0% | |
| SEASON | 43.9% | 21.1% | 35.0% | |
| Soil temperature | <8.0 | >8.0 | ||
| OCT | 100.0% | 0.0% | ||
| NOV | 40.0% | 60.0% | ||
| DEC | 0.0% | 100.0% | ||
| JAN | 0.0% | 100.0% | ||
| FEB | 0.0% | 100.0% | ||
| MAR | 6.5% | 93.5% | ||
| APR | 86.7% | 13.3% | ||
| SEASON | 32.9% | 67.1% |
References
- Hakkenberg, C.R.; Song, C.; Peet, R.K.; White, P.S. Forest structure as a predictor of tree species diversity in the North Carolina Piedmont. J. Veg. Sci. 2016, 27, 1151–1163. [Google Scholar] [CrossRef]
- Peri, P.L.; Hansen, N.E.; Bahamonde, H.A.; Lencinas, M.V.; von Müller, A.R.; Ormaechea, S.; Gargaglione, V.; Soler, R.M.; Tejera, L.; Lloyd, C.E.; Martínez Pastur, G. Silvopastoral systems under native forest in Patagonia, Argentina. In Silvopastoral systems in southern South America; Peri, P.L., Dube, F., Varella, A., Eds.; Springer, Series; Advances in Agroforestry 11: Bern, Switzerland, 2016; chapter 6, pp 117-168. [Google Scholar]
- Martínez Pastur, G.; Rosas, Y.M.; Chaves, J.; Cellini, J.M.; Barrera, M.D.; Favoretti, S.; Lencinas, M.V.; Peri, P.L. Changes in forest structure values along the natural cycle and different management strategies in Nothofagus antarctica forests. For. Ecol. Manage. 2021, 486, e118973. [Google Scholar] [CrossRef]
- Martínez Pastur, G.; Soler, R.M.; Lencinas, M.V.; Cellini, J.M.; Peri, P.L. Long-term monitoring of thinning for silvopastoral purposes in Nothofagus antarctica forests of Tierra del Fuego, Argentina. For. Syst. 2018, 27, e–01S. [Google Scholar] [CrossRef]
- Bahamonde, H.A.; Peri, P.L.; Álvarez, R.; Barneix, A. Producción y calidad de gramíneas en un gradiente de calidades de sitio y coberturas en bosques de Nothofagus antarctica (G. Forster) Oerst. en Patagonia. Ecología Austral 2012, 22, 62–73. [Google Scholar]
- Alonso, M.F.; Wentzel, H.; Schmidt, A.; Balocchi, O. Plant community shifts along tree canopy cover gradients in grazed Patagonian Nothofagus antarctica forests and grasslands. Agrofor. Syst. 2020, 94, 651–661. [Google Scholar] [CrossRef]
- Ormaechea, S.; Peri, P.L. Landscape heterogeneity influences on sheep habits under extensive grazing management in Southern Patagonia. Liv. Res. Rural Dev. 2015, 27, e105. [Google Scholar]
- Martínez Pastur, G.; Cellini, J.M.; Chaves, J.; Rodriguez-Souilla, J.; Benítez, J.; Rosas, Y.M.; Soler, R.M.; Lencinas, M.V.; Peri, P.L. Changes in forest structure modify understory and livestock occurrence along the natural cycle and different management strategies in Nothofagus antarctica forests. Agrofor. Syst. 2022, 96, 1039–1052. [Google Scholar] [CrossRef]
- Martínez Pastur, G.; Rosas, Y.M.; Cellini, J.M.; Barrera, M.D.; Toro Manríquez, M.; Huertas Herrera, A.; Favoretti, S.; Lencinas, M.V.; Peri, P.L. Conservation values of understory vascular plants in even- and uneven-aged Nothofagus antarctica forests. Biodiv. Conserv. 2020, 29, 3783–3805. [Google Scholar] [CrossRef]
- Peri, P.L.; López, D.; Rusch, V.; Rusch, G.; Rosas, Y.M.; Martínez Pastur, G. State and transition model approach in native forests of Southern Patagonia (Argentina): Linking ecosystemic services, thresholds and resilience. Int. J. Biodiv. Sci. Ecosyst. Serv. Manage. 2017, 13, 105–118. [Google Scholar] [CrossRef]
- Soler, R.M.; Martínez Pastur, G.; Peri, P.L.; Lencinas, M.V.; Pulido, F. Are silvopastoral systems compatible with forest regeneration? An integrative approach in southern Patagonia. Agrofor. Syst. 2013, 87, 1213–1227. [Google Scholar] [CrossRef]
- Bahamonde, H.A.; Lencinas, M.V.; Martínez Pastur, G.; Monelos, L.H.; Soler, R.M.; Peri, P.L. Ten years of seed production and establishment of regeneration measurements in Nothofagus antarctica forests under different crown cover and quality sites, in Southern Patagonia. Agrofor. Syst. 2018, 92, 623–635. [Google Scholar] [CrossRef]
- Martínez Pastur, G.; Soler, R.M.; Ivancich, H.; Lencinas, M.V.; Bahamonde, H.A.; Peri, P.L. Effectiveness of fencing and hunting to control Lama guanicoe browsing damage: Implications for Nothofagus pumilio regeneration in harvested forests. J. Environ. Manage. 2016, 168, 165–174. [Google Scholar] [CrossRef]
- Martínez Pastur, G.; Peri, P.L.; Cellini, J.M.; Lencinas, M.V.; Barrera, M.D.; Ivancich, H. Canopy structure analysis for estimating forest regeneration dynamics and growth in Nothofagus pumilio forests. Ann. For. Sci. 2011, 68, 587–594. [Google Scholar] [CrossRef]
- Torres, A.D.; Cellini, J.M.; Lencinas, M.V.; Barrera, M.D.; Soler, R.M.; Díaz-Delgado, R.; Martínez Pastur, G. Seed production and recruitment in primary and harvested Nothofagus pumilio forests: Influence of regional climate and years after cuttings. For. Syst. 2015, 24, 1–11. [Google Scholar] [CrossRef]
- Villalba, R.; Luckman, B.; Boninsegna, J.; D'arrigo, R.; Lara, A.; Villanueva-Diaz, J.; Masiokas, M.; Argollo, J.; Soliz, C.; Lequesne, C.; Stahle, D.; Roig, F.A.; Aravena, J.; Wiles, G.; Hartsough, P.; Wilson, R.; Watson, E.; Cook, E.; Cerano-Paredes, J.; Therrell, M.; Cleaveland, M.; Morales, M.; Moya, J.; Pacajes, J.; Massaccesi, G.; Biondi, F.; Urrutia, R.; Martínez Pastur, G. Dendroclimatology from regional to continental scales: Understanding regional processes to reconstruct large-scale climatic variations across the Western Americas. In Dendroclimatology: Progress and prospects; Hughes, M., Swetnam, T., Díaz, H., Eds.; Springer, Developments in Paleoenvironmental Research 11: Amsterdam, Netherlands, 2010; chapter 7, pp 175-227. [Google Scholar]
- Gao, S.; Liang, E.; Liu, R.; Babst, F.; Camarero, J.; Fu, Y.; Piao, S.; Rossi, S.; Shen, M.; Wang, T.; Peñuelas, J. An earlier start of the thermal growing season enhances tree growth in cold humid areas but not in dry areas. Nature Ecol. Evol. 2022, 6, 397–404. [Google Scholar] [CrossRef] [PubMed]
- Martínez-Sancho, E.; Treydte, K.; Lehmann, M.; Rigling, A.; Fonti, P. Drought impacts on tree carbon sequestration and water use-evidence from intra-annual tree-ring characteristics. New Phytol. 2022, 236, 58–70. [Google Scholar] [CrossRef] [PubMed]
- Martínez Pastur, G.; Soler, R.M.; Pulido, F.; Lencinas, M.V. Variable retention harvesting influences biotic and abiotic drivers of regeneration in Nothofagus pumilio southern Patagonian forests. For. Ecol. Manage. 2013, 289, 106–114. [Google Scholar] [CrossRef]
- De Frenne, P.; Lenoir, J.; Luoto, M.; Scheffers, B.; Zellweger, F.; Aalto, J.; Ashcroft, M.; Christiansen, D.; Decocq, G.; De Pauw, K.; Govaert, S.; Greiser, C.; Gril, E.; Hampe, A.; Jucker, T.; Klinges, D.; Koelemeijer, I.; Lembrechts, J.; Marrec, R.; Meeussen, C.; Ogée, J.; Tyystjärvi, V.; Vangansbeke, P.; Hylander, K. Forest microclimates and climate change, Importance; drivers and future research agenda. Glob. Chang. Biol. 2021, 27, 2279–2297. [Google Scholar] [CrossRef]
- Martínez Pastur, G.; Lencinas, M.V.; Cellini, J.M.; Mundo, I. Diameter growth: Can live trees decrease? Forestry 2007, 80, 83–88. [Google Scholar] [CrossRef]
- Sniderhan, A.E.; Mamet, S.D.; Baltzer, J.L. Non-uniform growth dynamics of a dominant boreal tree species (Picea mariana) in the face of rapid climate change. Can. J. For. Res. 2021, 51, 565–572. [Google Scholar] [CrossRef]
- Matskovsky, V.; Roig, F.A.; Martínez Pastur, G. Removal of non-climatically induced seven-year cycle from Nothofagus pumilio tree-ring width chronologies from Tierra del Fuego; Argentina for their use in climate reconstructions. Dendrochronologia 2019, 57, e125610. [Google Scholar] [CrossRef]
- Matskovsky, V.; Roig, F.A.; Fuentes, M.; Korneva, I.; Araneo, D.; Linderholm, H.; Aravena, J.C. Summer temperature changes in Tierra del Fuego since AD 1765: Atmospheric drivers and tree-ring reconstruction from the southernmost forests of the world. Clim. Dyn. 2023, 60, 1635–1649. [Google Scholar] [CrossRef]
- Castellano, P.; Srur, A.; Bianchi, L. Climate-growth relationships of deciduous and evergreen Nothofagus species in Southern Patagonia, Argentina. Dendrochronologia 2019, 58, e125646. [Google Scholar] [CrossRef]
- Yang, J.; Cooper, D.; Li, Z.; Song, W.; Zhang, Y.; Zhao, B.; Han, S.; Wang, X. Differences in tree and shrub growth responses to climate change in a boreal forest in China. Dendrochronologia 2020, 63, e125744. [Google Scholar] [CrossRef]
- Kang, J.; Shishov, V.V.; Tychkov, I.; Zhou, P.; Jiang, S.; Ilyin, V.A.; Ding, X.; Huang, J.G. Response of model-based cambium phenology and climatic factors to tree growth in the Altai Mountains, Central Asia. Ecol. Ind. 2022, 143, e109393. [Google Scholar] [CrossRef]
- Peri, P.L.; Lencinas, M.V.; Bousson, J.; Lasagno, R.; Soler, R.M.; Bahamonde, H.A.; Martínez Pastur, G. Biodiversity and ecological long-term plots in Southern Patagonia to support sustainable land management: The case of PEBANPA network. J. Nat. Conserv. 2016, 34, 51–64. [Google Scholar] [CrossRef]
- Bitterlich, W. The relascope idea: Relative measurements in forestry; CAB: London, England, 1984. [Google Scholar]
- Ivancich, H. Relaciones entre la estructura forestal y el crecimiento del bosque de Nothofagus antarctica en gradientes de edad y calidad de sitio. Dissertation of doctoral thesis, Universidad Nacional de La Plata, La Plata, Argentina, 2013.
- Bray, R.H.; Kurtz, L.T. Determination of total, organic, and available forms of phosphorus in soils. Soil Sci. 1945, 59, 39–45. [Google Scholar] [CrossRef]
- Bahamonde, H.A.; Gargaglione, V.; Peri, P.L. Sheep faeces decomposition and nutrient release across an environmental gradient in Southern Patagonia. Ecología Austral 2017, 27, 18–28. [Google Scholar] [CrossRef]
- Peri, P.L.; Rosas, Y.M.; López, D.; Lencinas, M.V.; Cavallero, L.; Martínez Pastur, G. Management strategies for silvopastoral system in native forests. Ecología Austral 2022, 32, 749–766. [Google Scholar] [CrossRef]
- Soler, R.M.; Martínez Pastur, G.; Lencinas, M.V.; Borrelli, L. Differential forage use between native and domestic herbivores in southern Patagonian Nothofagus forests. Agrofor. Syst. 2012, 85, 397–409. [Google Scholar] [CrossRef]
- Quinteros, P.; Hansen, N.; Kutschker, A. Composición y diversidad del sotobosque de ñire (Nothofagus antarctica) en función de la estructura del bosque. Ecología Austral 2010, 20, 225–234. [Google Scholar]
- Quinteros, P.; López Bernal, P.M.; Gobbi, M.E.; Bava, J. Distance to flood meadows as a predictor of use of Nothofagus pumilio forest by livestock and resulting impact, in Patagonia, Argentina. Agrofor. Syst. 2012, 84, 261–272. [Google Scholar] [CrossRef]
- Piazza, M.V.; Garibaldi, L.; Kitzberger, T.; Chaneton, E. Impact of introduced herbivores on understory vegetation along a regional moisture gradient in Patagonian beech forests. For. Ecol. Manage. 2016, 366, 11–22. [Google Scholar] [CrossRef]
- Pollmann, W.; Veblen, T.T. Nothofagus regeneration dynamics in south-central Chile, A test of a general model. Ecol. Monograp. 2004, 74, 615–634. [Google Scholar] [CrossRef]
- van Galen, L.; Lord, J.; Orlovich, D.; Larcombe, M. Restoration of southern hemisphere beech (Nothofagaceae) forests: A meta-analysis. Rest. Ecol. 2020, 29, e13333. [Google Scholar] [CrossRef]
- Martínez Pastur, G.; Cellini, J.M.; Lencinas, M.V.; Barrera, M.D.; Peri, P.L. Environmental variables influencing regeneration of Nothofagus pumilio in a system with combined aggregated and dispersed retention. For. Ecol. Manage. 2011, 261, 178–186. [Google Scholar] [CrossRef]
- Soto, D.; Donoso, P.; Zamorano Elgueta, C.; Ríos, A.; Promis, A. Precipitation declines influence the understory patterns in Nothofagus pumilio old-growth forests in northwestern Patagonia. For. Ecol. Manage. 2021, 491, e119169. [Google Scholar] [CrossRef]
- Toro-Manríquez, M.; Soler, R.M.; Lencinas, M.V.; Promis, A. Canopy composition and site are indicative of mineral soil conditions in Patagonian mixed Nothofagus forests. Ann. For. Sci. 2019, 76, e117. [Google Scholar] [CrossRef]
- Rosenfeld, J.M.; Navarro Cerrillo, R.; Guzman Alvarez, J.R. Regeneration of Nothofagus pumilio (Poepp. et Endl.) Krasser forests after five years of seed tree cutting. J. Environ. Manage. 2006, 78, 44–51. [Google Scholar] [CrossRef]
- Baker, T.; Jordan, G.; Steel, A.; Fountain-Jones, N.; Wardlaw, T.; Baker, S. Microclimate through space and time, Microclimatic variation at the edge of regeneration forests over daily, yearly and decadal time scales. For. Ecol. Manage. 2014, 334, 174–184. [Google Scholar] [CrossRef]
- Suárez, M.L.; Kitzberger, T. Recruitment patterns following a severe drought: Long-term compositional shifts in Patagonian forests. Can. J. For. Res. 2008, 38, 3002–3010. [Google Scholar] [CrossRef]
- Varela, S.A.; Gyenge, J.E.; Fernández, M.E.; Schlichter, T. Seedling drought stress susceptibility in two deciduous Nothofagus species of NW Patagonia. Trees 2010, 24, 443–453. [Google Scholar] [CrossRef]
- Amoroso, M.; Suarez, M.L.; Daniels, L. Nothofagus dombeyi regeneration in declining Austrocedrus chilensis forests: Effects of overstory mortality and climatic events. Dendrochronologia 2012, 30, 105–112. [Google Scholar] [CrossRef]
- Just, M.; Frank, S.D. Evaluation of an easy-to-install; low-cost dendrometer band for citizen-science tree research. J. For. 2019, 117, 317–322. [Google Scholar] [CrossRef]
- Olivar, J.; Rais, A.; Pretzsch, H.; Bravo, F. The impact of climate and adaptive forest management on the intra-annual growth of Pinus halepensis based on long-term dendrometer recordings. Forests 2022, 13, e935. [Google Scholar] [CrossRef]
- van der Maaten, E.; Pape, J.; van der Maaten-Theunissen, M.; Scharnweber, T.; Smiljanić, M.; Cruz-García, R.; Wilmking, M. Distinct growth phenology but similar daily stem dynamics in three co-occurring broadleaved tree species. Tree Physiol. 2018, 38, 1820–1828. [Google Scholar] [CrossRef] [PubMed]
- Paredes, D.; Cellini, J.M.; Lencinas, M.V.; Parodi, M.; Quiroz, D.; Ojeda, J.; Farina, S.; Rosas, Y.M.; Martínez Pastur, G. Influencia del paisaje en las cortas de protección en bosques de Nothofagus pumilio: Cambios en la estructura forestal y respuesta de la regeneración. Bosque 2020, 41, 55–64. [Google Scholar] [CrossRef]
- Kellomäki, S.; Väisänen, H. Modelling the dynamics of the forest ecosystem for climate change studies in the boreal conditions. Ecol. Model. 1997, 97, 121–140. [Google Scholar] [CrossRef]
- Pérez-Girón, J.C.; Álvarez-Álvarez, P.; Díaz-Varela, E.; Mendes Lopes, D. Influence of climate variations on primary production indicators and on the resilience of forest ecosystems in a future scenario of climate change: Application to sweet chestnut agroforestry systems in the Iberian Peninsula. Ecol. Ind. 2020, 113, e106199. [Google Scholar] [CrossRef]
- Groffman, P.M.; Driscoll, C.T.; Fahey, T.J.; Hardy, J.; Fitzhugh, R.; Tierney, G. Colder soils in a warmer world, A snow manipulation study in a northern hardwood forest ecosystem. Biogeochem. 2001, 56, 135–150. [Google Scholar] [CrossRef]
- Kilpeläinen, J.; Domisch, T.; Lehto, T.; Piirainen, S.; Silvennoinen, R.; Repo, T. Separating the effects of air and soil temperature on silver birch. Part I. Does soil temperature or resource competition determine the timing of root growth? Tree Physiol. 2022, 42, 2480–2501. [Google Scholar] [CrossRef]
- Dantas, B.; Moura, M.; Pelacani, C.; Angelotti, F.; Taura, T.; Oliveira, G.; Bispo, J.; Matias, J.; Silva, F.; Pritchard, H.; Seal, C. Rainfall, not soil temperature, will limit the seed germination of dry forest species with climate change. Oecologia 2020, 192, 529–541. [Google Scholar] [CrossRef]
- Belyazid, S.; Akselsson, C.; Zanchi, G. Water limitation in forest soils regulates the increase in weathering rates under climate change. Forests 2022, 13, e310. [Google Scholar] [CrossRef]
- Holmgren, M.; Scheffer, M.; Ezcurra, E.; Gutiérrez, J.; Mohren, G. El Niño effects on the dynamics of terrestrial ecosystems. Trends Ecol. Evol. 2001, 16, 89–94. [Google Scholar] [CrossRef] [PubMed]
- Maza-Villalobos, S.; Poorter, L.; Martínez-Ramos, M. Effects of ENSO and temporal rainfall variation on the dynamics of successional communities in old-field succession of a tropical dry forest. PLOS One 2013, 8, e82040. [Google Scholar] [CrossRef]
- Nunes, M.H.; Jucker, T.; Riutta, T.; Svátek, M.; Kvasnica, J.; Rejžek, M.; Matula, R.; Majalap, N.; Ewers, R.; Swinfield, T.; Valbuena, R.; Vaughn, N.; Asner, G.; Coomes, D. Recovery of logged forest fragments in a human-modified tropical landscape during the 2015-16 El Niño. Nat. Commun. 2021, 12, e1526. [Google Scholar] [CrossRef]
- Gaertner, B.; Zegre, N.; Warner, T.; Fernandez, R.; He, Y.; Merriam, E. Climate, forest growing season, and evapotranspiration changes in the central Appalachian Mountains, USA. Sci. Total Environ. 2019, 650, 1371–1381. [Google Scholar] [CrossRef]
- Prislan, P.; Gričar, J.; Čufar, K.; de Luis, M.; Merela, M.; Rossi, S. Growing season and radial growth predicted for Fagus sylvatica under climate change. Clim. Change 2019, 153, 181–197. [Google Scholar] [CrossRef]
- Cuevas, J. Tree recruitment at the Nothofagus pumilio alpine timberline in Tierra del Fuego, Chile. J. Ecol. 2000, 88, 840–855. [Google Scholar] [CrossRef]
- Bahamonde, H.A.; Peri, P.L.; Monelos, L.H.; Martínez Pastur, G. Aspectos ecológicos de la regeneración por semillas en bosques nativos de Nothofagus antarctica en Patagonia Sur, Argentina. Bosque 2011, 32, 20–29. [Google Scholar] [CrossRef]
- Piper, F.; Fajardo, A.; Cavieres, L. Simulated warming does not impair seedling survival and growth of Nothofagus pumilio in the southern Andes. Perspec. Plant Ecol. Evol. Syst. 2013, 15, 97–105. [Google Scholar] [CrossRef]
- Dey, D.; Knapp, B.; Battaglia, M.; Deal, R.; Hart, J.; O’Hara, K.; Schweitzer, C.; Schuler, T. Barriers to natural regeneration in temperate forests across the USA. New Forests 2019, 50, 11–40. [Google Scholar] [CrossRef]
- Chillo, V.; Ladio, A.; Salinas Sanhueza, J.; Soler, R.M.; Arpigiani, D.; Rezzano, C.; Cardozo, A.; Peri, P.L.; Amoroso, M. Silvopastoral systems in northern Argentine-Chilean Andean Patagonia: Ecosystem services provision in a complex territory. In Ecosystem services in Patagonia: A multi-criteria approach for an integrated assessment; Peri, P.L., Martínez Pastur, G., Nahuelhual, L., Eds.; Springer: Cham, Germany, 2021; pp 115-138. [Google Scholar]
- Betancourt, J.A.; Florez Yepes, G.; Hernández García, D. Innovation in agricultural systems facing climate change. J. Southwest Jiaotong Univ. 2022, 57, 257–267. [Google Scholar] [CrossRef]
Figure 1.
Forest environments studied in the Nothofagus antarctica forested landscapes: CF = closed primary forests, OF = open forests, EF = edge forests with openlands.
Figure 1.
Forest environments studied in the Nothofagus antarctica forested landscapes: CF = closed primary forests, OF = open forests, EF = edge forests with openlands.
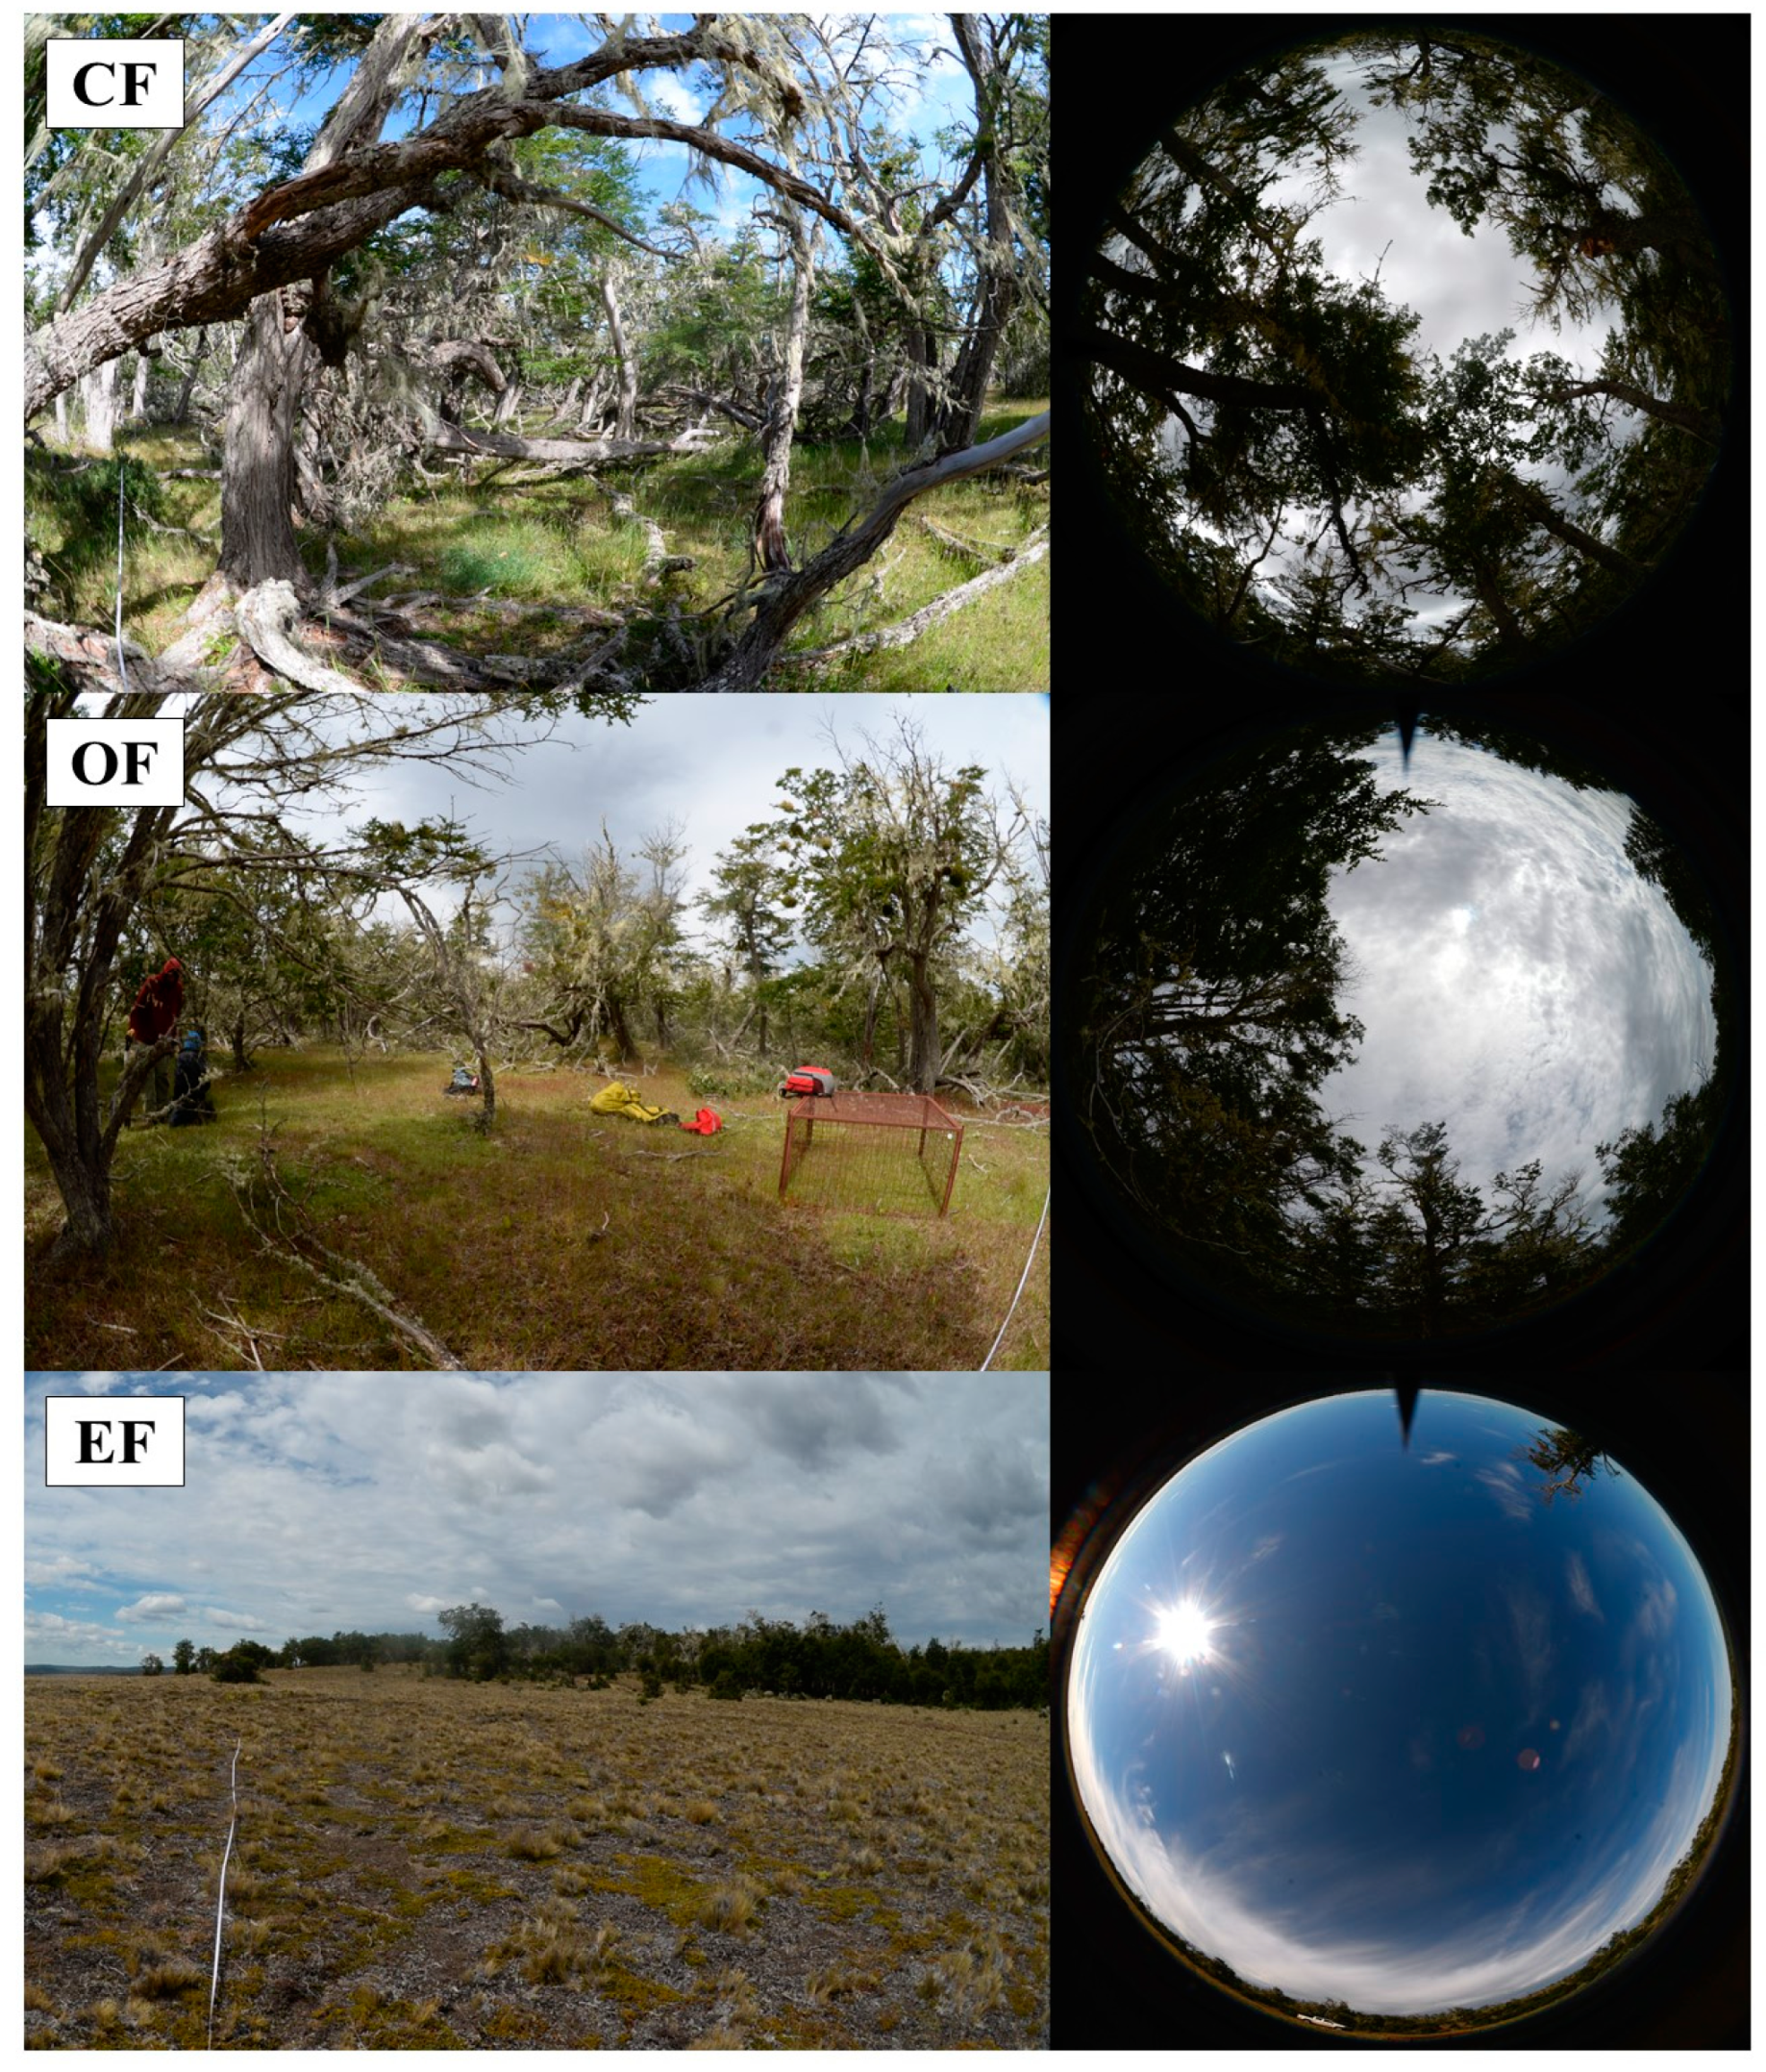
Figure 2.
Diameter growth during the growing season (mm) (S1 = 2018-2019 in dark colors, S2 = 2019-2020 in pale colors) for the different forest treatments (CF = closed primary forests in green, OF = open forests in blue, EF = edge forests with openlands in orange). Days starting at the beginning of October of each season.
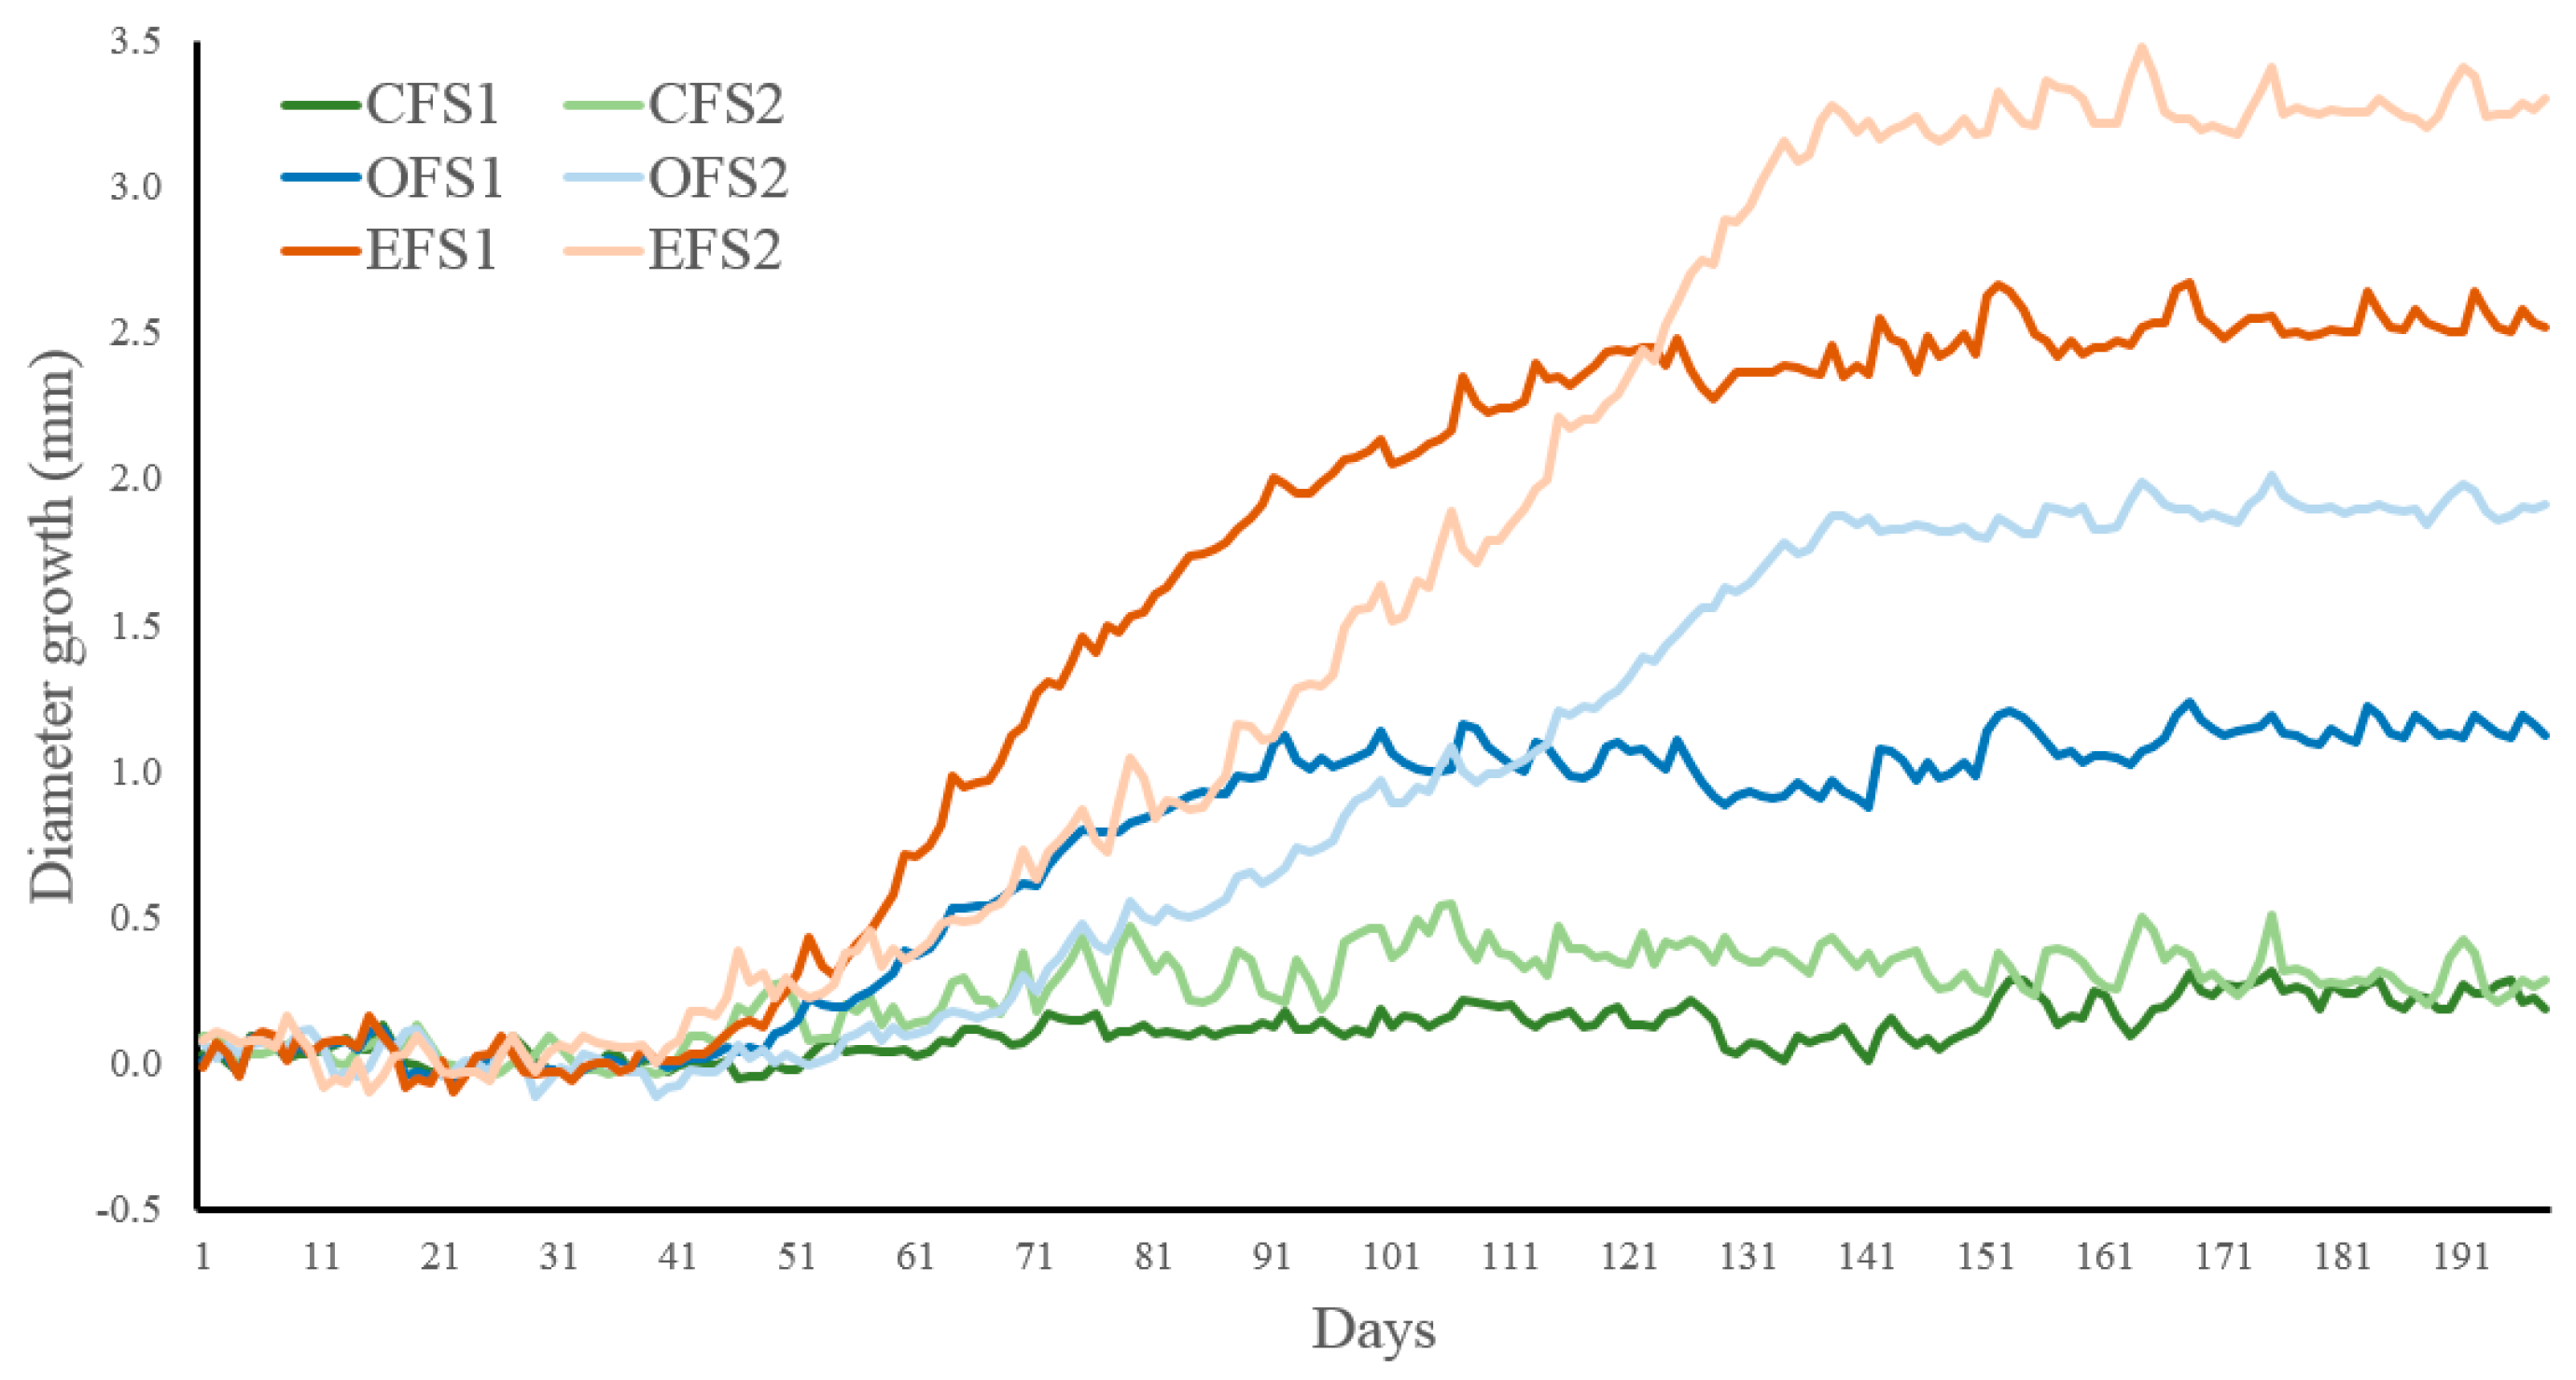
Figure 3.
Relationships of diameter growth increment across the season (pale, medium and dark colors represent from low to high values) among daily rainfall (mm), daily average air (°C) and soil temperature (°C) for the different forest treatments (CF = closed primary forests in green, OF = open forests in blue, EF = edge forests with openlands in orange). Bars represent the standard error of the axis values for each treatment.
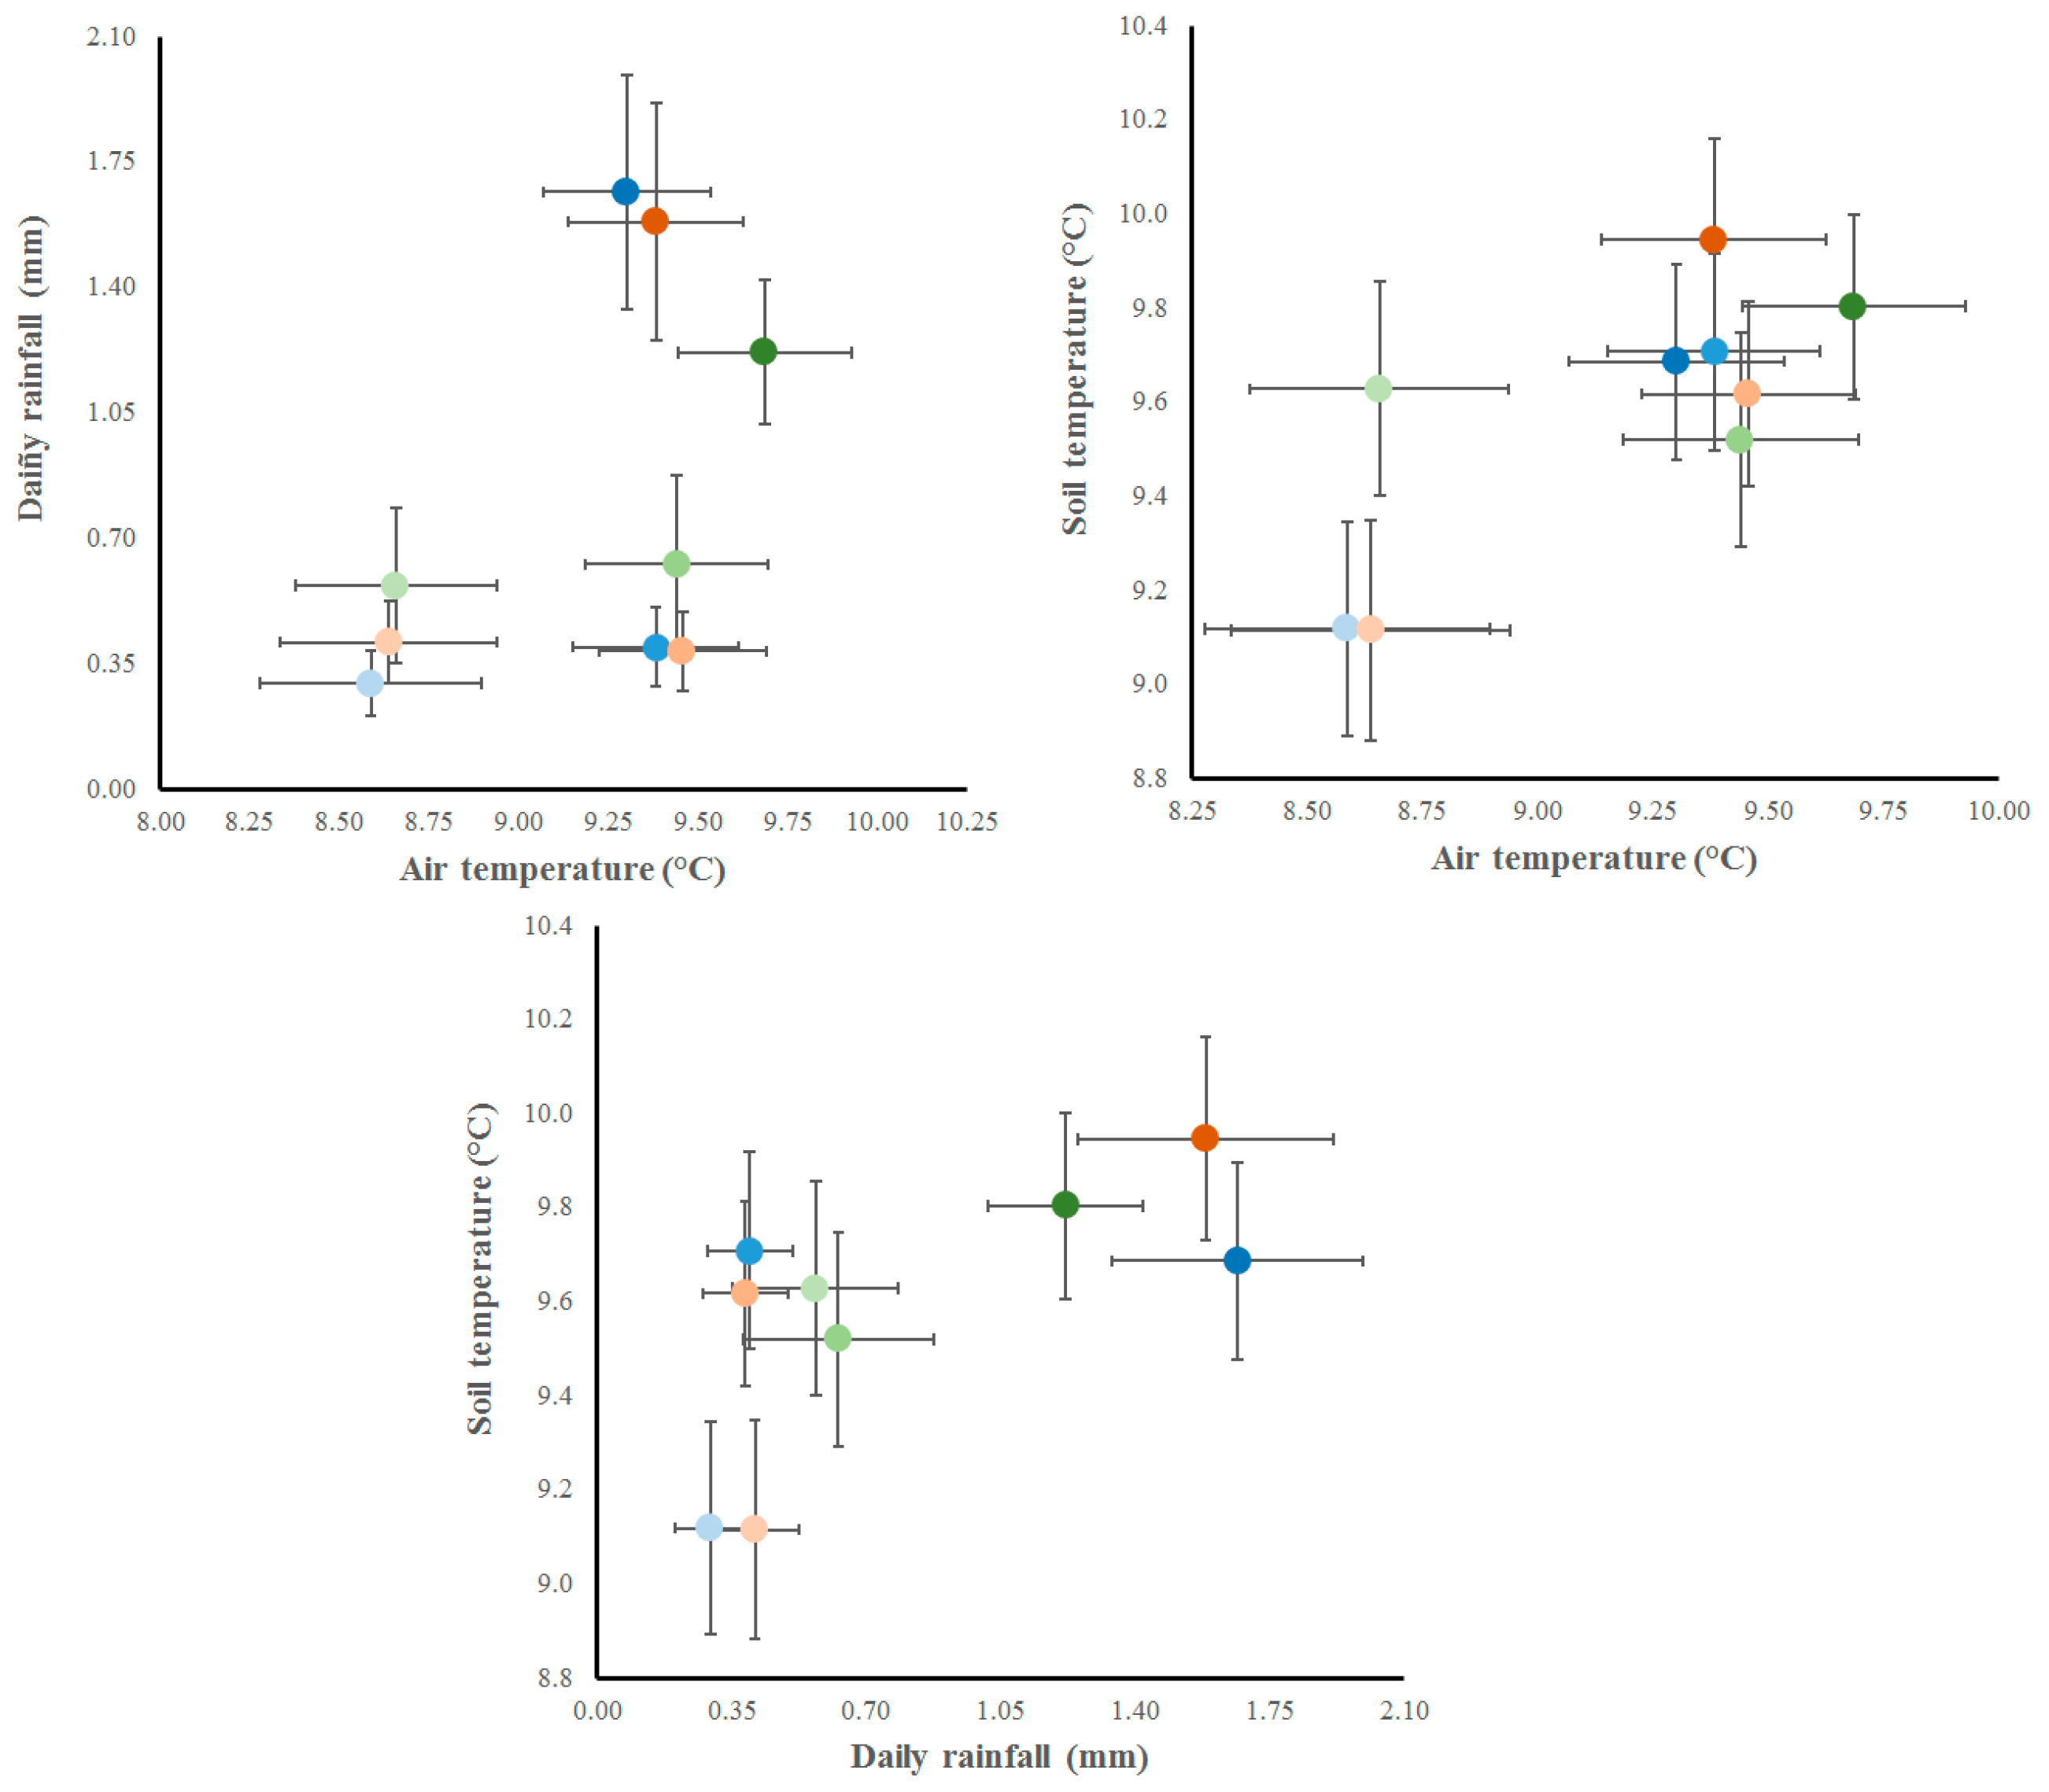
Table 1.
One-way ANOVAs of forest structure, environmental variables, soil properties, livestock density and understory biomass and cover considering forest treatments (CF = closed primary forests, OF = open forests, EF = edge forests with openlands) as main factors. BA = basal area (m² ha-1), TD = tree density (ind ha-1), TOBV = total over bark volume (m³ ha-1), OC = overstory cover (%), TR = transmitted radiation at understory level (%), SD = soil bulk density (gr cm³), SC = soil carbon content (kg m-2 30 cm depth), SN = soil nitrogen content (kg m-2 30 cm depth), SP = soil phosphorus content (kg m-2 30 cm depth), LD = livestock density (sheep equivalent ha-1), RIC = understory richness (n), UB = understory dry biomass (kg ha-1), UC = understory cover (%), DC = debris cover (%), and BS = bare soil (%).
| Treatment | BA | TD | TOBV | OC | TR |
|---|---|---|---|---|---|
| CF | 34.5c | 1789b | 172.4c | 73.1c | 37.2a |
| OF | 22.5b | 599ab | 117.3b | 53.7b | 61.9b |
| EF | <0.1a | <1a | <0.1a | 7.1a | 91.3c |
| F(p) | 42.15(<0.001) | 4.31(0.048) | 44.03(<0.001) | 63.42(<0.001) | 21.41(0.001) |
| SD | SC | SN | SP | LD | |
| CF | 0.712a | 14.96 | 0.684 | 0.422a | 1.06a |
| OF | 0.976b | 14.31 | 0.738 | 0.549b | 4.36b |
| EF | 0.802a | 13.94 | 0.691 | 0.419a | 1.02a |
| F(p) | 17.48(0.001) | 0.51(0.615) | 0.47(0.641) | 6.46(0.018) | 4.89(0.036) |
| RIC | UB | UC | DC | BS | |
| CF | 37.75b | 497.3a | 166.5b | 6.50b | 6.0 |
| OF | 36.75b | 714.1a | 149.0ab | 0.50a | 7.5 |
| EF | 28.25s | 3932.8b | 116.4a | 0.25a | 21.5 |
| F(p) | 6.53(0.018) | 5.77(0.024) | 6.60(0.017) | 7.61(0.012) | 4.46(0.045) |
F = Fisher test, (p) = probability. Different letters indicate significant differences using a Tukey test at p <0.05.
Table 2.
Multifactorial ANOVA of soil water content (SWC, %) and diameter growth increment (GI, mm day-1) considering forest treatments (CF = closed primary forests, OF = open forests, EF = edge forests with openlands), growth phases during the season (Early = before 15 November, Medium = 15 November to 15 February, Late = after 15 February) and seasons (1 = 2018-2019, 2 = 2019-2020) as main factors.
| Treatment | Level | SWC | GI |
|---|---|---|---|
| A: Treatment | CF | 26.7b | 0.0024 |
| OP | 22.4a | 0.0064 | |
| EP | 36.9c | 0.0134 | |
| F(p) | 2296.47(<0.001) | 2.97(0.052) | |
| B: Phase | Early | 30.5c | 0.0048a |
| Medium | 28.5b | 0.0176b | |
| Late | 27.1a | -0.0001a | |
| F(p) | 105.5(<0.001) | 11.89(<0.001) | |
| C: Season | 1 | 25.6a | 0.0052 |
| 2 | 31.8b | 0.0097 | |
| F(p) | 1190.99(<0.001) | 1.48(0.224) | |
| Interactions | A x B | 22.44(<0.001) | 2.97(0.019) |
| A x C | 282.05(<0.001) | 0.03(0.968) | |
| B x C | 44.29(<0.001) | 0.60(0.548) |
F = Fisher test, (p) = probability. Different letters indicate significant differences using a Tukey test at p <0.05.
Table 3.
Multifactorial ANOVA of diameter growth increment (mm day-1) for different forest treatments (CF = closed primary forests, OF = open forests, EF = edge forests with openlands) considering growth phases during the season (Early = before 15 November, Medium = 15 November to 15 February, Late = after 15 February), daily rainfall (mm) and seasons (1 = 2018-2019, 2 = 2019-2020) as main factors.
| Treatment | Level | CF | OF | EF |
|---|---|---|---|---|
| A: Phase | Early | 0.0154 | 0.0124ab | 0.0133ab |
| Medium | 0.0058 | 0.0225b | 0.0406ab | |
| Late | 0.0087 | 0.0087a | 0.0091a | |
| F(p) | 0.33(0.719) | 3.01(0.049) | 6.89(0.001) | |
| B: Rainfall | 0.0 | -0.0082a | -0.0051a | 0.0024a |
| 0.0-0.2 | -0.0008ab | 0.0059a | 0.0113a | |
| 0.2-1.0 | 0.0195ab | 0.0161ab | 0.0245ab | |
| >1.0 | 0.0293b | 0.0412b | 0.0459b | |
| F(p) | 6.93(<0.001) | 21.03(<0.001) | 7.53(<0.001) | |
| C: Season | 1 | 0.0065 | 0.0132 | 0.0171 |
| 2 | 0.0134 | 0.0158 | 0.0249 | |
| F(p) | 0.61(0.435) | 0.23(0.633) | 0.76(0.385) | |
| Interactions | A x B | 1.82(0.095) | 1.25(0.279) | 0.78(0.586) |
| A x C | 0.06(0.944) | 0.53(0.589) | <0.01(0.997) | |
| B x C | 0.61(0.612) | 3.46(0.017) | 1.02(0.385) |
F = Fisher test, (p) = probability. Different letters indicate significant differences using a Tukey test at p <0.05.
Table 4.
Multifactorial ANOVA of diameter growth increment (mm day-1) for different forest treatments (CF = closed primary forests, OF = open forests, EF = edge forests with openlands) considering growth phases during the season (Early = before 15 November, Medium = 15 November to 15 February, Late = after 15 February), daily average air temperature (°C) and seasons (1 = 2018-2019, 2 = 2019-2020) as main factors.
| Treatment | Level | CF | OF | EF |
|---|---|---|---|---|
| A: Phase | Early | 0.0028 | -0.0011a | 0.0001ab |
| Medium | -0.0011 | 0.0159b | 0.0271b | |
| Late | -0.0013 | 0.0002ab | -0.0003a | |
| F(p) | 0.07(0.934) | 4.64(0.010) | 6.47(0.002) | |
| B: Air temperature | <8.0 | -0.0039 | 0.0044 | 0.0091 |
| 8.0-10.0 | 0.0015 | 0.0086 | 0.0104 | |
| >10.0 | 0.0028 | 0.0021 | 0.0072 | |
| F(p) | 0.24(0.787) | 0.34(0.709) | 0.03(0.966) | |
| C: Season | 1 | -0.0005 | 0.0035 | 0.0058 |
| 2 | 0.0007 | 0.0066 | 0.0121 | |
| F(p) | 0.02(0.888) | 0.37(0.543) | 0.67(0.413) | |
| Interactions | A x B | 0.66(0.618) | 0.35(0.846) | 0.86(0.490) |
| A x C | 0.53(0.590) | 0.34(0.713) | 0.72(0.488) | |
| B x C | 0.41(0.662) | 0.13(0.874) | 0.52(0.594) |
F = Fisher test, (p) = probability. Different letters indicate significant differences using a Tukey test at p <0.05.
Table 5.
Multifactorial ANOVA of diameter growth increment (mm day-1) for different forest treatments (CF = closed primary forests, OF = open forests, EF = edge forests with openlands) considering growth phases during the season (Early = before 15 November, Medium = 15 November to 15 February, Late = after 15 February), daily average soil temperature (°C) and seasons (1 = 2018-2019, 2 = 2019-2020) as main factors.
| Treatment | Level | CF | OF | EF |
|---|---|---|---|---|
| A: Phase | Early | -0.0007 | 0.0029 | 0.0074 |
| Medium | 0.0109 | 0.0012 | -0.0158 | |
| Late | -0.0043 | -0.0019 | -0.0039 | |
| F(p) | 0.21(0.809) | 0.12(0.180) | 0.64(0.527) | |
| B: Soil Temperature | <8.0 | 0.0062 | -0.0073 | -0.0234a |
| >8.0 | -0.0022 | 0.0088 | 0.0152b | |
| F(p) | 0.24(0.626) | 1.8(0.180) | 4.87(0.028) | |
| C: Season | 1 | 0.0011 | 0.0001 | -0.0056 |
| 2 | 0.0028 | 0.0013 | -0.0026 | |
| F(p) | 0.02(0.894) | 0.04(0.849) | 0.10(0.748) | |
| Interactions | A x B | 0.49(0.615) | 0.28(0.754) | 1.58(0.207) |
| A x C | 0.96(0.328) | 0.16(0.689) | 0.06(0.799) | |
| B x C | 0.85(0.428) | 0.16(0.852) | 0.11(0.899) |
F = Fisher test, (p) = probability. Different letters indicate significant differences using a Tukey test at p <0.05.
Disclaimer/Publisher’s Note: The statements, opinions and data contained in all publications are solely those of the individual author(s) and contributor(s) and not of MDPI and/or the editor(s). MDPI and/or the editor(s) disclaim responsibility for any injury to people or property resulting from any ideas, methods, instructions or products referred to in the content. |
© 2023 by the authors. Licensee MDPI, Basel, Switzerland. This article is an open access article distributed under the terms and conditions of the Creative Commons Attribution (CC BY) license (https://creativecommons.org/licenses/by/4.0/).
Copyright: This open access article is published under a Creative Commons CC BY 4.0 license, which permit the free download, distribution, and reuse, provided that the author and preprint are cited in any reuse.


