
Submitted:
10 June 2025
Posted:
11 June 2025
You are already at the latest version
Abstract
The selectivity of the colorimetric method for Co(II) determination using the nitroso-R-salt (NRS) in samples with complex matrix had been improved. Interferences caused by Cu(II), Fe(II), Fe(III), Mn(II), Al(III) and Ni(II) ions, which were present in the bioleachate of lithium-ion batteries, have been solved through the sequential addition of masking agents: acetate, fluoride, ethylenediaminetetraacetic acid (EDTA), and strong acids (H2SO4). The absorbance of the NRS-Co(II) complex was typically measured at 525 nm but it was also studied at 550 nm due to minimal interferences observed at 550 nm. The sequence of the masking agent’s addition showed a significant influence on the interferences effect. The optimal sequence was sample, acetate-acetic acid buffer solution with dissolved fluoride, NRS, EDTA and H2SO4. The proposed method demonstrated robust performance at 550 nm, with a relative standard deviation (RSD) around 2%, accuracy (RV% around 100%). The limit of detection (LoD) was 0.1 mg L-1 and the limit of quantification (LoQ) was 0.3 mg L-1. The linear range extended up to 15 mg L-1 (R2= 0.998). Real samples analyzed using the optimized method showed no significant differences when compared to results from atomic absorption spectroscopy, confirming its reliability.
Keywords:
Co(II)
; cobalt
; nitroso-R-sal
; combinatory analysis
; batteries
; bioleachate
; leachate
; UV-vis spectrophotometry
1. Introduction
The increasing demand for lithium-ion batteries (LIBs), which are widely used in electronic devices, renewable energy and electrical vehicles, have driven the necessary recovery of valuable materials contained in batteries such as cobalt [1]. The demand for LIBs is expected to increase, with raw materials serving as the primary source of supply [2]. Due to their numerous advantages, including a low self-discharge rate, a long cycle life, a high energy density, and a lightweight design, LIBs are the optimal choice for a diverse range of applications, including electronic gadgets and electric mobility. Concurrently, the growing prevalence of LIBs has led to mounting pressure on geological deposits containing metals such as manganese, nickel, cobalt, lithium, and other metals. Consequently, in order to alleviate the pressure on geological reserves, it is of paramount importance to recover materials from discarded LIBs [3].
There are two major methods to recycle LIBs, pyrometallurgy and hydrometallurgy. Pyrometallurgy is a process whereby metals are extracted from other components by burning off electrolytes, binders, and polymers at high temperatures. Hydrometallurgy is a process that extracts metals from batteries by leaching them with acids and reducing agents [4]. Dai et al. [5] propose a novel method process for recovering the metals in cathode materials from spent LIBs using a mixed iron salts composed of Fe2(SO4)3 (precipitant) and FeSO4 (reducing agent).
Recent hydrometallurgical methods for recovering metals from electronic waste and LIBs involve the activity of some microorganisms [6,7,8,9,10]. This process is called bioleaching and is being intensively researched as a promising and environmentally friendly method for recovering cobalt and other metals from obsolete LIBs [11]. In the bioleaching of LIBs, microorganisms or their metabolites are used to convert metal elements in the cathode into to soluble ions in solution (leachate). The leachate contains a mixture of various metal ions, such as Li(I), Co(II), Ni(II), Mn(II) and Fe(III). To ensure the proper functioning of the bioleaching process, it is necessary to monitor the concentration variation of the metallic cations throughout the process. This can be done automatically and in situ using a miniaturized flow injection analysis [12,13].
There are several instrumental analytical methods to determine Co(II) in solution such as: atomic absorption spectrophotometry [14,15], fluorescence [16], thermal lens microscopy [17], potentiometry [18,19], chemiluminescence [20] and colorimetry [21,22,23,24,25,26]. FIA systems can be use UV-Vis absorption as detection method among other techniques [27,28]. The colorimetry strategies, which are easy to adapt to an FIA system [12,13], involve reaction of the metal ion to be determined with a chelating agent that forms a colored complex, the intensity of which is directly proportional to the metal concentration. The most used chelating agent for the cobalt colorimetric determination is the nitroso-R salt (NRS), which forms a red-orange complex [29]. The problem with this chelating agent is that it exhibits interferences with Fe(II), Fe(III), Cu(II), Ni(II) and many other metallic cations which are precisely found in bioleachates from batteries [24,30,31,32,33,34]. The low selectivity of NRS for Co(II) had led to the development of new chelating agents specific for Co(II) [35,36,37,38,39,40]. These new chelating agents resolves the selectivity problem but they are not commercially available, they need to be synthesized in the laboratory. This is quite expensive and requires stringent measures to ensure the purity of the final product. Thus, despite its limitations, this chelating agent is still the most widely used for Co(II) colorimetric determination.
Various studies have shown that method selectivity can be improved by adding masking agents that eliminate or significantly reduce interference from other metal ions. According to Shipmen et al. [41], fluoride and acetate could complex with Fe(III), Cu(II) and Fe(II) and avoid their interferences, moreover, fluoride ions precipitate the nickel and remove its interference. Other authors investigated the ethylenediaminetetraacetic acid (EDTA) behavior. EDTA is a unspecific chelating agent, that could compete with NRS and form stable complexes with Fe(III) and Fe(II) masking them [42,43,44]. According to some studies, the addition of a strong acid such as HNO3 or HCl plus boiling the sample can break down the complexes formed between NRS and metallic ions (Ni(II), Fe(III), Cu(II), Zn(II)) and except for NRS-Co(II), eliminating their interferences [34,41].
Moreover, some studies demonstrated that the sequence of chelating compound addition could affect the result. For instance, NRS was unable to dissociate the Co(II)-EDTA complex and vice-versa. So, it is not advisable to add EDTA before the reagent NRS [34,41,44]. In the same sense, some authors stablished that when acetate and fluoride were used as masking agents, they should be added before NRS [34,41,44].
All these studies avoid the interference of some metallic cations, but there is no described method dealing with the elimination of all the interferences that can be found in a battery bioleach ((Cu(II), Fe(II), Fe(III), Mn(II), Al(III) and Ni(III)), nor with the order of addition of all these masking agents when there are used together.
In this work, for the first time, all those masking agents (EDTA, fluoride, acetate, acetic acid and strong acid) have been used together in order to avoid interferences caused by cations (Cu(II), Mn(II), Fe(II), Fe(III), Al(III) and Ni(II)), usually present in a bioleachate from LIBs, and to enhance the selectivity of NRS for Co(II). Furthermore, a detailed study on the influence of the order of addition of each one on the colorimetric determination of cobalt with NRS has been carried out Additionally, hydroxylamine was investigated as a means of avoiding interferences, reducing the oxidation state of cationic metals, and decreasing the variety of cations, such as the reduction of Fe(III) to Fe(II). Also to test if Cu(I) interferes as Cu(II), since no study has been found to study the effect of Cu(I).
2. Chemicals and Methods
2.1. Chemicals, Reagents and Equipment
The Co(II) was used as CoSO4·7H2O (99%) from Panreac (Castellar del Vallès, Spain), Al(III) as Al2(SO4)3·18H2O (Al2(SO4)3 51-59%) from Scharlau (Barcelona, Spain), Cu(II) as CuSO4·5H2O (99%) from Labkem (Barcelona, Spain), Fe(II) as FeSO4·7H2O (99%) from Chem-lab (Zedelgem, Belgium), Fe(III) as FeNH4(SO4)2·12H2O (99%) from Scharlau (Polinya, Spain), Ni(II) as NiSO4·6H2O (≥99%) and Mn(II) as MnSO4·H2O (≥99%) from Panreac (Castellar del Vallés, Barcelona).
1,10-phenanthroline monohydrate from Labkem (Barcelona, Spain) was used to prepare a 0.1% w/v solution.
Hydroxylamine hydrochloride (98%) from Panreac (Castellar del Vallès, Spain) was used to prepare a 10% w/v aqueous solution.
The EDTA solution of 0.05 mol L-1 and 0.1 mol L-1 were obtained from Scharlab (Sentmenat, Spain).
A 33.3 g L-1 solution of potassium fluoride (KF) (≥ 99%) from Fisher Scientific (Geel, Belgium) was prepared to study its masking effects. This concentration was selected to ensure that, upon adding 4 mL to a final volume of 10 mL in the sample preparation, the resulting KF concentration would be 13.2 g L-1, matching the conditions described in the study of Shipmen [41].
A 3 g L-1 solution of acetate was prepared using sodium acetate trihydrate (99+%) from T3Q (Sentmenat, Spain). Also, buffer acetate-acetic acid was prepared dissolving 0.022 mol L-1 of sodium acetate trihydrate and 0.007 mol L-1 of acetic acid (99.8%) from Panreac (Castellar del Vallès, Barcelona).
H2SO4 (95-98%) was from Panreac (Castellar del Vallès, Spain) and utilized to prepare an aqueous solution with at pH= 1.8. This solution was used to prepare the metal interference solutions and to dilute the samples. In addition, H2SO4 solutions ranging from 5% v/v to 25% v/v were prepared for the interference study. Also, HCl 37% from Panreac (Castellar del Vallès, Spain) was used.
Three stock solutions of NRS from Fluka AG (Buchs, Switzerland) were prepared: one at a concentration of 1.68 × 10⁻⁴ mol L-1, following the same concentration used by Issa et al. [24]; another at a concentration of 4.0 g L-1 (1.06 × 10⁻² mol L-1); and a third containing 4.0 g L-1 of NRS and 3.0 g L-1 of acetate. NRS was stored in opaque containers and dark environments.
All solutions were prepared with deionized water from Milli-Q system (Millipore, Billerica, MA, USA).
Absorbance was measured at 525 nm in the initial experiments, despite the NRS-Co(II) complex having a maximum absorption at 415 nm. This is because the NRS reagent does not absorb at 525 nm [41]. From Section 3.5 onward, measurements were conducted at 550 nm and 710nm which was measured to assess Fe(II) interference. All measurements were carried out using a UV-Vis spectrophotometer (PerkinElmer Lambda 25)
2.2. Interference Study
Interferences in the colorimetric determination of Co(II) caused by the presence of various metal ions were addressed by adding masking agents (H2SO4 or HCl, KF, EDTA, and acetate), hydroxylamine. A series of experiments were conducted to study the effect of reagent addition order, aiming to determine the optimal sequence for the selective detection of Co(II). However, as the procedure involves six reagents in total, including NRS, testing all 720 (6!) possible combinations for each metal was not feasible. Additionally, the influence of reagent concentrations on the method’s selectivity was also examined, further increasing the complexity of the study. For this reason, a stepwise approach was adopted, meaning that experimental conditions were adjusted based on the results of previous experiments, focusing solely on the most promising configurations. Consequently, the experimental procedures and results are presented in chronological order.
2.2.1. Experimentation of Each Reagent Separately
The individual effects of the masking agents acetate, EDTA, and fluoride were evaluated in minimizing the interferences from Fe(II), Fe(III), and Cu(II), as these metals generate the most significant and challenging interferences [41]. To this end, tests were conducted using solutions containing of Fe(II), Fe(III) and Cu(II), with the addition of 2 mL of NRS. The volumes used for each masking agent were 2 mL of EDTA, 4 mL of fluoride, and 7 mL of acetate. These amounts were selected to ensure an excess of EDTA, maintain the same fluoride concentration as in Shipman’s method [41], and assess whether an excess of acetate could substitute for the boiling step employed in Shipman’s approach to mask interferences [41]. The effect of each masking agent was examined by comparing the outcomes when added before and after NRS, as well as in its absence. All test solutions were brought to a final volume of 10 mL with distilled water.
The effect of hydroxylamine was analyzed by adding 1 mL before and after the addition of 2 mL of NRS, with the volume adjusted again to 10 mL with distilled water. These tests were carried out with Fe(III) and Cu(II), as they are the only studied cations that can be reduced under these conditions.
The use of concentrated strong acids (37% v/v HCl and 25% v/v H2SO4) was evaluated as a potential strategy to reduce or eliminate interferences in the colorimetric determination of Co(II). Experiments were conducted using solutions containing the main metals typically found in lithium-ion battery bioleachates: 10 mg·L−1 Co(II), 30 mg·L−1 Al(III), 20 mg·L−1 Fe(II), 20 mg·L−1 Fe(III), 50 mg·L−1 Cu(II), 70 mg·L−1 Ni(II), and 10 mg·L−1 Mn(II), [45,46,47]. To each solution, 2 mL of NRS were added, and tests were carried out with the addition of either 2 mL or 4 mL of concentrated acid, adjusting the final volume to 10 mL with deionized water. The effect of acid addition was assessed by varying the order of addition—before and after NRS. This experiment, performed with all metals present simultaneously, aimed to evaluate whether concentrated acids could serve as effective masking agents to mitigate interference in the quantification of Co(II).
2.2.2. Combinatorial Experimentation
In the following section, the combined effect of the reagents: KF, acetate, NRS, hydroxylamine and EDTA was investigated, based on the findings presented in Section 3.1. From this point onward, the NRS stock solution was prepared with 4 g·L−1 of NRS and 3 g·L−1 of acetate, as justified in Section 3.1.4. Additionally, 33.3 g L-1 KF was dissolved in an acetate-acetic acid buffer solution, which maintained pH near optimal, justified in section 3.1.7.
As a result, four distinct reagent solutions were defined, reducing the complexity of the subsequent combinatorial experiments from 720 (6!) possible combinations to 24 (4!). These experiments aimed to assess the influence of the order of addition of reagents on the interferences caused by Cu(II) and Fe(III).
2.2.2.1. Study of Cu(II) Interferences
a) Combinatorial experimental
Cu(II) was selected as a starting point because according to Shipmen et al. [41] it is one of the main sources of interference in the determination of Co(II). Additionally, Cu(II) is very abundant in lithium-ion batteries utilized in electric mobility such as cars or scooters [45,46,47] and therefore, in the bioleachate of the present work. 40 mg L-1 of Cu(II) and 1.6 mg L-1 of Co(II) solutions were used to maintain the same concentration rate of described in the work of Shipmen et al. [41].
Using Minitat 19 software (Minitab Inc) the 24 possible combinations sequences were obtained and shown in Table S1. However, taking into account the inability of NRS to displace the Co(II) from the EDTA-metal complex explained by Adam and Přibil [44], combinations which EDTA precedes NRS were not tested. The combinations evaluated are shown in Table 1.
The volumes of each reagent solution were: 1 mL of hydroxylamine, 2 mL of NRS, 4 mL of KF in acetate-acetic acid buffer, and 2 mL of 0.05 mol L-1 EDTA. In all cases, 1 mL of sample was always added first. The total volume was 10 mL. These volumes were chose to ensure EDTA and NRS were in excess, hydroxylamine was chosen according to the method used in the laboratory [48] and KF in acetate-acetic acid buffer was explained in section 2.1 and section 3.1.7.
Each combination was tested with and without Cu(II), and each test was replicated three times. The blank of each sequence tested consisted of adding all the reagents in the same order but without any cationic metal, the sample was 1 mL of Milli-Q water. Finally, the absorbance value obtained with and without Cu(II) for a same sequence was subtracted, and the relative error was calculated. The smaller the relative error, the less Cu(II) interfered with the measurement.
b) Optimization of reagent concentrations using Taguchi experimental design
The influence of reagent concentrations on the suppression of interferences was evaluated using a Taguchi experimental design, implemented with Minitab 19 software. For this purpose, one of the most promising reagent addition sequences identified for minimizing Cu(II) interference—Sequence 8, as described in Section 3.2.1—was selected as the basis for the study.
Four concentration levels (0, low, medium, and high) were tested for all reagents except for NRS, which was evaluated at two levels (low and medium). The reagent concentrations corresponding to each level are detailed in Table S2. The combinations of concentration levels used experimental assays are detailed in Table S3.
2.2.2.2. Study of Fe (III) Interferences
Another metallic ion abundant in the bioleachate obtained from batteries is the Fe(III). This ion is obtained by oxidation of Fe(II) carried out by the microorganisms.
Based on results obtained in the Cu(II) interference study (section 3.2.1), twelve different reagent addition sequences were explored for Fe(III), using the same volumes and reagent concentration of reagents as in the copper combinatorial study. The tested sequences are summarized in Table 2. For each trial, absorbances values were recorded both with and without Fe(III). The difference between these values was used to calculate the relative error, with lower relative errors indicating reduced interference from Fe(III) in the Co(II) determination.
2.2.3. Absorbance Spectrum Scanning
To further minimize interferences in the colorimetric determination of Co(II), absorption spectra were recorded between 470 and 800 nm for the NRS complexes of Fe(II), Fe(III), Al(III), Ni(II), Cu(II), and Mn(II). The aim was to identify wavelengths at which these interfering metal complexes exhibited minimal absorbance, while the Co(II)–NRS complex maintained a strong and distinct signal.
2.2.4. Study of Fe(II) Interferences
The interference caused by Fe(II) is due to its formation of a complex with NRS, which has a significant absorption across the entire visible zone spectrum, particularly at 710 and 520 nm, where absorption process take place and several peaks are observed [49]. In addition, the signal generated by the Fe(II)-NRS complex is the most difficult to mask [41].
The volumes added were adjusted based on the results obtained in above experimental sections described. For NRS it was 1 mL and hydroxylamine was removed. Additionally, at this point the volume of EDTA added was changed from 2 mL of 0.05 mol L-1 to 1 mL of 0.1 mol L-1 plus 1 mL to free up volume for the addition of other chemicals.
In the case of KF in acetate-acetic acid buffer, the effect of varying its volume added on Fe(II) was investigated. As a first approximation 20 mg of Fe(II) was used and the tested volumes ranged from 4 to 7 mL. No cobalt was added.
2.2.5. Interferences Study with Combined Metals Ions Present in Batteries Bioleachates
Employing the optimal reagent addition sequence and concentrations established in the individual interference tests, a comprehensive interference assessment was conducted with all relevant metal ions separately. For each metal, three concentration levels—low, medium, and high—were evaluated. The specific concentrations used are detailed in Table 3. The medium level was equal to the value in a battery bioleachate in our lab from mobile phones [45,46,47]. The low concentration was set 10 mg L-1 lower (except for Mn, which was 5 mg L-1 lower), while the high concentration was 10 mg L-1 higher. The concentrations of Fe(II) and Fe(III) were selected based on the concentration of the medium (9000 mg L-1) feeding the microorganisms in the bioreactor, which when the sample is prepared for measurement is diluted 450 times, thus becoming 20 mg L-1 total iron. Each test was performed in triplicate.
2.3. Validation of Method
The analytical method was validated through the determination of repeatability, linearity, accuracy, detection and quantification limits. The study of repeatability was conducted by analyzing two different samples, which contain only Co(II) (2.5 and 10 mg L-1), six times each, then the variation coefficient was calculated and compared with those proposed by Horwith [50]. The determination of the linear range was done measuring calibration solutions ranging from 1 to 20 mg L-1. Regarding limit of detection (LoD) and limit of quantification (LoQ), they were determined by measuring the signal of five blanks and calculated through signal-to-noise approach using the formula (X + 3Sb)/S and (X + 10Sb)/S respectively, where X represents the mean of the blank measured, Sb is the standard deviation of the blank mean, and S is the slope of the calibration curve [51].
Furthermore, to complete the validation study, cobalt was determined in real samples and the results were compared with those obtained by atomic absorption spectroscopy (PerkinElmer, PinAAcle 500). The analyzed real samples were: bioreactor medium, water from the Agulla reservoir in Manresa (Spain), bioleachates from smartphone PCBs and bioleachates from batteries of bikes and scooters.
The bioreactor medium, bioleachates from smartphone PCBs and water from the Agulla reservoir samples were spiked with 3, 4 and 7 mg L-1; 2, 3.5 and 6 mg L-1 of Co(II); 1.5, 8 and 9 mg L-1, respectively, as they did not contain Co(II) themselves.
Accuracy was determined by adding a 5.5 mg L-1 Co(II) standard to the sample and calculating the recovery percentage (RV%) in bioleachate from bicycle and scooter batteries. To evaluated three different concentrations, the leachate was diluted 270, 360 and 450 times, resulting in three different samples.
3. Results and Discussion
3.1. Examination of Individual Reagents
A series of experiments were conducted to analyze and evaluate the individual contribution of the six reagents which were NRS, KF, acetate, hydroxylamine, strong acid (H2SO4 or HCl), and EDTA in the development of the Co(II) determination method. The primary objective of these tests was to analyze the effect of each isolate reagent to better understand its specific influence on the method. The results are presented below.
3.1.1. Nitroso-R-Salt (NRS)
The initial experiments focused on examining the coordination of NRS with Co(II) as well as its interaction with other interfering metals ions. NRS was tested in the presence of various metal cations under different pH conditions and in the presence of different metals ions to study its capability to complex formation and assess its suitability for Co(II). Furthermore, the potential of using excess NRS to minimize Fe(II) interference, as commented in [41], was investigated.
Results revealed that NRS reacts poorly and slowly in highly acidic media (pH 1-2). However, increasing the pH significantly accelerated the coordination reaction. Under these conditions, NRS formed colored distinctly colored complexes with several metals cations commonly present in the battery bioleachate: Ni(II)-NRS yielded an orange complex, Fe(II)-NRS was green, Co(II)-NRS was red-orange and Cu(II)-NRS produced a brown complex, as illustrated in Figure S1.
Fe(III) exhibited a unique, pH-dependent behavior in its interaction with NRS. In acidic media, the Fe(III)–NRS complex formed rapidly, producing a brown coloration. In contrast, under neutral conditions, the complex showed a green hue similar to that of the Fe(II)–NRS complex. To confirm that this shift was not caused by redox reactions—as previously speculated by Shipman et al. [41] —control experiments were conducted. A solution containing only Fe(III) was treated with 1,10-phenanthroline and an excess of acetate. No formation of the Fe(II)–phenanthroline complex was observed, confirming that no reduction of Fe(III) to Fe(II) had occurred.
Regarding NRS concentration, initial test using 1.68 × 10⁻⁴ mol L-1 previously reported by Issa et al. [24] was found to be inadequate, as Co(II) concentrations in the bioleachate could reach up to 5.72 × 10⁻⁴ mol L-1. Considering the 1:3 metal-to-ligand molar ratio required for stable complex formation [52], a higher NRS concentration (4g L-1) was necessary to ensure complete coordination. Furthermore, increasing the NRS concentration did not mitigate Fe(II) interference, in contrast to the observations reported by Shipman et al. [41], suggesting that excess ligand alone is insufficient to overcome Fe(II)-related spectral overlap under the studied conditions. This highlights the necessity of incorporating specific masking agents—rather than relying solely on stoichiometric excess—to suppress interference from Fe(II) and other competing metal ions in complex matrices such as battery bioleachates.
An additional observation was the gradual degradation of NRS over time, which resulted in the formation of a soft, agglomerated precipitate at the bottom of the storage container. This degradation compromised the reliability and reproducibility of the analyses. However, the stability of NRS significantly improved when the solution was stored in opaque containers or kept in a dark environment. Moreover, the presence of acetate in the solution also contributed to slowing down the degradation process.
3.1.2. Strong Acids
Tests conducted with HCl and H2SO4 revealed no significant differences in the results, indicating that the determining factor was the pH value, rather than the specific acid used. As such, the discussion focuses on the role of pH in the complexation and stability of the Co(II)–NRS complex. As mentioned earlier, the complexation reaction progresses very slowly under strongly acidic conditions. However, near the optimal pH (≈5.5) [53], the coordination reaction occurs rapidly and efficiently. Nevertheless, if the pH is drastically reduced after the complexes are formed (using 37% HCl or 25% H2SO4; adding 4 mL or more) the Co(II)-NRS complex remains stable, while other complexes decompose, achieving high selectivity in Co(II) determination.
The stability of each metal–NRS complex under acidic conditions varied. In the case of Fe(II), complex degradation was slower and required a larger quantity of acid compared to other metals—a behavior that will be discussed in more detail in Section 3.6. For Cu(II), ligand dissociation occurred more rapidly but still required a considerable amount of acid. Additionally, the amount of acid necessary to achieve full complex dissociation increased proportionally with the concentration of metal cations.
Although the use of concentrated acids significantly improves Co(II) selectivity by selectively destabilizing competing metal complexes, this approach presents practical limitations. In some cases, the volume and concentration of acid required exceeds what can be safely or feasibly added to the reaction mixture. Moreover, the method requires prolonged waiting times for complete dissociation. Due to these drawbacks, this strategy was excluded from the combinatorial optimization experiments, reducing the number of reagent sequence permutations from 720 (6!) to 120 (5!).
3.1.3. Hydroxylamine
In the case of hydroxylamine, no enhancement in the selectivity of the method was observed in this experiment. The reduction of Fe(III) to Fe(II) or Cu(II) to Cu(I) was not only ineffective, but it also exacerbates the effects caused by the different iron species.
3.1.4. Acetate
Acetate was initially evaluated for its potential as a masking agent, and its effectiveness was assessed based on the sequence of addition—either before or after NRS. Additionally, its role as a pH regulator was investigated, given that pH is a key factor influencing the efficiency of the coordination reaction between Co(II) and NRS.
The results revealed that acetate was unable to mask Cu(II) or Fe(II). However, acetate can mask Fe(III), provided it was added prior to NRS. Under these conditions, the formation of the Fe(III)–NRS complex was slow, yielding a green color of reduced intensity that stabilized after a few hours.
Although acetate was an ineffective masking agent, with only temporary masking capabilities for Fe(III), it demonstrated utility in other roles. Specifically, the coordination reaction with metals was typically slow; however, when acetate was added after NRS, the reaction accelerates and completes promptly. Similarly, adding acetate before NRS ensures rapid completion of the reaction. To optimize the reaction efficiency, a stock solution containing 4 g L-1 NRS and 3 g L-1 acetate was used hereafter. Trials with 1 g L-1 and 3 g L-1 acetate confirmed that 1 g L-1 was insufficient. Additionally, storing NRS with acetate was found to significantly delay the degradation of NRS over time.
Furthermore, acetate, when combined with acetic acid, acts as a buffer solution. As previously noted, maintaining an appropriate pH is critical for the reaction.
Consequently, although acetate was a poor masking agent, temporarily masking Fe(III), it plays a crucial role in pH regulation. This ensures optimal conditions for the coordination reaction between NRS and Co(II). Acetate will continue to be utilized both in the preparation of acetate-acetic acid buffer solutions and as a component in the NRS stock solution to support reaction efficiency and long-term stability.
3.1.5. Fluoride
To investigate the role of fluoride in ensuring the selectivity of Co(II) determination with NRS, experiments were conducted to examine the effect of the addition order by introducing fluoride either before or after the NRS. This approach aimed to evaluate fluoride’s contribution to enhancing the selectivity of the determination.
The results showed that fluoride was highly effective at masking both Fe(II) and Fe(III) when added prior to NRS. This masking effect was observed even at concentrations as high as 16 mg L-1 of Fe(II) or Fe(III) and was found to persist for over 12 hours. In contrast, acetate can only temporarily mask Fe(III) and very low concentrations. Conversely, when fluoride was added after NRS, it was unable break the complexes already formed between NRS and the metals. Regarding Cu(II) and Ni(II), their interaction with NRS was not significantly affected by the presence of fluoride, regardless of the order of addition.
These findings confirm that fluoride is a selective and durable masking agent for iron species, provided it is introduced before NRS, but it does not influence the coordination behavior of Cu(II) and Ni(II).
3.1.6. EDTA
A series of experiments were carried out to evaluate the role of ethylenediaminetetraacetic acid (EDTA) in the selective colorimetric determination of Co(II) using NRS. As with fluoride, the effect of the order of reagent addition was examined, testing whether EDTA was added before or after NRS. The objective was to assess its ability to mitigate metal interferences and enhance method selectivity.
The results are consistent with those of previous studies [34,44]. EDTA, a non-specific chelating agent, forms coordination complexes with all the metals present. Once a metal is chelated by EDTA, NRS cannot react with it, as it cannot break the coordination bonds formed by EDTA. However, when NRS is introduced first and EDTA is added subsequently, EDTA disrupts the coordination bonds formed by NRS, except for those with Co(II) and, to a lesser extent, those with Fe(II). At a concentration of 0.016 mol L-1, EDTA has been shown to mitigate interference from up to 6 mg L-1 of Fe(II) and up to 16 mg L-1 of both Fe(III) and Cu(II).
It is noteworthy that was necessary to dissolve acetate in the NRS stock solution, at concentrations of 4 g L-1 NRS and 3 g L-1 acetate. The presence of acetate was essential to accelerate the reaction, as its absence would have resulted in EDTA prematurely halting the reaction, potentially leading to erroneous conclusions. Upon the addition of EDTA, all coordination reactions involving NRS are immediately terminated.
These results underscore the strategic importance of reagent sequencing: EDTA must be added only after the Co(II)–NRS complex has formed. In this role, EDTA effectively eliminates interferences—particularly from Cu(II)—by outcompeting NRS for metal ions, without compromising the integrity of the Co(II) complex.
3.1.7. Combined Use of Acetate and Fluoride
The combined use of acetate–acetic acid buffer and fluoride was evaluated to optimize reagent addition in the Co(II)–NRS colorimetric method. Specifically, the sequence of addition was tested by introducing the buffer either before or after the fluoride, while ensuring that both were always added prior to NRS. The results showed no significant differences, leading to the decision to dissolve KF directly in the acetate-acetic acid buffer. This approach simplifies pH control and ensures optimal conditions during the reaction, avoiding potential pH fluctuations that could occur if KF were dissolved in Milli-Q water.
Since acetate lacks significant masking properties, its primary role was to control pH. Combining both reagents into a single solution allows the required concentrations for the final sample preparation to be maintained without increasing the concentrations in their respective stock solutions. This was particularly important given the total volume for sample preparation was 10 mL, with predefined proportions such as 1 mL of sample and 2 mL of NRS, among others.
Furthermore, integrating the buffer and KF into a single solution significantly reduces experimental complexity. By reducing the number of solutions from five to four, the possible combinations decrease from 120 (5!) to 24 (4!), simplifying experimental design and execution without compromising the efficacy or accuracy of the combinatorial experiment.
3.2. Study of Cu(II) Interferences
3.2.1. Combinatory Results
The effect of reagent addition order on the selectivity of Co(II) determination in the presence of Cu(II) was evaluated using 15 different reagent sequences. Each sequence involved the combination of hydroxylamine, nitroso-R-salt, EDTA, and a KF in acetate-acetic acid buffer, with all reagents added prior to measurement. The concentrations used were 1.6 mg·L−1 Co(II) and 40 mg·L−1 Cu(II), and all tests were conducted in triplicate with and without Cu(II) to assess interference. Table 4 summarizes the absorbance values at 525 nm, along with the absolute and relative errors.
The results demonstrate that the sequence of reagent addition significantly influences the extent of Cu(II) interference. Relative errors ranged from as low as 1.4% to as high as 21.4%, indicating substantial variability depending on the order
The lowest relative errors—indicating minimal interference—were obtained in sequences 8 (N–H–E–B) and 10 (N–B–E–H), both showing a relative error of just 1.4%, followed by sequence 11 (N–E–H–B) with 3.3%, and sequence 2 (H–N–E–B) with 5.3%. These results suggest that adding NRS early, followed by EDTA and then the KF in acetate-acetic acid buffer, helps preserve the Co(II)–NRS complex while minimizing Cu(II) interference. On the other hand, sequences 1 (H–N–B–E), 12 (N–E–B–H), and 13 (B–H–N–E) exhibited the highest relative errors, at 21.4%, 19.0%, and 21.0%, respectively. As it can be seen, in general, adding NRS first or second, followed by EDTA and/or KF in acetate-acetic acid buffer, leads to lower interference. In contrast, sequences where the KF in acetate-acetic acid buffer was added too early (before NRS) tend to result in higher relative errors. Additionally, it was observed during the experiment that the addition of hydroxylamine was counterproductive.
These findings underscore the importance of reagent sequencing in maximizing selectivity. The use of EDTA and fluoride as masking agents is clearly effective—but only when timed correctly relative to NRS addition. The optimal sequences identified here will guide the final method design. The sequence 8 and 10 presented the lowest relative error. For the study of effect of reactant concentration made in section 3.2.2, the sequence 8 was selected since its standard deviation was lower than sequence 10.
3.2.2. Effect of Reactant Concentrations
In order to optimize the reagent concentrations for the selective determination of Co(II), the Taguchi experimental design method was used. Different reagent concentrations were tested using sequence 8, both in the absence and presence of interfering Cu(II) ions.
The absorbance values obtained from the tests with and without Cu(II) were subtracted to assess the net interference effect, and the results were analyzed using the Taguchi signal-to-noise (S/N) ratio, applying the ‘nominal-is-best’ criterion with a target value of zero. This analysis was carried out using Minitab 19 software. Figure 1 presents the corresponding S/N analysis results graphically, while Table S4 summarizes the absorbance values obtained under the Taguchi experimental design conditions,
Figure 1.
Tagushi analysis results for different concentration levels of each reagent.
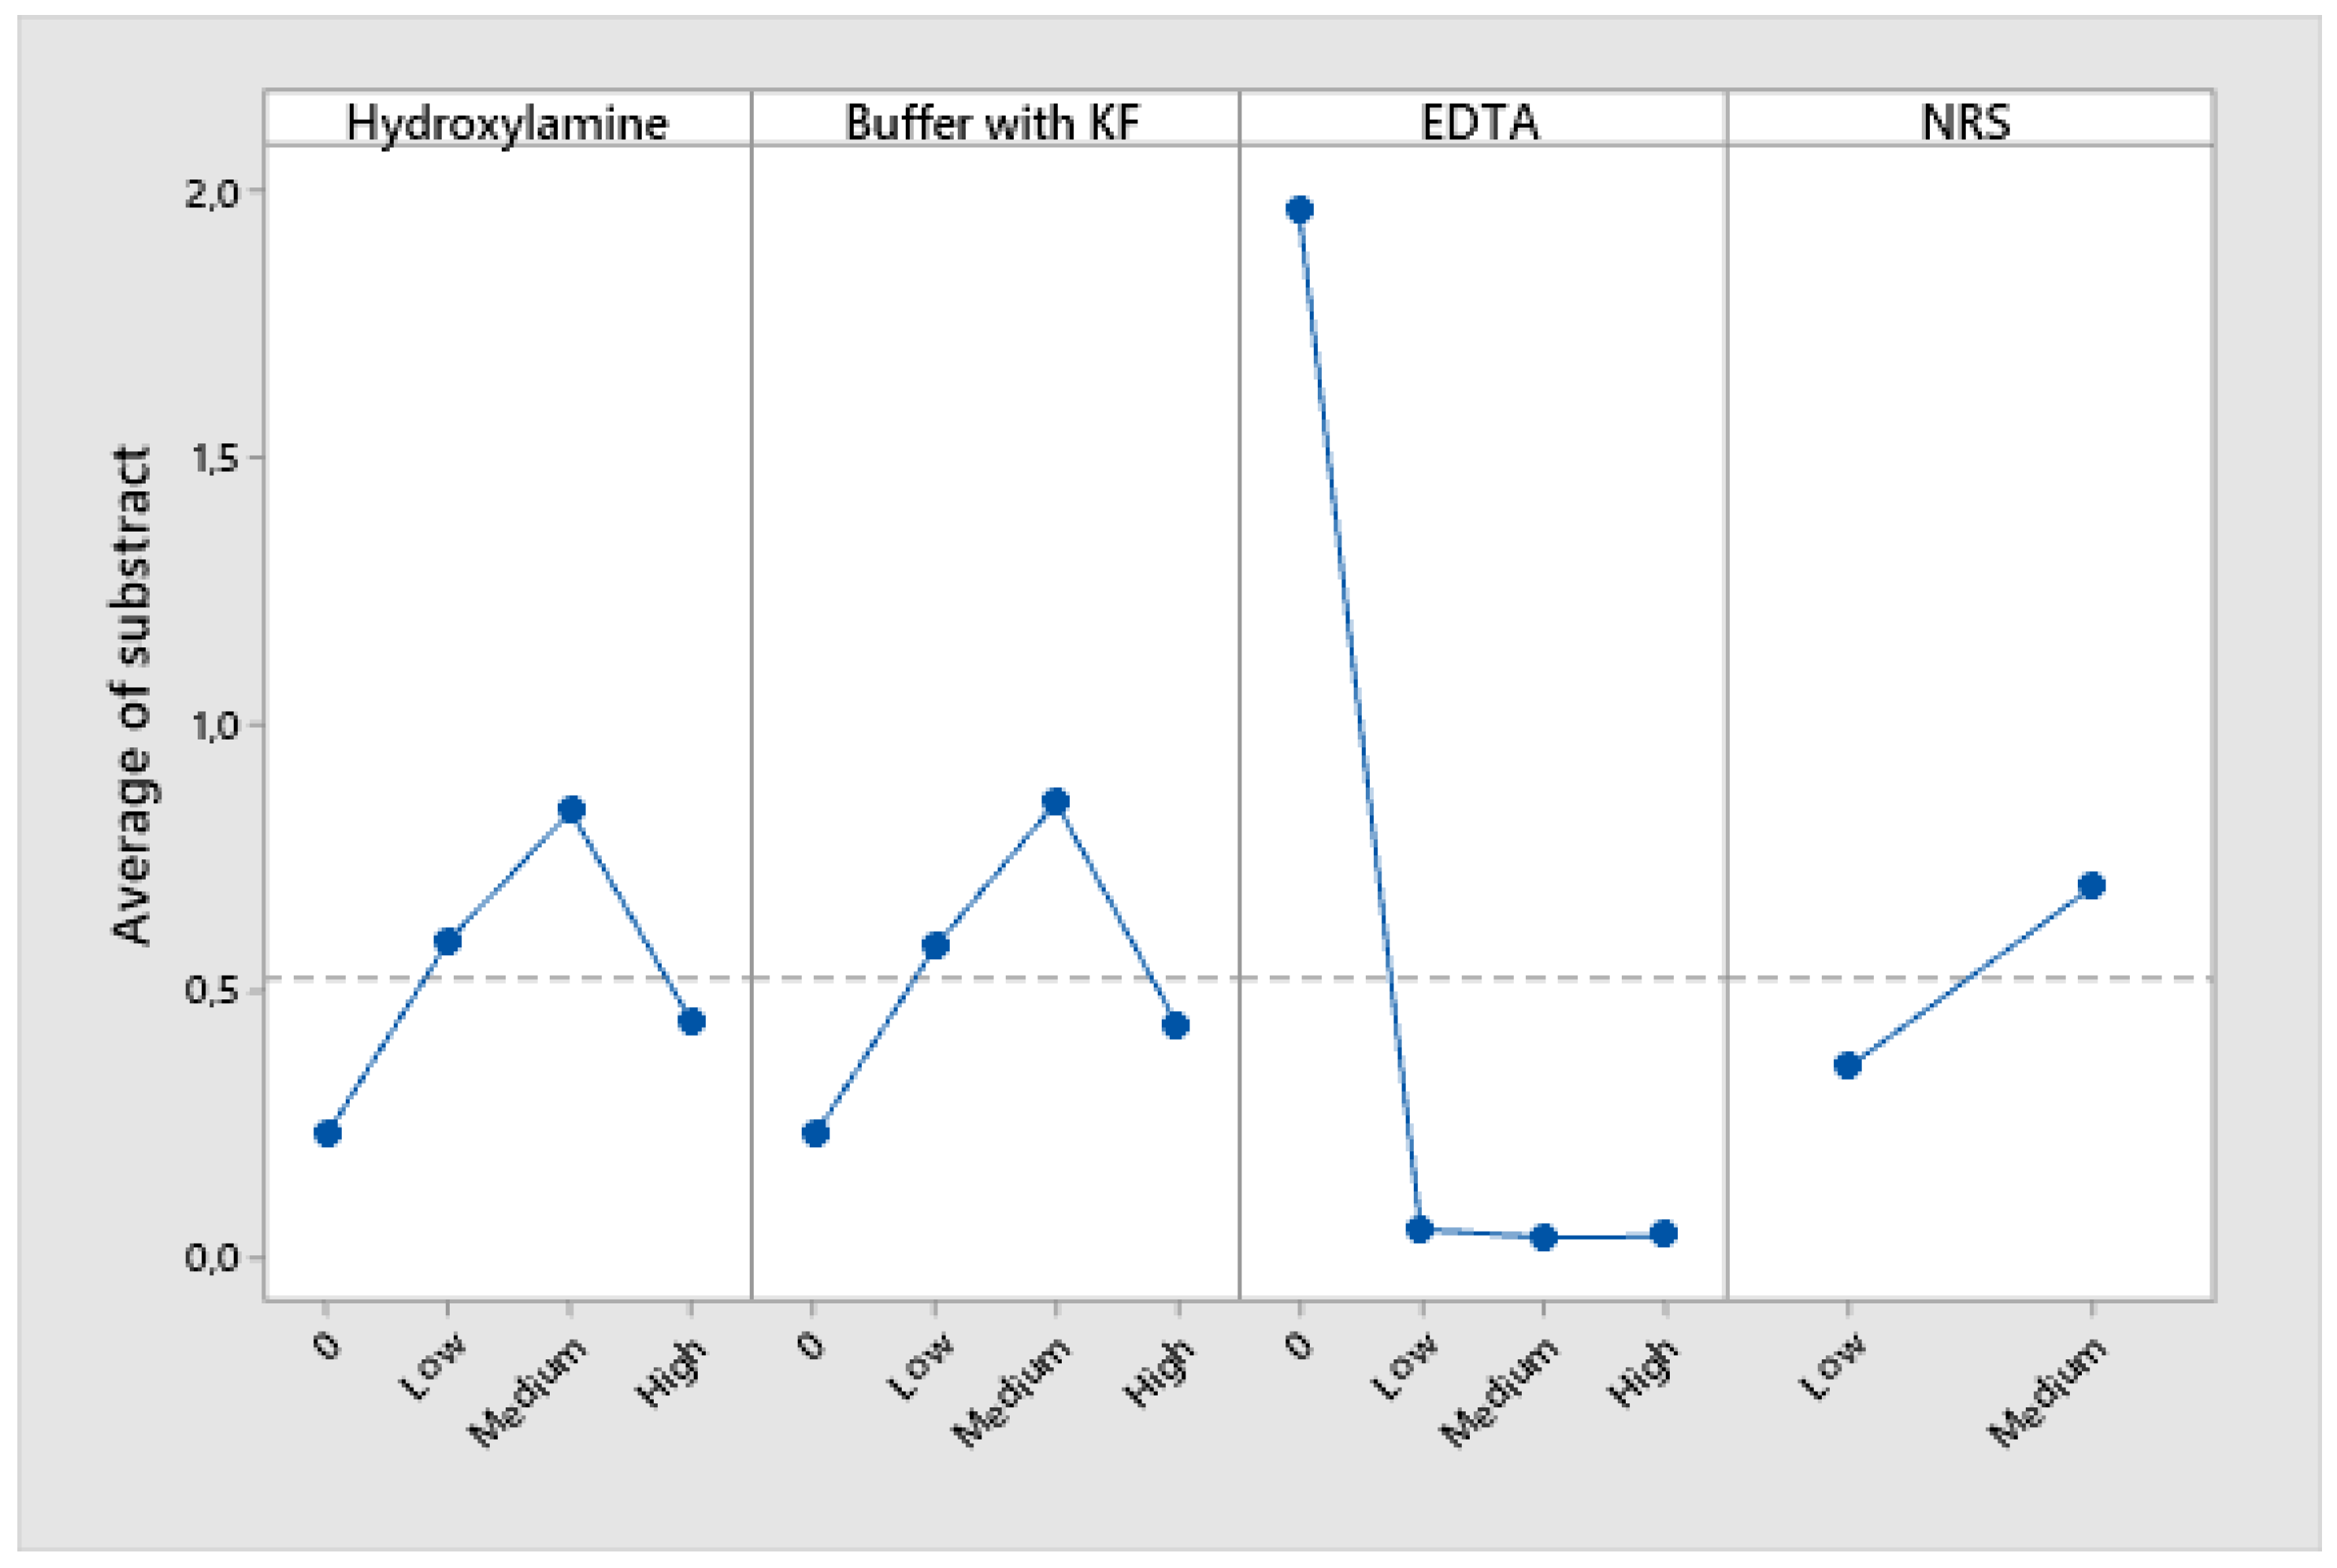
EDTA played a pivotal role since its presence reduces significantly interferences and prevents the precipitation of copper hydroxides. The response value in the Taguchi analysis of the low concentration level was nearly zero, indicating that there was sufficient EDTA to eliminate interferences. However, the medium concentration level, which has been utilized thus far, was maintained to ensure that it was in excess.
In the case of NRS, the low-level concentration it was closest to zero. One possible explanation is that reducing the NRS concentration enhances the method’s selectivity. However, it is also plausible that this is due to fewer complexes being formed, which would reduce the absorbances of the samples with and without copper, bringing their values closer together. To verify the cause, section 3.4 presents two absorbance scans of each metal coordinated with NRS: (i) one using the low concentration and (ii) another using the medium concentration.
The absence of KF in acetate-acetic acid buffer was the best option to avoid interference caused by Cu(II). Nevertheless, the KF in acetate-acetic buffer was still employed due to the necessity of eliminating Fe(III) interference and keep pH at optimal conditions for reaction.
Hydroxylamine was counterproductive in removing Cu(II) interference as its absence the nominal valor is near to 0. Therefore, the resulting Cu(I) from the reduction caused by hydroxylamine interferes as much as Cu(II).
Consequently, in the instance of Cu(II), the addition of EDTA in excess subsequent to NRS, which concentration was the minimum as possible, was sufficient to avoid its interference.
3.3. Study of Fe(III) Interferences
A new set of experiments was conducted to evaluate the effect of Fe(III) interference using a concentration of 16 mg L−1 Fe(III) [54]. The study focused on testing the most promising reagent sequences identified in the Cu(II) interference experiments, as well as exploring additional sequences to deepen the understanding of the system’s behavior. The results are summarized in Table 5.
The results presented in Table 6 show the effect of 16 mg L−1 Fe(III) on the absorbance signal of the NRS–Co(II) complex for various sequences of reagent addition. The absolute and relative errors (based on the difference in absorbance with and without Fe(III)) were used to evaluate the degree of interference. A lower relative error indicates better selectivity and effective masking of Fe(III).
Sequences 1, 2, 8, 9, 10, 11, and 12 resulted in large absolute and relative errors, with relative errors ranging from 154.1% to 302.6%, indicating that Fe(III) strongly interferes under these reagent addition orders. These sequences begin with NRS or hydroxylamine and delay the addition of EDTA and/or KF in acetate-acetic acid buffer.
In contrast, sequences 13, 15, and 16 demonstrated minimal interference, with relative errors between 12.3% and 19.6%, indicating effective masking of Fe(III). These sequences begin with KF in acetate-acetic acid buffer and add NRS early, before or immediately after hydroxylamine. The best result was obtained with sequence 13 (B–H–N–E), which yielded only a 12.3% relative error. This suggests that initiating the sequence with KF in acetate-acetic acid buffer effectively sequesters Fe(III). These observations align with the known high affinity of Fe(III) for fluoride and reinforce the importance of masking agent position in the addition sequence.
Additionally, the use of hydroxylamine was also counterproductive in this experiment. Thus, it was tested when hydroxylamine was not used in sequences 13, 15 and 16, which means that all three sequences to converge into a single sequence. The results, which were shown in the supplementary information, proved that it is better not to use hydroxylamine.
3.4. Absorbance Spectrum of Metal–NRS Complexes
To further improve the selectivity of the proposed method, absorbance spectra of various metal–NRS coordination complexes were recorded. The main objective was to identify wavelengths at which Co(II) can be selectively determined, minimizing interference from other metal ions with overlapping absorbance.
To expand on the findings presented in Section 3.2.2—where a lower NRS concentration led to a lower Cu(II) signal—each metal complex was analyzed using two NRS concentrations: 2 g L-1 and 4 g L-1. Only 2 mL of the NRS solution was added and made up to 10 mL with distilled water.
The concentration used were 10 mg L-1 for Co(II) and 16 mg L-1 for Fe(II), Fe(III), Cu(II) and Ni(II).
Spectral scans were conducted across the range of 470 to 800 nm, using Milli-Q water as the blank. The resulting spectra are presented in Figure 2.
Figure 1.
Absorbance spectra collected of different complexes metal-NRS using UV-Vis spectrophotometry which was scanned from 470 to 800 nm. a) NRS only, b) Co(II), c) Fe(II), d) Fe(III), e) Cu(II), f) Ni(II).
Figure 1.
Absorbance spectra collected of different complexes metal-NRS using UV-Vis spectrophotometry which was scanned from 470 to 800 nm. a) NRS only, b) Co(II), c) Fe(II), d) Fe(III), e) Cu(II), f) Ni(II).
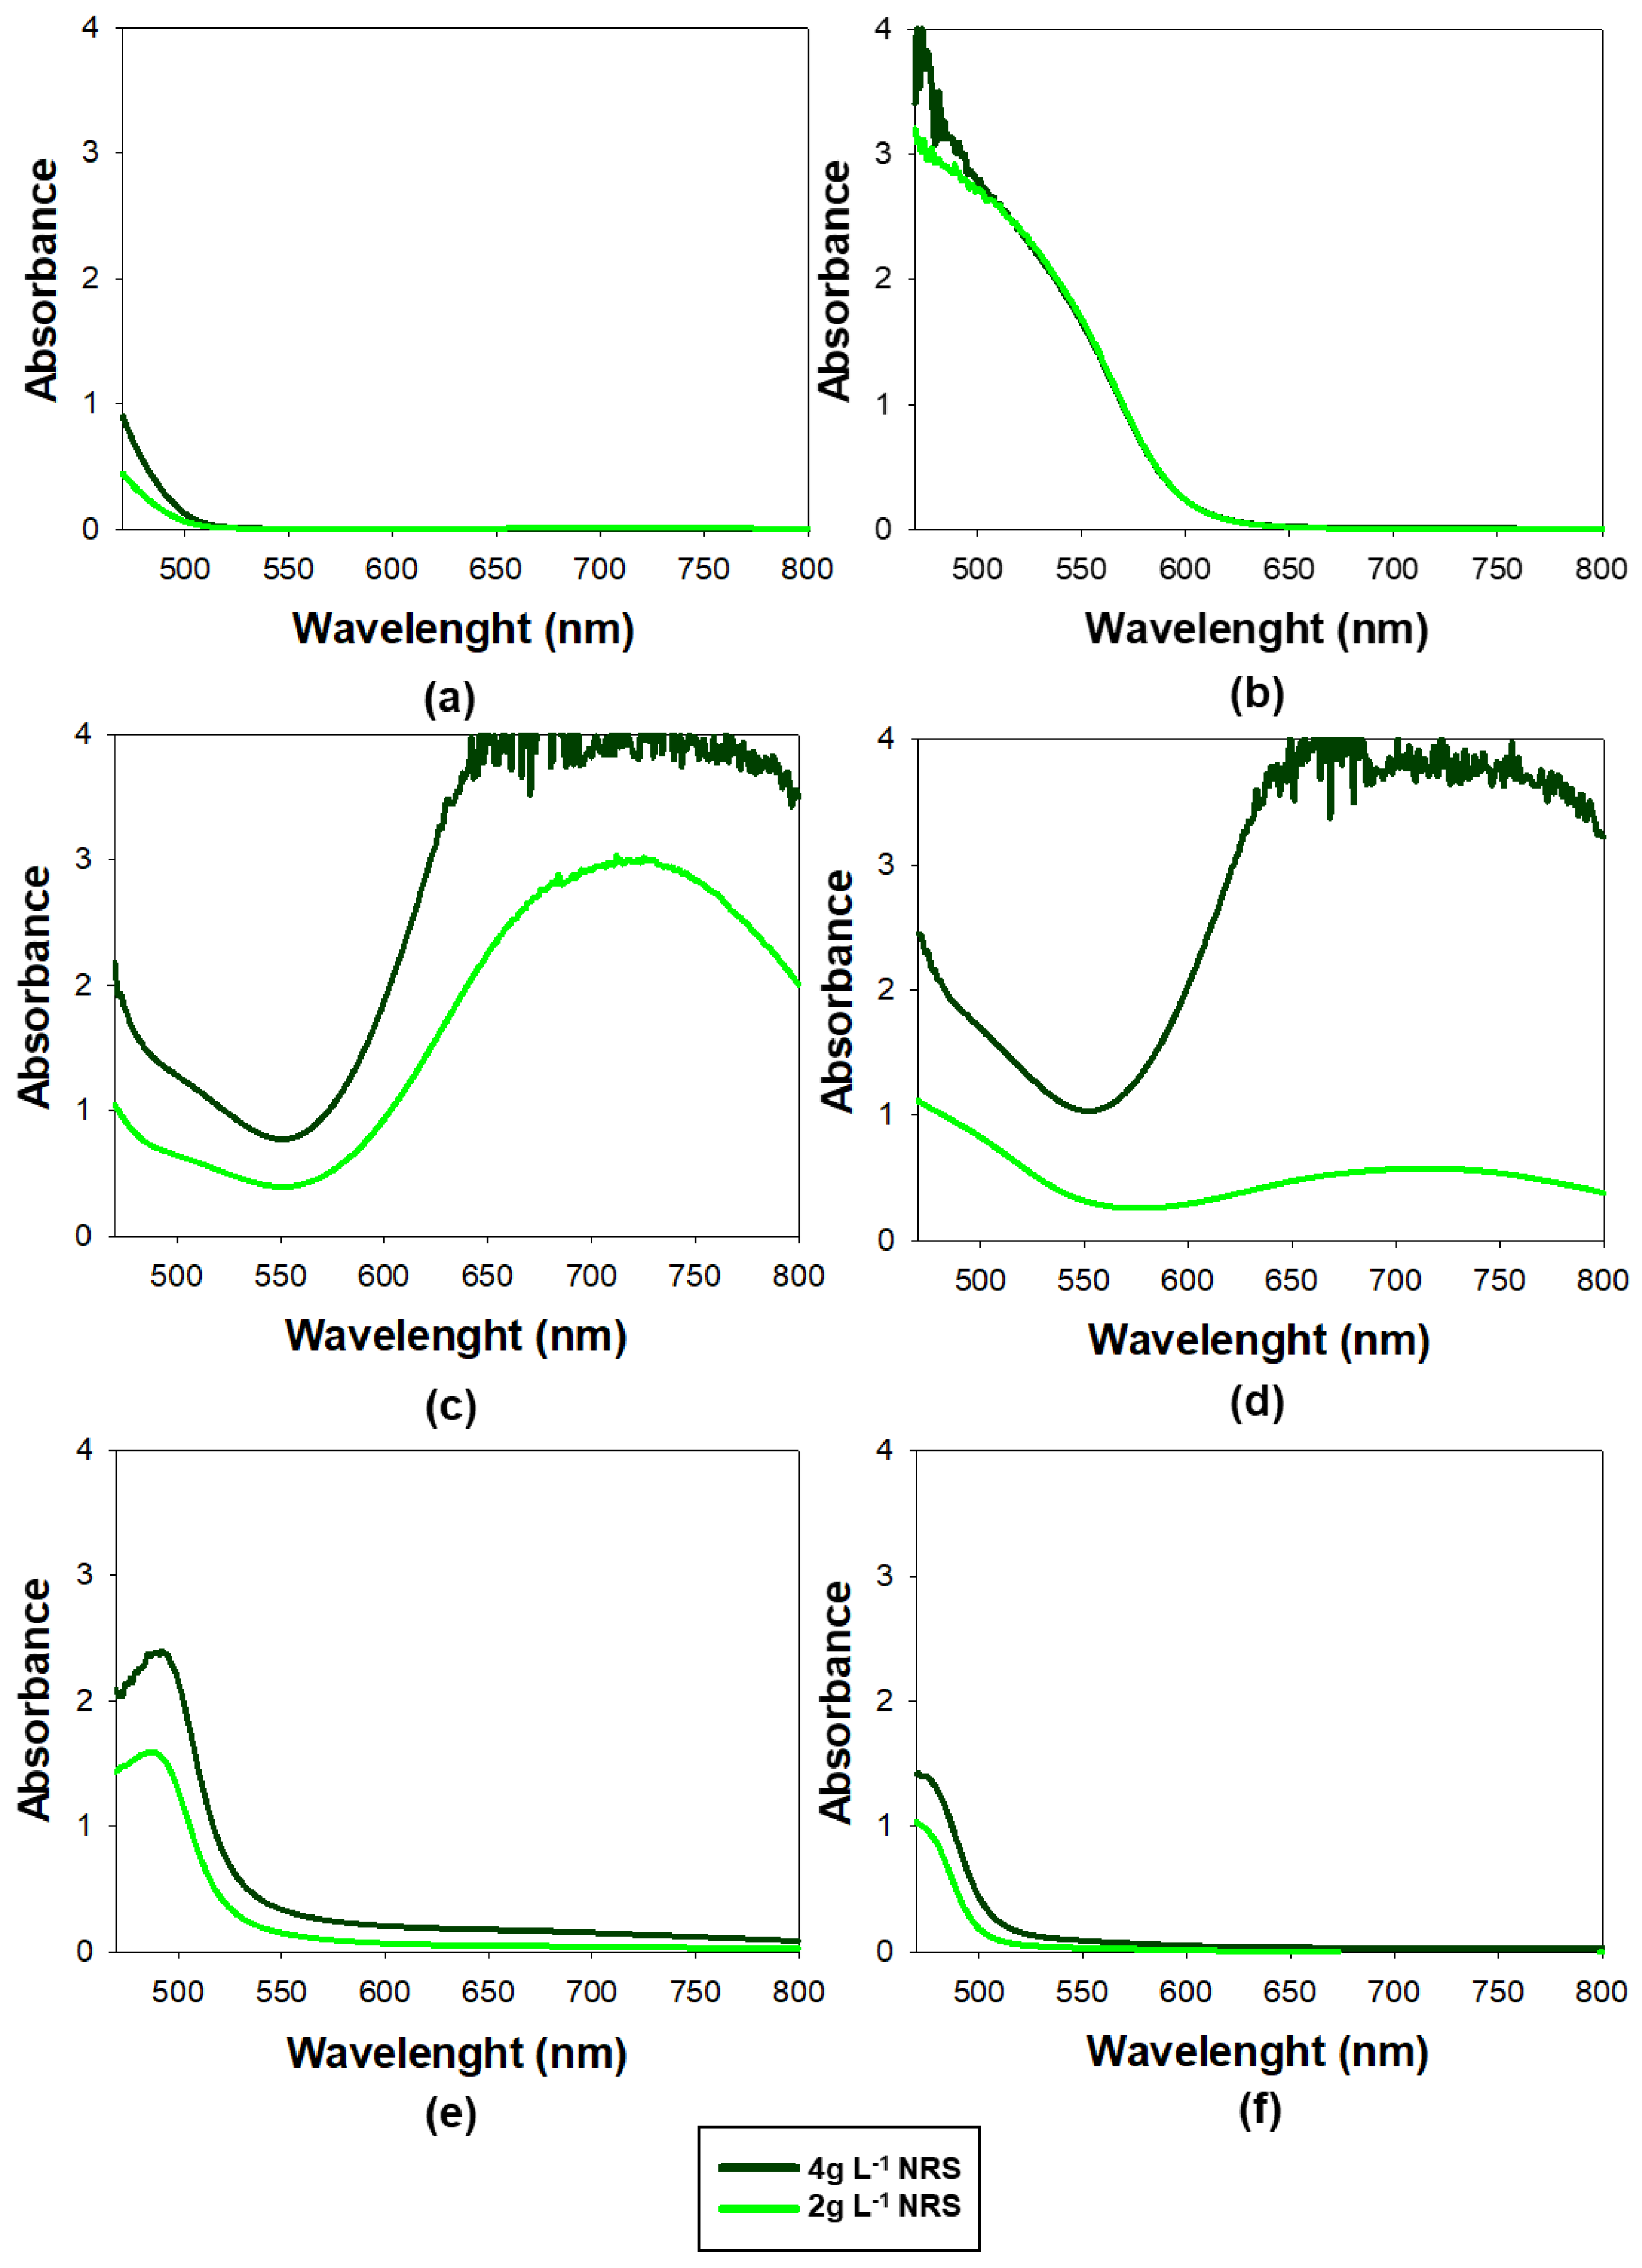
The optimum range for measuring the absorbance of the Co(II)-NRS complex was at 525 nm, as this was the wavelength with the highest absorption at which the NRS showed no absorbance. It was consistent with the findings of previous studies [22,29,41].
Moreover, it can be seen form Figure 2 that, the NRS–cobalt complex exhibits high absorbance in the 525–560 nm range. In fact, at 550 nm was particularly significant for enhancing the method’s selectivity, as the nickel and copper complexes practically did not absorb, meaning their interference in the determination of cobalt will be negligible. Additionally, the Fe(II) and Fe(III) complexes show a minimum in absorbance at 550 nm, further minimizing potential interference at this wavelength. These findings suggested that spectral interferences were significantly lower at 550 nm than at 525 nm, making 550 nm a more suitable wavelength for accurate cobalt determination
Furthermore, the results confirmed that using lower concentrations of NRS lowered the absorbance of the different metals except for Co(II), which remained unchanged.
An additional noteworthy observation was the absorbance spectrum of Fe(II), which displayed a high and wide peak around 710 nm. This was particularly important because, as previously highlighted, it posed the greatest challenge in terms of interference. To monitor its potential interference, 710 nm was employed as a sentinel wavelength: if absorbance was detected at this wavelength, it strongly suggested that there were NRS-Fe(II) or NRS-Fe(III) and may also be contributing to the signal at 550 nm. This approach served as an early warning system to identify possible Fe(II) interference and ensure the selectivity of the method for Co(II).
At this point, absorbance measured was 550nm and 710nm, which was the sentinel peak. The concentration of NRS was 2g L-1.
3.5. Study of Fe(II) Interferences
Once the optimal reagent addition sequence, the best combination of reagent concentrations, and the most favorable wavelengths for the analysis were established, the interference of Fe(II) —which is the most challenging interference to address— was investigated. Moreover, it is important to consider that Fe(II) ions can be present at high concentrations in the bioleachate from batteries. To tackle this issue, an evaluation was conducted to determine whether increasing the volume of KF in acetate-acetic acid buffer could completely mask the Fe(II). Samples containing only Fe(II) were prepared, with 4, 5, 6, and 7 mL of KF in acetate-acetic acid buffer added to each, and all tests were performed in triplicate.
As previously observed, reducing the concentration of NRS decreases the signal caused by Fe(II). Therefore, 1mL of NRS at 4g L-1 was used in these tests instead of the 2mL employed in earlier experiments.
Additionally, adjustments were made to the volume and concentration of the EDTA solution. Instead of using 2 mL of a 0.05 mol L-1 solution, 1 mL of a 0.1 mol L-1 solution was employed.
These changes provided greater flexibility to vary the volumes of other reagent solutions added while maintaining a total volume of 10 mL and allowing to perform the test adding 7 mL of KF in acetate-acetic acid buffer. Importantly, this modification did not result in significant changes in the outcomes.
Finally, to work with more representative laboratory conditions, a Fe(II) concentration of 20 mg L-1 was used, as opposed to the 16 mg L-1 utilized in previous experiments based on the reference [41]. This concentration better reflects the Fe(II) concentration in real samples analyzed.
The results were showed in Table 6. The obtained values indicate that the signal progressively decreases as more volume of KF in acetate-acetic acid buffer was added. However, beyond a volume of 6 mL, the signal no longer decreases and remains at a residual level. Therefore, it was concluded that this strategy is insufficient to avoid the interference caused by 20mg L-1 of Fe(II).
Nevertheless, the issue was surmounted by the addition of 4 mL of 25% v/v H2SO4 at the end of the sequence, followed by a waiting period of 10 minutes, as detailed in the subsequent section.
3.6. Study to Remove Turbidity from Fe(OH)3 and Al(OH)3
During the evaluation of the conditions optimized thus far, it was observed that the addition of KF dissolved in acetate–acetic acid buffer produced turbidity in the presence of 20 mg L−1 Fe(III) and 30 mg L−1 Al(III). This phenomenon was attributed to the potential formation of Fe(OH)₃ and Al(OH)₃. This issue had not been detected earlier, as aluminum had not been previously tested, and 16 mg L−1 of Fe(III) did not generate observable turbidity. However, at 20 mg L−1 Fe(III), the effect became evident.
To address this, the volume of KF in buffer was reduced to 1 mL, but turbidity still occurred. In the case of Fe(III), the problem was resolved by adding 1 mL of a sulfuric acid solution adjusted to pH 1.8 before the addition of KF in buffer. However, this introduced variability in absorbance between replicates, probably due to the new addition between the sample and the KF in acetate-acetic acid buffer. This issue was resolved by shaking the solution immediately after the addition of the KF-buffer mixture. Under these conditions, absorbance was consistently zero at two monitored wavelengths, 550 and 710 nm.
The final working protocol was as follows: 1 mL of sample, 1 mL of solution adjusted to pH 1.8 with H2SO4, 1 mL of KF in acetate–acetic acid buffer, vigorous shaking, 2 mL of NRS (at 2g L-1), 1 mL of EDTA, and 4 mL of Milli-Q water.
Using this protocol, Al(III) was tested at 30 mg L−1, and it exhibited behavior similar to Fe(III): turbidity appeared upon the addition of KF in buffer. To mitigate this, the 4 mL of Milli-Q water added at the end were replaced with H2SO4 solutions at increasing concentrations (5%, 10%, 15%, 20%, and 25% v/v). A concentration of 5% H2SO4 was sufficient to eliminate the turbidity caused by Al(III).
However, as discussed in Section 3.1.2, concentrated acids dissociate all metal complexes except Co(II)–NRS. This allowed for the potential removal of Fe(II) interference. To confirm this, the absorbance of Fe(II) was monitored at 550 and 710 nm after the addition of H2SO4 at 10% and 25% v/v. At 25%, no signal was detected after 10 minutes; at 10%, the signal disappeared after 30 minutes (see Figure S2).
Consequently, the final optimized protocol was established and validated.
3.7. Optimal Method
After conducting all the necessary studies to minimize interferences caused by metal ions in the colorimetric determination of cobalt using the complexing reagent NRS, the optimized method has been established as follows:
- 1 mL of sample
- 1 mL solution adjusted to pH 1.8 with H2SO4
- 1 mL of solution containing 33.3 g L-1 KF in acetate (0.022 mol L-1 of sodium acetate trihydrate)-acetic acid (0.007 mol L-1) buffer
- Shake the solution
- 2 mL of 2g L-1 NRS with 3g L.1 acetate
- 1 mL of EDTA 0.1 mol L-1
- 4 mL H2SO4 at 25% v/v.
Hydroxylamine was not used in this final version, and the amount of concentrated acid necessary was reduced.
The method was tested using all major metal ions found in battery bioleachates. No interferences were observed at 550 and 710 nm even at concentrations higher than those typically found in real samples, as shown in Table S5.
3.8. Method Validation
To evaluate the reliability and selectivity of the method for Co(II) determination in battery bioleachate samples, a validation study was carried out. The parameters assessed included precision (expressed as repeatability), limit of detection (LoD), limit of quantification (LoQ), linearity, accuracy, and application to real samples. The validation was conducted using measurement at wavelength of 550 nm.
3.8.1. Repeatability
To assess the method’s precision, six replicate analyses were performed on solutions containing 2.5 and 10 mg L−1 of Co(II). The close consistency of the results demonstrates good repeatability. The data are summarized in Table 7.
The coefficient of variation (CV or RSD%) ranged from 1.70% to 2.65%.
These repeatability values are considered acceptable according to the Horwitz criterion [50].
3.8.2. Analysis of Real Samples
In order to ensure the robustness and reliability of the proposed method, a validation was conducted using real samples with complex matrices. The mediums examined were the Acidithiobacillus ferrooxidans culture medium, water from the Agulla reservoir in Manresa, bioleachate from smartphone PCBs, and bioleachate from bike and scooter batteries. It was noteworthy that, aside from the battery bioleachate containing Co(II), Co(II) had to be added to the other mediums since it was not inherently present. All measures were performed by triplicated.
All samples, except for the reservoir water, were diluted 450 times. UV-Vis analyses results were compared with those obtained using atomic absorption spectroscopy. The concentration values obtained from both methods were found to be nearly identical, as presented in Table 8. This close agreement between the results reinforces the reliability and robustness of the developed method, highlighting its suitability for selective Co(II) determination in diverse and complex sample matrices and presence of interferers.
3.8.3. Accuracy
Accuracy, defined as the closeness of the experimental results to the true value, was assessed in terms of recovery (RV %) of a known amount of added standard. To this end, a known concentration of Co(II) (5.5 mg L−1) was spiked into bioleachate samples obtained from bike and scooter batteries. As it can be seen in Table 9, the recovery values were close to 100%, indicating that the method provides accurate results. All the measurements were performed in triplicate.
3.8.4. Lineal Range
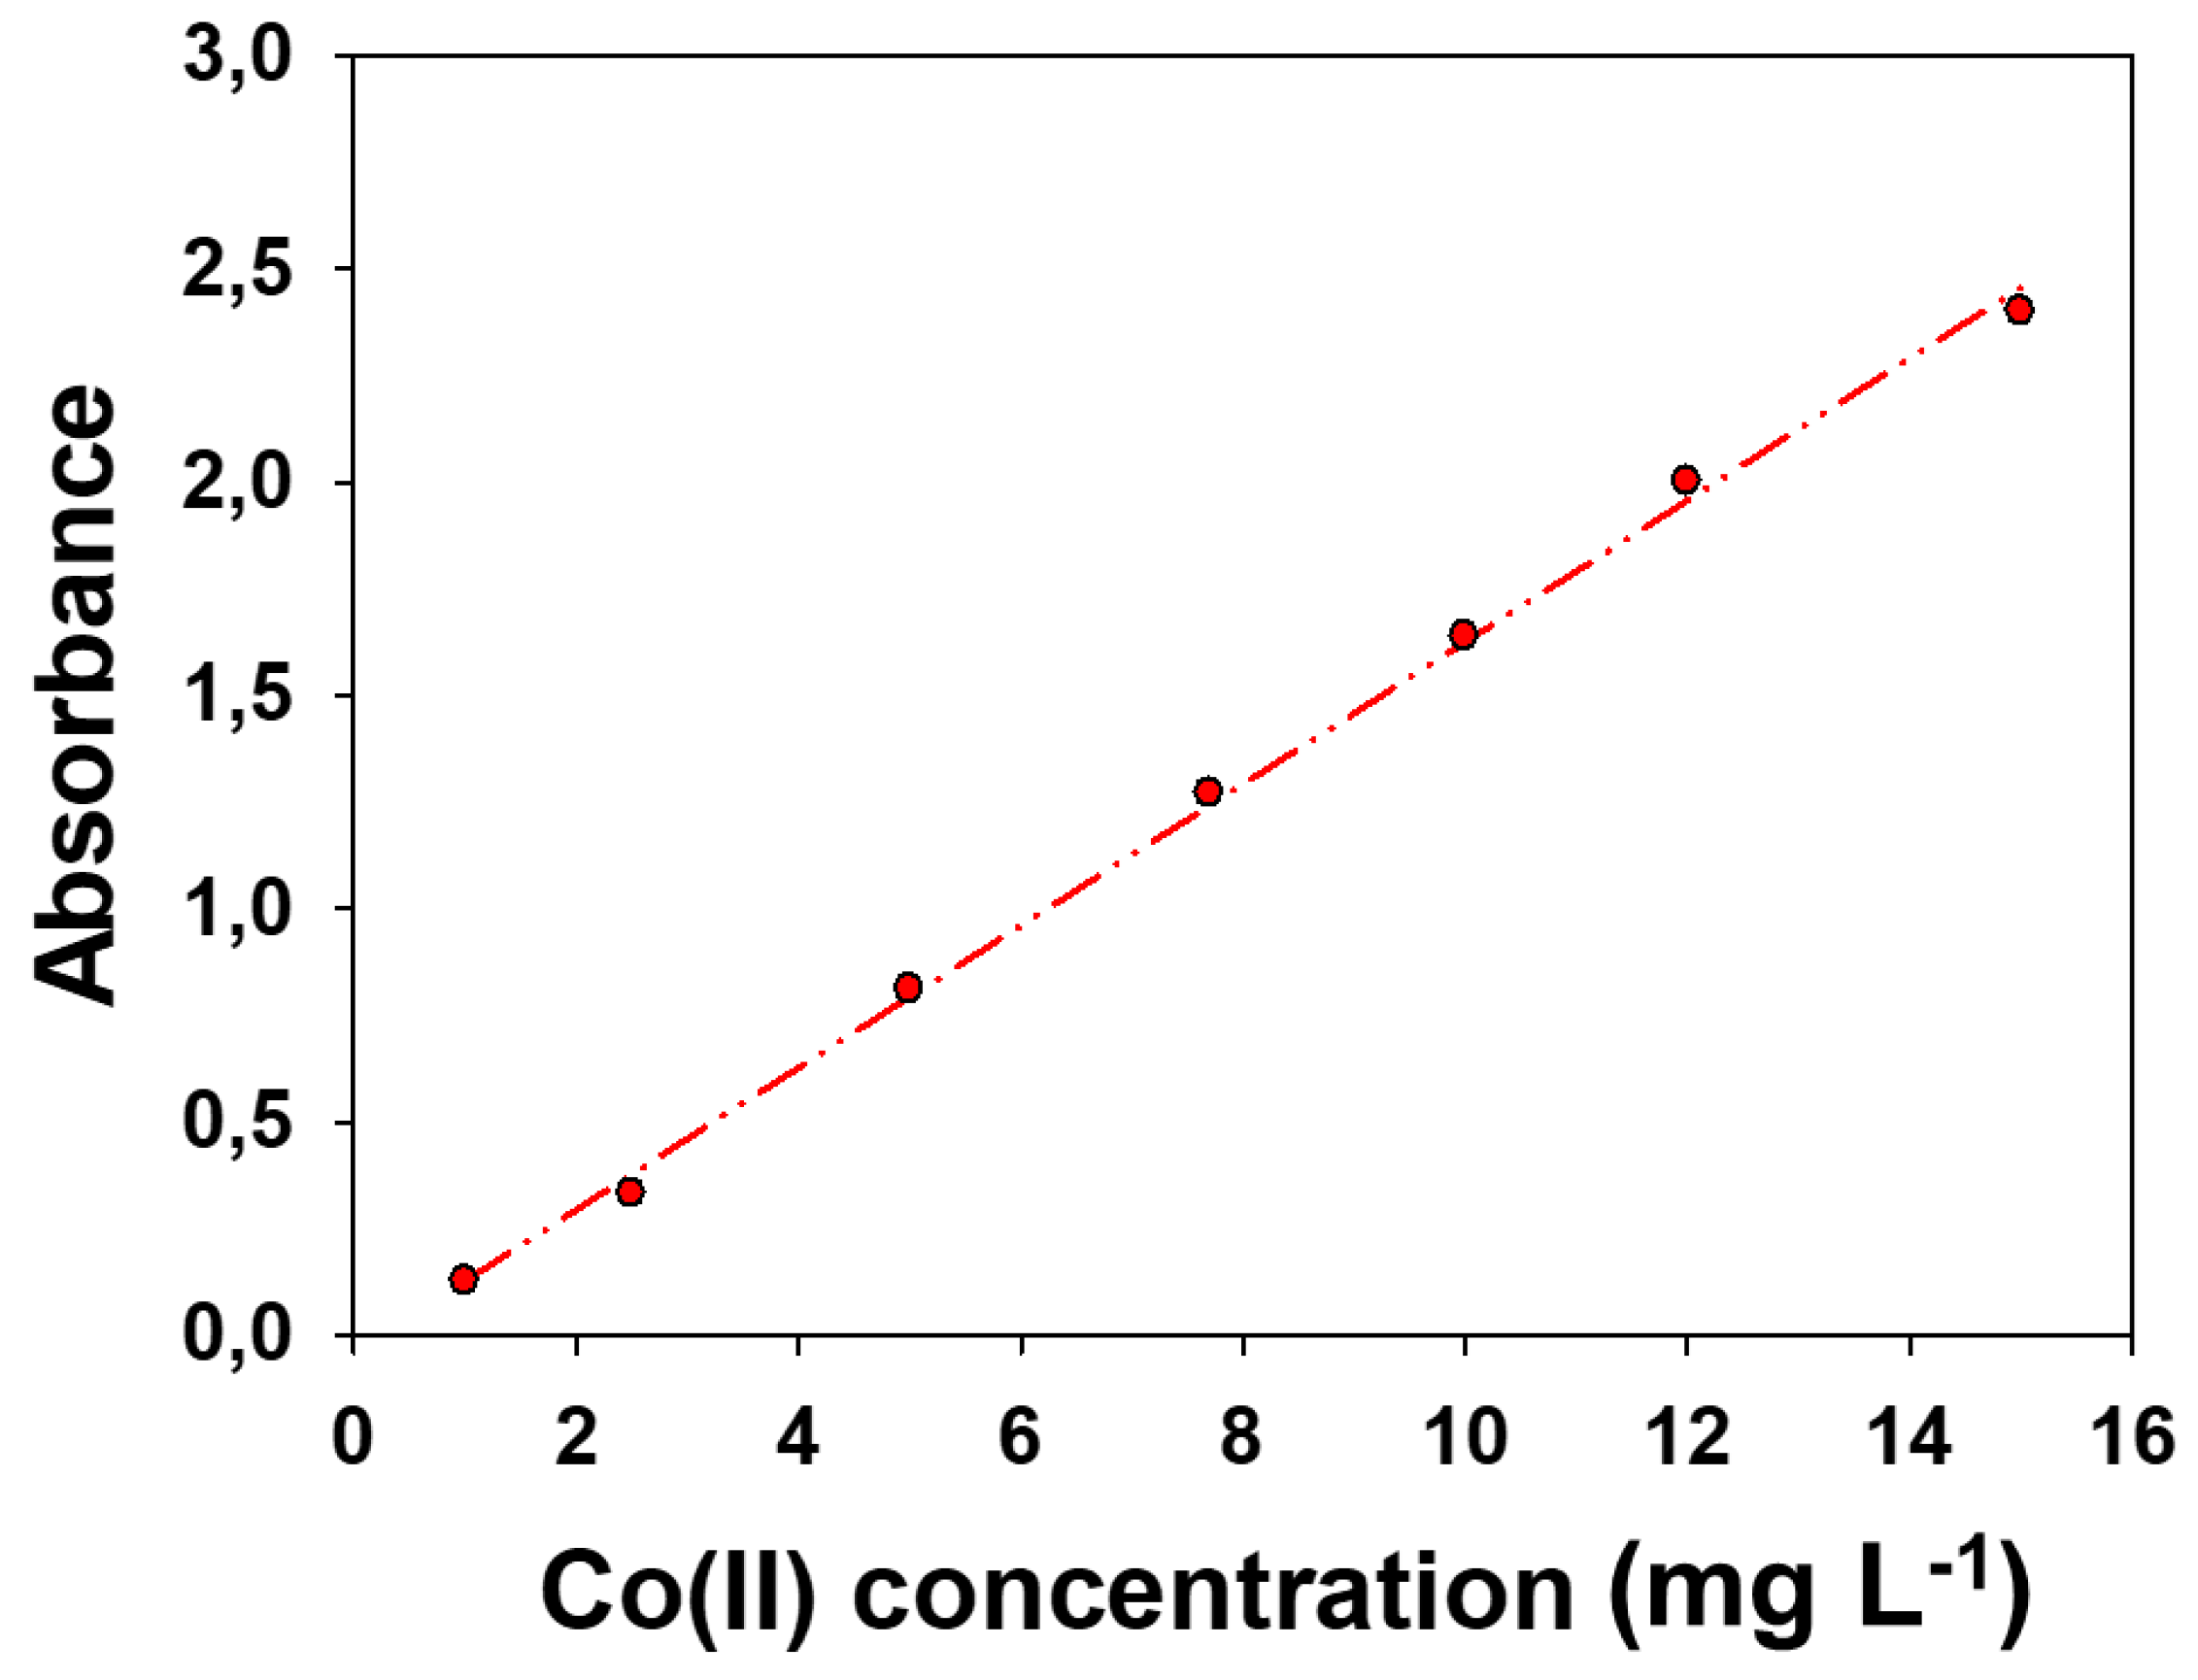
The linearity of an analytical method represents the relationship between analyte concentration and the analytical signal obtained. The linear response range, defined as the interval between the upper limit of quantification (LoQ) to the highest concentration, was determined by analyzing standard solutions ranging from 1 to 20 mg L-1. Thus, the calibration curve obtained was calculated by least squares. The upper limit was 15 mg L-1 an R2 of 0.998. The calibration plot is shown at Figure 3. The slope was 0.166.
Figure 2.
Calibration curves and linear adjustment within the linear range for the determination of Co(II). The equation was Abs = (0.166 ± 0.003) [Co(II)] – (0.04 ± 0.03).
Figure 2.
Calibration curves and linear adjustment within the linear range for the determination of Co(II). The equation was Abs = (0.166 ± 0.003) [Co(II)] – (0.04 ± 0.03).
3.8.5. Limit of Detection and Limit of Quantification
The limit of detection (LoD) and limit of quantification (LoQ) were determined by signal-to-noise approach. The signal-to-noise ratio was established by measuring the signals of 5 blanks, which contained all reagents without any metal. The LoD and LoQ were then calculated using the mean (X) and standard deviation (Sb) values, according to [51]: LoD = (X+3·Sb)/S and LoQ = (X+10·Sb)/S, where Sb is the standard deviation of the blank mean and S was the slope of the calibration curve or sensitivity. Using this method, the LoD was 0.1 mg L-1 and the LoQ was 0.3 mg L-1.
4. Conclusions
A simple, selective, and cost-effective spectrophotometric method was developed and validated for the determination of Co(II) in battery bioleachates. The optimization of reagent addition sequence (sample, H2SO4 at pH=1.8, KF in acetate-acetic acid buffer, shake the solution, NRS, EDTA and H2SO4 at 25% v/v), reagent concentrations, and measurement wavelength (550 nm) significantly improved selectivity of the method.
Particular attention was given to minimizing interferences, especially from Fe(II), which was effectively masked through the strategic use of potassium fluoride and EDTA under acidic conditions.
Absorbance spectra of various metal-NRS complexes among 480 and 800 nm confirmed a high absorbance from the complexation of Co(II) with the nitroso-R salt at 525 and 550 nm. In contrast, absorption of the other metal complexes at 550 nm was negligible, in the case of Cu(II) and Ni(II), or minimal, in the case of Fe(II) and Fe(III). Thus, 550 was selected for selective Co(II) measurements even in the presence of interfering metal ions such as Fe(II) Fe(III), Cu(II) and Ni(II).
The method demonstrated excellent repeatability (RSD% < 2.7), low limits of detection and quantification, a wide linear response range, and high accuracy, with recovery values near 100% in real bioleachate samples.
Given its robustness, simplicity, and low cost, this method represents a valuable tool for routine monitoring of cobalt in hydrometallurgical processes, bioleachate from batteries and environmental samples derived from spent lithium-ion batteries.
Supplementary Materials
The following supporting information can be downloaded at: xxxxx, Table S10: All possible combinations of reactant addition sequences. Table S11: Concentrations levels used for experiments in a Taguchi model. Table S12: Experiments performed within the framework of a Taguchi model. Figure S3: Color of different complexes metal-NRS. Table S13: Results of absorbance from experiments performed within the framework of a Taguchi model in presence of 40 mg L-1 Cu(II) as interference and 1.6 mg L-1 Co(II) with sequence 8 (NRS, hydroxylamine, EDTA, KF in acetic-acetate buffer). Figure S4: Time for the disappearance of Fe(II)-NRS absorbance one minute after the addition of acid. Table S5: Absorbance of interferents using the validated method. Table S6: Absorbance of various interfering cations without hydroxylamine. The concentrations used were Co(II) 1.6 mg L-1, Cu(II) 40 mg L-1 and Fe(III) 16 mg L-1.
Author Contributions
Conceptualization, C.L.-L., M.B. and A.D.D.; methodology, D.R., C.L.-L. and M.B.; validation, D.R. and C.L.-L.; investigation, D.R.; resources, A.D.D. and M.B.; data curation, D.R., C.L.-L. and M.B; writing—original draft preparation, D.R., C.L.-L. and M.B.; writing—review and editing, D.R., C.L.-L., M.B. and A.D.D.; visualization, C.L.-L., M.B. and A.D.D.; supervision, C.L.-L. and M.B.; project administration, A.D.D.; funding acquisition, A.D.D. All authors have read and agreed to the published version of the manuscript.
Funding
Project BIOMETAL PID2020-117520RA-I00 funded by MCIN/AEI/10.13039/501100011033, BIOCOLI ACE034/21/000044 funded by ACCIÓ.
Data Availability Statement
The data presented in this study are available upon request from the corresponding authors. The data are not publicly available because the repository that is used to keep the data is a private one provided by the university.
Acknowledgments
The authors gratefully acknowledge the UPC for the financial support of a predoctoral grant FPU-UPC, with the collaboration of Banco de Santander. The authors would like to acknowledge Marc Cuní Iglesias for their contribution to the interference study.
Conflicts of Interest
The authors declare that there is no conflict of interest.
References
- Deng, S.; Perez-Cardona, J.; Huang, A.; et al. Applying design of experiments to evaluate economic feasibility of rare-earth element recovery. Procedia CIRP 2020, 90, 165–170. [Google Scholar] [CrossRef]
- Forecasts|Benchmark Mineral Intelligence. 2024. https://www.benchmarkminerals.com/forecasts/ (accessed on 23 July 2024).
- Fan, E.; Li, L.; Wang, Z.; et al. Sustainable Recycling Technology for Li-Ion Batteries and Beyond: Challenges and Future Prospects. Chem. Rev. 2020, 120, 7020–7063. [Google Scholar] [CrossRef]
- Alipanah, M.; Saha, A.K.; Vahidi, E.; Jin, H. Value recovery from spent lithium-ion batteries: A review on technologies, environmental impacts, economics, and supply chain. Clean. Technol. Recycl. 2021, 1, 152–184. [Google Scholar] [CrossRef]
- Dai, Y.; Wang, N.; Xu, Z.; et al. Acid-Free Leaching Nickel, Cobalt, Manganese, and Lithium from Spent Lithium-Ion Batteries Using Fe(II) and Fe(III) Solution. J Sustain Met. 2022, 8, 863–871. [Google Scholar] [CrossRef]
- Benzal, E.; Solé, M.; Lao, C.; et al. Elemental Copper Recovery from e-Wastes Mediated with a Two-Step Bioleaching Process. Waste Biomass Valorization 2020, 11, 5457–5465. [Google Scholar] [CrossRef]
- Benzal, E.; Cano, A.; Solé, M.; et al. Copper Recovery from PCBs by Acidithiobacillus ferrooxidans: Toxicity of Bioleached Metals on Biological Activity. Waste Biomass Valorization 2020, 11, 5483–5492. [Google Scholar] [CrossRef]
- Dorado, A.D.; Gamisans Noguera, X.; Solé Sardans, M.; et al. Method for the biological recovery of metals in electric and electronic waste. 2019. [Google Scholar]
- Alipanah, M.; Reed, D.; Thompson, V.; et al. Sustainable bioleaching of lithium-ion batteries for critical materials recovery. Elsevier Ltd. 2023. [Google Scholar] [CrossRef]
- Morell, J.; Guimerà, X.; Dorado, A.D. Improving the transfer of dissolved oxygen in a biological Fe2+ oxidation process using a venturi jet as an intensive aeration system. Hydrometallurgy 2024, 229, 106380. [Google Scholar] [CrossRef]
- Zhang, X.; Shi, H.; Tan, N.; et al. Advances in bioleaching of waste lithium batteries under metal ion stress. Bioresour Bioprocess 2023, 10. [Google Scholar] [CrossRef]
- Ricart, D.; Dorado, A.D.; Lao-Luque, C.; Baeza, M. Microflow injection analysis based on modular 3D platforms and colorimetric detection for Fe(III) monitoring in a wide concentration range. Microchim Acta 2023, 191, 3. [Google Scholar] [CrossRef]
- Ricart, D.; Dorado, A.D.; Lao-Luque, C.; Baeza, M. Microflow injection system for efficient Cu(II) detection across a broad range. Preprints. 2024. [CrossRef]
- Daşbaşı, T.; Saçmacı, Ş.; Ülgen, A.; Kartal, Ş. Determination of some metal ions in various meat and baby food samples by atomic spectrometry. Food Chem. 2016, 197, 107–113. [Google Scholar] [CrossRef]
- Tewari, P.K.; Singh, A.K. Amberlite XAD-7 impregnated with Xylenol Orange: A chelating collector for preconcentration of Cd(II), Co(II), Cu(II), Ni(II), Zn(II) and Fe(III) ions prior to their determination by flame AAS. Fresenius J. Anal. Chem. 2000, 367, 562–567. [Google Scholar] [CrossRef]
- Tsai, C.Y.; Lin, Y.W. A highly selective and sensitive fluorescence assay for determination of copper(ii) and cobalt(ii) ions in environmental water and toner samples. Analyst 2013, 138, 1232–1238. [Google Scholar] [CrossRef] [PubMed]
- Minagawa, T.; Tokeshi, M.; Kitamori, T. Integration of a wet analysis system on a glass chip: Determination of Co(II) as 2-nitroso-1-naphthol chelates by solvent extraction and thermal lens microscopy. Lab. Chip 2001, 1, 72–75. [Google Scholar] [CrossRef] [PubMed]
- Ali, T.A.; Aglan, R.F.; Mohamed, G.G.; Mourad, M.A. New Chemically modified screen-printed electrode for co(II) determination in different water samples. Int. J. Electrochem. Sci. 2014, 9, 1812–1826. [Google Scholar] [CrossRef]
- Jain, A.K.; Gupta, V.K.; Singh, L.P.; Khurana, U. Macrocycle based membrane sensors for the determination of cobalt(II) ions. Analyst 1997, 122, 583–586. [Google Scholar] [CrossRef]
- Marino, D.F.; Wolff, F.; Ingle, J.D. Determination of Cobalt by lophine chemiluminescence. Anal. Chem. 1979, 51, 2051–2053. [Google Scholar] [CrossRef]
- Kang, S.M.; Jang, S.C.; Kim, G.Y.; et al. A rapid in situ colorimetric assay for cobalt detection by the naked eye. Sens. (Switzerland) 2016, 16, 1–10. [Google Scholar] [CrossRef]
- Willard, H.H.; Kaufman, S. Colorimetric determination of cobalt using nitroso-R-salt. Anal. Chem. 1947, 1, 1947. [Google Scholar] [CrossRef]
- Mezaal, E.N.; Sadiq, K.A.; Mohammed, M.A.A.S.; Rumez, R.M. Spectrophotometric determination of Co(II) by using ethyl cyano(2-methyl carboxylate phenyl azo acetate) (ECA). Int. J. Appl. Chem. 2016, 12, 699–711. [Google Scholar]
- Issa, R.M.; Zayan, S.E.; El-Shamy, T.M.; El-Hefnaway, G.B. Spectrophotometric study of the reaction of Co(II) and Ni(II) with nitroso-R-salt and α-nitroso-β-naphthol. Monatshefte Für Chem. 1980, 111, 1413–1425. [Google Scholar] [CrossRef]
- Bajue, S.A.; Taylor, G.A.; Lalor, G.C. The reactions of cobalt compounds with nitroso-naphtols-III [1]. Inorg. Nucl. Chem. 1972, 34, 1353–1364. [Google Scholar] [CrossRef]
- Bajue, S.A.; Lalor, G.C. The reactions of cobalt compounds nitroso-naphthols-V [1]. J. Inorg. Nucl. Chem. 1973, 35, 4231–4236. [Google Scholar] [CrossRef]
- Trojanowicz, M.; Pyszynska, M. Flow-Injection Methods in Water Analysis-Recent Developments. Molecules 2022, 27. [Google Scholar] [CrossRef]
- Nellaiappan, S.; Vishnu, N.; Manoj, D.; et al. Electrochemical flow injection analysis platforms for biomedical applications – Progress and prospects. Anal. Biochem. 2025, 700, 115795. [Google Scholar] [CrossRef]
- Claassen, A.; Westerveld, W. The photometric detrmination of Cobalt with nitroso-R-salt. 1948, 37, 720–724. [Google Scholar]
- Amatón, K.V.G.; Couceiro, P.; Fuentes, H.C.; et al. Microanalyser prototype for on-line monitoring of copper(II) ion in mining industrial processes. Sensors (Switzerland) 2019, 19. [Google Scholar] [CrossRef]
- Kruanetr, S.; Liawruangrath, S.; Youngvises, N. A simple and green analytical method for determination of iron based on micro flow analysis. Talanta 2007, 73, 46–53. [Google Scholar] [CrossRef]
- Reshetnyak, E.A.; Ivchenko, N.V.; Nikitina, N.A. Photometric determination of aqueous cobalt(II), nickel(II), copper(II) and iron(III) with 1-nitroso-2-naphthol-3,6-disulfonic acid disodium salt in gelatin films. Cent. Eur. J. Chem. 2012, 10, 1617–1623. [Google Scholar] [CrossRef]
- Kruanetr, S.; Tengjaroenkul, U.; Liawruangrath, B.; Liawruangrath, S. A cleaner and simple spectrophotometric micro-fluidic procedure for copper determination using nitroso-R salt as chromogenic agent. Spectrochim. Acta - Part. A Mol. Biomol. Spectrosc. 2008, 70, 1134–1140. [Google Scholar] [CrossRef] [PubMed]
- Garcia, F.C.; Lachica, G.M. Identificación de paladio utilizando como reactivosal nitroso - R. Estequiometria Del. complejo. ARS Pharm. 1961, 11, 159–166. [Google Scholar]
- Liu, Z.; Wang, W.; Xu, H.; et al. A “naked eye” and ratiometric chemosensor for cobalt(II) based on coumarin platform in aqueous solution. Inorg. Chem. Commun. 2015, 62, 19–23. [Google Scholar] [CrossRef]
- An Kim, P.; Lee, H.; So, H.; Kim, C. A chelated-type colorimetric chemosensor for sensing Co2+ and Cu2+. Inorganica Chim. Acta 2020, 505, 119502. [Google Scholar] [CrossRef]
- Zhou, J.R.; Liu, D.P.; He, Y.; et al. A highly selective colorimetric chemosensor for obalt(ii) ions based on a tripodal amide ligand. Dalt Trans. 2014, 43, 11579–11586. [Google Scholar] [CrossRef]
- Ismail, H.; Ahmad, M.N.; Normaya, E. A highly sensitive and selective thiosemicarbazone chemosensor for detection of Co2+ in aqueous environments using RSM and TD/DFT approaches. Sci. Rep. 2021, 11, 1–12. [Google Scholar] [CrossRef]
- Zhang, S.; Zhao, M.; Zhu, W.; et al. A highly sensitive, selective ratiometric fluorescent probe for cobalt(ii) and its applications for biological imaging. Dalt Trans. 2015, 44, 9740–9743. [Google Scholar] [CrossRef] [PubMed]
- Zhu, M.; Wang, W.; Liu, J.; et al. A novel pyrene-based fluorescent probe for the rapid and efficient detection of Co2+ in HeLa cells and natural water samples. J. Mol. Liq. 2020, 303, 112680. [Google Scholar] [CrossRef]
- Shipmen, W.H.; Foti, S.C.; Simon, W. Nature and Elimination of Interferences in the Determination of Cobalt with Nitroso-R-Salt. Anal. Chem. 1955, 27, 1240–1245. [Google Scholar] [CrossRef]
- Puri, B.K.; Balani, S. Preconcentration of iron(III), cobalt(II) and copper(II) nitroso-R complexes on tetradecyldimethylbenzylammonium iodide-naphthalene adsorbent. Talanta 1995, 42, 337–344. [Google Scholar] [CrossRef]
- Losev, V.N.; Didukh, S.L.; Mukhina, A.N.; Trofimchuk, A.K. Using silica modified by poly(hexamethylene guanidine) and nitroso-R-salt for the preconcentration and determination of cobalt. J. Anal. Chem. 2015, 70, 677–684. [Google Scholar] [CrossRef]
- Adam, J.; Přibil, R. Extraction with long-chain amines-V Calorimetric determination of cobalt with nitroso-R salt (Received. Talanta 2011, 18, 733–737. [Google Scholar] [CrossRef] [PubMed]
- Ben Youssef Daoui, M. Caracterització de bateries d’ió liti per a la mobilitat elèctrica: Comparació de la composició amb altres tipus de bateries. UPC, Escola Politècnica Superior d’Enginyeria de Manresa, Departament d’Enginyeria Minera, Industrial i TIC. 2024. [Google Scholar]
- Morell Llorens, J. Optimització del procés de recuperació de metalls en matèries amb mobilitat elèctrica. UPC, Escola Politècnica Superior d’Enginyeria de Manresa, Departament d’Enginyeria Minera, Industrial i TIC. 2022. [Google Scholar]
- Dan, G.I. Caracterización y separación de componentes de baterías Li-Ion, por encima de 500 µm. UPC, Escola Politècnica Superior d’Enginyeria de Manresa, Departament d’Enginyeria Minera, Industrial i TIC. 2023. [Google Scholar]
- Galera, I. Estudi Per a La Conversió a Continu Del Procés De Biolixiviació a Escala Pilot. EPSEM. 2018. [Google Scholar]
- Griffing, M.; Mellon, M.G. Colorimetric Determination of Iron with Nitroso-R-Salt. Anal. Chem. 1947, 19, 1014–1016. [Google Scholar] [CrossRef]
- Horwitz, W. Evaluation of analytical methods used for regulation of foods and drugs. Anal. Chem. 1982, 54, 67–76. [Google Scholar] [CrossRef]
- McNaught, A.D.; Wilkinson, A. Compendium of Chemical Terminology, 2nd ed.; Blackwell Science: Oxford, 1997. [Google Scholar]
- Eldawy, M.A.; Tawfik, A.S.; Elshabouri, S.R. Rapid and sensitive colorimetric determination of cobalt(II). J. Pharm. Sci. 1976, 65, 664–666. [Google Scholar] [CrossRef]
- Shipman, W.H.; Lai, J.R. General photometric microdetermination of cobalt with nitroso-R salt. Anal. Chem. 1956, 28, 1151–1152. [Google Scholar] [CrossRef]
- Cuní Iglesias, M. Posada a punt i validació d’un mètode espectrofotomètric per la determinació de cobalt. UPC, Escola Politècnica Superior d’Enginyeria de Manresa, Departament d’Enginyeria Minera, Industrial i TIC. 2023. [Google Scholar]

Table 1.
Combinations of reactants addition sequences tested in the presence of Cu(II) in the determination of Co(II). Where H is hydroxylamine, N is NRS, E is EDTA and B is KF in acetate-acetic acid buffer.
Table 1.
Combinations of reactants addition sequences tested in the presence of Cu(II) in the determination of Co(II). Where H is hydroxylamine, N is NRS, E is EDTA and B is KF in acetate-acetic acid buffer.
| Position of reagent | ||||
|---|---|---|---|---|
| Sequence number | 1st | 2nd | 3rd | 4th |
| 1 | H | N | B | E |
| 2 | H | N | E | B |
| 3 | H | B | N | E |
| 7 | N | H | B | E |
| 8 | N | H | E | B |
| 9 | N | B | H | E |
| 10 | N | B | E | H |
| 11 | N | E | H | B |
| 12 | N | E | B | H |
| 13 | B | H | N | E |
| 15 | B | N | H | E |
| 16 | B | N | E | H |
Table 2.
Combinations of reactant addition sequences tested in the presence of Fe(III) in the determination of Co(II). Where H is hydroxylamine, N is NRS, E is EDTA and B is KF in acetate-acetic acid buffer.
Table 2.
Combinations of reactant addition sequences tested in the presence of Fe(III) in the determination of Co(II). Where H is hydroxylamine, N is NRS, E is EDTA and B is KF in acetate-acetic acid buffer.
| Position of reagent | ||||
|---|---|---|---|---|
| Sequence number | 1st | 2nd | 3rd | 4th |
| 1 | H | N | B | E |
| 2 | H | N | E | B |
| 8 | N | H | E | B |
| 9 | N | B | H | E |
| 10 | N | B | E | H |
| 11 | N | E | H | B |
| 12 | N | E | B | H |
| 13 | B | H | N | E |
| 15 | B | N | H | E |
| 16 | B | N | E | H |
Table 3.
All tested concentrations of metal interferents in bioleachate samples using the optimized experimental conditions. The concentrations are expressed in mg L-1.
Table 3.
All tested concentrations of metal interferents in bioleachate samples using the optimized experimental conditions. The concentrations are expressed in mg L-1.
| Metal | Low concentration | Medium concentration | High concentration |
|---|---|---|---|
| Mn(II) | 5 | 10 | 20 |
| Al(III) | 20 | 30 | 40 |
| Cu(II) | 40 | 50 | 60 |
| Ni(II) | 60 | 70 | 80 |
| Fe(III) | 10 | 20 | 30 |
| Fe(II) | 10 | 20 | 30 |
Table 4.
Absorbance determined for the combinations tested in the addition of the order of the reagents in the case of 40 mg L-1 Cu(II) as interference and 1.6 mg L-1 Co(II). Where H is hydroxylamine, N is NRS, E is EDTA and B is KF in acetate-acetic acid buffer. Experimental uncertainty is the standard deviation (n=3).
| Position of reagent | Absorbance (λ= 525nm) | Error | ||||||
|---|---|---|---|---|---|---|---|---|
| Sequence number | 1st | 2nd | 3rd | 4th | Without Cu(II) | With Cu(II) | Absolute error | Relative error |
| 1 | H | N | B | E | 0.383 ± 0.008 | 0.301 ± 0.019 | 0.082 | 21.4% |
| 2 | H | N | E | B | 0.30 ± 0.03 | 0.280 ± 0.008 | 0.016 | 5.3% |
| 3 | H | B | N | E | 0.371 ± 0.016 | 0.301 ± 0.017 | 0.071 | 19.1% |
| 7 | N | H | B | E | 0.35 ± 0.07 | 0.413 ± 0.019 | 0.062 | 17.7% |
| 8 | N | H | E | B | 0.4144 ± 0.0025 | 0.420 ± 0.012 | 0.006 | 1.4% |
| 9 | N | B | H | E | 0.42 ± 0.03 | 0.45 ± 0.10 | 0.028 | 6.7% |
| 10 | N | B | E | H | 0.4220 ± 0.0021 | 0.428 ± 0.003 | 0.006 | 1.4% |
| 11 | N | E | H | B | 0.398 ± 0.019 | 0.41 ± 0.03 | 0.013 | 3.3% |
| 12 | N | E | B | H | 0.41 ± 0.03 | 0.49 ± 0.06 | 0.078 | 19.0% |
| 13 | B | H | N | E | 0.371 ± 0.007 | 0.29 ± 0.04 | 0.078 | 21.0% |
| 15 | B | N | H | E | 0.40 ± 0.03 | 0.38 ± 0.08 | 0.022 | 5.5% |
| 16 | B | N | E | H | 0.37 ± 0.06 | 0.420 ± 0.017 | 0.048 | 13.0% |
Table 5.
Absorbance determined for the combinations tested in the addition of the reagents in the case of 16 mg L-1 Fe(III). Where H is hydroxylamine, N is NRS, E is EDTA and B is KF in acetate-acetic acid buffer. Experimental uncertainty is the standard deviation (n=3).
Table 5.
Absorbance determined for the combinations tested in the addition of the reagents in the case of 16 mg L-1 Fe(III). Where H is hydroxylamine, N is NRS, E is EDTA and B is KF in acetate-acetic acid buffer. Experimental uncertainty is the standard deviation (n=3).
| Position of reagent | Absorbance (λ= 525nm) | Error | ||||||
|---|---|---|---|---|---|---|---|---|
| Sequence number | 1st | 2nd | 3rd | 4th | Without Fe(III) | With Fe(III) | Absolute error | Relative error |
| 1 | H | N | B | E | 0.3751 ± 0.0018 | 1.082 ± 0.004 | 0.707 | 188.5% |
| 2 | H | N | E | B | 0.209 ± 0.008 | 0.8414 ± 0.007 | 0.6324 | 302.6% |
| 8 | N | H | E | B | 0.408 ± 0.020 | 1.28 ± 0.06 | 0.868 | 212.7% |
| 9 | N | B | H | E | 0.472 ± 0.019 | 1.23 ± 0.09 | 0.758 | 160.6% |
| 10 | N | B | E | H | 0.427 ± 0.006 | 1.20 ± 0.07 | 0.77 | 180.3% |
| 11 | N | E | H | B | 0.416 ± 0.022 | 1.14 ± 0.10 | 0.729 | 175.2% |
| 12 | N | E | B | H | 0.425 ± 0.020 | 1.081 ± 0.004 | 0.655 | 154.1% |
| 13 | B | H | N | E | 0.3831 ± 0.0020 | 0.430 ± 0.022 | 0.047 | 12.3% |
| 15 | B | N | H | E | 0.413 ± 0.008 | 0.494 ± 0.011 | 0.081 | 19.6% |
| 16 | B | N | E | H | 0.44 ± 0.03 | 0.521 ± 0.006 | 0.08 | 18.2% |
Table 6.
Absorbance of Fe(II)-NRS adding different volumes of KF in acetate-acetic acid buffer; [Fe(II)] is 20 mg L-1.
Table 6.
Absorbance of Fe(II)-NRS adding different volumes of KF in acetate-acetic acid buffer; [Fe(II)] is 20 mg L-1.
| 550 nm | 710 nm | |||||
|---|---|---|---|---|---|---|
| Volume | Average | SD | CV (%) | Average | SD | CV (%) |
| 4 mL | 0.282 | 0.012 | 4.31% | 2.004 | 0.048 | 2.37% |
| 5 mL | 0.110 | 0.005 | 4.19% | 0.36 | 0.03 | 7.10% |
| 6 mL | 0.076 | 0.021 | 27.59% | 0.131 | 0.052 | 39.64% |
| 7 mL | 0.096 | 0.024 | 25.14% | 0.30 | 0.19 | 65.00% |
Table 7.
Repeatability results for the method.
| Concentration (mg L-1) | Average | SD | CV |
|---|---|---|---|
| 2.5 | 0.328 | 0.009 | 2.65% |
| 10 | 1.64 | 0.03 | 1.70% |
Table 8.
Comparison of Co(II) analysis in real samples between proposed method in UV-vis spectrophotometry and reference method atomic absorption spectrometry. Experimental uncertainty is standard deviation (n=3).
Table 8.
Comparison of Co(II) analysis in real samples between proposed method in UV-vis spectrophotometry and reference method atomic absorption spectrometry. Experimental uncertainty is standard deviation (n=3).
| Sample | Co(II) added (mg L-1) | Co(II) found (mg L-1) | |
|---|---|---|---|
| UV-vis 550 nm | Atomic absorption spectroscopy | ||
| Bioleached PCBs | 2 | 2.041 ± 0.019 | 2.07 ± 0.08 |
| 3.5 | 3.50 ± 0.03 | 3.70 ± 0.18 | |
| 6 | 6.11 ± 0.04 | 6.095 ± 0.025 | |
| Acidithiobacillus ferrooxidans medium |
3 | 2.96 ± 0.03 | 3.10 ± 0.13 |
| 4 | 3.981 ± 0.013 | 4.09 ± 0.04 | |
| 7 | 6.66 ± 0.06 | 6.66 ± 0.07 | |
| Water from the Parc de l’Agulla reservoir in Manresa |
1.5 | 1.62 ± 0.07 | 1.66 ± 0.03 |
| 8 | 7.476 ± 0.019 | 7.51 ± 0.07 | |
| 9 | 8.54 ± 0.03 | 8.39 ± 0.12 | |
| Bioleachate from bicycle and scooter batteries |
_ | 0.818 ± 0.010 | 0.777 ± 0.018 |
Table 9.
Accuracy results for the method. Experimental error is expressed as standard deviation.
| Dilution ration | Co(II) in sample (mg L-1) | Co(II) in spiked sample (mg L-1) | RV(%) |
|---|---|---|---|
| 1:450 | 0.71 ± 0.03 | 6.19 ± 0.14 | 99.55% |
| 1:360 | 0.86 ± 0.03 | 6.28 ± 0.08 | 98.69% |
| 1:270 | 1.262 ± 0.009 | 6.76 ± 0.06 | 99.87% |
Disclaimer/Publisher’s Note: The statements, opinions and data contained in all publications are solely those of the individual author(s) and contributor(s) and not of MDPI and/or the editor(s). MDPI and/or the editor(s) disclaim responsibility for any injury to people or property resulting from any ideas, methods, instructions or products referred to in the content. |
© 2025 by the authors. Licensee MDPI, Basel, Switzerland. This article is an open access article distributed under the terms and conditions of the Creative Commons Attribution (CC BY) license (http://creativecommons.org/licenses/by/4.0/).
Copyright: This open access article is published under a Creative Commons CC BY 4.0 license, which permit the free download, distribution, and reuse, provided that the author and preprint are cited in any reuse.


