
Submitted:
10 June 2025
Posted:
11 June 2025
You are already at the latest version
Abstract
Effective conservation and management of the endangered tufted deer (Elaphodus cephalophus) necessitate genetic diversity research. This study systematically assessed the genetic diversity, population structure, gene flow, and demographic history of three representative tufted deer populations in Chongqing, China (Jinfo Mountain, Simian Mountain, Northeastern Mountainous area) using combined mitochondrial Cytochrome b (Cyt b) gene and D-loop region analysis. Our findings reveal the D-loop region demonstrates significantly higher genetic variability and a faster mutation rate than Cyt b. The Simian Mountain population consistently displayed the highest haplotype diversity, suggesting its role as a genetic diversity hotspot and crucial hub for regional gene flow. Haplotype network analysis showed frequent gene exchange between Simian Mountain and Northeastern Mountainous populations, while the Jinfo Mountain population exhibits significant genetic isolation, likely due to unique topographical features. Historical demographic analyses suggest a likely slow expansion, with evidence for recent population expansion despite concurrent regional genetic isolation. This study underscores the critical importance of multi-scale genetic markers for deciphering species’ evolutionary histories and provides essential groundwork for tufted deer conservation. We recommend prioritizing Simian Mountain conservation, enhancing Jinfo Mountain genetic management, and maintaining regional population connectivity through ecological corridors and continuous monitoring.
Keywords:
tufted deer
; mitochondrial DNA
; genetic diversity
; Chongqing
1. Introduction
The tufted deer (Elaphodus cephalophus), the sole species within the genus Elaphodus of the Cervidae family, is classified as Near Threatened (NT) by the International Union for Conservation of Nature (IUCN) Red List of Threatened Species [1]. Characterized by its yellowish-brown coat, prominent brown frontal tuft, and short, unbranched antlers [2]. the tufted deer possesses unique morphological features that underscore its phylogenetic significance. Endemic to Southeast Asia, this species primarily inhabits mountainous forests in southeastern China [1,2]. Chongqing, situated on the southeastern rim of the Sichuan Basin, features a landscape dominated by mountains and hills [3]. This distinctive environment provides an ideal habitat for the tufted deer, facilitating the establishment of stable populations within the region.
The unique genetic background of tufted deer makes the study of its genetic diversity highly valuable for developing conservation strategies, understanding population differentiation, and exploring adaptive evolution. Analyzing microsatellite markers, mitochondrial DNA, or whole-genome data allows for the assessment of population genetic structure, demographic history, and environmental adaptability [4,5,6,7]. This information is crucial for comprehending current population status and formulating precise conservation strategies aimed at promoting gene flow and preserving genetic resources. From an ecological and evolutionary perspective, genetic diversity reflects a species’ health, adaptation mechanisms, and evolutionary history, helping to decipher the resilience of tufted deer to environmental changes [8,9,10] Furthermore, high levels of genetic diversity enhance a species’ environmental adaptability and disease resistance, providing vital indicators for species classification and ecosystem health monitoring [11,12,13].
Mitochondrial DNA (mtDNA) exists in multiple copies per cell, enabling its efficient amplification via Polymerase Chain Reaction (PCR) even from samples with low DNA concentration or significant degradation [14]. Furthermore, mtDNA is predominantly maternally inherited and lacks sexual recombination, conferring unique advantages for investigating population genetic structure, phylogeny, and demographic history [9,15,16]. Specifically, the cytochrome b (Cyt b) gene, a protein-coding region, evolves at a moderate rate [9]. This allows it to retain sufficient variability for detecting genetic differentiation and long-term divergence among populations while remaining relatively conserved [17]. Conversely, the D-loop region, a highly variable non-coding control region, is instrumental in revealing fine-scale genetic structure, haplotype distribution, and recent population dynamics within populations [18,19,20]. The combined analysis of these two markers leverages their complementary strengths, enhancing the reliability of genetic diversity assessments and yielding a more comprehensive and accurate understanding of population history, structure, and dynamic changes [21,22,23].
Despite the tufted deer being an endemic Southeast Asian species with a widespread distribution and unique genetic background, systematic research into its genetic diversity and population structure remains limited. A 2016 study utilized mtDNA control region (CR) and nuclear microsatellite markers to analyze the genetic structure and gene flow between two tufted deer populations in Bashan and Wuling Mountains, separated by the natural barrier of the Yangtze River [24]. However, the overall genetic landscape of the species has yet to be fully elucidated. This study, for the first time, integrates mtDNA Cyt b gene and D-loop region analyses to systematically assess the genetic diversity, population structure, gene flow, and evolutionary dynamics of tufted deer populations in Chongqing, China, thereby addressing a critical research gap and providing a scientific basis for species conservation and management.
2. Materials and Methods
2.1. Sample Collection and DNA Extraction
To minimize disturbance to the target species, this study employed a non-invasive fecal sampling approach to obtain genetic material from tufted deer. Host DNA was extracted from collected tufted deer fecal samples [25,26,27,28]. Between 2022 and 2023, a total of 46 tufted deer fecal samples were randomly collected from distinct forest regions within Chongqing, China: Jinfo Mountain National Nature Reserve (JF, n=13); Simian Mountain National Nature Reserve (SM, n=21); and the northeastern mountainous areas of Chongqing (NEM, n=12) (Figure 1). During sampling, personnel wore sterile disposable gloves, and collected samples were immediately stored at -80°C.
Host DNA was extracted from fecal samples using the QIAamp DNA Stool Mini Kit. Subsequently, DNA concentration and purity were measured with a micro-volume spectrophotometer (AuSine/Nano-400A) before storage at -20°C for later use.
2.2. PCR Amplification, Gene Cloning, and Sequencing
For the amplification of mtDNA, Polymerase Chain Reaction (PCR) was employed with specific primer pairs. The forward primer for the Cyt b gene was 5’-CAAACGGAGCATCAATGTT-3’, and the reverse primer was 5’-TGTCTCGTGGAGAAAGAGT-3’. Additionally, the D-loop region was targeted with the forward primer 5’-TAAGTCAAATCAGTCCTCGTCAA-3’ and the reverse primer 5’-GTTAAGTCCAGCTACAATTCATG-3’. PCR reactions were performed using TIANGEN’s 2× Taq PCR MasterMix II. The thermocycling program consisted of an initial denaturation at 94°C for 3 minutes, followed by 35 cycles of 94°C for 30 seconds (denaturation), 57°C for 30 seconds (annealing), and 72°C for 1 minute (extension). A final extension step was carried out at 72°C for 5 minutes.
PCR products were purified using the Biospin Gel Extraction Kit and subsequently cloned into the pTOPO-TA/Blunt Cloning Kit (Aidlab). Individual colonies were inoculated into 400 μl of Luria-Bertani (LB) medium containing 100 μg/ml ampicillin (Amp) and incubated at 37°C with shaking for 2 hours. Colony PCR was then performed to identify positive clones, and sent to Bioscience Company for sequencing(Changsha, China).
2.3. Data Analysis
After obtaining sequencing results, bases were manually verified against electropherograms to ensure accuracy. Sequences were then compared with entries in NCBI BLAST [29] to confirm their derivation from tufted deer. MEGA11 software was used for multiple sequence alignment and trimming, as well as for calculating haplotype genetic distances and nucleotide composition [30]. To analyze population genetic structure, DnaSP6 was employed to compute nucleotide diversity (Pi), number of haplotypes (H), haplotype diversity (Hd), and average nucleotide differences (K), along with mismatch distribution analysis [31]. Analysis of molecular variance (AMOVA) and genetic differentiation indices (Fst) were obtained using Arlequin 3.5 [32], Neutrality tests, including Tajima’s D and Fu’s FS, were also conducted. Gene flow (Nm was calculated using the formula Nm = 0.25(1 − Fst)/ Fst [33]. A median-joining haplotype network was constructed with PopART 1.7, and neighbor-joining (NJ) trees were generated using MEGA11 to visualize relationships among haplotypes [34,35].
3. Results
This section may be divided by subheadings. It should provide a concise and precise description of the experimental results, their interpretation, as well as the experimental conclusions that can be drawn.
3.1. Sequence Characteristics and Genetic Diversity
Mitochondrial DNA analysis of three muntjac populations (JF/SM/NEM) from Chongqing, China, revealed distinct sequence characteristics. The Cyt b gene exhibited a notable AT bias (AT = 58.4%, GC = 41.6%) (Table 1). In contrast, the D-loop region displayed a more balanced nucleotide composition (AT = 51.7%, GC = 48.3%) (Table 1). This relatively higher GC content in the non-coding D-loop region suggests potential differential selective pressures, indicating distinct adaptive evolutionary patterns. The AT-rich patterns observed across both sequences align with the typical evolutionary trajectory of mammalian mitochondrial DNA, consistent with established mitochondrial gene characteristics.
Genetic variation in the D-loop region was markedly higher than in the Cyt b gene, as evidenced by three key indices: (1) a greater number of polymorphic sites (D-loop S=43 vs. Cyt b S=17); (2) higher nucleotide diversity (π=0.02127 vs. 0.01424); and (3) richer haplotype diversity (Hd=0.97295 vs. 0.96522) (Table 2). These results are consistent with the inherently high variability of the D-loop, indicating that this region is especially sensitive to recent mutational events and can effectively reflect dynamic evolutionary processes such as population expansion and gene flow.
Population-specific analyses revealed the following patterns: (1) For the Cyt b gene, the NEM population exhibited the highest genetic diversity (Hd=0.96970; π=0.01602), suggesting a historically large effective population size or greater demographic stability; (2) For the D-loop region, the SM population displayed the highest diversity (Hd=0.97143; π=0.01982), implying either more extensive gene flow or enhanced habitat connectivity; and (3) The JF population showed the lowest diversity at both markers (Cyt b Hd=0.87179; D-loop Hd=0.91026), which may indicate genetic isolation or historical bottleneck events.
3.2. Haplotype Distribution and Genetic Structure Analysis
Analysis of the Cyt b gene region revealed 25 distinct haplotypes (JF=6, SM=12, NEM=10), with Hap_11 identified as the dominant haplotype. In contrast, the D-loop region exhibited a higher number of haplotypes (30 in total, JF=9, SM=16, NEM=10), where Hap_4 emerged as a predominant haplotype shared across populations (Table 3). Notably, the SM population demonstrated the highest haplotype diversity in both genetic markers, indicating substantial genetic variation within this group. This high diversity not only suggests a potentially enhanced adaptive capacity but also implies a unique evolutionary history or ecological niche advantage for the SM population.
Mitochondrial haplotype networks (Figure 2) and Neighbor-Joining (NJ) phylogenetic analyses (Figure 3) collectively elucidated the complex and rich genetic structure and evolutionary relationships of tufted deer populations. Within the Cyt b network, two high-frequency central haplotypes (H13/H14) were broadly shared between the SM and NEM populations, suggesting historical gene flow. The D-loop network, however, displayed greater diversity (30 haplotypes) and a multi-centered structure. Specifically, the SM population occupied a pivotal hub position within this network, connecting various haplotypes and populations, thereby acting as a crucial nexus for genetic exchange and migration. In the NJ tree analysis, both Cyt b and D-loop regions presented a multi-branching structure, without clear evidence of region-exclusive haplotypes, indicating frequent inter-regional migration and gene flow. While dominant haplotypes (Clod I) were widely distributed across populations, some regions still exhibited strong haplotype specificity, reflecting the influence of distinct evolutionary histories or geographical isolation.
3.3. Genetic Differentiation and Gene Flow
The Mitochondrial Cyt b gene and D-loop region consistently indicated the highest genetic differentiation for the JF population relative to the SM and NEM populations (Cyt b Fst: JF-SM=0.27405, JF-NEM=0.25385; D-loop Fst: JF-SM=0.23394, JF-NEM=0.26201). This pronounced differentiation suggests significant geographical isolation affecting the JF population. In contrast, genetic differentiation between the SM and NEM populations was notably lower (Cyt b Fst =0.09604; D-loop Fst =0.06227), implying higher genetic connectivity between these two groups (Table 4 and Table 5).
Gene flow (Nm) analyses showed notable disparities between the two markers. The D-loop region consistently detected higher gene flow intensities compared to the Cyt b region, particularly between the SM and NEM populations (D-loop Nm =3.76494 vs. Cyt b Nm =2.35307). This discrepancy reflects the D-loop’s greater sensitivity to more recent gene exchange events. Intriguingly, the SM population appears to act as a gene flow “hub,” exhibiting a noticeably higher unidirectional gene flow towards the JF population (Cyt b Nm =0.66218; D-loop Nm=0.81883) than in the reverse direction. This asymmetrical gene flow pattern may be attributed to the central geographical location of the SM population or its potentially larger effective population size.
3.4. Neutrality Tests and Demographic History
Mitochondrial DNA analyses of three tufted deer populations (JF=13, SM=21, NEM=12) in the Chongqing region revealed distinct demographic histories across different temporal scales (Table 6).
Analyses based on the Cyt b gene consistently showed positive Tajima’s D values across all populations (JF=0.24882, p=0.638; SM=0.75692, p=0.780; NEM=0.84804, p=0.841). However, only the NEM population exhibited a significantly negative Fu’s FS value (-3.40205, p=0.036). Coupled with a broad, unimodal mismatch distribution (peak at 5-10 nucleotide differences, maximum value 0.15)(Figure 4, a), these findings suggest that all populations may have experienced a slow expansion following late Pleistocene climate fluctuations and have since maintained relatively stable effective population sizes. The genetic signal within the NEM population appears more complex, where the disparity between Tajima’s D (positive) and Fu’s FS (negative) values might indicate substructure driven by complex topography.
In contrast, the D-loop region revealed more recent demographic dynamics. The SM population exhibited a highly significant negative Fu’s FS value (-5.73756, p=0.004), while the JF population, although not statistically significant (p=0.071), also showed indications of expansion (Fu’s FS = -2.55315). These characteristics, combined with a unimodal mismatch distribution (peak at 5 differences, maximum value 0.12)(Figure 4, b), strongly support a rapid population expansion during the mid-Holocene (approximately 3,000-5,000 years ago). This expansion was likely influenced by improved climatic conditions and habitat expansion during that period. Concurrently, the positive Tajima’s D value for the NEM population (0.89333, p=0.863) suggests either relative genetic stability or the persistence of cryptic substructure. The divergence in results between the two gene regions (Cyt b reflecting ancient history, D-loop reflecting recent events) underscores the critical importance of utilizing multi-scale genetic markers for comprehensive studies of species’ demographic histories.
4. Discussion
Genetic diversity analysis of tufted deer populations in Chongqing revealed significant inter-population differences. The mitochondrial Cyt b gene region exhibited a notable AT bias (58.4%, T=30.7%), consistent with the typical characteristics of mammalian mitochondrial coding genes [36,37,38]. This bias may reflect evolutionary pressures related to energy metabolism. In contrast, the D-loop region displayed a more balanced nucleotide composition (AT=51.7%, GC=48.3%), indicating less base preference in this non-coding region, potentially influenced by replication or transcriptional regulation. Comparatively, the D-loop region showed markedly higher genetic diversity than Cyt b across several metrics: number of polymorphic sites (S=43 vs. 17), nucleotide diversity (π=0.02127 vs. 0.01424), and haplotype diversity (Hd=0.97295 vs. 0.96522). This aligns with the D-loop’s known rapid mutation rate and its higher sensitivity in detecting recent population changes [17,18]. Among the studied populations, the NEM population exhibited higher Cyt b diversity (Hd=0.96970, π=0.01602). This implies that the NEM population either experienced considerable historical expansion or maintained a larger effective population size [39,40]. Conversely, the SM population showed the highest D-loop diversity (Hd=0.97143, π=0.01982), which may indicate stronger gene flow and better habitat connectivity within this region [41]. The significantly lower diversity observed in the JF population (Cyt b Hd=0.87179; D-loop Hd=0.91026) is potentially linked to a historical bottleneck event [42].
Mitochondrial haplotype network analysis (Figure 2) and Neighbor-Joining (NJ) tree analysis (Figure 3) collectively illustrate the complex and diverse genetic structure and evolutionary history of tufted deer populations. Within the Cyt b network, two high-frequency central haplotypes (H13 and H14) were broadly shared by the SM and NEM populations. This strongly indicates historical gene flow between these two populations. Such shared central haplotypes are typically characteristic of recent population expansion or remnants of historically larger populations. In contrast, the D-loop network exhibited higher diversity, comprising 30 haplotypes, and a more intricate multi-centric structure [43]. Notably, the SM population displayed the richest haplotype diversity across both mitochondrial markers, possessing the highest number of unique haplotypes and reflecting the greatest genetic variability within the entire dataset. This not only suggests a potentially stronger adaptive capacity for the SM population but also implies a unique evolutionary history or ecological advantage [44], such as serving as a diffusion center or a glacial refugium [45]. The analysis of the NJ tree for both the Cyt b and D-loop regions demonstrated the presence of multiple branches, with no distinct regional-specific haplotype clusters. This suggests frequent migration and gene flow among regions, leading to genetic admixture across populations. Notably, both Cyt b and D-loop regions contained low-frequency, region-specific haplotypes. This may reflect the influence of geographical isolation or local adaptation during historical evolution in different areas, allowing certain genetic lineages to evolve relatively independently. Overall, haplotype analysis revealed a complex genetic structure in tufted deer populations, demonstrating both extensive gene flow and some degree of regional specificity, indicating potentially intricate migration and dispersal pathways.
Population genetic structure analysis revealed persistently high gene flow between the SM and NEM populations (Nm > 2.35). This suggests that the Yangtze River does not present an absolute barrier to isolation for these two habitats, a finding consistent with Sun et al. (2016), who also noted that the Yangtze River is not an insurmountable barrier for gene exchange in certain species [24]. In contrast, the JF population, sampled from the Jinfo Mountain National Nature Reserve, exhibited significant genetic isolation (Fst > 0.23). This strongly indicates substantial geographical isolation surrounding this reserve. The unique and steep topography of Jinfo Mountain likely restricts gene flow between this population and other groups [46]. Notably, the D-loop region detected stronger recent gene flow, approximately 60% higher than that observed in Cyt b. This suggests that while Jinfo Mountain National Nature Reserve provides habitat protection, ongoing habitat fragmentation due to surrounding human activities may still exacerbate genetic isolation.
The evolutionary trajectory of tufted deer populations exhibits multi-scalar complexity. Overall, the consistently positive Tajima’s D values suggest that populations may have experienced a period of slow or stable expansion [47,48]. Specifically, the unimodal mismatch distribution (peak at 5 differences) and negative Fu’s Fs values for the mitochondrial D-loop region, particularly the significantly negative Fu’s Fs value for the NEM population (–3.40) and the SM population (–5.73), strongly support a hypothesis of recent population expansion or recovery. This expansion might be attributable to favorable conditions arising from climate change or other environmental factors, which facilitated rapid population growth and an increase in genetic diversity [49,50,51,52]. However, at a regional scale, significant genetic differentiation and restricted gene flow were observed among different populations, indicating a degree of geographical or historical isolation. Notably, the SM and NEM populations maintained relatively strong gene flow, while the JF population remained comparatively isolated.
Based on genetic analyses of the three tufted deer populations (SM, JF, NEM) in Chongqing, the following conservation recommendations are proposed: (1) Prioritize protection of the Simian Mountain (SM) population, which exhibits the highest genetic diversity among the regional groups. (2) For the Jinfo Mountain (JF) population, characterized by significant genetic isolation (Fst > 0.23) and lower haplotype diversity (Hd = 0.87179–0.91026), measures such as establishing ecological corridors, implementing regular genetic monitoring, and pursuing assisted migration should be adopted to promote gene flow. (3) Develop a long-term genetic monitoring and research framework, incorporating nuclear genome analysis to validate mitochondrial DNA findings and track temporal changes. These strategies aim to enhance population connectivity and conserve genetic diversity, ensuring sustainable management of tufted deer in Chongqing.
5. Conclusions
This research comprehensively evaluated the genetic diversity and population structure of tufted deer in the Chongqing area by integrating analyses of the mitochondrial Cyt b gene and D-loop regions. Our findings reveal rich genetic variation and diverse migration patterns within these populations. High genetic diversity is predominantly concentrated in the Simian Mountain area, indicating its crucial role in maintaining the species’ genetic resources. Conversely, the observed genetic isolation of the Jinfo population highlights the need for enhanced connectivity conservation. Overall, the presence of both isolation and exchange among different populations poses varying pressures on their long-term survival. Therefore, we recommend implementing targeted regional protection, ecological corridor construction, and continuous monitoring strategies to ensure the genetic diversity and ecological stability of tufted deer.
Supplementary Materials
The following supporting information can be downloaded at the website of this paper posted on Preprints.org.: Figure S1: PCR electrophoresis results of tufted deer Cyt b gene and D-loop region.s; Figure S2: Electrophoresis results of gel-extracted PCR products from the tufted deer Cyt b gene and D-loop region; Figure S3: Colony PCR electrophoresis results of the tufted deer Cyt b gene and D-loop region.
Author Contributions
Conceptualization, X.C. and J.P.; Methodology, F.W.; Software, F.W.; Validation, Y.X.; Formal Analysis, F.W.; Investigation, C.Y. and Q.X.; Resources, C.Y.; Writing – Original Draft Preparation, F.W.; Writing – Review & Editing, X.C., J.P., C.Y., Y.X., Q.X; Visualization, Y.X. and Q.X.; Supervision, X.C.; Project Administration, J.P.; Funding Acquisition, X.C. All authors have read and agreed to the published version of the manuscript.
Funding
This research was supported by the People’s Republic of China Wildlife Protection Program of the Central Forestry Reform and Development Fund of the State Forestry Administration, and the National Natural Science Foundation of China (No. 31470570).
Institutional Review Board Statement
Not applicable.
Informed Consent Statement
Not applicable.
Data Availability Statement
The original contributions presented in this study are included in this article. Further inquiries can be directed to the corresponding author(s).
Acknowledgments
We gratefully acknowledge the editors and anonymous reviewers for their insightful comments and constructive suggestions; we extend our special gratitude to the Chongqing Municipal Forestry Bureau, along with their subordinate district/county-level forestry bureaus and government staff, for their indispensable administrative support, guidance, and valuable insights during the field investigations. We are particularly indebted to the professors, fellow researchers, and local villagers who provided critical assistance throughout the fieldwork.
Conflicts of Interest
The authors declare no conflicts of interest.
References
- IUCN Elaphodus Cephalophus: Harris, R.B. & Jiang, Z.: The IUCN Red List of Threatened Species 2015: E.T7112A22159620 2014.
- Leslie, D.M.; Lee, D.N.; Dolman, R.W. Elaphodus Cephalophus (Artiodactyla: Cervidae). Mammalian Species 2013, 904, 80–91. [Google Scholar] [CrossRef]
- Liu, X.; Ming, Y.; Liu, Y.; Yue, W.; Han, G. Influences of Landform and Urban Form Factors on Urban Heat Island: Comparative Case Study between Chengdu and Chongqing. Sci Total Environ 2022, 820, 153395. [Google Scholar] [CrossRef] [PubMed]
- Golosova, O.S.; Kholodova, M.V.; Volodin, I.A.; Seryodkin, I.V.; Okhlopkov, I.M.; Argunov, A.V.; Sipko, T.P. Genetic Diversity of the Eastern Subspecies of Red Deer (Cervus Elaphus) in Russia Revealed by mtDNA and Microsatellite Polymorphism. Biol Bull Rev 2023, 13, 482–494. [Google Scholar] [CrossRef]
- Machmoum, M.; Boujenane, I.; Azelhak, R.; Badaoui, B.; Petit, D.; Piro, M. Genetic Diversity and Population Structure of Arabian Horse Populations Using Microsatellite Markers. J Equine Vet Sci 2020, 93, 103200. [Google Scholar] [CrossRef]
- Kilwanila, S.I.; Lyimo, C.M.; Rija, A.A. Mitochondrial Genetic Diversity of the Greater Cane Rat (Thryonomys Swinderianus) Populations from the Eastern Arc Mountains Ecosystem, Tanzania. Mol Biol Rep 2022, 49, 10431–10442. [Google Scholar] [CrossRef]
- Shi, H.; Li, T.; Su, M.; Wang, H.; Li, Q.; Lang, X.; Ma, Y. Whole Genome Sequencing Revealed Genetic Diversity, Population Structure, and Selective Signature of Panou Tibetan Sheep. BMC Genomics 2023, 24, 50. [Google Scholar] [CrossRef]
- Liu, H.; Han, T.; Liu, W.; Xu, G.; Zheng, K.; Xiao, F. Epidemiological Characteristics and Genetic Diversity of Bartonella Species in Rodents from Southeastern China. Zoonoses Public Health 2022, 69, 224–234. [Google Scholar] [CrossRef]
- Ladoukakis, E.D.; Zouros, E. Evolution and Inheritance of Animal Mitochondrial DNA: Rules and Exceptions. J Biol Res (Thessalon) 2017, 24, 2. [Google Scholar] [CrossRef]
- Li, X.; Han, B.; Liu, D.; Wang, S.; Wang, L.; Pei, Q.; Zhang, Z.; Zhao, J.; Huang, B.; Zhang, F.; et al. Whole-Genome Resequencing to Investigate the Genetic Diversity and Mechanisms of Plateau Adaptation in Tibetan Sheep. J Anim Sci Biotechnol 2024, 15, 164. [Google Scholar] [CrossRef]
- Yamasaki, H.; Sanpool, O.; Rodpai, R.; Sadaow, L.; Laummaunwai, P.; Un, M.; Thanchomnang, T.; Laymanivong, S.; Aung, W.P.P.; Intapan, P.M.; et al. Spirometra Species from Asia: Genetic Diversity and Taxonomic Challenges. Parasitol Int 2021, 80, 102181. [Google Scholar] [CrossRef] [PubMed]
- Angrizani, R.C.; Malabarba, L.R. Genetic Diversity and Species Delimitation in Rhamdia (Siluriformes: Heptapteridae) in South America, with a Redescription of R. Quelen (Quoy Amp; Gaimard, 1824). Zootaxa 2020, 4801, zootaxa.4801.1.3. [Google Scholar] [CrossRef] [PubMed]
- Cho, S.; Pandey, P.; Hyun, J.Y.; Marchenkova, T.; Vitkalova, A.; Petrov, T.; Jeong, D.; Lee, J.; Kim, D.Y.; Li, Y.; et al. Efficient and Cost-Effective Non-Invasive Population Monitoring as a Method to Assess the Genetic Diversity of the Last Remaining Population of Amur Leopard (Panthera Pardus Orientalis) in the Russia Far East. PLoS One 2022, 17, e0270217. [Google Scholar] [CrossRef] [PubMed]
- Brown, W.M.; George, M.; Wilson, A.C. Rapid Evolution of Animal Mitochondrial DNA. Proc Natl Acad Sci U S A 1979, 76, 1967–1971. [Google Scholar] [CrossRef]
- Galtier, N.; Nabholz, B.; Glémin, S.; Hurst, G.D.D. Mitochondrial DNA as a Marker of Molecular Diversity: A Reappraisal. Mol Ecol 2009, 18, 4541–4550. [Google Scholar] [CrossRef]
- Allio, R.; Donega, S.; Galtier, N.; Nabholz, B. Large Variation in the Ratio of Mitochondrial to Nuclear Mutation Rate across Animals: Implications for Genetic Diversity and the Use of Mitochondrial DNA as a Molecular Marker. Mol Biol Evol 2017, 34, 2762–2772. [Google Scholar] [CrossRef]
- Irwin, D.M.; Kocher, T.D.; Wilson, A.C. Evolution of the Cytochrome b Gene of Mammals. J Mol Evol 1991, 32, 128–144. [Google Scholar] [CrossRef]
- Saccone, C.; Attimonelli, M.; Sbisà, E. Structural Elements Highly Preserved during the Evolution of the D-Loop-Containing Region in Vertebrate Mitochondrial DNA. J Mol Evol 1987, 26, 205–211. [Google Scholar] [CrossRef]
- Sbisà, E.; Tanzariello, F.; Reyes, A.; Pesole, G.; Saccone, C. Mammalian Mitochondrial D-Loop Region Structural Analysis: Identification of New Conserved Sequences and Their Functional and Evolutionary Implications. Gene 1997, 205, 125–140. [Google Scholar] [CrossRef]
- Liu, Z.; Ren, B.; Wei, F.; Long, Y.; Hao, Y.; Li, M. Phylogeography and Population Structure of the Yunnan Snub-Nosed Monkey (Rhinopithecus Bieti) Inferred from Mitochondrial Control Region DNA Sequence Analysis. Mol Ecol 2007, 16, 3334–3349. [Google Scholar] [CrossRef]
- Babarinde, I.A.; Adeola, A.C.; Djagoun, C.A.M.S.; Nneji, L.M.; Okeyoyin, A.O.; Niba, G.; Wanzie, N.K.; Oladipo, O.C.; Adebambo, A.O.; Bello, S.F.; et al. Population Structure and Evolutionary History of the Greater Cane Rat (Thryonomys Swinderianus) from the Guinean Forests of West Africa. Front Genet 2023, 14, 1041103. [Google Scholar] [CrossRef] [PubMed]
- Sumana, S.L.; Wang, P.; Zhang, C.; Jing, X.; Zhu, J.; Tang, Y.; Liu, W.; Su, S.; Liao, Y. Genetic Diversity of the Common Carp Black Strain Population Based on mtDNA (D-Loop and Cytb). Heliyon 2024, 10, e30307. [Google Scholar] [CrossRef] [PubMed]
- Beltrán-López, R.G.; Pérez-Rodríguez, R.; Montañez-García, O.C.; Artigas-Azas, J.M.; Köck, M.; Mar-Silva, A.F.; Domínguez-Domínguez, O. Genetic Differentiation in the Genus Characodon: Implications for Conservation and Taxonomy. PeerJ 2021, 9, e11492. [Google Scholar] [CrossRef] [PubMed]
- Sun, Z.; Pan, T.; Wang, H.; Pang, M.; Zhang, B. Yangtze River, an Insignificant Genetic Boundary in Tufted Deer (Elaphodus Cephalophus): The Evidence from a First Population Genetics Study. PeerJ 2016, 4, e2654. [Google Scholar] [CrossRef]
- Zemanova, M.A.; Ramp, D. Genetic Structure and Gene Flow in Eastern Grey Kangaroos in an Isolated Conservation Reserve. Diversity 2021, 13, 570. [Google Scholar] [CrossRef]
- Hai, L.; Li, Y.; Lan, X.; Pei, C.; Hu, D. Insight into mtDNA Diversity of Wild Forest Musk Deer (Moschus Berezovskii) in Shanxi Province Mountains. Sci Rep 2025, 15, 5523. [Google Scholar] [CrossRef]
- Dou, H.; Yang, H.; Feng, L.; Mou, P.; Wang, T.; Ge, J. Estimating the Population Size and Genetic Diversity of Amur Tigers in Northeast China. PLoS One 2016, 11, e0154254. [Google Scholar] [CrossRef]
- Wang, Z.; Lu, G.; Gao, Y.; Li, M.; Hu, D.; Zhang, D. mtDNA CR Evidence Indicates High Genetic Diversity of Captive Forest Musk Deer in Shaanxi Province, China. Animals (Basel) 2023, 13, 2191. [Google Scholar] [CrossRef]
- Johnson, M.; Zaretskaya, I.; Raytselis, Y.; Merezhuk, Y.; McGinnis, S.; Madden, T.L. NCBI BLAST: A Better Web Interface. Nucleic Acids Res 2008, 36, W5-9. [Google Scholar] [CrossRef]
- Tamura, K.; Stecher, G.; Kumar, S. MEGA11: Molecular Evolutionary Genetics Analysis Version 11. Mol Biol Evol 2021, 38, 3022–3027. [Google Scholar] [CrossRef]
- Rozas, J.; Ferrer-Mata, A.; Sánchez-DelBarrio, J.C.; Guirao-Rico, S.; Librado, P.; Ramos-Onsins, S.E.; Sánchez-Gracia, A. DnaSP 6: DNA Sequence Polymorphism Analysis of Large Data Sets. Mol Biol Evol 2017, 34, 3299–3302. [Google Scholar] [CrossRef] [PubMed]
- Excoffier, L.; Lischer, H.E.L. Arlequin Suite Ver 3.5: A New Series of Programs to Perform Population Genetics Analyses under Linux and Windows. Mol Ecol Resour 2010, 10, 564–567. [Google Scholar] [CrossRef]
- Slatkin, M. Gene Flow and the Geographic Structure of Natural Populations. Science 1987, 236, 787–792. [Google Scholar] [CrossRef]
- Leigh, J.W.; Bryant, D. popart : Full-feature Software for Haplotype Network Construction. Methods Ecol Evol 2015, 6, 1110–1116. [Google Scholar] [CrossRef]
- Yang, X.; Su, M.; Meng, J.; Du, J.; An, W.; Shi, H.; Fan, W. Characterization of Two Novel HIV-1 Second-Generation Recombinants (CRF01_AE/CRF07_BC) Identified in Hebei Province, China. Front Microbiol 2023, 14, 1159928. [Google Scholar] [CrossRef]
- Cabria, M.T.; Rubines, J.; Gómez-Moliner, B.; Zardoya, R. On the Phylogenetic Position of a Rare Iberian Endemic Mammal, the Pyrenean Desman (Galemys Pyrenaicus). Gene 2006, 375, 1–13. [Google Scholar] [CrossRef] [PubMed]
- Zhi-Min, J.; Ke-Song, Q.; Bo-Qi, L.; Jun-Sheng, Z.; He, C.; Jin-Xun, L.; Zhu, W.; Zhu, L. Sequencing and Analysis of the Complete Mitochondrial Genome of Crocidura Tanakae from China and Its Phylogenetic Analysis. Mitochondrial DNA B Resour 2019, 4, 2791–2793. [Google Scholar] [CrossRef]
- Wang, H.; Zhu, X.; Pan, T.; Meng, X.; Li, C.; Zhou, L.; Zhang, B. Mitochondrial Genome of the Alpine Musk Deer Moschus Chrysogaster (Artiodactyla: Ruminantia: Moschidae). Mitochondrial DNA 2013, 24, 487–489. [Google Scholar] [CrossRef]
- Bhaskar, R.; Kanaparthi, P.; Sakthivel, R. Genetic Diversity and Phylogenetic Analysis of Blackbuck (Antilope Cervicapra) in Southern India. Mol Biol Rep 2021, 48, 1255–1268. [Google Scholar] [CrossRef]
- Yumnam, B.; Negi, T.; Maldonado, J.E.; Fleischer, R.C.; Jhala, Y.V. Phylogeography of the Golden Jackal (Canis Aureus) in India. PLoS One 2015, 10, e0138497. [Google Scholar] [CrossRef]
- Al-Ghafri, M.K.; White, P.J.C.; Briers, R.A.; Dicks, K.L.; Ball, A.; Ghazali, M.; Ross, S.; Al-Said, T.; Al-Amri, H.; Al-Umairi, M.; et al. Genetic Diversity of the Nubian Ibex in Oman as Revealed by Mitochondrial DNA. R Soc Open Sci 2021, 8, 210125. [Google Scholar] [CrossRef] [PubMed]
- Hu, Y.; Fan, H.; Chen, Y.; Chang, J.; Zhan, X.; Wu, H.; Zhang, B.; Wang, M.; Zhang, W.; Yang, L.; et al. Spatial Patterns and Conservation of Genetic and Phylogenetic Diversity of Wildlife in China. Sci Adv 2021, 7, eabd5725. [Google Scholar] [CrossRef] [PubMed]
- Plis, K.; Niedziałkowska, M.; Borowik, T.; Lang, J.; Heddergott, M.; Tiainen, J.; Bunevich, A.; Šprem, N.; Paule, L.; Danilkin, A.; et al. Pan-European Phylogeography of the European Roe Deer (Capreolus Capreolus). Ecol Evol 2022, 12, e8931. [Google Scholar] [CrossRef]
- Natochin, Yu.V.; Chernigovskaya, T.V. Evolutionary Physiology: History, Principles. Comparative Biochemistry and Physiology Part A: Physiology 1997, 118, 63–79. [Google Scholar] [CrossRef] [PubMed]
- Taylor, R.S.; Manseau, M.; Keobouasone, S.; Liu, P.; Mastromonaco, G.; Solmundson, K.; Kelly, A.; Larter, N.C.; Gamberg, M.; Schwantje, H.; et al. High Genetic Load without Purging in Caribou, a Diverse Species at Risk. Curr Biol 2024, 34, 1234–1246.e7. [Google Scholar] [CrossRef]
- Kuang, H.; Li, J.; Wang, X. Karst Study of Jinfo Mountain Based on Image Analysis. Heliyon 2023, 9, e19657. [Google Scholar] [CrossRef]
- Ramakrishnan, U.; Hadly, E.A. Using Phylochronology to Reveal Cryptic Population Histories: Review and Synthesis of 29 Ancient DNA Studies. Mol Ecol 2009, 18, 1310–1330. [Google Scholar] [CrossRef]
- Okello, J.B.A.; Wittemyer, G.; Rasmussen, H.B.; Arctander, P.; Nyakaana, S.; Douglas-Hamilton, I.; Siegismund, H.R. Effective Population Size Dynamics Reveal Impacts of Historic Climatic Events and Recent Anthropogenic Pressure in African Elephants. Mol Ecol 2008, 17, 3788–3799. [Google Scholar] [CrossRef]
- Wang, E.; Van Wijk, R.E.; Braun, M.S.; Wink, M. Gene Flow and Genetic Drift Contribute to High Genetic Diversity with Low Phylogeographical Structure in European Hoopoes (Upupa Epops). Mol Phylogenet Evol 2017, 113, 113–125. [Google Scholar] [CrossRef]
- Umbrello, L.S.; Didham, R.K.; How, R.A.; Huey, J.A. Multi-Species Phylogeography of Arid-Zone Sminthopsinae (Marsupialia: Dasyuridae) Reveals Evidence of Refugia and Population Expansion in Response to Quaternary Change. Genes (Basel) 2020, 11, 963. [Google Scholar] [CrossRef]
- Pesole, G.; Sbisá, E.; Preparata, G.; Saccone, C. The Evolution of the Mitochondrial D-Loop Region and the Origin of Modern Man. Mol Biol Evol 1992, 9, 587–598. [Google Scholar] [CrossRef] [PubMed]
- Liu, J.; Ding, X.; Zeng, Y.; Yue, Y.; Guo, X.; Guo, T.; Chu, M.; Wang, F.; Han, J.; Feng, R.; et al. Genetic Diversity and Phylogenetic Evolution of Tibetan Sheep Based on mtDNA D-Loop Sequences. PLoS One 2016, 11, e0159308. [Google Scholar] [CrossRef] [PubMed]
Figure 1.
Depicting tufted deer fecal sample collection sites.
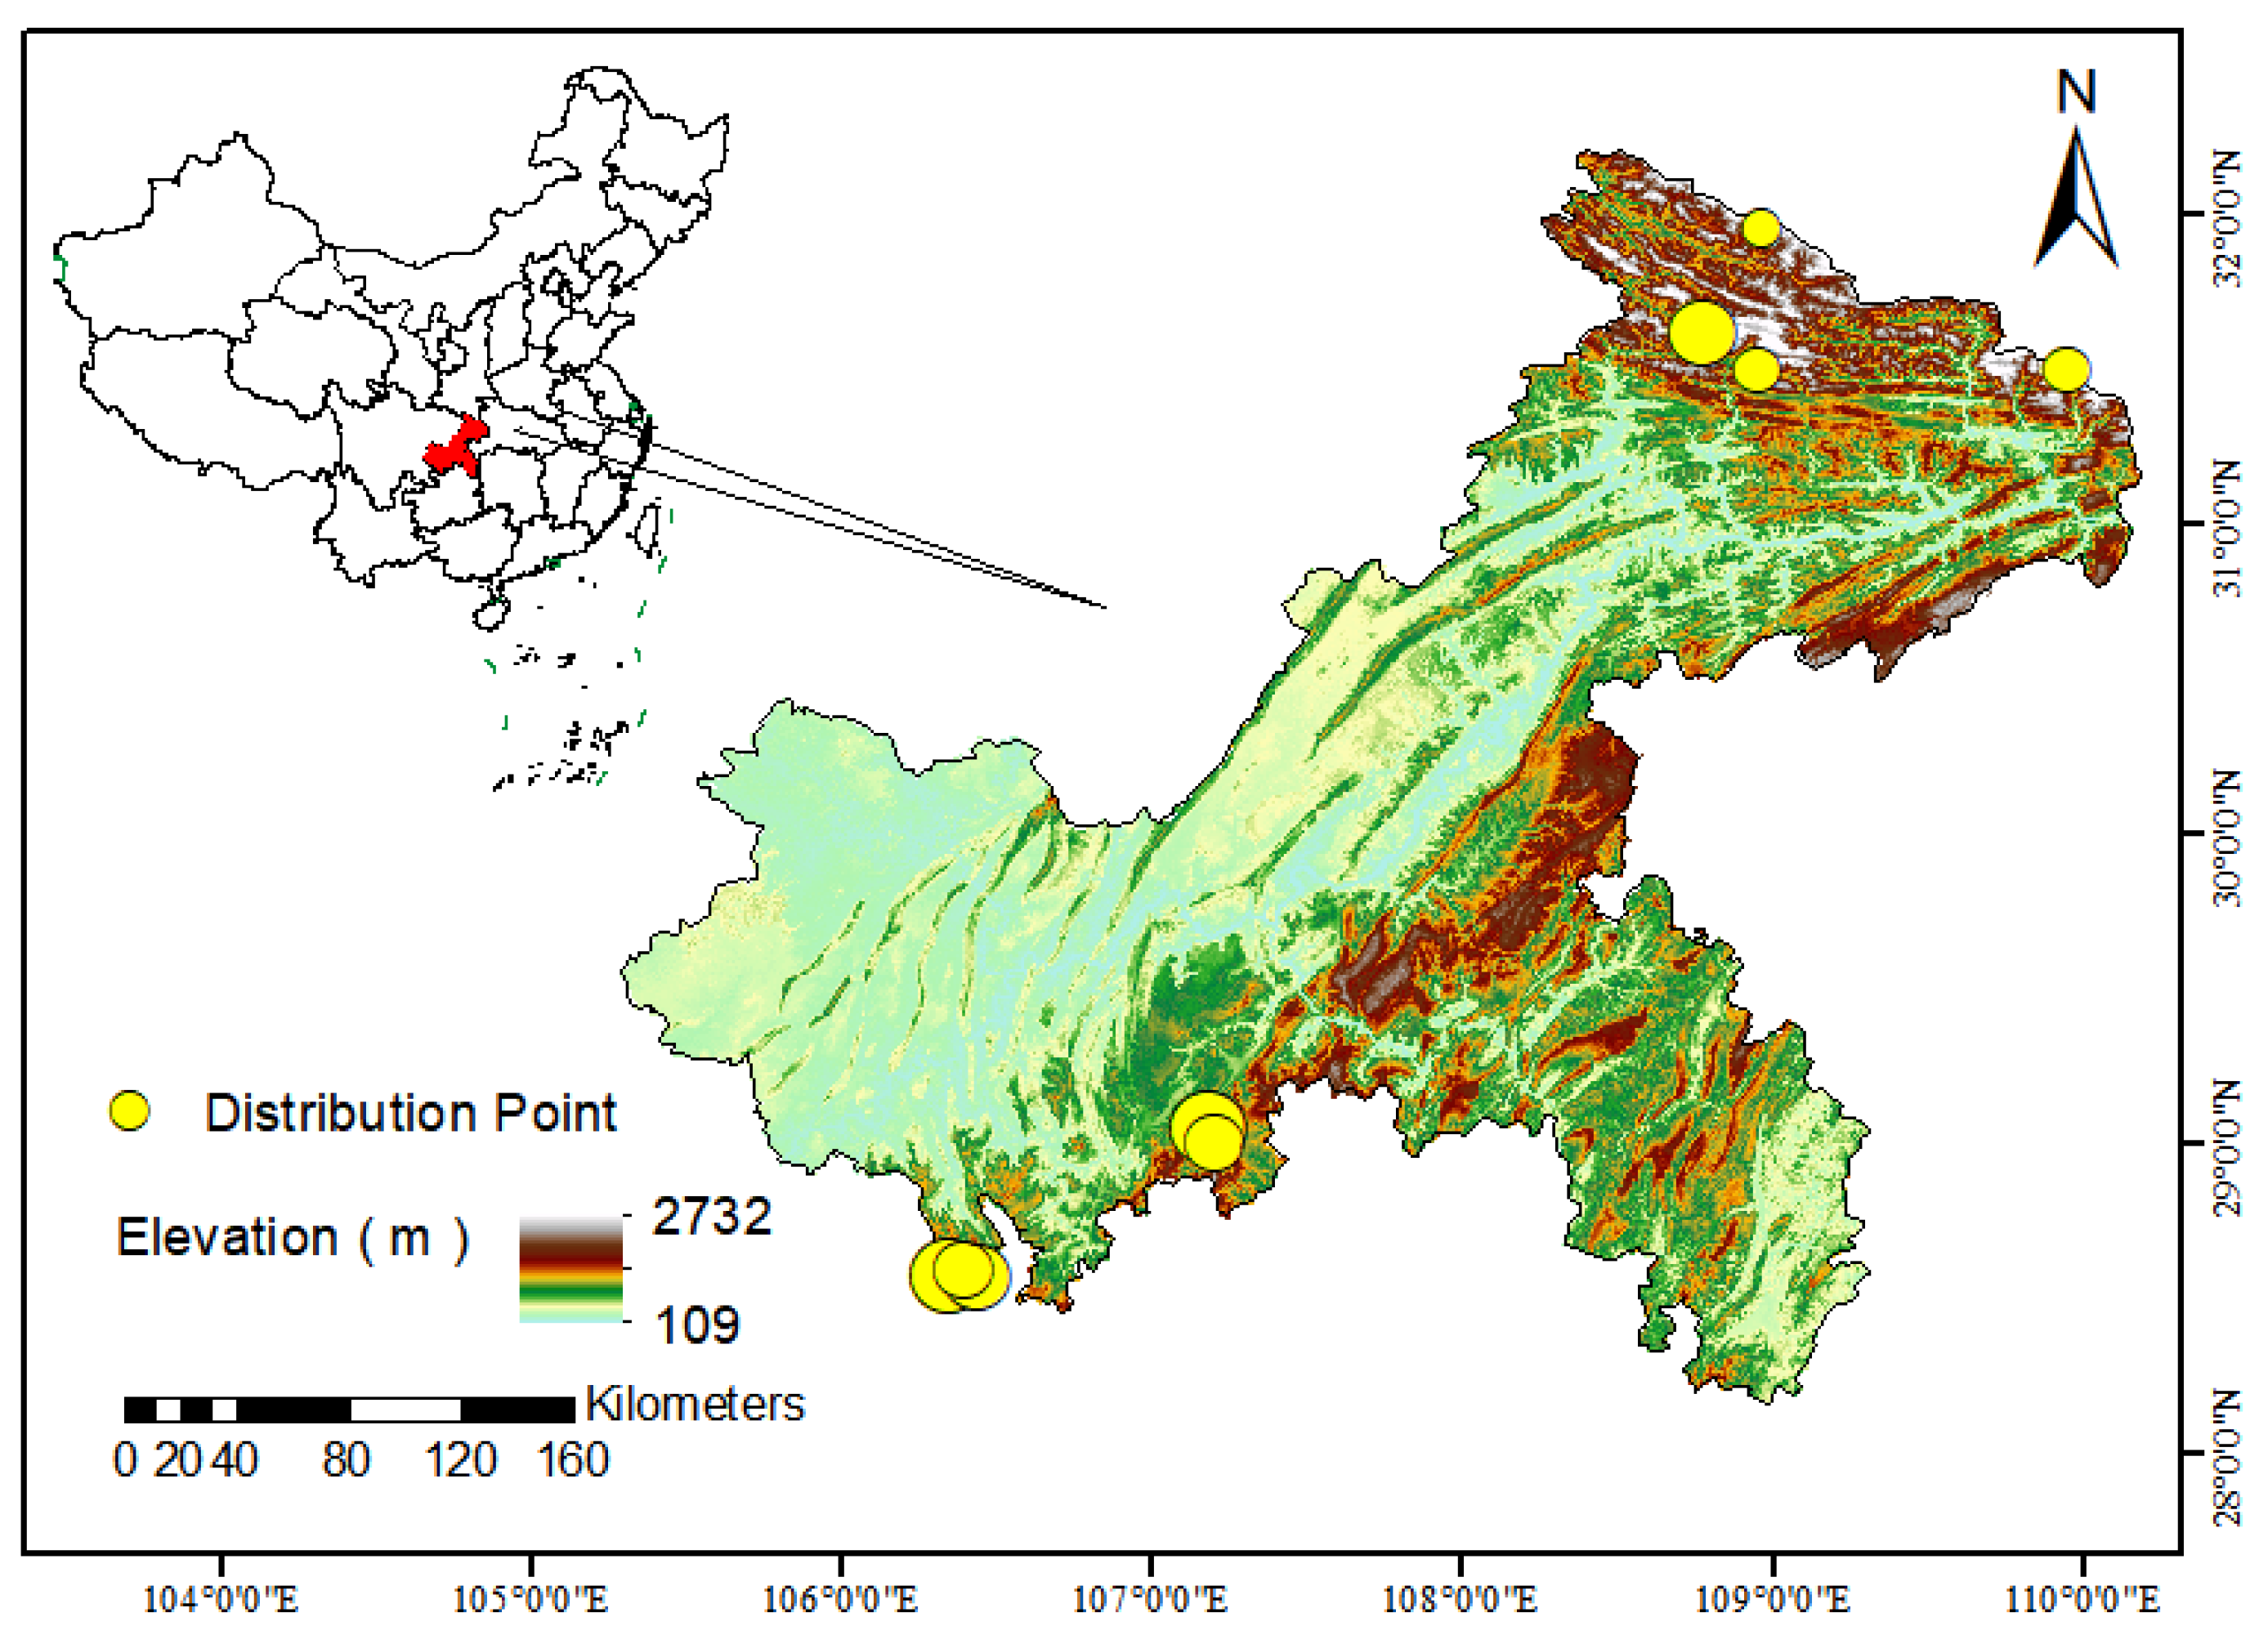
Figure 2.
Haplotype networks of tufted deer based on mitochondrial Cyt b gene (a) and D-loop region (b).
Figure 2.
Haplotype networks of tufted deer based on mitochondrial Cyt b gene (a) and D-loop region (b).
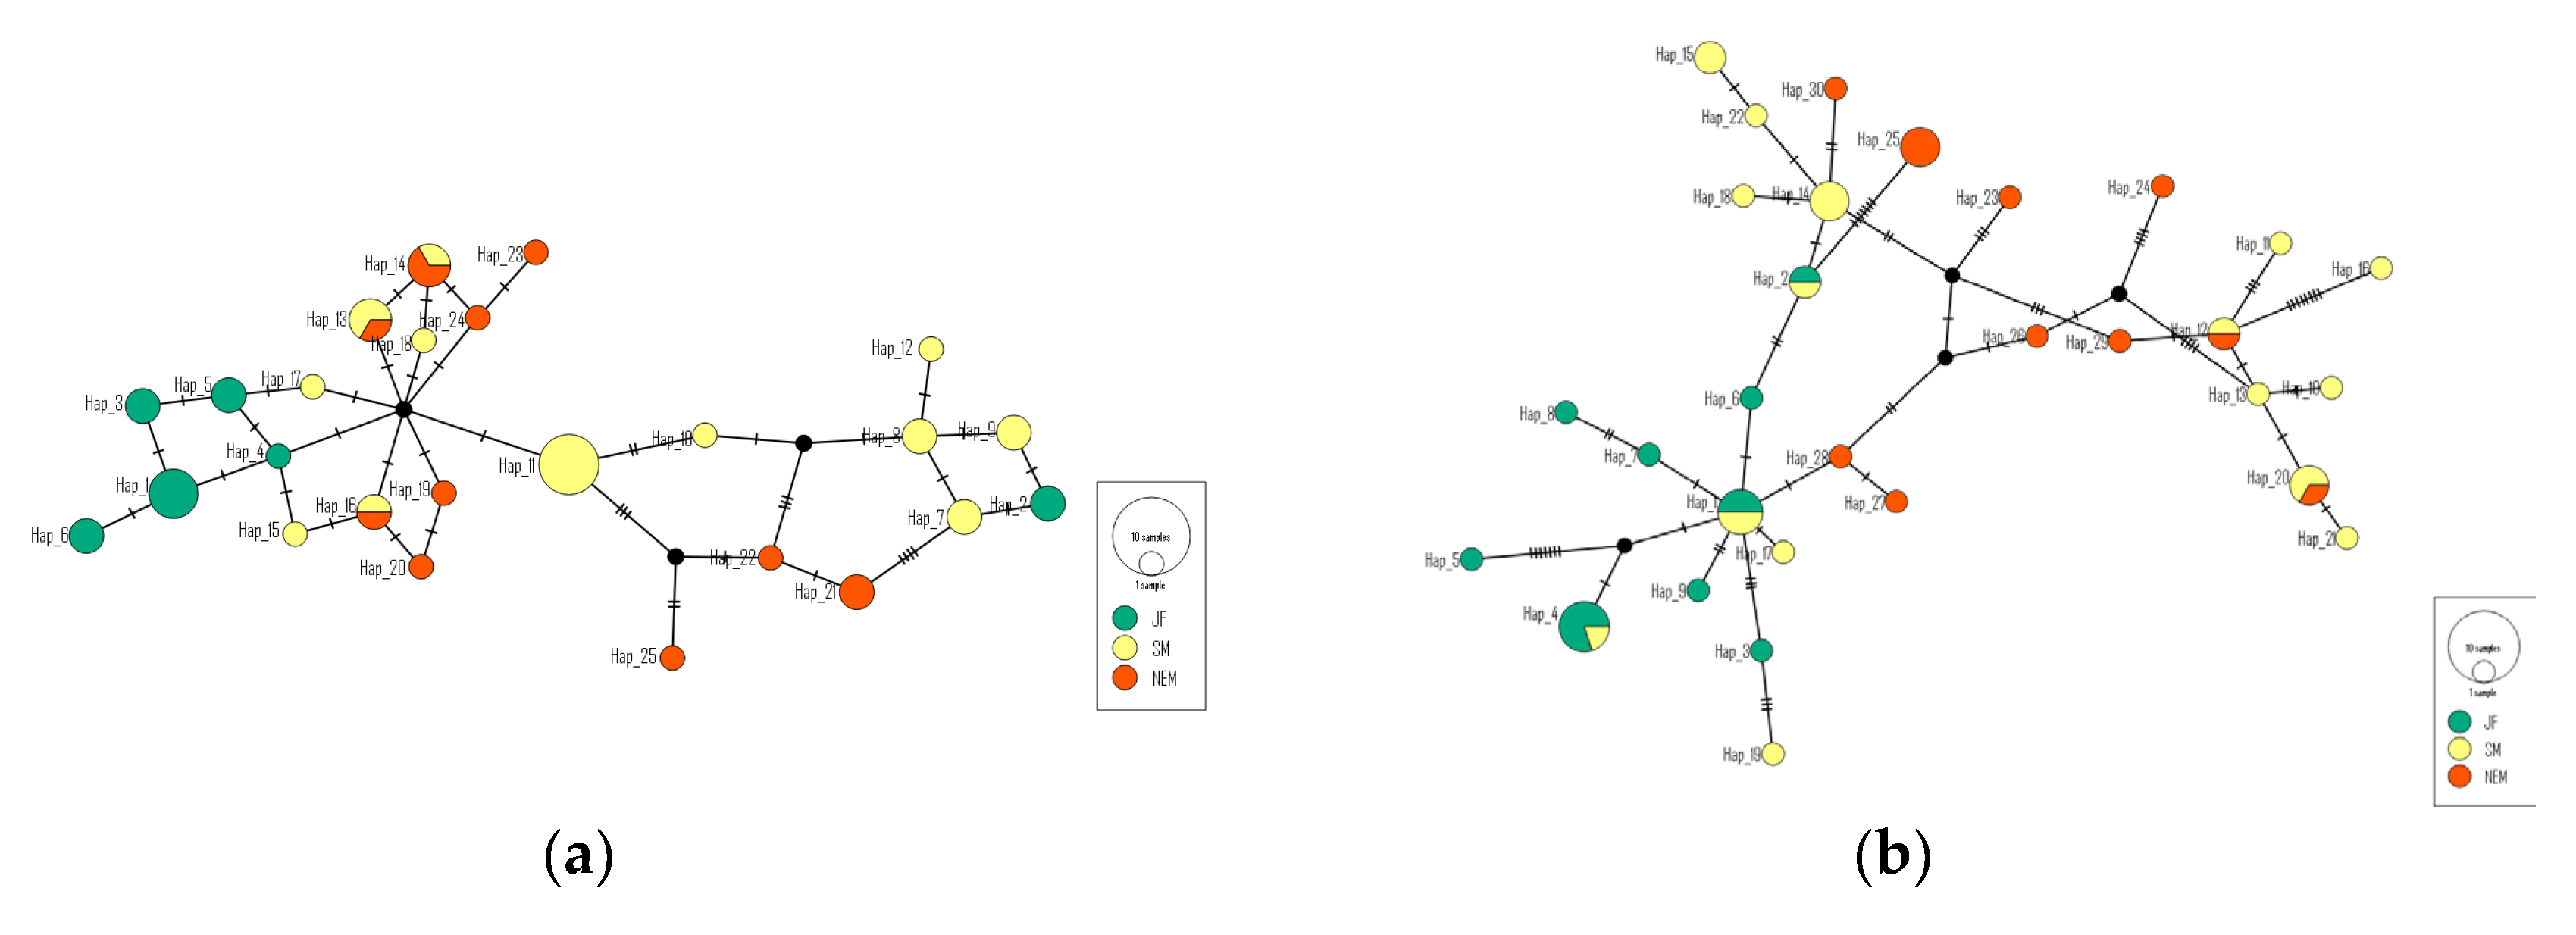
Figure 3.
Neighbor-Joining (NJ) trees of haplotypes derived from Cyt b gene (a) and D-loop region (b). Note: Rectangles represent haplotypes unique to the JF population; circles indicate haplotypes unique to the SM population; stars denote haplotypes specific to the NEM population; triangles indicate shared haplotypes among populations.
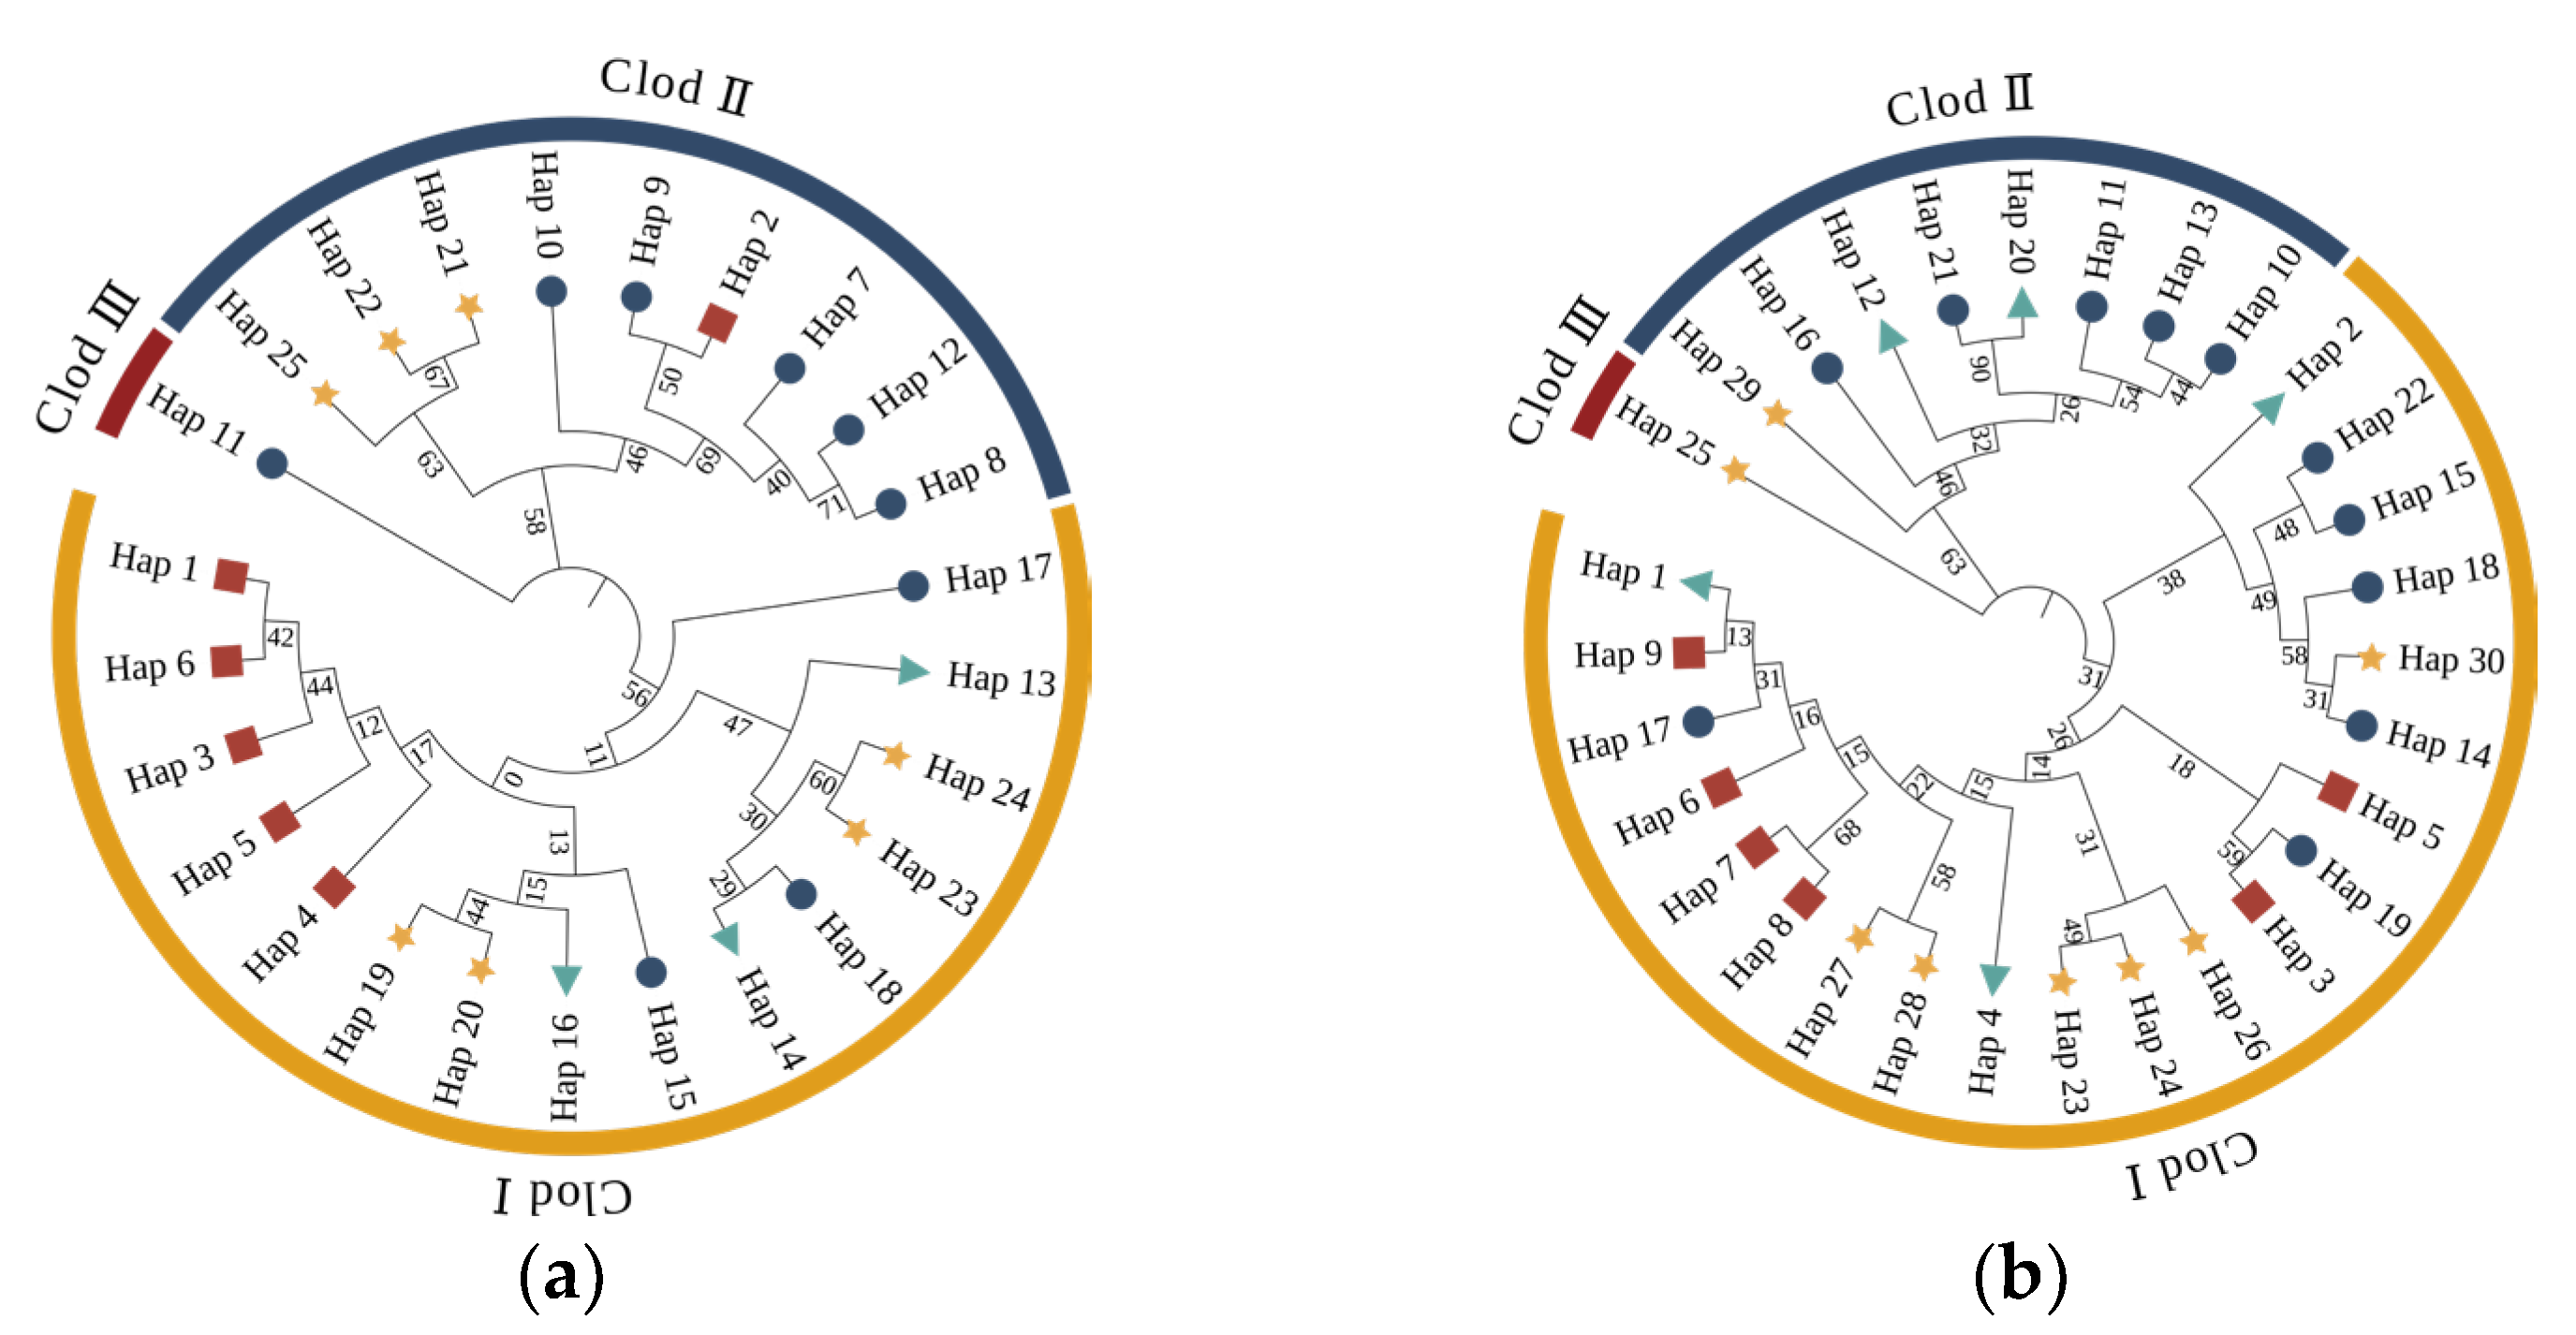
Figure 4.
Observed versus Expected Mismatch Distribution Curves for tufted deer Populations Based on (a) Cyt b and (b) D-loop Sequences.
Figure 4.
Observed versus Expected Mismatch Distribution Curves for tufted deer Populations Based on (a) Cyt b and (b) D-loop Sequences.
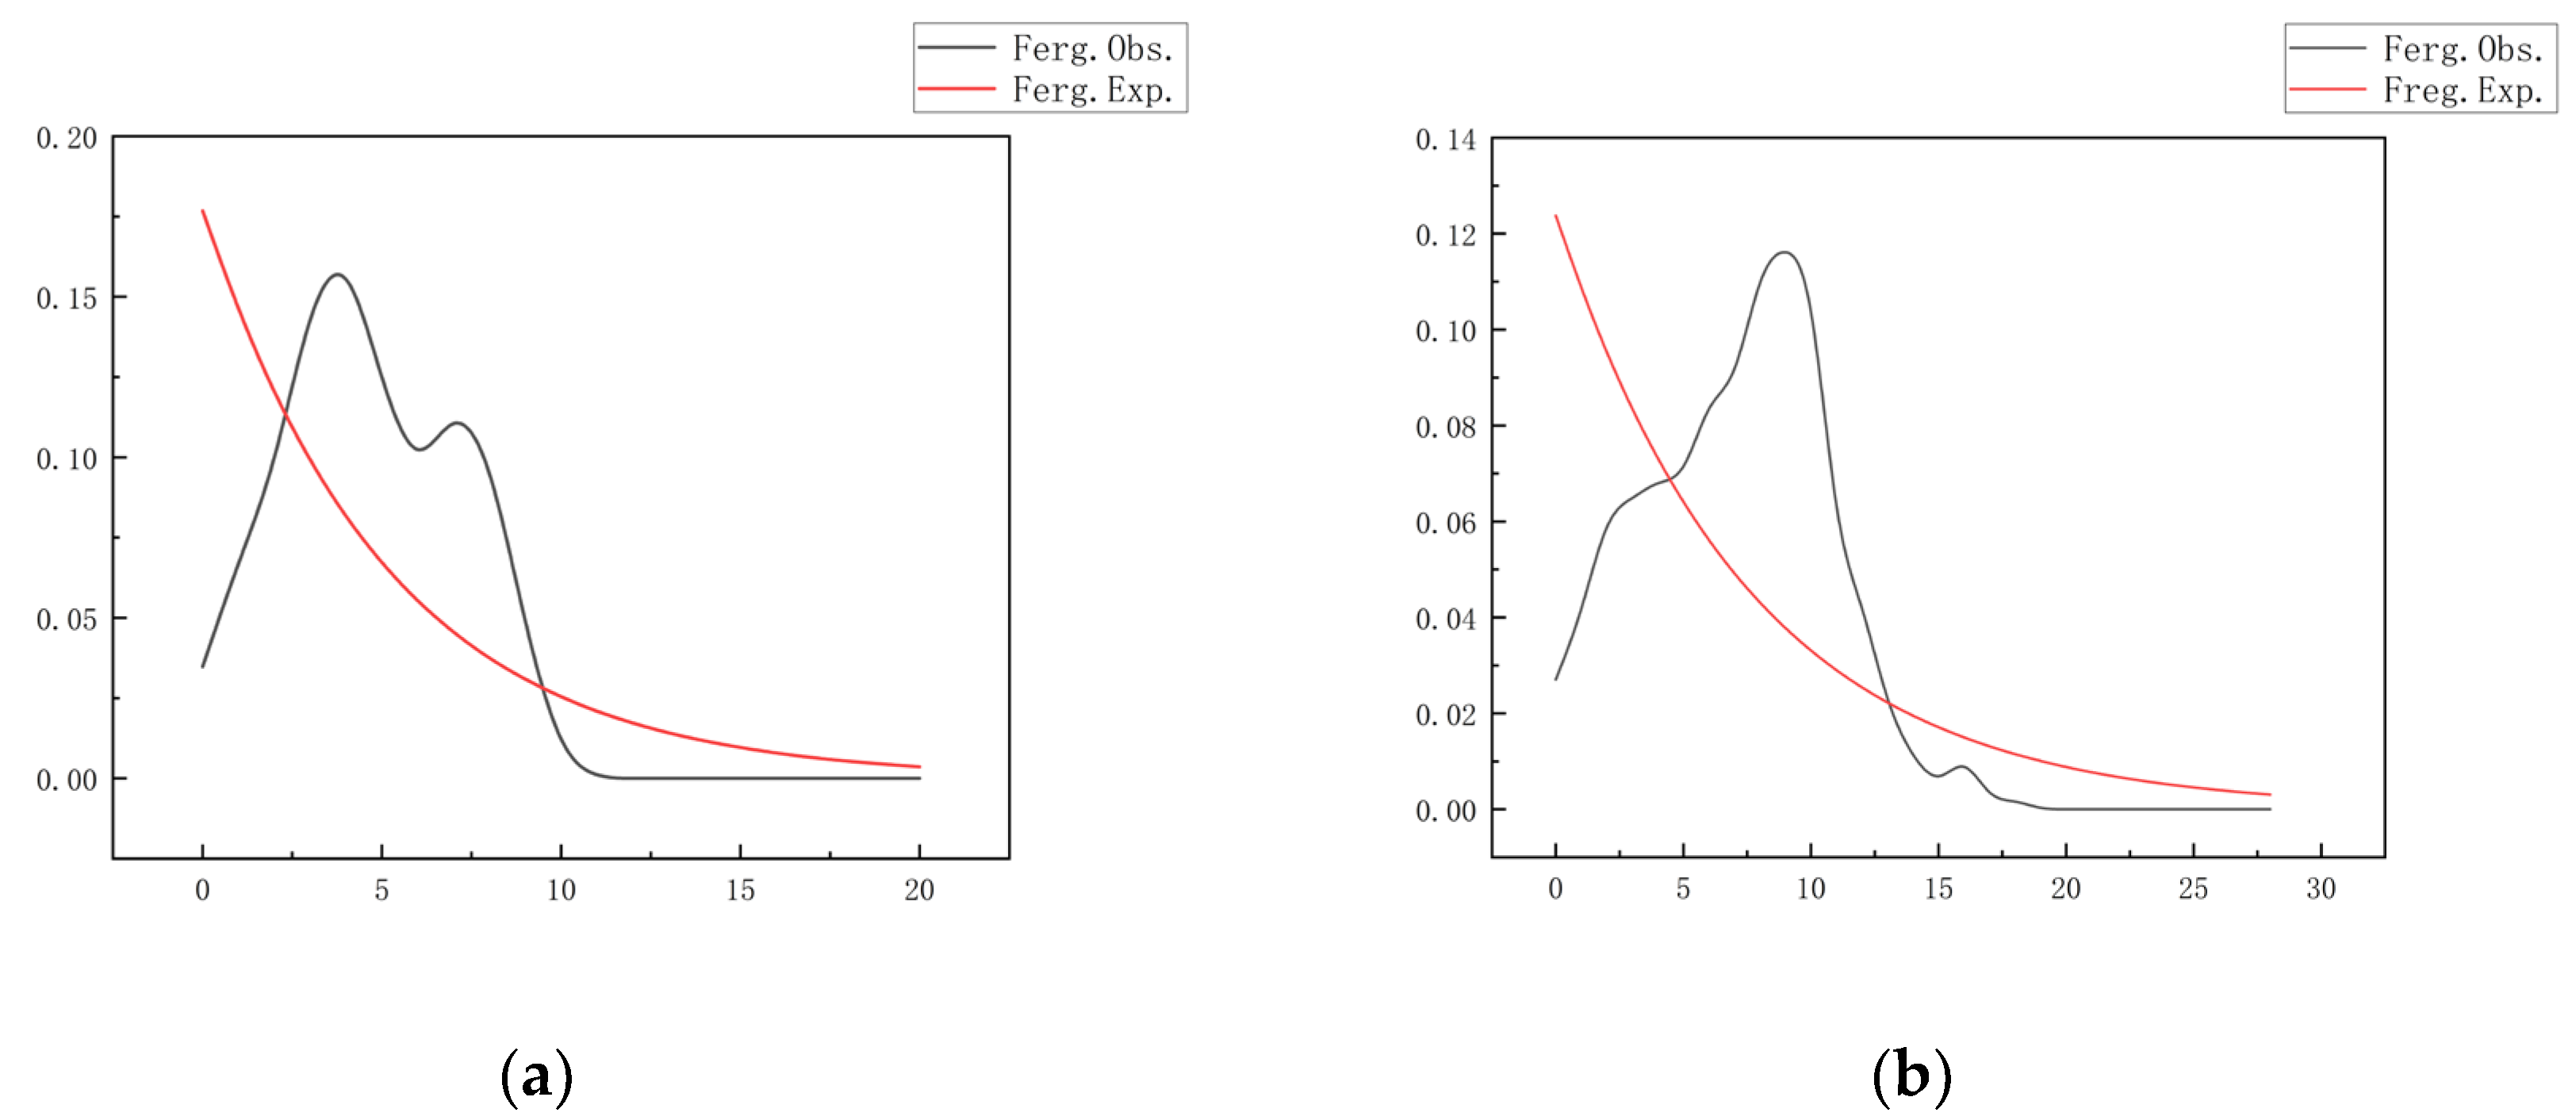

Table 1.
Nucleotide Composition of Cyt b Gene and D-loop Region in Muntjac Populations.
| Items | Base composition (%) | ||||||
|---|---|---|---|---|---|---|---|
| T(U) | C | A | G | AT(U) | GC | Total | |
| Cyt b | 30.7 | 24.5 | 27.7 | 17.1 | 58.4 | 41.6 | 327 |
| D-loop | 28.1 | 27.5 | 23.6 | 20.8 | 51.7 | 48.3 | 334 |
Table 2.
Genetic diversity indices of the Cyt b gene and D-loop region in tufted deer.
| Genetic Marker | Group | Polymorphism Site Analysis (S) | Number of Haplotypes (H) | Haplotype Diversity (Hd) |
Average Number of Nucleotide Differences (K) |
Nucleotide Diversity (π) |
|---|---|---|---|---|---|---|
| Cyt b | JF | 8 | 6 | 0.87179 | 2.74359 | 0.00839 |
| SM | 12 | 12 | 0.90952 | 4.04762 | 0.01238 | |
| NEM | 13 | 10 | 0.96970 | 5.16667 | 0.01602 | |
| Total Data Estimates | 17 | 25 | 0.96522 | 4.65700 | 0.01424 | |
| D-loop | JF | 18 | 9 | 0.91026 | 3.92308 | 0.01178 |
| SM | 25 | 16 | 0.97143 | 6.60000 | 0.01982 | |
| NEM | 20 | 10 | 0.95455 | 7.96970 | 0.02393 | |
| Total Data Estimates | 43 | 30 | 0.97295 | 7.08213 | 0.02127 |
Table 3.
Haplotype distribution of tufted deer in the Cyt b gene and D-loop regions.
| Items | Haplotypes | Individual No. | Number |
|---|---|---|---|
| Cyt b | Hap_1 | JF-01, JF-02, JF-03, JF-11 | 4 |
| Hap_2 | JF-04, JF-05 | 2 | |
| Hap_3 | JF-06, JF-13 | 2 | |
| Hap_4 | JF-07 | 1 | |
| Hap_5 | JF-08, JF-12 | 2 | |
| Hap_6 | JF-09, JF-10 | 2 | |
| Hap_7 | SM-01, SM-21 | 2 | |
| Hap_8 | SM-02, SM-16 | 2 | |
| Hap_9 | SM-03, SM-17 | 2 | |
| Hap_10 | SM-04 | 1 | |
| Hap_11 | SM-05, SM-06, SM-07, SM-09, SM-13, SM-19 | 6 | |
| Hap_12 | SM-08 | 1 | |
| Items | Haplotypes | Individual No. | Number |
| Hap_13 | SM-10, SM-20, NEM-11 | 3 | |
| Hap_14 | SM-11, NEM-08, NEM-10 | 3 | |
| Hap_15 | SM-12 | 1 | |
| Hap_16 | SM-14, NEM-01 | 2 | |
| Hap_17 | SM-15 | 1 | |
| Hap_18 | SM-18 | 1 | |
| Hap_19 | NEM-02 | 1 | |
| Hap_20 | NEM-03 | 1 | |
| Hap_21 | NEM-04, NEM-06 | 2 | |
| Hap_22 | NEM-05 | 1 | |
| Hap_23 | NEM-07 | 1 | |
| Hap_24 | NEM-09 | 1 | |
| Hap_25 | NEM-12 | 1 | |
| D-loop | Hap_1 | JF-01, JF-09, SM-10, SM-12 | 4 |
| Hap_2 | JF-02, SM-20 | 1 | |
| Hap_3 | JF-03 | 1 | |
| Hap_4 | JF-04, JF-06, JF-10, JF-11, SM-15 | 5 | |
| Hap_5 | JF-05 | 1 | |
| Hap_6 | JF-07 | 1 | |
| Hap_7 | JF-08 | 1 | |
| Hap_8 | JF-12 | 1 | |
| Hap_9 | JF-13 | 1 | |
| Hap_10 | SM-01 | 1 | |
| Hap_11 | SM-02 | 1 | |
| Hap_12 | SM-03, NEM-10 | 2 | |
| Hap_13 | SM-04 | 1 | |
| Hap_14 | SM-05, SM-07, SM-19 | 3 | |
| Hap_15 | SM-06, SM-09 | 2 | |
| Hap_16 | SM-08 | 1 | |
| Hap_17 | SM-11 | 1 | |
| Hap_18 | SM-13 | 1 | |
| Hap_19 | SM-14 | 1 | |
| Hap_20 | SM-16, SM-21, NEM-01 | 3 | |
| Hap_21 | SM-17 | 1 | |
| Hap_22 | SM-18 | 1 | |
| Hap_23 | NEM-02 | 1 | |
| Hap_24 | NEM-03 | 1 | |
| Hap_25 | NEM-04, NEM-05, NEM-06 | 3 | |
| Hap_26 | NEM-07 | 1 | |
| Hap_27 | NEM-08 | 1 | |
| Hap_28 | NEM-09 | 1 | |
| Hap_29 | NEM-11 | 1 | |
| Hap_30 | NEM-12 | 1 |
Table 4.
Genetic Differentiation (Fst, upper right) and Gene Flow (Nm, lower left) among tufted deer Populations Based on Cyt b Sequences.
Table 4.
Genetic Differentiation (Fst, upper right) and Gene Flow (Nm, lower left) among tufted deer Populations Based on Cyt b Sequences.
| Fst | JF | SM | NEM | |
|---|---|---|---|---|
| Nm | ||||
| JF | 0.27405 | 0.25385 | ||
| SM | 0.66218 | 0.09604 | ||
| NEM | 0.73482 | 2.35307 | ||
Table 5.
Genetic Differentiation (Fst, upper right) and Gene Flow (Nm, lower left) among tufted deer Populations Based on D-loop Sequences.
Table 5.
Genetic Differentiation (Fst, upper right) and Gene Flow (Nm, lower left) among tufted deer Populations Based on D-loop Sequences.
| Fst | JF | SM | NEM | |
|---|---|---|---|---|
| Nm | ||||
| JF | 0.23394 | 0.26201 | ||
| SM | 0.81883 | 0.06227 | ||
| NEM | 0.70417 | 3.76494 | ||
Table 6.
Tajima’s D and Fu’s FS Values for tufted deer Populations Based on Cyt b and D-loop Sequences.
Table 6.
Tajima’s D and Fu’s FS Values for tufted deer Populations Based on Cyt b and D-loop Sequences.
| Genetic Marker | Group | Tajima’s D | Tajima’s D p-value | FS | FS p-value |
|---|---|---|---|---|---|
| Cyt b | JF | 0.24882 | 0.63800 | -0.31705 | 0.44100 |
| SM | 0.75692 | 0.78000 | -2.89506 | 0.08800 | |
| NEM | 0.84804 | 0.84100 | -3.40205 | 0.03600 | |
| Mean | 0.61793 | 0.75300 | -2.20472 | 0.18833 | |
| Standard Deviation | 0.32289 | 0.10416 | 1.65431 | 0.22036 | |
| D-loop | JF | -1.37337 | 0.08100 | -2.55315 | 0.07100 |
| SM | -0.19214 | 0.48100 | -5.73756 | 0.00400 | |
| NEM | 0.89333 | 0.86300 | -2.08194 | 0.13900 | |
| Mean | -0.22406 | 0.47500 | -3.45755 | 0.07133 | |
| Standard Deviation | 1.13369 | 0.39103 | 1.98855 | 0.06750 |
Disclaimer/Publisher’s Note: The statements, opinions and data contained in all publications are solely those of the individual author(s) and contributor(s) and not of MDPI and/or the editor(s). MDPI and/or the editor(s) disclaim responsibility for any injury to people or property resulting from any ideas, methods, instructions or products referred to in the content. |
© 2025 by the authors. Licensee MDPI, Basel, Switzerland. This article is an open access article distributed under the terms and conditions of the Creative Commons Attribution (CC BY) license (http://creativecommons.org/licenses/by/4.0/).
Copyright: This open access article is published under a Creative Commons CC BY 4.0 license, which permit the free download, distribution, and reuse, provided that the author and preprint are cited in any reuse.


