
Submitted:
08 June 2025
Posted:
09 June 2025
You are already at the latest version
Abstract
Castor fiber birulai is a subspecies of the Eurasian beaver that has a relatively small population size compared to other Castor subspecies. There is limited genetic research on this subspecies. In this study, mitochondrial cytochrome b (Cytb) and D-loop sequences were analysed in genetic samples obtained from 19 individuals residing in the Ulungur River Basin, Xinjiang, China. The Cytb region presented a single haplotype, whereas three haplotypes were identified in the D-loop region. The genetic diversity within the Chinese population was low (D-loop Hd = 0.444; Pi = 0.0043), markedly lower than that observed in other geographical populations of C. fiber. Phylogenetic reconstructions and haplotype network analyses revealed substantial genetic differentiation between C.f. birulai and other Eurasian lineages (Fst > 0.95), supporting the status of C.f. birulai as a distinct evolutionary lineage. Although the genetic distance between the Chinese and Mongolian populations was relatively small (distance = 0.00269), significant genetic differentiation was detected (Fst = 0.67055), indicating that anthropogenic disturbances—such as hydraulic infrastructure and fencing along Cross-border Bulgan River—may have impeded gene flow and dispersal. Demographic analyses provided no evidence of recent population expansion (Fu’s Fs = 0.19152), suggesting a demographically stable population. These findings underscore the importance of the conservation of C.f. birulai as an Evolutionarily Significant Unit and provide a genetic basis for informed Cross-border conservation and management strategies.
Keywords:
Castor fiber birulai
; genetic diversity
; lineage independence
; mitochondrial cytochrome b
; D-loop sequences
Introduction
The Eurasian beaver (Castor fiber), one of only two extant species within the genus Castor, was historically widespread across the Eurasian continent. As a keystone species and ecological engineer in riparian ecosystems, it plays a pivotal role in maintaining wetland structure, regulating hydrological processes, and enhancing biodiversity [1]. However, since the Middle Ages, the population of C, fiber has declined dramatically due to intensive fur trade, overhunting, and habitat destruction. By the early 20th century, the global population had dwindled to fewer than 1,200 individuals, surviving in only eight geographically isolated refugia across France, Norway, Germany, Belarus, and Russia [2].
With the implementation of wildlife protection policies and the advancement of reintroduction programs, wild C. fiber populations have been reestablished in more than 25 countries. The global population has now recovered to over 1.5 million individuals [3,4,5,6]. Despite this remarkable recovery, concerns have emerged regarding lineage admixture, genetic homogenization, and reduced local adaptation associated with artificial translocations. These genetic and ecological challenges pose significant risks to the long-term viability and sustainability of reintroduced populations [7,8,9].
Studies have shown that the extant maternal lineages of C. fiber can be broadly classified into two major clades: a western lineage (populations in France, Germany, and surrounding regions) and an eastern lineage (populations from Russia, Mongolia, and adjacent areas), reflecting their independent evolutionary trajectories shaped by isolation in glacial refugia [10]. On a global scale, naturally distributed populations of C. fiber that retain their original lineage without anthropogenic disturbance are exceedingly rare. Castor fiber birulai, native to the Ulungur River Basin in Xinjiang, China, represents the only indigenous subspecies of C. fiber in the country and is one of the few remaining subspecies worldwide with a genetically intact and evolutionarily continuous lineage. As one of the descendants of the eight historical refugia of C. fiber [11], C.f. birulai occupies a clearly defined geographical range and has been geographically isolated for a long period of time. Its core habitat lies in the Ulungur River Basin, including its upper tributaries in China and the upstream sections of the Bulgan and Tes Rivers in Mongolia [12,13]. The Bulgan River, a cross-border watercourse between China and Mongolia, has historically facilitated the natural distribution of the species across both countries.
Recent population estimates suggest that approximately 800 individuals remain in China and approximately 500 individuals remain Mongolia, with the total number of C.f. birulai individuals falling below 1,300 individuals. The subspecies is characterized by a narrow geographic distribution, small and endangered population size, and pronounced habitat fragmentation and isolation.
C.f. birulai is recognized as a core species of the eastern lineage of Eurasian beavers and is one of the eight primary phylogeographic lineages proposed by Ducroz et al [10]. Owing to its long-term isolation in closed river systems in arid environments, this subspecies has remained largely free from interlineage admixture and is therefore considered a classic example of a “genetic relict population” with high lineage integrity and evolutionary continuity [14]. On the basis of complete mitochondrial genome analysis, Horn[15].inferred that the major divergence events among Eurasian beaver matrilines likely occurred approximately 210,000 years ago. It is plausible that C.f. birulai has retained ancestral characteristics from these early divergences, underscoring its evolutionary significance and conservation value.
Nevertheless, systematic research on the genetic diversity, population structure, and phylogenetic placement of C.f. birulai remains remarkably insufficient. In contrast to the comprehensive multilocus genetic assessments conducted for many reintroduced populations in Europe, research on C.f. birulai has long been marginalized both domestically and internationally. The existing data are sparse and lack adequate geographical representation, thereby limiting the scientific basis for effective conservation management of this subspecies.
To address this gap, representative samples of C.f. birulai from the Ulungur River Basin in Xinjiang, China, were collected to conduct a systematic evaluation of haplotype diversity, phylogenetic structure, and demographic history using mitochondrial cytochrome b (cytb) and control region (D-loop) sequences in this study. By integrating these data with publicly available sequences from C. fiber subspecies across Eurasia, we aimed to clarify the phylogenetic placement and evolutionary distinctiveness of C.f. birulai and highlight the importance of its conservation. These findings are intended to provide a scientific foundation and technical support for the development of targeted genetic resource management and conservation strategies for this taxon.
Materials and Methods
Sample Collection
Between 2023 and 2025, a total of 19 genetic samples of C.f. birulai were collected from the Ulungur River Basin. All the samples were collected from different individuals to ensure proper representation of the population genetic structure. Of these, 12 faecal samples were obtained from rescued individuals housed within the Burqin Beaver National Nature Reserve in Xinjiang, whereas 7 muscle tissue samples were obtained from naturally deceased individuals preserved in the Tianma Natural History Museum, Xinjiang(see Supplementary Table S1).
Following collection, all the tissue samples were immediately stored in liquid nitrogen and subsequently transferred to a laboratory facility, where they were preserved at –80 °C until DNA extraction. The sampling procedures adhered to ethical standards and technical guidelines for genetic research on wildlife and were approved under the relevant ethics review protocol (XJUAE-2025-018).
DNA Extraction and Amplification of Cytb and D-loop Genes
Genomic DNA was extracted from beaver faecal samples using the QIAamp Fast DNA Stool Mini Kit (Qiagen, Germany) following the manufacturer’s protocol. Muscle tissue DNA was extracted using the Ezup Column Animal Genomic DNA Purification Kit (Sangon Biotech, China) according to the manufacturer’s instructions.
On the basis of the published complete mitochondrial genome of the Eurasian beaver, primers for Cytb gene amplification were designed using Primer Premier v5.0 [16]. The forward primer was 5′-TCGACCTCCCAACACCAT-3′, and the reverse primer was 5′-GAGAGCTACTACTCCACCGA-3′. Amplification of the mitochondrial D-loop region was performed using the primers Thr-L15926 (5′-CAATTCCCCGGTCTTGTAAACC-3′) and DL-H16340 (5′-CCTGAAGTAGGAACCAGATG-3′), following protocols described by Ducroz and Durka [10,11].
A reaction mixture (25 μL) containing 12.5 μL of 2× PCR buffer, 5 μL of dNTPs (2 mmol/L), 1 μL of KOD FX NEO polymerase (1.0 U/μL), 0.75 μL of each primer (10 pmol/μL), 1.5 μL of template DNA, and 3.5 μL of nuclease-free water was prepared for PCR. The thermal cycling conditions were as follows: initial denaturation at 96 °C for 4 minutes; 35 cycles of denaturation at 96 °C for 40 seconds, annealing at 56 °C for 45 seconds, and extension at 72 °C for 1 minute; and a final extension at 72 °C for 10 minutes and storage at 4 °C.
The amplification products were assessed via 1.0% agarose gel electrophoresis to verify the fragment size and concentration and were stored at –20 °C prior to sequencing. The PCR products of the mitochondrial Cytb and D-loop regions were sequenced by Sangon Biotech (Shanghai, China). The resulting DNA sequences were verified and annotated through BLAST searches against the GenBank database.
DNA Sequence Data Processing
Bidirectional sequencing chromatograms of the Cytb and D-loop genes were initially subjected to manual inspection and correction using Chromas and EditSeq software to ensure sequence accuracy and consistency [17]. Subsequently, sequence trimming and assembly were conducted employing the SeqMan module of the DNAStar 11.0 software suite [18]. The resulting sequences were aligned with the ClustalW algorithm implemented in MEGA 11.0 to produce a standardized alignment. The base composition and the ratio of transitions (Ti) to transversions (Tv) were computed using MEGA 11.0 [19].
The haplotype number (h), haplotype diversity (Hd), and nucleotide diversity (π) were estimated for the entire dataset and for each geographic population using DnaSP 6 [20]. Mismatch distribution analyses were performed to evaluate historical demographic expansions. Neutrality tests, including Tajima’s D [21] and Fu’s Fs [22], alongside pairwise genetic differentiation tests (Fst) [23], were performed using Arlequin 3.1 [24]. Statistical significance was assessed through 1,000 bootstrap replicates [25].
To contextualize the genetic data of C.f. birulai, a comprehensive mitochondrial dataset was compiled from the GenBank database, encompassing global C. fiber and Castor canadensis sequences. Specifically, 16 Cytb and 92 D-loop sequences of C. fiber, along with 4 Cytb and 14 D-loop sequences of C. canadensis, were obtained for phylogenetic reconstruction, haplotype network analysis, and genetic distance estimation. For phylogenetic analyses, the European otter (Lutra lutra) was designated the outgroup (see Supplementary Table S1).
For the analysis of population demographic history, four major geographic units were defined: Russia (two C. fiber subspecies from Russia), China (C.f. birulai beaver populations from China and Mongolia), Europe (three C .fiber subspecies from Europe), and North America (representative populations of the North American beaver (Castor canadensis) (see Supplementary Table S1).
Results
Mitochondrial Sequence Analysis
High-quality genomic DNA was successfully extracted from all 19 Castor fiber birulai samples, and clear amplification bands were obtained for both the Cytb and D-loop regions, indicating successful PCR amplification (see Supplementary Figure S1). After alignment and manual correction, the Cytb sequence was 800 bp in length, with the following base composition: adenine (A) 24.5%, thymine (T) 31.1%, cytosine (C) 31.3%, and guanine (G) 13.1%. The G content was the lowest among the four bases, and the combined A+T content (55.6%) exceeded that of C+G (44.4%), indicating a marked AT bias typical of vertebrate mitochondrial DNA.
The aligned D-loop sequences were 592 bp in length, with the following base compositions: A 27.1%, T 32.3%, C 15.7%, and G 24.8%. The A+T content was 59.4%, again exceeding the G+C content (40.5%) and reflecting a similar AT bias. Substitutions in this region were predominantly transitions, with an estimated transition/transversion ratio (R) of 1.77.
Genetic Diversity of C.f. birulai
Analysis of the 19 samples revealed a single haplotype in the Cytb gene region. In contrast, three haplotypes were identified in the D-loop region, with Hap_1 being the predominant haplotype. The haplotype diversity (Hd) of the D-loop region was 0.444, the nucleotide diversity (π) was 0.0043, and the mean number of nucleotide differences (K) was 2.56.
The Cytb and D-loop sequences were concatenated to generate a combined sequence of 1,258 bp in length. Three haplotypes were identified from the concatenated dataset, which was consistent with those detected in the D-loop region alone. The diversity indices for the concatenated sequence were as follows: Hd = 0.444, π = 0.00181, and K = 2.281 (see Table 1).
Genetic Structure of Xinjiang C.f. birulai
The D-loop region of the C.f. birulai population in China presented low genetic diversity, with a haplotype diversity (Hd) of 0.576 and nucleotide diversity (π) of 0.00515. In contrast, only a single haplotype was detected in the Cytb region, and no nucleotide diversity was detected, indicating an extremely low level of genetic variation within this mitochondrial locus.
In comparison, the Mongolian C.f. birulai population presented slightly greater genetic diversity (D-loop: Hd = 0.600, π = 0.00248; Cytb: Hd = 0.667, π = 0.00083). However, the overall genetic diversity of both Chinese and Mongolian populations remains significantly lower than that reported in other geographic populations of C. fiber and C. canadensis (see Table 2).
Haplotype Network Analysis
Haplotype network analysis revealed a total of eight Cytb haplotypes in beavers distributed across six countries and 52 D-loop haplotypes in beavers distributed across 12 countries (Figure 1). The C. fiber populations presented pronounced geographic genetic structuring. Haplotype networks based on both Cytb and D-loop sequences consistently indicated substantial genetic differentiation between C.f. birulai and other Eurasian beaver subspecies distributed in Europe.
In contrast, European beaver populations presented greater haplotype diversity and a more complex phylogeographic structure. Notably, the Russian beaver samples formed several localized clusters, suggesting diverse historical migration routes. The Romanian beaver samples occupied a central position within the network, linked multiple geographic groups, and may have functioned as a genetic bridge during the historical dispersal of C. fiber across Eurasia.
Phylogenetic trees constructed on the basis of Cytb, D-loop, and concatenated mitochondrial sequences consistently demonstrated that samples from the China–Mongolia border region belong to the subspecies C.f. birulai, forming a stable, distinct clade characterized by strong geographic clustering and genetic homogeneity. In contrast, samples from European populations formed a separate and more complex clade, indicative of a polyphyletic origin (Figure 2). Within this European clade, individuals from Germany, Norway, Austria, and Poland presented greater genetic variation, reflecting multiple historical reintroduction events and admixture from diverse sources. Notably, the British samples grouped with those from Central Europe to form a relatively distinct monophyletic lineage.
Analyses of genetic distance and the genetic differentiation index (Fst) among Eurasian beaver populations revealed minimal genetic distance (0.00269) between the Chinese and Mongolian C.f. birulai populations (Figure 3). However, the corresponding Fst value was notably high (0.67055), suggesting the presence of significant population structure and limited gene flow between the two national populations. Furthermore, pairwise Fst values between Chinese C.f. birulai and various European subspecies—including C.f. albicus (Germany), C.f. galliae (France), C.f. fiber (Norway), and C.f. pohlei, C.f. tuvinicus, and C.f. belorussicus (Russia)—exceed 0.95, indicating a high degree of genetic differentiation between C.f. birulai and other European lineages (Table 3).
Demographic History Analysis
Neutrality tests and mismatch distribution analyses based on the D-loop region revealed distinct demographic patterns among geographic groups. For both the Chinese and European populations, the values of Tajima’s D and Fu’s FS were positive but not statistically significant (China = 0.19152; EU = 1.11565), suggesting an absence of recent population expansion or contraction. The mismatch distribution curve for the Chinese population exhibited a relatively smooth and unimodal shape, closely matching the expected distribution under demographic equilibrium, which is consistent with a stable population history.
In contrast, the North American population presented a significantly negative Fu’s FS value (−5.95), whereas the Russian population also presented a negative Fu’s FS value (−2.71), both of which are indicative of historical demographic expansion. The multimodal shape observed in the mismatch distribution of the Russian population further supports the hypothesis of past expansion events, potentially associated with internal genetic substructure or secondary contact following historical range shifts (Figure 4).
Discussion
Genetic diversity is closely linked to a species’ ability to adapt to new environments survive over evolutionary time. It is a key indicator in assessing the long-term viability of populations, as its loss can lead to decreased individual fitness and reproductive success. In this study, the Chinese population of C.f. birulai presented extremely low genetic variation in both the mitochondrial Cytb and D-loop markers. The number of haplotypes and diversity indices were significantly lower than those reported in other populations of C. fiber and C. canadensis, indicating an overall reduction in genetic diversity. As a protein-coding region of the mitochondrial genome, Cytb is relatively conserved and has low mutation rates, often presenting limited polymorphisms or even a single haplotype in small populations [26,27]. In contrast, the D-loop, as a noncoding control region, evolves faster and accumulates mutations more readily, thus providing richer haplotype information within populations [28].
Previous studies have shown that small and isolated populations of endangered wildlife often present low genetic diversity, habitat-specific adaptations, and loss of migratory behaviour [29]. For example, the isolated population of the Galápagos giant tortoise (Chelonoidis abingdonii) presented extremely low genetic diversity, with certain genetic regions lacking haplotype variation. This genetic homogenization severely constrains the adaptive potential of the population [30]. Similarly, the low census size, narrow distribution, and fragmented habitats of C.f. birulai may restrict gene flow and impede the accumulation and maintenance of novel genetic variation.
Haplotype network and phylogenetic analyses revealed that C.f. birulai constitutes a highly distinct lineage that is clearly differentiated from other European C. fiber populations. This divergence reflects not only the evolutionary trajectory of a peripheral population under strong genetic drift but also the role of geographic isolation and ecological compartmentalization as barriers to gene flow [10]. Similar phylogenetic isolation has been reported in other endangered species with restricted ranges, such as the Hainan gibbon (Nomascus hainanus) and Yunnan snub-nosed monkey (Rhinopithecus bieti), both of which exhibit lineage conservatism and low genetic diversity due to geographic and ecological isolation [31,32]. In the populations of Eurasian otters (Lutra lutra) living in the Pyrenean edge zone, mountainous terrain and isolated river systems likewise hinder gene flow and result in a loss of genetic diversity [33]. These patterns across species underscore the critical role of ecological and geographic barriers in driving lineage independence and reducing genetic diversity in endangered populations.
In contrast, European C. fiber populations present high lineage admixture due to extensive anthropogenic reintroduction during the 20th century. Owing to a lack of lineage-level assessment during release programs, individuals of various subspecies and geographic origins were often translocated into the same areas. For example, individuals from western Europe (C.f. albicus), France (C.f. galliae), Norway (C.f. fiber), and the Voronezh breeding center in Russia (C.f. orientoeuropaeus) were all introduced into regions of Germany, Poland, Austria, and Switzerland. This has led to the emergence of hybrid zones where lineage integrity is significantly disrupted. Although such genetic admixture may increase short-term diversity and promote population growth, it can also undermine local adaptations,lead to behavioural changes, and alter microhabitat utilization strategies, raising concerns about “adaptive conflict” and “genetic pollution” [35]. In Austria and Switzerland, maternal lineage disruption and lineage replacement have already been observed in reintroduced populations [36,37]. Prolonged admixture may further erode rare lineage-specific traits, compromising species-wide phylogenetic integrity and evolutionary resilience [38]. A similar controversy arose in the Alpine brown bear reintroduction project, where mixed-lineage individuals led to the extinction of local lineages [39].
Therefore, future reintroduction efforts must prioritize subspecies and lineage integrity. Molecular evaluations should precede releases to ensure compatibility with existing lineages in target habitats. For example, the “lineage-priority model” implemented in European brown bear (Ursus arctos) management requires strict geographic matching to prevent genetic dilution [40]. In China, reintroduction programs for the forest musk deer (Moschus berezovskii) and Przewalski's horse (Equus przewalskii) have likewise emphasized lineage recognition and isolation, with enforced “lineage consistency” standards, particularly for cross-border population reinforcemen [41,42]. In this context, C.f. birulai—as a lineage-distinct and genetically divergent subspecies—should be managed as an Evolutionarily Significant Unit (ESU). Ex situ conservation and reintroduction programs must avoid genetic introgression from other lineages [43].
Joint analyses of Cytb and D-loop sequences confirmed the formation of a stable, distinct clade encompassing Chinese and Mongolian C.f. birulai populations, which is consistent with the characteristics of an ESU. Despite their small average genetic distance (0.00269), a high Fst value (0.67055) reflects significant genetic differentiation. These findings highlight the influence of physical barriers, habitat fragmentation, genetic drift, and founder effects in shaping divergence [44,45]. The Bulgan River, a cross-border watercourse connecting China and Mongolia, has been affected by dam construction and habitat fragmentation, which likely impedes gene flow across the border. Antoine [46] emphasized that the loss of habitat connectivity is a powerful driver of rapid genetic differentiation—even in the absence of large geographic distances. For example, wild giant pandas (Ailuropoda melanoleuca) have formed distinct genetic clusters across Sichuan, Shaanxi, and Gansu Mountains because of fragmented forests and human barriers [47]. Similarly, the brown-eared pheasant (Crossoptilon mantchuricum) has shown significant genetic differentiation among populations in the Qinling–Taihang region because of deforestation and agricultural expansion [48]. Together, these cross-species findings illustrate a causal chain linking habitat fragmentation, loss of gene flow, and lineage divergence.
Historical demographic analyses further revealed that the C.f. birulai population has not experienced recent expansion or contraction, remaining relatively stable. In contrast, the Russian population showed signs of historical expansion. Population expansion typically requires continuous, suitable aquatic habitats, abundant resources, low anthropogenic disturbance, and strong dispersal capacity. However, C.f. birulai inhabits arid river basins with limited water resources and geographic barriers, which constrain migration and expansion [49]. Although European populations have expanded in number and distribution, mitochondrial data have not mirrored this trend, possibly because of sample admixture, maternal lineage conservatism, and the delayed changes in the D-loop sequence in response to demographic changes [28]. Similar discrepancies have been reported in reintroduced forest musk deer [41], highlighting the need to incorporate nuclear genomic data and multigenerational monitoring to assess the genetic impact of population expansion accurately.
In contemporary conservation practice, endangered species management often faces a dilemma between “population recovery” and “genetic purity.” As one of the most phylogenetically distinct and genetically intact C. f. fiber subspecies, C.f. birulai serves as a living relic for understanding Castor evolution. This study also provides a valuable model for exploring the trade-off between phylogenetic conservatism and genetic diversity in small-range populations.
Acknowledgments
This study was supported by the 2024 Regional Collaborative Innovation Program of the Xinjiang Uygur Autonomous Region (Shanghai Cooperation Organization Science and Technology Partnership Program), the International Science and Technology Cooperation Project “Cross-border Distribution Patterns and Genetic Structure of Castor fiber birulai in the Buergen River”, and the Natural Science Foundation of Xinjiang Uygur Autonomous Region [2022D01C657]. We sincerely thank the Xinjiang Tianma Museum for providing beaver samples and the staff of the Xinjiang Buergen River Beaver National Nature Reserve for their kind assistance during fieldwork.
References
- Rosell, F.; BozsÉR, O.; Collen, P.; Parker, H. Ecological impact of beavers Castor fiber and Castor canadensisand their ability to modify ecosystems. Mammal Review 2005, 35, 248-276. [CrossRef]
- Biedrzycka, A.; Konior, M.; Babik, W.; Świsłocka, M.; Ratkiewicz, M. Admixture of two phylogeographic lineages of the Eurasian beaver in Poland. Mammalian Biology 2014, 79, 287-296. [CrossRef]
- Halley, D.J.; Saveljev, A.P.; Rosell, F.J.M.r. Population and distribution of beavers Castor fiber and Castor canadensis in Eurasia. 2021, 51, 1-24.
- Falaschi, M.; Ficetola, G.F.; Viviano, A.; Mazza, G.; Mori, E. Environmental suitability and potential range expansion of the Eurasian beaver in Italy. Animal Conservation 2023, 27, 324-337. [CrossRef]
- Gaywood, M.J. Reintroducing the Eurasian beaver Castor fiber to Scotland. Mammal Review 2017, 48, 48-61. [CrossRef]
- Halley, D.J. Sourcing Eurasian beaver Castor fiber stock for reintroductions in Great Britain and Western Europe. Mammal Review 2010, 41, 40-53. [CrossRef]
- Marr, M.M.; Brace, S.; Schreve, D.C.; Barnes, I. Identifying source populations for the reintroduction of the Eurasian beaver, Castor fiber L. 1758, into Britain: evidence from ancient DNA. Scientific Reports 2018, 8. [CrossRef]
- Campbell-Palmer, R.; Rosell, F.; Naylor, A.; Cole, G.; Mota, S.; Brown, D.; Fraser, M.; Pizzi, R.; Elliott, M.; Wilson, K.; et al. Eurasian beaver (Castor fiber) health surveillance in Britain: Assessing a disjunctive reintroduced population. Veterinary Record 2021, 188. [CrossRef]
- Senn, H.; Ogden, R.; Frosch, C.; Syrůčková, A.; Campbell-Palmer, R.; Munclinger, P.; Durka, W.; Kraus, R.H.S.; Saveljev, A.P.; Nowak, C.; et al. Nuclear and mitochondrial genetic structure in the Eurasian beaver (Castor fiber) – implications for future reintroductions. Evolutionary Applications 2014, 7, 645-662. [CrossRef]
- Ducroz, J.-F.; Stubbe, M.; Saveljev, A.P.; Heidecke, D.; Samjaa, R.; Ulevičius, A.; Stubbe, A.; Durka, W. Genetic Variation and Population Structure of the Eurasian Beaver Castor fiber in Eastern Europe and Asia. Journal of Mammalogy 2005, 86, 1059-1067. [CrossRef]
- Halley, D.J.; Saveljev, A.P.; Rosell, F. Population and distribution of beaversCastor fiberand Castor canadensisin Eurasia. Mammal Review 2020, 51, 1-24. [CrossRef]
- Chu, H.; Jiang, Z. Distribution and conservation of the Sino-Mongolian beaver Castor fiber birulai in China. Oryx 2009, 43. [CrossRef]
- Saveljev, A.P.; Niamosor, B.; Shaariybuu, B.; Batseren, D. Self-eating in beavers — trophic opportunism or reaction on stress Extreme case from Mongolia. Russian Journal of Theriology 2016, 15, 68-74. [CrossRef]
- Halley, D.; Rosell, F.; Saveljev, A.J.B.F. Population and distribution of Eurasian beaver (Castor fiber). 2012, 18, 168-175.
- Horn, S.; Durka, W.; Wolf, R.; Ermala, A.; Stubbe, A.; Stubbe, M.; Hofreiter, M.J.P.o. Mitochondrial genomes reveal slow rates of molecular evolution and the timing of speciation in beavers (Castor), one of the largest rodent species. 2011, 6, e14622.
- Singh, V.K.; Mangalam, A.K.; Dwivedi, S.; Naik, S. Primer Premier: Program for Design of Degenerate Primers from a Protein Sequence. BioTechniques 2018, 24, 318-319. [CrossRef]
- Li, L.; Wang, X.; Gai, J.; Yu, D.J.D.S. Isolation and characterization of a seed-specific isoform of microsomal omega-6 fatty acid desaturase gene (FAD2-1B) from soybean: Full Length Research Article. 2008, 19, 28-36.
- Burland, T.G.J.B.m.; protocols. DNASTAR’s Lasergene sequence analysis software. 1999, 71-91.
- Tamura, K.; Stecher, G.; Kumar, S.; Battistuzzi, F.U. MEGA11: Molecular Evolutionary Genetics Analysis Version 11. Molecular Biology and Evolution 2021, 38, 3022-3027. [CrossRef]
- Rozas, J.; Ferrer-Mata, A.; Sánchez-DelBarrio, J.C.; Guirao-Rico, S.; Librado, P.; Ramos-Onsins, S.E.; Sánchez-Gracia, A. DnaSP 6: DNA Sequence Polymorphism Analysis of Large Data Sets. Molecular Biology and Evolution 2017, 34, 3299-3302. [CrossRef]
- Excoffier, L.; Laval, G.; Schneider, S.J.E.b. Arlequin (version 3.0): an integrated software package for population genetics data analysis. 2005, 1, 117693430500100003.
- Tajima, F.J.G. Statistical method for testing the neutral mutation hypothesis by DNA polymorphism. 1989, 123, 585-595.
- Fu, Y.-X.J.G. Statistical tests of neutrality of mutations against population growth, hitchhiking and background selection. 1997, 147, 915-925.
- Weir, B.S.; Cockerham, C.C. Estimatingf-Statistics for the Analysis of Population Structure. Evolution 1984, 38, 1358-1370. [CrossRef]
- Exeoeffr, L.; Smouse, P.; Quattro, J.J.G. Analysis of molecular variance inferred from metric distances among DNA haplotypes: applications to human mitochondrial DNA restriction data. 1992, 131, 479-491.
- Moritz, C.J.T.i.e.; evolution. Defining ‘evolutionarily significant units’ for conservation. 1994, 9, 373-375.
- Hoban, S.; Bruford, M.W.; da Silva, J.M.; Funk, W.C.; Frankham, R.; Gill, M.J.; Grueber, C.E.; Heuertz, M.; Hunter, M.E.; Kershaw, F.; et al. Genetic diversity goals and targets have improved, but remain insufficient for clear implementation of the post-2020 global biodiversity framework. Conservation Genetics 2023, 24, 181-191. [CrossRef]
- Zhang, Y.M.; Sheikh, S.I.; Ward, A.K.G.; Forbes, A.A.; Prior, K.M.; Stone, G.N.; Gates, M.W.; Egan, S.P.; Zhang, L.; Davis, C.; et al. Delimiting the cryptic diversity and host preferences of Sycophila parasitoid wasps associated with oak galls using phylogenomic data. Molecular Ecology 2022, 31, 4417-4433. [CrossRef]
- Frankham, R. Genetics and extinction. Biological Conservation 2005, 126, 131-140. [CrossRef]
- Loire, E.; Chiari, Y.; Bernard, A.; Cahais, V.; Romiguier, J.; Nabholz, B.; Lourenço, J.M.; Galtier, N.J.G.B. Population genomics of the endangered giant Galápagos tortoise. 2013, 14, 1-11.
- Guo, Y.; Chang, J.; Han, L.; Liu, T.; Li, G.; Garber, P.A.; Xiao, N.; Zhou, J. The Genetic Status of the Critically Endangered Hainan Gibbon (Nomascus hainanus): A Species Moving Toward Extinction. Frontiers in Genetics 2020, 11. [CrossRef]
- Kuang, W.; Zinner, D.; Li, Y.; Yao, X.; Roos, C.; Yu, L. Recent Advances in Genetics and Genomics of Snub-Nosed Monkeys (Rhinopithecus) and Their Implications for Phylogeny, Conservation, and Adaptation. Genes 2023, 14. [CrossRef]
- Fernández-Morán, J.; Saavedra, D.; Manteca-Vilanova, X.J.J.o.Z.; Medicine, W. Reintroduction of the Eurasian otter (Lutra lutra) in northeastern Spain: trapping, handling, and medical management. 2002, 33, 222-227.
- Canestrelli, D.; Frosch, C.; Kraus, R.H.S.; Angst, C.; Allgöwer, R.; Michaux, J.; Teubner, J.; Nowak, C. The Genetic Legacy of Multiple Beaver Reintroductions in Central Europe. PLoS ONE 2014, 9. [CrossRef]
- Tigano, A.; Friesen, V.L. Genomics of local adaptation with gene flow. Molecular Ecology 2016, 25, 2144-2164. [CrossRef]
- Gouskov, A.; Vorburger, C. Postglacial recolonizations, watershed crossings and human translocations shape the distribution of chub lineages around the Swiss Alps. BMC Evolutionary Biology 2016, 16. [CrossRef]
- Caramelli, D.; Elsner, J.; Hofreiter, M.; Schibler, J.; Schlumbaum, A. Ancient mtDNA diversity reveals specific population development of wild horses in Switzerland after the Last Glacial Maximum. Plos One 2017, 12. [CrossRef]
- Groombridge, J.J.; Raisin, C.; Bristol, R.; Richardson, D.S.J.R.b.I.s.; management. Genetic consequences of reintroductions and insights from population history. 2012, 395-440.
- Preatoni, D.; Mustoni, A.; Martinoli, A.; Carlini, E.; Chiarenzi, B.; Chiozzini, S.; Van Dongen, S.; Wauters, L.A.; Tosi, G. Conservation of brown bear in the Alps: space use and settlement behavior of reintroduced bears. Acta Oecologica 2005, 28, 189-197. [CrossRef]
- Swenson, J.E.; Taberlet, P.; Bellemain, E. Genetics and conservation of European brown bears Ursus arctos. Mammal Review 2011, 41, 87-98. [CrossRef]
- Yang, S.; Zhang, T.; Li, Y.; Xu, S.; Zhang, M.; Hu, X.; Liu, S.; Hu, D.; Wronski, T. Identifying personality traits and their potential application to the management of captive forest musk deer (Moschus berezovskii). Applied Animal Behaviour Science 2021, 234. [CrossRef]
- Tarav, M.; Tokunaga, M.; Kondo, T.; Kato-Mori, Y.; Hoshino, B.; Dorj, U.; Hagiwara, K. Problems in the Protection of Reintroduced Przewalski's Horses (Equus ferus przewalskii) Caused by Piroplasmosis. Journal of Wildlife Diseases 2017, 53, 911-915. [CrossRef]
- Crandall, K.A.; Bininda-Emonds, O.R.; Mace, G.M.; Wayne, R.K.J.T.i.e.; evolution. Considering evolutionary processes in conservation biology. 2000, 15, 290-295.
- Stock, S.E.; Klop-Toker, K.; Wallace, S.; Kelly, O.; Callen, A.; Seeto, R.; Mahony, S.V.; Hayward, M.W.; Mahony, M.J. Uncovering inbreeding, small populations, and strong genetic isolation in an Australian threatened frog, Litoria littlejohni. Conservation Genetics 2023, 24, 575-588. [CrossRef]
- Perrin, A.; Khimoun, A.; Faivre, B.; Ollivier, A.; de Pracontal, N.; Théron, F.; Loubon, M.; Leblond, G.; Duron, O.; Garnier, S. Habitat fragmentation differentially shapes neutral and immune gene variation in a tropical bird species. Heredity 2020, 126, 148-162. [CrossRef]
- Perrin, A.; Khimoun, A.; Faivre, B.; Ollivier, A.; de Pracontal, N.; Théron, F.; Loubon, M.; Leblond, G.; Duron, O.; Garnier, S.J.H. Habitat fragmentation differentially shapes neutral and immune gene variation in a tropical bird species. 2021, 126, 148-162.
- Lan, T.; Yang, S.; Li, H.; Zhang, Y.; Li, R.; Sahu, S.K.; Deng, W.; Liu, B.; Shi, M.; Wang, S.; et al. Large-scale genome sequencing of giant pandas improves the understanding of population structure and future conservation initiatives. Proceedings of the National Academy of Sciences 2024, 121. [CrossRef]
- Wang, P.; Burley, J.T.; Liu, Y.; Chang, J.; Chen, D.; Lu, Q.; Li, S.-H.; Zhou, X.; Edwards, S.; Zhang, Z.; et al. Genomic Consequences of Long-Term Population Decline in Brown Eared Pheasant. Molecular Biology and Evolution 2021, 38, 263-273. [CrossRef]
- Hodgson, J.A.; Moilanen, A.; Wintle, B.A.; Thomas, C.D. Habitat area, quality and connectivity: striking the balance for efficient conservation. Journal of Applied Ecology 2010, 48, 148-152. [CrossRef]
Figure 1.
Haplotype networks of Eurasian beavers based on mitochondrial Cytb (A) and D-loop (B) sequences.
Figure 1.
Haplotype networks of Eurasian beavers based on mitochondrial Cytb (A) and D-loop (B) sequences.
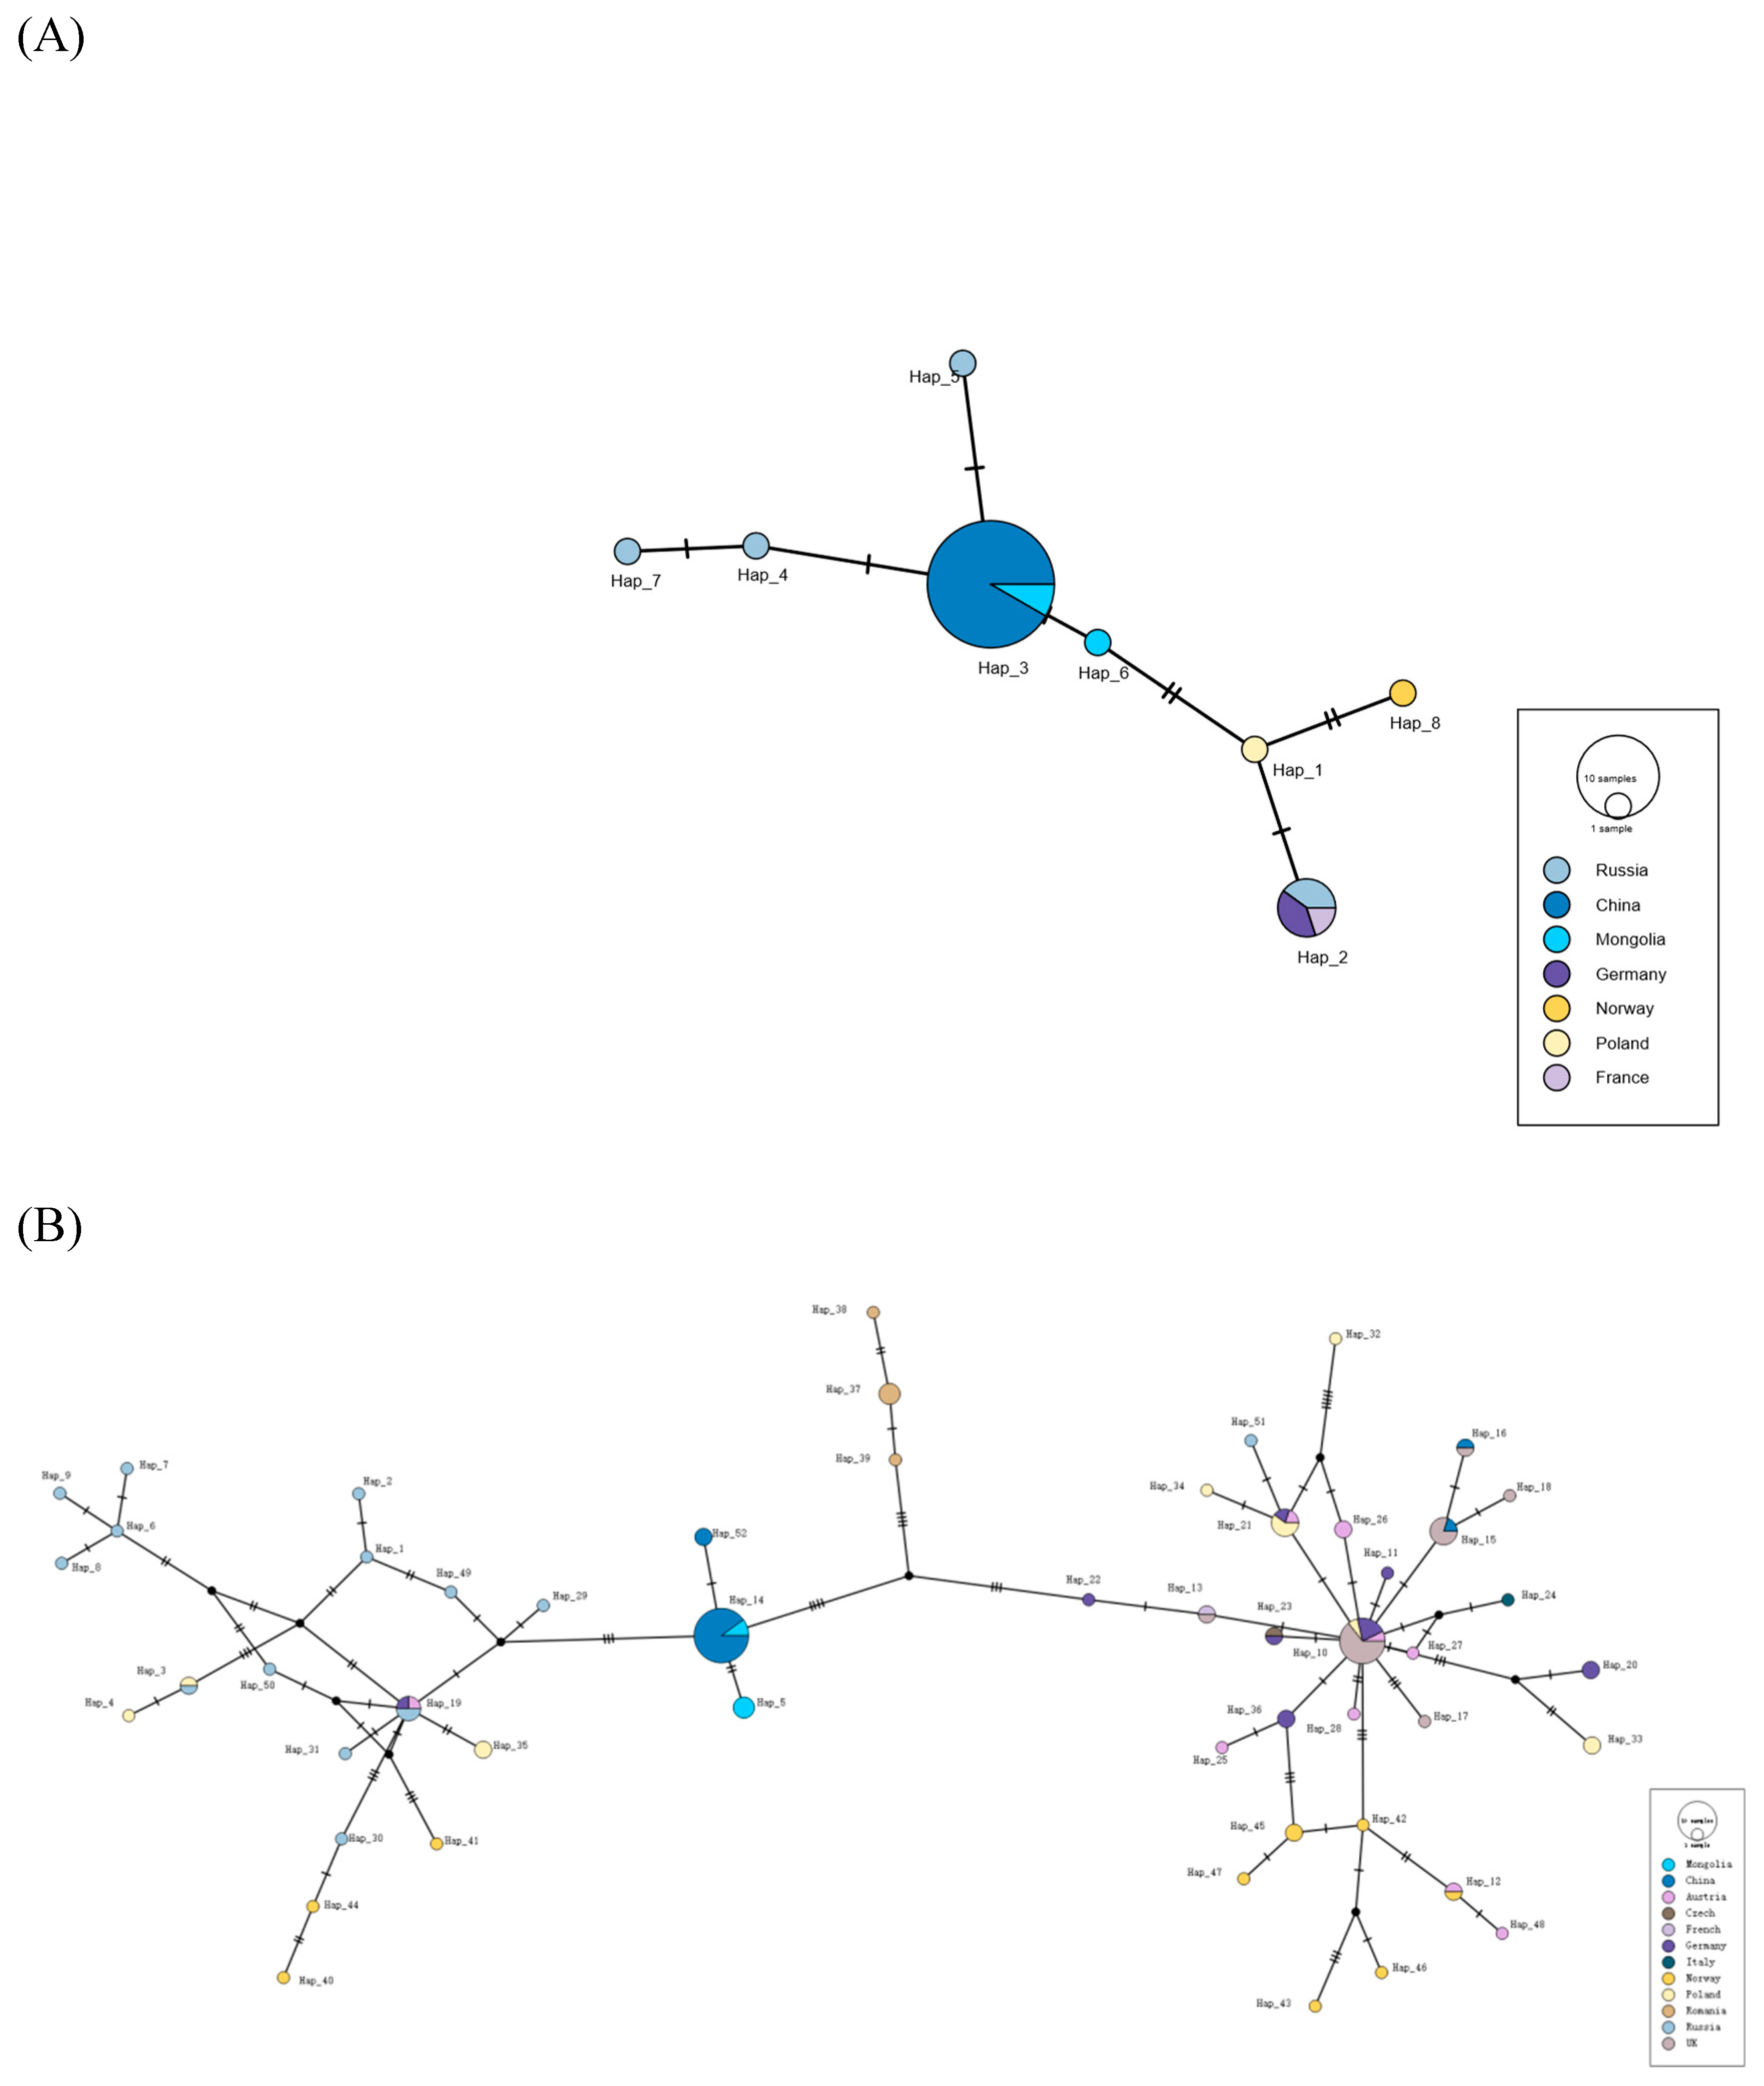
Figure 2.
Phylogenetic trees of beavers based on Cytb (A), D-loop (B), and concatenated sequences (C).
Figure 2.
Phylogenetic trees of beavers based on Cytb (A), D-loop (B), and concatenated sequences (C).
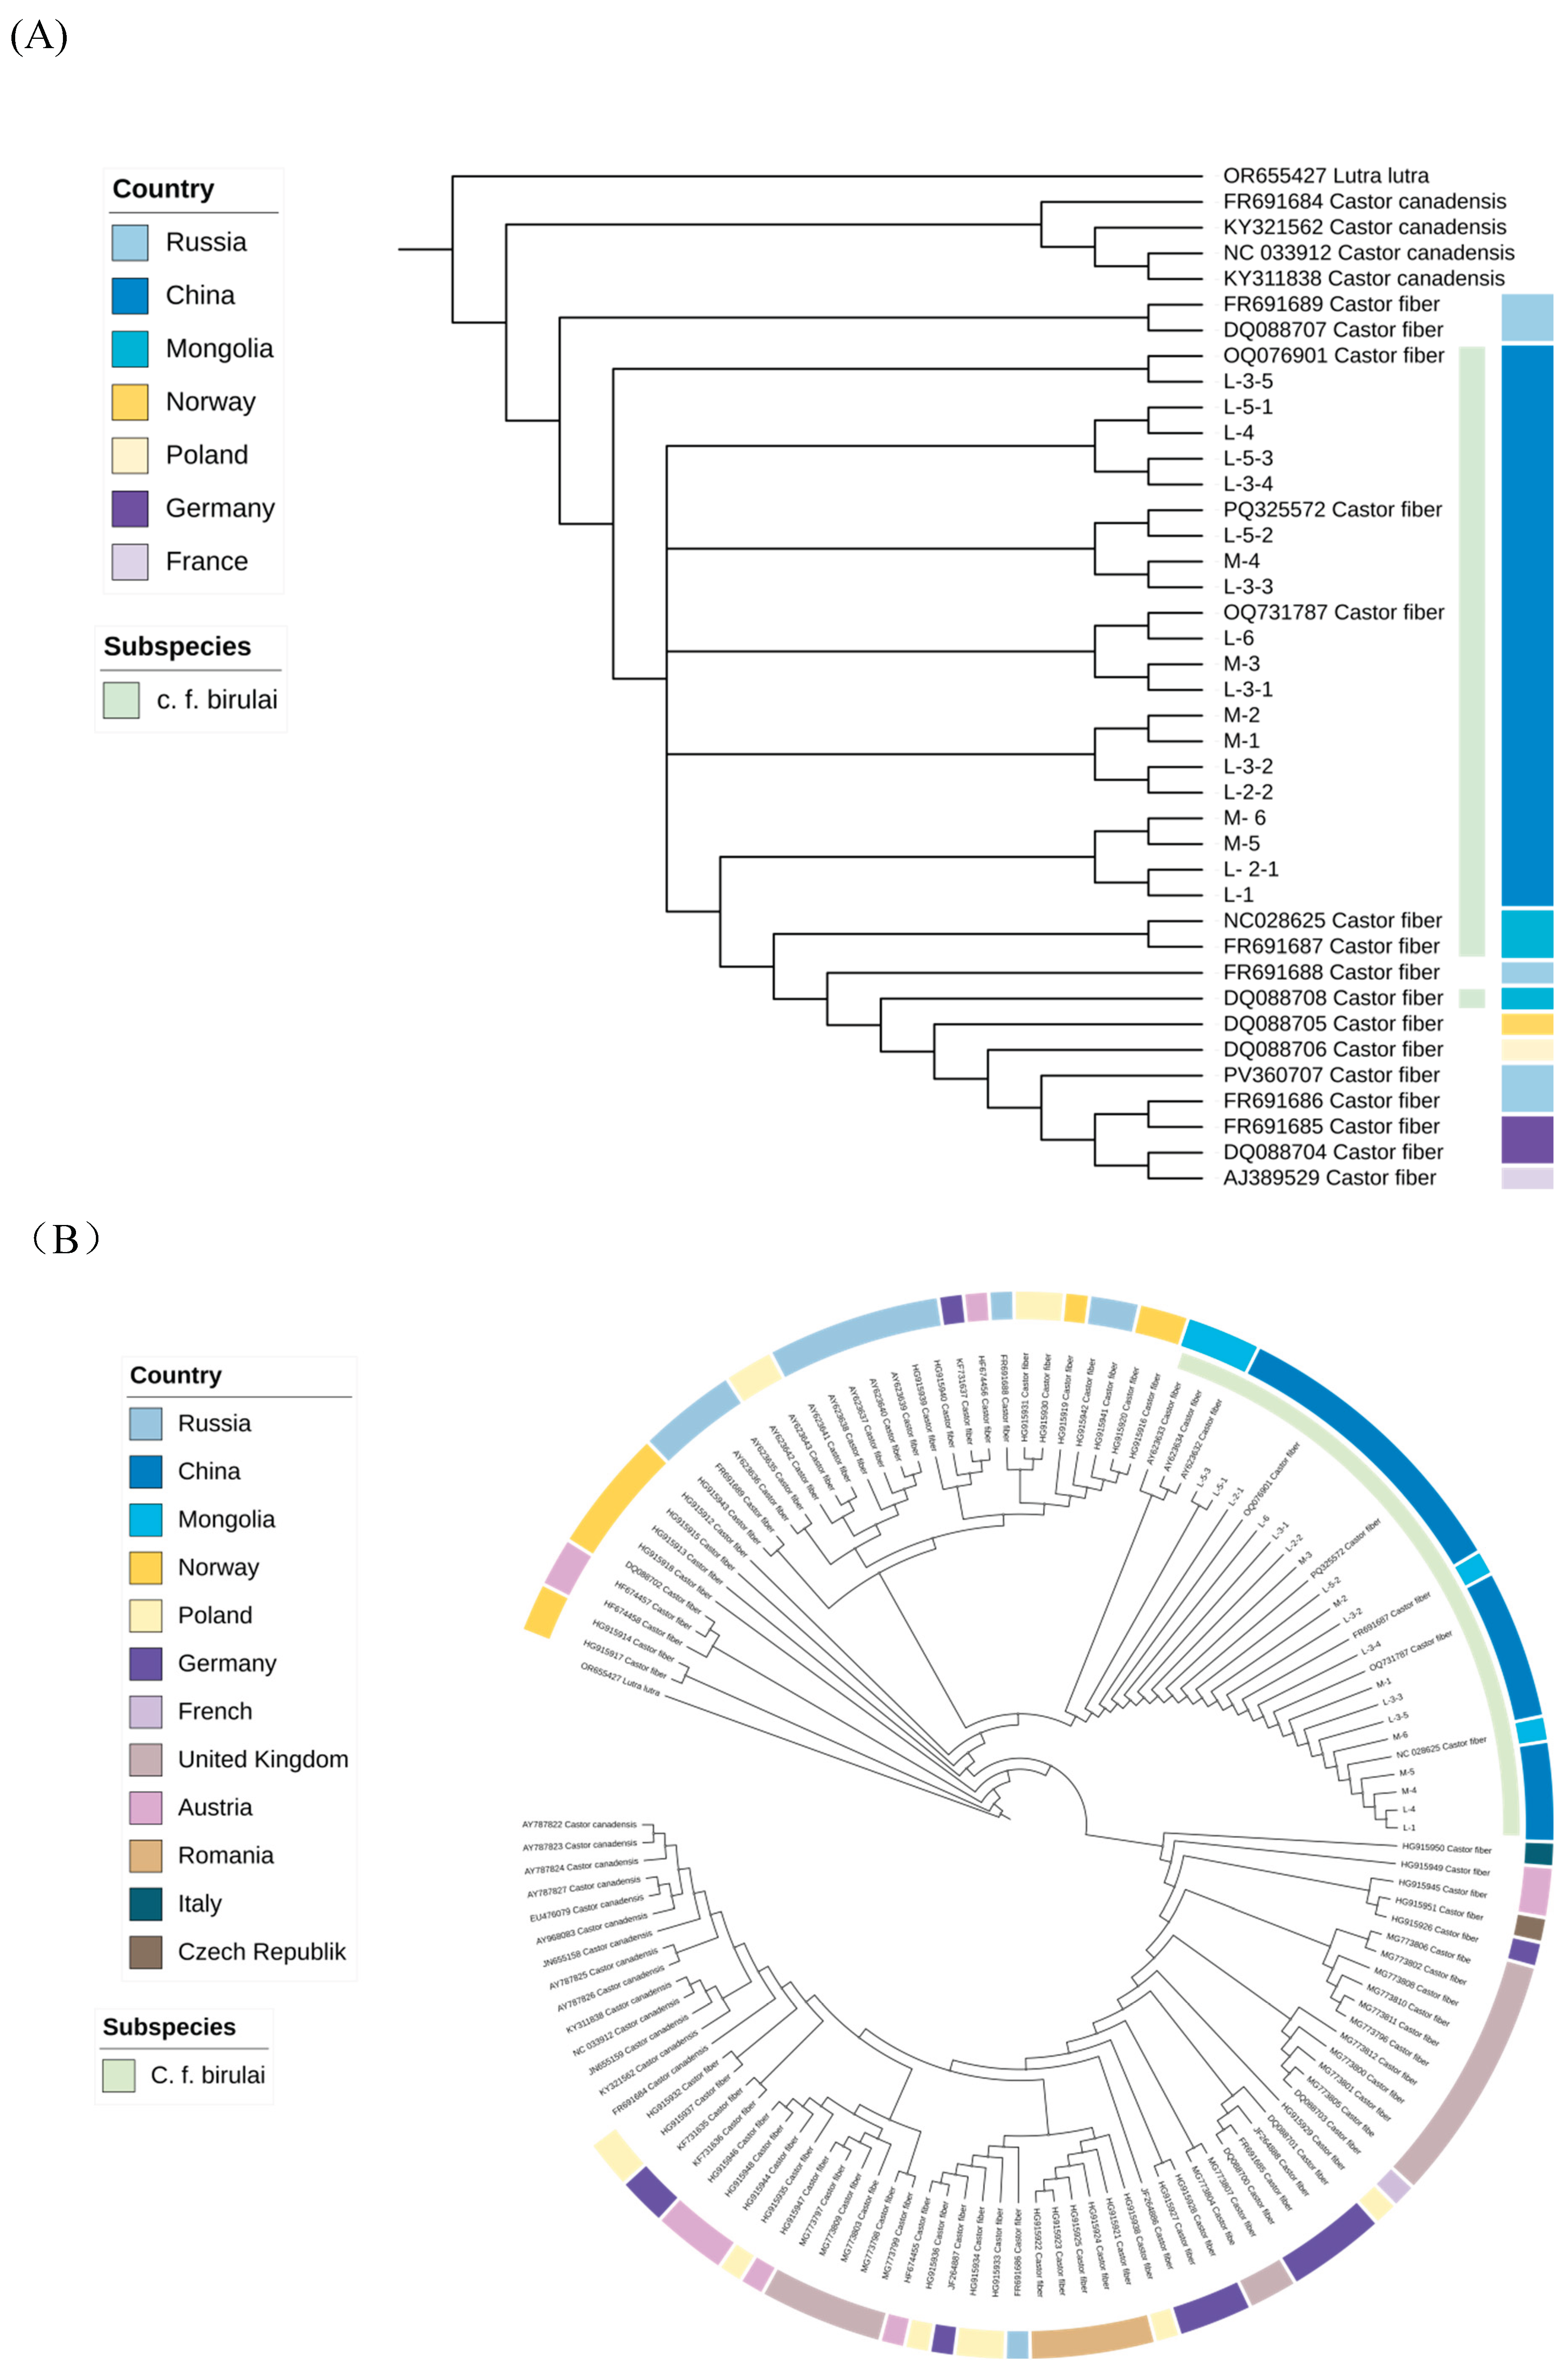
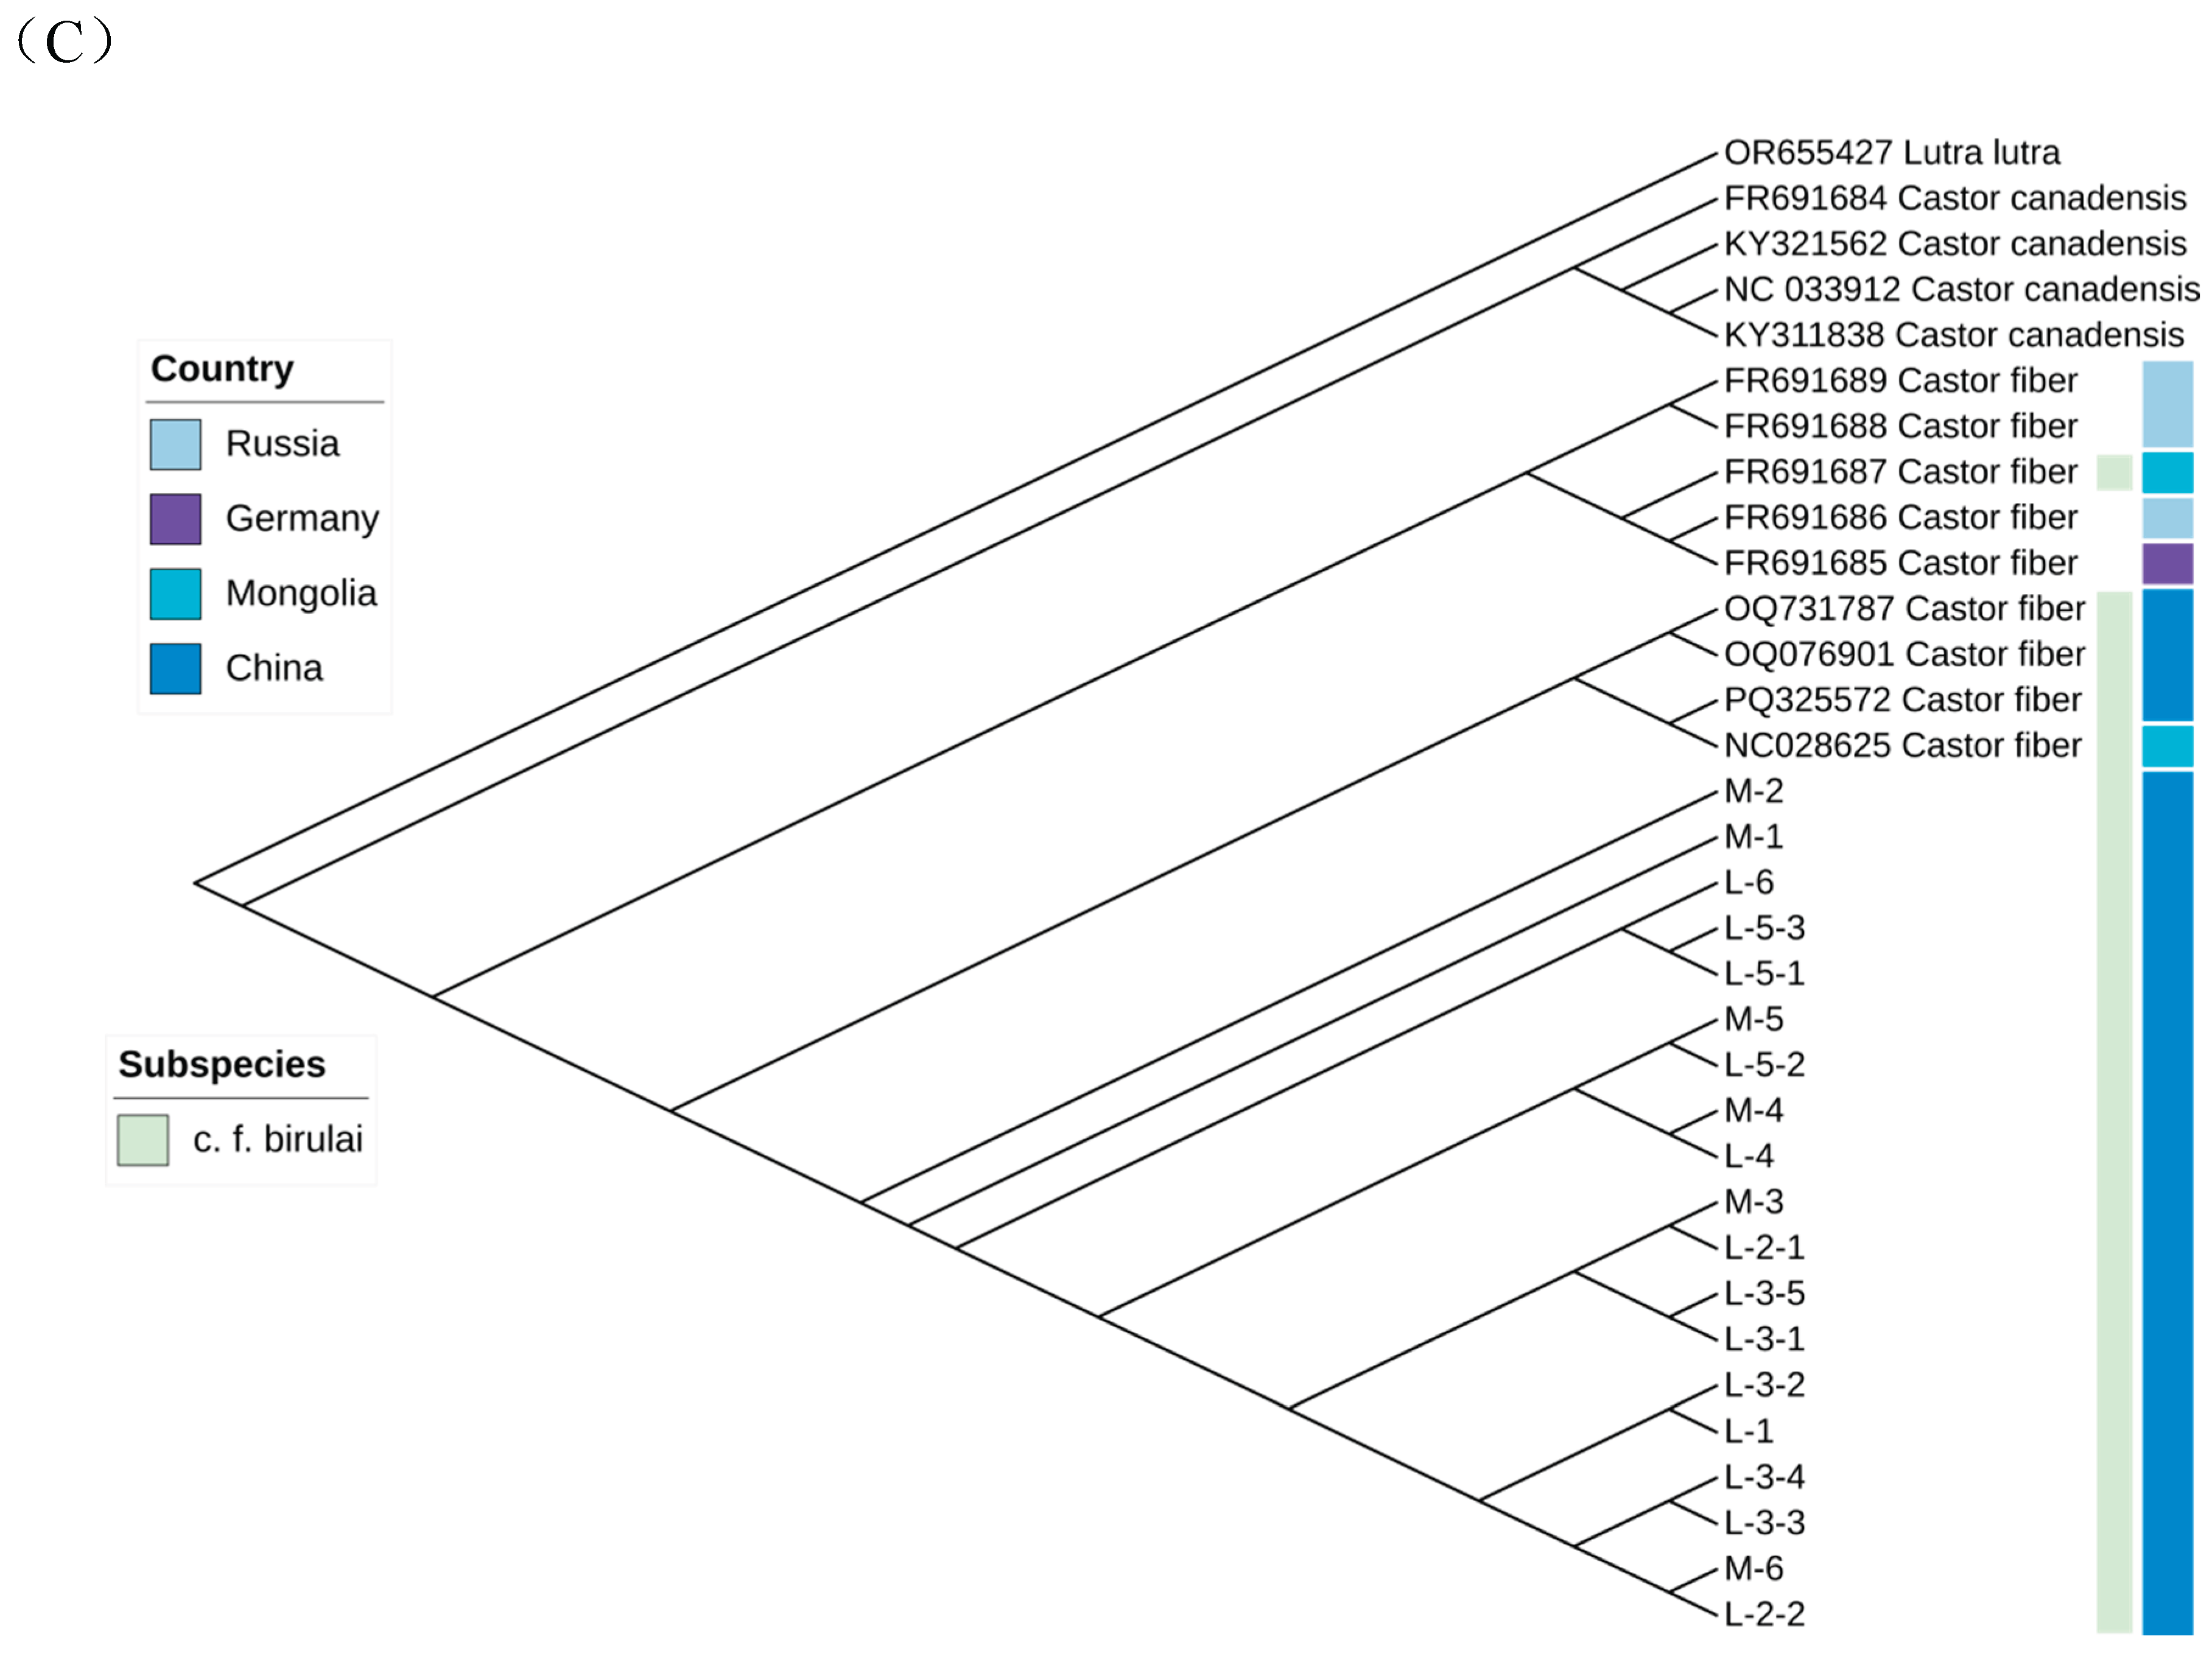
Figure 3.
Phylogenetic tree based on D-loop genetic distances among different Castor fiber.
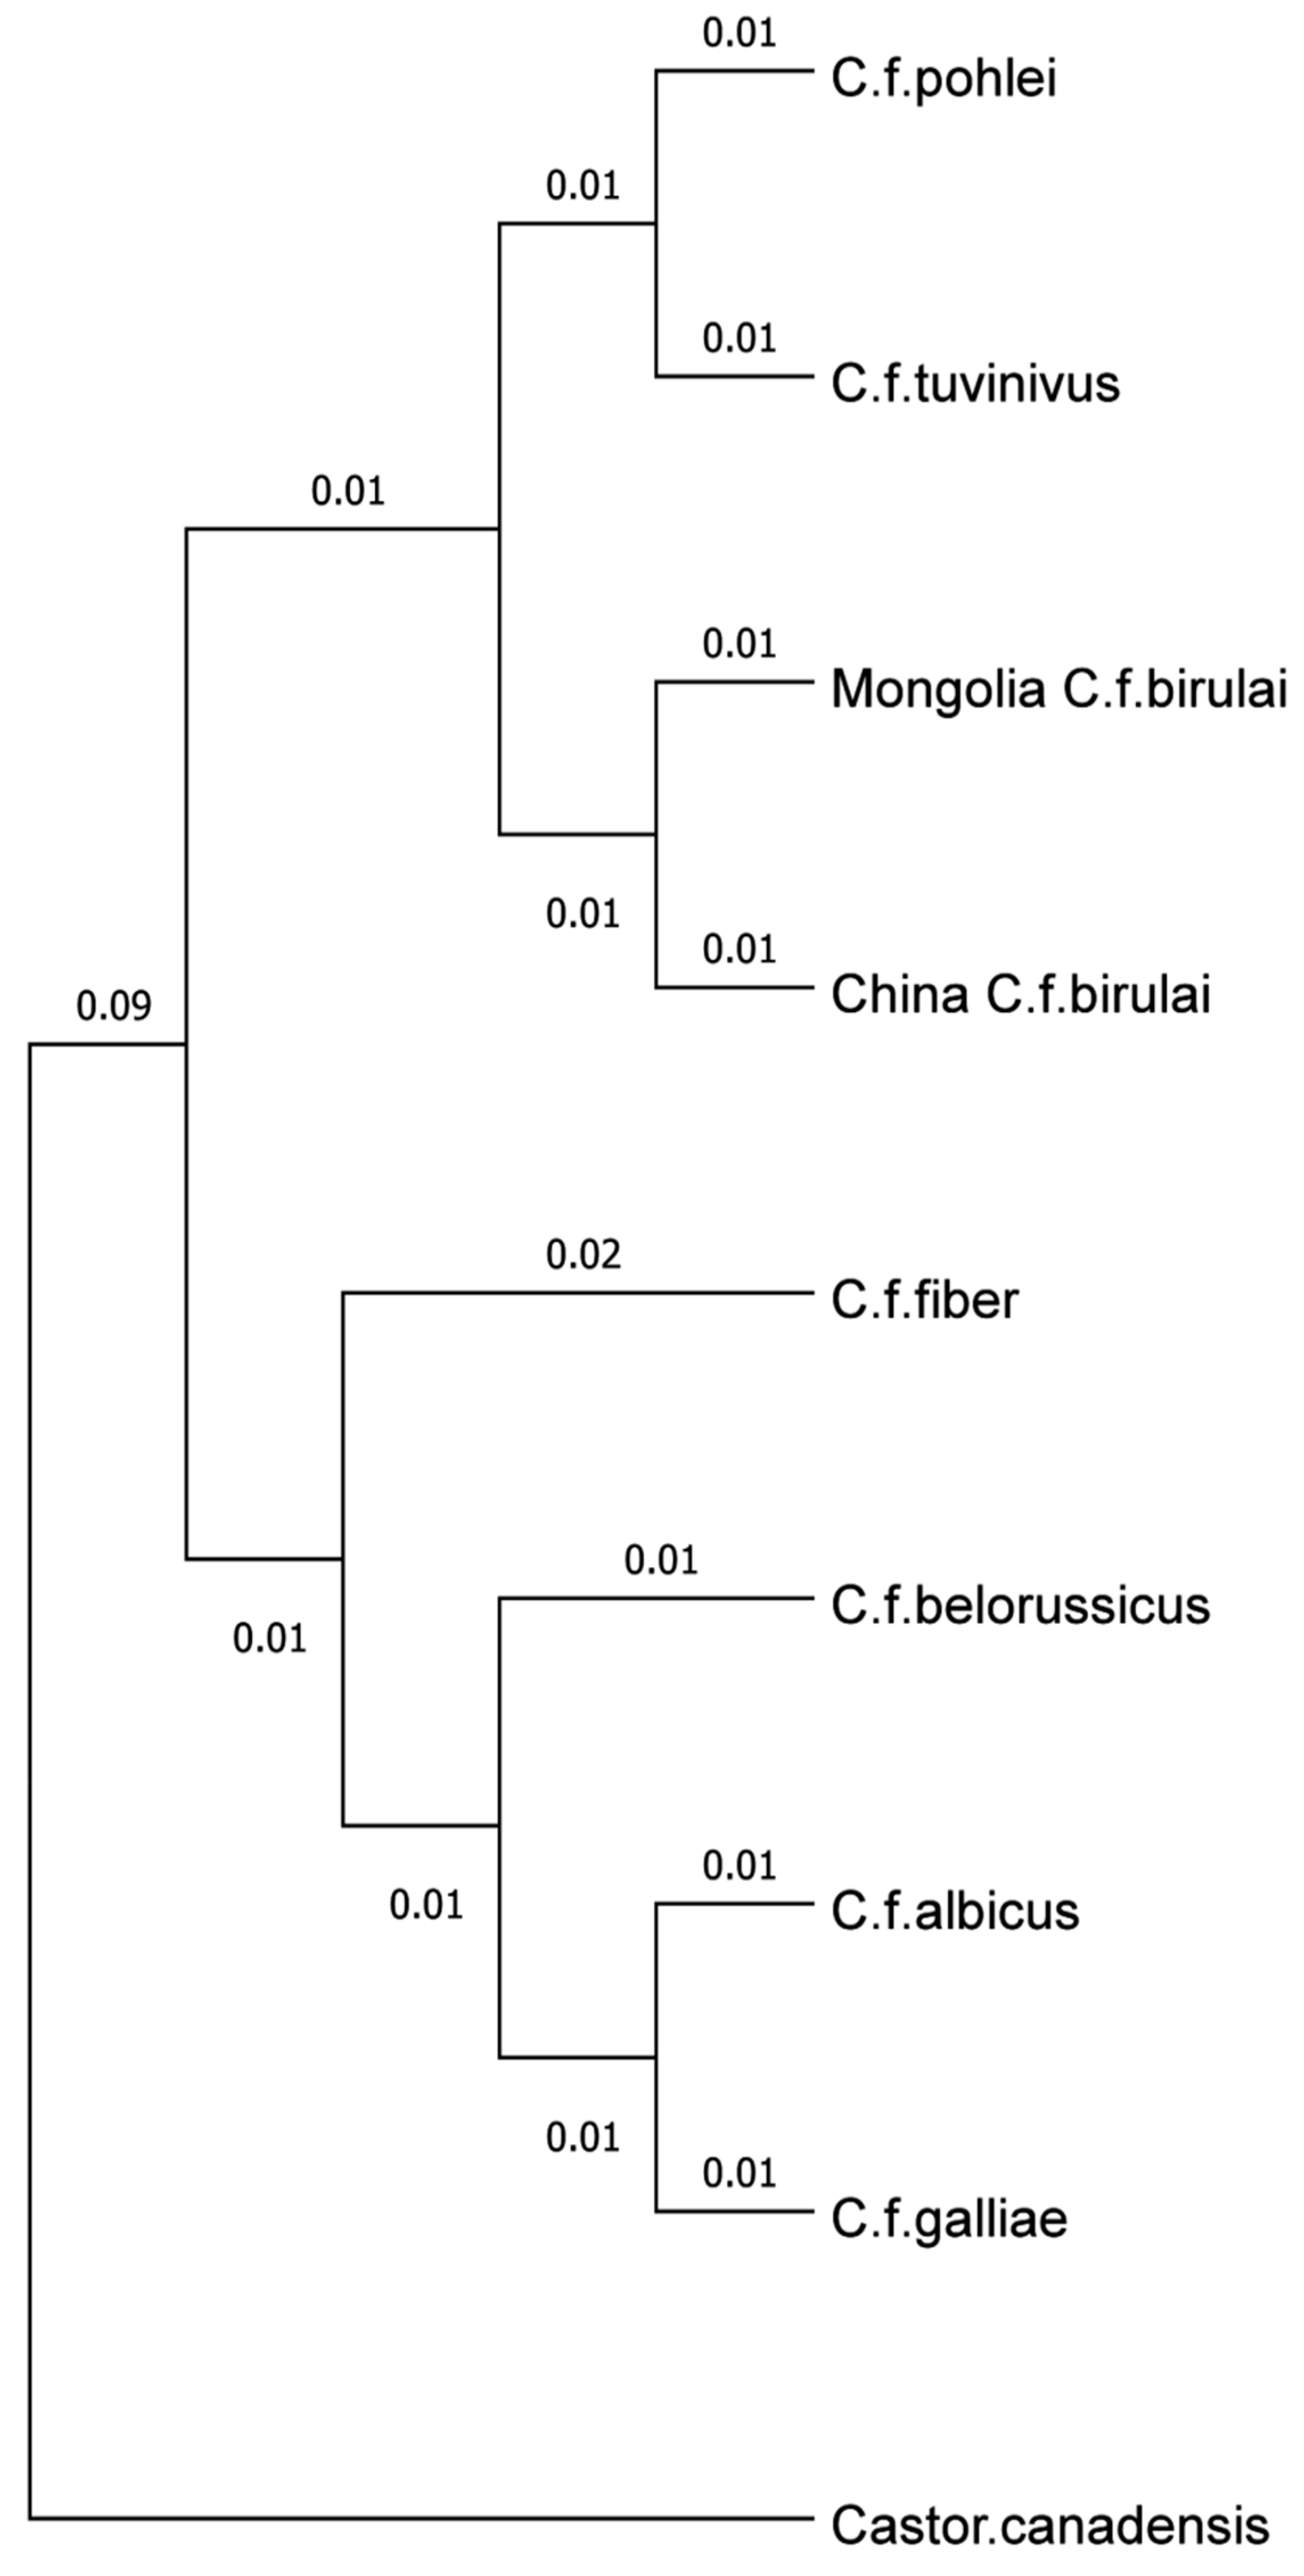
Figure 4.
Mismatch distribution of D-loop haplotypes in Eurasian beavers: (A) Russia, (B) China, (C) Europe, and (D) C. canadensis.
Figure 4.
Mismatch distribution of D-loop haplotypes in Eurasian beavers: (A) Russia, (B) China, (C) Europe, and (D) C. canadensis.
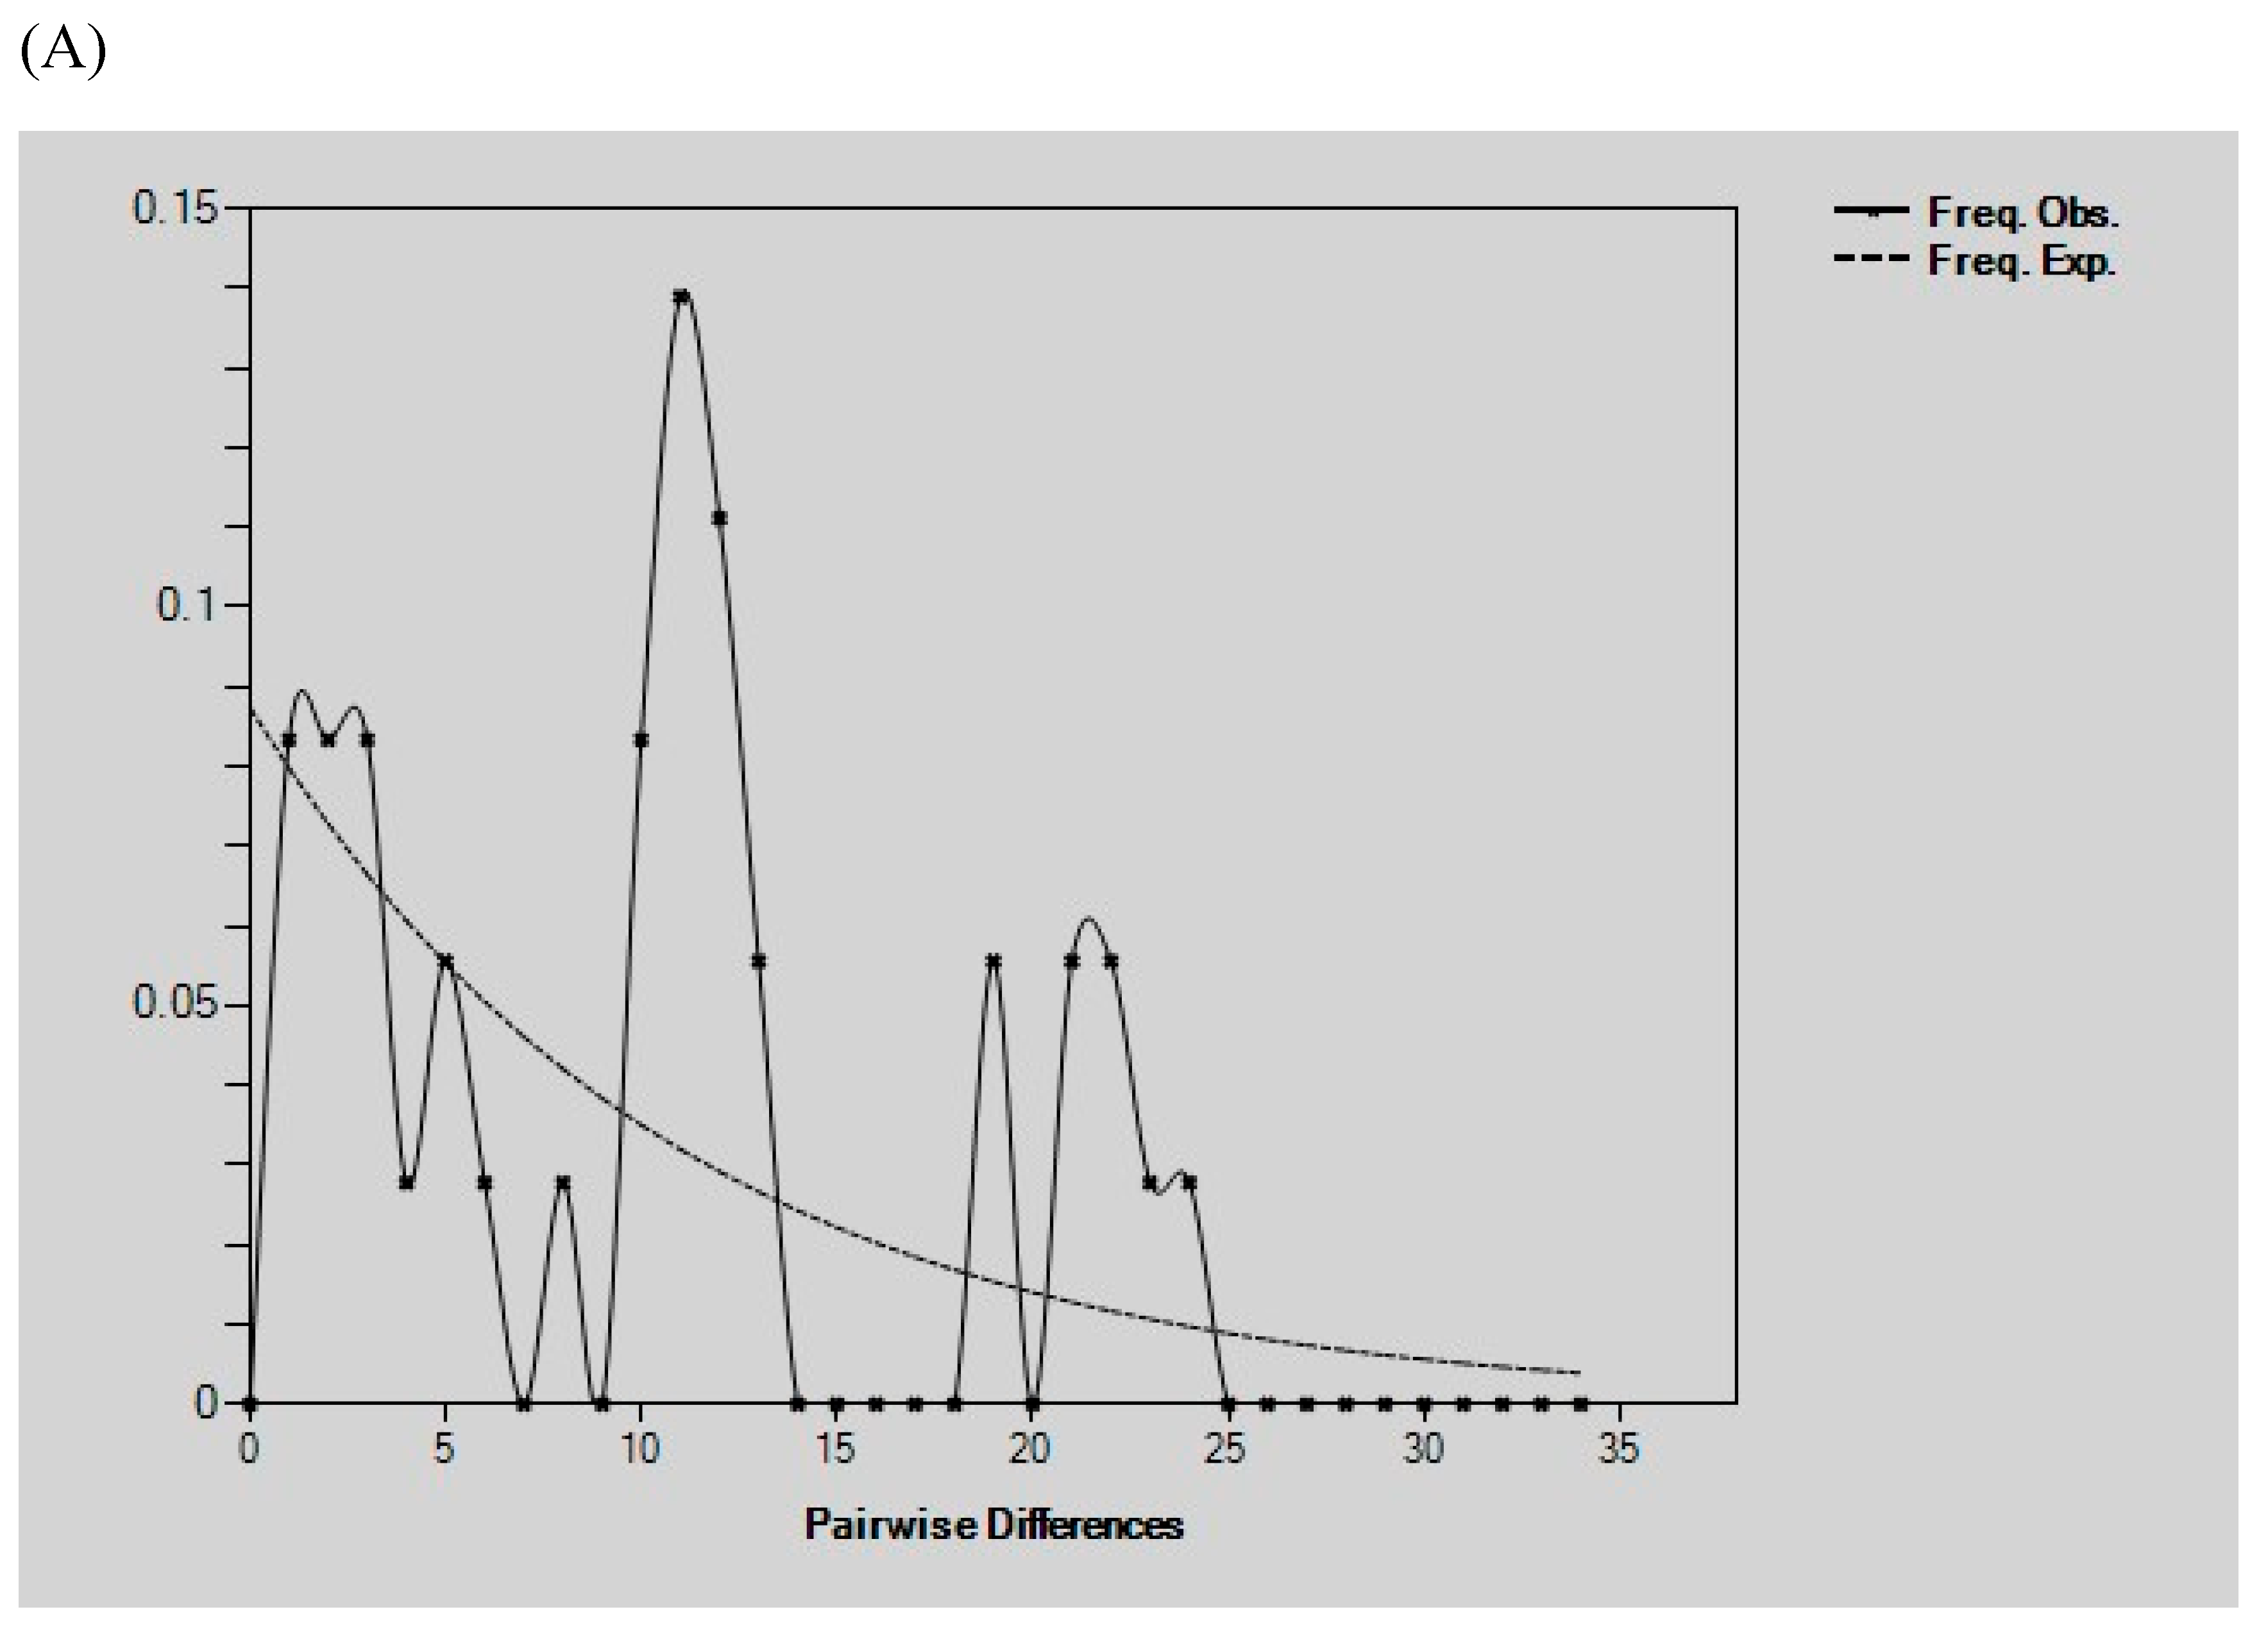
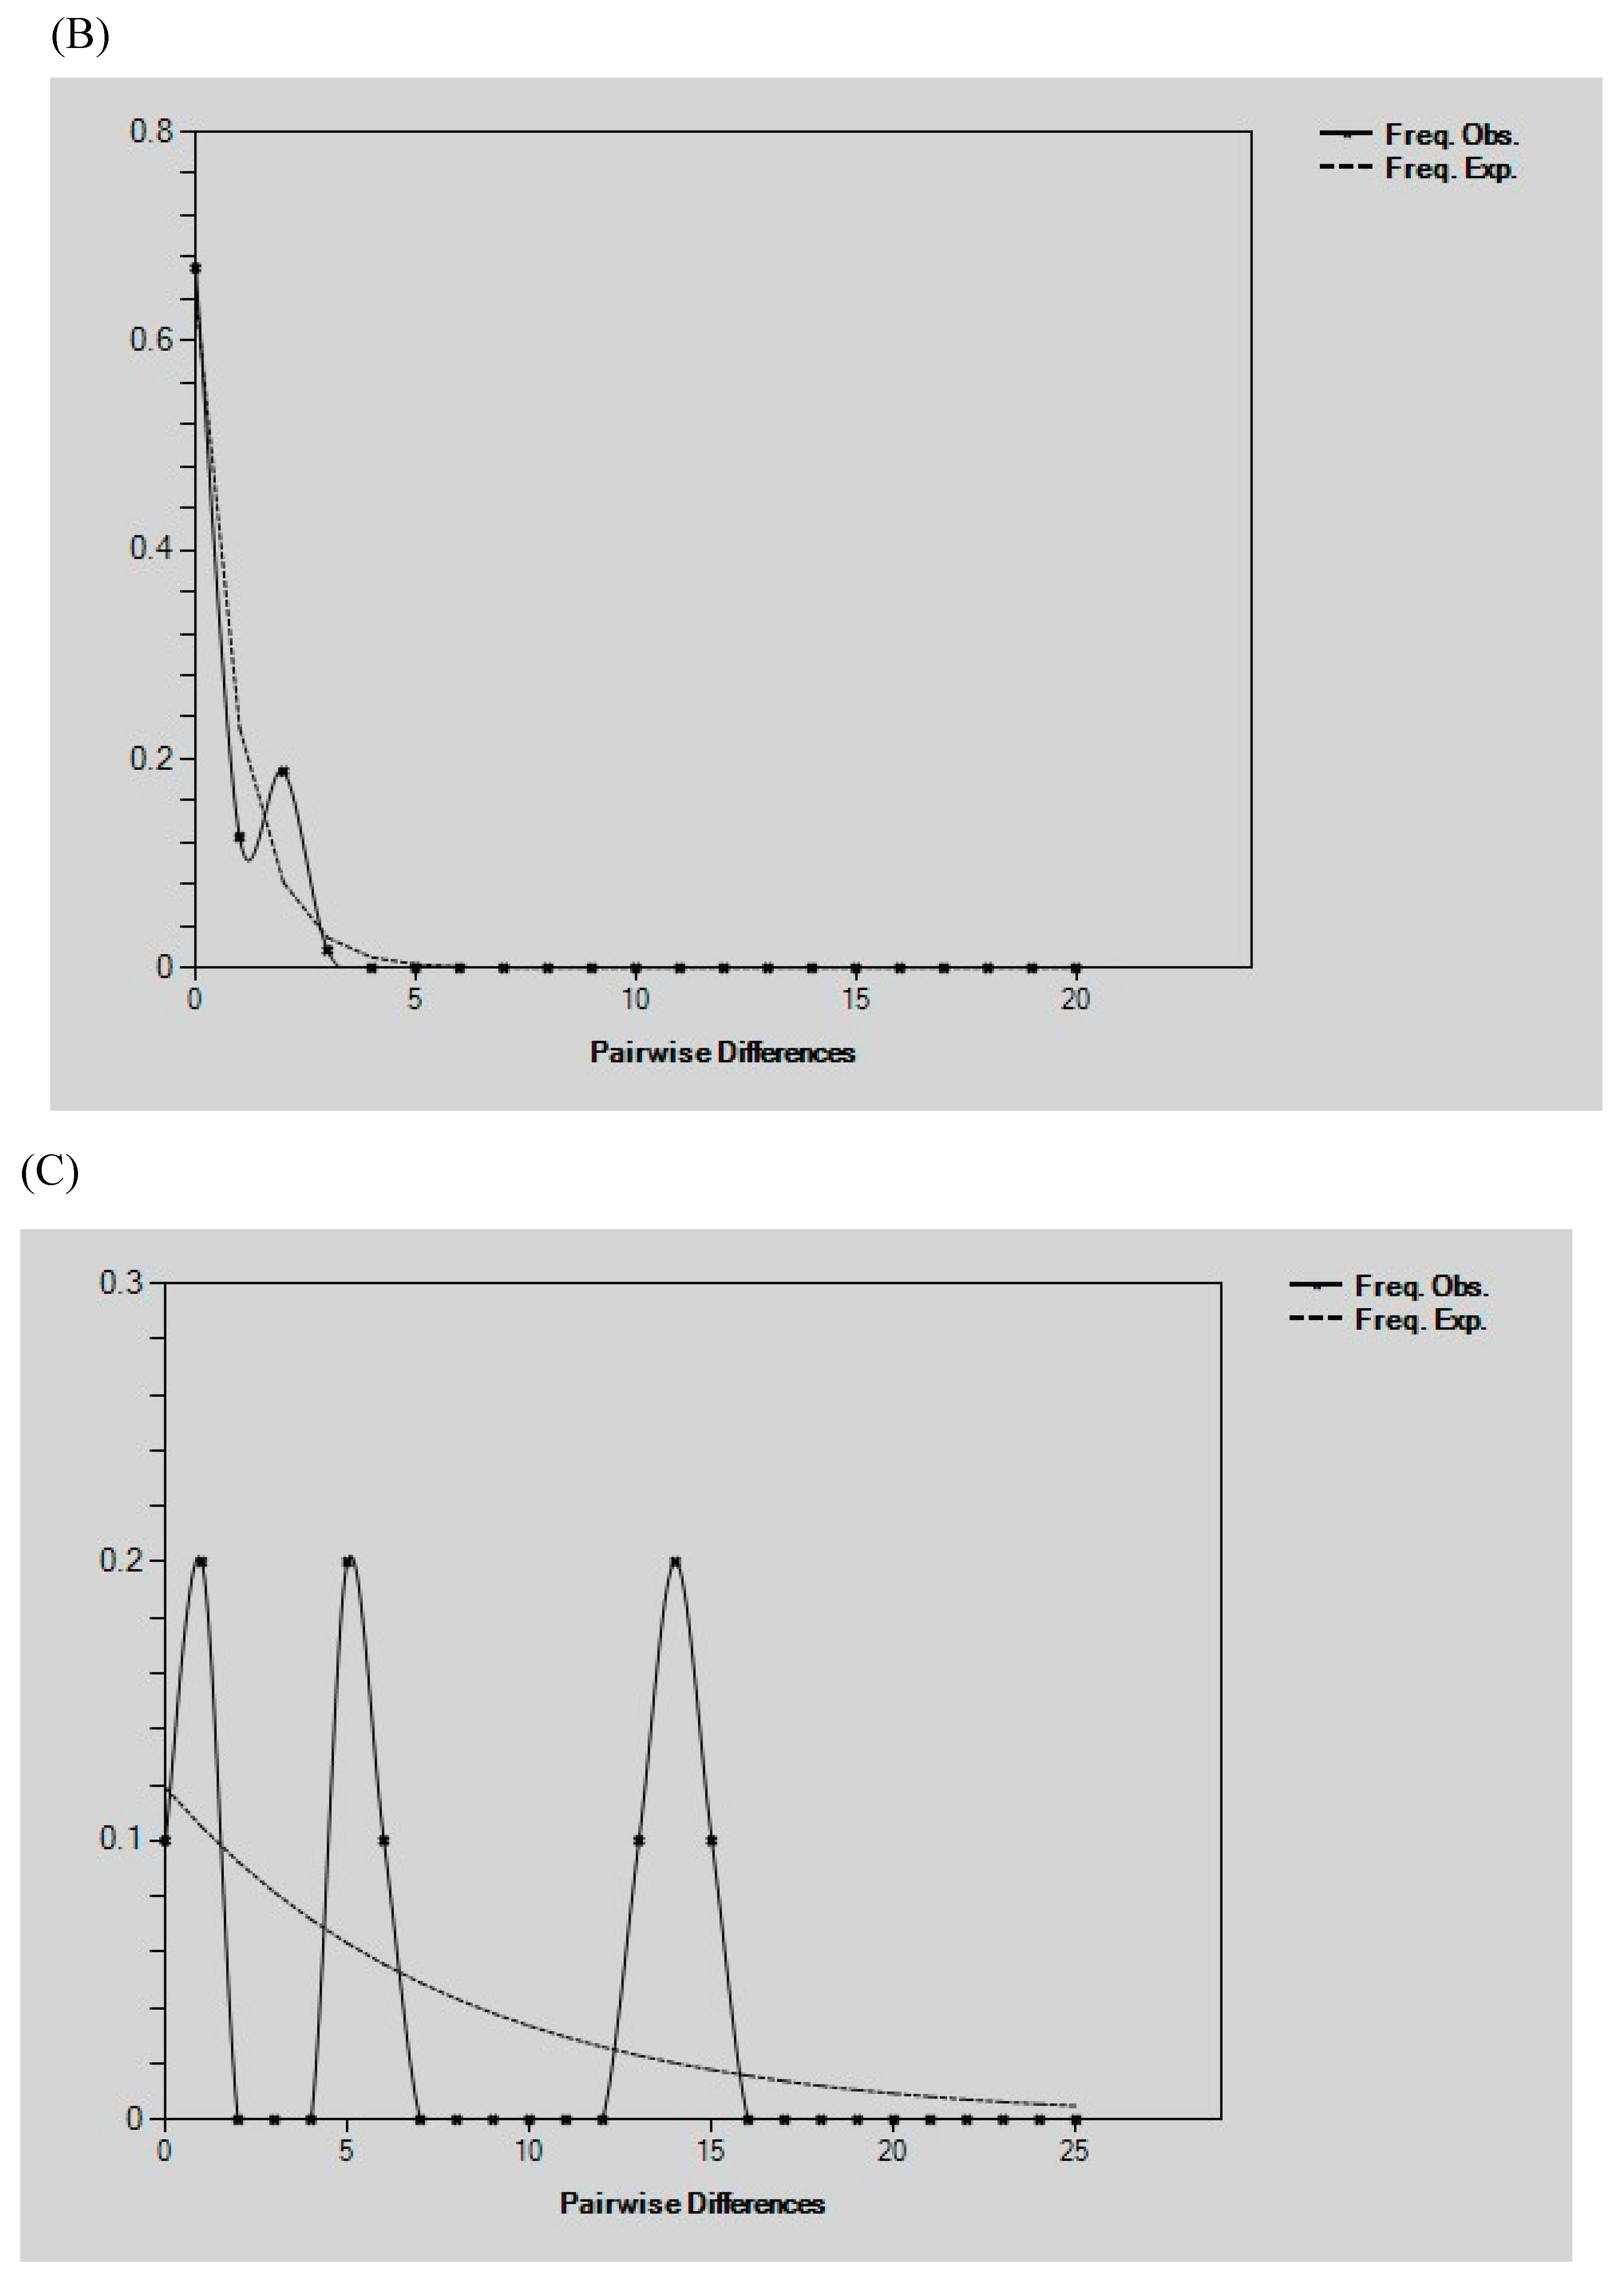
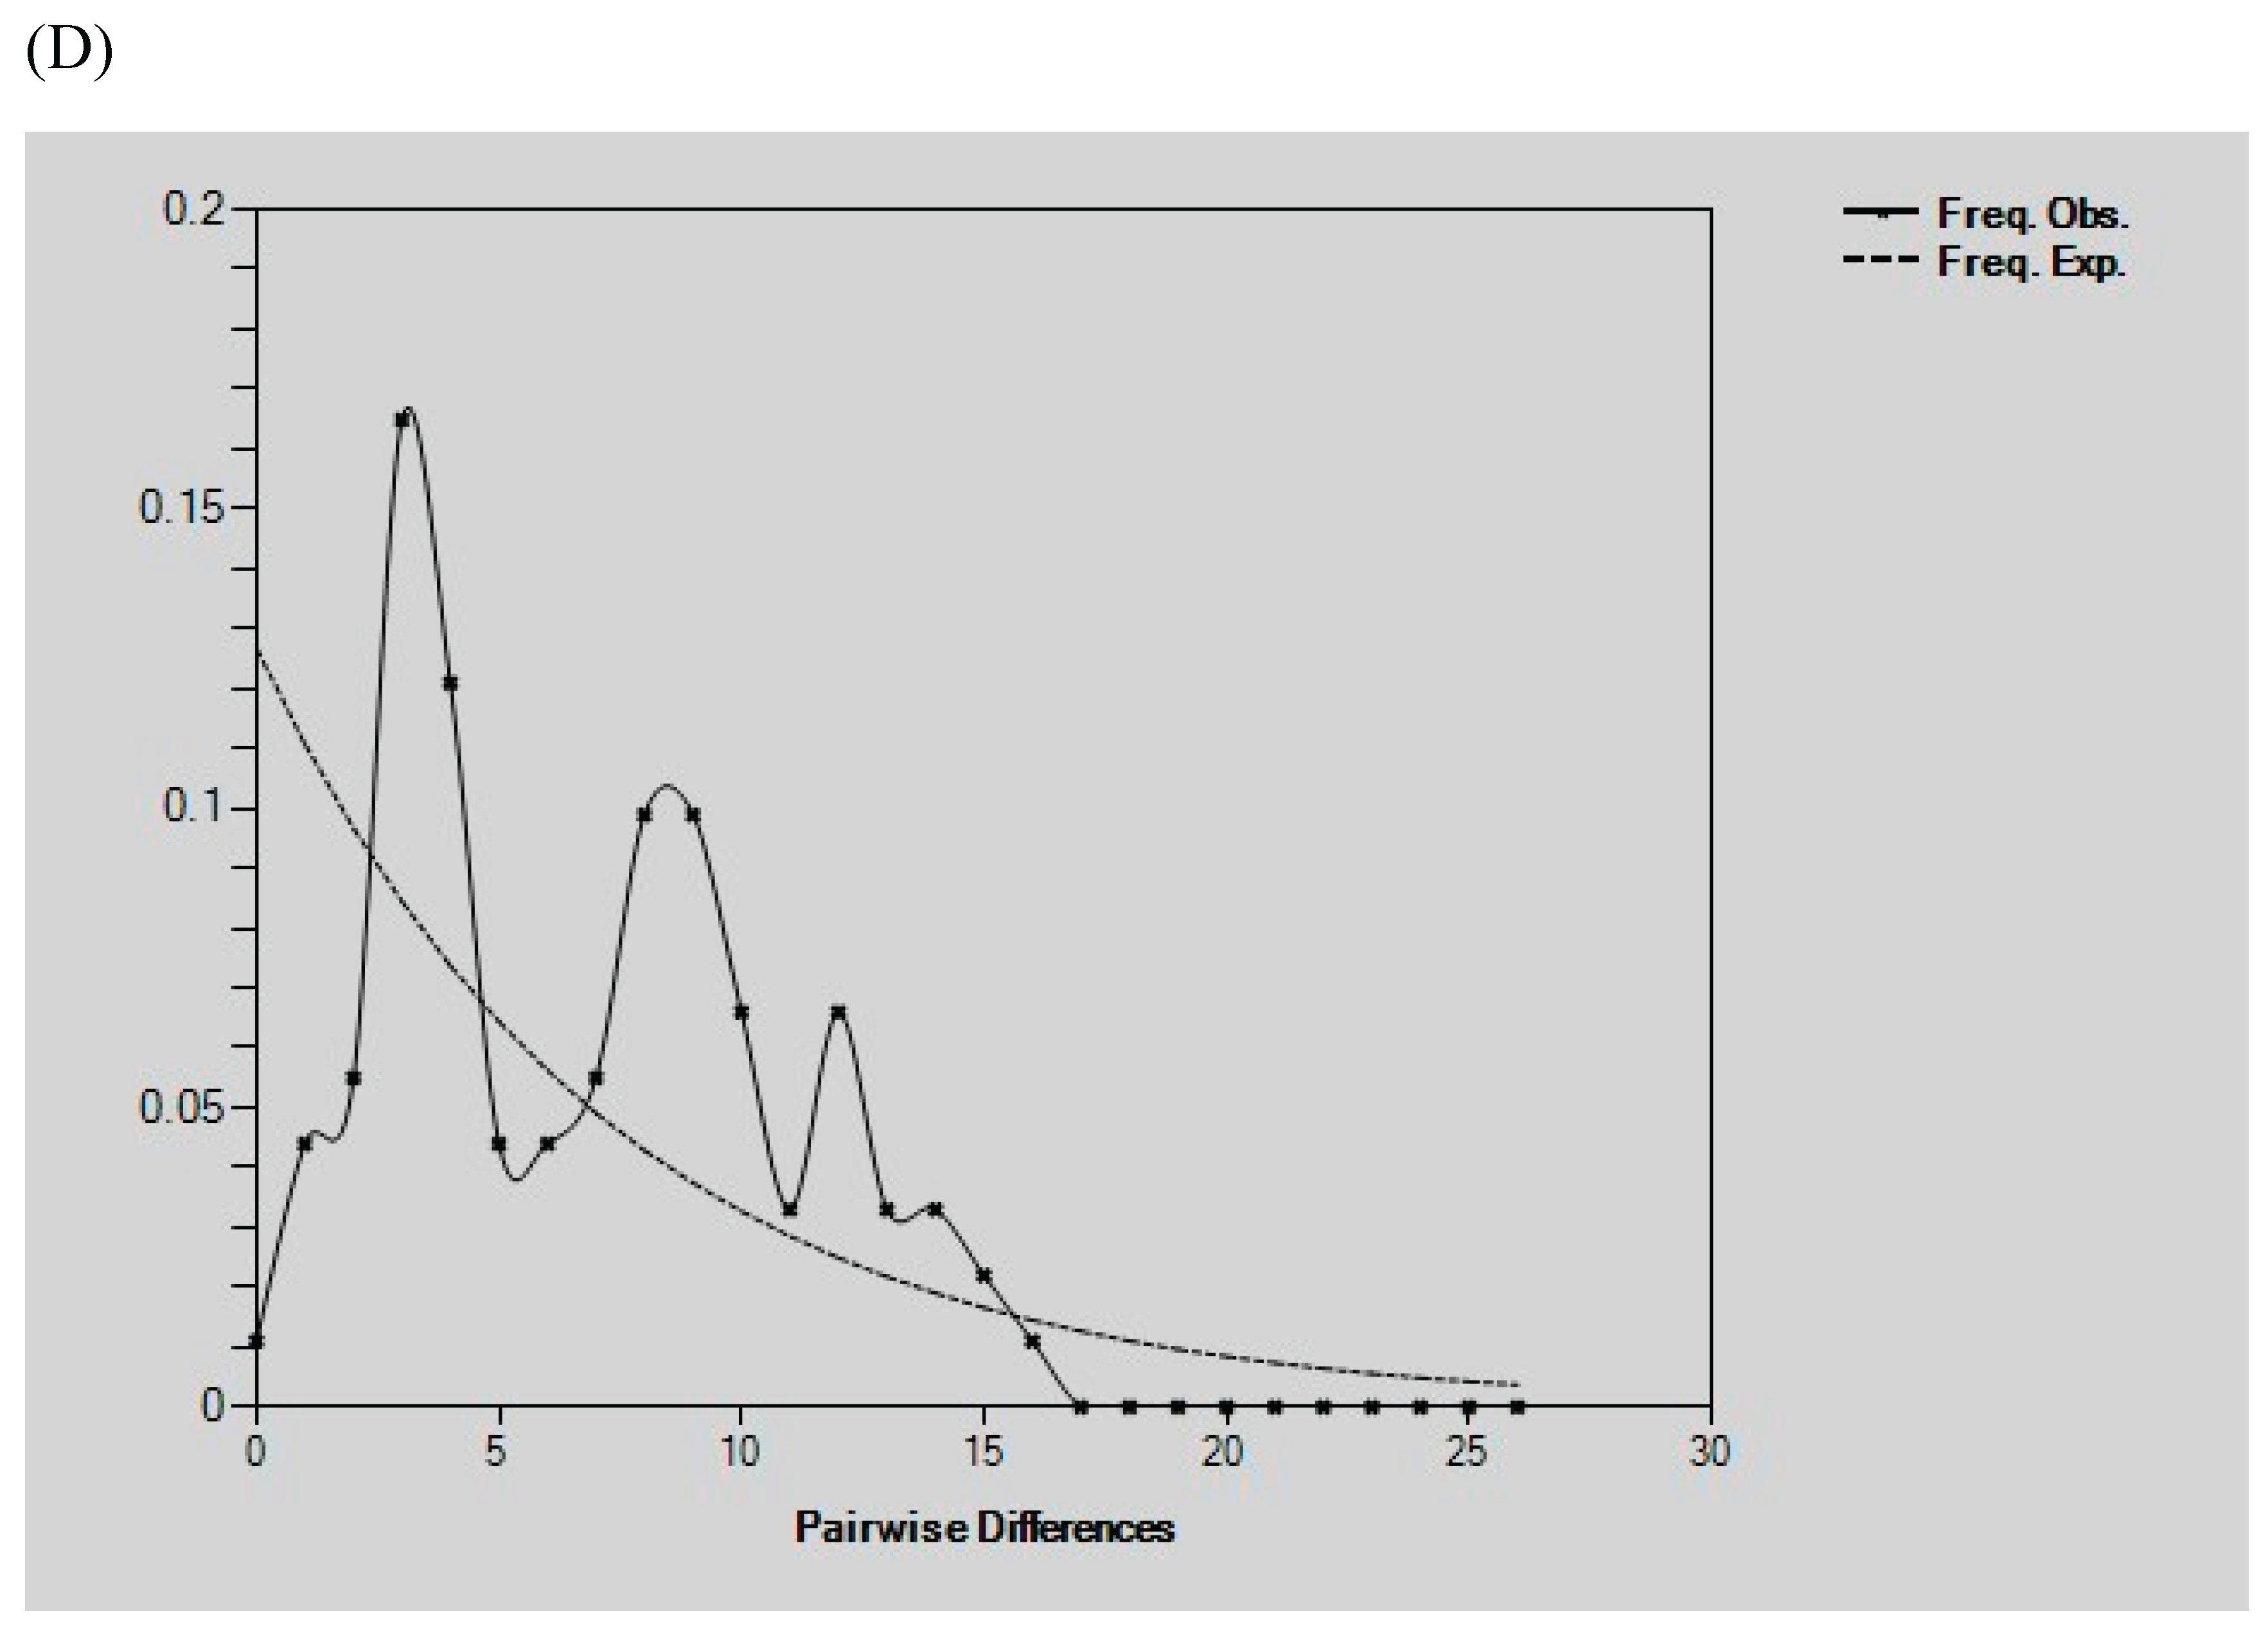

Table 1.
Haplotype distribution of C. f. birulai (Cytb, D-loop, concatenated).
| Genes | Bp | Haplotypes | Sample |
| Cytb | 800 | \ | \ |
| D-loop | 592 | Hap_1 | L_1、L_2_1、L_2_2、L_3_1、L_3_2、L_3_3、L_3_4、L_3_5、L_4、L_5_2、M_2、M_3、M_4、M_5、M_6 |
| Hap_2 | L_5_1、L_5_3 | ||
| Hap_3 | L_6、M_1、M_2 | ||
| Cytb+D-loop | 1258 | Hap_1 | L_1、L_2_1、L_2_2、L_3_1、L_3_2、L_3_3、L_3_4、L_3_5、L_4、L_5_2、M_2、M_3、M_4、M_5、M_6 |
| Hap_2 | L_5_1、L_5_3 | ||
| Hap_3 | L_6、M_1、M_2 |
Table 2.
Genetic diversity of beavers by region (Cytb, D-loop, concatenated sequences).
| Population | H | π | K | |||
| Cytb | D-LOOP | Cytb | D-loop | Cytb | D-loop | |
| China-C. f. birulai | 1 | 0.576 | \ | 0.00515 | \ | 2.41558 |
| Mongolia-C. f. birulai | 2 | 0.600 | 0.00083 | 0.00248 | 0.667 | 1.20 |
| Castor fiber | 7 | 0.967 | 0.00411 | 0.02123 | 3.289 | 8.15398 |
| Castor canadensis | 3 | 0.989 | 0.00440 | 0.01472 | 3.500 | 6.89011 |
Table 3.
D-loop genetic distance and Fst among beaver subspecies and regions.
| country | Subspecies | C.f. pohlei |
mogolin_ C.f. briulai |
C.f. tuvinivus | C.f. albicus | C.f. fiber | C.f. galliae |
China_ C.f. briulai |
C.f. belorussicus | Castor canadensis |
| Russia | C.f. pohlei | - | 0.86900 | 0.95059 | 0.94203 | 0.89286 | 0.89831 | 0.97056 | 0.90323 | 0.93333 |
| mogolin |
mogolin_ C.f. briulai |
0.02389 | - | 0.83434 | 0.95033 | 0.94059 | 0.93750 | 0.67055 | 0.93407 | 0.93627 |
| Russia | C.f. tuvinivus | 0.02357 | 0.02826 | - | 0.90330 | 0.84158 | 0.85965 | 0.95059 | 0.85321 | 0.93368 |
| Germany | C.f. albicus | 0.05007 | 0.04446 | 0.05262 | - | 0.95349 | 0.87500 | 0.98880 | 0.84615 | 0.93267 |
| Norway | C.f. fiber | 0.04022 | 0.04370 | 0.04367 | 0.03063 | - | NA | 0.99093 | NA | 0.92314 |
| French | C.f. galliae | 0.04248 | 0.04147 | 0.04958 | 0.01118 | 0.02770 | - | 0.99043 | NA | 0.92350 |
| China |
China_ C.f. briulai |
0.02494 | 0.00269 | 0.03002 | 0.04200 | 0.04125 | 0.03902 | - | 0.98987 | 0.96743 |
| Russia | C.f. belorussicus | 0.04474 | 0.03919 | 0.04727 | 0.00906 | 0.02990 | 0.01047 | 0.03676 | - | 0.91914 |
| Canada | Castor canadensis | 0.24048 | 0.21939 | 0.23211 | 0.22851 | 0.23189 | 0.23341 | 0.21630 | 0.21754 | - |
Note: Below the diagonal are genetic distances; above the diagonal are pairwise Fst values between populations.
Disclaimer/Publisher’s Note: The statements, opinions and data contained in all publications are solely those of the individual author(s) and contributor(s) and not of MDPI and/or the editor(s). MDPI and/or the editor(s) disclaim responsibility for any injury to people or property resulting from any ideas, methods, instructions or products referred to in the content. |
© 2025 by the authors. Licensee MDPI, Basel, Switzerland. This article is an open access article distributed under the terms and conditions of the Creative Commons Attribution (CC BY) license (http://creativecommons.org/licenses/by/4.0/).
Copyright: This open access article is published under a Creative Commons CC BY 4.0 license, which permit the free download, distribution, and reuse, provided that the author and preprint are cited in any reuse.


