
Submitted:
02 December 2024
Posted:
03 December 2024
You are already at the latest version
Abstract
The Kunlun, Arjin, and Qilian mountain ranges mark the northern edge of the Qinghai-Tibet Plateau (QTP), where rapid uplift and Quaternary glacial cycles have shaped a unique cold desert ecosystem and species distribution. Despite sampling challenges, phylogeographic studies are crucial for understanding reptile populations such as the Qinghai toad-headed agama (Phrynocephalus vlangalii), a viviparous lizard with limited dispersal and multiple subspecies in the northeastern QTP. Our fieldwork identified populations of P. vlangalii on the northern slope of the Kunlun-Arjin Mountains, similar to the controversial subspecies P. v. lidskii. We analyzed 130 individuals from the northern slope of the Kunlun-Arjin-Qilian Mountains and 253 individuals from GenBank, using three mitochondrial genes and two nuclear genes to assess intraspecific differentiation and demographic history. We found high haplotype diversity and low nucleotide diversity in P. vlangalii, with phylogenetic analyses revealing six distinct clades. Clade VI, confirmed as P. v. lidskii, and Clade IV, a new genetic lineage, were identified alongside three recognized subspecies. Genetic variation was largely attributed to clade splitting, indicating significant divergence. The Mantel test indicated that geographical and environmental factors drove population differentiation. Bayesian molecular clock analysis suggested that the most recent common ancestor of P. vlangalii was 2.55 million years ago, influenced by the Qinghai-Tibet Movement and glacial cycles. Demographic history and ecological niche modeling indicated no population decline during the Last Glacial Maximum, supporting the glacial maximum expansion model, with ENM predicting future habitat expansion for P. vlangalii. In addition, morphological data from 13 meristic and 15 metric characters confirmed clade differences. Our findings significantly advance our understanding of P. vlangalii diversification, population dynamics and response to geological and climatic changes in the QTP.
Keywords:
Phrynocephalus
; Genetic diversity
; Morphological characters
; Ecological niche modeling
; Cryptic diversity
; Phylogeography
1. Introduction
Patterns of population diversity and geographical distribution in the contemporary world are influenced by historical geological events and climate fluctuations, either in isolation or in combination [1,2,3,4]. Since the Quaternary period (2.6 million years ago, Ma), the cycles of glacial and interglacial periods have caused global climate fluctuations, while the Qinghai-Tibet Plateau (QTP) has undergone rapid uplift in three phases: the Qinghai-Tibet Movement, the Kunhuang Movement, and the Gonghe Movement [5]. These events have profoundly impacted the geological changes around the plateau and the differentiation and distribution pattern of its species [6].
Mountains are known for their unique biodiversity. The Kunlun-Arjin-Qilian mountains range marks the boundary between the arid and semi-arid regions and the QTP. The region's high-altitude deserts, grasslands, glaciers, and snow-capped mountains support a unique ecosystem and are home to rare alpine species such as the Tibetan antelope (Pantholops hodgsonii), the Tibetan wild ass (Equus kiang), the Tibetan gazelle (Procapra picticaudata), and the black-necked crane (Grus nigricollis) [7,8,9]. However, due to its remoteness, poor transport, and collection challenges, this area has long received minimal scientific attention, with recent studies focusing on flora, birds and mammals, leaving amphibians and reptiles largely unstudied.
The viviparous species of the genus Phrynocephalus are a notable group of reptiles on the QTP, including P. vlangalii, P. theobaldi, P. erythrurus, P. putjatai and P. forsythii [10]. These plateau lizards form a monophyletic group on the phylogenetic tree, with their species differentiation and geographical distribution primarily influenced by the geological movements of the QTP [11,12]. Ongoing scientific research is refining our understanding of the biodiversity of the QTP (e.g., [12,13,14,15,16,17]).
Phrynocephalus vlangalii, first described by Strauch in 1876 from Qinghai Lake and its surroundings [10], is adapted to the cold, high altitude and dry sandy environments of the QTP. Found at altitudes ranging from 2300 to 4500 meters (our field observation), it is well suited for studying geographical patterns in temperature-variable faunal systems on the QTP and adjacent areas.
Bedriaga [18] originally classified P. vlangalii into six subspecies based on morphology, a classification that has been challenged and remains controversial [19,20,21,22,23,24,25,26,27]. Jin et al. [28] was the first to use mtDNA genetic markers to reconstruct the phylogenetic relationships within P. vlangalii, revealing three subspecies with discontinuous distribution and long periods of genetic isolation. Chen et al. [12] discovered an undescribed independent genetic population distributed in Gonghe County, Qinghai, but their study did not cover the northern slopes of the Kunlun and Arjin mountains, where we have collected unique Phrynocephalus specimens. These lizards show significant morphological differences from sympatric P. forsythii and are more similar to P. vlangalii, raising questions about their previously constroversial classification as P. v. lidskii.
In this study, we sampled P. vlangalii from the northern slope of the Kunlun-Arjin-Qilian Mountains (NKAQ) and assessed intraspecific diversity using molecular data (mtDNA and nuDNA), morphological, and environmental data. Our objectives were to: (i) investigate the genetic structure and geographical distribution of P. vlangalii populations; (ii) compare morphological differences among populations; (iii) assess the validity of P. v. lidskii; and (iv) explore the evolutionary history and population dynamics in response to environmental climate change.
2. Materials and Methods
2.1. Sample Collection and DNA Sequencing Procedures
This study is based on data from a total of 383 individuals of P. vlangalii obtained from 31 localities. Of these, 130 samples were newly collected from 15 sites in the NKAQ (Figure 1), while the remaining 253 were obtained from the previous study by Chen et al. [12]. In accordance with the animal use protocol approved by the Chengdu Institute of Biology (CIB), Chinese Academy of Sciences, the lizards were euthanized via intraperitoneal injection of an overdose of pentobarbital sodium, and liver tissue was extracted and fixed in 95% ethanol and stored at -20°C. Voucher specimens are deposited at the CIB. Full details of the samples can be found in Supplementary Material Tables S3 and S4.
To compare with the data of Chen et al. [12], we amplified and sequenced three mitochondrial DNA (mtDNA) gene fragments: 16S ribosomal RNA (16S rRNA), NADH dehydrogenase subunit 2 (ND2) together with adjacent fragment of the complete tRNATrp and partial tRNAAla genes (referred to as ND2 and adjacent tRNAs), and NADH dehydrogenase subunit 4 (ND4) with adjacent tRNA genes (referred to as ND4 and adjacent tRNAs). We also sequenced two nuclear (nuDNA) gene fragments: the recombinase activating gene 1 (RAG-1) and the amelogenin gene (AMEL). The specific PCR primers and conditions for each gene fragment are detailed in Table S1.
Genomic DNA extraction was performed using the TIANamp Genomic DNA Kit (TIANGEN, Beijing, China). Amplified products were visualized on a 1% agarose gel, purified commercially by Sangon Biotechn (Beijing, China) and then double-stranded sequenced using the same primers as in PCR. Chromatograms from both sense and antisense strands were edited and assembled using SeqManII [29] from DNASTAR 5.0 (DNASTAR, Madison, WI, USA) to generate a single, consistent sequence. Sequences were aligned in MEGA 7.0 [30], with manual trimming of partial bases at sequence ends, and equal-length sequences were exported for further analysis. MEGA 7.0 was used to calculate the number of conserved sites (c), parsimony information sites (PI) and variable sites (V) for each mtDNA and nuDNA segment. Haplotypes for concatenated mtDNA were generated using DnaSP v5.10 [31].

Table 1.
Locations information of newly collected P. vlangalii samples in this study.
| Site Number | n | Locality | Clade | Latitude | Longitude | Altitude (m) |
|---|---|---|---|---|---|---|
| 1 | 9 | Yutian County, Xinjiang | VI | 36.18 | 81.56 | 2575 |
| 2 | 3 | Yutian County, Xinjiang | VI | 36.22 | 81.68 | 2835 |
| 3 | 12 | Yutian County, Xinjiang | VI | 36.31 | 81.78 | 3088 |
| 4 | 5 | Yutian County, Xinjiang | VI | 36.44 | 81.97 | 2629 |
| 5 | 8 | Minfeng County, Xinjiang | IV | 36.67 | 83.18 | 2584 |
| 6 | 11 | Minfeng County, Xinjiang | IV | 37.11 | 84.53 | 2391 |
| 7 | 6 | Qiemo County, Xinjiang | IV | 37.43 | 85.44 | 2343 |
| 8 | 12 | Qiemo County, Xinjiang | IV | 37.33 | 85.47 | 2767 |
| 9 | 6 | Ruoqiang County, Xinjiang | II | 38.43 | 90.12 | 3053 |
| 10 | 4 | Ruoqiang County, Xinjiang | II | 38.92 | 90.16 | 3226 |
| 11 | 5 | Huatugou Town, Qinghai | II | 37.96 | 91.25 | 3008 |
| 12 | 14 | Sugan Lake, Gansu | II | 38.90 | 93.90 | 2800 |
| 13 | 14 | Akesai County, Gansu | III | 39.43 | 94.26 | 2539 |
| 14 | 9 | Subei County, Gansu | III | 39.34 | 95.32 | 3068 |
| 15 | 12 | Subei County, Gansu | III | 39.44 | 94.97 | 2489 |
2.2. Phylogenetic Analyses
We reconstructed the phylogenetic tree of P. vlangalii using Bayesian inference (BI) and maximum likelihood (ML) to resolve intaspecific phylogenetic relationships. Following Chen et al. [12], P. przewalskii and P. putjatia were designated as outgroup taxa (Supplementary Material, Table S4). The analysis was conducted in PhyloSuite v1.1.15 [32], where 16S rRNA, ND2 and adjacent tRNA, ND4 and adjacent tRNA, AMEL and RAG-1 sequences were concatenated using the ‘Concatenate Sequence’ function.
For the BI tree, the ‘Partitionfinder2’ was used to determine the best nucleotide model and partitioning scheme based on the corrected Akaike information criterion (AICc). The BI phylogenetic tree was reconstructed using ‘MrBayes’ [33], with two runs of 20 million generations each, sampling every 1000 generations and discarding the first 25% as burn-in. Nodes with posterior probability (PP) ≥ 0.95 were considered well-supported. The ML tree was generated with ‘IQ-TREE’ using the optimal model determined by AICc for each partition [34], and node support was assessed using 5000 ultrafast bootstrap approach (UFBoot) replicates; nodes with UFBoot ≥ 95% were considered fully supported [35]. Phylogenetic trees were visualized with FigTree v1.4.4 [36]. A summary of DNA partitions and associated models, as determined by PartitionFinder, is provided in the Supplementary Materials (Table S2).
Haplotype networks for concatenated mtDNA and nuDNA alignments were performed separately in PopART v1.7 [37] to illustrate haplotype relationships. Due to the absence of AMEL and RAG-1 sequences in GenBank, only the 130 individuals sequenced in this study were included in the nuDNA analyses. Given the presence of ambiguous sites in the concatenated nuDNA sequence, DNAsp v5.10 [31] was used to generate phased nuDNA alleles.
2.3. Divergence Time Estimation
We used BEAST v1.10.4 [38] to infer the historical evolutionary processes of P. vlangalii by estimating the divergence times of major lineages from our concatenated mtDNA dataset. Given the lack of reliable fossil records, our analyses followed a two-step approach similar to other studies [39,40]. In the first step of the analyses, we dated the most recent common ancestor (MRCA) of P. vlangalii. We extracted six haplotypes from different clades identified in our previous phylogenetic analyses. In addition, we obtained 15 complete mitochondrial genome sequences of other Phrynocephalus species from GenBank (Supplementary Materials, Table S4), with Laudakia tuberculata as an outgroup, following Jin and Brown [13]. After sequence alignment, the ‘Partitionfinder2′ function in PhyloSuite was used to select the optimal partition and evolutionary model based on the AICc. Based on the results of Jin and Brown [13], three calibration points were introduced: C1, the MRCA of the genus Phrynocephalus [9.78 ± 1.0 Ma (million years ago)]; C2, the MRCA of viviparous species (5.04 ± 0.5 Ma); C3, the divergence time of P. vlangalii, P. theobaldi and P. erythrurus (3.02 ± 0.5 Ma). A relaxed lognormal clock and a birth-death process were used to link clock models and trees. In a second step, we estimated the coalescent time of internal lineages within P. vlangalii using the age estimate for its MRCA [2.42 Ma, 95% highest probability density interval (HPD): 1.56–3.20 Ma] as a normal distribution model (mean = 2.42, SD = 0.42). We assumed a relaxed lognormal clock and a constant-size coalescent tree prior. The analysis consisted of 300 million generations of the MCMC chain, with samples taken every 5000 generations. The model specifications, priors and parameter settings are detailed in the Supplementary Materials (Table S2). We assessed convergence using effective sample sizes (ESS) ≥ 200 in Tracer v1.7.1 [41].
2.4. Population Genetic Analyses
We used DNAsp v5.10 [31] to calculate nucleotide diversity (π) and haplotype diversity (Hd) for each clade based on our concatenated mtDNA dataset. To evaluate significant genetic differentiation and genetic structure among P. vlangalii clades, we used Arlequin v3.5.2.2 [42] to calculate genetic differentiation coefficient (Fst) and MEGA 7.0 [43] to determine mean genetic distances between and within clades using uncorrected pairwise genetic distances (p-distance).
For a more in-depth analysis of population structure, we performed a spatial analysis of molecular variance (SAMOVA) using SAMOVA v2.0 [44]. The population from Gonghe County (Clade I) was excluded due to limited sampling, resulting in 30 sample sites for analysis. We evaluated K values ranging from 2 to10, with 10,000 simulated annealing processes, to identify the optimal number of groups based on the peak Fct values. Groups with fewer than two individuals were not considered.
Following SAMOVA, we used Arlequin to perform an analysis of molecular variance (AMOVA) to estimate the proportion and significance of genetic variation among groups (Fct), within groups (Fsc), and within populations (Fst) with 100,000 random permutations, following the optimal geographical grouping structure defined by SAMOVA 2.5. Testing correlations between genetic, environmental, and geographical distances.
We conducted isolation-by-distance (IBD) [45] and isolation-by-environment (IBE) [46] tests to explore the relative impacts of geographic and environmental factors on population differentiation in P. vlangalii, based on our concatenated mtDNA dataset.
P-distances between sampling sites were calculated using MEGA [43]. Geographical distances were estimated with GeographicDistanceMatrixGenerator v1.2.3 [47]. We downloaded 19 contemporary bioclimatic variables from WorldClim v1.4 (http://www.worldclim.org, accessed on 15 August 2023) [48] and extracted them for our 31 sampling sites using ArcGIS v10.8. After removing highly correlated variables (Pearson′s r > 0.80), we selected seven non-highly correlated environmental variables (Bio1, 2, 3, 7, 12, 15, 17 and 19) for further analyses. Environmental Euclidean distances were calculated using the “vegan” package in R [49]. Mantel tests was performed in ZT v1.1 [50] to assess relationships between genetic distance (Fst/(1-Fst)) and the logarithm of geographic distance (log km), as well as between genetic distance (Fst/(1-Fst)) and environmental distance. To eliminate potential spurious correlations between IBD and IBE effects, we conducted partial Mantel tests, controlling for either environmental or geographical distance. Considering the influence of geographical barriers on gene flow, we used the Kunlun-Arjin-Qilian mountains as an indicator for partial Mantel tests, as the distribution of P. vlangaii has not crossed the northern peaks of the QTP. The test results were visualized using Microsoft Excel 2021.
2.5. Inference of Demographic Histories
We inferred the historical population size fluctuations for the major clades of P. vlangalii using three different approaches with concatenated mtDNA data. First, we calculated Tajima’s D, Fu’s Fs, and R2 statistics and their respective p-values in DnaSP, with 10,000 simulated samples [31]. These tests provide insight into the historical dynamics of the population under various scenarios. Tajima’s D indicates long-term population events, while Fu’s Fs and R2 are sensitive to recent population expansions. Fu’s Fs is particularly suitable for large sample sizes, while R2 is more appropriate for smaller samples. Second, we generated a mismatch distribution (MD) plot using Arlequin for each P. vlangalii clade. We estimated the sum of squared deviations (SSD) and Harpending’s raggedness index (Rg) with 10,000 bootstrap replicates to assess hypotheses of recent population growth. Finally, we constructed Bayesian skyline plots (BSP) [38] using BEAST to model changes in population size over time. The nucleotide substitution model was determined using ‘PartitionFinder2’ in PhyloSuite v1.1.15 [32]. A strict clock model was applied with a substitution rate of 1.15%/site/million years (95% HPD: 0.47%–1.92%/site/million years), based on previous divergence dating analysis. Model specifications, priors and parameters are detailed in Table S2. The results of each analysis were visualized using Tracer.
2.6. Morphology Data Collection and Analyses
We examined 82 newly sampled partial P. vlangalii specimens from the NKAQ and obtained 13 meristic characters and 15 metric characters (Table S6), which are traditionally used to diagnose Phrynocephalus species [21,24,51]. Collection methods and definitions of diagnostic characters followed Zhao et al. [21]. Specimens were sexed by inspecting the reproductive organs, and individuals with a snout-vent length (SVL) greater than 45 mm were classified as adults, while smaller individuals were classified as juveniles [52]. Metric characters were measured to the nearest 0.01 mm using a digital caliper, and meristic characters were assessed using a binocular microscope.
To determine if P. vlangalii specimens occupied different positions in morphospace and to validate the molecular phylogenetic results, we conducted a principal component analysis (PCA) using the SPSS version 19 (SPSS Inc., Chicago, USA). Meristic and metric characters were analyzed separately due to the lack of known correlations. As no sexual dimorphism or adult-juvenile differences were observed in meristic characters, all individuals were included in a single PCA analysis. However, as sexual dimorphism affects metric characters [51], males and females were analyzed separately in the PCA for these characters.
2.7. Ecological Niche Modeling
To explore potential range shifts of P. vlangalii from the Pleistocene to the 2070s under climate change scenarios, we employed Ecological Niche Modeling (ENM) with MaxEnt v3.4.1 [53]. MaxEnt is a widely used method for predicting species distributions, particularly with presence-only data, and it can project range changes under various climatic conditions.
Occurrence data, comprising 69 localities, were compiled from fieldwork and previous studies with precise coordinates (Table S10). To reduce spatial bias, we used SDMtoolbox v2.5 [54] in ArcGIS to filter the dataset, ensuring that no two localities were closer than 10 km, resulting in 56 localities. The study area was defined by a minimum bonding rectangle around the localities with a 5° buffer [55,56], covering the known range from of P. vlangalii from 76–107° E and 28–44° N.
We obtained 19 climate variable factors for five different time periods from the WorldClim database (http://www.worldclim.org) [57]: the present (1960–1990), the last interglacial (LIG, 0.12–0.14 Mya), the last glacial maximum (LGM, ~0.02 Mya), the middle Holocene (MH, ~6000 years ago) and the future 2070s (2061–2080). The LGM data had a resolution of 2.5 arc-minutes, while the others were all 30 arc-seconds. We chose the Model for Interdisciplinary Research on Climate (MIROC) for the LGM and MH and applied it under the Shared Socio-economic Pathways 126 and 585 (SSP 126/585) for the 2070s, representing the lowest and highest carbon emission situations.
We estimated correlations between the 19 contemporary climate variable factors using SDMtoolbox [54] in ArcGIS, retaining variables with low correlation (r < 0.8). Eight variables (Bio1, 2, 3, 7, 12, 14, 15, and 19) were selected for analysis (Supplementary Materials, Table S9). The current distribution model was based on contemporary climate data, with niche models for other periods projected from the contemporary dataset. MaxEnt randomly allocated 70% of the data for training and 30% for testing, with 100 bootstrap replicates.
The ENMeval package [58] in R was used to manage model complexity and to determine the optimal MaxEnt feature classes and regularization multipliers. The optimal model had a multiplier of 0.1 and a linear/quadratic feature class, with other parameters set by default. To avoid over-extrapolation, we conducted a multivariate environmental similarity surface (MESS) analysis [59] to check for climatic variable combinations not represented in the training data, indicating reliable or unreliable projection areas. Model reliability was evaluated using the area under the receiver operating characteristic curve (AUC), with AUC > 0.7 indicating a fair model. The habitat suitability index ranged from 0 to 1, with higher values indicating greater suitability. We used maximum training sensitivity plus specificity (MTSS) and balanced training omission, predicted area and threshold value (BTPT) as classification thresholds, dividing the habitat suitability index into highly, secondarily, and unsuitable habitats (BTPT = 0.0237, MTSS = 0.1946). The importance of each climate variable was assessed based on the contribution values reported in the MaxEnt output files.
3. Results
3.1. Phylogenetic Analyses
Both BI and ML analyses revealed a consistent tree topology, indicating that individuals of P. vlangalii form six well-differentiated clades with high support values from PP and UFBoot, respectively (Figure 2). These clades correspond well to distinct geographical distribution ranges, which are strongly supported by the data (Figure 1). Individuals from Gonghe County, Qinghai Province (L28), were the first to diverge, forming an independent genetic lineage, Clade I (PP = 1.0, UFBoot = 100), consistent with Chen et al. [12]. With the exception of L28, P. vlangalii from other localities formed a monophyletic group (PP = 1.0, UFBoot = 98). Within this group, clades II and III formed a well-supported cluster (PP = 1.0, UFBoot = 100), while a second cluster comprising clades IV, V, and VI showed unresolved relationships (PP = 0.61, UFBoot = 99). Clade II, corresponding to the subspecies P. v. vlangalii, included individuals from the Qaidam Basin (L11,16–27), Gusan Lake (L12) and Ruoqiang County (L9,10) (PP = 1.0, UFBoot = 100). Clade III, considered P. v. nanschanica, consisted of individuals from the North Qilian Mountains, including Akesai County (L13) and Subei County (L14,15) in Gansu Province (PP = 1.0, UFBoot = 100). Clade V included populations from the headwaters of the Yellow River, such as Maduo County and Maqu County in Qinghai Province, and Ruoergai County in Sichuan Province, representing the southernmost distribution of P. vlangalii and the subspecies P. v. pylzowi. Phylogenetic analysis also divided P. vlangalii individuals from Xinjiang into two clades. Clade IV, an undescribed new lineage, included populations from Minfeng County and Qiemo County. Clade VI, which evolved independently should belong to the subspecies P. v. lidskii according to Peters [27], since its type locality is exactly Yutian County, where this clade is distributed.
Figure 2.
A 50% majority-rule consensus tree inferred using Bayesian inference with MrBayes v.3.2. Six clades are identified within P. vlangalii, each highlighted for visual distinction. Bayesian posterior probability (PP) and maximum likelihood UFBoot values are shown at major nodes. Photo of Clade I by Jian Liu; clades II, IV and VI by Xianguang Guo; clades III and V by Zhongyi Yao.
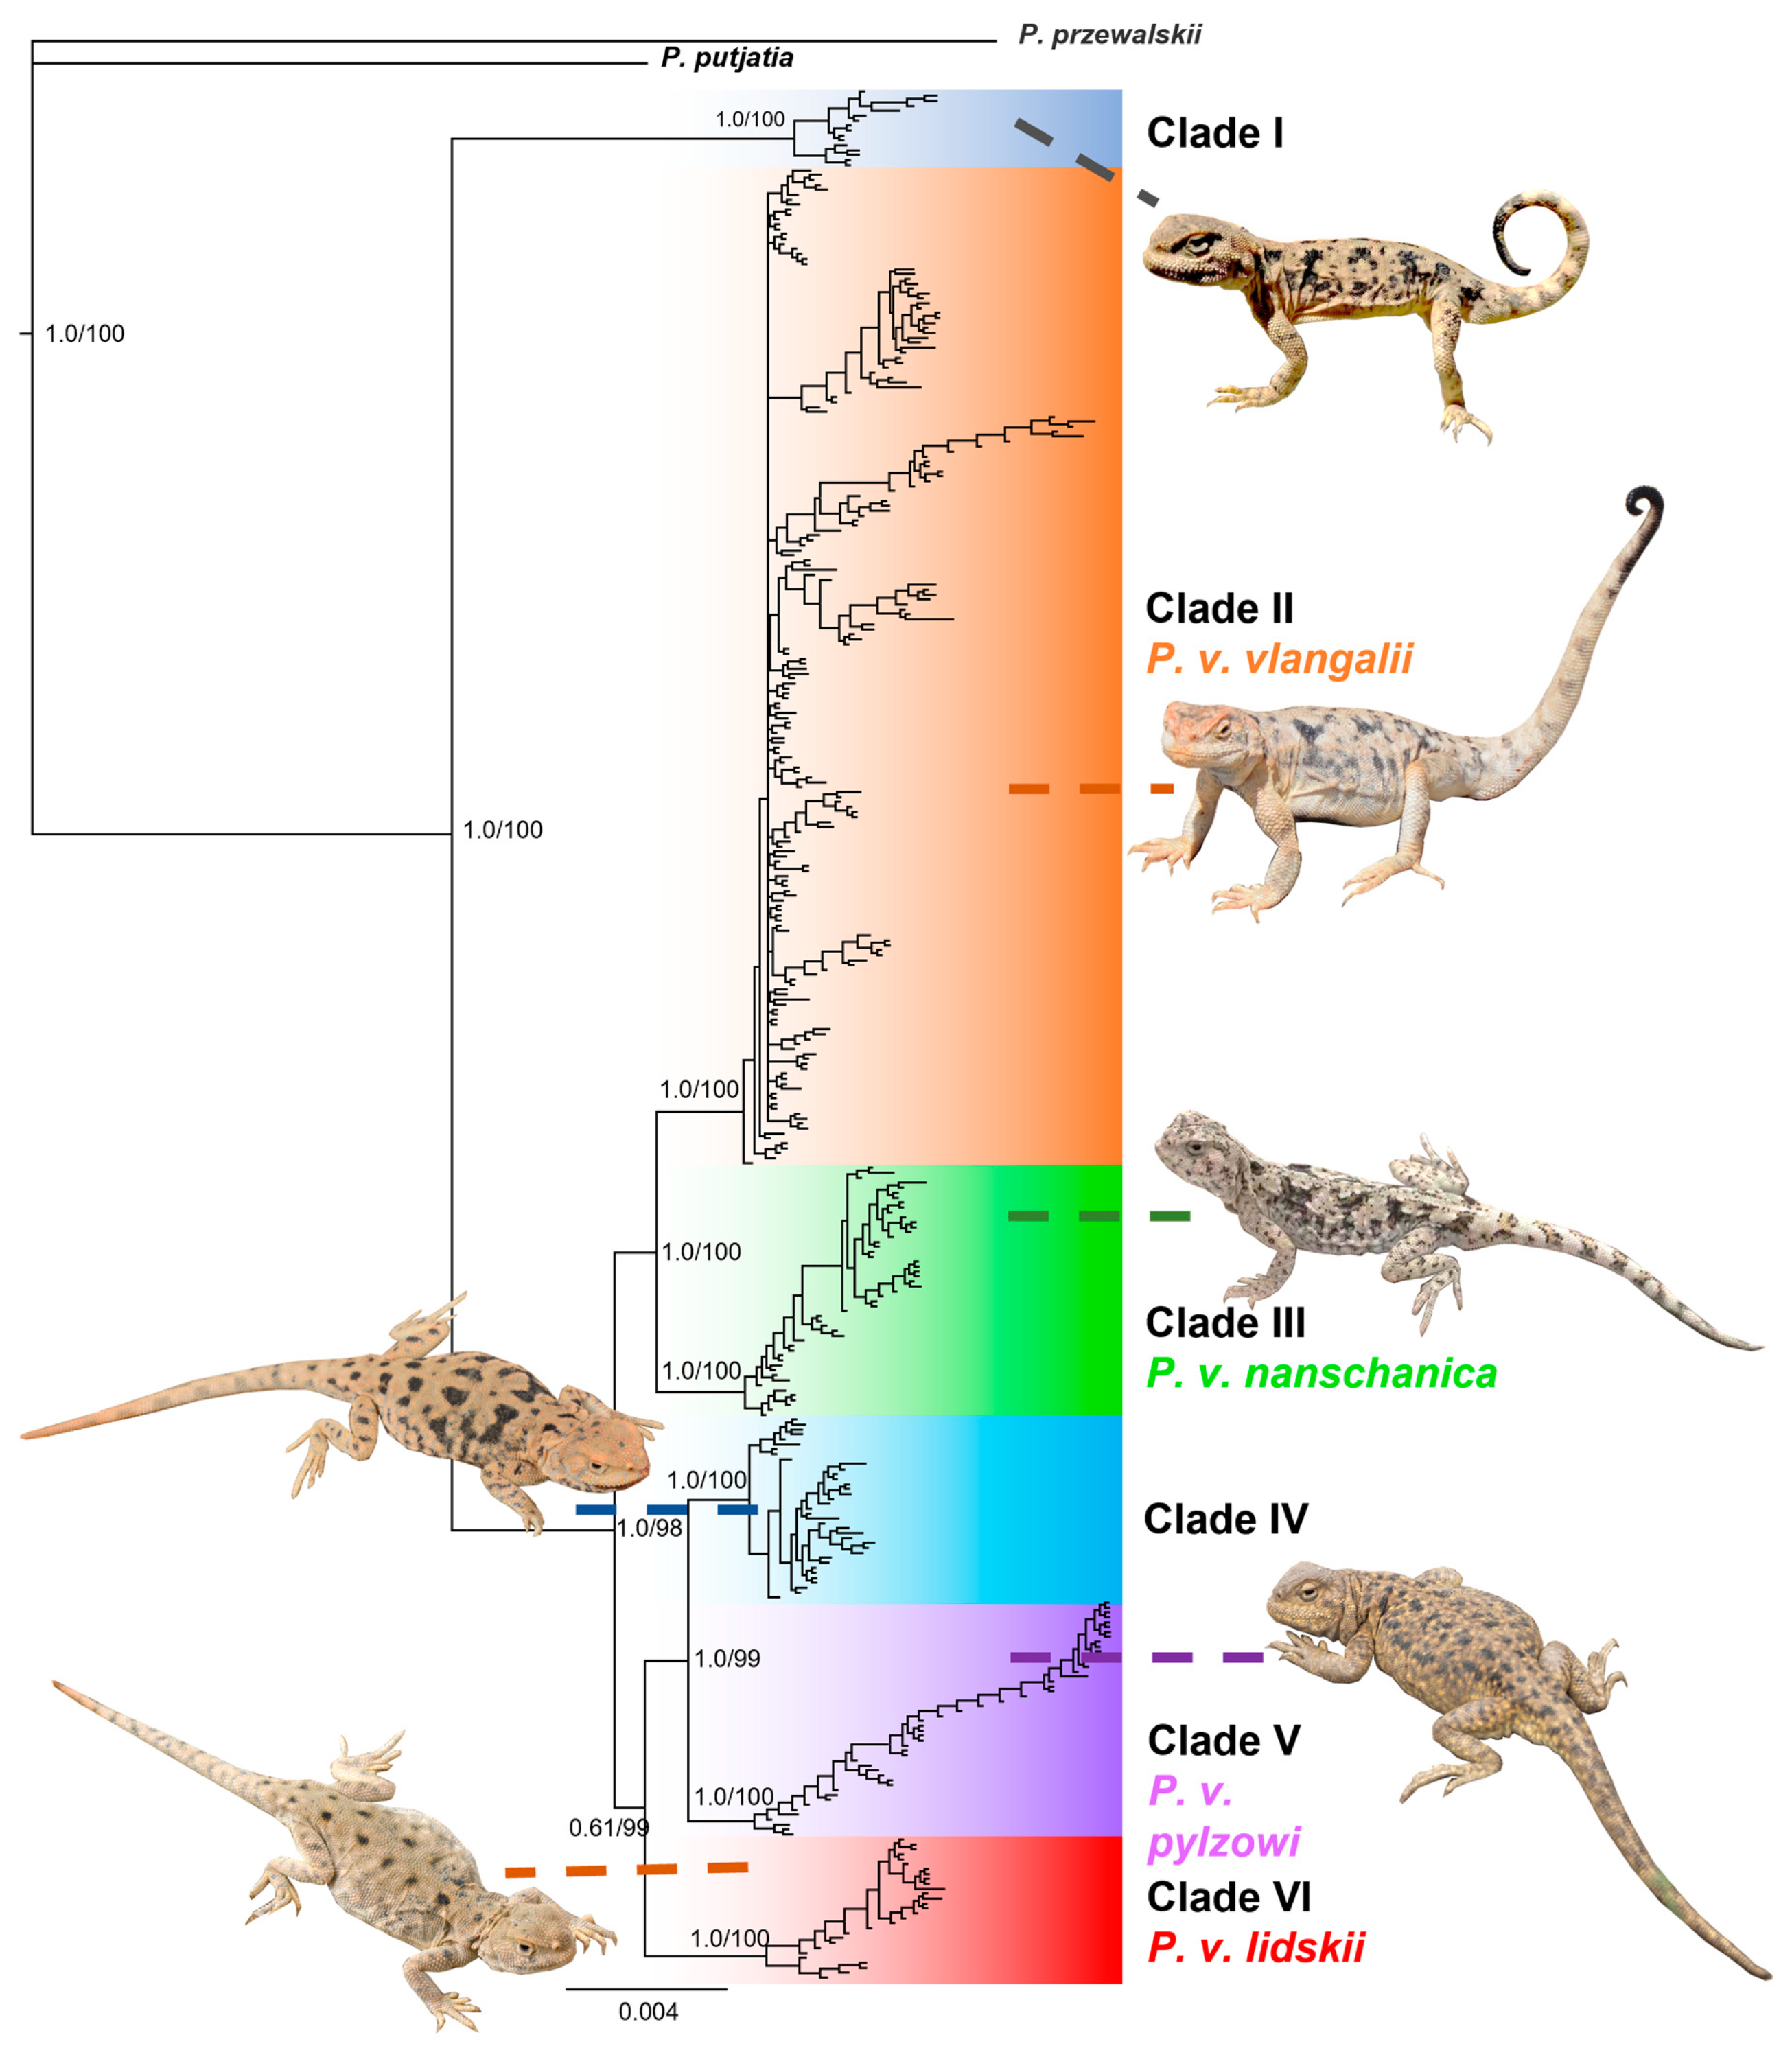
Figure 3.
TCS network of haplotypes inferred from a total of 382 concatenated mtDNA sequences for P. vlangalii using PopART software. Each colored circle represents a single haplotype; black dots indicate inferred vectors. Different filled colors correspond to the geographical origins of the haplotypes. The size of each circle is proportional to the number of individuals sharing that particular haplotype. Short bars crossing haplotypes represent substitution steps and indicate the genetic distance between them.
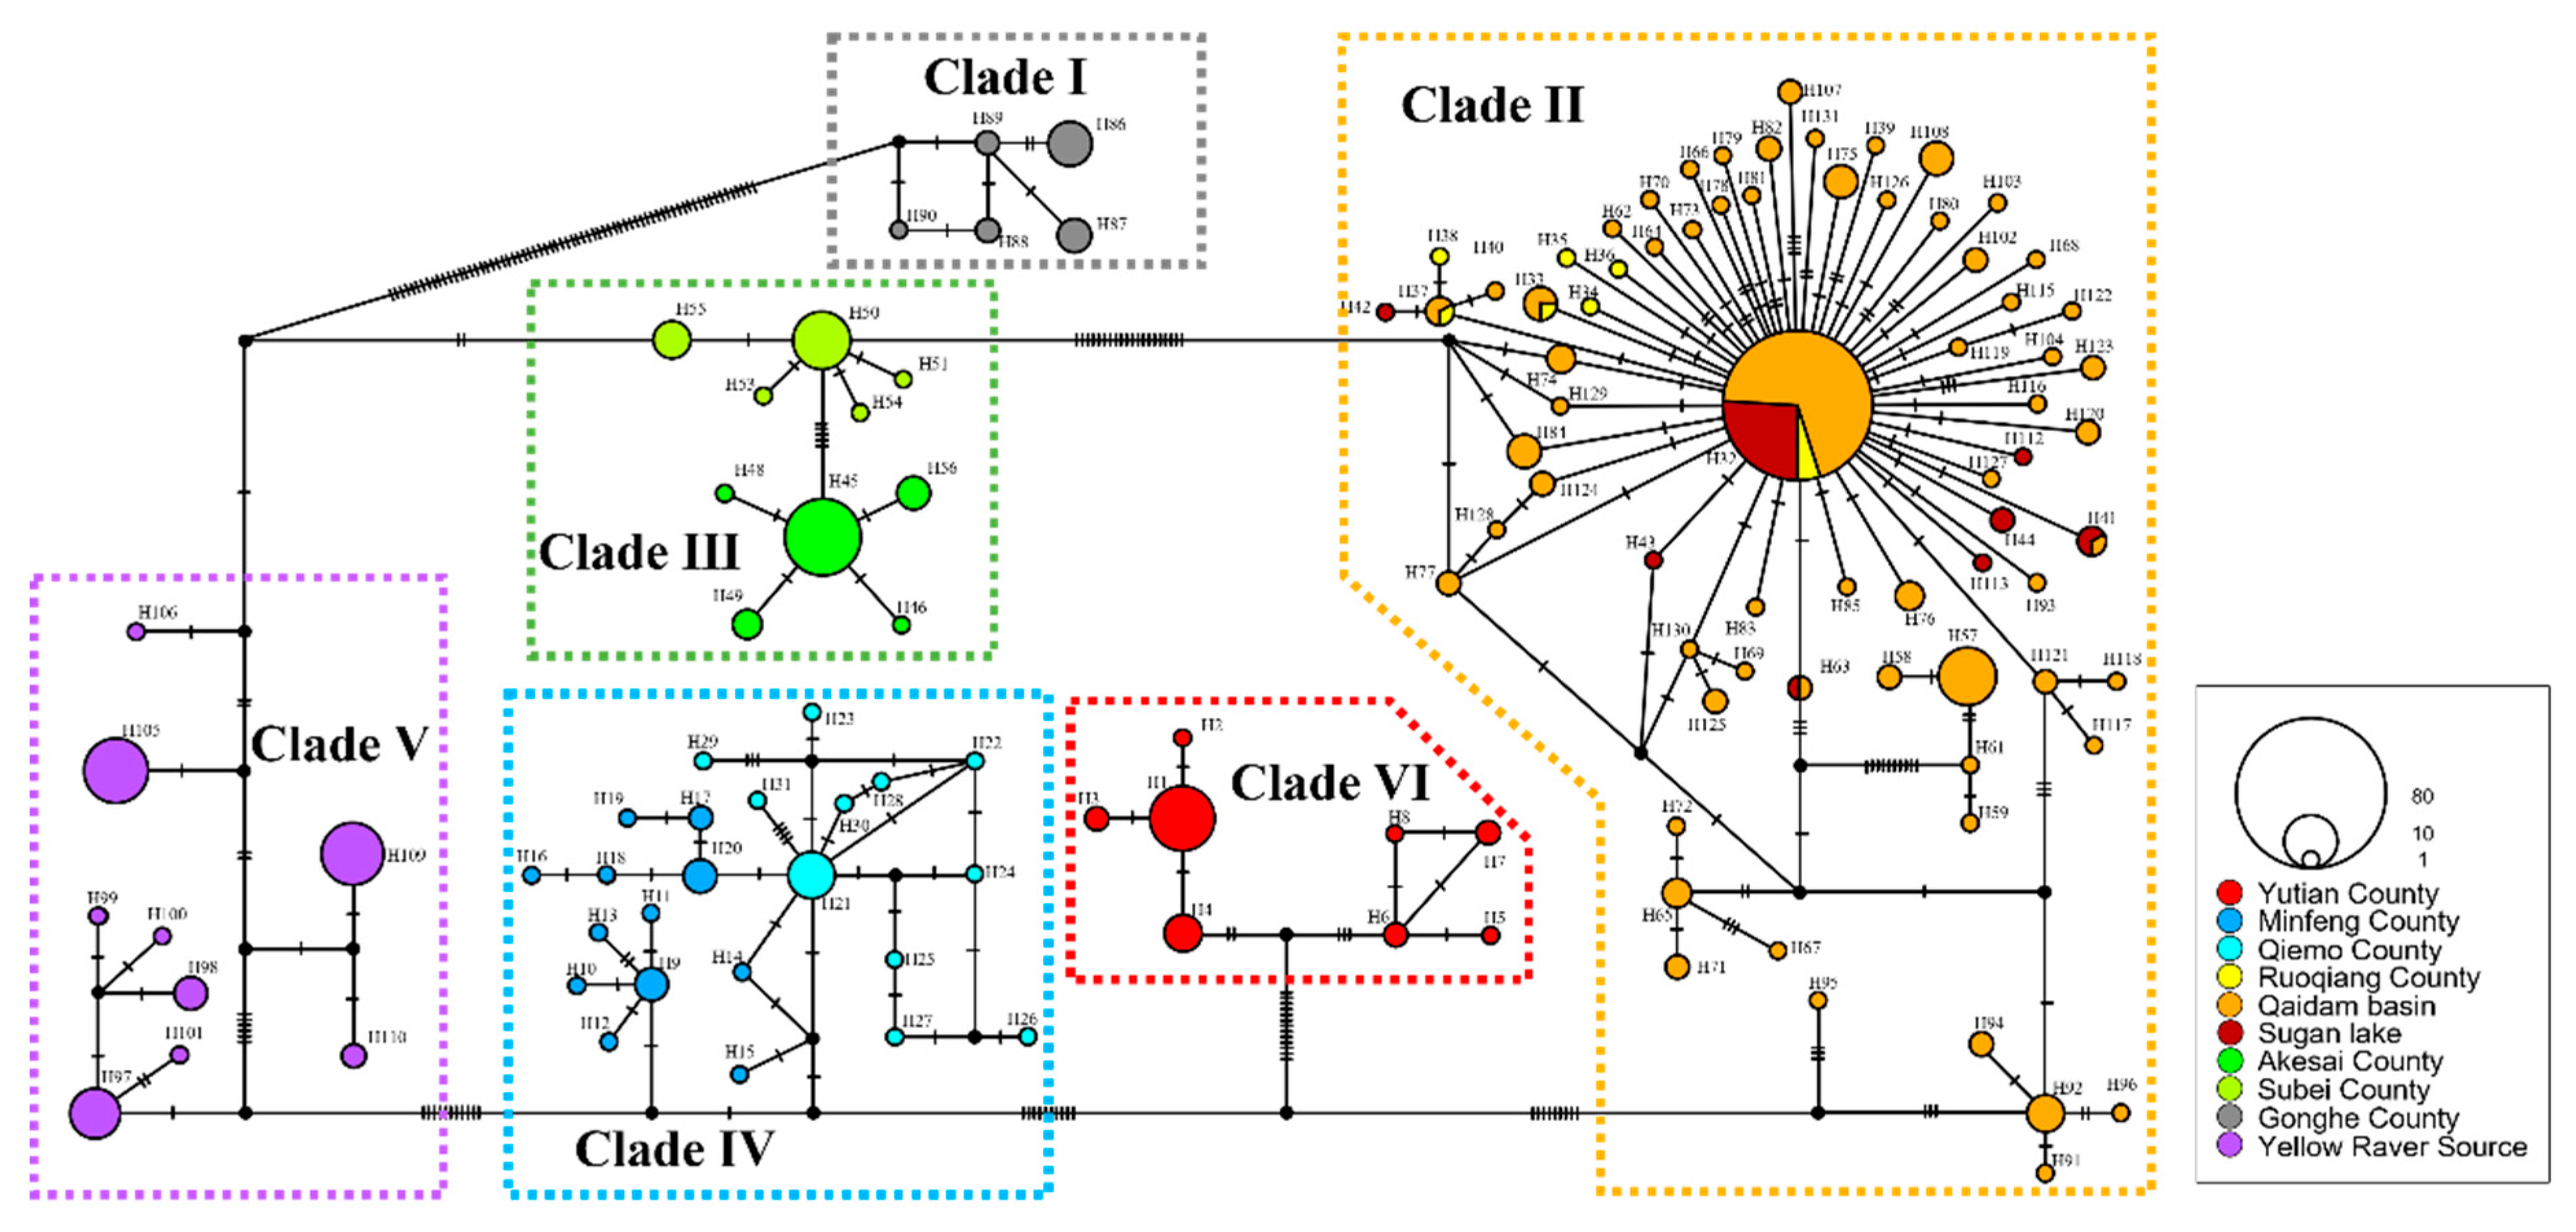
For the haplotype networks, one sample, identified by the voucher number Guo5226, was excluded from this part of the analyses due to unsuccessful sequencing of the ND4-tRNALeu gene. Based on the rest mtDNA dataset of 382 individuals, we identified a total of 131 haplotype sequences and constructed a haplotype network using the TCS method [60] (Figure 3). The network revealed six major haplogroups, consistent with the topology of the phylogenetic tree. These haplogroups exhibit high differentiation and geographic specificity among P. vlangalii populations. Each clade has several dominant haplotypes, with Clade II showing a distinct star-like network centered on the most abundant haplotype (H32, comprising 79 sequences), suggesting a recent population expansion.
For nuDNA, we obtained 86 haplotype sequences after excluding Clade I (Gonghe County lineage), Clade V (Yellow River headwaters, P. v. pylzowi) and part of Clade II (Qaidam Basin, P. v. vlangalii) from the mtDNA phylogenetic tree. The haplotype network was reconstructed using the median-joining method [61]. Due to the conservation of nuclear gene sequences, the mtDNA-based topological structure was not well-supported in the nuDNA haplotype network (Supplementary Materials, Figure S1). Additionally, common haplotypes were observed between different clades, such as between Clade II and Clade III, and between Clade IV and Clade VI.
3.2. Divergence Times Estimation
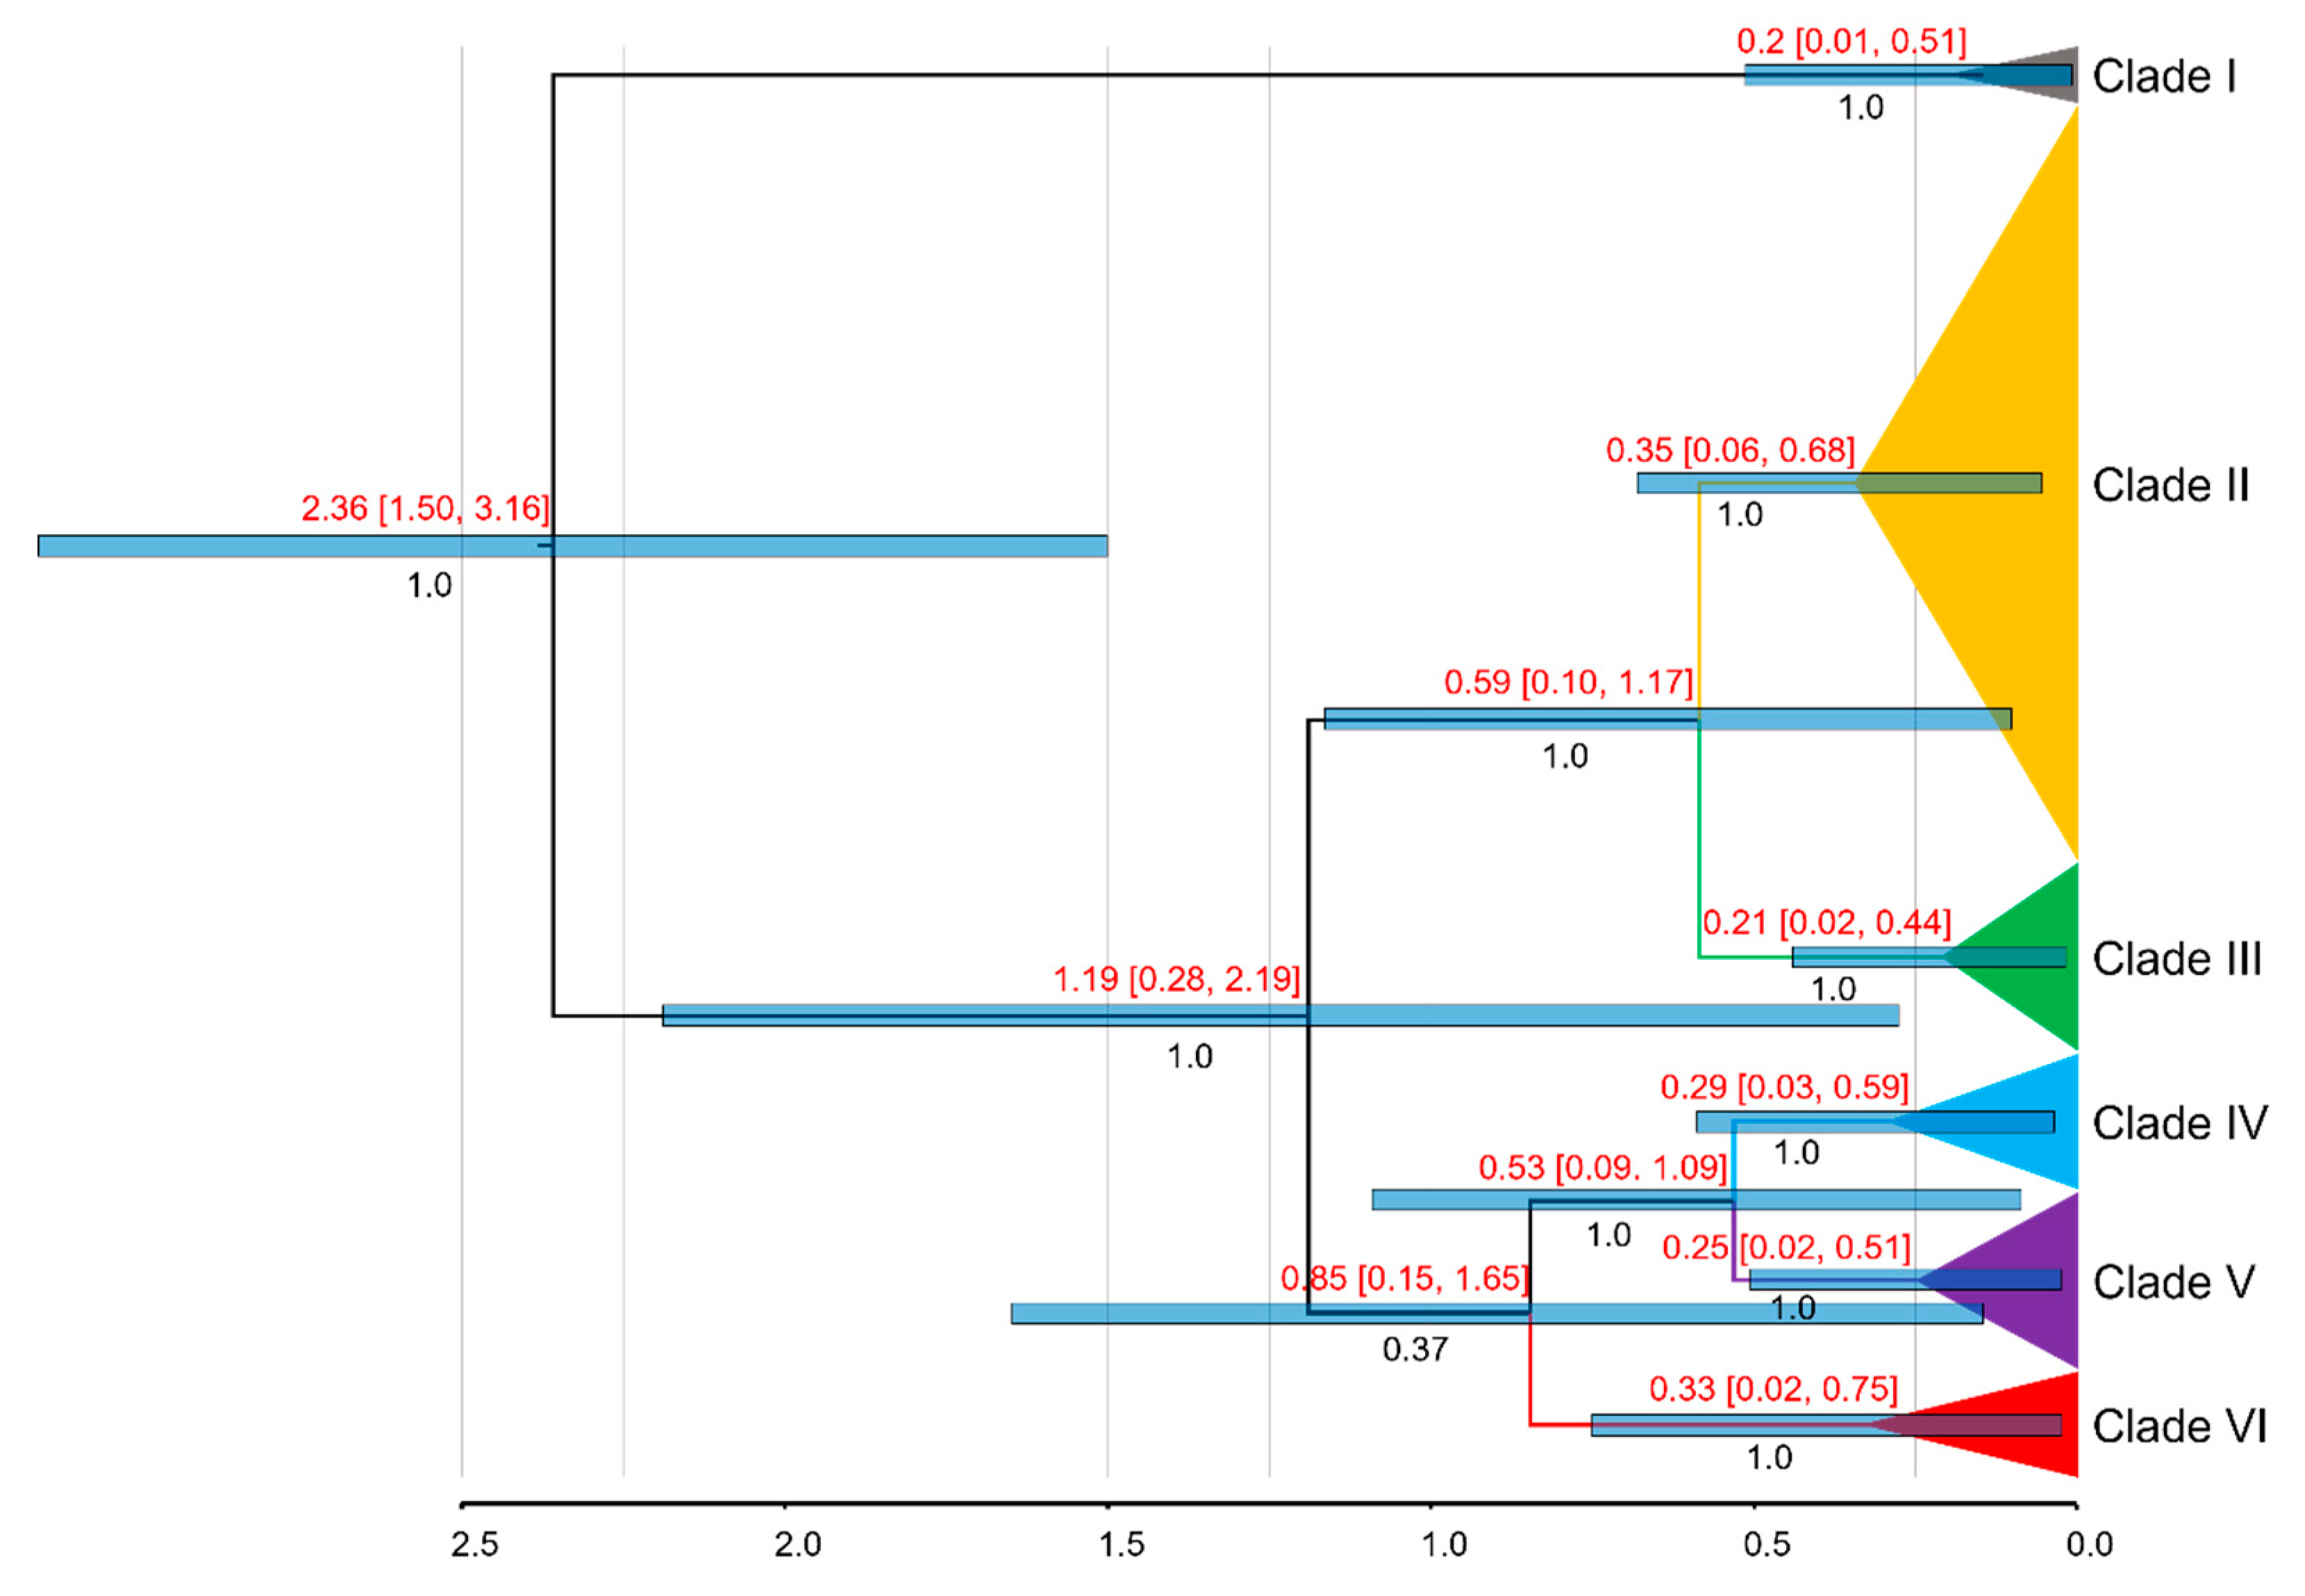
The first analysis of divergence times within the genus Phrynocephalus, as depicted in Figure S2, indicates that P. vlangalii diverged from other Phrynocephalus species during the Pliocene epoch (~2.55 Ma, 95% HPD: 1.78–3.39 Ma). The MRCA of P. vlangalii was dated to the early Pleistocene (~2.36 Mya; 95% HPD: 1.50–3.16 Ma), as shown in Figure 4. The earliest divergence within P. vlangalii was identified as Clade I, the population from Gonghe County. The remaining P. vlangalii populations split into two major clusters around 1.19 Ma (95% HPD: 0.28–2.19 Ma). One of these clusters included clades II and III, which diverged around 0.59 Ma (95% HPD: 0.10–1.17 Ma). Among the remaining clades, clades IV and V diverged at approximately 0.53 Ma (95% HPD: 0.09–1.09 Ma). The support of the differentiation for Clade VI relative to other clades is low (PP=0.37), and the estimated time of divergence with other branches is around 0.85 Ma (95% HPD: 0.15–1.65 Ma).
Figure 4.
Molecular dating of P. vlangalii based on the concatenated mtDNA. Divergence dates with 95% HPD and posterior probability for major nodes are shown.
Figure 4.
Molecular dating of P. vlangalii based on the concatenated mtDNA. Divergence dates with 95% HPD and posterior probability for major nodes are shown.
3.3. Genetic Diversity and Genetic Structure
Removed the sample Guo5226, a total of 126 haplotypes were defined from the concatenated mtDNA dataset of 382 individuals of P. vlangalii. The overall genetic diversity of P. vlangalii is characterized by high haplotype diversity (0.944) and low nucleotide diversity (0.01424) (Table 2). Haplotype diversity varied among the six clades, ranging from a low of 0.709 (Clade IV) to a high of 0.938 (Clade IV). Nucleotide diversity also varied among the clades, with the lowest value of 0.001003 observed in Clade I and the highest value of 0.00413 in Clade II.
Table 2.
Summary statistics of genetic diversity for each clade in P. vlangalii.
| Clade | n | H | Hd | π |
|---|---|---|---|---|
| I | 16 | 5 | 0.758±0.080 | 0.00103±0.00011 |
| II | 218 | 73 | 0.855±0.023 | 0.00413±0.00046 |
| III | 50 | 10 | 0.759±0.045 | 0.00167±0.00011 |
| IV | 37 | 23 | 0.938±0.027 | 0.00202±0.00021 |
| V | 48 | 22 | 0.788±0.032 | 0.00332±0.00019 |
| VI | 29 | 8 | 0.709±0.081 | 0.00143±0.00030 |
| Total | 382 | 126 | 0.944±0.008 | 0.01424±0.00066 |
The SAMOVA analysis of P. vlangalii, excluding Clade I, showed that the Fct value increased with the number of groups (K) from 2 to 10. However, when K reached 6 or more, some populations were merged into single groups. This, K = 5, was identified by SAMOVA as the optimal number of groups, in agreement with the results of the phylogenetic analysis. The Fct values for K = 2, 3, 4, and 5 were 0.5047, 0.6363, 0.7485, and 0.8452, respectively.
The AMOVA analysis (Table 3), based on the SAMOVA grouping, showed significant genetic differences mainly between groups when the 30 populations were divided into 2, 3, 4, and 5 groups (50.47%, 63.63%, 74.85%, 84.52%), with highly significant genetic differentiation coefficients (p < 0.01).
Table 3.
Results of AMOVA for P. vlangalii other than Clade I.
| Hypothesized structure | Among groups | Between populations | Among populations | ||||||
|---|---|---|---|---|---|---|---|---|---|
| df | %var | Fct | df | %var | Fs | df | %var | Fst | |
| No structure | 29 | 93.96 | 336 | 6.04 | 0.93957 | ||||
| K=2 | 1 | 50.47 | 0.50470 | 28 | 46.07 | 0.93018 | 336 | 3.46 | 0.96542 |
| K=3 | 2 | 63.63 | 0.63526 | 27 | 32.30 | 0.88808 | 336 | 4.07 | 0.95929 |
| K=4 | 3 | 74.85 | 0.74854 | 26 | 20.66 | 0.82160 | 336 | 4.49 | 0.95514 |
| K=5 | 4 | 84.52 | 0.84518 | 25 | 11.11 | 0.71769 | 336 | 4.37 | 0.95629 |
The genetic differentiation coefficients are all extremely significant.
The genetic differentiation coefficient Fst calculated between the six clades of P. vlangalii is shown in Table 4. The Fst values ranged from 0.75579 (between clades IV and V) to 0.97079 (between clades I and VI), indicating substantial genetic differentiation between each pair of clades. All significance tests were highly significant (p < 0.01), underscoring the genetic distinctiveness among the clades.
Additionally, the p-distances between and within the clades are presented in Table 4. The average inter-clade genetic distance ranged from 1.1% (between clades IV and V) to 4.4% (between clades I and VI), with no pair exceeding a distance of 5%. Intraclade genetic distances varied from 0.1% (within Clade I and Clade VI) to 0.3% (within Clade V).
Table 4.
The mean uncorrected pairwise distance (p-distance) within each clade (bold diagonal) and between clades (bottom diagonal), together with the pairwise genetic differentiation Fst and its significance between clades (top diagonal) for P. vlangalii.
Table 4.
The mean uncorrected pairwise distance (p-distance) within each clade (bold diagonal) and between clades (bottom diagonal), together with the pairwise genetic differentiation Fst and its significance between clades (top diagonal) for P. vlangalii.
| Clade | I | II | III | IV | V | VI |
|---|---|---|---|---|---|---|
| I | 0.001 | 0.94773* | 0.96367* | 0.95824* | 0.93373* | 0.97079* |
| II | 0.042 | 0.002 | 0.85091* | 0.86520* | 0.86438* | 0.88265* |
| III | 0.042 | 0.015 | 0.002 | 0.89136* | 0.86554* | 0.92031* |
| IV | 0.041 | 0.017 | 0.017 | 0.002 | 0.75579* | 0.89296* |
| V | 0.041 | 0.019 | 0.018 | 0.011 | 0.003 | 0.86559* |
| VI | 0.044 | 0.019 | 0.020 | 0.016 | 0.019 | 0.001 |
Significance level: 0.01*.
3.4. IBD and IBE
The results of the IBD and IBE analyses for P. vlangalii are detailed in the Supplementary Materials (Figure S3). The IBD analysis, the Mantel test, revealed a highly significant positive correlation between genetic distance and geographic distance among populations (R2=0.1938, P < 0.001), supporting the IBD model. In the partial Mantel test, controlling for environmental barriers, a significant positive correlation between genetic and geographic distance was observed (r = 0.2697, P < 0.01). Conversely, when controlling for geographic distance, a significant positive correlation was found between genetic distance and geographical barriers (r = 0.2215, P < 0.05), indicating that both geographic distance and environmental factors, such as the Kunlun-Arjin-Qilian Mountains, significantly influence population differentiation in P. vlangalii.
For the IBE analysis, the Montel test showed a significant positive correlation between genetic distance and environmental distance (R2 = 0.3996, P = 0.002), consistent with the IBE model. In the partial Montel test, controlling for geographic distance, a significant positive correlation was observed between genetic and environmental distance (r = 0.2468, P < 0.05). Similarly, controlling for environmental distance, a significant positive correlation was found between genetic and geographic distance (r = 0.3146, P < 0.05). The results suggest that both environmental and geographic distances contribute to population differentiation in P. vlangalii, with a stronger correlation observed between geographic and genetic distances.
3.5. Historical Demographic Change
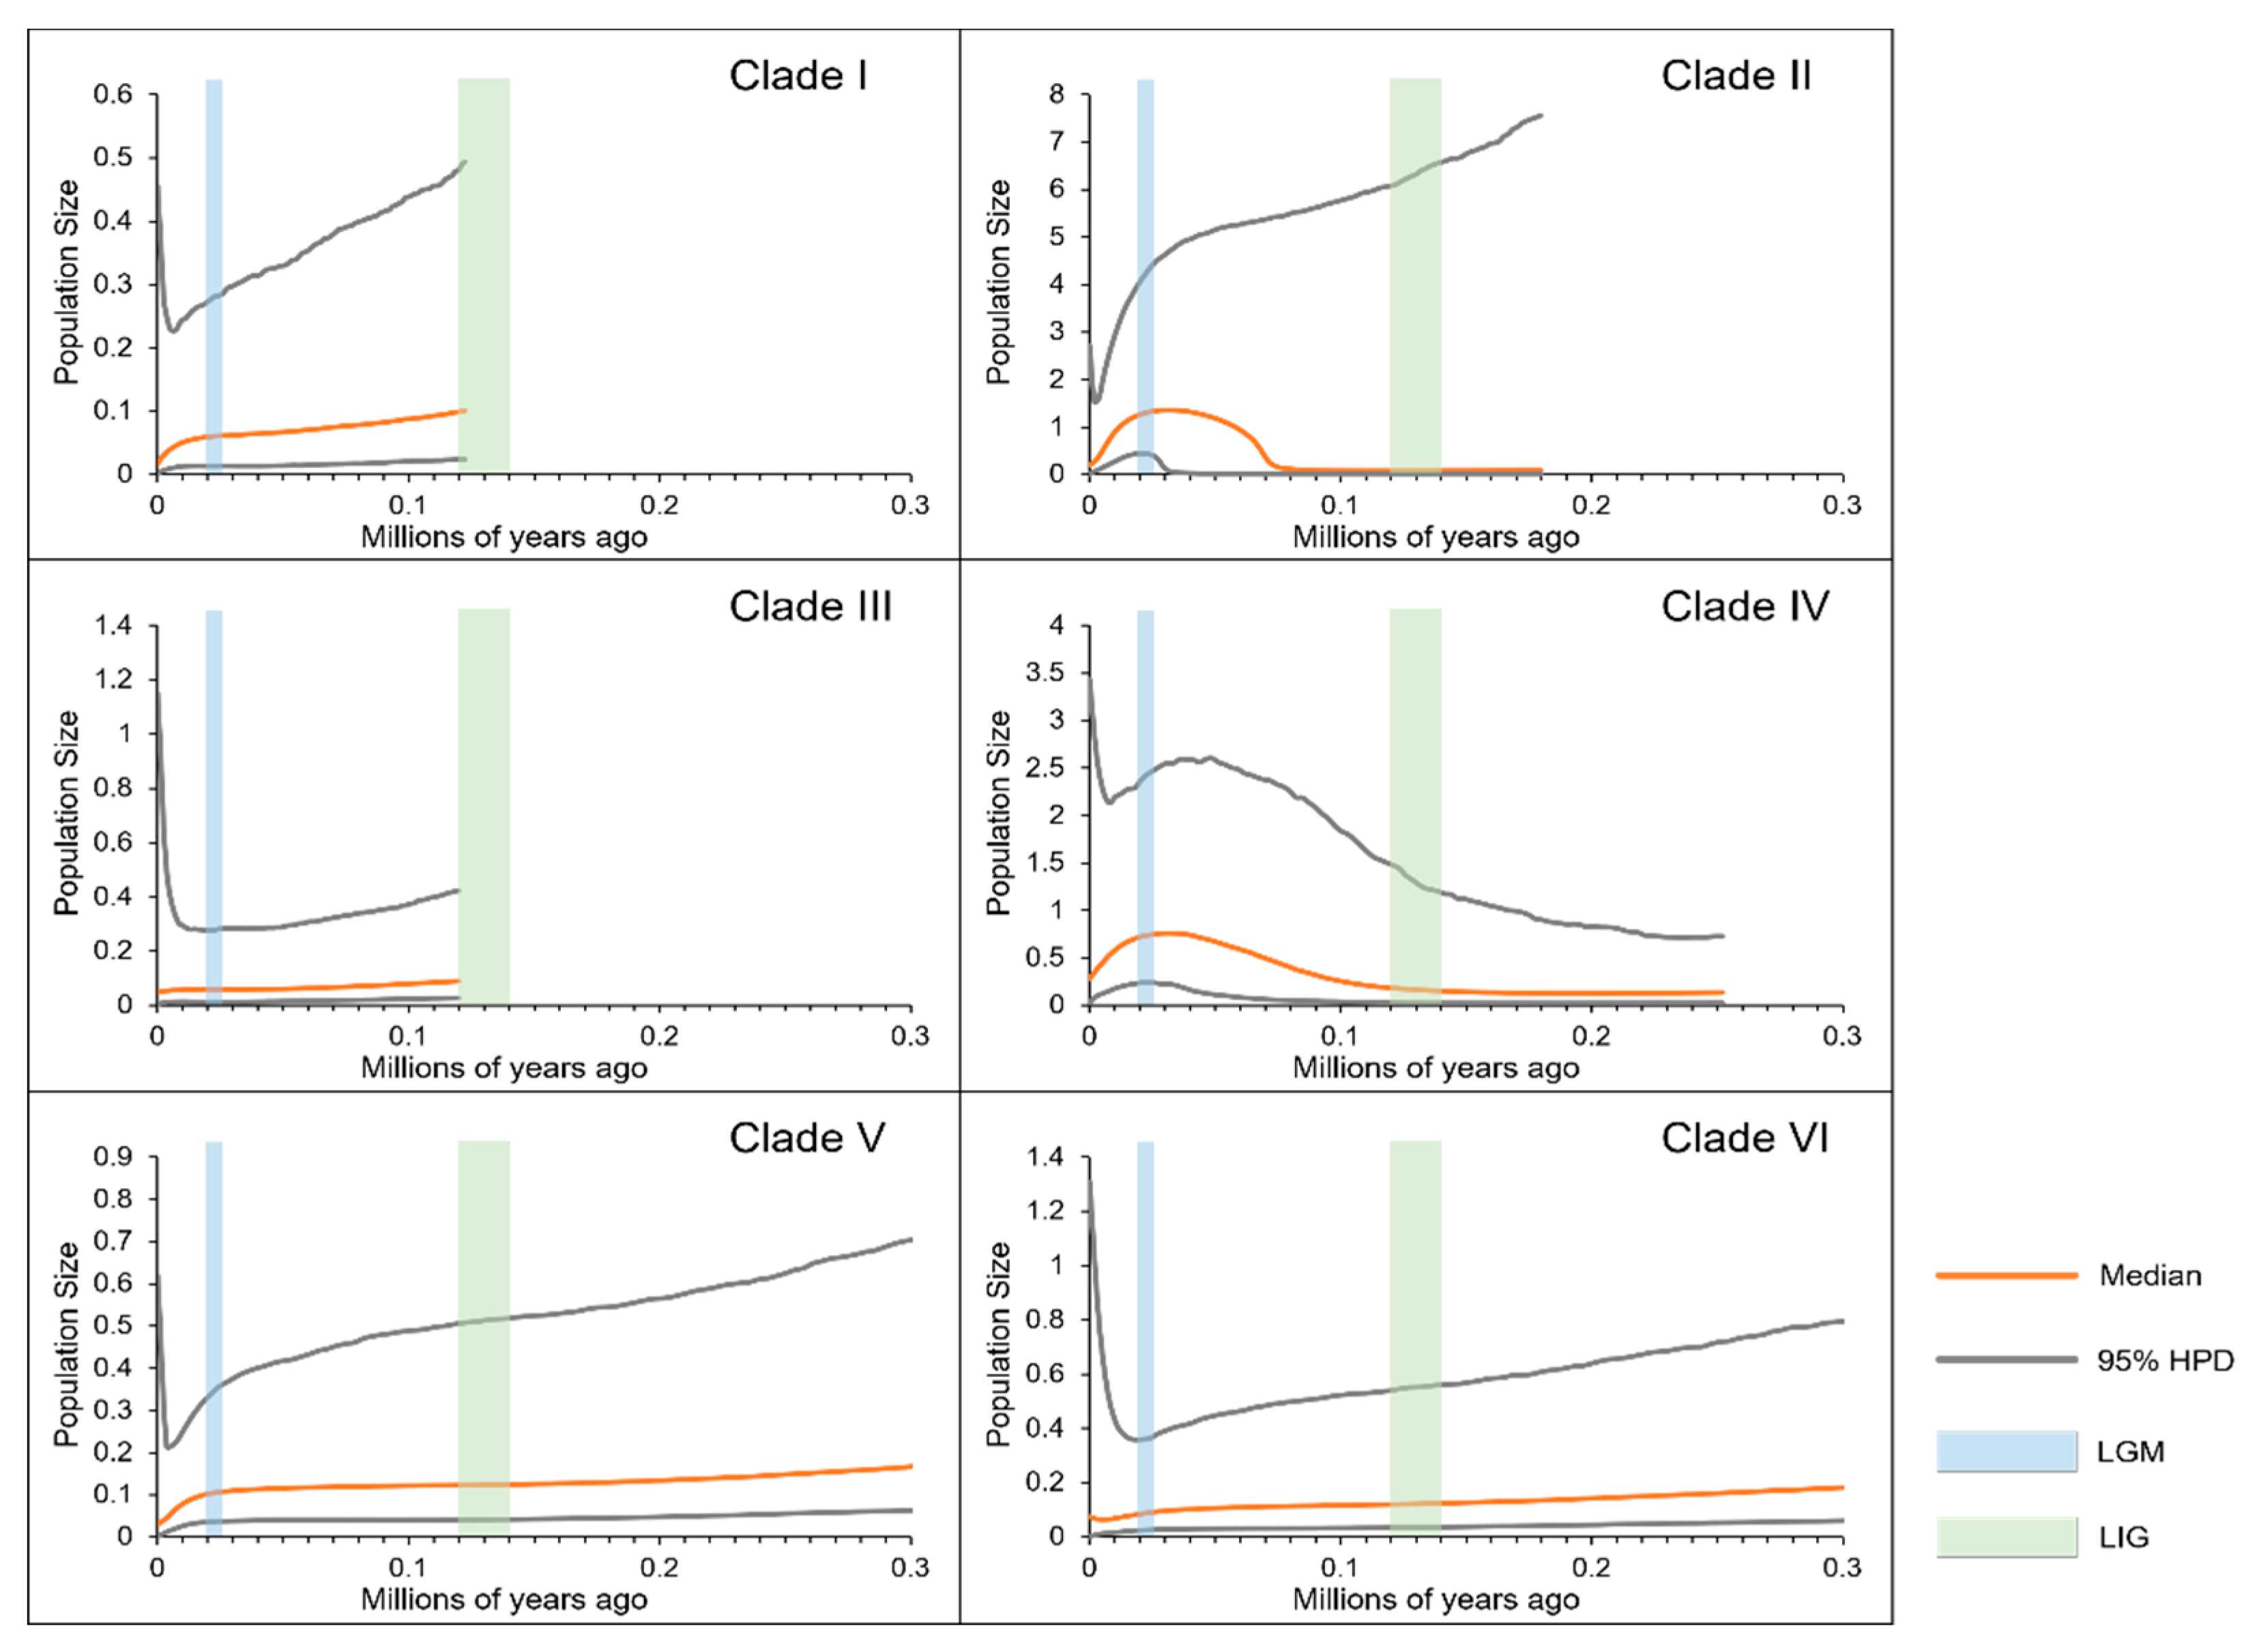
The population expansion tests for each clade of P. vlangalii, including Tajima's D, Fu's Fs, and R2 values, are presented in Table 5. For Clade II, both Tajima's D and Fu's Fs are highly significantly negative, while R2 is highly significantly positive. These results indicate a strong signal of population expansion for Clade II. In the case of Clade IV, Tajima's D is not significantly negative, but Fu's Fs is highly significantly negative and R2 is also significantly positive. This suggests that Clade IV has also experienced some degree of population expansion, although the signal is not as strong as in Clade II.
Analysis of the mismatch distribution (Figure 5) revealed that Clade II and Clade IV exhibited unimodal curves, a characteristic often associated with populations that have undergone rapid expansion. Furthermore, the SSD and Rg values for these clades were small positive numbers, which are not significantly different from zero, further supporting the inference of a historical population growth.
The BSP results for each P. vlangalii clade, as shown in Figure 6, indicate that Clade II and Clade V underwent a rapid expansion after the LIG, followed by contraction after the LGM. These patterns are consistent with the results of our neutrality tests and mismatch distribution analyses. In contrast, the population sizes of the other clades remained relatively stable over the past and only experienced only minor contractions after the LGM.
Table 5.
Neutrality tests and the indicators of mismatch distribution for each clade of P. vlangalii.
Table 5.
Neutrality tests and the indicators of mismatch distribution for each clade of P. vlangalii.
| Clade | Tajima’s D | Fu’s Fs | R2 | SSD | Rg |
|---|---|---|---|---|---|
| I | 0.85989 | 0.18164 | 0.15691 | 0.05819 | 0.16521 |
| II | -2.27806** | -25.42324** | 0.08047** | 0.01726 | 0.03982 |
| III | 0.20213 | -0.19232 | 0.10647 | 0.07700 | 0.11369 |
| IV | -1.37197 | -15.39601** | 0.11797* | 0.00321 | 0.01103 |
| V | 0.78254 | 3.73030 | 0.10731 | 0.07546** | 0.17139** |
| VI | 0.48321 | -0.41435 | 0.12636 | 0.06625 | 0.11087 |
Significance level: 0.05*; 0.01**.
3.6. Morphological Diversity
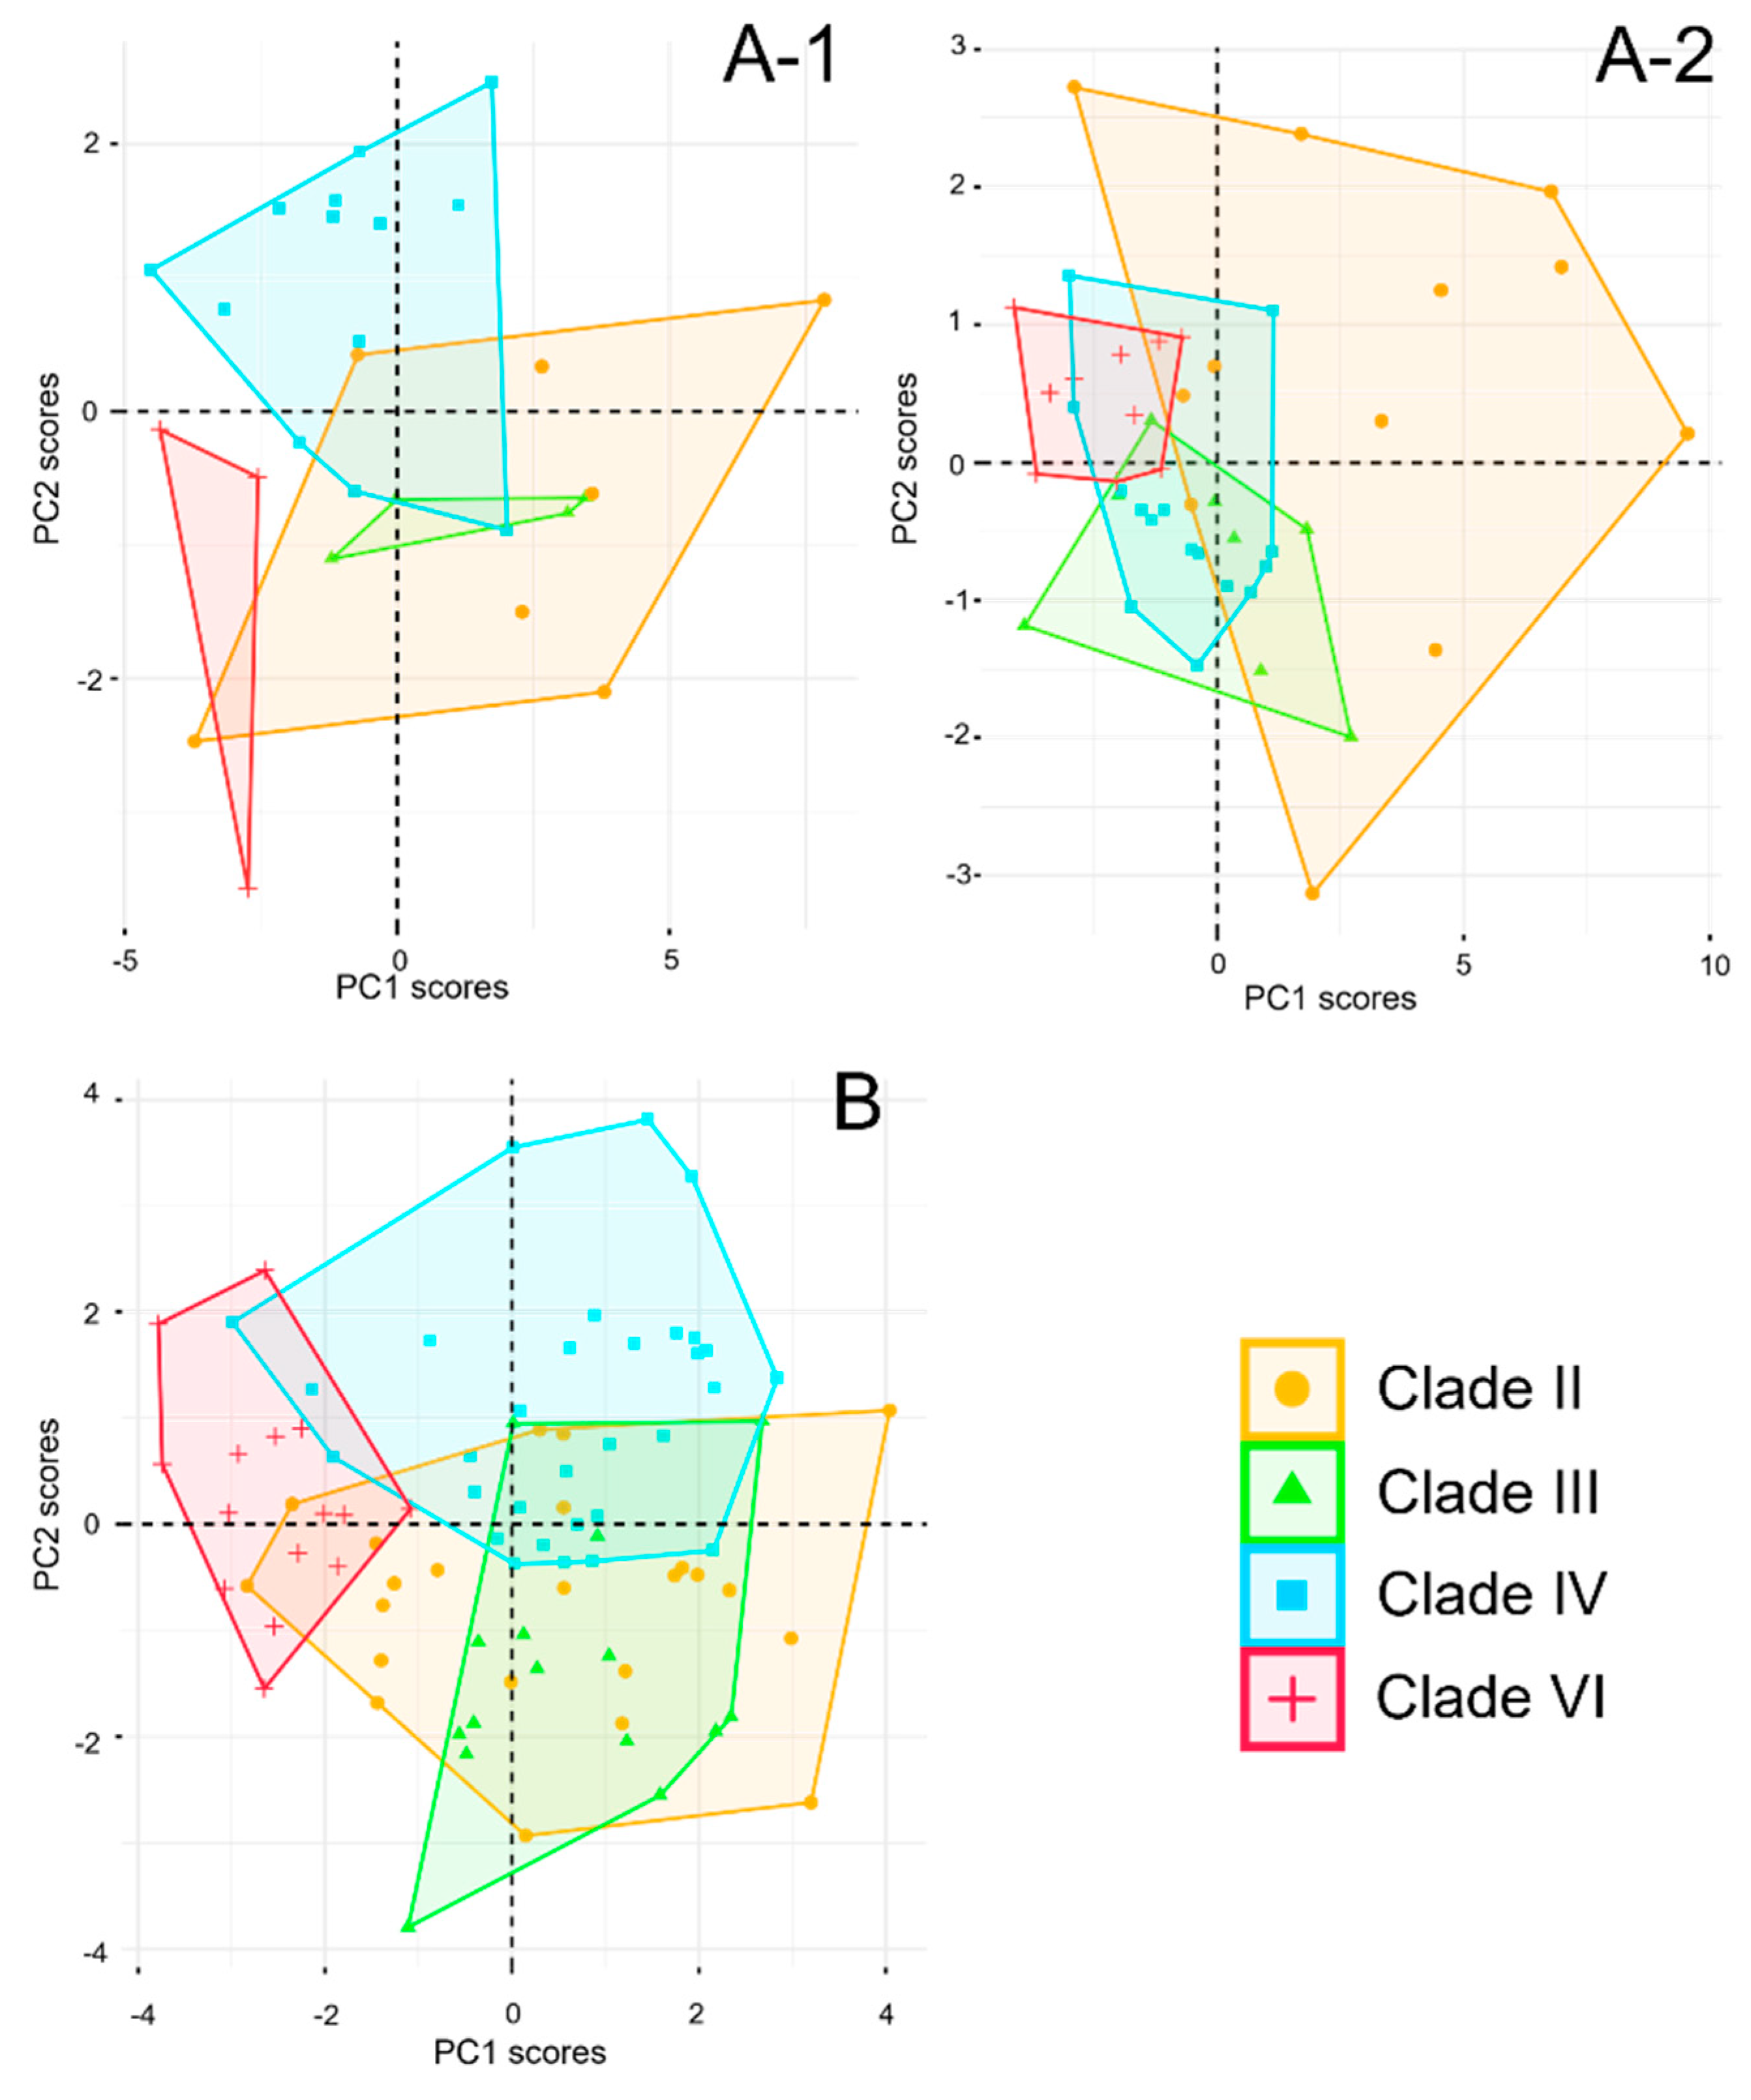
All morphological data collected for P. vlangalii are detailed in Supplementary Materials (Table S8). Principal component analyses (PCAs) of metric traits for both males and females extracted three principal components from the morphological variables, as detailed in Supplementary Materials (Table S7). For the first principal component (PC1), all metric characters show significant loadings (> 0.4), accounting for 58.5% of the variance in males and 63.0% in females, indicating that PC1 is a reasonable representation of individual size. PC2 shows sexual dimorphism in P. vlangalii. In males, high loadings for traits such as tail length (TL), head length (HL), head height (HH), forelimb length (FLL), hind limb length (HLL), and fourth toe claw length (4thTCL) account for 12.4% of the variance. For females, PC2 is mainly loaded on HL and 4th TCL, with less clear patterns, explaining only 6.7% of the variance. The PCA results are shown in Figure 7 (A), where Clade II occupies the largest area and overlaps with other clades. Male Clade VI shows minimal overlap with other clades in metric traits, while female Clade VI has limited overlap with Clade III, and Clade IV overlaps strongly with both Clade VI and Clade III.
Figure 5.
Results of the mismatch distribution analysis for each clade. Orange bars represent the pairwise differences in the observed distribution, and blue lines represent the theoretically expected distribution under a population expansion model.
Figure 5.
Results of the mismatch distribution analysis for each clade. Orange bars represent the pairwise differences in the observed distribution, and blue lines represent the theoretically expected distribution under a population expansion model.
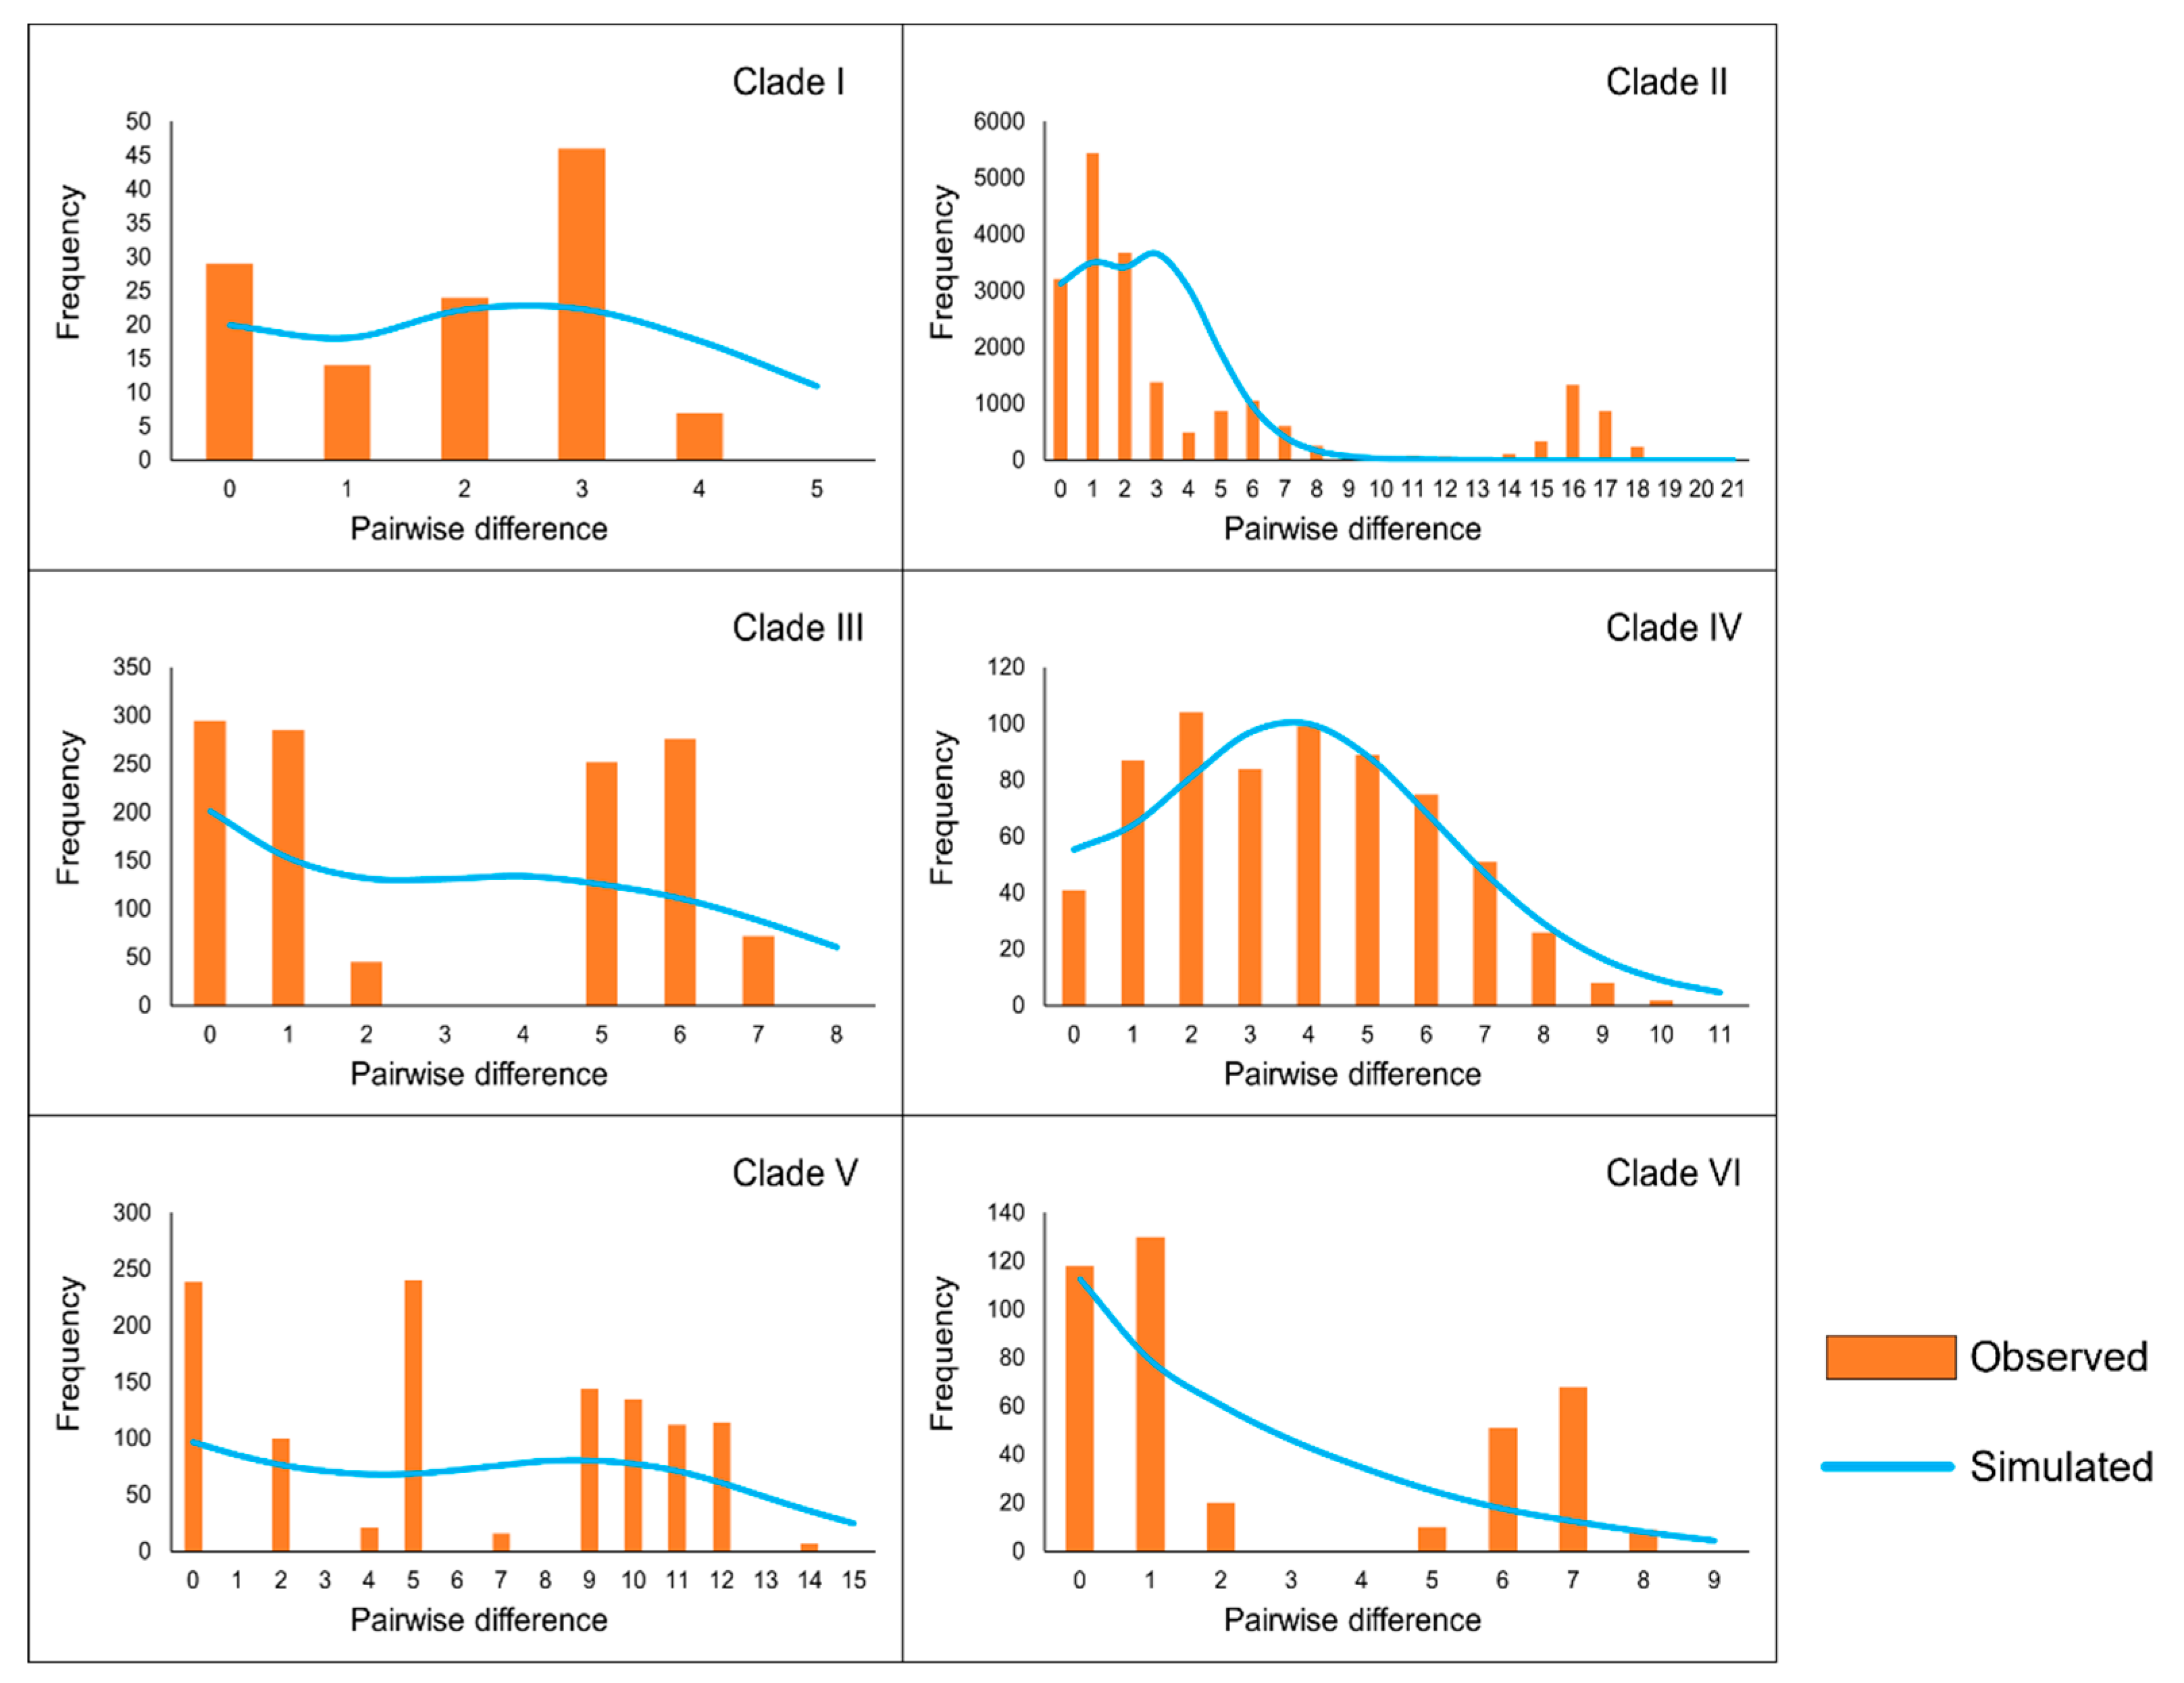
Figure 6.
Bayesian skyline plots for each clade. The y-axes represent the estimated effective population size on a logarithmic scale (Ne*τ/106, the product of the female effective population size and generation length in years); the x-axes represent time in millions of years ago (Ma). The vertical blue and green bars represent the duration of the Last Glacial Maximum (LGM) and the Last Interglacial (LIG), respectively.
For meristic traits, four principal components were extracted from the PCAs of all individuals (Supplementary Materials, Table S7). The PC1 includes significant loadings for scale length (SL), interlimb length (IL), scale midline gap (SMG), dorsal openings (DO), ventral edges (VE), subauricular muscles (SAM), and fourth toe intermediate scale (4thTI), accounting for 26.2% of the variance. PC2, PC3, and PC4, mainly composed of head scales, account for 16.0%, 9.0% and 8.0% of the variance, respectively. The PCA results for the meristic characters are shown in Figure 7 (B). Clade VI shows limited interaction with Clade III and other clades, indicating substantial differences. Most individuals from Clade III overlap with Clade II, while half of the individuals in Clade IV overlap with other clades, suggesting relatively minor differences.
Figure 7.
Result of PCA for each clade of P. vlangalii. A, metric characters (A-1 for male; A-2 for female); B, meristic characters.
Figure 7.
Result of PCA for each clade of P. vlangalii. A, metric characters (A-1 for male; A-2 for female); B, meristic characters.
3.7. Ecological Niche Modeling
In our analysis, the three climate variables that contribute most to the distribution of P. vlangalii are Bio_1 (annual mean temperature, accounting for 48%), Bio_2 (mean diurnal range, 24.3%) and Bio_7 (temperature annual range, 7%). These results underscore the importance of temperature as the primary factor influencing the potential geographical distribution pattern of P. vlangalii (see Supplementary Materials, Table S9). The response curves between the environmental variables and the predicted probability of presence predominantly exhibit non-linear relationships (Supplementary Materials, Figure S3). The probability of presence peaks at 2.5°C for Bio_1, 15.2°C for Bio_2, and 41°C for Bio_7, respectively, consistent with the high-latitude climate pattern.
The AUC values for the training and test datasets were 0.963 ± 0.006 and 0.958 ± 0.014, respectively, indicating the excellent credibility of the simulation results.
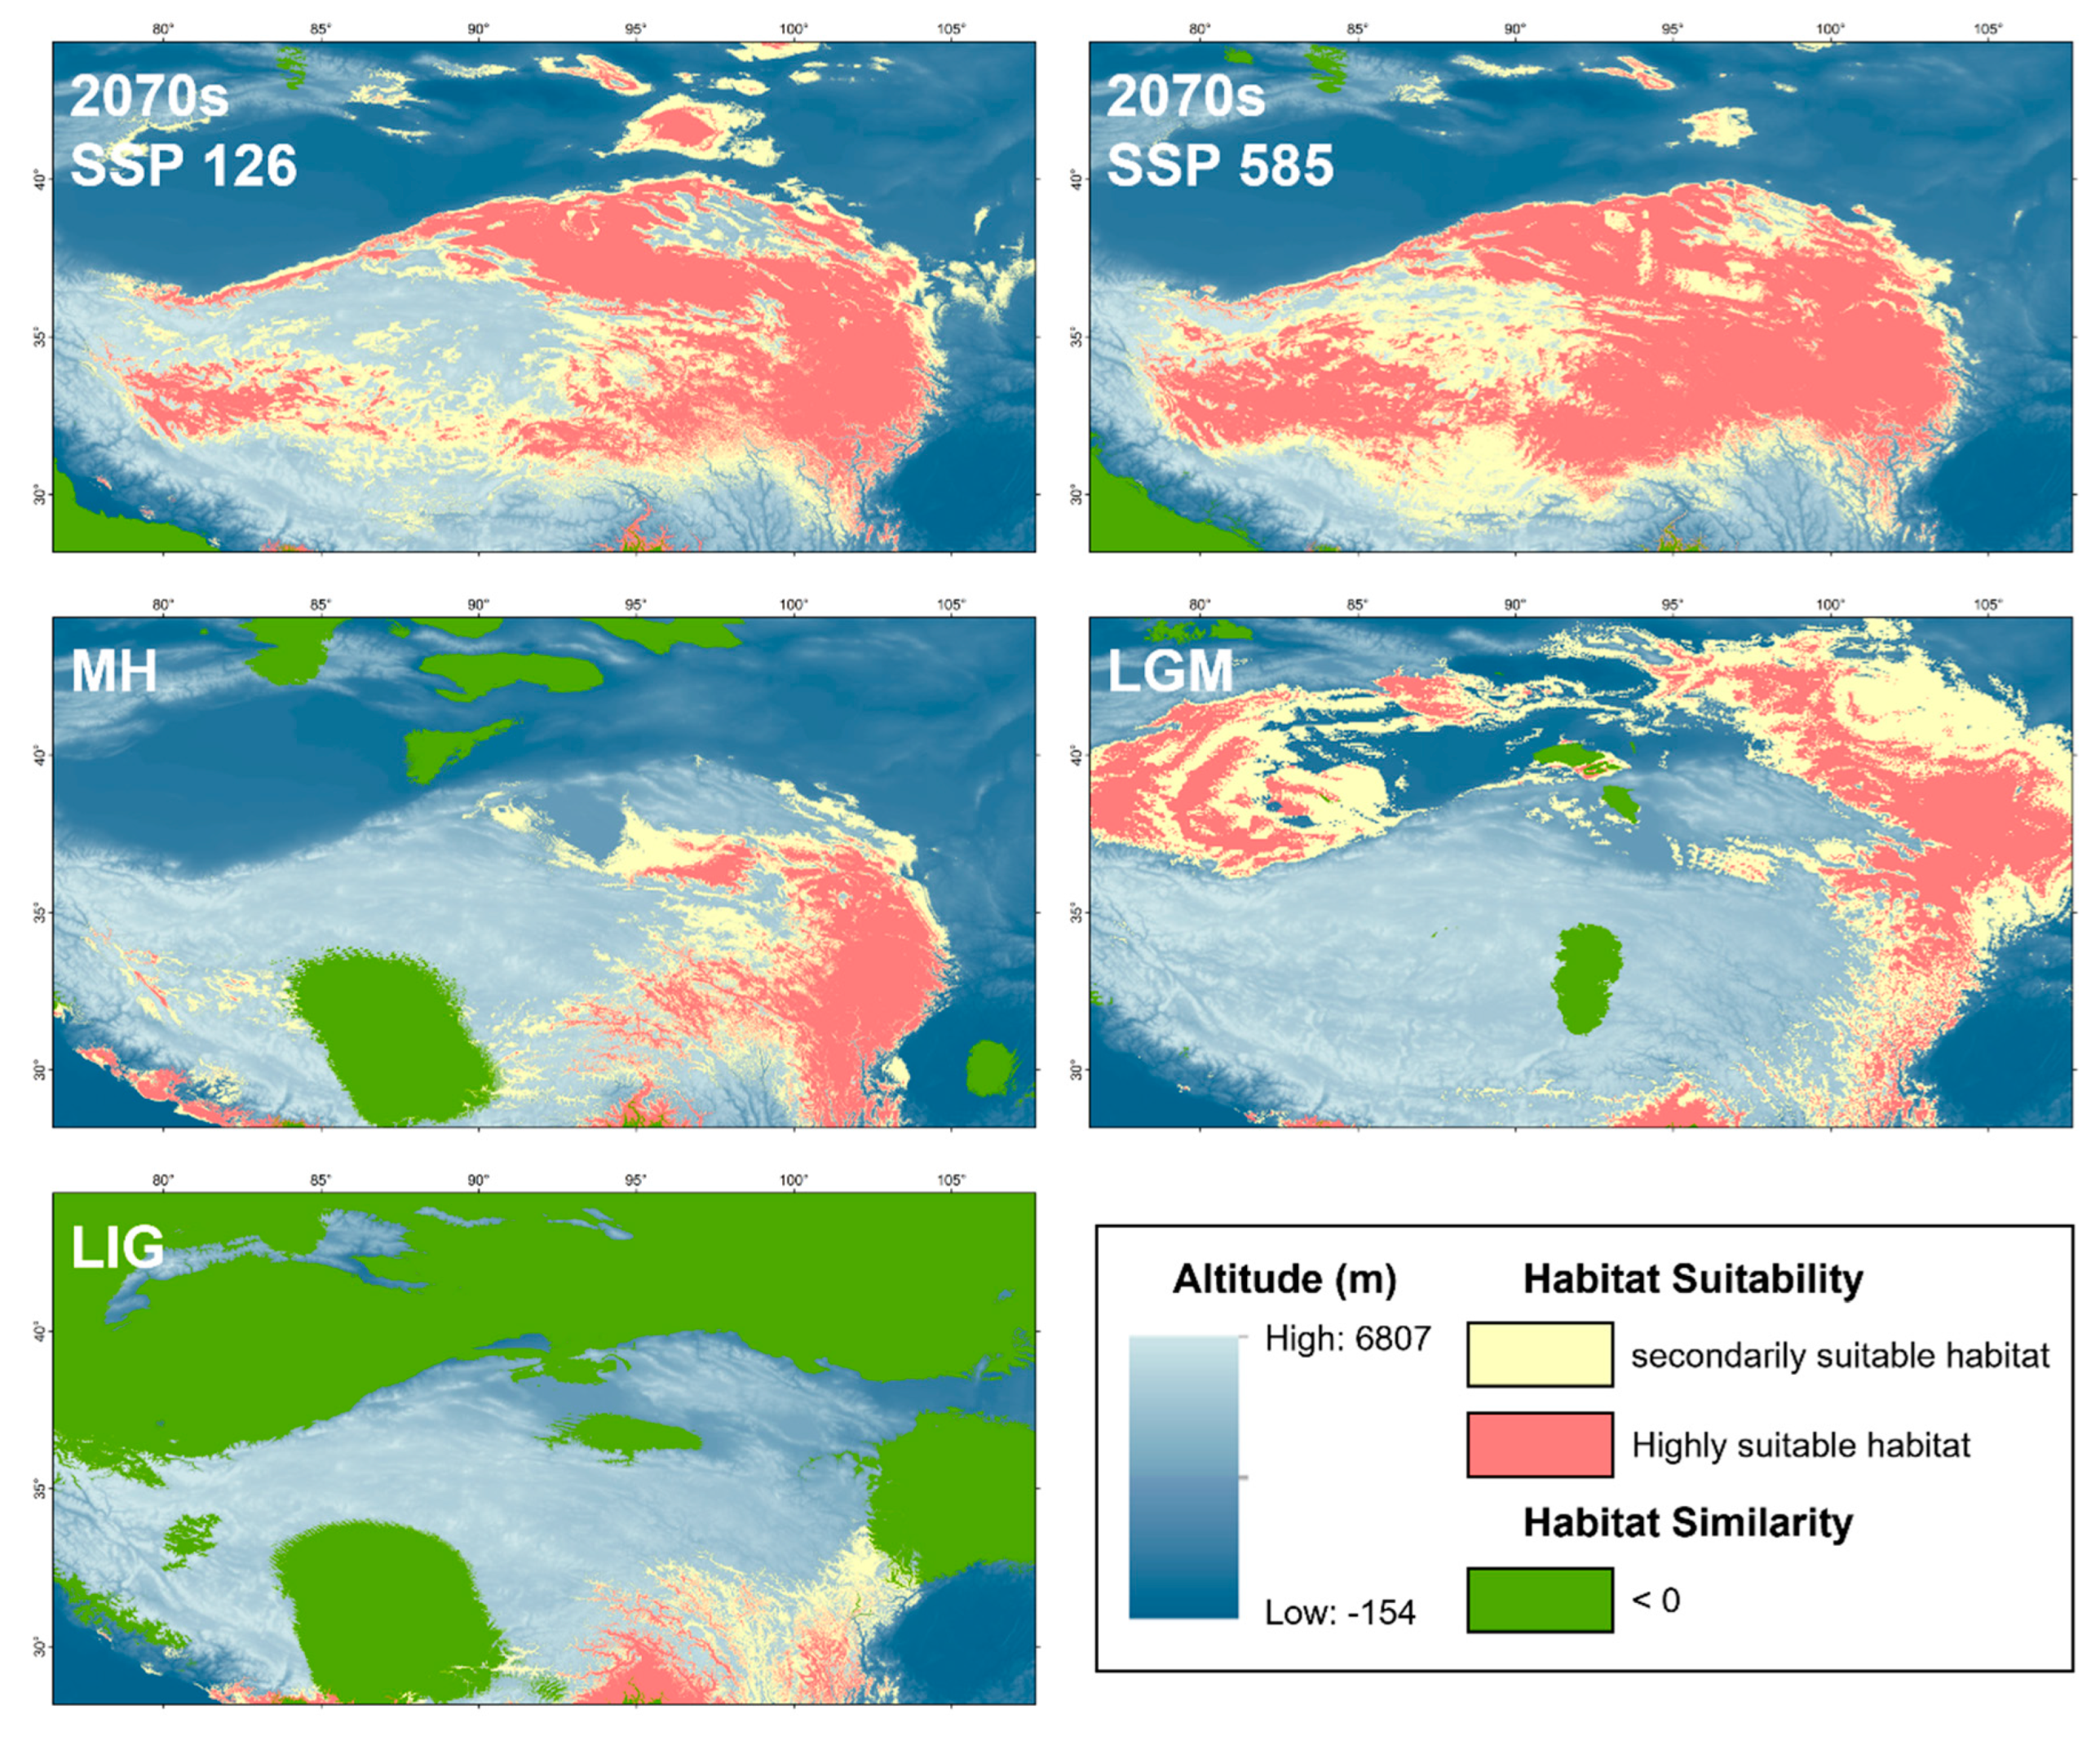
Currently (as shown in Figure 8), the highly suitable and the secondarily suitable habitats for P. vlangalii are widely distributed throughout our study area. In particular, the most important predicted suitable habitats include the NKAQ, the Qaidam Basin, the Yellow River headwaters, the Hexi Corridor, Nagqu and Ngari Prefecture in Tibet, and the area south of Tianshan Mountain. The predicted suitable habitat areas for all periods are detailed in Table 6. In the LIG (Figure 9), P. vlangalii occupied the area south of the QTP, with the smallest suitable habitat area under significant climate differences from the present. Afterwards, however, a rapid expansion occurred, and P. vlangalii reached its largest suitable habitat area in the past during the LGM, with the suitable habitat mainly at the periphery of the QTP. The suitable habitat then contracted prior to the MH. During the MH, the suitable habitat was mainly distributed in the Qaidam Basin and eastern QTP. These changes in area are consistent with the results of previous demographic analyses. In the 2070s, the suitable habitat for P. vlangalii is expected to expand again, shifting to higher elevations of the QTP, especially under the SSP 585 scenario.
Table 6.
The area of predicted suitable habitat for each period of P. vlangalii.
| Period | Highly suitable habitat (km2) | Secondarily suitable habitat (km2) | Total suitable habitat (km2) |
|---|---|---|---|
| Present | 45.55535 | 75.47528 | 121.03063 |
| LIG | 11.06444 | 23.41674 | 34.48118 |
| LGM | 64.07291 | 94.32986 | 158.40277 |
| MH | 41.35229 | 50.57611 | 91.92840 |
| 2070s-126 | 86.65292 | 83.99479 | 170.64771 |
| 2070s-585 | 115.08100 | 78.94542 | 194.02642 |
Figure 8.
Predicted suitable range at contemporary era for P. vlangalii. Green dots represent occurrence data used in Maxent. Yellow and red areas indicate suitable habitat.
Figure 8.
Predicted suitable range at contemporary era for P. vlangalii. Green dots represent occurrence data used in Maxent. Yellow and red areas indicate suitable habitat.
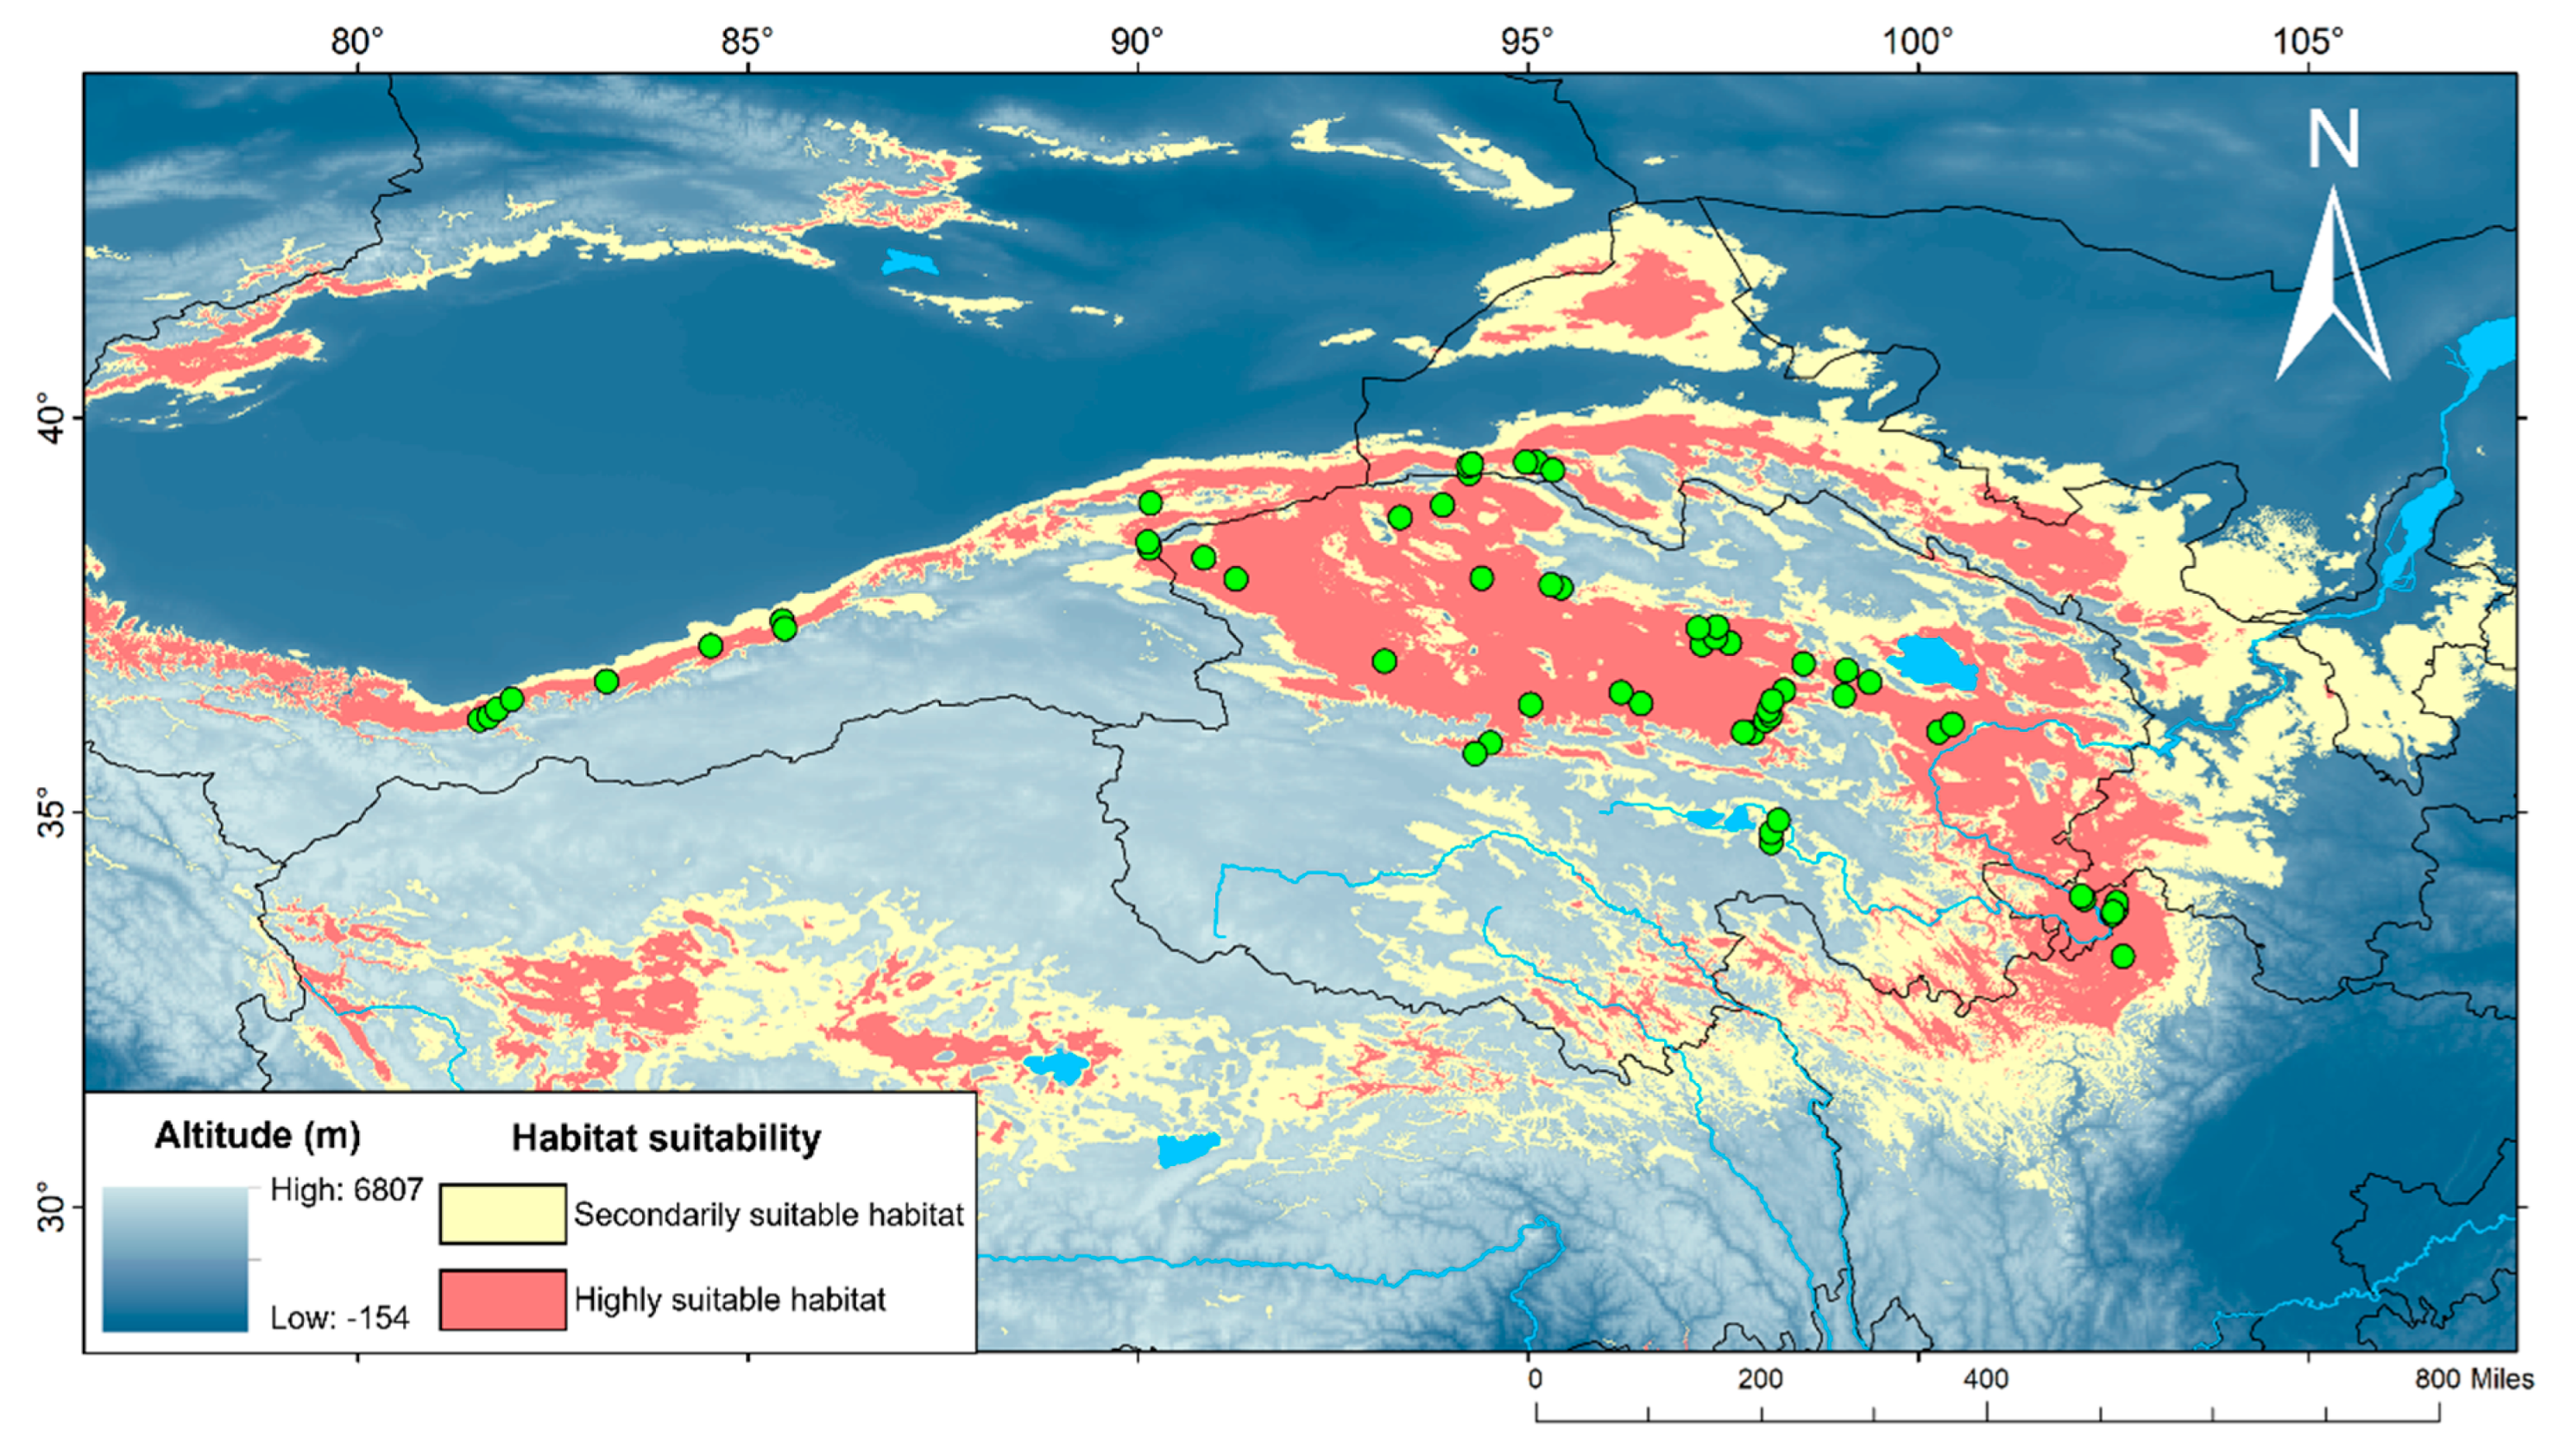
Figure 9.
Potentially suitable range for P. vlangalii in five different time periods. Green area represents MESS scores < 0, indicating areas with no current equivalent of climatic conditions.
Figure 9.
Potentially suitable range for P. vlangalii in five different time periods. Green area represents MESS scores < 0, indicating areas with no current equivalent of climatic conditions.
4. Discussion
4.1. Evolutionary History of P. vlangalii
Based on a phylogenetic tree constructed from three mtDNA and two nuDNA markers, the entire P. vlangalii species was divided into six distinct clades, each with strong statistical support. A study by Chen et al. [12] explored the reasons for multiple divergence nodes through the analysis of molecular clocks and population barriers. The earliest differentiation within P. vlangalii was identified as the Gonghe County population. Chen et al. [12] proposed that this differentiation corresponds to the uplift of the Elashan Mountains during the second phase of the Qingzang Movement (~2.5 Ma), which was the most significant uplift phase. Subsequently, the remaining P. vlangalii split into two major branches, clades II+III and clades IV+V+VI, associated with the uplift of the Anyemanqen Mountains during the Kunhuang Movement (1.1–0.6 Ma).
Subsequently, the differentiation of the subspecies P. v. vlangalii and P. v. nanschanica was attributed to the uplift of the Arjin Mountains. We largely agree with the views of Chen et al. [12]. However, their study lacked strong posterior probability support for the differentiation time of P. v. vlangalii and P. v. nanschanica, possibly due to an insufficient number of haplotypes obtained for P. v. nanschanica at that time. Our analysis determined the differentiation time of P. v. vlangalii and P. v. nanschanica to be approximately 0.59 Ma (95% HPD: 0.10–1.17 Ma), with a high posterior probability support (PP=1.0), confirming that the uplift of the Arjin Mountains during the Kunhuang Movement blocked the gene flow of P. v. vlangalii and P. v. nanschanica [12].
For the other three clades, the phylogenetic tree and molecular clock constructed by Bayesian inference did not fully resolve the phylogenetic relationships between the Minfeng-Qiemo population, P. v. pylzowi and P. v. lidskii (BP < 0.9). The differentiation time of P. v. lidskii and other clades is estimated to be around 0.85 Ma, coinciding with the period of the Kunhuang Movement when the Kunlun Mountains underwent significant uplift, possibly causing differentiation [5]. The Minfeng-Qiemo population and P. v. pylzowi diverged around 0.53 Ma, close to the Kunlun glacial period in China (0.78~0.56Ma [62]). During this time, the higher elevations of the QTP were covered by ice sheets, possibly causing P. vlangalii populations to migrate to lower elevations. It is hypothesized that multiple glacial refugia on the QTP blocked gene flow between the two clades, leading to differentiation [63].
Furthermore, our neutral analysis, mismatch distribution and BSP all indicated significant population expansion in clades II and IV, consistent with the GM expansion model [64]. Additionally, the ENM analysis results revealed a larger area of suitable habitat during the LGM. During this period, the dry and cold climate affected a large area of desert and sandy areas in northern China, intensifying sand-drift activity and increasing desert areas, which may be directly responsible for the expansion of P. vlangalii [65].
4.2. Genetic Structure of P. vlangalii from the NKAQ
In this study, we identified four clades within P. vlangalii from the NKAQ region, each with a distinct regional structure. Clade II (Ruoqiang County), Clade III (Akesai and Subei counties), and Clade V (Yellow River headwaters) correspond to the subspecies P. v. vlangalii, P. v. nanschanica, and P. v. pylzowi, respectively. The population from the northern Kunlun Mountains was first described by Bedriaga [18] as a new variant of P. v. var lidskii. However, Bedriaga’s original description was based on syntype specimens without specifying a type locality. Peters [27] later identified the type locality in the Keria Mountains, Yutian County. Our phylogenetic analysis revealed that the range of P. v. var lidskii includes two strongly supported monophyletic groups, Clade IV and Clade VI, representing the Minfeng-Qiemo and the Yutian populations, respectively. Following the principle of priority, we have designated the Yutian population as P. v. lidskii, while the Minfeng-Qiemo population is recognized as a cryptic new lineage.
Genetic distances and Fst values between different known subspecies of P. vlangalii range from 0.11–0.44 and 0.75579–0.97079, respectively. Despite the close geographical proximity of the Minfeng-Qiemo and Yutian populations, the genetic distance between them is 0.016, and the Fst value is 0.89296, indicating that the genetic differentiation has reached the subspecies level. This suggests that Clade IV, distributed in Minfeng County and Qiemo County, should be recognized as a new subspecies of P. vlangalii.
In our analysis of the nuDNA haplotype network, we did not observe a clear geographical structure as in the case of mtDNA. This phenomenon has been observed in other species, such as the variegated racerunner (Eremias vermiculata), the Barcheck darter (Etheostoma obeyense), and the dry forest toad (Incilius coccifer) [66,67,68]). There are several potential explanations for the discrepancies between nuDNA and mtDNA, including: (i) incomplete lineage sorting (ILS); (ii) gene flow between lineages; (iii) sex-biased dispersal; (iv) populations undergoing secondary contact [69,70]. Male-biased dispersal has been confirmed in P. vlangalii, with females exhibiting philopatry and males having a wider range of activity [71]. This male-mediated gene flow may reduce differences in nuDNA structure between regions.
Additionally, P. vlangalii lineages may be influenced by ILS. NuDNA has a lower rate of base substitution than mtDNA, and the differentiation time between lineages is relatively short, leading to the random fixation of mutations and the sharing of ancestral polymorphisms between these lineages.
4.3. Morphological Diversity of P. vlangalii from the NKAQ
The different clades of P. vlangalii in the NKAQ exhibit unique morphological features. P. v. lidskii, which inhabits the desert and clay habitats of Yutian County, has a sandy yellow body color that is well camouflaged in its environment. This subspecies lacks a prominent dorsal midline and has several pairs of distinct black spots on either side of the spine, extending from the nape to the tail base. The first pair of black spots behind the forelimbs may extend outwards in a dumbbell shape, and a slightly lighter cyan pattern is present on the back, excluding the black spots. P. v. lidskii is the smallest among the four clades, with an average snout-vent length (SVL) of 48.63 mm (SD: 2.28 mm), almost 10 mm shorter than the largest subspecies, P. v. vlangalii, which has an average SVL of 57.53±8.21 mm. The largest individual of P. v. lidskii in this study measured only 51.64 mm.
The Minfeng-Qiemo population shares a similar body color to P. v. lidskii but is slightly larger, with an average SVL of 50.46±2.75 mm. Notably, this population typically has a tail length (TL) that is equal to or greater than its SVL, averaging 54.44±4.59 mm. This characteristic distinguishes it from other clades, which generally have a TL that is shorter than the SVL. The Minfeng-Qiemo population also shows the highest ratios of forelimb length (FLL), hind limb length (HLL), SMG, as well as number of ventrals (VE) and Fourth toe infratarsals (4th TI) to SVL, suggesting a high adaptability to sandy environments.
There are significant morphological differences among populations of P. v. vlangalii from different regions [72], with the NKAQ population being the largest in body size. The Sugan Lake population is particularly notable, with the largest individual reaching an SVL of 73.71 mm (a female). However, this clade has the lowest ratios of TL, FLL, HLL and distance across the axilla and groin (DAG) to SVL, even significantly smaller than other clades with a stout trunk.
P. v. nanschanica shows no significant differences from other clades in principal component analysis (PCA) for either metric or meristic characters. Its back is greyish-white with large grey or yellowish spots extending to the sides of the body. The spots are irregularly shaped with a black border. Numerous small black dots, each consisting of one or a few scales, are present on the back, limbs, and tail, contrasting sharply with the background color.
5. Conclusions
This study provides a focused yet comprehensive examination of the phylogeography and diversity of the Qinghai toad-headed agama (P. vlangalii) across the Qinghai-Tibetan Plateau. The identification of six distinct genetic lineages highlights the central role of geological and glacial history in shaping the evolution of the species. The observed high genetic diversity and significant divergence between clades, influenced by geographic and environmental factors, highlights the need for conservation strategies that take into account fine-scale spatial heterogeneity. The morphological data are consistent with the genetic results, further highlighting the adaptability of P. vlangalii to the geological and climatic changes of the region. The species' resilience is evident in the lack of population decline during the last glacial maximum and the anticipated future habitat expansion, demonstrating its ability to adapt to environmental change. Taken together, our research highlights the critical importance of integrating geological and climatic factors into conservation efforts, and emphasizes the need for ongoing research to safeguard the species against the backdrop of ongoing environmental change.
Supplementary Materials
The following supporting information can be downloaded at the website of this paper posted on Preprints.org. Figure S1: Median-joining network of haplotypes inferred from a total of 130 concatenated nuDNA sequences for P. vlangalii using PopART software; Figure S2: Molecular dating for partial species of the genus Phrynocephalus based on the concatenated mtDNA. Branch support values are not given for most intra-generic nodes to preserve clarity. C1, C2 and C3 indicate the calibration points placed on nodes, and bars show 95% HPD of divergence date, the red bar represents the node of P. vlangalii; Figure S3: Results of the Mantel test of IBD (A) and IBE (B) analysis for P. vlangalii with precise location coordinates. Red lines show the trend of scatter plot; Figure S4. Response curves for each environmental variable in ENM; Table S1: mtDNA and nuDNA primers used in this study, and annealing temperatures used in the PCR reactions; Table S2: Data on the phylogenetic, molecular dating and BSP analyses, including partitions, models and parameters; Table S3: Information on the sampling localities of P. vlangalii, showing locality code and abbreviation, sample size (n) and geographic coordinates for each locality; Table S4: GenBank accession number of each sample and molecular marker; Table S5: Results of AMOVA for P. vlangalii except Clade I; Table S6: Morphological characters examined in this study; Table S7: Loading and cumulative variation for the principal components; Table S8: Morphological data for each clade; Table S9: Eight bioclimatic factors used in ecological niche modeling. References [73‒93] are cited in Supplementary Materials.
Author Contributions
Conceptualization, X.G. and R.X.; methodology, R.X.; software, R.X.; validation, X.G., D.C. and Q.S.; formal analysis, R.X. and Q.S.; investigation, G.X., D.C. and Q.S.; resources, G.X. and D.C.; data curation, X.G.; writing—original draft preparation, R.X.; writing—review and editing, X.G., Q.S. and D.C.; visualization, Q.S., D.C. and X.G.; supervision, X.G.; project administration, X.G.; funding acquisition, X.G. and D.C. All authors have read and agreed to the published version of the manuscript.
Funding
This work was supported by the National Natural Science Foundation of China (Grant Nos. 32070433, 32470466, 31672270, 31872959), the Third Xinjiang Scientific Expedition Program (Grant No. 2021xjkk0600), and the Strategic Priority Research Program of the Chinese Academy of Sciences (Grant No. XDA20050201). The funders had no role in study design, data collection and analysis, decision to publish, or preparation of the manuscript.
Institutional Review Board Statement
The animal study protocol was approved by the Animal Protection and Utilization Committee of Chengdu Institute of Biology, Chinese Academy of Sciences (license numbers: CIB-20120767, CIB-20160767 and CIB-20200767).
Informed Consent Statement
Not applicable.
Data Availability Statement
The data supporting the results of this study can be found in the manuscript. All sequences generated during this study have been deposited in GenBank (https://www.ncbi.nlm.nih.gov/genbank/).
Acknowledgments
We thank Jinlong Liu, Minli Chen, Tianhe Zhou, Xiong Gong, Na Wu, and Song Wang for their help with sample collection. We also thank Zhongyi Yao and Jian Liu for providing some photographs of the lizards used in this study.
Conflicts of Interest
The authors declare no conflict of interest.
References
- Avise, J.C. Phylogeography: The History and Formation of Species; Harvard University Press, Cambridge, MA, 2000.
- Justi, S.A.; Galvao, C.; Schrago, C.G. Geological changes of the Americas and their influence on the diversification of the Neotropical kissing bugs (Hemiptera: Reduviidae: Triatominae). PLoS Neglect. Trop. Dis. 2016, 10, e0004527; [Google Scholar] [CrossRef] [PubMed]
- Maldonado-Sánchez, D.; Gutiérrez-Rodríguez, C.; Ornelas, J.F. Genetic divergence in the common bush-tanager Chlorospingus ophthalmicus (Aves: Emberizidae) throughout Mexican cloud forests: the role of geography, ecology and Pleistocene climatic fluctuations. Mol. Phylogenet. Evol. 2016, 99, 76–88. [Google Scholar] [CrossRef] [PubMed]
- He, J.; Lin, S.; Ding, C.; Yu, J.; Jiang, H. Geological and climatic histories likely shaped the origins of terrestrial vertebrates endemic to the Tibetan Plateau. Global Ecol. Biogeogr. 2021, 30, 1116–28. [Google Scholar] [CrossRef]
- Liu, Z.J.; Sun, Y.J. Uplift of the Qingha-Tibet Plateau and formation, evolution of the Yellow River. Geogr. Geo-Information Sci. 2007, 23, 79–82, (In Chinese with English abstract). [Google Scholar]
- Favre, A.; Päckert, M.; Pauls, S. U.; Jähnig, S. C.; Uhl, D.; Michalak, I.; Muellner-Riehl, A. N. The role of the uplift of the Qinghai-Tibetan Plateau for the evolution of Tibetan biotas. Biol. Rev. 2015, 90, 236–253. [Google Scholar] [CrossRef]
- Zhang, T.; Ma, M.; Zhang, X.; Zhang, H.B.; Liu, M.; Ding, P.; Xu, F. Distribution and population size of black-necked cranes in autumn in East Kunlun and Altun Mountains, Xinjiang. Chin. J. Zool. 2012, 47, 31–35. [Google Scholar] [CrossRef]
- Wu, Y.H. Characteristics of vascular plant flora of Altun Mountain. Master Dissertation, Inner Mongolia University, Hohhot, Inner Mongolia, China, 2021. (In Chinese with English abstract). [Google Scholar]
- Xu, D.Q.; Xi, J.X.; Duan, R.; Jing, H.Q.; Chun, H.; Huang, Y.Y.; Wang, L.; Zhang, C.; Rong, B.G.; Zhan, D.H.; Feng, J.G.; Shi, Z.W.; An, J.S. Investigation and analysis of pathogenic yersinia in plague host animals in the Spermonphilus alaschanicus plague foci of Gansu Province. Chin. J. Zoonoses 2021, 37, 664–667, (In Chinese with English abstract). [Google Scholar]
- Barabanov, A.V.; Ananjeva, N.B. Catalogue of the available scientific species-group names for lizards of the genus Phrynocephalus Kaup, 1825 (Reptilia, Sauria, Agamidae). Zootaxa 2007, 1399, 1–56. [Google Scholar] [CrossRef]
- Jin, Y.T. Evolutionary biology of Phrynocephalus (Agamidae) on Qinghai-Xizang (Tibetan) Plateau. Doctoral Dissertation, Lanzhou University, Lanzhou, China, 2008. (In Chinese with English abstract). [Google Scholar]
- Chen, Y.J.; Zhu, L.; Wu, Q.N.; Hu, C.C.; Qu, Y.F.; Ji, X. Geological and climatic influences on population differentiation of the Phrynocephalus vlangalii species complex (Sauria: Agamidae) in the northern Qinghai-Tibet Plateau. Mol. Phylogenet. Evol. 2022, 169, 107394. [Google Scholar] [CrossRef]
- Jin, Y.T.; Brown, R.P. Species history and divergence times of viviparous and oviparous Chinese toad-headed sand lizards (Phrynocephalus) on the Qinghai-Tibetan Plateau. Mol. Phylogenet. Evol. 2013, 68, 259–68. [Google Scholar] [CrossRef]
- Jin, Y.T.; Yang, Z.S.; Brown, R.P.; Liao, P.H.; Liu, N.F. Intraspecific lineages of the lizard Phrynocephalus putjatai from the Qinghai-Tibet Plateau: impact of physical events on divergence and discordance between morphology and molecular markers. Mol. Phylogenet. Evol. 2014, 71, 288–297. [Google Scholar] [CrossRef] [PubMed]
- Jin, Y.; Brown, R.P. Morphological species and discordant mtDNA: A genomic analysis of Phrynocephalus lizard lineages on the Qinghai-Tibetan Plateau. Mol. Phylogenet. Evol. 2019, 139, 106523. [Google Scholar] [CrossRef]
- Macey, J.R.; Schulte, J.A.; Ananjeva, N.B.; Van Dyke, E.T.; Wang, Y.; Orlov, N.; Shafiei, S.; Robinson, M.D.; Dujsebayeva, T.; Freund, G.S.; Fischer, C.M.; Liu, D.; Papenfuss, T.J. A molecular phylogenetic hypothesis for the Asian agamid lizard genus Phrynocephalus reveals discrete biogeographic clades implicated by plate tectonics. Zootaxa 2018, 4467, 1–81. [Google Scholar] [CrossRef]
- Hu, C.C.; Wu, Y.Q.; Ma, L.; Chen, Y.J.; Ji, X. Genetic and morphological divergence among three closely related Phrynocephalus species (Agamidae). BMC Evol. Biol. 2019, 19, 1–15. [Google Scholar] [CrossRef]
- Bedriaga, J. Amphibien und Reptilien (Reptilia Przewalskiana). In: Wissenschaftliche Resultate der von N.M. Przewalski nach Central-Asien unternommenen Reisen. Zoologischer Theil, Bd. 3, Abth. 1, Lfrg. 1909, 3, 279–502. [Google Scholar]
- Zhao, K.T. A survey of the classification and distribution of the toad head agamids (Phrynocephalus) in China. Acta Sci. Nat. Univ. Neimongol 1979, 15, 111–121, (In Chinese with English abstract). [Google Scholar]
- Zhao, K.T. Notes on the Chinese toad-headed agamids and its diagnostic characters. J. Suzhou Rly. Teachers Coll. 1997, 14, 27–32. (In Chinese with English abstract).
- Zhao, K.T. The terms of classification of genus Phrynocephalus and the atlas of Chinese toad-headed agamids. J. Suzhou Rly. Teachers Coll. 1999, 16, 46–54, (In Chinese with English abstract). [Google Scholar]
- Pope, C.H. Natural History of Central Asia Vol. X: The Reptiles of China. New York, US, 1935; 10, 469–471.
- Jiang, Y.M.; Huang, Q.Y.; Zhao, E.M. A new subspecies of Phrynocephalus vlangalii (Strauch) and preliminary observations on its ecology. Acta Zool. Sin. 1980, 26, 178–183, (In Chinese with English abstract). [Google Scholar]
- Wang, Y.Z.; Zeng, X.M.; Fang, Z.L.; Wu, G.F. A valid species of the genus Phrynocephalus: P. putjatia and a discussion on taxonomy of Phrynoceohalus hongyuanensis (Sauria: Agamidae). Acta Zool. Sin. 2002, 27, 372–383, (In Chinese with English abstract). [Google Scholar]
- Zeng, X.M.; Wang, Y.Z.; Liu, Z.J.; Fang, Z.L.; Wu, G.F.; Papenfuss, T.J.; Macey, J.R. Karyotypes of nine species in the genus Phrynocephalus, with discussion of karyotypic evolution of Chinese Phrynocephalus. Acta Zool. Sin. 1997, 43, 399–410, (In Chinese with English abstract). [Google Scholar]
- Guo, X., Wang, Y. Partitioned Bayesian analyses, dispersal–vicariance analysis, and the biogeography of Chinese toad-headed lizards (Agamidae: Phrynocephalus): A re-evaluation. Mol. Phylogenet. Evol. 2007, 45, 643–62. [CrossRef]
- Peters, G. Die Krötenkopfagamen Zentralasiens (Agamidae: Phrynocephalus). Mitt. Zool. Mus. Berlin 1984, 60, 23–67. [Google Scholar]
- Jin, Y.T.; Brown, R.P.; Liu, N. F Cladogenesis and phylogeography of the lizard Phrynocephalus vlangalii (Agamidae) on the Tibetan plateau. Mol. Ecol. 2008, 17, 1971–82. [Google Scholar] [CrossRef] [PubMed]
- Swindell, S.R.; Plasterer, T.N. SEQMAN: Contig assembly. Sequence data analysis guidebook, 1997, 75–89.
- Kumar, S.; Stecher, G.; Tamura, K. MEGA7: Molecular evolutionary genetics analysis version 7.0 for bigger datasets. Mol. Biol. Evol. 2016, 33, 1870–1874. [Google Scholar] [CrossRef] [PubMed]
- Librado, P.; Rozas, J. DnaSP v5: a software for comprehensive analysis of DNA polymorphism data. Bioinformatics 2009, 25, 1451–1452. [Google Scholar] [CrossRef] [PubMed]
- Zhang, D.; Gao, F.; Jakovlic, I.; Zou, H.; Zhang, J.; Li, W.X.; Wang, G.T. PhyloSuite: An integrated and scalable desktop platform for streamlined molecular sequence data management and evolutionary phylogenetics studies. Mol. Ecol. Resour. 2020, 20, 348–355. [Google Scholar] [CrossRef]
- Ronquist, F.; Teslenko, M.; van der Mark, P.; Ayres, D.L.; Darling, A.; Hohna, S.; Larget, B.; Liu, L.; Suchard, M.A.; Huelsenbeck, J.P. MrBayes 3.2: Efficient Bayesian phylogenetic inference and model choice across a large model space. Syst. Biol. 2012, 61, 539–542. [Google Scholar] [CrossRef]
- Nguyen, L.T.; Schmidt, H.A.; von Haeseler, A.; Minh, B.Q. IQ-TREE: A fast and effective stochastic algorithm for estimating maximum-likelihood phylogenies. Mol. Biol. Evol. 2015, 32, 268–274. [Google Scholar] [CrossRef]
- Minh, B.Q. , Nguyen, M.A.T.; Von Haeseler, A. Ultrafast approximation for phylogenetic bootstrap. Mol. Biol. Evol. 2013, 30, 1188–1195. [Google Scholar] [CrossRef]
- FigTree. Available online: http://tree.bio.ed.ac.uk/software/figtree/ (accessed on 23 May 2024).
- Leigh, J.; Bryant, D. PopART: full-feature software for haplotype network construction. Methods Ecol.
- Drummond, A.J.; Rambaut, A. BEAST: Bayesian evolutionary analysis by sampling trees. BMC Evol. Biol. 2007, 7, 214. [Google Scholar] [CrossRef]
- Liu, J.L.; Guo, X.G.; Chen, D.L.; Li, J.; Yue, B.S.; Zeng, X.M. Diversification and historical demography of the rapid racerunner (Eremias velox) in relation to geological history and Pleistocene climatic oscillations in arid Central Asia. Mol. Phylogenet. Evol. 2019, 130, 244–258. [Google Scholar] [CrossRef]
- Wu, N.; Wang, S.; Dujsebayeva, T.N.; Chen, D.L.; Ali, A.; Guo, X.G. Geography and past climate changes have shaped the evolution of a widespread lizard in arid Central Asia. Mol. Phylogenet. Evol. 2023, 184, 107781. [Google Scholar] [CrossRef] [PubMed]
- Rambaut, A.; Drummond, A.J.; Xie, D.; Baele, G.; Suchard, M.A. Posterior summarization in Bayesian phylogenetics using Tracer 1.7. Syst. Biol. 2018, 67, 901–904. [Google Scholar] [CrossRef] [PubMed]
- Excoffier, L.; Laval, G.; Schneider, S. Arlequin ver. 3.0: an integrated software package for population genetics data analysis. Evol. Bioinform. Online 2005, 1, 47–50. [Google Scholar] [CrossRef]
- Kumar, S.; Stecher, G.; Tamura, K. MEGA7: Molecular evolutionary genetics analysis version 7.0 for bigger datasets. Mol. Biol. Evol. 2016, 33, 1870–1874. [Google Scholar] [CrossRef] [PubMed]
- Dupanloup, I.; Schneider, S.; Excoffier, L. A simulated annealing approach to define the genetic structure of populations. Mol. Ecol. 2002, 11, 2571–81. [Google Scholar] [CrossRef]
- Wright, S. Isolation by distance. Genetics 1943, 28, 114–138. [Google Scholar] [CrossRef]
- Wang, I.J.; Bradburd, G.S. Isolation by environment. Mol. Ecol. 2014, 23, 5649–5662. [Google Scholar] [CrossRef]
- Ersts, P. Geographic distance matrix generator (version 1.23). Available online: http://biodiversityinformatics.amnh.org/open_source/gdmg (accessed on 15 August 2023).
- Hijmans, R.J.; Cameron, S.E.; Parra, J.L.; Jones, P.G.; Jarvis, A. Very high resolution interpolated climate surfaces for global land areas. Int. J. Climatol. 2005, 25, 1965–1978. [Google Scholar] [CrossRef]
- Dixon, P. Vegan, a package of R functions for community ecology. J. Veg. Sci. 2003, 14, 927–930. [Google Scholar] [CrossRef]
- Bonnet, E.; Van de Peer, Y. zt: A software tool for simple and partial mantel tests. J. Stat. Softw. 2002, 7, 1–12. [Google Scholar] [CrossRef]
- Gozdzik, A. , Fu, J. Are toad-headed lizards Phrynocephalus przewalskii and P. frontalis (Family Agamidae) the same species? Defining species boundaries with morphological and molecular data. Russ. J. Herpetol. 2009, 16, 107–18. [Google Scholar]
- Wang, Y.Z.; Wang, H.Z. Geographic variation and diversity in three species of Phrynocephalus in the Tengger Desert, Western China. Asian Herpetol. Res. 1993, 5, 9, (In Chinese with English abstract). [Google Scholar]
- Phillips, S.J.; Anderson, R.P.; Schapire, R.E. Maximum entropy modeling of species geographic distributions. Ecol. Modell. 2006, 190, 231–259. [Google Scholar] [CrossRef]
- Brown, J.L.; Bennett, J.R.; French, C.M. SDMtoolbox 2.0: the next generation Python-based GIS toolkit for landscape genetic, biogeographic and species distribution model analyses. PeerJ 2017, 5, e4095. [Google Scholar] [CrossRef]
- Anderson, R.P.; Raza, A. The effect of the extent of the study region on GIS models of species geographic distributions and estimates of niche evolution: preliminary tests with montane rodents (genus Nephelomys) in Venezuela. J. Biogeogr. 2010, 37, 1378–1393. [Google Scholar] [CrossRef]
- Barve, N.; Barve, V.; Jiménez-Valverde, A.; Lira-Noriega, A.; Maher, S.P.; Peterson, A.T.; Soberón, J.; Villalobos, F. The crucial role of the accessible area in ecological niche modeling and species distribution modeling. Ecol. Model. 2011, 222, 1810–1819. [Google Scholar] [CrossRef]
- Hijmans, R.J.; Cameron, S.E.; Parra, J.L.; Jones, P.G.; Jarvis, A. Very high resolution interpolated climate surfaces for global land areas. Int. J. Climatol. 2005, 25, 1965–1978. [Google Scholar] [CrossRef]
- Muscarella, R.; Galante, P.J.; Soley-Guardia, M.; Boria, R.A.; Kass, J.M.; Uriarte, M.; Anderson, R.P. ENM eval: An R package for conducting spatially independent evaluations and estimating optimal model complexity for Maxent ecological niche models. Methods Ecol. Evol. 2014, 5, 1198–1205. [Google Scholar] [CrossRef]
- Elith, J.; Kearney, M.; Phillips, S. The art of modelling range-shifting species. Methods Ecol. Evol. 2010, 1, 330–342. [Google Scholar] [CrossRef]
- Clement, M.; Posada, D.; Crandall, K.A. TCS: a computer program to estimate gene genealogies. Mol. Ecol. 2000, 9, 1657–9. [Google Scholar] [CrossRef]
- Bandelt, H. J.; Forster, P.; Röhl, A. Median-joining networks for inferring intraspecific phylogenies. Mol. Biol. Evol. 1999, 16, 37–48. [Google Scholar] [CrossRef] [PubMed]
- Shi, Y.F.; Zhao, J.D.; Wang, J. New Understanding of Quaternary Glaciations in China. Shanghai Popular Science Press, Shanghai, China, 2011. (In Chinese with English abstract).
- Jing, C.R.; Liu, H.P. On the glacial and interglacial stages in quaternary of China. J. Chengdu Univ. Tech. 1999, 26,100–103. (In Chinese with English abstract).
- Galbreath, K.E.; Hafner, D.J.; Zamudio, K.R. When cold is better: climate-driven elevation shifts yield complex patterns of diversification and demography in an alpine specialist (American pika, Ochotona princeps). Evolution 2009, 63, 48–63. [Google Scholar] [CrossRef] [PubMed]
- Lu, H.Y. , Guo, Z.T. Impact of climatic change and human activity on desert and sand field in Northern China since the Last Glacial Maximum. Chin. Basic Sci. 2015, 17, 3–8, (In Chinese with English abstract). [Google Scholar]
- Zhou, T.H. Characterization of the complete mitochondrial genome of Eremias vermiculata and its population genetic divergence and historical population dynamics. Master Dissertation, University of Chinese Academy of Sciences, Beijing, China, 2016. (In Chinese with English abstract). [Google Scholar]
- Mendelson, T.C.; Simons, J.N. AFLPs resolve cytonuclear discordance and increase resolution among barcheek darters (Percidae: Etheostoma: Catonotus). Mol. Phylogenet. Evol. 2006, 41, 445–53. [Google Scholar] [CrossRef] [PubMed]
- Firneno, T.J.; O’Neill, J.R.; Portik, D.M.; Emery, A.H.; Townsend, J.H.; Fujita, M.K. Finding complexity in complexes: assessing the causes of mitonuclear discordance in a problematic species complex of Mesoamerican toads. Mol. Ecol. 2020, 29, 3543–59. [Google Scholar] [CrossRef]
- Zink, R.M.; Barrowclough, G.F. Mitochondrial DNA under siege in avian phylogeography. Mol. Ecol. 2008, 17, 2107–21. [Google Scholar] [CrossRef]
- Miraldo, A. , Hewitt, G.M., Paulo, O.S., Emerson, B.C. Phylogeography and demographic history of Lacerta lepida in the Iberian Peninsula: multiple refugia, range expansions and secondary contact zones. BMC Evol. Biol. 2011, 11, 1–19. [Google Scholar] [CrossRef]
- Urquhart, J.; Wang, Y.; Fu, J. Historical vicariance and male-mediated gene flow in the toad-headed lizards Phrynocephalus przewalskii. Mol. Ecol. 2009, 18, 3714–29. [Google Scholar] [CrossRef]
- Xie, F. Environmental correlation of genetic and phenotypic differentiation of Phrynocephalus vlangalii. Master Dissertation, Nanjing Normal University, Nanjing, Jiangsu, China, 2021. (In Chinese with English abstract). [Google Scholar]
- Rassmann, K. Evolutionary age of the Galápagos iguanas predates the age of the present Galápagos Islands. Mol. Phylogenet. Evol. 1997, 7, 158–172. [Google Scholar] [CrossRef]
- Jin, Y.T.; Liu, N.F. Phylogeography of Phrynocephalus erythrurus from the Qiangtang Plateau of the Tibet Plateau. Mol. Phylogenet. Evol. 2010, 54, 933–940. [Google Scholar] [CrossRef]
- Arèvalo, E.; Davis, S.K.; Sites, J.W. Mitochondrial DNA sequence divergence and phylogenetic relationships among eight chromosome races of the Sceloporus grammicus complex (Phrynosomatidae) in central Mexico. Syst. Biol. 1994, 43, 387–418; [Google Scholar] [CrossRef]
- Macey, J.R.; Schulte, J.A.; Ananjeva, N.B.; Larson, A. Phylogenetic relationships among agamid lizards of the Laudakia caucasia species group: testing hypotheses of biogeographic Fragmentation and an area cladogram for the Iranian Plateau. Mol. Phylogenet. Evol. 1998, 10, 118–131. [Google Scholar] [CrossRef] [PubMed]
- Tong, H.; Jin, Y. The complete mitochondrial genome of an agama, Phrynocephalus putjatia (Reptilia, Squamata, Agamidae). Mitochondrial DNA A 2014, 27, 1028–1029. [Google Scholar] [CrossRef]
- Zhu, L.; Liao, P.; Tong, H.; Jin, Y. The complete mitochondrial genome of the subspecies, Phrynocephalus erythrurus parva (Reptilia, Squamata, Agamidae), a toad-headed lizard dwell at highest elevations of any reptile in the world. Mitochondrial DNA A 2014, 27, 703–704. [Google Scholar] [CrossRef] [PubMed]
- Jin, Y.T.; Brown, R.P. Partition number, rate priors and unreliable divergence times in Bayesian phylogenetic dating. Cladistics 2018, 34, 568–573. [Google Scholar] [CrossRef]
- Li, J.; Guo, X.; Chen, D.; Wang, Y. The complete mitochondrial genome of the Yarkand toad-headed agama, Phrynocephalus axillaris (Reptilia, Squamata, Agamidae). Mitochondrial DNA 2013, 24, 234–236. [Google Scholar] [CrossRef]
- Chen, D.; Zhou, T.; Guo, X. The complete mitochondrial genome of Phrynocephalus forsythii (Reptilia, Squamata, Agamidae), a toad-headed agama endemic to the Taklamakan Desert. Mitochondrial DNA A 2016, 27, 4046–4048. [Google Scholar] [CrossRef]
- Fu, C.; Chen, W.; Jin, Y. The complete mitochondrial genome of Phrynocephalus guinanensis (Reptilia, Squamata, Agamidae). Mitochondrial DNA A 2016, 27, 1103–1104. [Google Scholar] [CrossRef]
- Li, D.; Song, S.; Chen, T.; Zhang, C.; Chang, C. Complete mitochondrial genome of the desert toad-headed agama, Phrynocephalus przewalskii (Reptilia, Squamata, Agamidae), a novel gene organization in vertebrate mtDNA. Mitochondrial DNA 2015, 26, 696–697. [Google Scholar] [CrossRef]
- Li, D.; Guo, J.; Zhou, X.; Chang, C.; Zhang, S. The complete mitochondrial genome of Phrynocephalus helioscopus (Reptilia, Squamata, Agamidae). Mitochondrial DNA A 2016, 27, 1846–1847. [Google Scholar] [CrossRef]
- Chen, D.; Guo, X.; Li, J. The complete mitochondrial genome of secret toad-headed agama, Phrynocephalus mystaceus (Reptilia, Squamata, Agamidae). Mitochondrial DNA 2013, 25, 19–20. [Google Scholar] [CrossRef] [PubMed]
- Song, S.; Li, D.; Zhang, C.; Jiang, K.; Zhang, D.; Chang, C. The complete mitochondrial genome of the color changeable toad-headed agama, Phrynocephalus versicolor (Reptilia, Squamata, Agamidae). Mitochondrial DNA A 2016, 27, 1121–1122. [Google Scholar] [CrossRef] [PubMed]
- Shuang, L.; Liu, L.; Song, S. The complete mitochondrial genome of Grumgzimailo’s toad-headed agama, Phrynocephalus grumgrizimailoi (Reptilia, Squamata, Agamidae). Mitochondrial DNA A 2014, 27, 1581–1582. [Google Scholar] [CrossRef] [PubMed]
- Shao, M.; Ma, L.; Zhang, G.; Wang, Z. The complete mitochondrial genome of the toad-headed lizard, Phrynocephalus albolineatus (Reptilia, Squamata, Agamidae). Mitochondrial DNA A 2017, 28, 137–138. [Google Scholar] [CrossRef] [PubMed]
- Li, J.Q. Life history evolution of Phrynocephalus (Agamidae) along altitudinal gradients on Tibetan Plateau. Doctoral Dissertation, Lanzhou University, Lanzhou, China, 2013. (In Chinese with English abstract). [Google Scholar]
- Yu, W. Altitudinal differences in reproductive life history traits and offspring growth of Phrynocephalus vlangalii. Master Dissertation, Northeast Forestry University, Harbin, China, 2021. (In Chinese with English abstract). [Google Scholar]
- Niu, C.K. Study on the personality and gut microbiota of Phrynocephalus vlangalii. Master Dissertation, Lanzhou University, Lanzhou, China, 2022. (In Chinese with English abstract). [Google Scholar]
- Wan, H.; Qi, Y; Guo, X.; Wang, Y. Preliminary study on sexual dimorphism and seasonal variation of the belly patch and tail-tip badge of the adult toad-headed lizard Phrynocephalus vangalii hongyuanensis. Sichuan J. Zool. 2011, 30, 54–58. [Google Scholar]
- Liu, L.; Guo, X.; Wang, Y. Genetic variation and diversity of Phrynocephalus vlangalii hongyuanensis in Zoige wetland inferred from ND4-tRNAleu Gene. Zool. Res. 2008, 29, 121–126, (In Chinese with English abstract). [Google Scholar] [CrossRef]
Figure 1.
Collection sites for P. vlangalii samples used in this study. The sites are numbered in accordance with Table 1 and Table S3, with clades distinguished by different colors as referenced in Figure 2. Sites 16‒31 were sourced from previous research by Chen et al. [12]. The following abbreviations represent the geographical features associated with the collection sites: KLM, Kunlun Mountains; AJM, Arjin Mountains; QLM, Qilian Mountains; TB, Tarim Basin; QTP, Qinghai-Tibetan Plateau; QB, Qaidam Basin; ZB, Zoige Basin; YR, Yellow River; QHL, Qinghai Lake.
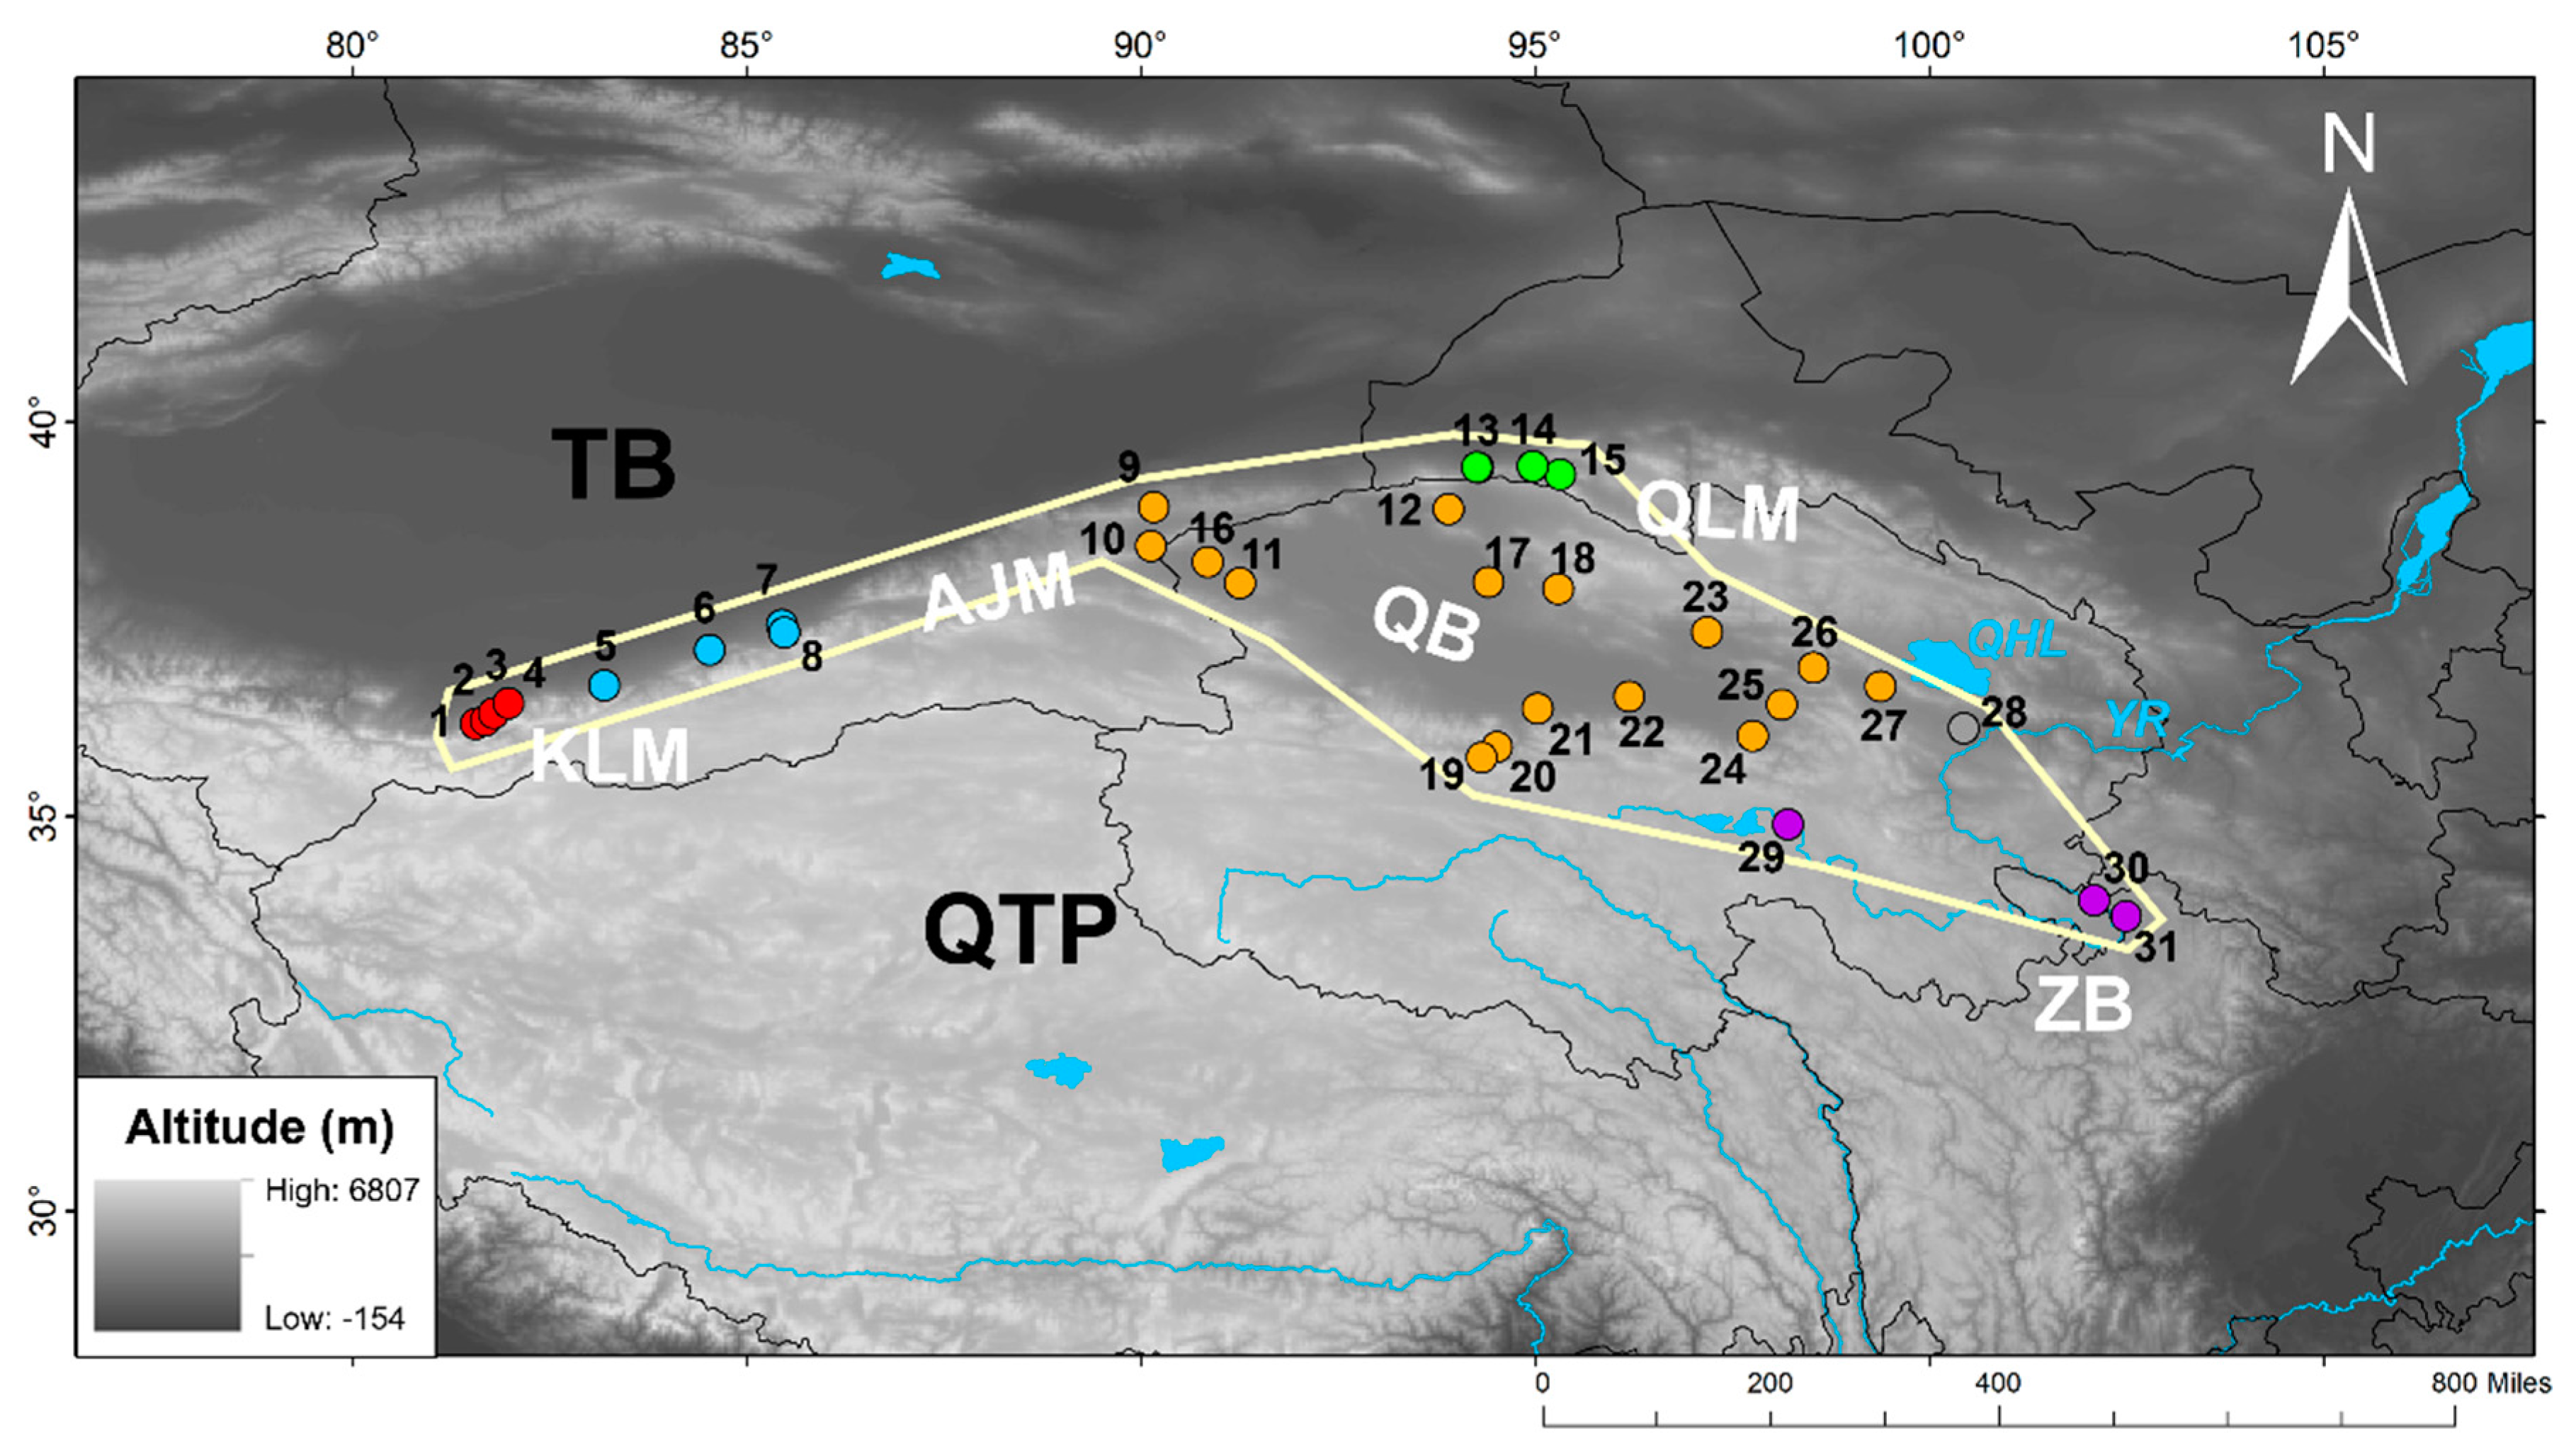
Disclaimer/Publisher’s Note: The statements, opinions and data contained in all publications are solely those of the individual author(s) and contributor(s) and not of MDPI and/or the editor(s). MDPI and/or the editor(s) disclaim responsibility for any injury to people or property resulting from any ideas, methods, instructions or products referred to in the content. |
© 2024 by the authors. Licensee MDPI, Basel, Switzerland. This article is an open access article distributed under the terms and conditions of the Creative Commons Attribution (CC BY) license (http://creativecommons.org/licenses/by/4.0/).
Copyright: This open access article is published under a Creative Commons CC BY 4.0 license, which permit the free download, distribution, and reuse, provided that the author and preprint are cited in any reuse.


