
Submitted:
09 June 2025
Posted:
10 June 2025
You are already at the latest version
Abstract
Isoflavones are the main phenolic compounds of soybean that affect its biological activity. The amount of these compounds isolated from plant material can vary depending on the extraction method, including the type of extractants used. This study aimed to develop optimum proportions of three-component extraction mixtures to maximise the extraction of individual isoflavones from soybeans. The method of Design of Experiments (DOE, Design of Experiments) for three-component mixtures was employed to optimise the experiment. The results of the predominant isoflavones obtained from soybean seeds were daidzin, genistin, malonylgenistin, malonyldaidzin and malonylglycitin. The tested extracts were obtained by accelerated solvent extraction and analyzed for isoflavones content (ESI-TOF-MS profiling of extracts). In the conducted experiment, the use of three extractants: ethanol, propanediol (glycol) and water in a 1:1:1 ratio allowed the isolation of the highest amounts of isoflavones among all used mixtures. However, the development of approximated value and utility profiles indicated the model with which the extraction efficiency was the highest. This model involves the use of a mixture with the following composition: ethanol 32.8%, water 39.2% and glycol 27.8%. It allows us to obtain the optimal amount of isoflavones from soybean seeds. The method of plans for mixtures and triangular response surfaces in the described case proved effective in developing an optimal three-component extraction mixture.
Keywords:
soybean
; extraction
; design of experiment
; isoflavones
; daidzin
; genistin
1. Introduction
Soybeans (Glycine max (L.) Merr.) belong to the broad bean (legume) plants (Leguminosae). The plant was domesticated from wild soybeans (Glycine soja Sieb. & Zucc.) in China about 5000 years ago [1]. Long-term artificial selection for higher yields has resulted in cultivated soybeans having larger inflorescences, larger seeds, thicker stems and more upright plants than their wild ancestors. Additionally, it is classified as an oilseed crop due to the diverse applications of its oil, including its use as an ingredient for biodiesel. Moreover, soybeans is cultivated for its wide use in human and animal nutrition and industrial applications (e.g. cosmetics, paints, plastics). Statistics show that global soybean production increased about 13-fold between 2014- 2023 compared to previous years [2].
The plant’s capacity to fix free nitrogen through the symbiotic root-nodule bacteria Bradyrhizobium japonicum confers economic benefits and environmental advantages. As a result, soybeans have lower fertiliser requirements. Seed soybeans are characterised by their high protein and fat content, including unsaturated fatty acids. These can be found in the raw plant, seeds, and soy products, i.e., soymilk, meal, sauce and tofu. The protein content of soybean seeds is 33-45%, while the fat content ranges from 18-22%. Due to the high biological value of protein, soybeans is considered the most important protein crop in the world [1]. Soybean varieties are classified into distinct earliness groups based on their respective dates of maturity. The following varieties are distinguished: very early, early, intermediate early, late, and very late. The most popular varieties in Poland are Merlin, Abelina, Sg Anser, Amandine, Lissabon and Malaga [3].
Besides protein and fats, soybeans are a source of various metabolites, including phenols, isoflavones, terpenoids, saponins, vitamins, tocopherols, amino acids, fibre, lecithin, mineral salts, which play the role of vitamins and antioxidants [4,5]. Soy saponins protect against cancer, diabetes, and cardiovascular diseases. Additionally, they are distinguished by their antiviral, antimicrobial, and hepatoprotective properties [6]. In contrast, soy isoflavones possess antioxidant properties and have been demonstrated to exert salutary effects in cancer, cardiovascular disease, osteoporosis, and menopausal symptoms [3]. Raw soybeans may contain 1.2- 4.2 mg/g dry weight of isoflavones, and high-protein soy flour may contain up to 1.1-1.4 mg/g dry weight [4]. Given the considerable variation in isoflavones content observed among soy varieties, intensive research is ongoing to identify the most valuable source of these compounds. Given the beneficial effects of soy products on human health, it is important to consume soy products with higher levels of isoflavones [7]. Soybean isoflavones are comprised of three fundamental molecules: genistein, daidzein and glycitein [8,9].
Just like a large proportion of secondary metabolites, isoflavones occur in plants in the form of glycosides [10]. The biological activities of isoflavones have found significant applications in pharmacy, cosmetic therapy, dietetics and nutrition [11]. The structure of phytoestrogens allows them to bind with estrogen receptors (ERs), as flavonoids are similar to 17β-estradiol and estriol. The compounds in question possess an aromatic ring in conjunction with a hydroxyl group, which enables them to exhibit binding affinity to both estrogens [12]. This has resulted in using soy concentrates in hormone replacement therapy within the dietary supplement sector [13]. Furthermore, isoflavones interact with the metabolism of steroid hormones [14].
Isoflavones show mild anti-osteoporosis effects and weak beneficial effects on menopausal syndrome [15]. Furthermore, they have minimal capacity to mitigate the likelihood of developing type 2 diabetes, particularly in postmenopausal women who have not undergone hormone replacement therapy [16]. Phytoestrogens are good at lowering blood levels of total cholesterol, triglycerides, low-density lipoproteins and reducing endogenous cholesterol [17]. Daidzein has properties that reduce blood viscosity, which improves peripheral microcirculation [18]. Biochanin A and genistein stimulate the activity of bone-forming cells (osteoblasts), which promotes the growth and remineralisation of bone tissue cells leading to regeneration [12].
The isoflavones content is also subject to some degree of influence from the processing method employed, with the highest levels observed in whole grains, such as tofu and cooked soybeans, 3-4 mg of isoflavones expressed as aglycones per gram of protein [19]. Isoflavones are susceptible to degradation by heat and often undergo hydrolysis during industrial processing and storage. This is exemplified by the production of soymilk, where the isoflavones are subjected to a series of chemical reactions that alter their chemical structure [6].
As with many research areas, there are established methodologies for extracting isoflavones. Lee et al. [20] and Jeszka-Skowron et al. [21] employed the Design Method of Experiment to successfully optimise the extraction processes. Furthermore, Jeszka-Skowron et al. [21] presented a study on the impact of ethanol concentration and temperature on the efficiency of extracting phenolic compounds from white mulberry. The researchers developed a model that indicated the most optimal process conditions, and they obtained satisfactory results for the isolation of polyphenolic compounds by optimising two factors: extraction temperature and the methanol percentage concentration of the extractant. Lee et al. [20] also demonstrated that the use of the experience planning method and the response plane method is an effective method for process optimisation.
The primary aim of this article is to showcase the use of the most effective three-component mixture for the efficient extraction of essential active metabolites from soybeans, particularly isoflavones. For the experiment, the solvents used were: ethanol, glycol and water in different proportions. To optimise the experiment, the Design of Experiments (DOE) method was employed. The premise was to test the effectiveness of the methodology used to develop plans for mixtures and triangular surfaces for optimising the isoflavone extraction process.
2. Materials and Methods
2.1. Chemicals
In the following studies, isoflavones were extracted from soybean seeds using a mixture of solvents consisting of ethanol, 1,3-propanediol (glycol) and Milli-Q water. All chromatographic reagents and solvents were of analytical grade purchased from Merck, KGaA, Darmstadt, Germany. Selected propanediol as a plant glycol is a completely natural raw material. The substance is an odourless and colourless liquid. It is readily biodegradable and does not present any hazard according to the REACH Regulation 1907/2006, classification (EU1272 / 2008); CAS: 504-63-2 propane-1,3-diol - 99.5% w/w. Propanediol was purchased from Ecospa, Warszawa, Poland. Ultra-pure water was used from the Milli-Q® EQ 7000 system Merck (KGaA, Darmstadt, Germany).
2.2. Plant Materials and Extraction Method
The soybean seeds were purchased from Dary Natury (Grodzisk, Poland). The seeds were subjected to grinding using IKA A11, a basic analytical mill (IKA-Werke, Stufen, Germany). The grounded seeds were defatted by diethyl ether (CHEMPUR, Piekary Sląskie, Poland). Then, samples of 150 mg each were placed in 2.0 ml Eppendorf-type tubes and subjected to extraction. The experimental scheme was developed using the Experiment Planning module available in Statistica ver. 12.0. An extraction technique was used with three solvents (Milli –Q water, propanediol, and ethanol) in 10 different percentages (Table 1, Figure 1).
All samples were extracted in a Sonorex ultrasonic bath at a temperature not exceeding 40 °C, 2 × 15 min. Then, they were centrifuged in an MPW-352R laboratory centrifuge for 10 minutes at 5200 rpm and at a temperature not exceeding 20 °C. After centrifugation, 1 ml of each extract was pipetted and transferred to analytical glass vials. Samples containing 100% glycol, were diluted 1: 1 v/v with deionised water before analysis due to the high viscosity of the solvent.
2.3. HPLC-DAD and UPLC-ESI-TOF-MS Chromatographic Analysis
The extracts compositions were analysed by HPLC-DAD according to the method described previously by Szymczak et al. (2015). HPLC analysis was conducted on a C18 reversed-phase LiChrospher 100 column (Merck, Darmstadt, Germany, 25 cm × 4.0 mm i.d., particle size 5 mm) at 30 °C using a VWR Hitachi Chromaster 600 chromatograph with a detector (DAD) spectrophotometric detector and EZChrom Elite software (Merck). The mobile phase consisted of acetonitrile (A) and water (B) with the addition of 0.025% trifluoroacetic acid, and the flow rate was 1.5 ml/min. The gradient program was as follows: A 15%, B 85% for 0-5 min; A 20%, B 80% for 5-15 min; and A 25%, B 75% for 15-40 min. Data were collected in the wavelength range from 200 to 400 nm, while quantitative analysis was carried out based on the signal collected at 254 nm. The identity of compounds was established by comparing retention times, and UV-Vis spectra (the similarity coefficient calculated by EZChrom Elite software was greater than 0.97).
UPLC-ESI-TOF-MS analysis was performed to confirm the identity of the analytes tested. The separation was performed using a UPLC (Infinity Series II, DAD Agilent 6224 ESI/TOF mass detector) using an RP18 column (10 cm × 2.1 mm i.d., 1.9 μm particle size) at 30 °C and a flow rate of 0.2 ml/min. The mobile phase was a 0.05% solution of formic acid in water (A) and a solution of 0.05% formic acid in acetonitrile. Mass analysis was performed with the following parameters: gas temperature 325 °C, gas flow 5 L/min, pressure 30 psi, voltage 3500 V, fragmentation 170 V and ions were gathered in the range of 100 to 900 m/z.
The Materials and Methods should be described with sufficient details to allow others to replicate and build on the published results. Please note that the publication of your manuscript implicates that you must make all materials, data, computer code, and protocols associated with the publication available to readers. Please disclose at the submission stage any restrictions on the availability of materials or information. New methods and protocols should be described in detail while well-established methods can be briefly described and appropriately cited.
Research manuscripts reporting large datasets that are deposited in a publicly available database should specify where the data have been deposited and provide the relevant accession numbers. If the accession numbers have not yet been obtained at the time of submission, please state that they will be provided during review. They must be provided prior to publication.
Interventionary studies involving animals or humans, and other studies that require ethical approval, must list the authority that provided approval and the corresponding ethical approval code.
In this section, where applicable, authors are required to disclose details of how generative artificial intelligence (GenAI) has been used in this paper (e.g., to generate text, data, or graphics, or to assist in study design, data collection, analysis, or interpretation). The use of GenAI for superficial text editing (e.g., grammar, spelling, punctuation, and formatting) does not need to be declared.
3. Results and Discussion
3.1. Isoflavones Content in Soybeans
It is widely considered that soybeans are one of the best sources of isoflavones and well-digestible protein among legumes [19]. Moreover, Shim et al. [22] reflect that the extraction method employed is of paramount importance to the overall process. Up to the present moment, the following observations have been recorded that, many experiments for the extraction of isoflavones, binary extractants have been used, e.g., aqueous methanol solutions - typically 60-80% [23].
In this study, the investigation focuses on isoflavones determined in soybean seeds after their extraction using three solvents: ethanol, propanediol (glycol) and water, in different proportions. The chromatogram (Figure 2) shows the consecutive peaks: 1. daidzin, 2. glycitin, 3. genistin, 4. malonyldaidzin, 5. malonylglycitin, 6. malonylgenistin.
As demonstrated in the study, the daidzin, genistin, malonylgenistin, malonyldaidzin and malonylglycitin were the predominant isoflavones present in the majority of tested extracts. However, the results of the quantitative analysis (Table 2) suggest that there is considerable variation in the amount of isoflavones present in the samples, depending on which solvent mixture is employed. It has been shown that the use of three-component extractants is the most efficient method for the extraction of all isoflavones.
The worst extraction yield was obtained for 100% ethanol. The daidzin content was 2.5 ± 0.5 mg/g d.m., while the presence of other isoflavones was not detected. When extract were prepared using 100% water, the levels of daidzin, genistein and malonylglycitin were found to be quite low, ranging from 0.039 mg/g d.m. to 0.070 mg/g d.m., but the levels of malonyldaidzin and malonylgenistin exhibited a marked values 0.3945 mg/g d.m. and 0.438 mg/g d.m, respectively. Malonylgenistin and malonyldaidzin riched a slightly significant concentration also in the extract of 100% glycol (0.2295 mg/g d.m, 0.1765 mg/g d.m. respectively), but significantly lower results were obtained for daidzin, malonylglycitin, and genistin (0.1005 mg/g d.m., 0.041 mg/g d.m., 0.985 mg/g d.m., respectively). Extraction of the target analytes was most efficient in binary mixtures of 50/50% water-ethanol. The levels of malonylgenistin were found to be the highest, ranging from 0.759 mg/g d.m. to 0.551 mg/g d.m., 0.2915 mg/g d.m., and 0.20075 mg/g d.m., respectively, for malonyldaidzin, genistin, and daidzin. The lowest content in this binary mixture was malonylglycitin, with a range of 0.101 mg/g d.m. A quite good results of extraction was obtained in the case of binary mixtures of 50/50% glycol-water. Levels of malonyldaidzin were observed to be the most abundant, with a range 1.14 mg/g d.m. The results also exhibited a high range: 1.07 mg/g d.m., 0.7405 mg/g d.m., 0.2655 mg/g d.m., 0.227 mg/g d.m. for malonylglycitin, malonylgenistin, genistin and daidzin, respectively. The binary mixture was found to be the least effective of all the mixtures, with an ethanol-glycol ratio of 50/50%, and a range from 0.135 mg/g d.m. to 0.013 mg/g d.m. for malonylgenistin and malonylglycitin. In contrast, in our study using 100% ethanol, the result for daidzin was 0.0025 mg/g d.m., and the other isoflavones were not detected. Based on the analyses carried out, it has been found that at a concentration of 100% of water, the extraction rates were: for malonylgenitin 0.438 mg/g and for malonyldaidzin 0.3945 mg/g. The obtained values of isoflavones in soybean seeds are comparable to the results of other researchers [24,25]. Lee et al. [23] extracted soybean seeds using pure acetone, dichloromethane and methanol at different concentrations. The researchers found, that both acetone and dichloromethane were not good extractants for isoflavones, while glucosides were better extracted at methanol concentrations of 70% and 100%, while malonylglucosides at a methanol concentration of 50% [23].
The highest efficiency of extraction was obtained using a mixture of three solvents at a ratio of 33/33/33%. The concentrations of isoflavones were 0.3175 mg/g d.m., 0.339, mg/g d.m., 0.712 mg/g d.m., 0.158 mg/g d.m., 0.8025 mg/g d.m. for daidzein, genistein, malonyldaidzin, malonylglycitin and malonylgenistin, respectively.
The use of suitable extractants in optimal proportions was essential for the consideration of improvements the extraction efficiency of isoflavones from soybean seeds. This conclusion aligns with findings from Mai et al. [26], who also demonstrated that varying proportions of ethanol, ethylene glycol, and water significantly influenced the extraction of flavonoids from Euonymus alatus. The present study investigates the extraction of plant glycol, with a view to ascertaining its optimal extraction method and potential benefits Zhao et al. [27]. Compared to propylene glycol, plant glycol yields better results in extracting plant substances and also improves epidermal penetration when incorporated into formulations like hydrogels.
3.3. Regression Models and Response Surfaces
When assessing the effect of individual factors for the daidzin extraction model, the linear factor ethanol (A) was found to be non-significant (p>0.05), and the same was true for the BC(B-C) component (Table 3), which was not removed due to deterioration in model fit parameters (Table 4). In the model fit for daidzin and the analysis of variance of the variance explained by the model form and the lack of fit, the result for the model was highly significant p=0.0000. In contrast, the model variance accounted for by the lack of fit was insignificant (p=0.07034). In evaluating the impact of individual factors for the daidzin extraction model, it should be noted that an interesting result was the linear factor (A), which was not significant, as evidenced by a p-value above 0.05 (Table 3). This shows that the extraction closely depends on the relationship of the individual components to each other. The results indicate that the model employed exhibited a satisfactory level of fit. This is confirmed by the determination coefficients of 0.98, where the model created explains 98% of the variation in the level of daidzin extraction (Table 4).
The surface fit of the soybean seed extraction level was expressed in the form of a triangular coordinate system (Figure 3) to determine the effect of all possible combinations of mixtures. In the plans for mixtures, the input factors are the components of the mixture, and for this reason, their values are not mutually independent. In the case of three components, this means that the plan layouts can be located in space only on a plane having the shape of a triangle (Figure 3). The regression model developed for the effect of the composition of the extraction mixture on the amount of genistin indicates that, as with daidzin, the linear component (A) - ethanol - is insignificant. In addition, other quadratic and cubic components were removed from the model, improving the model fit (Table 3 and 4). The significance of the developed regression model was found in the model fit for genistin and the analysis of variance explained by the model form (Table 4). In contrast, the variance determined by the lack of fit remains statistically significant (p<0.05). The model’s R2 fit was 97% (Table 4). In the case of genistin, despite attempts to select the most suitable components of the model, the lack of fit is a significant component. Ultimately, it can distort and limit the model’s predictive capabilities, which remains relevant with high fit rates. To determine the effect of all possible combinations of mixtures, the surface fit of the level of genistin extraction from seeds with different mixtures. When assessing the effect of individual factors for the malonyldaidzin extraction model, the effect of the linear factor (A)-ethanol was insignificant (Table 3, Figure 3). As far as the model fit is concerned, the p-value obtained was 0.00000. This is below the p<0.05 value and indicates a well-chosen model for malonyldaidzine. It is confirmed by the coefficient of determination with a high value of R2 =99% to determine the effect of all possible combinations of mixtures, the fitting of malonyldaidzin level plots with different mixtures (Figure 3). When assessing the influence of individual factors for the malonylglycitin extraction model, it was found that, as with other isoflavones, the linear factor (A) was a non-significant component (Table 3, Figure 3) In the model fit for malonylglycitin and the variance analysis of the variation explained by the model form, it was found that the model was a component, while the variance determined by the lack of fit was insignificant the model fit R2 was 93% (Table 4). To determine the effect of all possible combinations of mixtures, the fit of the malonylglycitin level plots with different mixtures is shown in Figure 3.
An analysis of the effect evaluation of the individual factors for the malonylogenistin extraction model indicates that the linear factor (A) - ethanol was the non-significant component (Table 3, Figure 3). An assessment of the variation in variability explained by the model form, and the lack of fit result that both components are significant. The model fit R2 was 99% (Table 3). To determine the effect of all possible combinations of mixtures, the fit of the seed malonylogenistin extraction level plots with different mixtures is shown in Figure 3.
The use of experimental planning techniques, such as the Design of Experiments (DOE) and Response Surface Methodology (RSM), has proven to be an effective approach for optimizing extraction processes (Lee et al., 2006). For instance, Jeszka-Skowron et al. [21] applied the DOE method to optimize the extraction of phenolic compounds from white mulberry, revealing the importance of two factors - ethanol concentration and temperature on extraction efficiency. In the present study, the optimal proportions for a three-component extractant mixture (ethanol, glycol, and water) were ascertained to be those in which the quantities are more equal. By applying the DOE method for ternary mixtures and using utility profiles, an extraction model was developed with optimized conditions: ethanol 32.8%, water 39.2%, and glycol 27.8% (Figure 4). The method of mixture designs and triangular response surfaces was shown to be highly effective for determining the optimal extractant mixture for isoflavones extraction from soybean seeds.
Author Contributions
Conceptualization, S.D. and M.O.; methodology, S.D.; software, S.D.; investigation, A.B.; resources, S.D.; data curation, A.B. and S.D.; writing—original draft preparation, A.B. and M.O.; writing—review and editing, M.O.; visualization, A.B., S.D. and M.O.; supervision, S.D. and M.O. All authors have read and agreed to the published version of the manuscript.
Conflicts of Interest
The authors declare no conflicts of interest
References
- Staniak, M., Stępień, A., Czopek, K. (2018), Response of common soybean (Glycine max (L.) Merr.) to selected abiotic stresses. Studies and reports IUNG-PIB, 57(11): 63-74. [CrossRef]
- Volkova, E., & Smolyaninova, N. (2024). Analysis of world trends in soybean production. In BIO Web of Conferences (Vol. 141, p. 01026). EDP Sciences. [CrossRef]
- Ademiluyi, A.O., Oboh, G., Boligon, A.A, Athayde, M.L., (2014), Effect of fermented soybean condiment supplemented diet on α-amylase and α-glucosidase activities in Streptozotocin-induced diabetic rats. J. Funct. Foods, 9, pp. 1-9. [CrossRef]
- Silva, L.R., Pereira, M.J., Azevedo, J., Gonçalves, R.F., Valentão, P., Guedes de Pinho, P., Andrade, P.B., (2013), Glycine max (L.) Merr., Vigna radiata L. and Medicago sativa L. sprouts: a natural source of bioactive compounds. Food Res. Int. 50, 167–175. [CrossRef]
- Alu’datt, M.H., Rababah, T., Ereifej, K., Alli, I., (2013), Distribution, antioxidant, and characterization of phenolic compounds in soybeans, flaxseed and olives. Food Chem., 139 pp. 93-99. [CrossRef]
- Vogiatzoglou A., Mulligan A. A., Lentjes M. A. H., Luben R. N., Spencer J. P. E., Schroeter H., Khaw K., Kuhnle G. G. C., (2015), Flavonoid Intake in European Adults (18 to 64 Years), PLOS ONE, (10): 1-10. [CrossRef]
- Lee, J.H., Hwang, S.R., Lee, Y.H., Kim, K., Cho, K.M., Lee, Y.B., (2015), Changes occurring in compositions and antioxidant properties of healthy soybean seeds [Glycine max (L.) Merr.] and soybean seeds diseased by Phomopsis longicolla and Cercospora kikuchii fungal pathogens. Food Chem., 185 pp. 205-211. [CrossRef]
- Prasain, JK., Carlson, SH., Wyss, JM., (2010) Flavonoids and Age-Related Disease: Risk, benefits and critical windows ISSN: 0378-5122, Vol: 66, Issue: 2, Page: 163-171. [CrossRef]
- Garrett R. D., Rueda X., Lambin E. F. (2014), Globalization’s unexpected impact on soybean production in South America: linkages between preferences for non-genetically modified crops, eco-certifications, and land use. Environ. Res. Lett. 8: 1-11. [CrossRef]
- Zhang, J., Ge, Y., Han, F., Li, B., Yan, S., Sun, J., Wang, L., (2014), Isoflavone content of soybean cultivars from maturity group 0 to VI grown in Northern and Southern China. J. Am. Oil Chem. Soc., 91 pp. 1019-1028. [CrossRef]
- Kumar S., Pandey A. K., (2013), Chemistry and Biological Activities of Flavonoids: An Overview, Hindawi Publishing Corporation, Sci. World J. Volume 2013. [CrossRef]
- Busch Ch., Burkard M., Leischner Ch., Lauer U. M., Frank J. Venturelli S., (2015), Epigenetic activities of flavonoids in the prevention and treatment of cancer, BioMed Central. [CrossRef]
- Sugiyama, A., Yamazaki, Y., Yamashita, K., Takahashi, S., Nakayama, T., Yazaki, K., (2016), Developmental and nutritional regulation of isoflavone secretion from soybean Roots. Biosci. Biotechnol. Biochem., 80 pp. 89-94. [CrossRef]
- Hai Liu R., (2013), Dietary Bioactive Compounds and Their Health Implications. J. Food Sci., Vol. (78, S1): A18-A23. [CrossRef]
- Batra P., Sharma A. K., (2013), Anti-cancer potential of flavonoids: recent trends and future Perspectives. Biotech, (3): 439-446. [CrossRef]
- Lee, M.J., Chung, M.J., Kim, H., Jung, M.Y., (2015), High resolution LC-ESI-TOF-mass spectrometry method for fast separation, identification, and quantification of 12 isoflavones in soybeans and soybean products. Food Chem., 176, pp. 254-262. [CrossRef]
- Alam M. A., Subhan N., Rahman M. M., Uddin S. J., Reza H. M., Sarker S. D., (2014), Effect of Citrus Flavonoids, Naringin and Naringenin, on Metabolic Syndrome and Their Mechanisms of Action, American Society for Nutrition, Adv. Nutr. (5):404,413. [CrossRef]
- Britz, S.J., Schomburg, C.J., Kenworthy, W.J., (2011), Isoflavones in seeds of field-grown soybean: variation among genetic lines and environmental effects, J. Am. Oil Chem. Soc., 88 pp. 827-832. [CrossRef]
- Jiao, Z., Si, X., Zhang, Z., Li, G., Cai, Z., (2012), Compositional study of different soybean (Glycine max L.) varieties by 1H NMR spectroscopy, chromatographic and spectrometric techniques. Food Chem. 135, 285–291. [CrossRef]
- Lee W.C., Yusof S., Hamid N.S.A., Baharin B.S. (2006), Optimizing conditions for hot water extraction of banana juice using response surface methodology (RSM). J. Food Eng.,75 (4), 473-479. [CrossRef]
- Jeszka-Skowron M., Flaczyk E., Kobus-Cisowska J., Kośmider A., Górecka D. (2014) Optimizing process of extracting phenolic compounds having antiradical activity from white mulberry leaves by means of response surface methodology (RSM). Food Science Technology Quality. [CrossRef]
- Shim, Y.S., Yoon, W.J., Hwang, J.B., Park, H.J., Seo, H.J., Ha, J., (2015), Rapid method for the determination of 14 isoflavones in food using UHPLC coupled to photo diode array detection, Food Chem., 187 pp. 391-397. [CrossRef]
- Lee Y.H., Kim B., Hwang S.R., Kim K., Lee J.H., (2018), Rapid characterization of metabolites in soybean using ultra high performance liquid chromatography coupled with electrospray ionization quadrupole time-of-flight mass spectrometry (UPLC-ESI-Q-TOFMS/MS) and screening for α-glucosidase inhibitory and antioxidant properties through different solvent systems. J Food Drug Anal. ;26(1):277-291. [CrossRef]
- Lee, J.H., Cho, K.M., (2012), Changes occurring in compositional components of black soybeans maintained at room temperature for different storage periods. Food Chem., 131, pp. 161-169. [CrossRef]
- Szymczak G., Wójciak-Kosior M., Sowa I., Zapała K., Strzemski M., Kocjan R., (2017), Evaluation of isoflavone content and antioxidant activity of selected soy taxa. J. Food Compos. Anal. 57, 40–4. [CrossRef]
- Mai, X., Liu, Y., Tang, X., Wang, L., Lin, Y., Zeng, H., Luo, L., Fan, H., & Li, P. (2020), Sequential extraction and enrichment of flavonoids from Euonymus alatus by ultrasonicassisted polyethylene glycol-based extraction coupled to temperature-induced cloud point extraction. Ultrasonics sonochemistry 66, 105073. [CrossRef]
- Zhao, Y., Zhao, D., He, J., Ma, K., Zhu, J., Liu, J.,... & Li, T. (2025), Protective fractionation of highly uncondensed lignin with high purity and high yield: new insights into propanediol-blocked lignin condensation. Green Chemistry. [CrossRef]
Figure 1.
Scheme of the percentage compositions of the mixtures of three solvents (water, ethanol, propanediol).
Figure 1.
Scheme of the percentage compositions of the mixtures of three solvents (water, ethanol, propanediol).
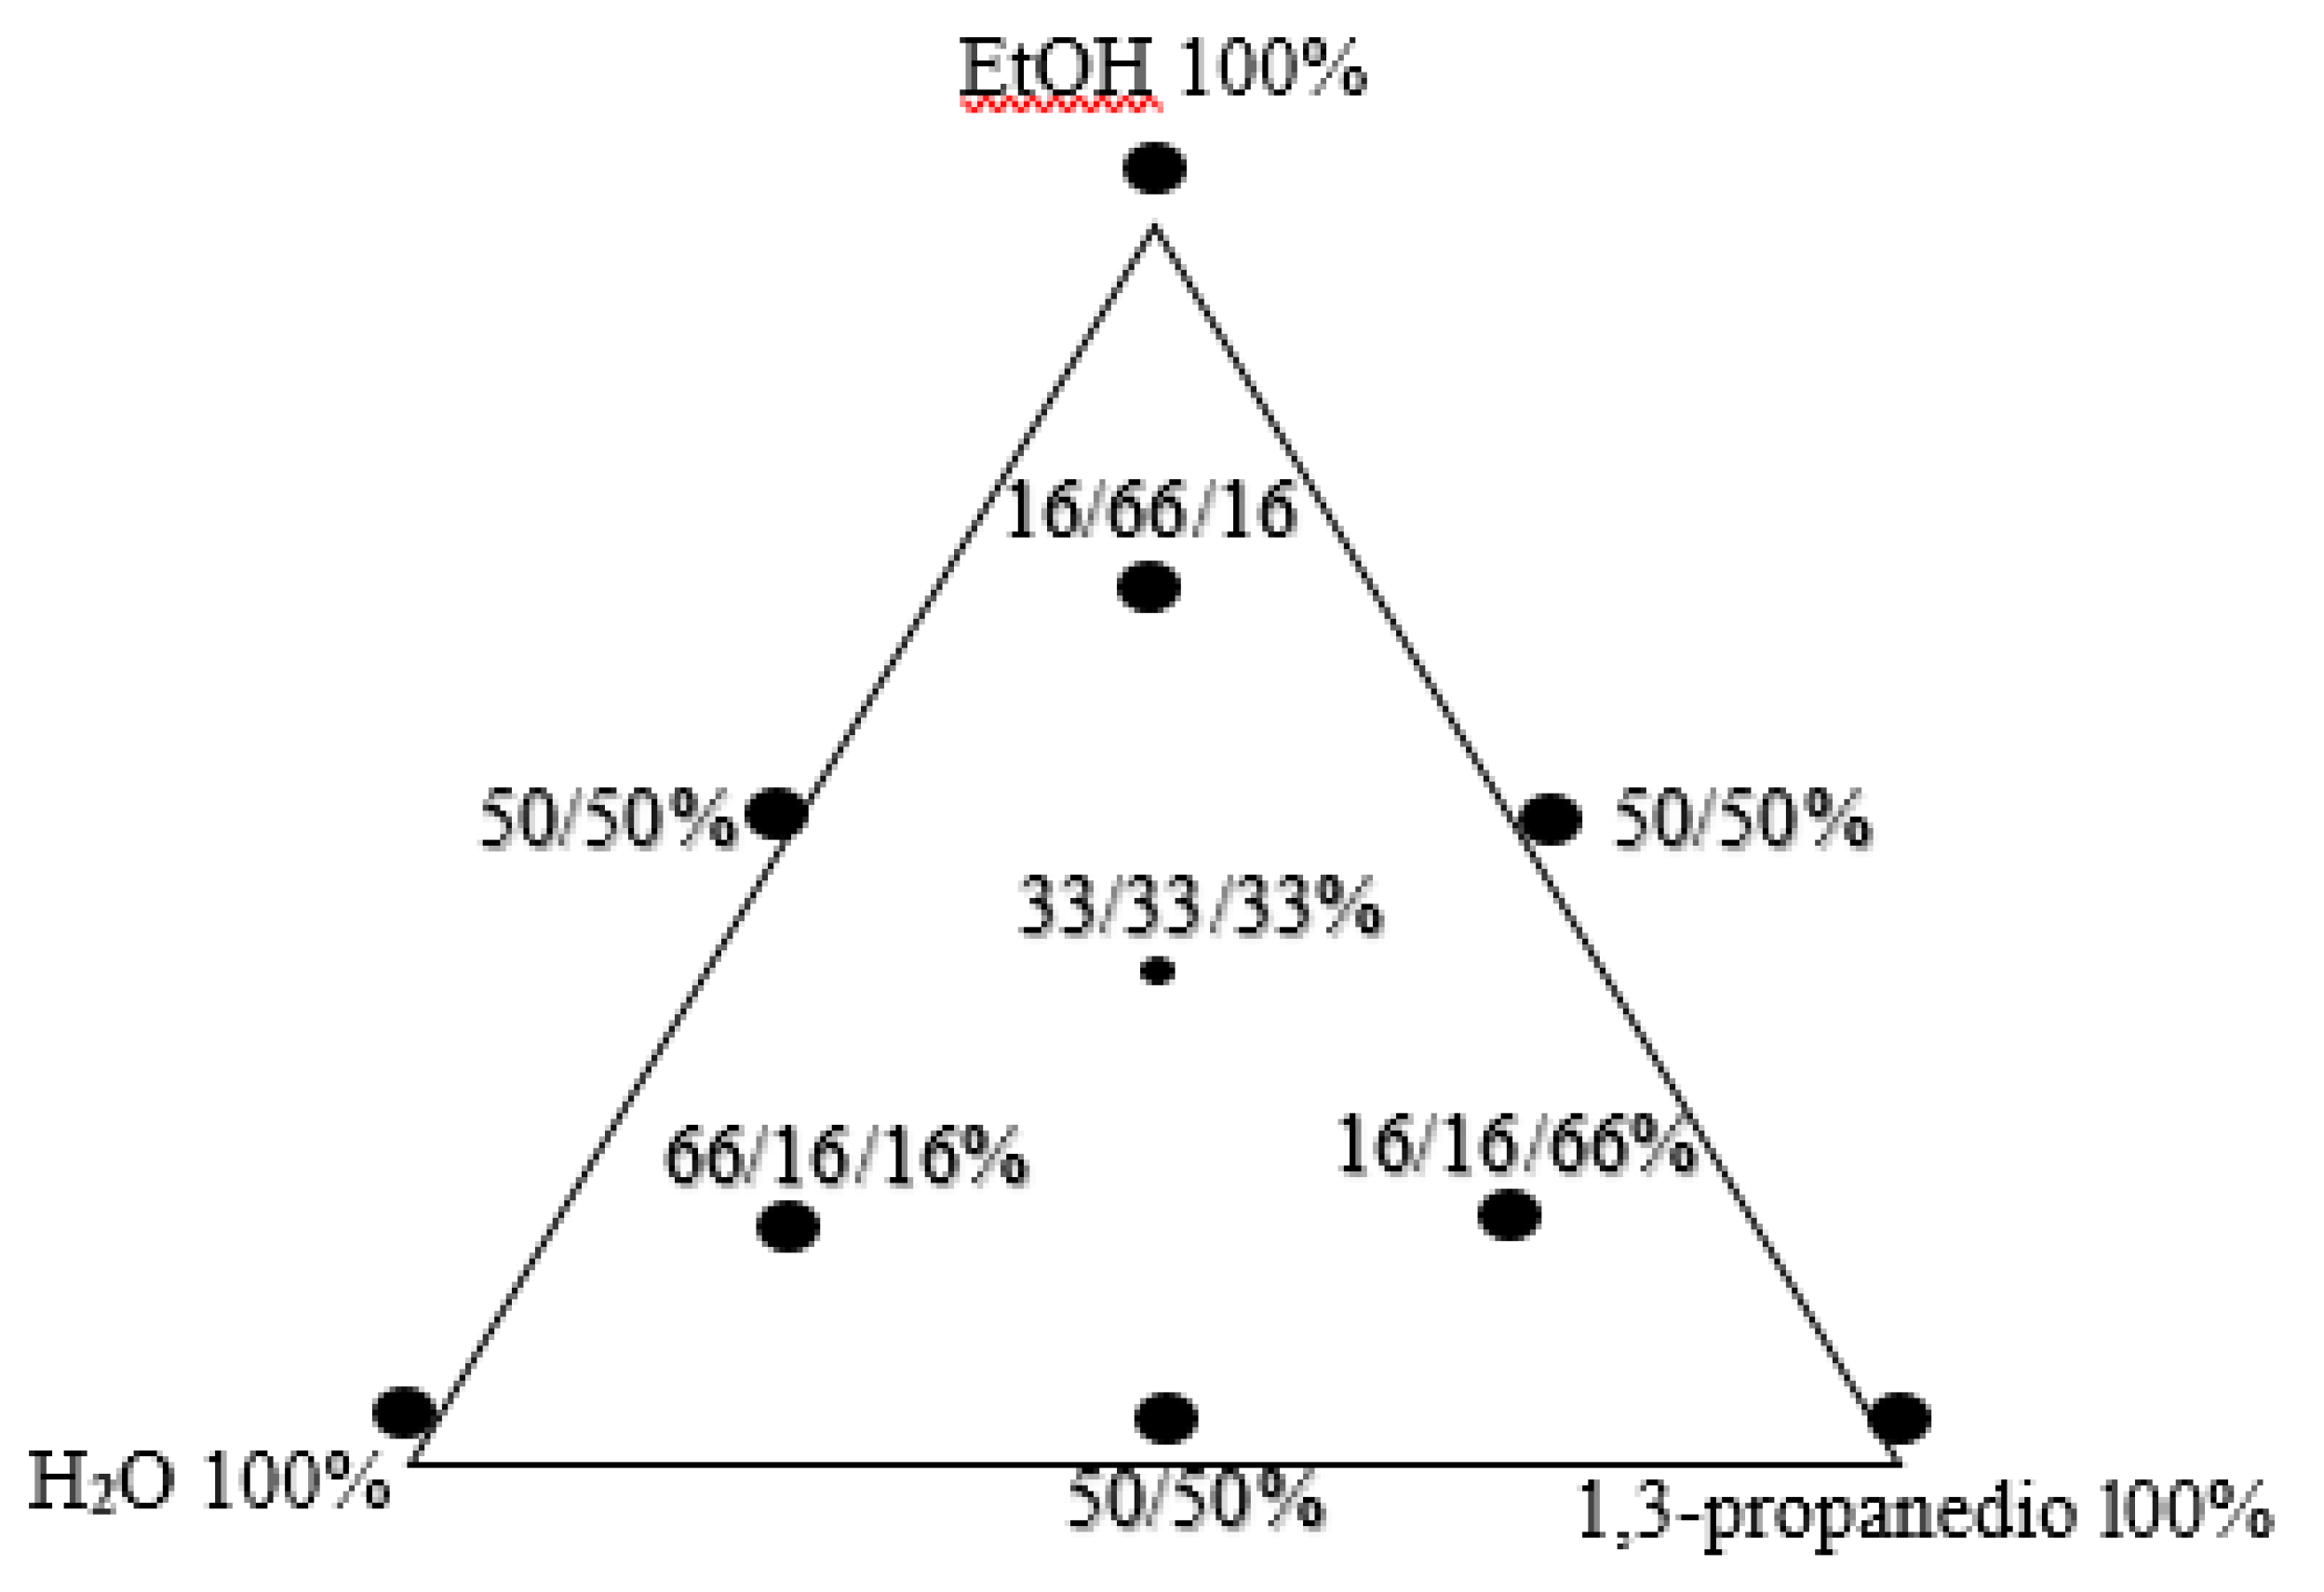
Figure 2.
A representative HPLC-DAD chromatogram (λ=254 nm) of the extract from the soybean seeds. Peaks: 1-Daidzin 2-Glycitin, 3-Genistin, 4-Malonyldaidzin, 5-Malonylglycitin, 6- Malonylgenistin.
Figure 2.
A representative HPLC-DAD chromatogram (λ=254 nm) of the extract from the soybean seeds. Peaks: 1-Daidzin 2-Glycitin, 3-Genistin, 4-Malonyldaidzin, 5-Malonylglycitin, 6- Malonylgenistin.
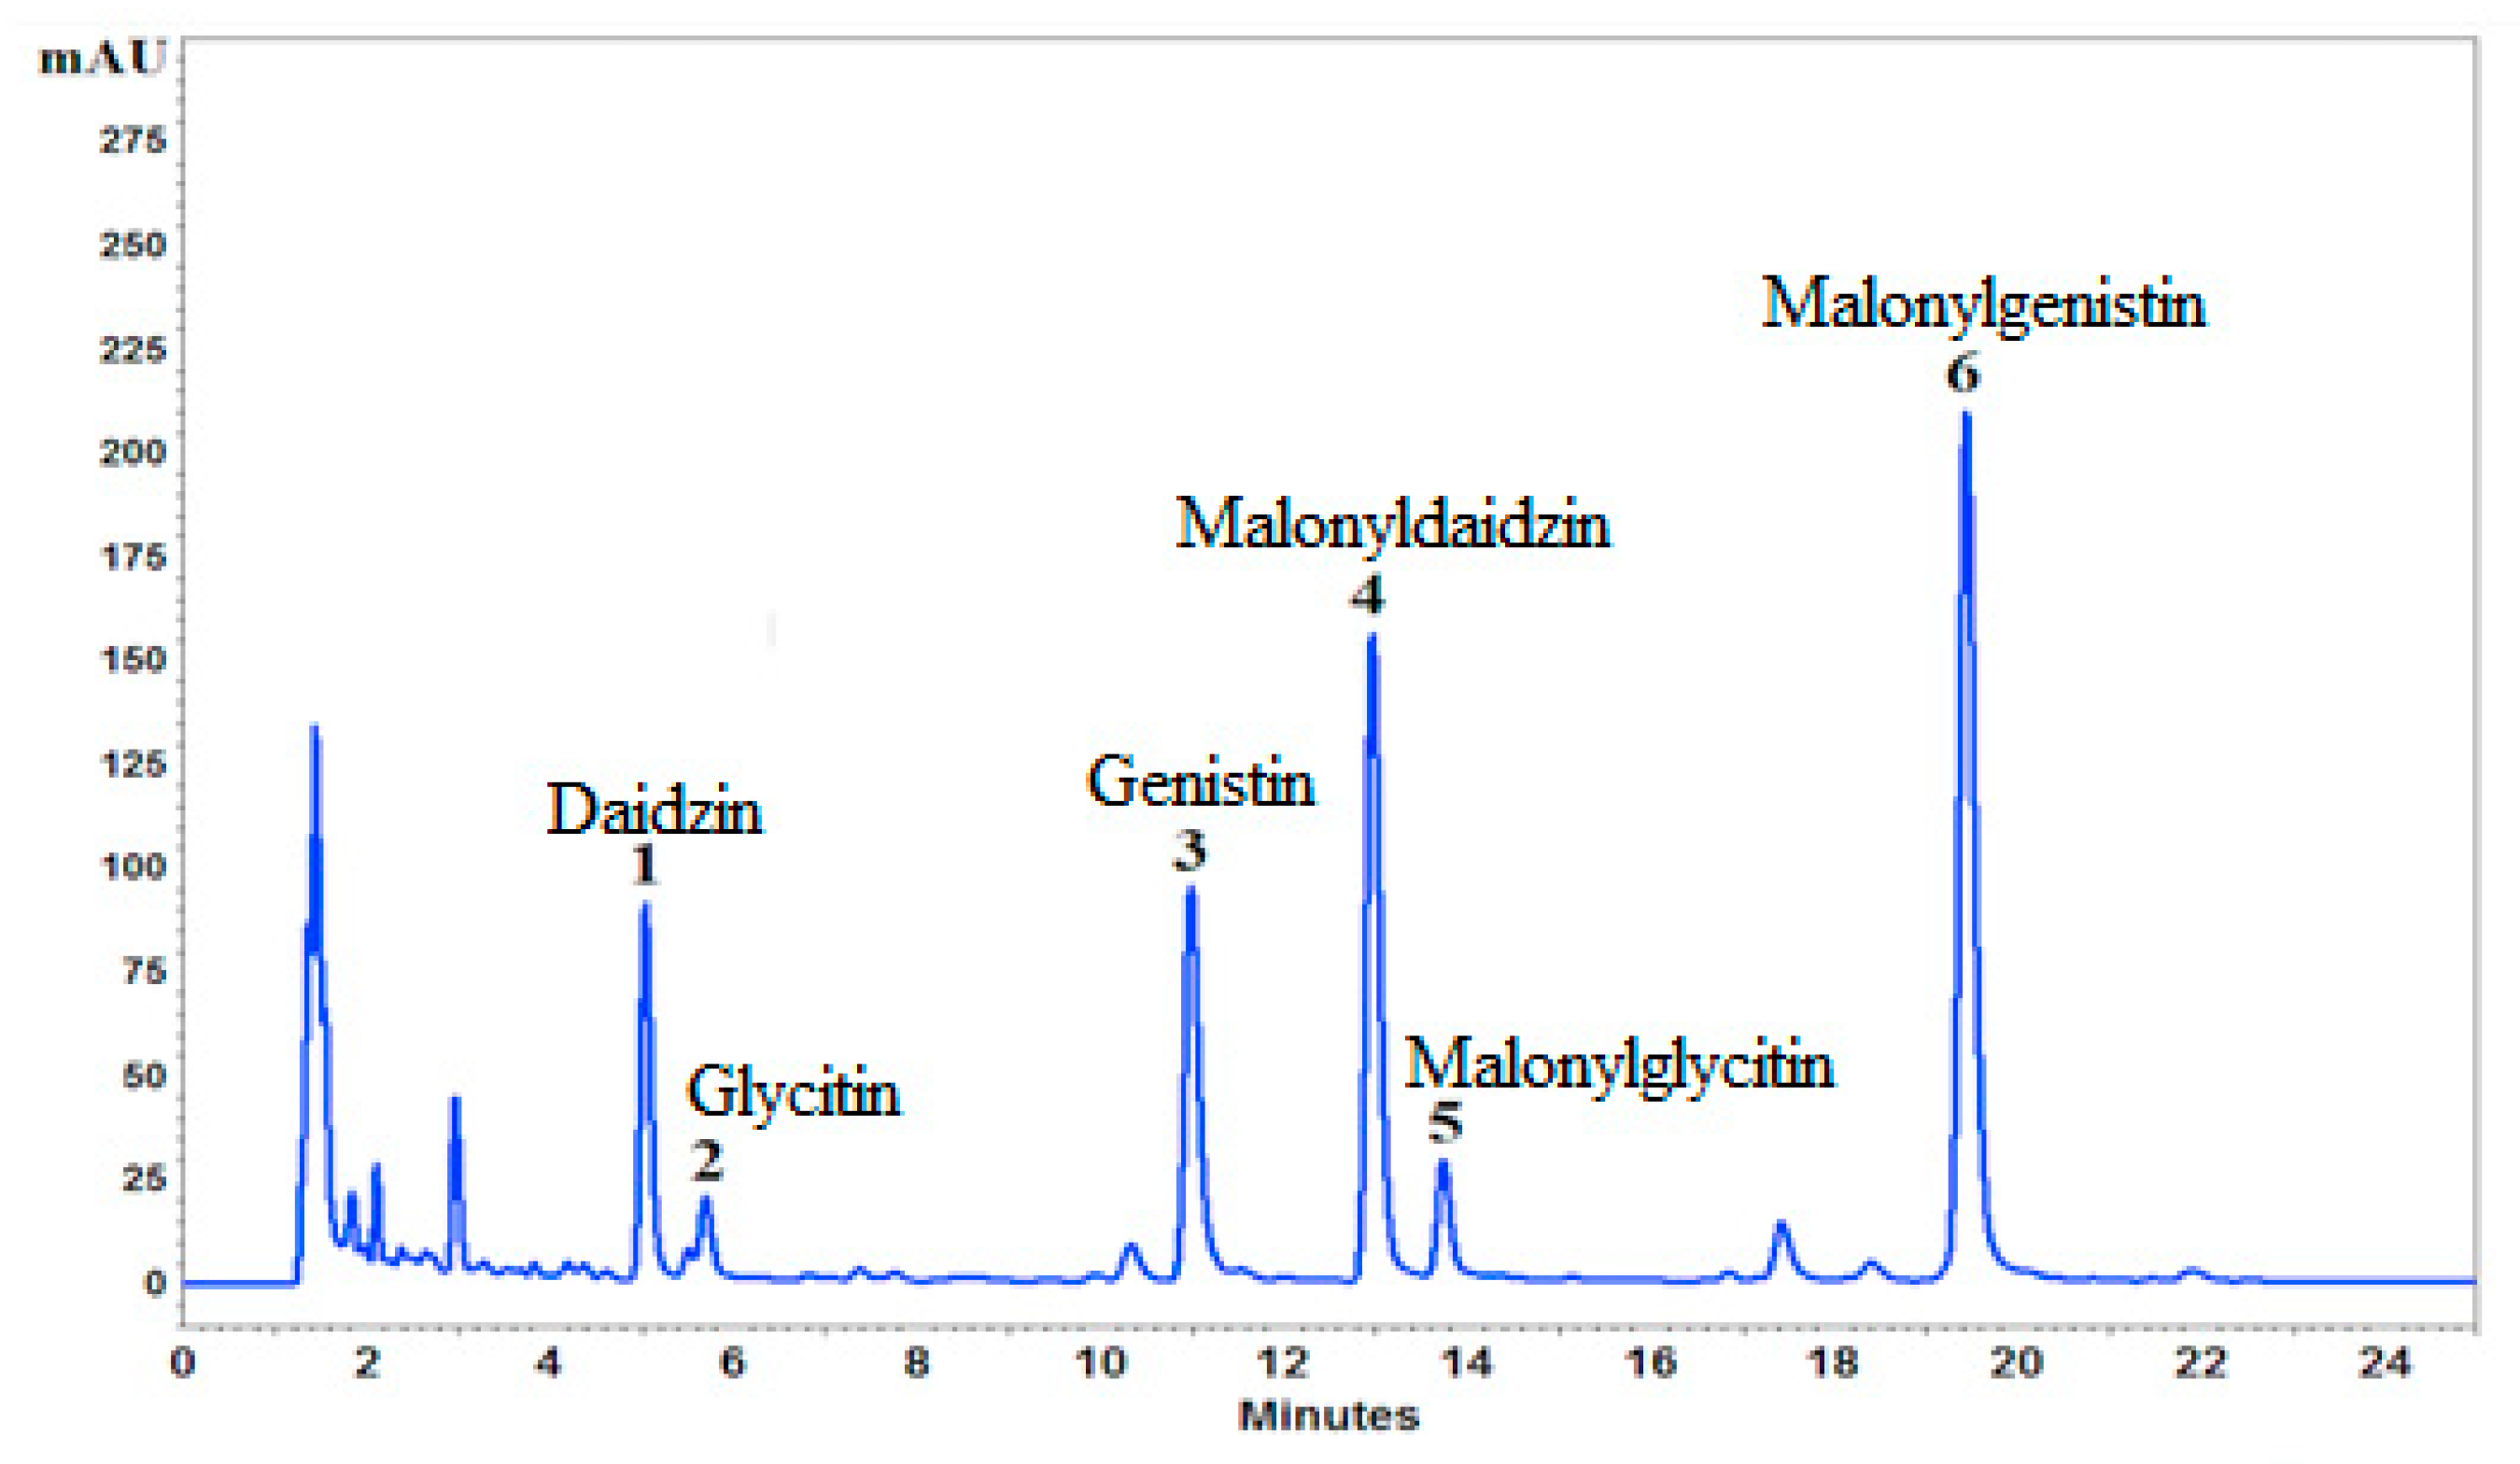
Figure 3.
The response contour plot of the impact of the solvent composition on the extraction rate of: daidzin, genistin, malonyldaidzin, malonylglycitin, and malonylgenistin.
Figure 3.
The response contour plot of the impact of the solvent composition on the extraction rate of: daidzin, genistin, malonyldaidzin, malonylglycitin, and malonylgenistin.
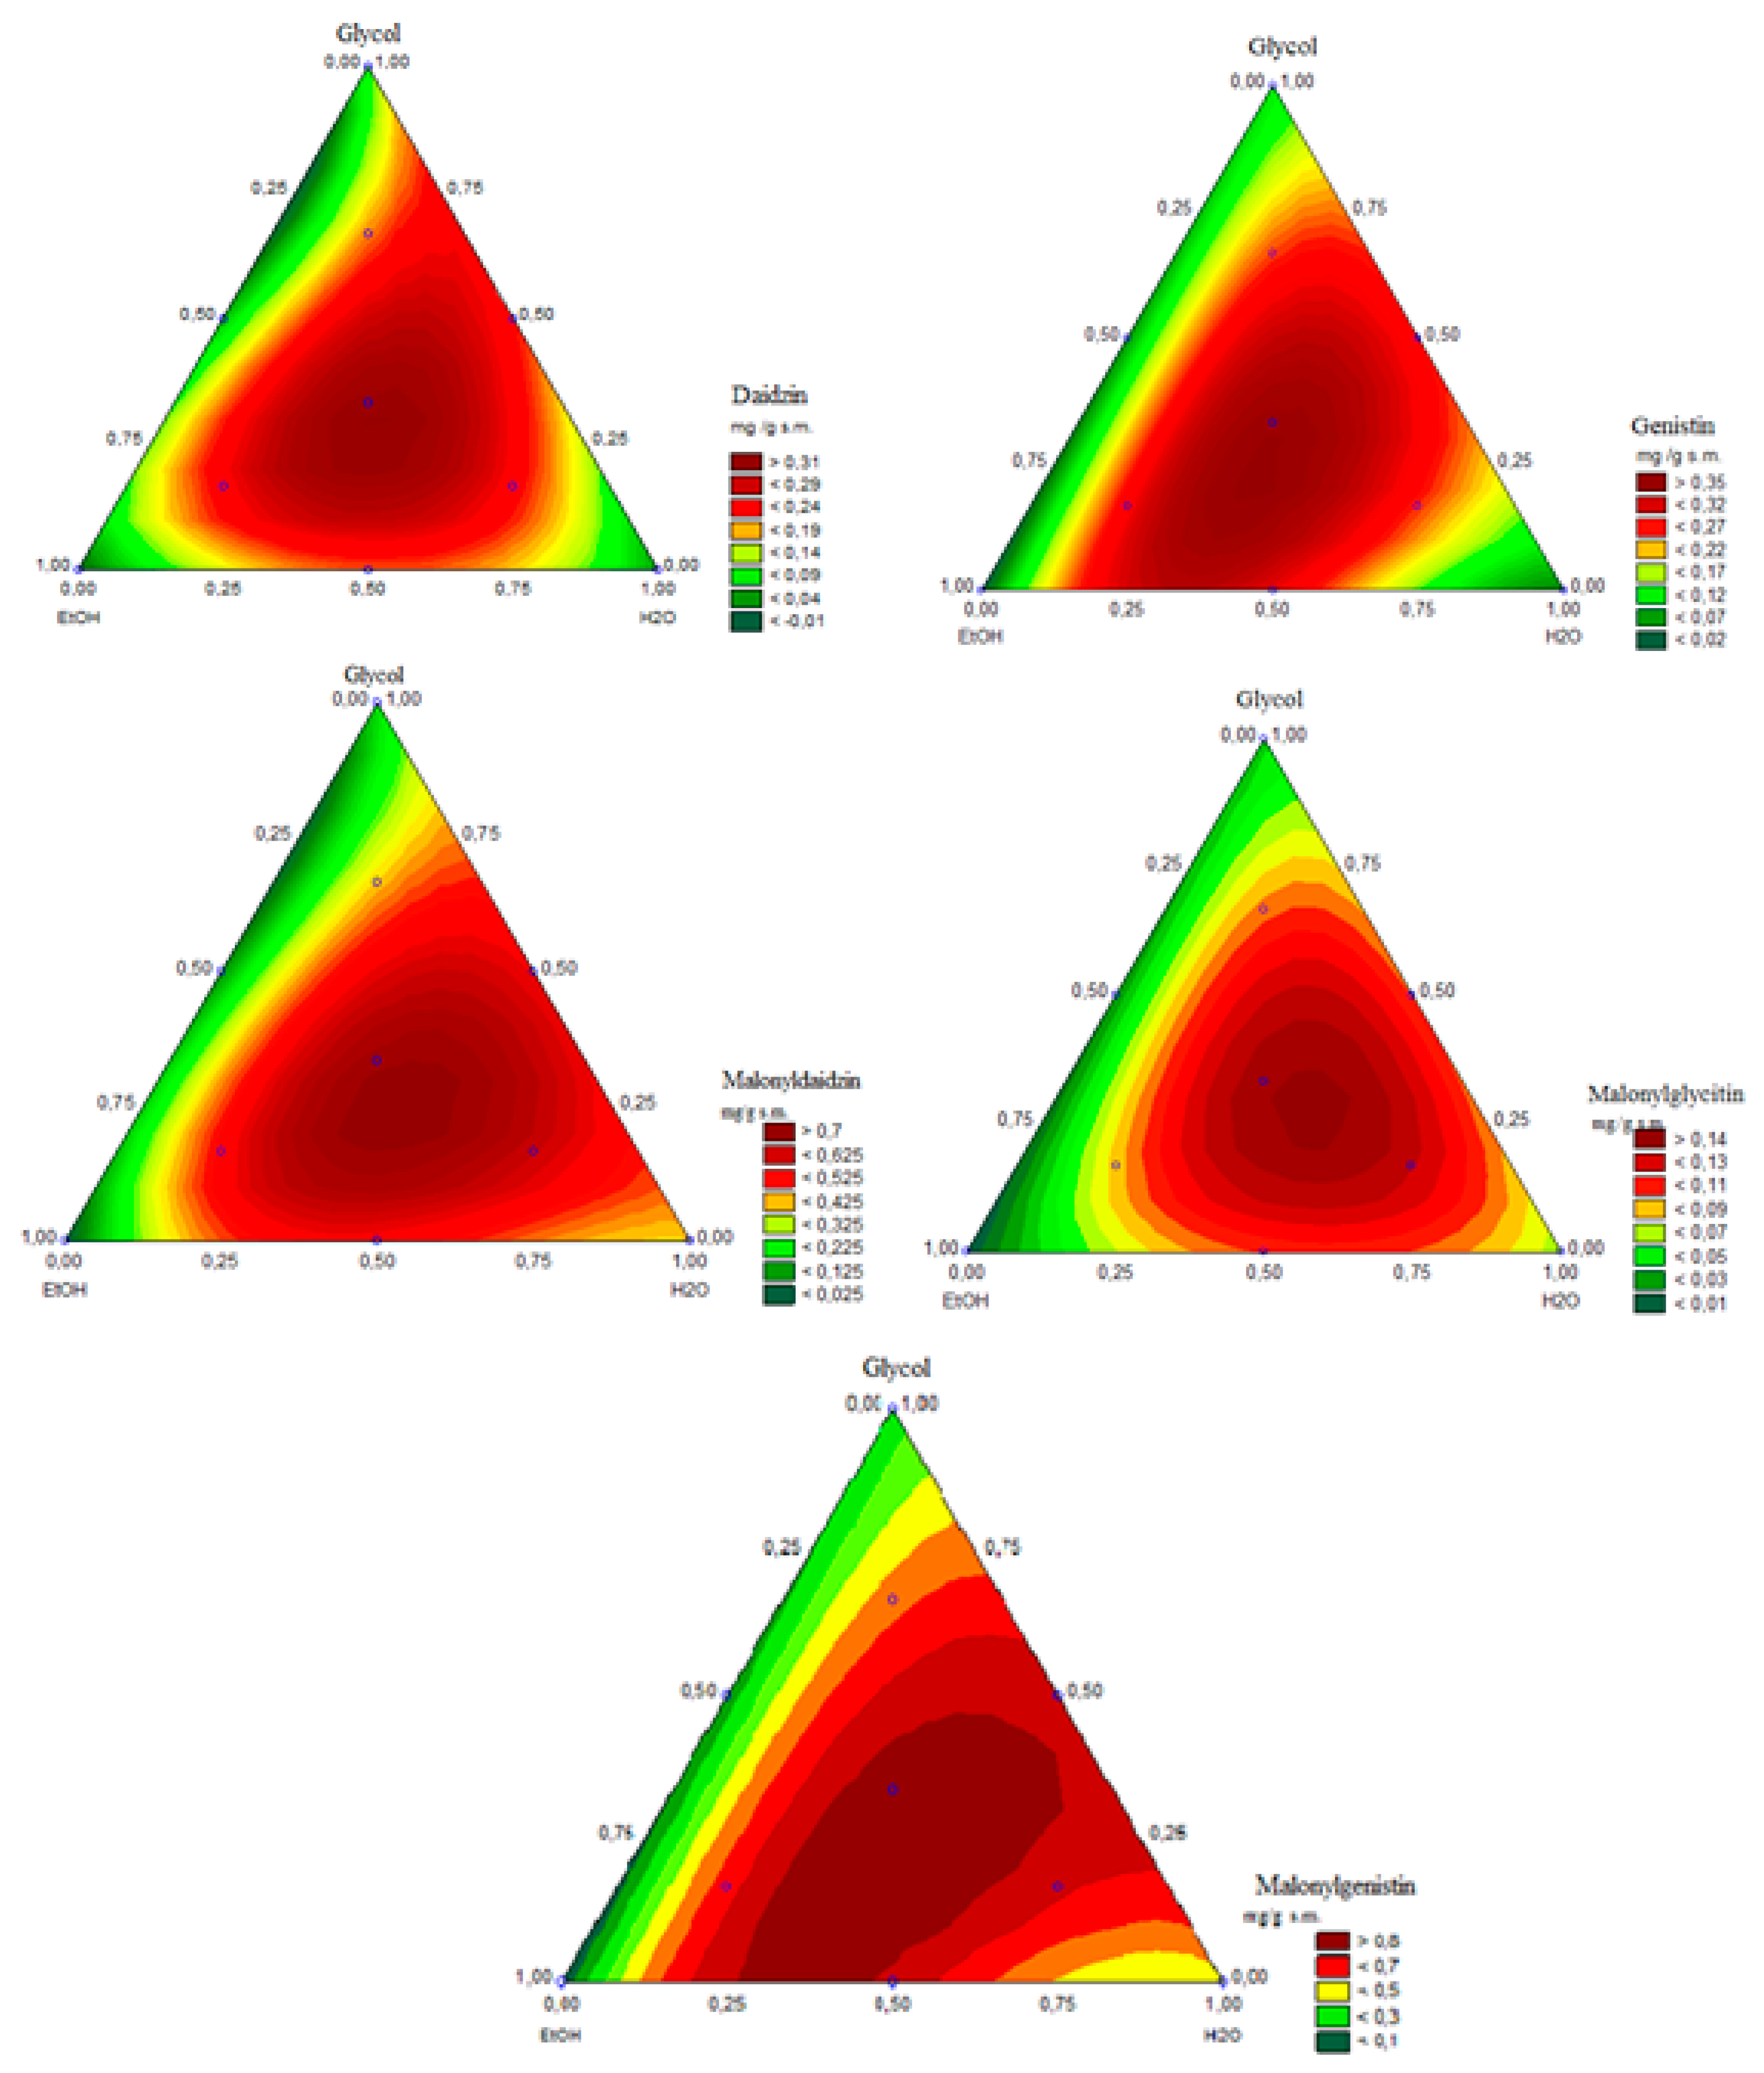
Figure 4.
Profiles of approximated values and desirability of the composition of three solvents of extraction efficiency of daidzin, genistin, malonyldaidzin, malonylglycitin and malonylgenistin.
Figure 4.
Profiles of approximated values and desirability of the composition of three solvents of extraction efficiency of daidzin, genistin, malonyldaidzin, malonylglycitin and malonylgenistin.
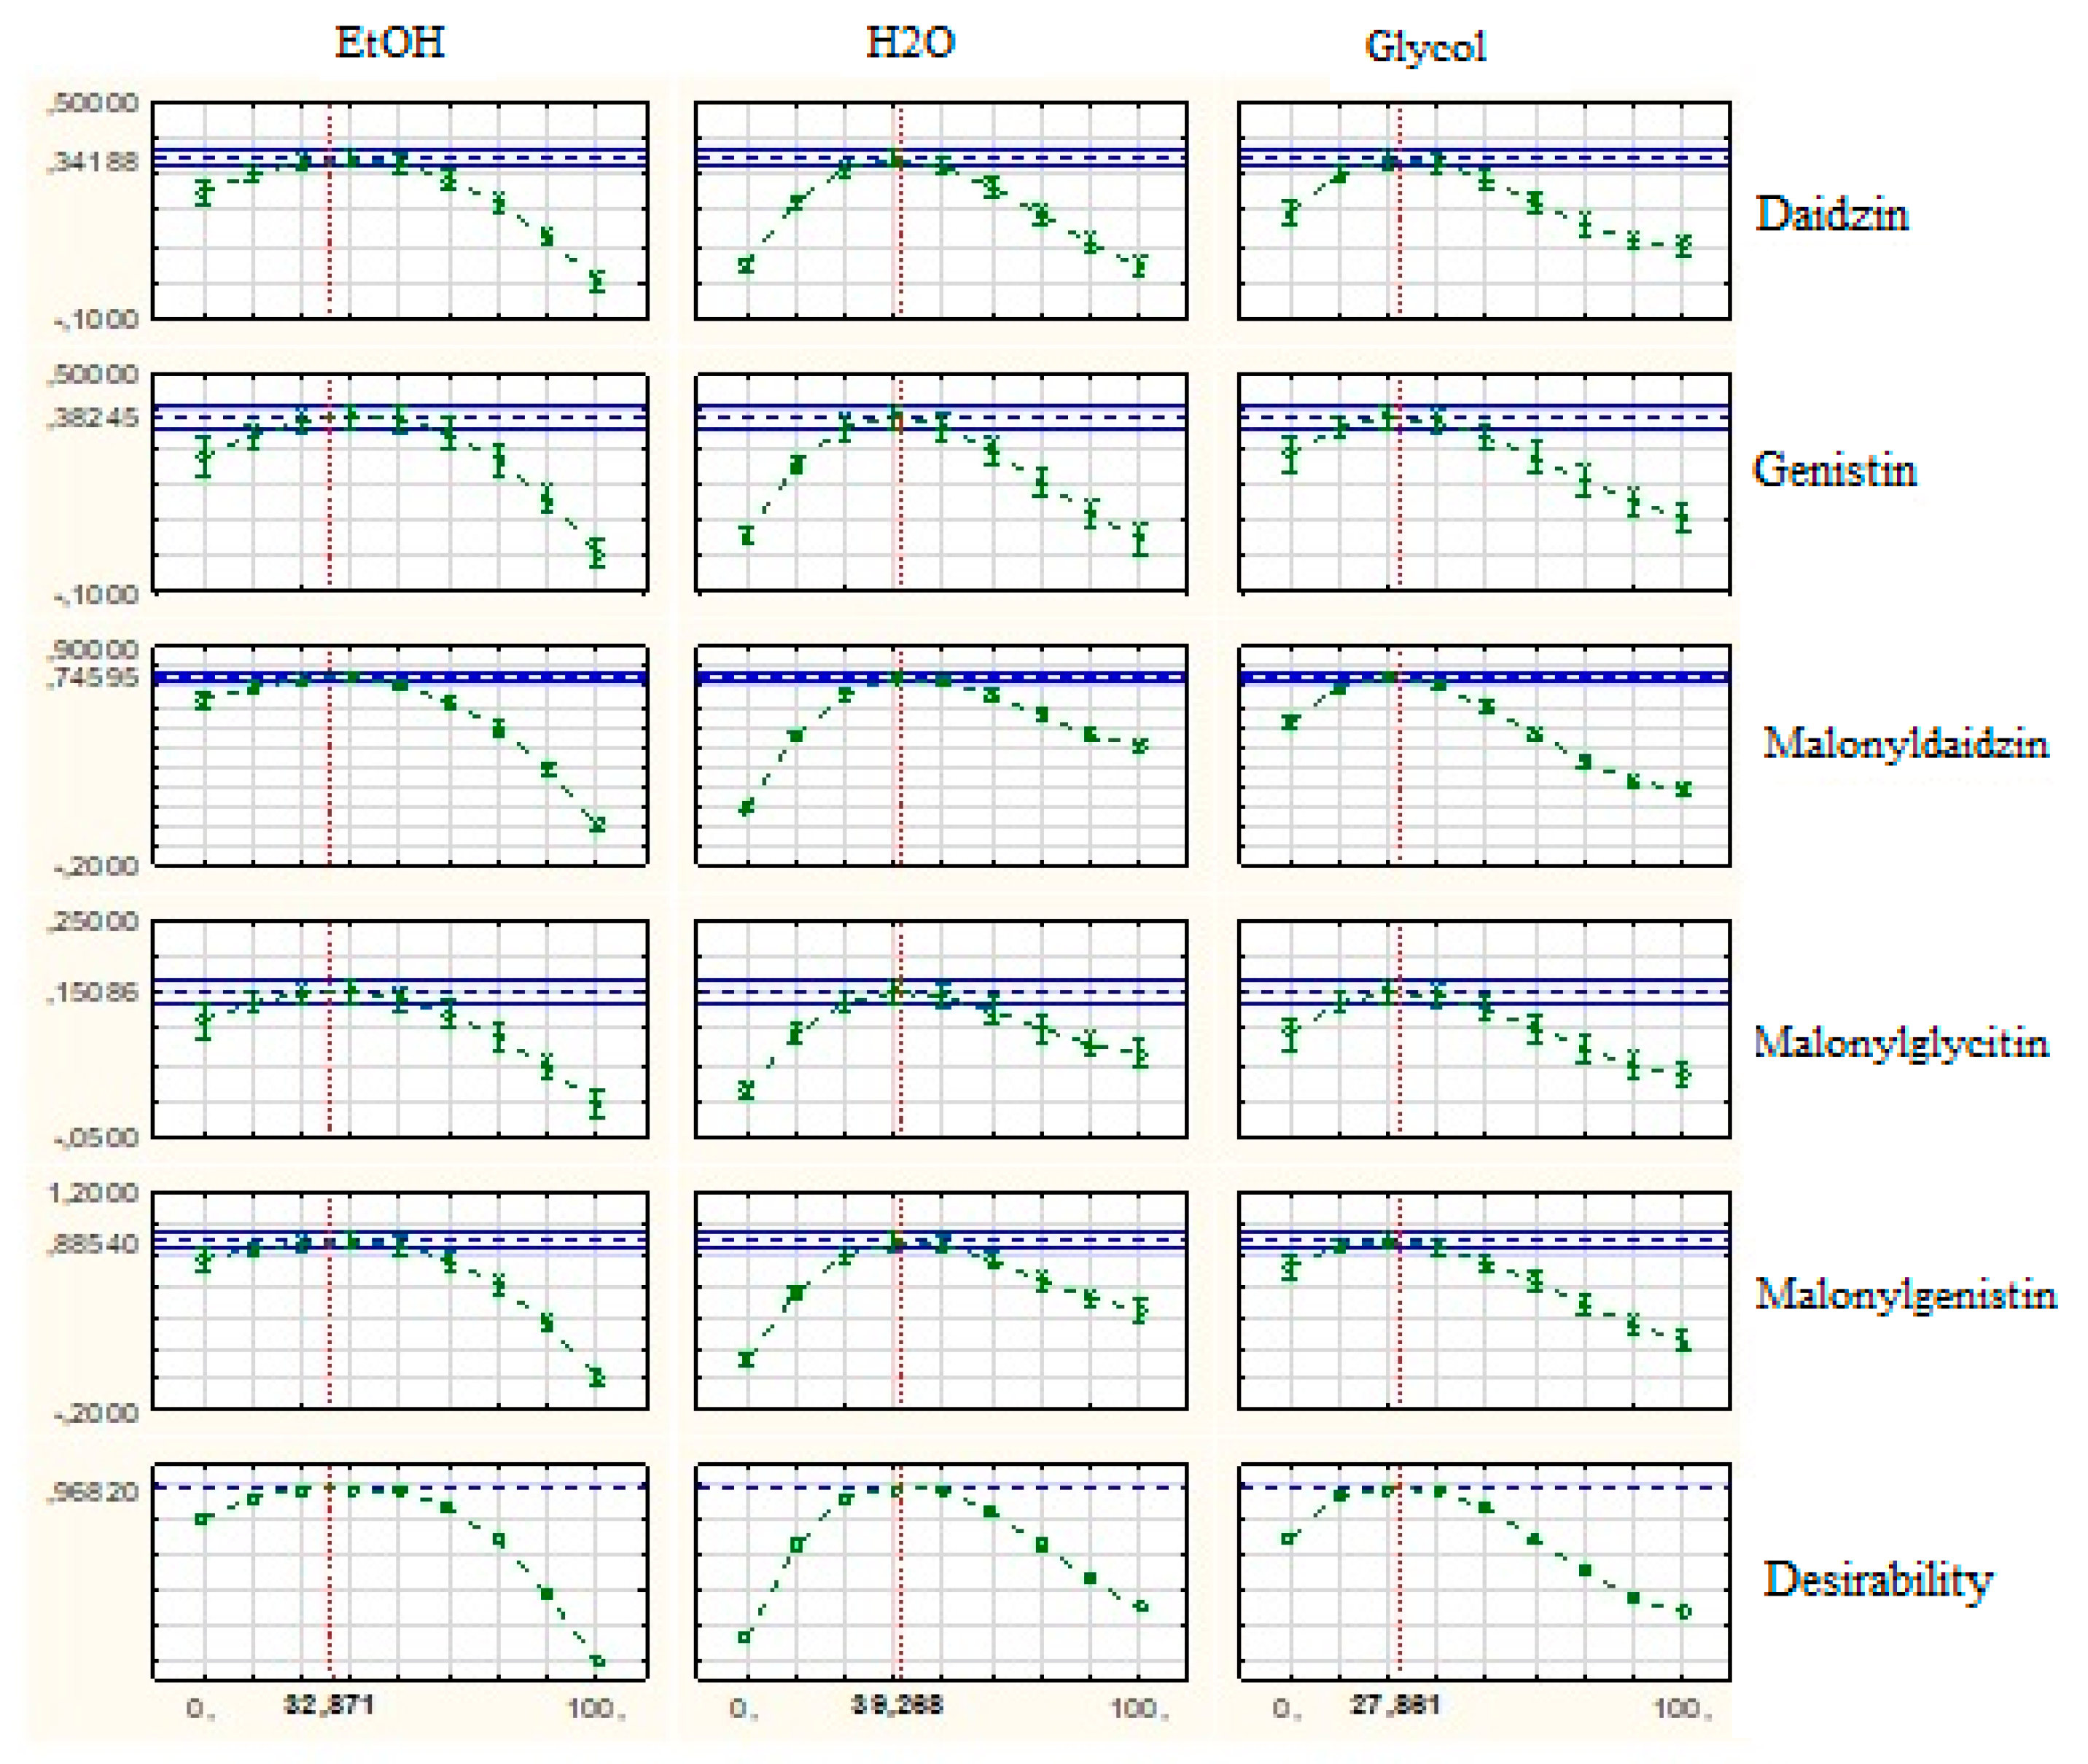

Table 1.
The percentage composition of solvents mixtures used for extraction of isoflavones.
| No. | EtOH % |
Glycol % |
H2O % |
|---|---|---|---|
| 1. | 100 | 0 | 0 |
| 2. | 0 | 0 | 100 |
| 3. | 0 | 100 | 0 |
| 4. | 50 | 0 | 50 |
| 5. | 50 | 50 | 0 |
| 6. | 0 | 50 | 50 |
| 7. | 33.3 | 33.3 | 33.3 |
| 8. | 66.7 | 16.7 | 16.7 |
| 9. | 16.7 | 16.7 | 66.7 |
| 10. | 16.7 | 66.7 | 16.7 |
Table 2.
The content of isoflavones and the values of investigative response.
| Type of solvent | Isoflavone content | ||||||
|---|---|---|---|---|---|---|---|
|
EtOH % |
Glycol % |
H2O % |
Daidzin mg/g |
Genistin mg/g |
Malonyldaidzin mg/g |
Malonylglycitin mg/g |
Malonylgenistin mg/g |
| 100 | 0 | 0 | 0.00 ± 0.00 | nd | nd | nd | nd |
| 0 | 0 | 100 | 0.04 ± 0.01 | 0.04 ± 0.01 | 0.39 ± 0.01 | 0.07 ± 0.00 | 0.44 ± 0.00 |
| 0 | 100 | 0 | 0.10 ± 0.00 | 0.10 ± 0.00 | 0.18 ± 0.01 | 0.04 ± 0.00 | 0.23 ± 0.00 |
| 50 | 0 | 50 | 0.20 ± 0.02 | 0.29 ± 0.02 | 0.55 ± 0.02 | 0.10 ± 0.01 | 0.76 ± 0.01 |
| 50 | 50 | 0 | 0.05 ± 0.01 | 0.06 ± 0.00 | 0.10 ± 0.00 | 0.01 ± 0.00 | 0.14 ± 0.02 |
| 0 | 50 | 50 | 0.23 ± 0.01 | 0.27 ± 0.02 | 1.14 ± 0.03 | 0.11 ± 0.02 | 0.74 ± 0.04 |
| 33.3 | 33.3 | 33.3 | 0.32 ± 0.00 | 0.34 ± 0.01 | 0.71 ± 0.01 | 0.16 ± 0.03 | 0.80 ± 0.04 |
| 66.7 | 16.7 | 16.7 | 0.27 ± 0.02 | 0.32 ± 0.00 | 0.55 ± 0.02 | 0.10 ± 0.01 | 0.70 ± 0.04 |
| 16.7 | 16.7 | 66.7 | 0.26 ± 0.04 | 0.29 ± 0.03 | 0.64 ± 0.04 | 0.11 ± 0.01 | 0.77 ± 0.00 |
| 16.7 | 66.7 | 16.7 | 0.21 ± 0.00 | 0.27 ± 0.02 | 0.41 ± 0.03 | 0.08 ± 0.00 | 0.60 ± 0.01 |
| nd- not detected | |||||||
Table 3.
An evaluation of the influence and regression coefficients of models for five isoflavones, using a mixture design with three solvents: A) ethanol, B) H₂O and C) glycol.
Table 3.
An evaluation of the influence and regression coefficients of models for five isoflavones, using a mixture design with three solvents: A) ethanol, B) H₂O and C) glycol.
| solvents - linear factors |
coefficient | standard error | p value |
|---|---|---|---|
| Daidzin | |||
| (A) EtOH | 0.005976 | 0.012274 | 0.635129 |
| (B) H₂O | 0.046436 | 0.013484 | 0.004860 |
| (C) Glycol | 0.104128 | 0.012274 | 0.000002 |
| AB | 0.743744 | 0.065217 | 0.000000 |
| BC | 0.626670 | 0.065217 | 0.000001 |
| ABC | 3.578962 | 0.396505 | 0.000001 |
| AC(A-C) | 1.013699 | 0.219349 | 0.000589 |
| BC(B-C) | -0.390842 | 0.218512 | 0.098924 |
| Genistin | |||
| (A)EtOH | 0.010618 | 0.017566 | 0.555965 |
| (B)H₂O | 0.048974 | 0.019273 | 0.024604 |
| (C)Glycol | 0.105408 | 0.016896 | 0.000030 |
| AB | 1.095919 | 0.093359 | 0.000000 |
| BC | 0.782245 | 0.093849 | 0.000001 |
| ABC | 3.070757 | 0.570956 | 0.000126 |
| AB(A-B) | 1.015913 | 0.272909 | 0.002558 |
| Malonyldaidzin | |||
| (A)EtOH | 0.005035 | 0.013116 | 0.707798 |
| (B)H₂O | 0.395916 | 0.014408 | 0.000000 |
| (C)Glycol | 0.182057 | 0.013116 | 0.000000 |
| AB | 1.411829 | 0.069688 | 0.000000 |
| BC | 1.133447 | 0.069688 | 0.000000 |
| ABC | 6.566528 | 0.423685 | 0.000000 |
| AB(A-B) | 1.159180 | 0.233490 | 0.000328 |
| AC(A-C) | 1.252320 | 0.234385 | 0.000176 |
| Malonylglycitin | |||
| (A)EtOH | 0.002846 | 0.009474 | 0.768255 |
| (B)H₂O | 0.063592 | 0.010561 | 0.000031 |
| (C)Glycol | 0.036284 | 0.009474 | 0.001839 |
| AB | 0.272083 | 0.052391 | 0.000136 |
| BC | 0.196498 | 0.052391 | 0.002151 |
| ABC | 1.662748 | 0.320204 | 0.000136 |
| Malonylgenistin | |||
| (A)EtOH | 0.017682 | 0.027268 | 0.527991 |
| (B)H₂O | 0.447711 | 0.029917 | 0,000000 |
| (C)Glycol | 0.238918 | 0.026227 | 0.000001 |
| AB | 2.183971 | 0.144919 | 0.000000 |
| BC | 1.629657 | 0.145679 | 0.000000 |
| ABC | 5.432483 | 0.886282 | 0.000036 |
| AB(A-B) | 2.537765 | 0.423631 | 0.000045 |
Table 4.
Model fit for and analysis of variation explained by model form and lack of fit for five isoflavones using a mixture design with three solvents: A) ethanol, B) H₂O and C) glycol.
Table 4.
Model fit for and analysis of variation explained by model form and lack of fit for five isoflavones using a mixture design with three solvents: A) ethanol, B) H₂O and C) glycol.
| Source | SS | MS | F value | p value |
|---|---|---|---|---|
| Daidzin | ||||
| Model | 0.21320 | 0.03045 | 83.34809 | 0.00000 |
| Total error | 0.00438 | 0.00036 | ||
| Lack of fit | 0.00180 | 0.00090 | 3.50217 | 0.07034 |
| Pure Error | 0.00257 | 0.00025 | ||
| Cor Total | 0.21758 | 0.01145 | ||
| Model fit R2= 0.9681 Accuracy: Adj. R2=0.9798 | ||||
| Genistin | ||||
| Model | 0.30003 | 0.15088 | 361.6285 | 0.00000 |
| Total error | 0.00985 | 0.00041 | ||
| Lack of fit | 0.00780 | 0.00024 | 0.52370 | 0.60276 |
| Pure Error | 0.00205 | 0.00045 | ||
| Cor Total | 0.30988 | 0.05585 | ||
| Model fit; R2=0.9535 Accuracy: Adj. R2=0.9682 | ||||
| Malonyldaidzin | ||||
| Model | 0.05620 | 0.15088 | 361.6285 | 0.00000 |
| Total error | 0.00500 | 0.00041 | ||
| Lack of fit | 0.00048 | 0.00024 | 0.52370 | 0.60276 |
| Pure Error | 0.00452 | 0.00045 | ||
| Cor Total | 1.06120 | 0.05585 | ||
| Model fit R2=0.9925 Accuracy:Adj. R2=0.9953 | ||||
| Malonylglycitin | ||||
| Model | 0.040246 | 0.008049 | 33.70776 | 0.000000 |
| Total error | 0.003343 | 0.000239 | ||
| Lack of fit | 0.001927 | 0.000482 | 3.40081 | 0.052986 |
| Pure Error | 0.001416 | 0.000142 | ||
| Cor Total | 0.043589 | 0.002294 | ||
| Model fit R2=0.8959 Accuracy:Adj. R2=0.9233 | ||||
| Malonylgenistin | ||||
| Model | 1.57859 | 0.26309 | 144.0319 | 0.00000 |
| Total error | 0.02374 | 0.00182 | ||
| Lack of fit | 0.01812 | 0.00604 | 10.7555 | 0.00179 |
| Pure error | 0.00561 | 0.00056 | ||
| Cor Total | 1.60232 | 0.08433 | ||
| Model fit R2=0.9783 Accuracy: Adj. R2= 0.9852 | ||||
Disclaimer/Publisher’s Note: The statements, opinions and data contained in all publications are solely those of the individual author(s) and contributor(s) and not of MDPI and/or the editor(s). MDPI and/or the editor(s) disclaim responsibility for any injury to people or property resulting from any ideas, methods, instructions or products referred to in the content. |
© 2025 by the authors. Licensee MDPI, Basel, Switzerland. This article is an open access article distributed under the terms and conditions of the Creative Commons Attribution (CC BY) license (http://creativecommons.org/licenses/by/4.0/).
Copyright: This open access article is published under a Creative Commons CC BY 4.0 license, which permit the free download, distribution, and reuse, provided that the author and preprint are cited in any reuse.


