
Submitted:
13 June 2025
Posted:
17 June 2025
You are already at the latest version
Abstract
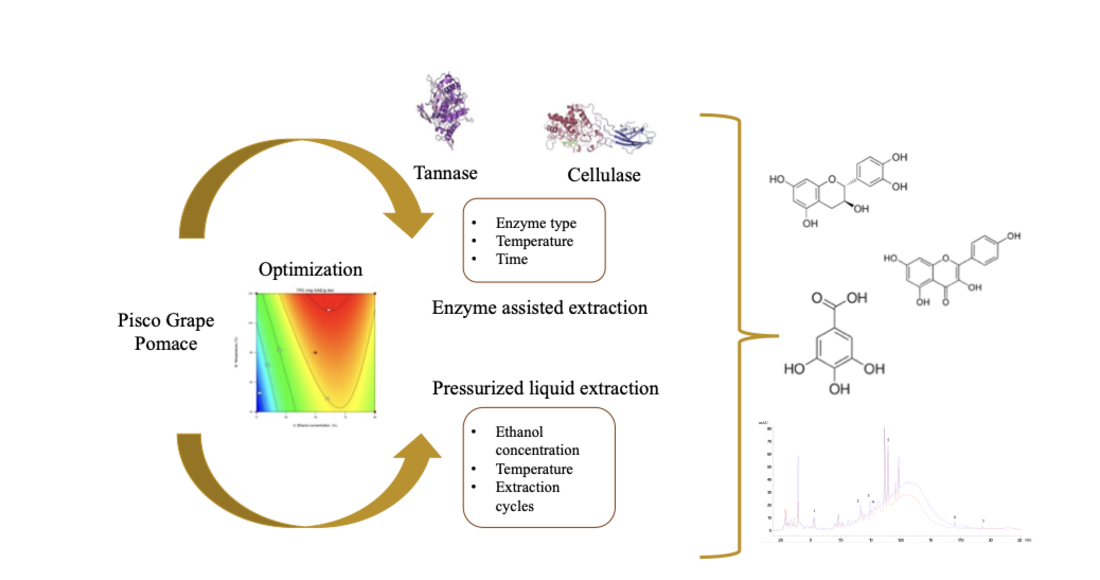
The pisco industry generates significant environmental waste, particularly grape pomace, a rich source of phenolic compounds. Emerging extraction technologies offer promising alternatives for recovering these bioactive components. This study evaluat-ed enzyme-assisted extraction (EAE) and pressurized liquid extraction (PLE) tech-niques, using response surface methodology to optimize phenolic compound yield and antioxidant capacity. Specifically, a D-optimal design was applied for EAE, and a Box-Behnken design for PLE. The optimal extraction conditions for EAE were 0.75 U of tannase, 40 U of cellulase, 20 °C, and 15 minutes. For PLE, the optimal parameters were 54% ethanol, 113 °C, and three extraction cycles. These conditions yielded 38.49 mg GAE g⁻¹ dw and 50.03 mg GAE g⁻¹ dw of total polyphenols, and antioxidant capacities of 342.47 μmol TE g⁻¹ dw and 371.00 μmol TE g⁻¹ dw, respectively. The extracts ob-tained under optimal conditions were further characterized through chromatographic techniques to determine their phenolic profiles. Seven phenolic compounds were iden-tified: gallic acid, catechin, epicatechin, 4-hydroxybenzoic acid, quercetin-3-rutinoside hydrate, quercetin-3-O-rhamnoside, and kaempferol. PLE extracts exhibited the high-est concentration of these compounds. These findings demonstrate that recovering an-tioxidant-rich phenolic compounds from pisco grape pomace using innovative extrac-tion methods is a viable strategy for obtaining functional ingredients and supporting sustainable industrial practices.
Keywords:
Pisco grape pomace
; efficient conditions
; enzyme-assisted extraction
; liquid pressurized extraction
; polyphenols
; antioxidant capacity
1. Introduction
Grapes are one of the most produced fruits and are essential in the world economy, with approximately 75 million tons/year. Its production is oriented to fresh consumption, juices, raisins, wine, and derivatives [1,2]. In Chile, pisco is a distilled beverage obtained from grapes, and this significant industry is concentrated in the Atacama and Coquimbo regions, with the majority of grape plantations located in the latter region [3]. The pisco production process generates a by-product known as grape pomace is mainly composed of seeds and skins and weighs about 20-30 % of the harvested grapes [4], which constitutes a significant volume of waste generated and has a strong environmental impact. This residue is composed of polyphenols and other metabolites; These polyphenols have been shown to have properties that prevent various diseases [2,5]. The solution to the problem of final disposal of this pomace is to find an appropriate technology for valorization so that it can be transformed into a product with added value for marketing.
Conventional extraction (solid-liquid) is generally used to recover polyphenols from different plant matrices. However, this process has several drawbacks as it uses various toxic solvents in high quantities, generating environmental risk, long extraction processes, and low yields [6]. Among the non-conventional methods is enzyme-assisted extraction (EAE), a more environmentally friendly alternative strategy based on enzymes' ability to degrade complex cell wall materials, thus promoting the release of trapped compounds [7]. The cell wall of grape skins is a complex network formed by various components such as pectin, lignin, proteins, and polysaccharides. The phenols in grapes include those that bind to these latter constituents through hydrogen bonds and hydrophobic interactions [8], and enzymes could release them [9]. The action of cellulases consists of the depolymerization of cellulose into simpler fermentable sugars, and tannase hydrolyzes the ester and depside bonds of tannins, producing glucose and gallic acid. Therefore, a selective enrichment in different extract phenols is expected depending on the action of each enzyme [8]. Another type of extraction is pressurized liquid extraction (PLE), which has several advantages over other extraction methods. Among these is its mechanism that establishes that high temperatures and pressure promote greater recovery of the phenolic compounds in a short period because there is an increase in the mass transfer rate from the matrix to the solvent [10].
Emerging extraction techniques such as Enzyme-Assisted Extraction (EAE) and Pressurized Liquid Extraction (PLE) are gaining increasing attention as environmentally friendly and sustainable strategies for recovering bioactive compounds from agricultural by-products. Response Surface Methodology (RSM) offers valuable statistical and mathematical tools to develop, optimize, and improve these extraction processes. RSM enables the evaluation of the effects of independent variables on response variables through experimental designs that reduce the number of required trials. Standard designs used for optimizing the extraction of polyphenolic compounds include Central Composite Design (CCD), Box-Behnken, and D-optimal designs, among others [11,12].
The main objective of this study is to use two emerging extraction technologies (EAE and PLE) for the recovery of phenolic compounds and antioxidants from Pisco grape pomace, applying experimental design models to find the best conditions in both extractions to obtain compounds with health benefits, and thus use and valorize this plant residue as a potential source for the future development of functional foods.
2. Materials and Methods
2.1. Materials
The pisco grape pomace was obtained from Pisquera de Chile S.A., located in Ovalle, Coquimbo Region, Chile, during the 2021 harvest, corresponding to the Muscat variety.
2.2. Chemicals and Reagents
The enzymes used were Aspergillus niger cellulase (white powder, ~0.8 U/mg) (Sigma-Aldrich, St. Louis, Missouri, USA) and food grade tannase (white powder ≥100 U/g) (High-tech industrial zone, China).
Ethanol, water milli-Q, Folin Ciocalteu reagent, sodium carbonate, DPPH (2,2-Diphenyl-1-picrylhydrazyl), AAPH (2,2′-Azobis (2-methylpropionamidine dihydrochloride), fluorescein sodium salt, trolox (6-hydroxy-2,5,7,8-tetramethylchroman-2-carboxylic acid), acetonitrile, water (HPLC grade), formic acid were purchased from Merck (Darmstadt, Germany), glucose 3,5-dinitrosalicylic acid and standards of phenolic compounds gallic acid, catechin, epicatechin, 4-hydroxybenzoic, quercetin-3-rutinoside hydrate, quercetin-3-O-rhamnoside, and kaempferol) were purchased from Sigma Aldrich Co. (St. Louis, MO, US).
2.3. Preparation of the Raw Material
Once the grape pomace was received, it was dehydrated in a vacuum oven at a temperature of 60 °C with a pressure of 100 mbar (Memmert, model VO 400, Schwabach, Germany) for 390 min based on a study carried out in a previous work [13]. The sample was stored until further analysis at -18 °C.
2.4. Characterization of the Dried Pomace
The proximate analysis of dried grape pomace was measured according to the methodology of the Association of Official Analytical Chemists [14]. Carbohydrates were calculated by difference. Water activity (aw) was measured at 25 °C using AQUA LAB equipment (4TE, Pullman, WA, USA). Reducing sugar content was measured according to Bailey et al. [15] and expressed as grams of glucose equivalents 100 g-1 dw. All measurements were performed in triplicate.
2.5. Conventional Extraction by Agitation (EA)
Conventional extraction will be carried out according to the methodology of Li et al. [16] with some modifications. One g of sample was weighed and mixed with 40 mL of 50% ethanol for 30 min in an orbital shaker (Boeco, OS-20) at 200 rpm. It was then centrifuged for 5 min at 4193 x g, and the supernatant was filtered for further analysis.
2.6. Experimental Design of Enzyme-Assisted Extraction (EAE)
A D-optimal design was used to optimize the EAE parameters and evaluate the main influences of various parameters on the total polyphenol extraction yield (Y1) and antioxidant capacity (Y2) of grape pomace. Four independent variables (Tannase (X1), cellulase (X2), temperature (X3), and time (X4)) with their levels (0.75-5 U; 4-40 U, 20-40 °C and 30-180 min, respectively) were considered, and the response variables were evaluated to determine the optimal extraction condition. The experimental data obtained were fitted to a second-order polynomial regression model.
2.7. Enzyme Assisted Extraction (EAE)
One g of dry pomace was weighed and mixed with 20 mL of acetate buffer (0.1 M, pH 4.8), and the dose of each enzyme was added and subjected to the process conditions delivered by the design. Then, the sample obtained in EAE was taken to a conventional extraction by shaking under conditions described by Chamorro et al. [7] with some modifications. 20 mL of absolute ethanol was added to the previous mixture and shaken for 30 min (Boeco, OS-20). It was centrifuged, filtered, and reconstituted to a final volume of 50 mL.
2.8. Experimental Design of Pressurized Liquid Extraction (PLE)
A Box Behnken design was used to optimize the PLE parameters and evaluate the main influences of various parameters on the TPC extraction yield (Y3) and antioxidant capacity (Y4) of grape pomace. Three independent variables (Ethanol Concentration (X1), Temperature (X2), and extraction cycles (X3) with their levels (of 10-90 %; 40-120 ° C and 1-5 cycles, respectively) were considered, and the response variables were evaluated to determine the optimum extraction condition. The experimental data obtained were fitted to a second-order polynomial regression model.
2.9. Pressurized Liquid Extraction
One g of dry pomace was weighed and mixed with diatomaceous earth (1:1). It was placed in a 34 mL stainless steel cell and taken to the Accelerated Solvent Extraction (Thermo Scientific Thermo Fisher Scientific Dionex ASE 150, EE.UU), according to the experimental design. The fixed conditions of the process were 3 min according to preliminary tests, where 3-15 min were evaluated, and 103 bar of pressure, depending on the operation of the equipment. Then, the supernatant was centrifuged, filtered, and replaced with 50 mL [16].
2.10. Characterization of Optimal EAE and PLE Extracts
Total phenolic compounds (TPC) content was assessed by the Folin-Ciocalteu assay based on the method of Singleton and Rossi [17] in a multiplate reader (Perkin-Elmer, Victor TM χ3, Turku, Finland) at 750 nm. Determining antioxidant capacity by DPPH assay was performed using the method described by Grajeda-Iglesias et al. [18] in a Multiplate Reader at 510 nm. Total flavonoid content (TFC) was determined in a spectrophotometer (Thermo Scientific, ORION AQUAMATE 8000, Madison, USA) at 415 nm [19]. The ORAC assay was performed in a 96-well microplate at an excitation wavelength of 485 nm and an emission of 535 nm [19]. Reducing sugar content was determined using dinitrosalicylic acid reagent (DNS) according to the method of Bailey et al. [15]. For the determination of the phenolic profile, the extracts were automatically injected into an HPLC system (Agilent 1200 series, Santa Clara, CA, USA) with a diode array detector (DAD) at wavelengths of 280, 310 and 370 nm, and the chromatographic conditions used were those reported by Vega-Gálvez et al. [19].
2.11. Statistical Analysis
The selected D-optimal design consisted of 29 experiments, which included four central points for calculating variance, and the Box Behnken design consisted of 17 experimental runs. For both designs, statistical regression validation was performed using ANOVA with a confidence level of 95%. The optimal conditions of the variables that maximize the response were calculated using RSM, using the Design-Expert software (test version 8.0.6, Stat Ease Inc., Minneapolis). In addition, the effect of both extractions was evaluated using an analysis of variance and the multiple-range test. Statistically significant differences were determined when the p-value was < 0.05 (Statistical Graphics Corp., Herndon, VA, USA).
3. Results and Discussion
3.1. Characterization of the Dried Pomace
Table 1 shows the proximate analysis of the vacuum-dried sample. The moisture content of the final product was 5.51 g 100 g-1 expressed on a dry basis and an aw of 0.3069. The water activity must be less than 0.6 to ensure the raw matrix is microbiologically stable and thus increases its shelf life. The lipid content was 7.35 g 100 g-1 dw, mainly attributed to grape pomace seeds. The ashes and proteins presented values of 5.83 and 12.74 g 100 g-1 dw, respectively. These values of the proximal analysis varied from those of other studies on grape pomace [20,21,22,23].
The total dietary fiber (TDF) content was high, at 40.94%. It should be noted that the total dietary fiber is composed of lignins, celluloses, and hemicelluloses that are linked to the insoluble dietary fiber (38.08%), the predominant fraction present in the pomace. The literature shows that the TDF in grape varieties is 35-55% [24], while in pomace in red grape varieties, a content of 16.4-58% TFD was found [25].
The total carbohydrate content was 74.07 g per 100 g-1 dw, with reducing sugars expressed as glucose accounting for 33.65 g per 100 g-1 dw. This indicates a substantial amount of simple sugars, with the remaining fraction mainly corresponding to dietary fiber. These findings align with those reported for pisco grape pomace dehydrated using different drying methods and similar grape varieties [21]. In pomace, carbohydrates can vary between 6 - 15% depending on the grape variety, agro-climatic conditions, or viticultural practices. It should be considered that these white pomaces contain a relatively high number of soluble sugars, unlike pomace from red grapes [23].
Taken together, the compositional profile characterized by high fiber, relevant sugar content, and low water activity supports not only the stability and conservation of the dried matrix but also its potential as an optimal substrate for emerging extraction technologies, aimed at the efficient recovery and valorization of its bioactive compounds.
3.2. Experimental Design of Enzyme-Assisted Extraction
To define the experimental design, preliminary tests were carried out to determine the factors and levels to be used. The effect of three enzymes, pectinase, cellulase, and tannase, applied individually at different concentrations, on the extraction yield of total polyphenols was evaluated. According to the results, cellulase and tannase increased polyphenol extraction in a concentration-dependent manner, showing a progressive improvement in yield with increasing dosage. In contrast, pectinase (results not shown) did not significantly improve polyphenol recovery, regardless of the concentration applied. Several studies have shown a positive effect of using individual and combined enzymes [8]. The action of cellulase is because its substrate is cellulose, one of the polysaccharides found in the highest proportion in the pomace (12%) and is characterized by giving stability and rigidity to the cell wall. Therefore, its degradation allows access to the compounds trapped in its structure; and tannase can depolymerize the polyphenols present [7].
D-optimal experimental design using response surface methodology (RSM) was performed to establish the optimal conditions for maximizing total polyphenol extraction yield (TPC) and antioxidant capacity (DPPH). The effects of four independent variables, Tannase (U), Cellulase (U), Temperature (°C), and Time (min), were investigated. Table 2 shows the experimental values of the 29 runs of the design for each of the response variables evaluated.
The most reliable way to assess the quality of the adapted model is to apply the analysis of variance (ANOVA), which consists of determining the effects of several independent variables on the response variable and deciding whether these effects are significant [26].
According to the ANOVA (Table 3) analysis for TPC, the value of R2=0.9639 and the adjusted R2= 0.9456. The R2 is related to the terms of the mathematical model, while the adjusted R2 is the one that allows making decisions and relates to the quality of the fit; it also indicates that the model obtained can explain 94.56% of the variation in the TPC value [12]. The coefficient of variation (CV) is a relationship between the mean and the deviation. A low CV value indicates that there is a high reproducibility of the results obtained [23]; for this model, a CV value of 6.32% was obtained.
Analysis of the quadratic regression model showed that it was significant (p<0.05), while the “lack of fit” was not significant (p>0.05). Of the four independent variables in the model, temperature and time were significant (p<0.05) at the 95.0% confidence level. The model showed that the independent variable with the most significant effect on the TPC was time (X4), with a lower p-value (p<0.05) and an F value of 218.54, followed by temperature (X3), with an F value of 78.81. At the same time, tannase (X1) and cellulase (X2) did not significantly affect the TPC yield (p>0.05). A reduced quadratic model was developed since the quadratic independent variables and interactions that did not present significance in the design for the TPC data set were eliminated in the analysis and adjusted to the following equation 1:
For the antioxidant capacity, the value of R2=0.8698 and the adjusted R2= 0.8116 presented a % CV of 6.13%. Analysis of the quadratic regression model showed that it was significant (p<0.05), while the “lack of fit” was not significant (p>0.05). Of the four independent variables in the model, temperature (X3) and time (X4) were significant again (p<0.05) at the 95.0% confidence level. The model showed that the independent variable with the greatest effect on the extraction yield was time (p<0.05), with an F value of 44.46, followed by temperature, with an F value of 28.05. Meanwhile, tannase and cellulase did not have significant effects on the antioxidant yield (p>0.05) (Table 3).
The quadratic model developed in the antioxidant capacity data set was adjusted to the following equation 2:
The 3D surface graphs were obtained by keeping two variables constant and varying the other two within the experimental range. Figure 1 depicts the impacts of EAE conditions, such as enzyme type, temperature, and time, on TPC and antioxidant capacity. Figure 1-A and Figure 1-B show that a shorter extraction time (15 min) and a lower temperature (20 °C) results in a higher TPC yield and greater antioxidant capacity (with variables constant: 40 U of cellulose and 0.75 U of tannase). It can be observed that the highest values were found at the extremes of the experimental levels; this can be attributed to the fact that the range of levels chosen was limited for this type of extraction. Considering this, experimental tests were carried out (results not shown), where temperatures of 10 °C and 60 °C were evaluated, and times of 10 min and 200 min; here, it was observed that both the content of total polyphenols (21.89-34.38 mg GAE g-1 dw) and antioxidant capacity decreased (221.47-264.64 μmol ET g-1 dw). As mentioned above, the TPC 3D surface graphs evaluating the effect of enzymes (tannase-cellulase) were not shown because it was not significant for the model. Figure 1-C shows that with a higher amount of cellulose (40 U) and a lower amount of tannase (0.75 U) the antioxidant capacity is higher (with variables constant: 20 °C and 15 min). In addition, it was found that the TPC value varied in wide ranges from 16.19-44.78 mg GAE g-1 dw depending on the changes in the process variables, while the antioxidant capacity varied from 226.34-369.49 μmol ET g-1 dw (Table 2). The optimal conditions for the determination of TPC and antioxidant capacity for EAE were 0.75 U tannase, 40 U cellulase, 20 °C temperature, and a time of 15 min, with a desirability value of 0.734, where values close to 1 indicate that the value of response is consistent with the target value.
3.3. Experimental Design of Pressurized Liquid Extraction (PLE)
According to preliminary experiments and a literature search based on studies that have used PLE to extract different compounds from grapes [16,27,28], the experimental design was defined considering the effects of three independent variables: ethanol concentration, temperature, and extraction cycles, evaluating the phenolic content and the antioxidant capacity. Table 4 shows the experimental values of the 17 design runs for each of the response variables evaluated. A quadratic model was developed for the total polyphenols and antioxidant capacity data set. In the ANOVA analysis for TPC, the value of R2=0.9889, the adjusted R2= 0.9747, and the CV (%) was 6.37 (Table 5). A quadratic model was developed, considering the interactions and quadratic independent variables, and the analysis was adjusted to the following equation 3:
The antioxidant capacity, the value of R2=0.9777 and, the adjusted R2= 0.9490 and presented a CV (%) of 8.82. The quadratic model developed in the antioxidant capacity data set was adjusted to the following equation 4:
Analysis of the quadratic regression model showed that it was significant (p<0.05), while the “lack of fit” was not significant (p>0.05). The model showed that the independent variables with the most significant effect on TPC yield were ethanol concentration (X1), with an F value of 215.09, and temperature (X2), with an F value of 94.47 (p<0.05), while in antioxidant capacity, the independent variables with the most significant effect were ethanol concentration (X1) (p<0.05), with an F value of 114.05. The extraction cycle variable (X3) for both response variables was not significant (p>0.05).
The 3D surface graphs were obtained by keeping one variable constant and varying the other two within the experimental range. Figure 2 shows the impacts of PLE conditions, such as ethanol concentration, temperature, and extraction cycles, on TPC and antioxidant capacity.
Figure 2-A and Figure 2-C show that the yield of total phenolic compounds (TPC) and antioxidant capacity increase significantly when using temperatures between 80 and 120 °C and ethanol concentrations between 50 and 80%, with three extraction cycles kept constant. These temperature and solvent concentration ranges are consistent with previous studies, in which similar conditions enhanced the extraction efficiency of phenolic compounds, attributed to improved solubility and greater release of phenolic metabolites from the plant matrix [29,30,31]. It is observed that the red region in Figure 2-B and Figure 2D are similar because there were no significant differences concerning the extraction cycles and at an ethanol concentration region (with variable constant: 80 °C). In addition, it was found that the TPC value varied in wide ranges from 5.84-50.21 mg GAE g-1 dw, while the antioxidant capacity varied from 98.33-347.14 μmol ET g-1 dw (Table 4). Some studies in PLE have reported that extraction cycles did not show significance in obtaining TPC, using longer extraction times [16,27].
The optimum conditions for extracting total polyphenols and antioxidant capacity for PLE were 54% ethanol, 113 °C, and three extraction cycles with a desirability value of 0.937, where values close to 1 indicate that the response value is consistent with the target value.
3.4. Validation of Enzymatic and Pressurized Liquid Extractions
To verify the reliability of the models of both extractions, experiments were carried out under optimal conditions, in which the experimental values were compared with the predicted values to obtain the percentage error (Table 6). The percentage errors for EAE were 7.34% and 7.57% for TPC content and antioxidant capacity, respectively. In the case of PLE, they were 1.24% and 11.80% for TPC and antioxidant capacity, respectively. It is important to mention that these variations can be attributed to the samples' heterogeneity due to their composition (seeds and skin). The errors between the predicted and experimental values indicate that it can be extrapolated that the regression models obtained by RSM could predict the extraction yields of TPC and antioxidant capacity.
3.5. Characterization of Optimal Extracts
Table 7 presents the characterization of the optimal extracts obtained by EAE and PLE. The content of total polyphenols, total flavonoids, antioxidant capacity (using DPPH and ORAC assays), sugars, and phenol profile were evaluated.
The optimized extracts presented higher amounts of phenolic compounds and antioxidant capacity than by agitation. Compared with EA, the EAE extract increased 31% TPC and antioxidant capacity by 2% and 8% for DPPH and ORAC, respectively. Meanwhile, PLE stood out over agitation extraction in that the PLE extract increased 70 % TPC and antioxidant capacity by 12% and 24% for DPPH and ORAC, respectively. Both extracts showed significant differences between them (p<0.05).
EA showed a polyphenol content of 29.46 ± 0.37 mg GAE g-1 dw, flavonoids 48.04 ± 0.75 mg QE g-1 dw, and antioxidant capacity values of 329.67 ± 5.39 and 1549.17 ± 94.63 μmol ET g-1 dw, by DPPH and ORAC respectively (data not shown).
The sugars in EAE and PLE increased by 20% compared to EA (217.03 mg glucose g-1 dw). The sugar content was determined considering that grape skin contains large amounts of hemicellulosic sugars, which increase when hydrolyzed due to the release of xylose and glucose monomers [25].
To evaluate the distribution of polyphenolic compounds within the different fractions of grape pomace, the optimal extraction conditions obtained in this study were applied separately to the seed and skin components (data not shown). EAE in seeds had a TPC content of 58.48 mg GAE g-1 dw, while skin had 8.24 mg GAE g-1 dw. Values for antioxidant capacity by DPPH were 401.30 μmol ET g-1 dw and 171.86 μmol ET g-1 dw for seeds and skin, respectively. For PLE, TPC content was 67.73 mg GAE g-1 dw in seeds and 22.44 mg GAE g-1 dw in skin. The values for antioxidant capacity by DPPH obtained were 399.21 μmol ET g-1 dw in seeds and 171.86 μmol ET g-1 dw in skin. Notably, in all grape varieties, the highest concentration of polyphenolic compounds is present in the seeds, which are correlated with the antioxidant capacity. In addition, 70% of the extractable compounds are from the seeds, while 28-35% are from the skin [25]. The TPC values obtained in this work were higher than those obtained in other grape EAE and PLE studies. EAE variations can be attributed to the type of enzyme, the enzyme-substrate ratio, longer incubation times, and higher temperatures [7,32,33]. In PLE, the type of grape, higher temperature, and longer extraction times used can be attributed [6,16].
EAE and PLE, compared with ultrasound and microwave extraction, which are also emerging techniques applied to grape pomace and seeds of red and white grape varieties, have obtained similar values in TPC and lower values in TFC and antioxidant capacity by DPPH [34]. Although studies have been conducted on optimizing EAE y PLE in grape pomace for wine production, work has yet to be reported using enzymes in pisco grape pomace. PLE proves to be more efficient in increasing the content of the compounds of interest.
The correlation between TPC and antioxidant capacity was evaluated for the EAE and PLE extracts. The EAE extract showed an R2 = 0.8017, and the PLE extract an R2 = 0.8827; these values indicate a high correlation between both variables studied.
3.6. Phenol Profile of Optimum Extracts
Phenolic compounds are natural antioxidants that control or prevent metabolic syndrome and various chronic diseases. They also possess various pharmacological activities, such as antimicrobial, inflammatory, and anticarcinogenic properties [16,25,35].
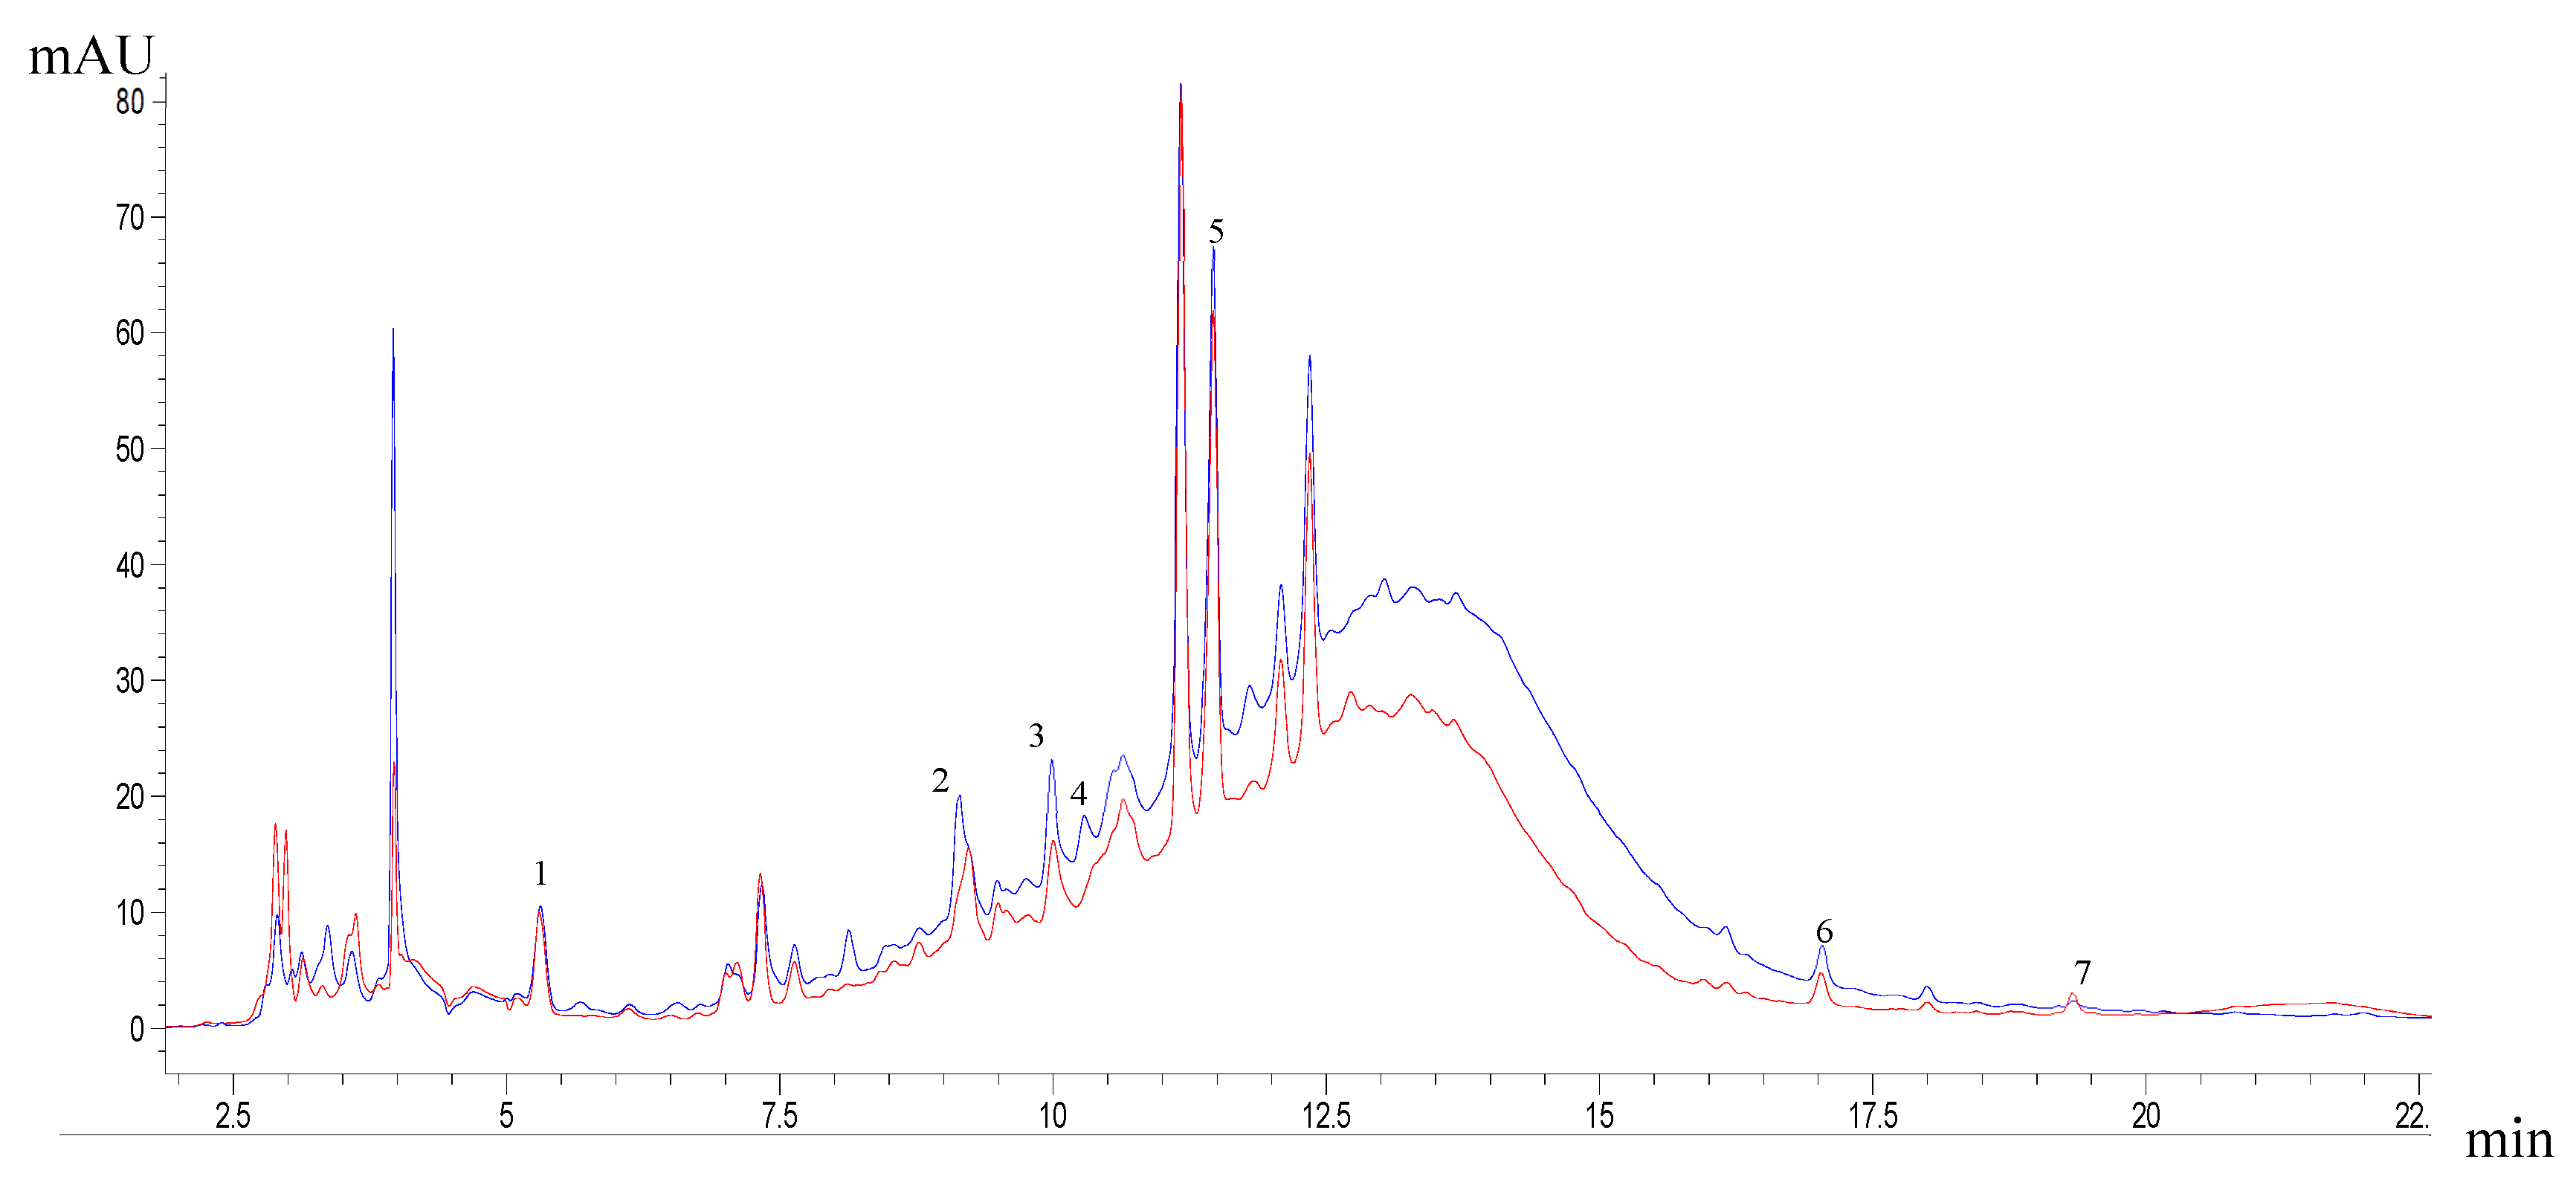
Figure 3 compares the profile of phenolic compounds present in the optimal EAE and PLE extracts. The phenolic compounds identified in both optimum extractions were gallic acid, catechin, epicatechin, 4-hydroxybenzoic acid, quercetin-3-rutinoside hydrate, quercetin-3-O-rhamnoside, and kaempferol.
The PLE extract showed the highest concentration of phenolic compounds compared to EAE. Quercetin-3-rutinoside hydrate was the compound in the highest concentration, with a value of approximately 3 mg g-1 dw (Table 7). It was followed by catechin and epicatechin with values of 0.3-0.7 mg g-1 dw, respectively. Due to the advantages of PLE already mentioned, and the added thermal energy, this extraction contributes to breaking the matrix bonds and favors the diffusion of some specific polyphenols, such as phenolic acids, flavonols, and flavonols [6].
EAE and PLE influenced the phenolic recovery of grape pomace extracts. Chromatographic analysis (HPLC-DAD) identified more individual phenolic compounds than EA. According to a previous study by Poblete et al. [13] using EA and comparing them with the optimal extracts, these increases in concentration and the presence of two new phenols, quercetin-3-O-rhamnoside (0.09-0.12 mg g-1 dw) and kaempferol (0.04-0.05 mg g-1 dw), was also identified and quantified. Most of the compounds found belong to the flavonol group.
Individual phenolic compounds were also evaluated in seeds and skins. In the seeds, the EAE extract was found to have a higher concentration of catechin and epicatechin (0.45-1.45 mg g-1 dw) than the PLE extract (0.36-1.26 mg g-1 dw). In the skin, the EAE extract had a higher concentration of quercetin-3-rutinoside hydrate (2.59 mg g-1 dw) than the PLE extract (2.42 mg g-1 dw). Among the compounds in grape seeds are tannins, also called proanthocyanidins (flavonols). When hydrolyzed, their main monomers are obtained, such as catechin, epicatechin, epigallocatechin, and epicatechin-3-O-gallate [36]. In PLE, high temperatures favor the release of these monomers in the extracts [6].
Some studies in grapes and grape pomace using EAE and PLE reported the presence of gallic acid, pyrogallol, catechin, epicatechin, caffeic acid, rutin, quercetin, and kaempferol. These studies reported that gallic acid was one of the predominant compounds; rutin and quercetin were found in higher concentrations, while catechin and epicatechin were found in lower concentrations, mainly in white grapes. However, the concentrations of these compounds are different compared to this study.
Among the bioactive properties of the phenolic compounds found, gallic acid is one of the most important hydroxybenzoic acids found in grapes; it can be found in the skin, pulp, or seeds but is more abundant in the skin and has a high antioxidant capacity. Catechins and epicatechins have cholesterol-lowering properties and reduce blood pressure. Rutin, quercetin, and kaempferol possess potent antioxidant capacity, playing a role in protecting against cardiovascular disease. These last two compounds belonging to the flavonols group are mainly present in grapes and grape pomace as aglycones and in glycosylated form [25,37].

Table 1.
Proximal composition of vacuum dried (VAC) grape pomace at 60 °C.
| Parameters | VAC 60 °C | ||
|---|---|---|---|
| 1Moisture | 5.51 | ± | 0.26 |
| 2Fat | 7.35 | ± | 0.24 |
| 2Ash | 5.83 | ± | 0.09 |
| 2Crude protein | 12.74 | ± | 0.54 |
| 2Insoluble dietary fiber, IDF | 38.08 | ± | 4.04 |
| 2Soluble dietary fiber, SDF | 2.86 | ± | 0.18 |
| 2Total dietary fiber, TDF | 40.94 | ± | 3.86 |
| 3Total Carbohydrates | 74.07 | ± | 0.48 |
| 4Reducing sugar content | 33.65 | ± | 1.09 |
| 5Water activity, aw | 0.3069 | ± | 0.0066 |
1 Mean value ± Standard deviation (SD) was expressed in g 100 g -1 sample (%). 2 Mean values ± SD and the data are expressed as g 100 g-1 dw. 3 Total Carbohydrates (TC) by difference: TC = 100 - (% Moisture + % Crude protein + % Fat + % Ash). 4 Reducing sugar content is expressed as g glucose 100 g-1 dw. 5 Dimensionless.
Table 2.
Experimental D-optimal design for EAE of pisco grape pomace yield of extract polyphenols, and the antioxidant capacity.
Table 2.
Experimental D-optimal design for EAE of pisco grape pomace yield of extract polyphenols, and the antioxidant capacity.
| Variables | Response | |||||
|---|---|---|---|---|---|---|
| X1 | X2 | X3 | X4 | Y1 | Y2 | |
| Run |
Tannase (U) |
Cellulase (U) |
Temperature (°C) |
Time (min) |
TPC (mg GAE g-1 dw) |
Antioxidant capacity (μmol TE g-1 dw) |
| 1 | 3.99 | 4 | 50 | 15 | 35.61 | 327.04 |
| 2 | 0.75 | 40 | 20 | 180 | 31.17 | 332.94 |
| 3 | 0.75 | 4 | 20 | 15 | 38.96 | 300.68 |
| 4 | 10 | 4 | 20 | 88.43 | 33.8 | 329.88 |
| 5 | 10 | 4 | 50 | 180 | 19.47 | 260.06 |
| 6 | 5.38 | 22 | 35 | 97.5 | 20.28 | 253.04 |
| 7 | 3.99 | 4 | 20 | 180 | 31.68 | 320.17 |
| 8 | 10 | 40 | 33.05 | 180 | 23.23 | 252.69 |
| 9 | 10 | 40 | 50 | 88.43 | 30.21 | 258.26 |
| 10 | 10 | 24.16 | 20 | 180 | 30.11 | 289.96 |
| 11 | 7.60 | 40 | 20 | 15 | 40.09 | 320.78 |
| 12 | 0.75 | 40 | 20 | 180 | 34.92 | 331.81 |
| 13 | 0.75 | 4 | 20 | 15 | 39.79 | 331.40 |
| 14 | 1.49 | 40 | 28.64 | 15 | 44.78 | 369.49 |
| 15 | 10 | 24.52 | 50 | 15 | 38.15 | 299.94 |
| 16 | 3.96 | 40 | 50 | 180 | 16.19 | 238.86 |
| 17 | 10 | 4 | 32.75 | 15 | 31.15 | 304.45 |
| 18 | 10 | 4 | 50 | 180 | 19.98 | 239.59 |
| 19 | 0.75 | 4 | 33.5 | 105.75 | 19.57 | 247.00 |
| 20 | 0.75 | 4 | 50 | 180 | 18.17 | 243.97 |
| 21 | 0.75 | 23.98 | 36.65 | 180 | 30.07 | 259.49 |
| 22 | 7.60 | 40 | 20 | 15 | 42.42 | 359.75 |
| 23 | 5.38 | 22 | 35 | 97.5 | 19.18 | 226.34 |
| 24 | 0.75 | 40 | 50 | 15 | 38.97 | 347.46 |
| 25 | 3.99 | 4 | 20 | 180 | 31.53 | 295.15 |
| 26 | 0.75 | 23.44 | 20 | 90.9 | 35.50 | 318.41 |
| 27 | 0.75 | 20.15 | 49.50 | 88.94 | 30.21 | 268.40 |
Response values are the mean of three replicates. TPC: Total polyphenol content.
Table 3.
Analysis of variance of the regression parameters of the total polyphenols yield and the antioxidant capacity of EAE of the pisco grape pomace.
Table 3.
Analysis of variance of the regression parameters of the total polyphenols yield and the antioxidant capacity of EAE of the pisco grape pomace.
| Response | Y1:TPC | Y2: Antioxidant capacity | ||||||||||
|---|---|---|---|---|---|---|---|---|---|---|---|---|
| Source | Sum of Squares | df | Mean Square | F-value | p-value | Sum of Squares | df | Mean Square | F-value | p-value | ||
| Model | 1537.99 | 8 | 192.25 | 53.48 | < 0.0001 | 38917.57 | 8 | 4864.7 | 15 | < 0.0001 | ||
| X1-Tannase | 2.49 | 1 | 2.49 | 0.6939 | 0.4171 | 786.84 | 1 | 786.84 | 2.43 | 0.1367 | ||
| X2-Cellulase | 16.05 | 1 | 16.05 | 4.46 | 0.0507 | 479.19 | 1 | 479.19 | 1.48 | 0.2398 | ||
| X3-Temperature | 283.34 | 1 | 283.34 | 78.81 | < 0.0001 | 9094.98 | 1 | 9094.98 | 28.05 | < 0.0001 | ||
| X4-Time | 785.68 | 1 | 785.68 | 218.54 | < 0.0001 | 14415.47 | 1 | 14415.47 | 44.46 | < 0.0001 | ||
| X1X2 | - | - | - | - | - | 3326.98 | 1 | 3326.98 | 10.26 | 0.0049 | ||
| X3X4 | 107.12 | 1 | 107.12 | 29.8 | < 0.0001 | 1760.49 | 1 | 1760.49 | 5.43 | 0.0316 | ||
| X1² | 17.05 | 1 | 17.05 | 4.74 | 0.0447 | - | - | - | - | - | ||
| X3² | 228.65 | 1 | 228.65 | 63.6 | < 0.0001 | 2981.37 | 1 | 2981.37 | 9.19 | 0.0072 | ||
| X4² | 18.19 | 1 | 18.19 | 5.06 | 0.0389 | 2259.98 | 1 | 2259.98 | 6.97 | 0.0166 | ||
| Residual | 57.52 | 16 | 3.6 | 5836.62 | 18 | 324.26 | ||||||
| Lack of Fit | 46.68 | 10 | 4.67 | 2.58 | 0.1287 | 3725.84 | 12 | 310.49 | 0.8826 | 0.5997 | ||
| Pure Error | 10.84 | 6 | 1.81 | 2110.78 | 6 | 351.8 | ||||||
| Cor Total | 1595.51 | 24 | 44754.19 | 26 | ||||||||
| Fit Statistics | ||||||||||||
| R2 | 0.9639 | 0.8698 | ||||||||||
| R2 Adjusted | 0.9456 | 0.8116 | ||||||||||
| R2 Predicted | 0.9085 | 0.7067 | ||||||||||
| CV (%) | 6.32 | 6.13 | ||||||||||
TPC: Total polyphenol content; p-values less than 0.05 indicate model terms are significant.
Table 4.
Box Behnken experimental design for PLE of pisco grape pomace, polyphenolic yield of the extract, and antioxidant capacity.
Table 4.
Box Behnken experimental design for PLE of pisco grape pomace, polyphenolic yield of the extract, and antioxidant capacity.
| Variables | Response | ||||
|---|---|---|---|---|---|
| X1 | X2 | X3 | Y1 | Y2 | |
| Run |
Ethanol concentration (%) | Temperature (°C) | Extraction cycles | TPC (mg GAE g-1 dw) |
Antioxidant capacity (μmol TE g-1 dw) |
| 1 | 90 | 120 | 3 | 40.05 | 289.10 |
| 2 | 90 | 80 | 1 | 34.07 | 253.40 |
| 3 | 50 | 80 | 3 | 41.85 | 304.27 |
| 4 | 50 | 40 | 1 | 31.53 | 277.81 |
| 5 | 50 | 80 | 3 | 44.18 | 301.35 |
| 6 | 50 | 80 | 3 | 39.90 | 308.08 |
| 7 | 90 | 40 | 3 | 34.19 | 277.74 |
| 8 | 90 | 80 | 5 | 33.54 | 253.94 |
| 9 | 10 | 80 | 5 | 12.70 | 130.90 |
| 10 | 50 | 40 | 5 | 33.38 | 310.86 |
| 11 | 10 | 40 | 3 | 5.84 | 102.22 |
| 12 | 10 | 80 | 1 | 8.72 | 98.33 |
| 13 | 50 | 120 | 5 | 50.21 | 295.86 |
| 14 | 50 | 80 | 3 | 45.49 | 298.83 |
| 15 | 50 | 120 | 1 | 48.64 | 347.14 |
| 16 | 50 | 80 | 3 | 44.94 | 281.54 |
| 17 | 10 | 120 | 3 | 25.25 | 233.23 |
Response values are the mean of three replicates. TPC: Total polyphenol content.
Table 5.
Analysis of variance of the regression parameters of the total polyphenols yield and the antioxidant capacity of PLE of the pisco grape pomace.
Table 5.
Analysis of variance of the regression parameters of the total polyphenols yield and the antioxidant capacity of PLE of the pisco grape pomace.
| Response | Y1:TPC | Y2: Antioxidant capacity | ||||||||||
|---|---|---|---|---|---|---|---|---|---|---|---|---|
| Source | Sum of Squares | df | Mean Square | F-value | p-value | Sum of Squares | df | Mean Square | F-value | p-value | ||
| Model | 2901.32 | 9 | 322.37 | 69.5 | < 0.0001 | 87221.11 | 9 | 9691.23 | 34.06 | < 0.0001 | ||
| X1-Ethanol concentration | 997.7 | 1 | 997.7 | 215.09 | < 0.0001 | 32448.78 | 1 | 32448.78 | 114.05 | < 0.0001 | ||
| X2-Temperature | 438.23 | 1 | 438.23 | 94.47 | < 0.0001 | 4836.36 | 1 | 4836.36 | 17 | 0.0044 | ||
| X3-Extraction cycles | 5.9 | 1 | 5.9 | 1.27 | 0.2966 | 27.68 | 1 | 27.68 | 0.0973 | 0.7642 | ||
| X1X2 | 45.9 | 1 | 45.9 | 9.9 | 0.0162 | 3579.03 | 1 | 3579.03 | 12.58 | 0.0094 | ||
| X1X3 | 5.09 | 1 | 5.09 | 1.1 | 0.3299 | 256.48 | 1 | 256.48 | 0.9014 | 0.374 | ||
| X2X3 | 0.0196 | 1 | 0.0196 | 0.0042 | 0.95 | 1777.89 | 1 | 1777.89 | 6.25 | 0.041 | ||
| X1² | 1335.71 | 1 | 1335.71 | 287.96 | < 0.0001 | 40858.42 | 1 | 40858.42 | 143.6 | < 0.0001 | ||
| X2² | 3.2 | 1 | 3.2 | 0.6894 | 0.4338 | 2688.04 | 1 | 2688.04 | 9.45 | 0.018 | ||
| X3² | 43.21 | 1 | 43.21 | 9.32 | 0.0185 | 1100 | 1 | 1100 | 3.87 | 0.09 | ||
| Residual | 32.47 | 7 | 4.64 | 1991.65 | 7 | 284.52 | ||||||
| Lack of Fit | 10.55 | 3 | 3.52 | 0.6419 | 0.6272 | 1571.2 | 3 | 523.73 | 4.98 | 0.0774 | ||
| Pure Error | 21.92 | 4 | 5.48 | 420.45 | 4 | 105.11 | ||||||
| Cor Total | 2933.79 | 16 | 89212.76 | 16 | ||||||||
| Fit Statistics | ||||||||||||
| R2 | 0.9889 | 0.9777 | ||||||||||
| R2 Adjusted | 0.9747 | 0.9490 | ||||||||||
| R2 Predicted | 0.9308 | 0.7180 | ||||||||||
| CV (%) | 6.37 | 8.82 | ||||||||||
TPC: Total polyphenol content; p-values less than 0.05 indicate model terms are significant.
Table 6.
Validation of enzymatic and pressurized liquid extractions.
| TPC (mg GAE g-1 dw) |
Antioxidant capacity (μmol ET g-1 dw) |
|||||||
|---|---|---|---|---|---|---|---|---|
| Extraction | Optimal conditions | Value Predicted | Value Experimental | Error percentage (%) * | Value Predicted | Value Experimental | Error percentage (%) * |
|
| EAE | Tannase (U) | 0.75 | 41.51 | 38.49 | 7.34 | 370.52 | 342.47 | 7.57 |
| cellulase (U) | 40 | |||||||
| Time (min) | 15 | |||||||
| Temperature (°C) | 20 | |||||||
| PLE | Ethanol concentration (%) | 54 | ||||||
| Temperature (°C) | 113 | 50.66 | 50.03 | 1.24 | 331.84 | 371.00 | 11.80 | |
| Extraction cycles | 3 | |||||||
* The error percentage (%) was calculated by comparing the experimental value to the predicted value. EAE: Enzyme-assisted extraction; PLE: Extraction by pressurized liquids; TPC: Total polyphenols content.
Table 7.
Characterization of optimal extracts.
| Extraction methods | |||||||
|---|---|---|---|---|---|---|---|
| Parameters | EAE | PLE | |||||
| TPC (mg GAE g-1 dw)* | 38.49 | ± | 0.99b | 50.03 | ± | 0.58ª | |
| TFC (mg QE g-1 dw) | 51.78 | ± | 1.62b | 75.48 | ± | 2.12ª | |
| DPPH (μmol TE g-1 dw)* | 342..47 | ± | 1.29b | 371.00 | ± | 8.89ª | |
| ORAC (μmol TE g-1 dw) | 1687.47 | ± | 4.66b | 1931.39 | ± | 90.26ª | |
| Sugars (mg Glucose g-1 dw) | 262.58 | ± | 1.83b | 266.79 | ± | 0.02a | |
| Phenolic compounds (mg g-1 dw) | |||||||
| Gallic acid | 0.14 | ± | 0.01b | 0.23 | ± | 0.01ª | |
| Catechin | 0.37 | ± | 0.02b | 0.69 | ± | 0.00a | |
| Epicatechin | 0.40 | ± | 0.01b | 0.61 | ± | 0.02ª | |
| 4-Hydroxybenzoic | NQ | 0.19 | ± | 0.00a | |||
| Rutin | 2.31 | ± | 0.06b | 2.88 | ± | 0.03ª | |
| Quercetin | 0.09 | ± | 0.00b | 0.12 | ± | 0.02ª | |
| Kaempferol | 0.05 | ± | 0.00b | 0.04 | ± | 0.00a | |
Values with different letters in the same row are significantly different (p < 0.05). TPC: Total polyphenols content; TFC: Total flavonoid content. EAE: Enzyme-assisted extraction; PLE: Extraction by pressurized liquids. NQ: Not quantifiable.* Optimal validation values.
4. Conclusions
The experimental design of the emerging extraction processes presented in this work allowed an increase in the extraction yield of bioactive compounds such as polyphenols and flavonoids with antioxidant properties compared to a conventional shaking technique. The optimal condition of EAE was 40 U cellulose, 0.75 U tannase, 20 °C, and 15 min. Compared with EA, EAE increased the polyphenol yield and antioxidant capacity by 31% and 3%, respectively. The optimal conditions of PLE were 54% ethanol, 113 °C, and three extraction cycles, increasing the polyphenol yield and antioxidant capacity by 70% and 3%, respectively, compared to EA. PLE showed the highest total polyphenol content and antioxidant capacity among both optimal extracts. Seven phenolic compounds were found in EAE and PLE: gallic acid, catechin, epicatechin, 4-hydroxybenzoic acid, quercetin-3-rutinoside hydrate, quercetin-3-O-rhamnoside, and kaempferol, with rutin predominating, followed by catechin and epicatechin. The phenolic compounds found in grape pomace from pisco production extracted by emerging techniques is the first step to be considered as an alternative in high value-added products, such as new food ingredients, nutraceuticals, sustainable packaging, and others, contributing to sustainability and generating a promising solution to develop products with benefits for human health.
Author Contributions
Conceptualization, I.Q.-F.; data curation, J.P.; formal analysis, J.P. and I.Q.-F.; funding acquisition, I.Q.-F.; investigation, J.P.; methodology, J.P. and I.Q.-F.; project administration, I.Q.-F.; resources, I.Q.-F.; supervision, M.A. and I.Q.-F.; validation, I.Q.-F.; writing—original draft, J.P.; writing—review and editing, J.P., M.A. and I.Q.-F. All authors have read and agreed to the published version of the manuscript. All authors have read and agreed to the published version of the manuscript.
Funding
This research was funded by the National Agency for Research and Development (ANID) through Fondecyt Initiation Grant No. 11230866; Regular Project DIDULS PR-2253856 from the University of La Serena; and support for the national doctoral scholarship (Folio: 21221853).
Informed Consent Statement
Not applicable.
Data Availability Statement
The data used or analyzed during the current study are available from the corresponding author upon reasonable request.
Acknowledgments
The authors thank the Department of Food Engineering of the University of La Serena and the Department of Chemistry and Pharmacy, Pontificia Universidad Católica de Chile. The company Pisco de Chile S.A. (CCU-Control), Sotaqui Plant, IV region, facilitates access to raw materials.
Conflicts of Interest
Pisquera de Chile S.A., responsible for providing the pisco grape pomace used in this study, was not involved in the design of the research, nor in the collection, analysis or interpretation of the data, nor in the preparation of the manuscript or in the decision to submit it for publication.
References
- Coelho, M.C.; Pereira, R.N.; Rodrigues, A.S.; Teixeira, J.A.; Pintado, M.E. The Use of Emergent Technologies to Extract Added Value Compounds from Grape By-Products. Trends Food Sci Technol 2020, 106, 182–197. [Google Scholar] [CrossRef]
- Piñeiro, Z.; Aliaño-González, M.J.; González-de-Peredo, A. V.; Palma, M.; de Andrés, M.T. Microwave-Assisted Extraction of Non-Coloured Phenolic Compounds from Grape Cultivars. European Food Research and Technology 2022, 248, 1883–1901. [Google Scholar] [CrossRef]
- Castillo-Vergara, M.; Alvarez-Marin, A.; Carvajal-Cortes, S.; Salinas-Flores, S. Implementation of a Cleaner Production Agreement and Impact Analysis in the Grape Brandy (Pisco) Industry in Chile. J Clean Prod 2015, 96, 110–117. [Google Scholar] [CrossRef]
- Mollica, A.; Scioli, G.; Valle, A. Della; Cichelli, A.; Novellino, E.; Bauer, M.; Kamysz, W.; Llorent-Martínez, E.J.; Córdova, M.L.F. De; Castillo-López, R.; et al. Phenolic Analysis and in Vitro Biological Activity of Red Wine, Pomace and Grape Seeds Oil Derived from Vitis Vinifera l. Cv. Montepulciano d’abruzzo. Antioxidants 2021, 10. [CrossRef]
- Solari-Godiño, A.; Lindo-Rojas, I.; Pandia-Estrada, S. Determination of Phenolic Compounds and Evaluation of Antioxidant Capacity of Two Grapes Residues (Vitis Vinifera) of Varieties Dried: Quebranta (Red) and Torontel (White). Cogent Food Agric 2017, 3. [Google Scholar] [CrossRef]
- Allcca-Alca, E.E.; León-Calvo, N.C.; Luque-Vilca, O.M.; Martínez-Cifuentes, M.; Pérez-Correa, J.R.; Mariotti-Celis, M.S.; Huamán-Castilla, N.L. Hot Pressurized Liquid Extraction of Polyphenols from the Skin and Seeds of Vitis Vinifera L. Cv. Negra Criolla Pomace a Peruvian Native Pisco Industry Waste. Agronomy 2021, 11. [Google Scholar] [CrossRef]
- Chamorro, S.; Viveros, A.; Alvarez, I.; Vega, E.; Brenes, A. Changes in Polyphenol and Polysaccharide Content of Grape Seed Extract and Grape Pomace after Enzymatic Treatment. Food Chem 2012, 133, 308–314. [Google Scholar] [CrossRef] [PubMed]
- Fernández, K.; Vega, M.; Aspé, E. An Enzymatic Extraction of Proanthocyanidins from País Grape Seeds and Skins. Food Chem 2015, 168, 7–13. [Google Scholar] [CrossRef] [PubMed]
- Gligor, O.; Mocan, A.; Moldovan, C.; Locatelli, M.; Crișan, G.; Ferreira, I.C.F.R. Enzyme-Assisted Extractions of Polyphenols – A Comprehensive Review. Trends Food Sci Technol 2019, 88, 302–315. [Google Scholar] [CrossRef]
- Da Silva, L.C.; Viganó, J.; Sanches, V.L.; De Souza Mesquita, L.M.; Pizani, R.; Rostagno, M.A. Simultaneous Extraction and Analysis of Apple Pomace by Gradient Pressurized Liquid Extraction Coupled In-Line with Solid-Phase Extraction and on-Line with HPLC. Food Chem 2023, 407. [Google Scholar] [CrossRef]
- Oladipo, B.; Betiku, E. Process Optimization of Solvent Extraction of Seed Oil from Moringa Oleifera: An Appraisal of Quantitative and Qualitative Process Variables on Oil Quality Using D-Optimal Design. Biocatal Agric Biotechnol 2019, 20. [Google Scholar] [CrossRef]
- Quispe-Fuentes, I.; Vega-Gálvez, A.; Campos-Requena, V.H. Antioxidant Compound Extraction from Maqui (Aristotelia Chilensis [Mol] Stuntz) Berries: Optimization by Response Surface Methodology. Antioxidants 2017, 6. [Google Scholar] [CrossRef]
- Poblete, J.; Quispe-Fuentes, I.; Aranda, M.; Vega-Gálvez, A. Application of Vacuum and Convective Drying Processes for the Valorization of Pisco Grape Pomace to Enhance the Retention of Its Bioactive Compounds. Waste Biomass Valorization 2023. [Google Scholar] [CrossRef]
- Association of Official Analytical Chemists AOAC: Official Methods of Analysis; 1990.
- Bailey, M.J.; Biely, P.; Poutanen, K. Interlaboratory Testing of Methods for Assay of Xylanase Activity; 1992; Vol. 23.
- Li, J.; Zhang, S.; Zhang, M.; Sun, B. Novel Approach for Extraction of Grape Skin Antioxidants by Accelerated Solvent Extraction: Box–Behnken Design Optimization. J Food Sci Technol 2019, 56, 4879–4890. [Google Scholar] [CrossRef]
- Singleton, V.L.; Rossi, J.A. Colorimetry of Total Phenolics with Phosphomolybdic-Phosphotungstic Acid Reagents; 1965.
- Grajeda-Iglesias, C.; Salas, E.; Barouh, N.; Baréa, B.; Panya, A.; Figueroa-Espinoza, M.C. Antioxidant Activity of Protocatechuates Evaluated by DPPH, ORAC, and CAT Methods. Food Chem 2016, 194, 749–757. [Google Scholar] [CrossRef] [PubMed]
- Vega-Gálvez, A.; Poblete, J.; Quispe-Fuentes, I.; Uribe, E.; Bilbao-Sainz, C.; Pastén, A. Chemical and Bioactive Characterization of Papaya (Vasconcellea Pubescens) under Different Drying Technologies: Evaluation of Antioxidant and Antidiabetic Potential. Journal of Food Measurement and Characterization 2019, 0, 0. [Google Scholar] [CrossRef]
- Alfaia, C.M.; Costa, M.M.; Lopes, P.A.; Pestana, J.M.; Prates, J.A.M. Use of Grape By-Products to Enhance Meat Quality and Nutritional Value in Monogastrics. Foods 2022, 11. [Google Scholar] [CrossRef]
- Vásquez, P.; Vega-Gálvez, A.; Bernal, C. Production of Antioxidant Pectin Fractions, Drying Pretreatment Methods and Physicochemical Properties: Towards Pisco Grape Pomace Revalue. Journal of Food Measurement and Characterization 2022. [CrossRef]
- Barriga-Sánchez, M.; Campos Martinez, M.; Cáceres Yparraguirre, H.; Rosales-Hartshorn, M. Characterization of Black Borgoña (Vitis Labrusca) and Quebranta (Vitis Vinifera) Grapes Pomace, Seeds and Oil Extract. Food Science and Technology (Brazil) 2022, 42. [Google Scholar] [CrossRef]
- Rodríguez-Ramos, F.; Cañas-Sarazúa, R.; Briones-Labarca, V. Pisco Grape Pomace: Iron/Copper Speciation and Antioxidant Properties, towards Their Comprehensive Utilization. Food Biosci 2022, 47. [Google Scholar] [CrossRef]
- Costa, G.N.S.; Tonon, R. V.; Mellinger-Silva, C.; Galdeano, M.C.; Iacomini, M.; Santiago, M.C.P.A.; Almeida, E.L.; Freitas, S.P. Grape Seed Pomace as a Valuable Source of Antioxidant Fibers. J Sci Food Agric 2019, 99, 4593–4601. [Google Scholar] [CrossRef]
- Beres, C.; Costa, G.N.S.; Cabezudo, I.; da Silva-James, N.K.; Teles, A.S.C.; Cruz, A.P.G.; Mellinger-Silva, C.; Tonon, R. V.; Cabral, L.M.C.; Freitas, S.P. Towards Integral Utilization of Grape Pomace from Winemaking Process: A Review. Waste Management 2017, 68, 581–594. [Google Scholar] [CrossRef]
- Hefied, F.; B Ahmed, Z.; Yousfi, M. Optimization of Ultrasonic-Assisted Extraction of Phenolic Compounds and Antioxidant Activities From Pistacia Atlantica Desf. Galls Using Response Surface Methodology. J Appl Res Med Aromat Plants 2023, 32. [Google Scholar] [CrossRef]
- Bozan, B.; Altinay, R.C. Accelerated Solvent Extraction of Flavan-3-OL Derivatives from Grape Seeds. Food Sci Technol Res 2014, 20, 409–414. [Google Scholar] [CrossRef]
- Nieto, J.A.; Santoyo, S.; Prodanov, M.; Reglero, G.; Jaime, L. Valorisation of Grape Stems as a Source of Phenolic Antioxidants by Using a Sustainable Extraction Methodology. Foods 2020, 9. [Google Scholar] [CrossRef]
- Huamán-Castilla, N.L.; Campos, D.; García-Ríos, D.; Parada, J.; Martínez-Cifuentes, M.; Mariotti-Celis, M.S.; Pérez-Correa, J.R. Chemical Properties of Vitis Vinifera Carménère Pomace Extracts Obtained by Hot Pressurized Liquid Extraction, and Their Inhibitory Effect on Type 2 Diabetes Mellitus Related Enzymes. Antioxidants 2021, 10, 1–14. [Google Scholar] [CrossRef] [PubMed]
- Nieto, A.; Borrull, F.; Pocurull, E.; Marcé, R.M. Pressurized Liquid Extraction: A Useful Technique to Extract Pharmaceuticals and Personal-Care Products from Sewage Sludge. TrAC - Trends in Analytical Chemistry 2010, 29, 752–764. [Google Scholar] [CrossRef]
- Rajha, H.N.; Ziegler, W.; Louka, N.; Hobaika, Z.; Vorobiev, E.; Boechzelt, H.G.; Maroun, R.G. Effect of the Drying Process on the Intensification of Phenolic Compounds Recovery from Grape Pomace Using Accelerated Solvent Extraction. Int J Mol Sci 2014, 15, 18640–18658. [Google Scholar] [CrossRef]
- Ferri, M.; Bin, S.; Vallini, V.; Fava, F.; Michelini, E.; Roda, A.; Minnucci, G.; Bucchi, G.; Tassoni, A. Recovery of Polyphenols from Red Grape Pomace and Assessment of Their Antioxidant and Anti-Cholesterol Activities. N Biotechnol 2016, 33, 338–344. [Google Scholar] [CrossRef]
- Kammerer, D.; Claus, A.; Andreas Schieber, R.C. A Novel Process for the Recovery of Polyphenols from Grape (Vitis Vinifera L.) Pomace. 2005, 70.
- Marianne, L.C.; Lucía, A.G.; de Jesús, M.S.M.; Eric Leonardo, H.M.; Mendoza-Sánchez, M. Optimization of the Green Extraction Process of Antioxidants Derived from Grape Pomace. Sustain Chem Pharm 2024, 37. [Google Scholar] [CrossRef]
- Mangiapelo, L.; Blasi, F.; Ianni, F.; Suvieri, C.; Sardella, R.; Volpi, C.; Cossignani, L. Optimization of a Simple Analytical Workflow to Characterize the Phenolic Fraction from Grape Pomace. Food Bioproc Tech 2023. [CrossRef]
- Wang, Z.; Yang, N.; Zhang, J.; Yuan, C. Skin Cell Wall Ripeness Alters Wine Tannin Profiles via Modulating Interaction with Seed Tannin during Alcoholic Fermentation. Food Research International 2022, 162. [Google Scholar] [CrossRef] [PubMed]
- Sabra, A.; Netticadan, T.; Wijekoon, C. Grape Bioactive Molecules, and the Potential Health Benefits in Reducing the Risk of Heart Diseases. Food Chem X 2021, 12. [Google Scholar] [CrossRef] [PubMed]
Figure 1.
3D surface graphs from Enzyme Assisted Extraction (EAE). A) Total polyphenol content (TPC) (Time-Temperature); B) Antioxidant capacity (Time-Temperature); C) Antioxidant capacity (Tannase-Cellulase). On the color scale: blue (low values), and red (high values).
Figure 1.
3D surface graphs from Enzyme Assisted Extraction (EAE). A) Total polyphenol content (TPC) (Time-Temperature); B) Antioxidant capacity (Time-Temperature); C) Antioxidant capacity (Tannase-Cellulase). On the color scale: blue (low values), and red (high values).
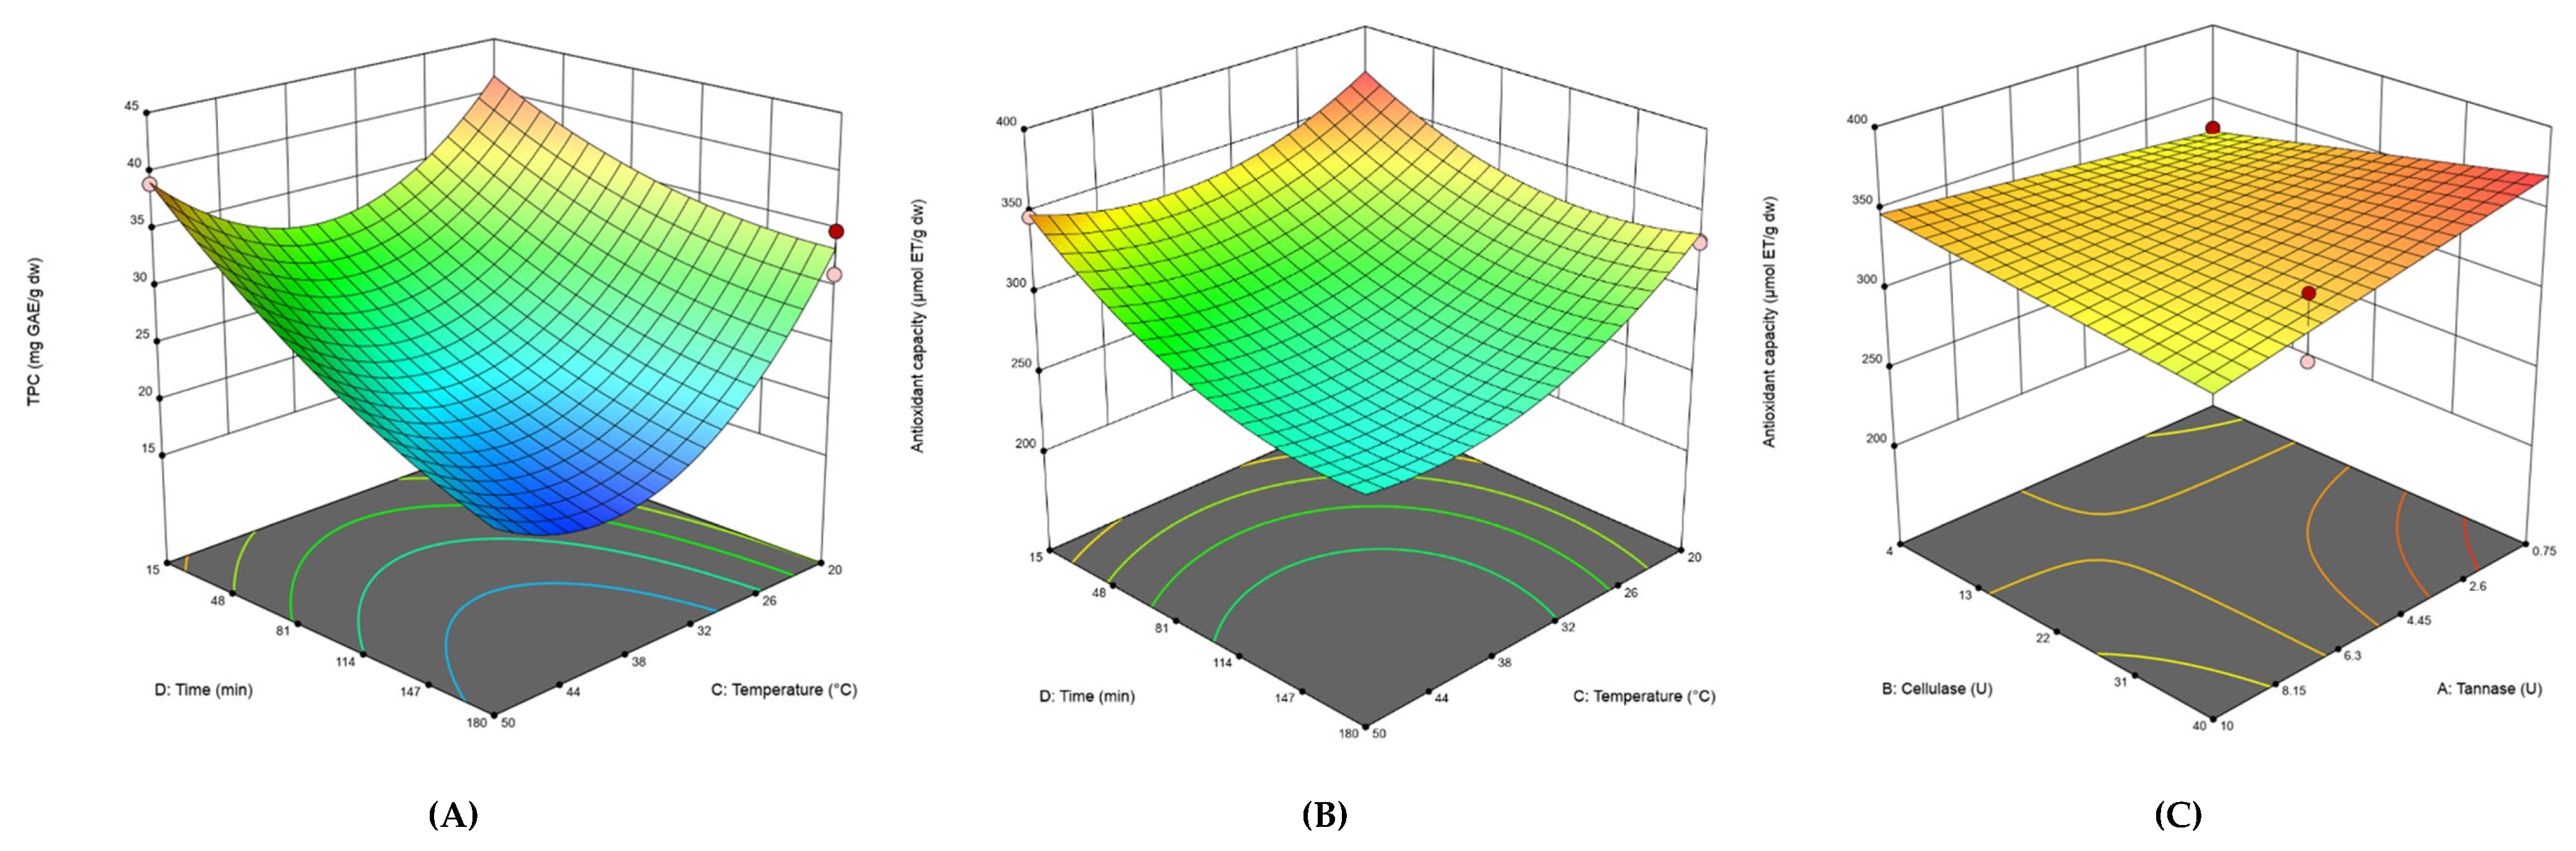
Figure 2.
3D surface graphs from Pressurized Liquids Extraction (PLE). A) Total polyphenol content (TPC)(Ethanol concentration-temperature); B) Total polyphenol content (TPC) (Ethanol concentration-extraction cycles); C) Antioxidant capacity (Ethanol concentration-temperature), and D) Antioxidant capacity (Ethanol concentration-extraction cycles). On the color scale: blue (low values) and red (high values).
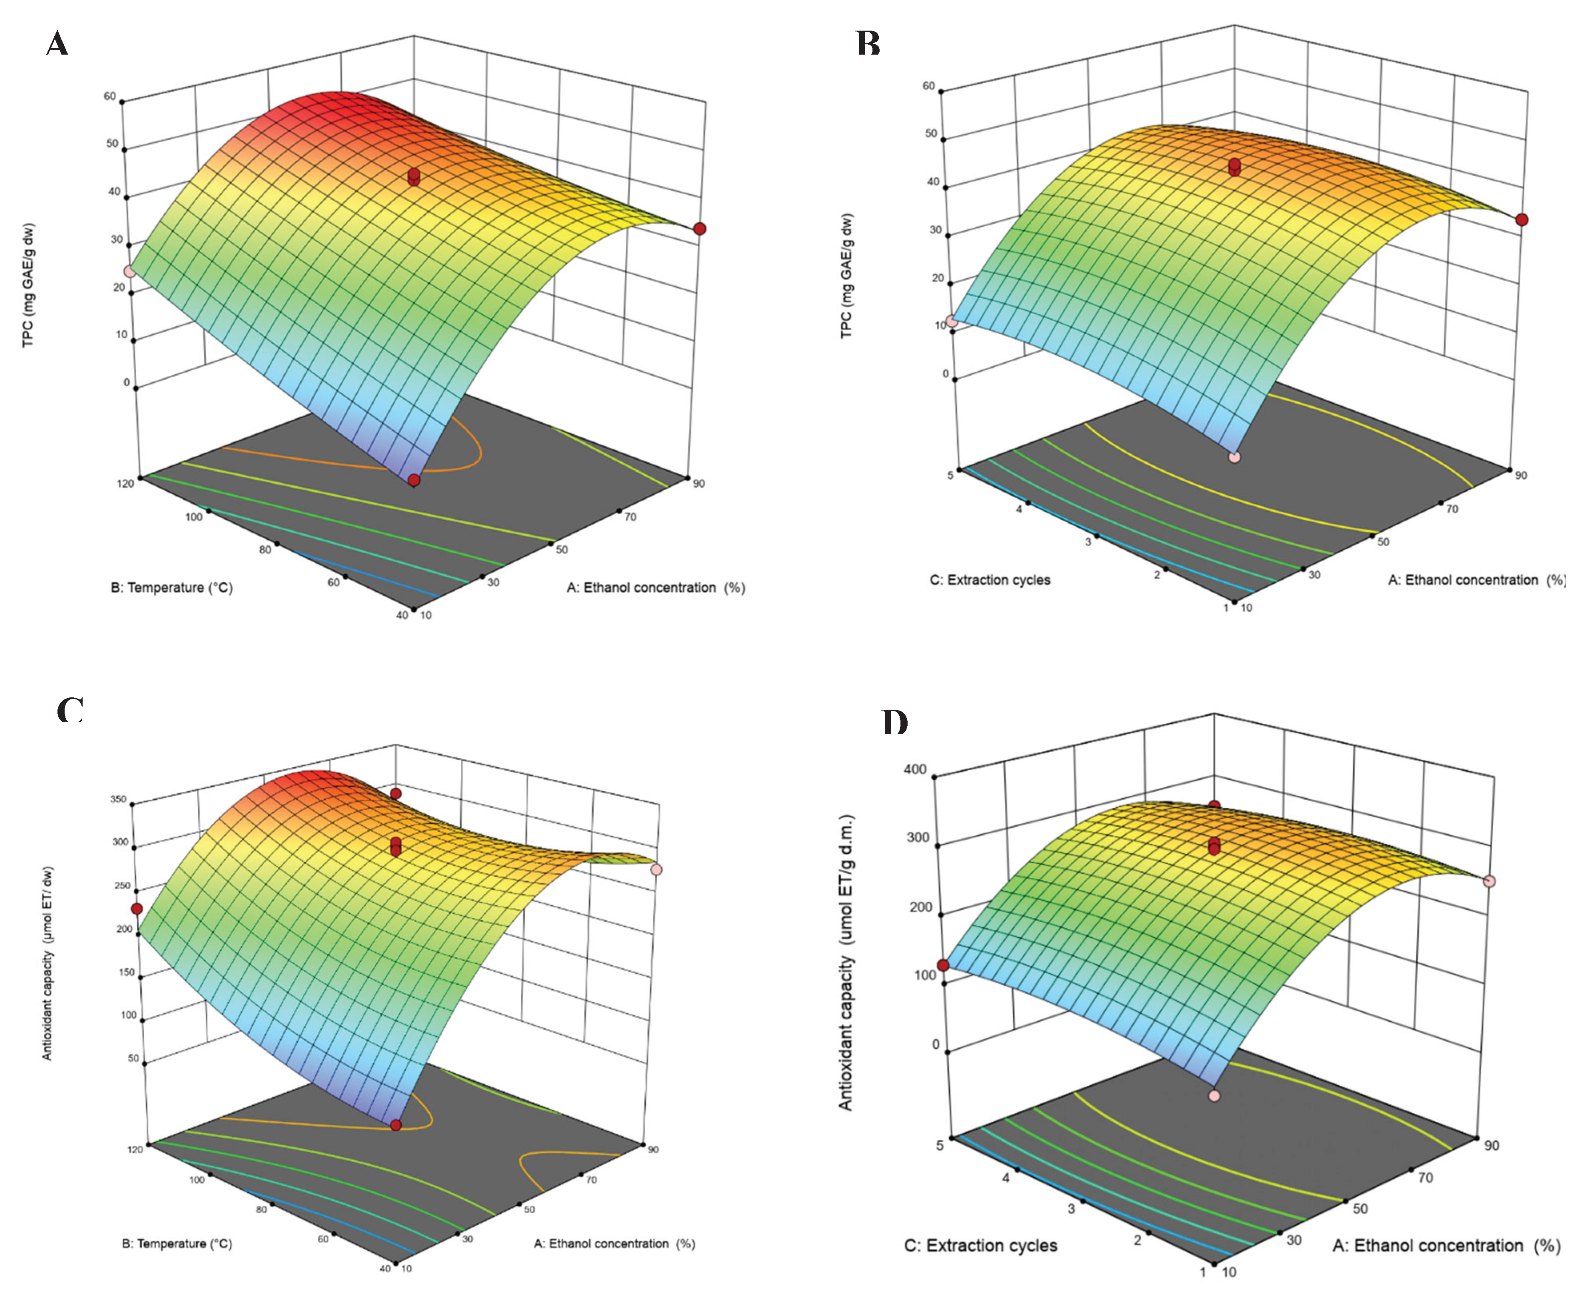
Figure 3.
Profile of phenolic compounds from pisco grape pomace (1) Gallic acid, (2) Catechin, (3) Epicatechin, (4) 4-Hydroxybenzoic acid, (5) Quercetin-3-rutinoside hydrate, (6) Quercetin-3-O-rhamnoside, (7) Kaempferol. Comparison of the profile of phenolic compounds of pisco grape pomace enzyme-assisted extraction (Red) and pressurized liquid extraction (Blue).
Disclaimer/Publisher’s Note: The statements, opinions and data contained in all publications are solely those of the individual author(s) and contributor(s) and not of MDPI and/or the editor(s). MDPI and/or the editor(s) disclaim responsibility for any injury to people or property resulting from any ideas, methods, instructions or products referred to in the content. |
© 2025 by the authors. Licensee MDPI, Basel, Switzerland. This article is an open access article distributed under the terms and conditions of the Creative Commons Attribution (CC BY) license (http://creativecommons.org/licenses/by/4.0/).
Copyright: This open access article is published under a Creative Commons CC BY 4.0 license, which permit the free download, distribution, and reuse, provided that the author and preprint are cited in any reuse.


