
Submitted:
05 June 2025
Posted:
09 June 2025
You are already at the latest version
Abstract
The Ichubamba Yasepan wetlands, in the Andean paramos of Ecuador, suffer heavy metal contamination due to anthropogenic activities and volcanic ash from Sangay, impacting biodiversity and ecosystem services. This quasi-experimental study evaluated the bioaccumulation and tolerance of metals in high Andean species through stratified random sampling and linear transects in two altitudinal ranges. Concentrations of Cr., Pb., Hg., As. and Fe. in water and tissues of eight dominant plant species were analyzed using atomic absorption spectrophotometry, calculating bioaccumulation indices (BAI) and applying principal component analysis (PCA), clustering and linear discriminant analysis (LDA). Twenty-five species from 14 families were identified, predominantly Poaceae and Cyperaceae, with Calamagrostis intermedia as the most relevant (IVI=12.74). The water exceeded regulatory limits for As., Cr., Fe .and Pb., indicating severe contamination. Carex bonplandii showed high ABI for Cr. (47.8), Taraxacum officinale and Plantago australis for Pb., and Lachemilla orbiculata for Hg., while Fe. was widely accumulated. The LDA highlighted differences based on As. and Pb., suggesting physiological adaptations. Pollution threatens biodiversity and human health, but Carex bonplandii and Lachemilla orbiculata have phytoremediation potential.
Keywords:
Accumulation of metals
; differential patterns
; bioaccumulation index
1. Introduction
The Andean paramos, alpine ecosystems located at elevations above 3000 m.a.s.l., are recognized for their high biodiversity and their critical role as water sources for the lower Andean watersheds [1,2]. However, these ecosystems face increasing threats from heavy metal contamination from anthropogenic activities such as mining, intensive agriculture and industrial processes, as well as from natural sources such as volcanic activity [3,4,5]. Metals such as lead (Pb.), cadmium (Cd.), mercury (Hg.), copper (Cu.), arsenic (As.) and nickel (Ni) accumulate in soils and surface waters, particularly in wetlands, seriously affecting flora, fauna and ecosystem services [6,7,8].
Mining activity, predominant in the Andes, is a significant source of Cd., Cu. and Hg. contamination, especially in areas affected by artisanal gold mining, where inadequate practices release these metals into water sources, compromising water quality and human health [4,7]. In addition, volcanic eruptions, such as those of the Sangay volcano in the Ichubamba Yasepan region, disperse ash that releases Cd., Pb. and Hg., exacerbating contamination [9]. It should be noted that these non-essential metals, unlike essential micronutrients such as Fe., Mn., Zn., Cu., Mo. and Ni., are toxic and alter plant physiological processes, reducing biodiversity and affecting soil health [10,11]. Bioaccumulation of these contaminants in species such as rainbow trout (Oncorhynchus mykiss) and agricultural crops represents a significant risk to human health through the food chain [8].
The bioavailability of heavy metals in volcanic soils is influenced by factors such as pH, soil texture and organic matter, which facilitates their uptake by plants and their entry into food webs [12]. Recent studies have reported serious toxicological effects, such as an increased incidence of thyroid cancer in regions with high exposure to heavy metals from volcanic ash, highlighting the implications for public health [13]. In addition, leaching of ash deposits and rainfall runoff aggravate contamination in surrounding areas, intensified by anthropogenic activities and natural geological processes [9,14].
To mitigate these impacts, strategies such as phytoremediation have shown potential to absorb and stabilize heavy metals, using plant species adapted to contaminated environments [15,16]. Likewise, bioremediation with metal-reducing bacteria and the implementation of sustainable agricultural practices offer promising solutions, although their effectiveness depends on the local ecological context [17,18,19].
In this context, the relationships between tolerance and bioaccumulation of metals in plants of the wetlands of the protected area are analyzed in order to identify groups and discriminating markers that allow the identification of differential patterns of bioaccumulation of heavy metals in plant species and the existence of specific physiological mechanisms of absorption and retention, with the objective of creating strategies for the management and conservation of wetlands in the medium and long term.
2. Materials and Methods
2.1. Study Area
Ichubamba Yasepan protected area has an area of 4,790.13 hectares and is located in Guamote County, Chimborazo Province, Ecuador, in the Ecuadorian Andes, at latitude 2° 5’ 9.47“South and longitude 78° 29’ 38.64” West. This area is part of Ecuador’s National System of Protected Areas (SNAP) and is ecologically characterized by its paramo ecosystems, with an altitudinal range that oscillates between 3448 and 4120 meters above sea level. The climate is typical of high mountains, with an average annual temperature of 7.2° C and an annual rainfall of 1246.6 millimeters per square meter. The geology of the area is marked by volcanic soils and the presence of 154.75 hectares of wetlands. Rainwater runs off from the mountains to the east and is collected in the middle zone, where it forms the Yasipan River that runs from the east to the west of the protected area (Figure 1).
The methodological scheme used is as follows (Figure 2).
2.2. Floristic Inventory
The wetlands were stratified in two altitudinal ranges: lower (3440 to 3640 m.a.s.l.) and upper (3640.1 to 3840 m.a.s.l.), with areas of 1744.32 and 1542.26 hectares, respectively. Grids of 100 x 100 meters were applied using Arc GIS software version 10.8, resulting in 196 cells: 154 in the lower stratum and 42 in the upper stratum (Figure 3).
Stratified random sampling was used to determine the sample, which is a robust methodology for conducting flora inventories, as it allows different subgroups to be adequately represented. Its main objective is to divide the population into strata that are internally homogeneous, but heterogeneous among themselves, which improves the precision of the estimates. The correct definition of the strata was key, considering the altitude factor. This method has proven to be effective in ecological studies by improving data representativeness and minimizing geographic and ecological gaps [20]. In addition, it balances the sampling effort between strata and reduces the overall variance of the mean estimator, improving the reliability of flora characterization [21]. Previous research has confirmed that this approach improves statistical efficiency compared to simple random sampling, especially in populations with high heterogeneity [22].
The sample in each stratum was calculated using the sample size equation for finite populations:
Where (N) is the population size, (Z) is the confidence level, (p) is the expected proportion, (e) is the margin of error and n is the sample, a sample of 130 was determined, then the proportionality constant was calculated with the formula: Κ=n/N obtaining a constant of 0.66:

Table 1.
Sample calculation.
| Altitudinal stratum | Number of cells | Sample per stratum |
| Upper | 42x 0,66 | 28 |
| Lower | 154x 0,66 | 102 |
| TOTAL | 196 | 130 |
Linear transects were applied for the collection of flora data, the design was based on walking in straight and segmented lines, depending on the characteristics of the landscape and the need to minimize sampling biases [23,24]. Each transect was 100 m. long and 2 m. wide [25].
During data collection, the species present were identified, recording their diversity and abundance [26]. Samples not recognized in the field were collected and transferred to the Herbarium of the Escuela Superior Politécnica de Chimborazo (Espoch), where they were cleaned by removing external residues, then pressed for preservation and subsequent identification.
2.3. Bioaccumulation of Metals in Wetlands
The first step was to analyze the concentration of metals in the water of the 10 wetlands for the following parameters: Pb., Hg., As., Cr. and Fe., 2 samples were taken for each wetland collected in multiple locations to take into account the spatial variability of contamination and the dynamics of metals [30,31]. Samples were collected early in the morning in containers suitable for preserving their characteristics [32].
The analysis of the samples was performed by Atomic Absorption Spectrophotometry (AAS), which is widely used for the detection of specific metals. Flame AAS and graphite furnace AAS were used, which are effective for the analysis of trace metals [33,34]. Special attention was paid to the detection limits of the method and possible interferences. The analyses were performed in the laboratory of basic sciences and bromatology of the Faculty of Livestock Sciences of Espoch. To ensure the accuracy and reliability of the results, quality control measures were applied, such as the use of certified reference materials and the performance of duplicate analyses that improves the integrity of the results [35]. The results were validated by one-way ANOVA statistical analysis to assess the significance of samples from different locations [31]
The second step was to analyze the concentration of metals in roots, stems and leaves in 8 plant species that presented the highest values of the importance value index (IVI) due to their ecological relevance. Collection was performed uniformly to ensure that samples represent the variability of the wetland ecosystem
Once collected, plant samples were subjected to appropriate pretreatment including washing to remove surface contaminants and air drying. Before grinding, the leaves, stem and roots of each plant were separated to obtain a powder that facilitates digestion and analysis. Acid digestion with nitric acid (HNO₃) and hydrochloric acid (HCl) was applied which is often used to effectively extract metal concentrations from plant tissues [36,37].
Atomic Absorption Spectroscopy (AAS) was then used, in particular for Hg, considering that AAS can be optimized with techniques such as cold vapor generation to improve detection limits [38].
Finally, the bioaccumulation factor (BAF) was calculated, which is defined as the ratio between the concentration of a metal in plant tissues (mg/kg) and its concentration in water (mg/l) [39,40]. This factor provides information on the efficiency of the plant to absorb and accumulate metals in relation to their concentrations in the environment, which is essential for evaluating the phytoremediation potential and its implications for food safety [41,42].
The bioaccumulation rate is quantified by the formula: BAI= CP / CA
2.4. Multivariate Statistical Analysis
For the analysis of the data, a main table was constructed: in the columns were placed the variables corresponding to the species and in the rows the concentrations of the different metals. The MULTBIPLOT software version 16.430.0.0, which allows handling multiple variables and facilitates the visualization of complex relationships, was used [43]. The following methods were applied:
To Identify the main patterns of metal accumulation in the studied species and tissues, principal component analysis (PCA) was applied which is a statistical technique to reduce the dimensionality of complex data by transforming correlated variables into uncorrelated principal components. The first component captures the largest variance, and the following ones, decreasing variances, revealing significant patterns. Mathematically, PCA centers the data, calculates the covariance matrix, and obtains eigenvalues and eigenvectors, projecting the data onto the upper eigenvector subspace [44,45,46].
PCA is applied in various fields such as image processing, genetics, and social and environmental sciences [47,48]. Its ability to handle diverse data makes it a versatile tool for data analysis.
For PCA, the data were standardized using the formula: ; where X is the original value, μ is the mean of the variable and σ is the standard deviation, then the covariance matrix was calculated using the formula: , then the eigenvalues and eigenvectors of the covariance matrix were obtained: Sν=λν where v is the eigenvector and λ is the corresponding eigenvalue, then the principal components were formed. Finally, the Hj biplot visualization was generated which allows to simultaneously represent the observations and variables in a two-dimensional space, the coordinates of the observations are equal to F=XA where A are the first two eigenvectors scaled by the square root of their respective eigenvalues and the coordinates of the variables are equal to where V is the eigenvector matrix and Λ is the diagonal matrix of eigenvalues.
Cluster analysis allowed the grouping of the data of the variables under study, ensuring that the objects within the same cluster are more similar to each other, grouping was applied using K-means, widely used for its computational efficiency and simplicity. This method divides the data into K clusters by iteratively assigning data points to the cen-troid of the nearest cluster and recalculating the centroids until convergence is reached. K-means is especially effective for large data sets [49].
Linear discriminant analysis (LDA) was applied to construct a linear discriminant function that maximizes the separation between different classes. A fundamental principle of LDA is the optimization of the ratio of the between-class variance to the within-class variance, thus improving classification performance [50]. The assumptions of normality of the predictor variables and homogeneity of the variance-covariance matrices between groups were verified [51].
Once the model was established, cross-validation was used which helps to assess the predictive ability of the model with unanalyzed data, which is imperative to avoid overfitting [52].
3. Results
3.1. Composition and Structure of Wetlands
The plant community studied is composed of 25 species belonging to 14 botanical families, with Poaceae and Cyperaceae as the most important families, together representing about 30%. Asteraceae, with three species, stands out for its diversity and moderate distribution. Families such as Rosaceae and Geraniaceae also play a significant role, although with fewer species. In contrast, families such as Solanaceae and Iridaceae have a minimal contribution, indicating a restricted presence.
Calamagrostis intermedia, stands out for its probable association with grassland habitats, species such as Carex pichinchensis and Eleocharis sp. show adaptations to humid conditions, while Asteraceae, with three species recorded, reflects a moderate ecological participation. Together, these patterns determine an ecosystem dominated by grasses and sedges, adapted to the wetlands, with a moderate floristic richness and a plant structure influenced by a few key families.
Table 2.
Density and relative frequency and importance value index of wetland species.
| Family | Species | %Relative Density | %Relative Frequency | Importance Value Index - IVI |
| Apiaceae | Eryngium humile | 3,87 | 2,7 | 3,28 |
| Apiaceae | Daucus montanus | 2,83 | 2,22 | 2,53 |
| Plantaginaceae | Plantago australis | 8,19 | 5,56 | 6,38 |
| Asteraceae | Gnaphalium spicatum | 1,80 | 2,7 | 2,25 |
| Cyperaceae | Eleocharis sp | 3,64 | 4,44 | 4,04 |
| Asteraceae | Diplostephium ericoides | 2,99 | 2,2 | 3,16 |
| Campanulaceae | Centropogon solisii | 2,43 | 1,11 | 1,77 |
| Lamiaceae | Clinopodium nubigenum | 7,31 | 3,33 | 4,82 |
| Ericaceae | Vaccinium floribundum | 2,99 | 2,1 | 2,61 |
| Fabaceae | Trifolium amabile | 1,29 | 2,41 | 3,35 |
| Fabaceae | Medicago polymorpha | 3,15 | 1,11 | 2,13 |
| Geraniaceae | Geranium laxicaule | 4,85 | 5,56 | 5,20 |
| Polygonaceae | Rumex acetosella | 4,64 | 6,67 | 5,15 |
| Iridaceae | Tigridia pavonia | 1,03 | 2,70 | 1,87 |
| Lamiaceae | Stachys elliptica | 2,43 | 2,10 | 2,32 |
| Cyperaceae | Carex pichinchensis | 3,64 | 2,10 | 2,93 |
| Orobanchaceae | Lamourouxia virgata | 5,50 | 2,33 | 3,42 |
| Poaceae | Agrostis perennans | 1,86 | 5,56 | 3,71 |
| Poaceae | Calamagrotis intermedia | 7,76 | 17,78 | 12,74 |
| Rosaceae | Lachemilia orbiculata | 7,19 | 6,67 | 7,93 |
| Geraniaceae | Geranium diffudum | 3,15 | 2,22 | 2,69 |
| Asteraceae | Taraxacum Officinale | 5,61 | 6,67 | 4,90 |
| Cyperaceae | Carex Bonplandii | 6,67 | 6,43 | 6,57 |
| Rubiaceae | Galium hypocarpium | 3,64 | 2,22 | 2,93 |
| Solanaceae | Solanum nigrescens | 1,54 | 1,11 | 1,32 |
The analysis of the composition and structure of the vegetation in the wetlands reveals a structure dominated by species of high ecological relevance. Among these, Calamagrotis intermedia (Poaceae) is positioned as the most outstanding species, with an IVI of 12.74, reflecting a combination of high frequency and density, which suggests a wide distribution and a marked adaptation to local environmental conditions. It is followed by Lachemilia orbiculata (Rosaceae), which also has considerable ecological value, although with a lower frequency. The relative importance of these species points to a pattern of functional dominance that could influence the structure and dynamics of the ecosystem (Figure 4).
Other species such as Plantago australis and Clinopodium nubigenum have high density values, but a more localized distribution, which translates into moderate IVI, showing their relevance in specific sectors of the wetland. In contrast, species such as Solanum nigrescens and Tigridia pavonia show small values, indicating a low ecological representativeness, possibly linked to a restricted distribution or specific environmental requirements.
3.2. Concentration of Metals in Water
The quantitative chemical analysis of the water samples reveals a significant transgression of the permissible limits established by the Ecuadorian Institute of Standardization Standard for drinking water INEN 1108 and the Official Mexican Standard for environmental health, water for human use and consumption NOM -127-SSA1 and the Unified Text of Secondary Legislation of the Ministry of Environment (TULSMA) for various heavy metals. Specifically, the average concentration of arsenic (2.5825 mg/l) exceeds the thresholds for human consumption and preservation of aquatic biota by orders of magnitude. Similarly, chromium (0.1525 mg/l) and iron (0.623 mg/l) present values that double or triple the regulatory limits for both quality criteria. Lead (0.0106 mg/l) exhibits a slight but relevant exceedance of the standard.
Table 3.
Concentration of metals in the water of the wetland.
| Parameters | Average(mg/l) | Maximum allowed value for drinking water | Maximum allowable value for flora and fauna preservation | Water quality according to the Standard | |
| INEN 1108-NOM -127-SSA1) | TULSMA | ||||
| As. | 2,5825 | 0,01 | 0,05 | x | x |
| Cr. | 0,1525 | 0,05 | 0,05 | x | x |
| Fe. | 0,623 | 0,3 | 0,3 | x | x |
| Pb. | 0,0106 | 0,01 | 0,01 | x | x |
| Hg. | 0,00381 | 0,006 | 0,0002 | ✓ | x |
The non-compliance of the water in the wetlands for most of the parameters analyzed implies a potential risk to both human health and the ecological integrity of the wetlands. The marked elevation in the concentration of As. suggests a source of contamination of considerable impact, linked to anthropogenic activities or geochemical processes inherent in the area. The presence of chromium, iron and lead at elevated levels points to multifactorial contamination.
3.3. Concentration of Metals in Plant Segments
Analysis of metal distribution reveals differential uptake and translocation strategies. The exclusive accumulation of Cr. in the roots of Carex bonplandii suggests an efficient radical uptake with limited translocation to aerial tissues, as a defense mechanism against its toxicity. In contrast, Pb. was detected in all species, albeit in low concentrations, with a homogeneous distribution in Taraxacum officinale indicative of efficient translocation, while its absence in Plantago australis roots raises the possibility of alternative uptake pathways.
Table 4.
Concentration of metals in segments of floristic species.
| Name | Segment | Cr. | Pb. | Hg. | As. | Fe. |
| Lachemilla Orbiculata | Raíz | 0,00 | 0,03 | 1,31 | 1,91 | 50,00 |
| Lachemilla Orbiculata | Tallo | 0,00 | 0,19 | 0,00 | 1,84 | 45,00 |
| Lachemilla Orbiculata | Hojas | 0,00 | 0,12 | 0,00 | 1,93 | 55,00 |
| Carex Bonplandii | Raíz | 21,88 | 0,02 | 0,00 | 1,99 | 40,00 |
| Carex Bonplandii | Tallo | 0,00 | 0,10 | 0,00 | 2,09 | 48,00 |
| Carex Bonplandii | Hojas | 0,00 | 0,06 | 0,00 | 2,11 | 30,00 |
| Taraxacum Officinale | Raíz | 0,00 | 0,44 | 0,00 | 2,46 | 36,00 |
| Taraxacum Officinale | Tallo | 0,00 | 0,40 | 0,00 | 2,48 | 34,00 |
| Taraxacum Officinale | Hojas | 0,00 | 0,39 | 0,00 | 2,57 | 50,00 |
| Rumex Acetosella L. | Raíz | 0,00 | 0,01 | 0,00 | 2,93 | 58,24 |
| Rumex Acetosella L. | Tallo | 0,00 | 0,07 | 0,00 | 2,90 | 67,20 |
| Rumex Acetosella L. | Hojas | 0,00 | 0,13 | 0,00 | 2,99 | 31,36 |
| Calamagrostis Intermedia | Raíz | 0,00 | 0,10 | 0,00 | 3,20 | 40,32 |
| Calamagrostis Intermedia | Tallo | 0,00 | 0,03 | 0,00 | 3,04 | 38,08 |
| Calamagrostis Intermedia | Hojas | 0,00 | 0,11 | 0,00 | 3,04 | 56,00 |
| Eleocharis sp. | Raíz | 0,00 | 0,16 | 0,00 | 3,18 | 62,72 |
| Eleocharis sp. | Tallo | 0,00 | 0,00 | 0,00 | 3,19 | 56,45 |
| Eleocharis sp. | Hojas | 0,00 | 0,06 | 0,00 | 3,13 | 68,99 |
| Plantago Australis | Raíz | 0,00 | 0,00 | 0,00 | 3,18 | 50,18 |
| Plantago Australis | Tallo | 0,00 | 0,43 | 0,00 | 3,22 | 60,21 |
| Plantago Australis | Hojas | 0,00 | 0,13 | 0,00 | 3,19 | 37,63 |
| Clinopodium nubigenum | Raíz | 0,00 | 0,26 | 0,00 | 3,34 | 65,23 |
| Clinopodium nubigenum | Tallo | 0,00 | 0,19 | 0,00 | 3,26 | 75,26 |
| Clinopodium nubigenum | Hojas | 0,00 | 0,11 | 0,00 | 3,29 | 35,12 |
The marked accumulation of Hg in the roots of Lachemilla orbiculata contrasts with the absence of translocation to stems and leaves, suggesting a radical retention mechanism to protect photosynthetic tissues. Despite the high concentration of As. in water, plants showed moderate concentrations with a uniform distribution in their different parts, implying efficient uptake and translocation, but with a possible limitation in total accumulation as a tolerance strategy.
Finally, Fe. showed high concentrations in all species, reflecting its bioavailability and generalized absorption capacity, although the variability in distribution among roots, stems and leaves suggests interspecific differences in translocation and storage, linked to the particular physiological needs of each species in the bog.
3.4. Bioaccumulation Index (ABI)
The ABI in various plant species shows a marked selectivity in the uptake of heavy metals. Specifically, Carex bonplandii showed a high capacity to bioaccumulate Cr. with an ABI of 47.8, while the other species showed zero uptake. It should be noted that Pb. was bioaccumulated by all the species analyzed, with particularly high values in Taraxacum officinale and Plantago australis despite their low concentration in the water.
Table 5.
Calculation of the bioaccumulation index.
| Species | Cr. | Pb. | Hg. | As. | Fe. |
| Lachemilla Orbiculata | 0,0 | 10,6 | 114,6 | 0,7 | 80,3 |
| Carex Bonplandii | 47,8 | 5,6 | 0,0 | 0,8 | 63,1 |
| Taraxacum Officinale | 0,0 | 38,5 | 0,0 | 1,0 | 64,2 |
| Rumex Acetosella | 0,0 | 6,7 | 0,0 | 1,1 | 83,9 |
| Calamagrostis Intermedia | 0,0 | 7,6 | 0,0 | 1,2 | 71,9 |
| Eleocharis sp. | 0,0 | 6,7 | 0,0 | 1,2 | 100,7 |
| Plantago Australis | 0,0 | 17,8 | 0,0 | 1,2 | 79,2 |
| Clinopodium nubigenum | 0,0 | 17,3 | 0,0 | 1,3 | 94,0 |
Hg. presented an extreme and specific bioaccumulation pattern with Lachemilla orbiculata, indicating a unique capacity to concentrate this metal present in low aquatic concentrations. On the other hand, As., despite its high concentration in the water of the wetland, showed low ABI values in all species, suggesting the presence of tolerance or exclusion mechanisms. Fe. stood out for being highly bioaccumulated by all the species studied, with IBAs ranging from 63.1 to 100.7, with Eleocharis sp. being the species with the highest accumulation.
The observed variability in bioaccumulation between species and metals underlines the complexity of plant-pollutant interactions, and the high accumulation of Pb. and Hg. in certain species could imply risks for the food chain through consumption by herbivores. The limited bioaccumulation of As., despite its high availability, suggests physiological adaptations of these plants to As toxicity.
3.5. Principal Component Analysis
The analysis reveals significant patterns of heavy metal accumulation across the four main axes, which explain 91.8% of the total variance (Figure 5).
Axis 1 (32.96%) is characterized by As, showing a strong accumulation in the roots of Eleocharis sp. and Clinopodium nubigenum species, as well as in the leaves of Calamagrostis Intermedia. This suggests that these species are exposed to soils with high As concentration, with the roots acting as the main uptake site. In addition, Cr also contributes to this axis, with notable accumulation in the roots of Carex Bonplandii.
Axis 2 (23,232%) is characterized by Pb., with significant accumulation in the parts of Taraxacum Officinale and Rumex Acetosella highlighting them as bioaccumulator species. Some Fe. accumulation is also observed in the leaves of Eleocharis sp and in the stem of Rumex Acetosella, suggesting a combined exposure to multiple metals in these species.
Axis 3 (21.05%) is dominated by Cr and Hg. The roots of Carex Bonplandii accumulate Cr, while the root of Lachemilla Orbiculata shows accumulation of Hg. This reflects multifactorial contamination in their habitat (Figure 6).
Axis 4 (14.597%), characterized by Fe, highlights the accumulation of this metal in the stem and root of Calamagrostis Intermedia also in the leaves of Rumex Acetosella, Clinopodium nubigenum and Plantago Australis, suggesting that Fe. is a common element in many plant parts.
3.6. Cluster Analysis
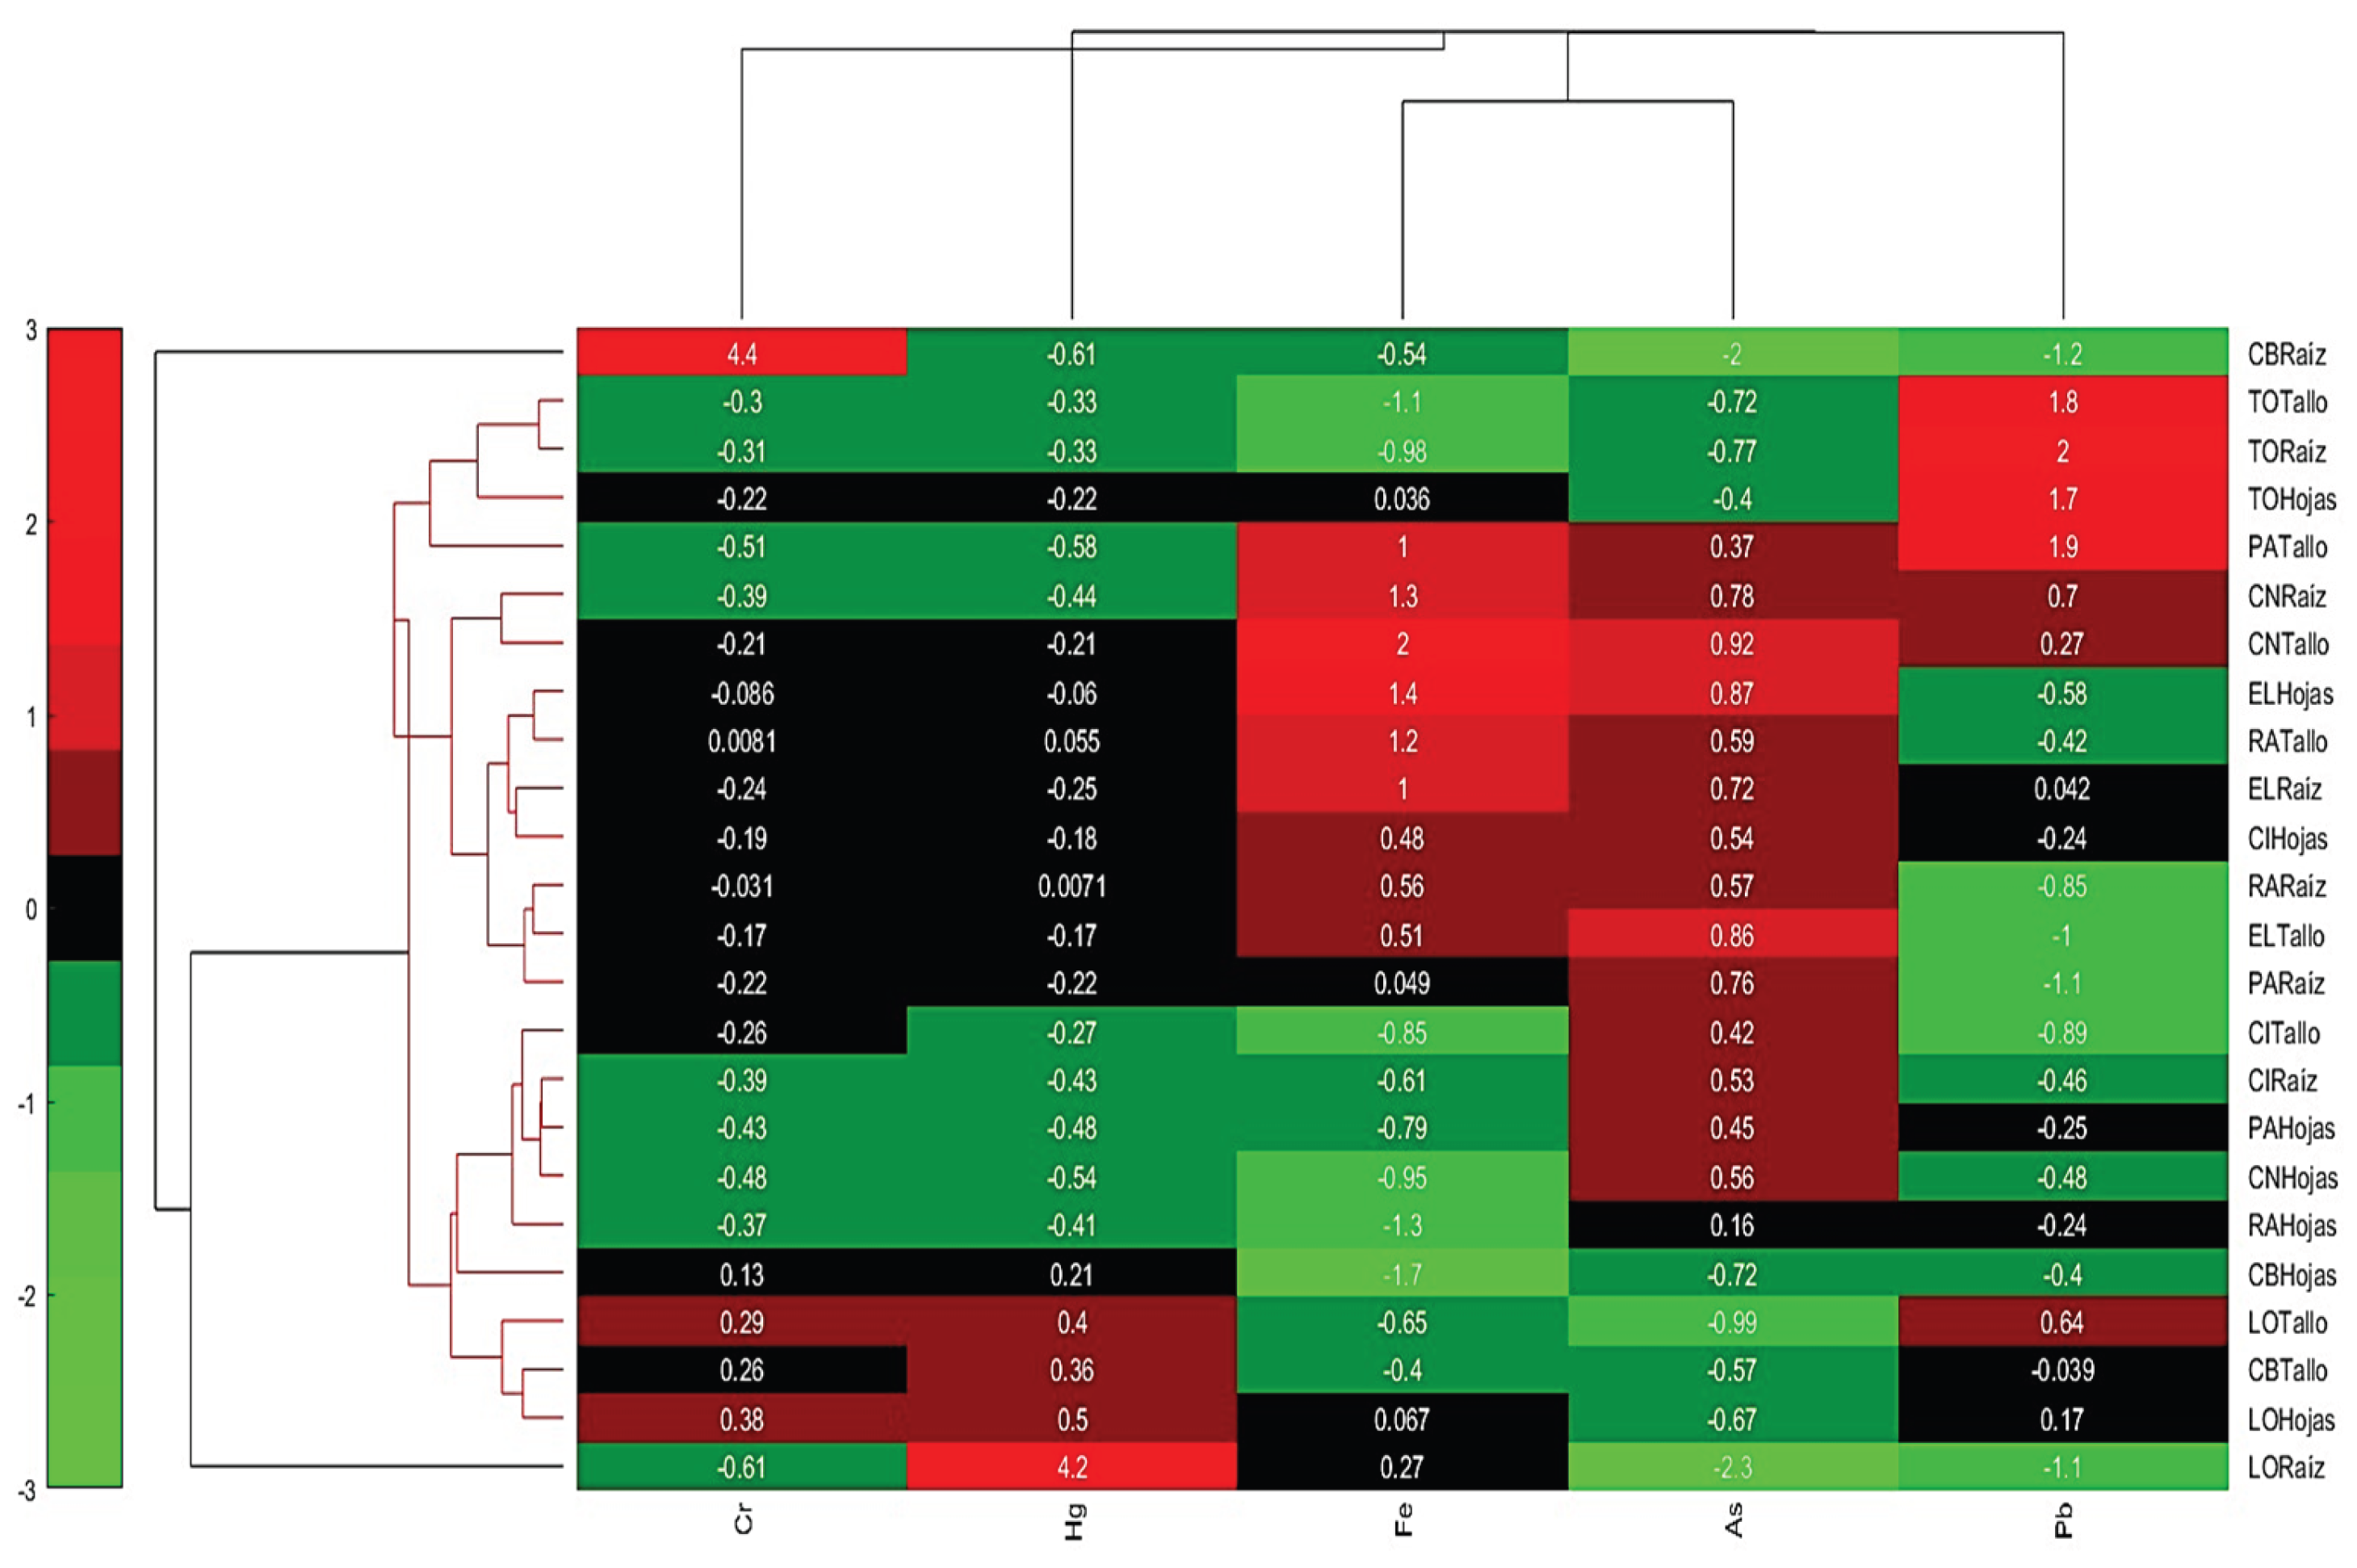
Cluster 1 shows similar accumulation patterns for Cr. and Pb., indicating that these metals tend to accumulate together in certain parts of plants, mainly in the root of Carex bonplandii, which has extremely high values for Cr. and Pb. It should also be noted that the stem of Plantago australis and Clinopodium nubigenum have moderate Pb. accumulations (Figure 7).
Cluster 2, has lower accumulations of Cr. and Pb., but shows some accumulation of Fe. and As. The root of Calamagrostis intermedia has a high value for Fe., and the root of Eleocharis sp. has a low value for As, indicating lower relative accumulation. This cluster also suggests that leaves of Clinopodium nubigenum, Rumex acetosella, and Plantago australis, along with roots and stems of Calamagrostis intermedia, accumulate Fe. and As. more moderately.
Cluster 3, this group has low accumulations of all metals, especially Lachemilla orbiculata, which shows low negative values for some metals. This indicates that Lachemilla orbiculata and aerial parts of Carex bonplandii have medium accumulation of specific heavy metals.
3.7. Discriminant Analysis
Linear discriminant analysis (LDA) classified 8 plant species using concentrations of five metals, the model generated six discriminant functions, of which the first two explain 99.5% of the variance.
Table 6.
Ranking Function Coefficients.
| Species | ||||||||
| Lachemilla Orbiculata | Carex Bonplandii | Taraxacum Officinale | Rumex Acetosella L. | Calamagrostis Intermedia | Eleocharis sp. | Plantago Australis | Clinopodium nubigenum | |
| Cr. | 4,5 | 5,3 | 5,8 | 6,7 | 7,0 | 7,2 | 7,3 | 7,5 |
| Pb. | -98,8 | -117,6 | -97,1 | -169,6 | -174,8 | -184,8 | -167,9 | -176,0 |
| Hg. | -11,4 | -21,1 | -22,2 | -32,3 | -33,9 | -35,1 | -33,7 | -35,0 |
| As. | 861,0 | 957,6 | 1119,9 | 1339,7 | 1405,2 | 1445,4 | 1447,4 | 1495,8 |
| Fe. | 1,1 | 1,1 | 1,19 | 1,544 | 1,5 | 1,7 | 1,588 | 1,6 |
| segment | 7,217 | 7,323 | 7,345 | 8,262 | 8,3 | 8,8 | 8,6 | 8,9 |
| (constant) | -844,0 | -1035,3 | -1415,0 | -2014,2 | -2211,4 | -2346,2 | -2347,6 | -2509,8 |
Function 1, which explains 98.2% of the variance with a canonical correlation of 0.997, is dominated by arsenic (As.), with a standardized coefficient of 1.147 and a correlation of 0.866. This function clearly separates Lachemilla orbiculata and Carex bonplandii, with low concentrations of As, from Clinopodium nubigenum and Plantago australis, with high concentrations. Function 2, which contributes an additional 1.3% of variance (canonical correlation of 0.841), is influenced by lead (Pb.) (coefficient = 1.034, correlation = 0.886), with Taraxacum officinale standing out for its high Pb. concentrations.
4. Discussion
4.1. Implications of Metal Contamination on Wetland Plant Species
Wetlands, dominated by Poaceae and Cyperaceae, are key ecosystems for ecological balance, but face pressures due to heavy metal contamination. This contamination induces oxidative stress and physiological alterations that affect the growth, reproduction and structure of vegetation, decreasing biodiversity and favoring tolerant species [53,54,55]. Some species develop hyperaccumulation mechanisms, although excessive contamination reduces the vitality of the flora and modifies the composition of plant communities, evidencing the vulnerability of these ecosystems [56,57].
The presence of heavy metals above regulatory limits represents environmental and health risks, with bioaccumulation in the trophic chain that threatens human health through the consumption of contaminated agricultural products and livestock [58]. These contaminants, which are non-biodegradable, are associated with carcinogenic effects, neurotoxicity and immunosuppression [59,60]. Low floristic richness and biodiversity loss reflect the ecological impact, requiring rigorous monitoring and updating of regulatory frameworks to mitigate adverse effects through interdisciplinary strategies [61,62,63].
4.2. Bioaccumulation
The bioaccumulation of heavy metals in plants shows heterogeneous patterns, with marked differences between metals and species. As. shows low bioaccumulation rates, mainly in roots, suggesting specific regulatory mechanisms for its uptake and root retention [64]. In contrast, Pb. and Hg. exhibit more pronounced accumulation dynamics; for example, Taraxacum officinale shows efficient bioaccumulation and translocation of lead, increasing the risk of trophic transfer [65,66]. The high accumulation of mercury in certain species highlights ecological concerns due to its potential for ecosystem impact. Accumulation profiles are determined by specific retention and translocation mechanisms, as in Carex bonplandii, which selectively retains Cr. in roots, possibly as protection against toxicity in photosynthetic tissues [66]. Fe., on the other hand, accumulates widely due to its bioavailability and metabolic role, reflecting the influence of environmental and phylogenetic factors on uptake strategies [65].
4.3. Group Identification, Discriminant Markers and Complex Relationships
Wetlands face ecological alterations due to the accumulation of heavy metals that modulate plant uptake and generate trophic bioaccumulation risks for herbivores and humans [67,68]. Root uptake is the main route of incorporation, with some species showing tolerance to As. and Pb. through biochemical adaptations, such as the synthesis of compounds that mitigate toxicity [69,70]. However, exposure to these metals induces physiological stress, with increased reactive oxygen species (ROS), implying metabolic costs that affect plant growth and reproduction [71,72]. Discriminant analysis highlights that As and Pb. concentrations significantly differentiate wetland and paramos species, reflecting distinct ecological niches. [73].
The bioavailability of Pb., limited by its binding to organic matter, favors its accumulation in roots, with specific tolerance in wetland species adapted to high levels [74,75]. As, influenced by interactions with iron oxides, shows greater accumulation in specific species, possibly due to anthropogenic or geological sources [76]. Competitive interactions, such as between Fe. and As or Pb. and Cr., are key to understanding effects on plant health and diversity [77]. Concentrations of Pb., Hg, and As. underscore the need for continuous monitoring and management strategies to mitigate risks to livestock and human health, integrating environmental and agricultural health measures in Andean regions.
The accumulation of heavy metals such as lead (Pb.), mercury (Hg.) and chromium (Cr.) in wetlands represents a trophic risk due to their transfer to aerial parts of plants, promoting bioaccumulation in the food web and affecting the health of terrestrial and aquatic organisms [78,79]. Species such as Carex bonplandii and Lachemilla orbiculata stand out for their ability to absorb Hg. and Cr., showing potential for phytoremediation by acting as biological filters without compromising their vitality [80,81].
In addition, macrophytes such as Azolla filiculoides employ rhizofiltration and phytoaccumulation mechanisms to stabilize pollutants, improving water quality and minimizing leaching [82,83]. These findings underscore the importance of investigating hyperaccumulating species to optimize remediation strategies in wetlands affected by industrial runoff, strengthening the conservation of these ecosystems [84,85].
5. Conclusions
The high Andean wetlands of Ichubamba Yasepan harbor a plant community with moderate floristic richness, characterized by the presence of 25 species belonging to 14 botanical families, where the high density and frequency of Poaceae, mainly Calamagrostis intermedia and Cyperaceae, with Carex bonplandii and Eleocharis sp. underline their fundamental ecological role. The limited representation of other families suggests more restricted ecological niches.
Analysis of the water in the wetlands revealed severe heavy metal contamination, with concentrations of arsenic, chromium, iron and lead that significantly exceeded the permissible limits for human consumption and the preservation of biota established by national and international regulations. Only mercury showed levels partially within the standards for human consumption, but not for ecosystem protection. This contamination, with possible anthropogenic, geochemical and ash fall origins, represents a threat, with the potential to alter biodiversity and biogeochemical cycles inherent to the wetlands.
The study showed differential patterns of heavy metal bioaccumulation in the plant species analyzed, indicating the existence of specific physiological mechanisms of absorption, retention and translocation. Carex bonplandii showed an exclusive accumulation of chromium in roots, while Taraxacum officinale and Plantago australis stood out for their high bioaccumulation and efficient translocation of lead, implying a higher risk of trophic transfer. Lachemilla orbiculata accumulated high mercury concentrations in roots with minimal translocation. Despite the high concentration of arsenic in the water, species showed low bioaccumulation rates, suggesting exclusion or tolerance mechanisms. Iron was highly bioaccumulated by all species, reflecting its bioavailability and metabolic role. These findings highlight the potential of certain species for phytoremediation, although a thorough assessment of the associated trophic risks is required. Linear discriminant analysis (LDA) performed on the concentrations of five heavy metals in eight plant species reveals a clear differentiation between species based mainly on As. and Pb. lead concentrations.
Author Contributions
Conceptualization: D.F.C.-C. and G.M.A.-C.; methodology, M.L.V.-C., M.V.G-C., and E.D.G.-P.; software, G.M.A.-C.; validation, D.F.C.-C. and M.Y.B.-M.; formal analysis, D.F.C.-C., E.A.M.-J., and G.M.A.-C.; investigation, C.S.T-R., and M.L.V.-C.; writing—original draft preparation, D.F.C.-C. and G.M.A.-C.; writing—review and editing, E.D.G.-P.; visualization, P.V.V.-C. and E.A.M.-J.; supervision, D.F.C.-C. and G.M.A.-C. All authors have read and agreed to the published version of the manuscript.
Funding
This work was supported by the project “IDIPI-324-Determining the Efficient Use of Biopurifying Altoandin Vegetable Species for The Conservation of the Water Resource in the Microbasin of the Cebadas River, Chimborazo Province”, financed by the Escuela Superior Politécnica de Chimborazo through the Dean’s Office of Research (DDI-ESPOCH).
Institutional Review Board Statement
Not applicable.
Informed Consent Statement
Not applicable.
Data Availability Statement
The data presented in this study are available upon request from the corresponding author.
Conflicts of Interest
The authors declare no conflicts of interest.
References
- Bystriakova, N., Tovar, C., Monro, A., Moat, J., Hendrigo, P., Carretero, J., … & Diazgranados, M. (2021). Colombia’s bioregions as a source of useful plants. Plos One, 16(8), e0256457. [CrossRef]
- Valencia, E., Changoluisa, I., Palma, K., Cruz, P., Valencia, D., Ayala, P., … & Puga, D. (2022). Wetland monitoring technification for the ecuadorian andean region based on a multi-agent framework. Heliyon, 8(3), e09054. [CrossRef]
- Capparelli, M., Cabrera, M., Rico, A., Lucas-Solis, O., Alvear-S, D., Vasco, S., … & Moulatlet, G. (2021). An integrative approach to assess the environmental impacts of gold mining contamination in the amazon. Toxics, 9(7), 149. [CrossRef]
- Cano, D., Pizarro, S., Cacciuttolo, C., Peñaloza, R., Yaranga, R., & Gandini, M. (2023). Study of ecosystem degradation dynamics in the peruvian highlands: landsat time-series trend analysis (1985–2022) with arvi for different vegetation cover types. Sustainability, 15(21), 15472. [CrossRef]
- Yang, Y., Bai, X., Lu, J., Zou, R., Ding, R., & Hua, X. (2023). Assessment of five typical environmental endocrine disruptors and thyroid cancer risk: a meta-analysis. Frontiers in Endocrinology, 14. [CrossRef]
- Orellana, E., Custodio, M., Bastos, M., & Ascencion, J. (2020). Heavy metals in agriculture soils from high andean zones and potential ecological risk assessment in peru’s central andes. Journal of Ecological Engineering, 21(8), 108-119. [CrossRef]
- Wingfield, S., Moscoso, A., Quiroga, D., & Ochoa-Herrera, V. (2021). Challenges to water management in ecuador: legal authorization, quality parameters, and socio-political responses. Water, 13(8), 1017. [CrossRef]
- Peñaloza, R., Custodio, M., Cacciuttolo, C., Chanamé, F., Cano, D., & Solorzano, F. (2023). Human health risk assessment for exposure to heavy metals via dietary intake of rainbow trout in the influence area of a smelting facility located in peru. Toxics, 11(9), 764. [CrossRef]
- Khazal, S. and Azeez, D. (2025). Assessment of ground water pollution by heavy metals in kirkuk governorate. Iop Conference Series Earth and Environmental Science, 1449(1), 012092. [CrossRef]
- Vassilev, A., Schwitzguébel, J., Thewys, T., Lelie, D., & Vangronsveld, J. (2004). The use of plants for remediation of metal-contaminated soils. The Scientific World Journal, 4, 9-34. [CrossRef]
- Satchi, K., Mafulul, S., Mélila, M., & Longdet, I. (2024). Exposure to trace elements through <i>rauwolfia vomitoria</i> and <i>argemone mexicana,</i> two medicinal plants at hahotoé-kpogamé, a polluted area in southern togo. American Journal of Bioscience, 12(2), 53-60. [CrossRef]
- Clovis, M., Machumi, F., & Innocent, E. (2020). Assessment of heavy metals in hibiscus sabdariffa calyces and moringa oleifera leaves collected from different areas in tanzania. Journal of Ecobiotechnology, 17-21. [CrossRef]
- Gianì, F., Masto, R., Trovato, M., Franco, A., Pandini, G., & Vigneri, R. (2021). Thyroid stem cells but not differentiated thyrocytes are sensitive to slightly increased concentrations of heavy metals. Frontiers in Endocrinology, 12. [CrossRef]
- Paape, T., Heiniger, B., Domingo, M., Clear, M., Lucas, M., & Pueyo, J. (2022). Genome-wide association study reveals complex genetic architecture of cadmium and mercury accumulation and tolerance traits in medicago truncatula. Frontiers in Plant Science, 12. [CrossRef]
- Butar, E., Permatasari, I., & Sembiring, T. (2022). Phytoremediation of heavy metal contaminated soil by chrysopogon zizanioides l. Iop Conference Series Earth and Environmental Science, 1017(1), 012022. [CrossRef]
- Badawy, W., Sarhan, Y., Duliu, O., Kim, J., Yushin, N., Samman, H., … & Щеглoв, А. (2021). Monitoring of air pollutants using plants and co-located soil—egypt: characteristics, pollution, and toxicity impact. Environmental Science and Pollution Research, 29(14), 21049-21066. [CrossRef]
- Chamba-Eras, I., Griffith, D., Kalinhoff, C., Ramírez, J., & Gázquez, M. (2022). Native hyperaccumulator plants with differential phytoremediation potential in an artisanal gold mine of the ecuadorian amazon. Plants, 11(9), 1186. [CrossRef]
- Atoloye, I., Adesina, I., Sharma, H., Subedi, K., Liang, C., Shahbazi, A., … & Bhowmik, A. (2022). Hemp biochar impacts on selected biological soil health indicators across different soil types and moisture cycles. Plos One, 17(2), e0264620. [CrossRef]
- Kunić, S. (2024). The content of heavy metals in honey as indicators of pollutants. Technol. acta, 17(1), 3-9. [CrossRef]
- Roleček, J., Chytrý, M., Hájek, M. et al. Sampling design in large-scale vegetation studies: Do not sacrifice ecological thinking to statistical purism!. Folia Geobot 42, 199–208 (2007). [CrossRef]
- Shahzad, U., Hanif, M. & Koyuncu, N. A new estimator for mean under stratified random sampling. Math Sci 12, 163–169 (2018). [CrossRef]
- Liu, Z. and Pontius, R. (2021). The total operating characteristic from stratified random sampling with an application to flood mapping. Remote Sensing, 13(19), 3922. [CrossRef]
- Naqinezhad, A., Zare-Maivan, H. & Gholizadeh, H. A floristic survey of the Hyrcanian forests in Northern Iran, using two lowland-mountain transects. J. For. Res. 26, 187–199 (2015). [CrossRef]
- Hiby, L. and Krishna, M. (2001). Line transect sampling from a curving path. Biometrics, 57(3), 727-731. [CrossRef]
- Williams, M. (2008). Assessing diversity of diurnal lepidoptera in habitat fragments: testing the efficiency of strip transects. Environmental Entomology, 37(5), 1313-1322. [CrossRef]
- Young, H., Raab, T., McCauley, D., Briggs, A., & Dirzo, R. (2010). The coconut palm, cocos nucifera, impacts forest composition and soil characteristics at palmyra atoll, central pacific. Journal of Vegetation Science, 21(6), 1058-1068. [CrossRef]
- Chen, Y., Shen, T., Hoang, C., Shi, S., Jiang, J., Condit, R., … & Hubbell, S. (2019). Inferring multispecies distributional aggregation level from limited line transect-derived biodiversity data. Methods in Ecology and Evolution, 10(7), 1015-1023. [CrossRef]
- Höing, A., Quinten, M., Indrawati, Y., Cheyne, S., & Waltert, M. (2013). Line transect and triangulation surveys provide reliable estimates of the density of kloss’ gibbons (hylobates klossii) on siberut island, indonesia. International Journal of Primatology, 34(1), 148-156. [CrossRef]
- Kafle, S. and Pathak, H. (2023). Diversity of orchids in shiureni forest, aadhikhola rural municipality, syangja, nepal. Himalayan Biodiversity, 22-28. [CrossRef]
- Sikdar, P. and Sahu, P. (2009). Understanding wetland sub-surface hydrology using geologic and isotopic signatures. Hydrology and Earth System Sciences, 13(7), 1313-1323. [CrossRef]
- George, M. and Ngole-Jeme, V. (2022). An evaluation of the khubelu wetland and receiving stream water quality for community use. Water, 14(3), 442. [CrossRef]
- Idrees, N., Tabassum, B., Abd Allah, E. F., Hashem, A., Sarah, R., & Hashim, M. (2018). Groundwater contamination with cadmium concentrations in some West U.P. Regions, India. Saudi journal of biological sciences, 25(7), 1365–1368. [CrossRef]
- Kendüzler E, Türker A. Determination of trace cadmium in waters by flame atomic absorption spectrophotometry after preconcentration with 1-nitroso-2-naphthol-3,6-disulfonic acid on Ambersorb 572. Ann Chim. 2005;95(1-2):77-85. [CrossRef]
- Behpour, M., Soltani, N., & Ghoreishi, S. (2010). Simultaneous preconcentration of lead and cadmium ions with methyltrioctylammonium chloride supported on microcrystalline naphthalene and determination by flame atomic absorption spectrometry. European Journal of Chemistry, 1(3), 216-220. [CrossRef]
- Wang, X., Zhang, D., Guan, B., Qi, Q., & Tong, S. (2017). Optimum water supplement strategy to restore reed wetland in the yellow river delta. Plos One, 12(5), e0177692. [CrossRef]
- Göthberg, A., Greger, M., & Bengtsson, B. (2002). Accumulation of heavy metals in water spinach (ipomoea aquatica) cultivated in the bangkok region, thailand. Environmental Toxicology and Chemistry, 21(9), 1934-1939. [CrossRef]
- Tangahu, B., Abdullah, S., Basri, H., Idris, M., Anuar, N., & Mukhlisin, M. (2011). A review on heavy metals (as, pb, and hg) uptake by plants through phytoremediation. International Journal of Chemical Engineering, 2011(1). [CrossRef]
- Bansal, S., Johnson, O., Meier, J., & Zhu, X. (2020). Vegetation affects timing and location of wetland methane emissions. Journal of Geophysical Research Biogeosciences, 125(9). [CrossRef]
- Obaid, H., Ma, L., Nader, S., Hashimi, M., Sharifi, S., Kakar, H., … & Ni, C. (2023). Heavy metal contamination status of water, agricultural soil, and plant in the semiarid region of kandahar, afghanistan. Acs Earth and Space Chemistry, 7(7), 1446-1458. [CrossRef]
- Samuel, P. and Babatunde, B. (2021) Risk Assessment of Heavy Metals in Food Crops at Abandoned Lead-Zinc Mining Site at Tse-Faga, Logo, Lga, Benue State, Nigeria. Journal of Environmental Protection, 12, 624-638. [CrossRef]
- Singh, G., Patel, N., Jindal, T., & Ranjan, M. (2021). Heavy metal contamination in soils and crops irrigated by kali river in uttar pradesh, india. Bulletin of Environmental Contamination and Toxicology, 107(5), 931-937. [CrossRef]
- Singh, S., Dhyani, S., Janipella, R., Chakraborty, S., Pujari, P., Shinde, V., … & Singh, K. (2022). Biomonitoring-supported land restoration to reduce land degradation in intensively mined areas of india. Sustainability, 14(20), 13639. [CrossRef]
- Murillo-Avalos CL, Cubilla-Montilla M, Celestino Sánchez MÁ, Vicente-Galindo P. What environmental social responsibility practices do large companies manage for sustainable development? Corp Soc Responsib Environ Manag. 2021; 28: 153–168. [CrossRef]
- Jolliffe, I. and Cadima, J. (2016). Principal component analysis: a review and recent developments. Philosophical Transactions of the Royal Society a Mathematical Physical and Engineering Sciences, 374(2065), 20150202. [CrossRef]
- Abdi, H. and Williams, L.J. (2010), Principal component analysis. WIREs Comp Stat, 2: 433-459. [CrossRef]
- Rahmani, M. and Atia, G. (2017). Coherence pursuit: fast, simple, and robust principal component analysis. Ieee Transactions on Signal Processing, 65(23), 6260-6275. [CrossRef]
- Liu, A., Zhang, Y., Gehan, E., & Clarke, R. (2002). Block principal component analysis with application to gene microarray data classification. Statistics in Medicine, 21(22), 3465-3474. [CrossRef]
- Luo, L., Bao, S., & Tong, C. (2019). Sparse robust principal component analysis with applications to fault detection and diagnosis. Industrial & Engineering Chemistry Research, 58(3), 1300-1309. [CrossRef]
- Patil, C. and Baidari, I. (2019). Estimating the optimal number of clusters k in a dataset using data depth. Data Science and Engineering, 4(2), 132-140. [CrossRef]
- Losifidis, A., Tefas, A., & Pitas, I. (2015). Class-specific reference discriminant analysis with application in human behavior analysis. Ieee Transactions on Human-Machine Systems, 45(3), 315-326. [CrossRef]
- Pepler, P., Uys, D., & Nel, D. (2017). Discriminant analysis under the common principal components model. Communications in Statistics - Simulation and Computation, 46(6), 4812-4827. [CrossRef]
- Mitterœcker, P. and Bookstein, F. (2011). Linear discrimination, ordination, and the visualization of selection gradients in modern morphometrics. Evolutionary Biology, 38(1), 100-114. [CrossRef]
- Yu L, Kaiyi S, Jie Y and Qiyu K (2021) Evaluation of Heavy Metal Pollutants From Plateau Mines in Wetland Surface Deposits. Front. Environ. Sci. 8:557302. [CrossRef]
- Zhang, Y., Yan, J., Cheng, X., & He, X. (2021). Wetland changes and their relation to climate change in the pumqu basin, tibetan plateau. International Journal of Environmental Research and Public Health, 18(5), 2682. [CrossRef]
- Cushquicullma-Colcha DF, Ati-Cutiupala GM, Guilcapi-Pacheco ED, Villacis-Uvidia JF, Brito-Mancero MY, Vaca-Cárdenas PV, Vasco-Lucio MM, Muñoz-Jácome EA, Vaca-Cárdenas ML. Influence of Altitude and Climatic Factors on the Floristic Composition of the Moorlands of the Guamote Canton, Ecuador: Key Revelations for Conservation. Sustainability. 2025; 17(2):383. [CrossRef]
- Mitchell L, New E, Mahon C. Macromolecular optical sensor arrays. ACS Appl Polym Mater. 2021;3(2):506-30. [CrossRef]
- Maharjan, B., Panday, D., Blanco-Canqui, H., & Mikha, M. (2021). Potential amendments for improving productivity of low carbon semiarid soil. Agrosystems Geosciences & Environment, 4(3). [CrossRef]
- Amer, A.S., Mohamed, W.S. Assessment of Ismailia Canal for irrigation purposes by water quality indices. Environ Monit Assess 194, 862 (2022). [CrossRef]
- Shorinwa, O. and Chukwuemeka, J. (2024). Comparative study of heavy metal content of <i>manihot esculenta</i> tubers and soil in rivers state, nigeria: effect on histology of kidney and liver of wistar rats. Journal of Pharmacy & Bioresources, 21(1), 19-31. [CrossRef]
- Hussain, M., Khan, Z., Naeem, M., Ahmad, K., Awan, M., Alwahibi, M., … & Elshikh, M. (2021). Blood, hair and feces as an indicator of environmental exposure of sheep, cow and buffalo to cobalt: a health risk perspectives. Sustainability, 13(14), 7873. [CrossRef]
- Ajala, L., Ali, E., Obasi, N., Fasuan, T., Odewale, I., Igidi, J., … & Singh, J. (2021). Insights into purification of contaminated water with activated charcoal derived from hamburger seed coat. International Journal of Environmental Science and Technology, 19(7), 6541-6554. [CrossRef]
- Du, H., Le, G., Hou, L., Mao, X., Liu, S., & Huang, K. (2022). Nontoxic concentration of ochratoxin a aggravates renal fibrosis induced by adriamycin/cyclosporine a nephropathy via tgf-β1/smad2/3. Journal of Agricultural and Food Chemistry, 70(43), 14005-14014. [CrossRef]
- Gasparatos, D. (2022). Soil contamination by heavy metals and metalloids. Environments, 9(3), 32. [CrossRef]
- Bărbulescu, A., Barbeș, L., & Dumitriu, C. (2022). Impact of soil pollution on melliferous plants. Toxics, 10(5), 239. [CrossRef]
- Cakaj, A., Lisiak, M., Hańć, A., Małecka, A., Borowiak, K., & Drapikowska, M. (2023). Common weeds as heavy metal bioindicators: a new approach in biomonitoring. Scientific Reports, 13(1). [CrossRef]
- Klym, O. and Stadnytska, O. (2020). Heavy metals in the dandelion and apple tree pollen from the different terrestrial ecosystems of the carpathian region. Acta Scientiarum Polonorum Zootechnica, 18(3), 15-20. [CrossRef]
- Balali-Mood, M., Naseri, K., Tahergorabi, Z., Khazdair, M., & Sadeghi, M. (2021). Toxic mechanisms of five heavy metals: mercury, lead, chromium, cadmium, and arsenic. Frontiers in Pharmacology, 12. [CrossRef]
- Yager, K., Prieto, M., & Meneses, R. (2021). Reframing pastoral practices of bofedal management to increase the resilience of andean water towers. Mountain Research and Development, 41(4). [CrossRef]
- Onyia, P., Ozoko, D., & Ifediegwu, S. (2020). Phytoremediation of arsenic-contaminated soils by arsenic hyperaccumulating plants in selected areas of enugu state, southeastern, nigeria. Geology Ecology and Landscapes, 5(4), 308-319. [CrossRef]
- Cantamessa, S., Massa, N., Gamalero, E., & Berta, G. (2020). Phytoremediation of a highly arsenic polluted site, using pteris vittata l. and arbuscular mycorrhizal fungi. Plants, 9(9), 1211. [CrossRef]
- Zhou, H., Fuzhao, N., Chen, B., Zhu, Y., Yue, X., Zhang, N., … & Xia, Y. (2023). Synergistic reduction of arsenic uptake and alleviation of leaf arsenic toxicity in maize (zea mays l.) by arbuscular mycorrhizal fungi (amf) and exogenous iron through antioxidant activity. Journal of Fungi, 9(6), 677. [CrossRef]
- Liu, S., Pan, L., Chen, J., Wang, Z., Li, Z., Gao, C., … & Hui-lin, Y. (2024). Mechanisms and applications of microbial synthesis of metal nanoparticles in agri-sectors. Environmental Science Nano, 11(7), 2803-2830. [CrossRef]
- Cruzado-Tafur, E., Bierła, K., Torró, L., & Szpunar, J. (2021). Accumulation of as, ag, cd, cu, pb, and zn by native plants growing in soils contaminated by mining environmental liabilities in the peruvian andes. Plants, 10(2), 241. [CrossRef]
- Vasile, G.-G.; Tenea, A.-G.; Dinu, C.; Iordache, A.M.M.; Gheorghe, S.; Mureseanu, M.; Pascu, L.F. Bioavailability, Accumulation and Distribution of Toxic Metals (As, Cd, Ni and Pb) and Their Impact on Sinapis alba Plant Nutrient Metabolism. Int. J. Environ. Res. Public Health 2021, 18, 12947. [CrossRef]
- Baldi, A., Cecchi, S., Grassi, C., Zanchi, C., Orlandini, S., & Napoli, M. (2021). Lead bioaccumulation and translocation in herbaceous plants grown in urban and peri-urban soil and the potential human health risk. Agronomy, 11(12), 2444. [CrossRef]
- Sandhi, A., Yu, C., Rahman, M., & Amin, M. (2022). Arsenic in the water and agricultural crop production system: bangladesh perspectives. Environmental Science and Pollution Research, 29(34), 51354-51366. [CrossRef]
- Ross, A., Mendoza, M., Drenkhan, F., Montoya, N., Baiker, J., Mackay, J., … & Buytaert, W. (2023). Seasonal water storage and release dynamics of bofedal wetlands in the central andes. Hydrological Processes, 37(8). [CrossRef]
- Tshithukhe, G., Motitsoe, S., & Hill, M. (2021). Heavy metals assimilation by native and non-native aquatic macrophyte species: a case study of a river in the eastern cape province of south africa. Plants, 10(12), 2676. [CrossRef]
- Ali, S., Abbas, Z., Rizwan, M., Zaheer, I., Yavaş, İ., Ünay, A., … & Kalderis, D. (2020). Application of floating aquatic plants in phytoremediation of heavy metals polluted water: a review. Sustainability, 12(5), 1927. [CrossRef]
- Goodson, E. and Aziz, T. (2023). Assessing the native plant species for phytoremediation of freshwater bodies in southern ontario, canada. Science Letters, 11(2), 50-58. [CrossRef]
- Morsy, M., Nossier, M., Elsebaay, A., & Abd-Elrahman, S. (2022). Phytoremediation of pb and cd by alfalfa (medicago sativa l.): an applied study in the presence of lettuce plants (lactuca sativa l.). Arab Universities Journal of Agricultural Sciences, 0(0), 0-0. [CrossRef]
- Qayoom, I. and Jaies, I. (2023). Phytoremediation potential of macrophytes against heavy metals, nitrates and phosphates: a review. Environment Conservation Journal, 24(1), 273-280. [CrossRef]
- Hassanzadeh, M., Zarkami, R., & Sadeghi, R. (2021). Uptake and accumulation of heavy metals by water body and azolla filiculoides in the anzali wetland. Applied Water Science, 11(6). [CrossRef]
- Osman, N., Roslan, A., Ibrahim, M., & Hassan, M. (2020). Potential use of pennisetum purpureum for phytoremediation and bioenergy production: a mini review. Asia-Pacific Journal of Molecular Biology and Biotechnology, 14-26. [CrossRef]
- Jin, M., You, M., Lan, Q., Cai, L., & Lin, M. (2021). Effect of copper on the photosynthesis and growth of eichhornia crassipes. Plant Biology, 23(5), 777-784. [CrossRef]
Figure 1.
The main map (A) shows the protected area with topographic and elevation variations and the location of the wetlands with an area of 3286.58 hectares. The regional location maps (B, C, D) show the canton of Guamote, the province of Chimborazo and the location of the province within Ecuador, respectively.
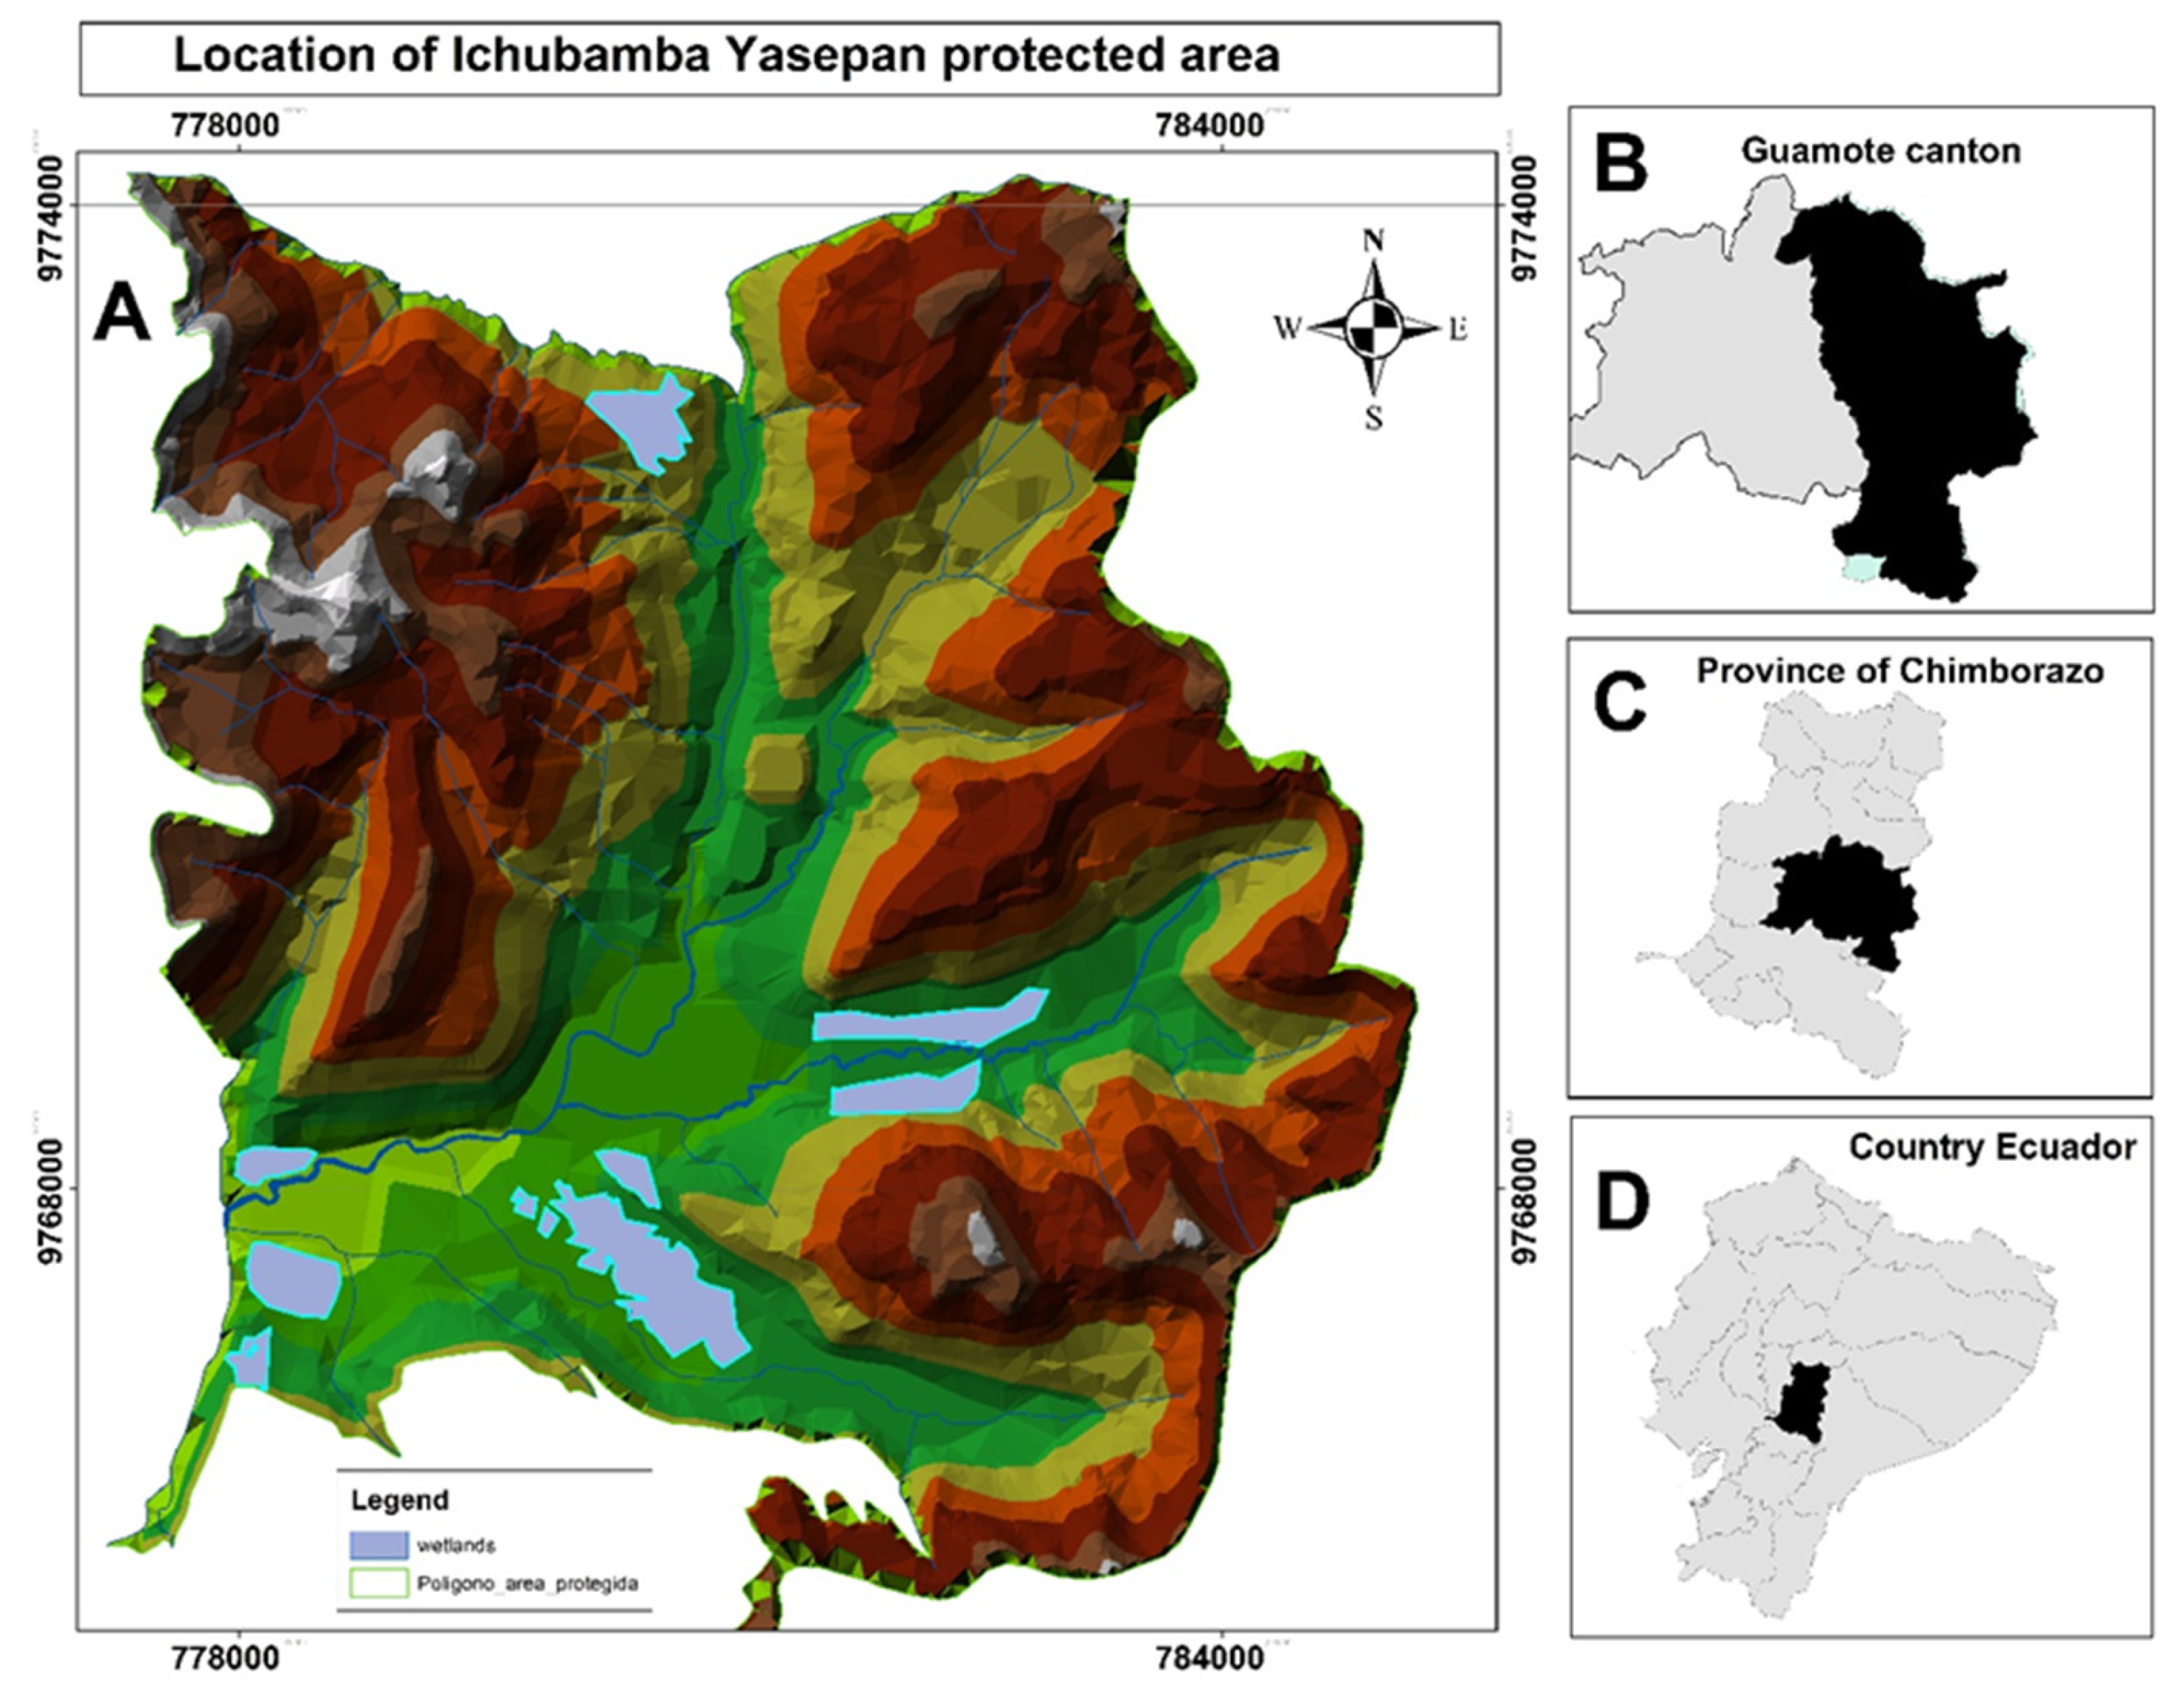
Figure 2.
Methodological research process.
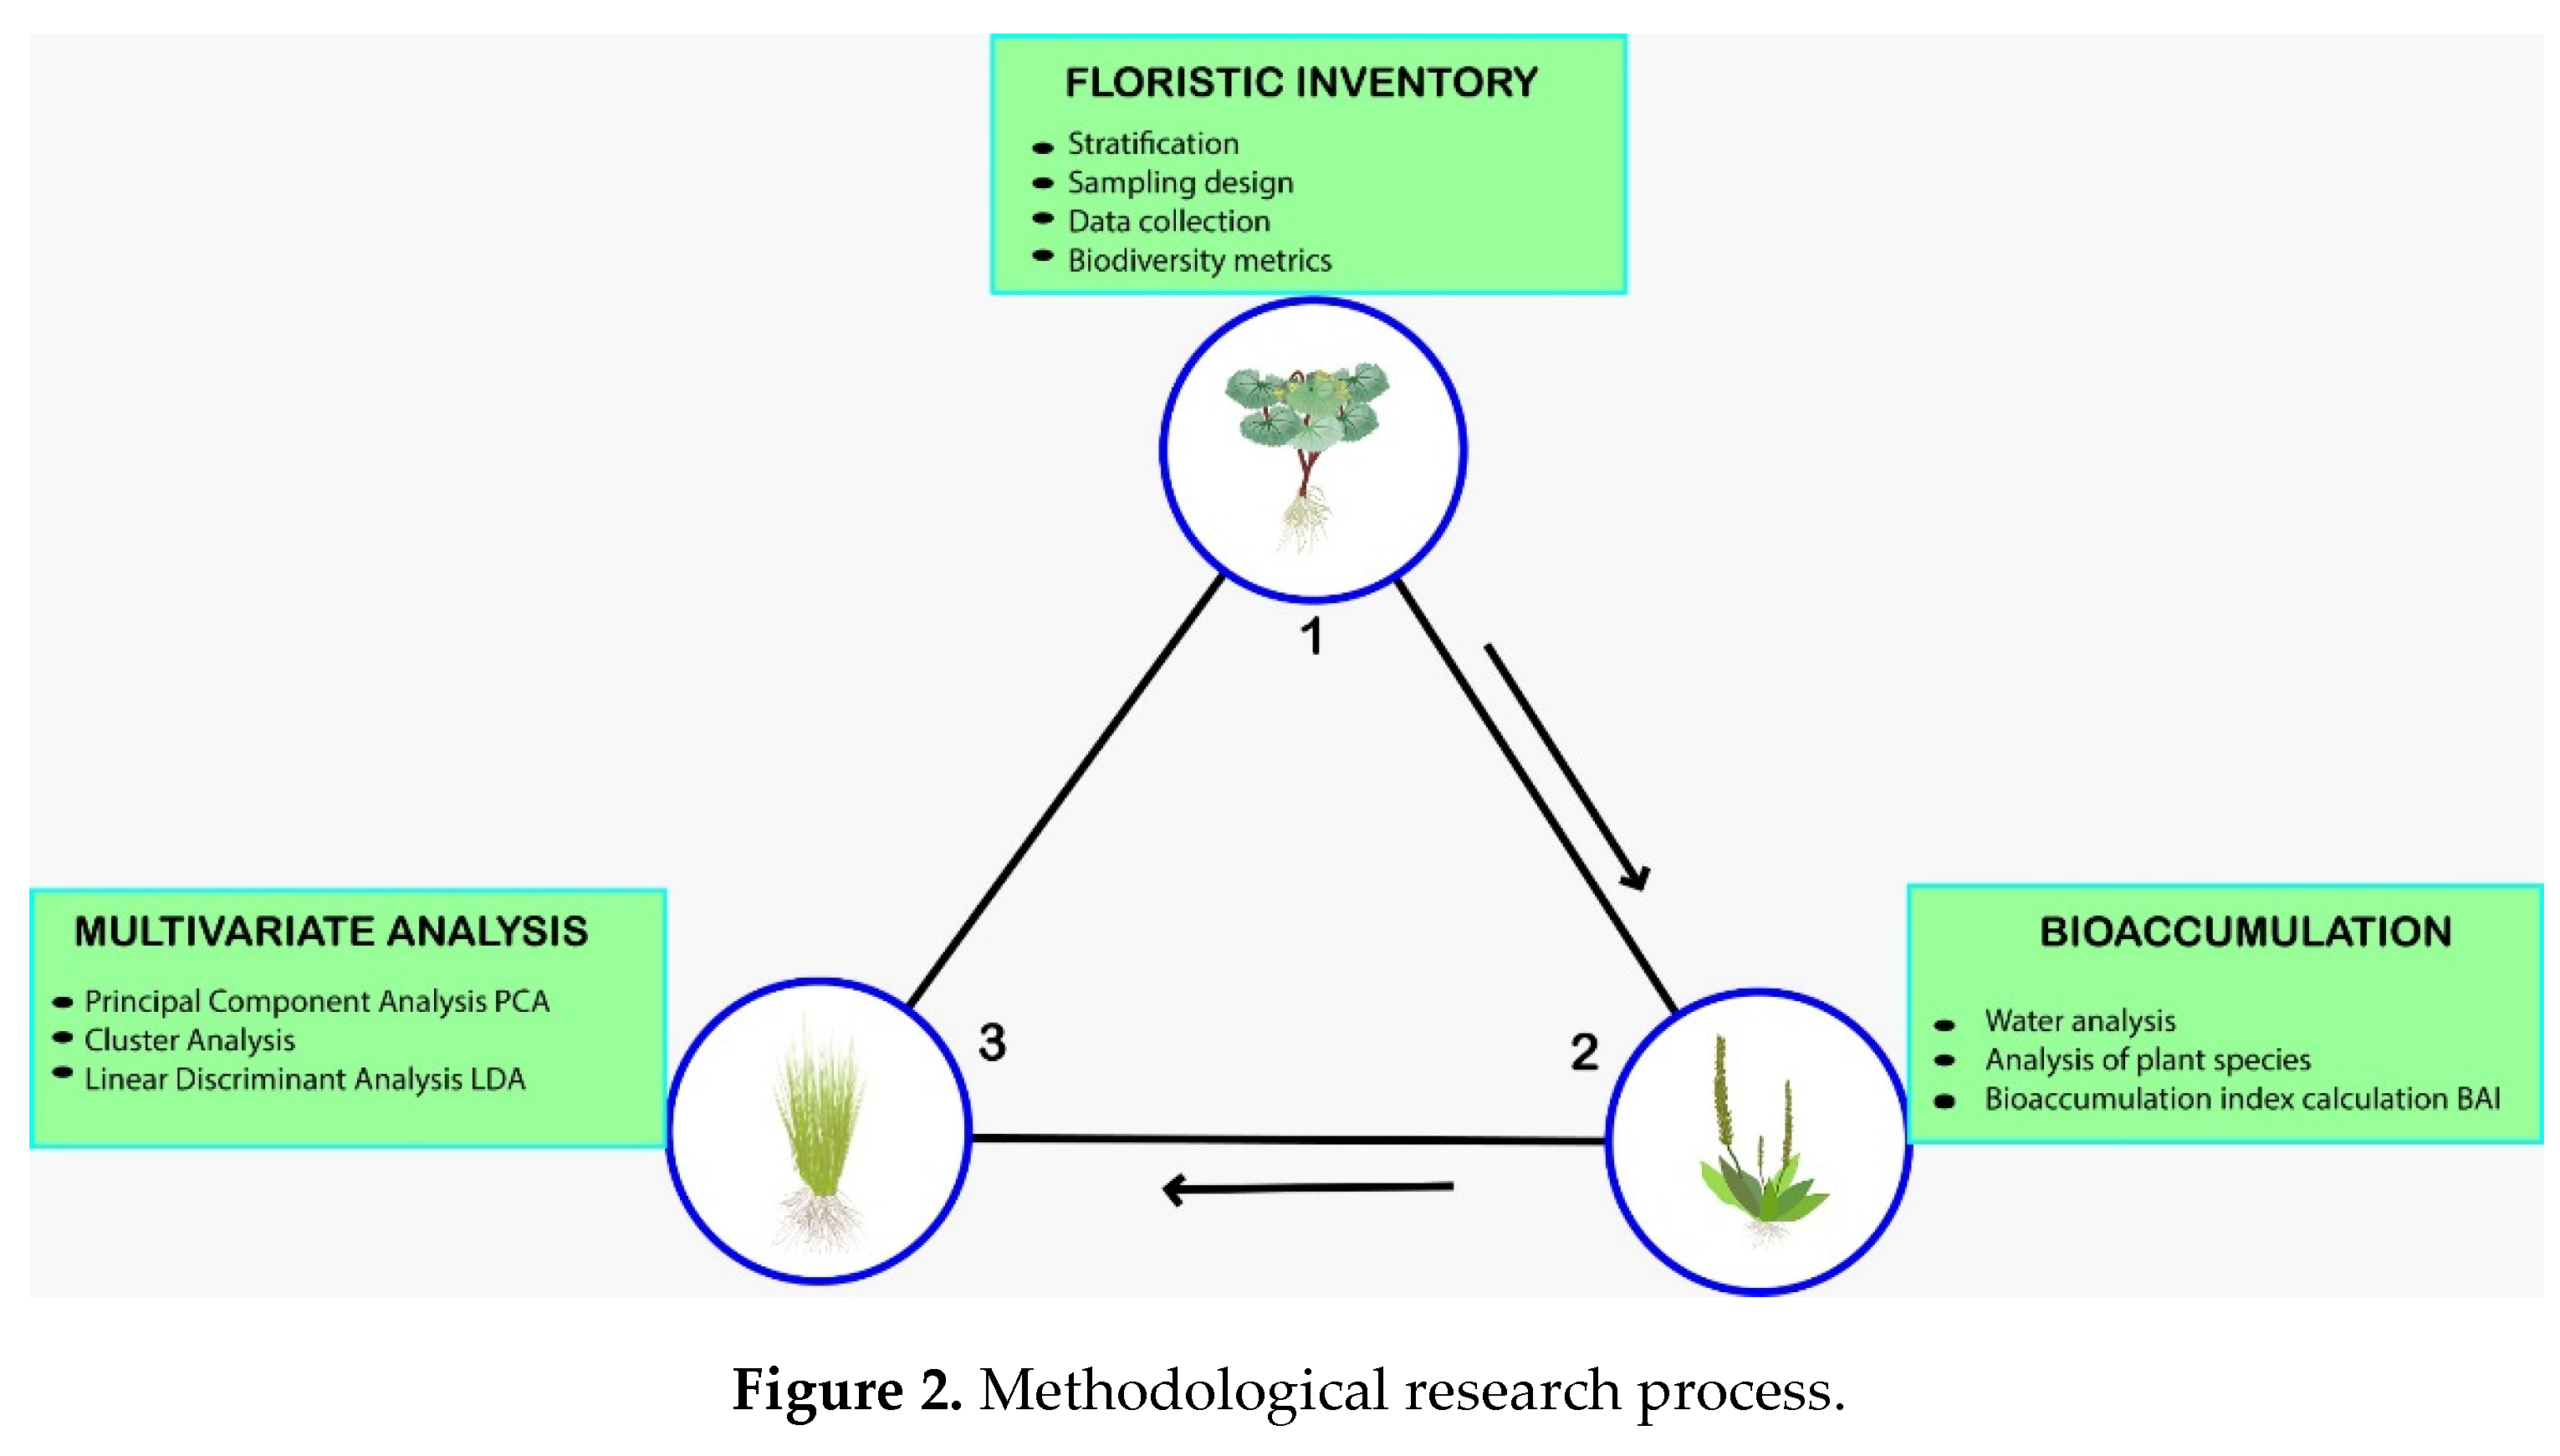
Figure 3.
The map shows the spatial distribution of the wetlands, highlights the delimitation by altitudinal strata and highlights the cells used for stratified random sampling.
Figure 3.
The map shows the spatial distribution of the wetlands, highlights the delimitation by altitudinal strata and highlights the cells used for stratified random sampling.
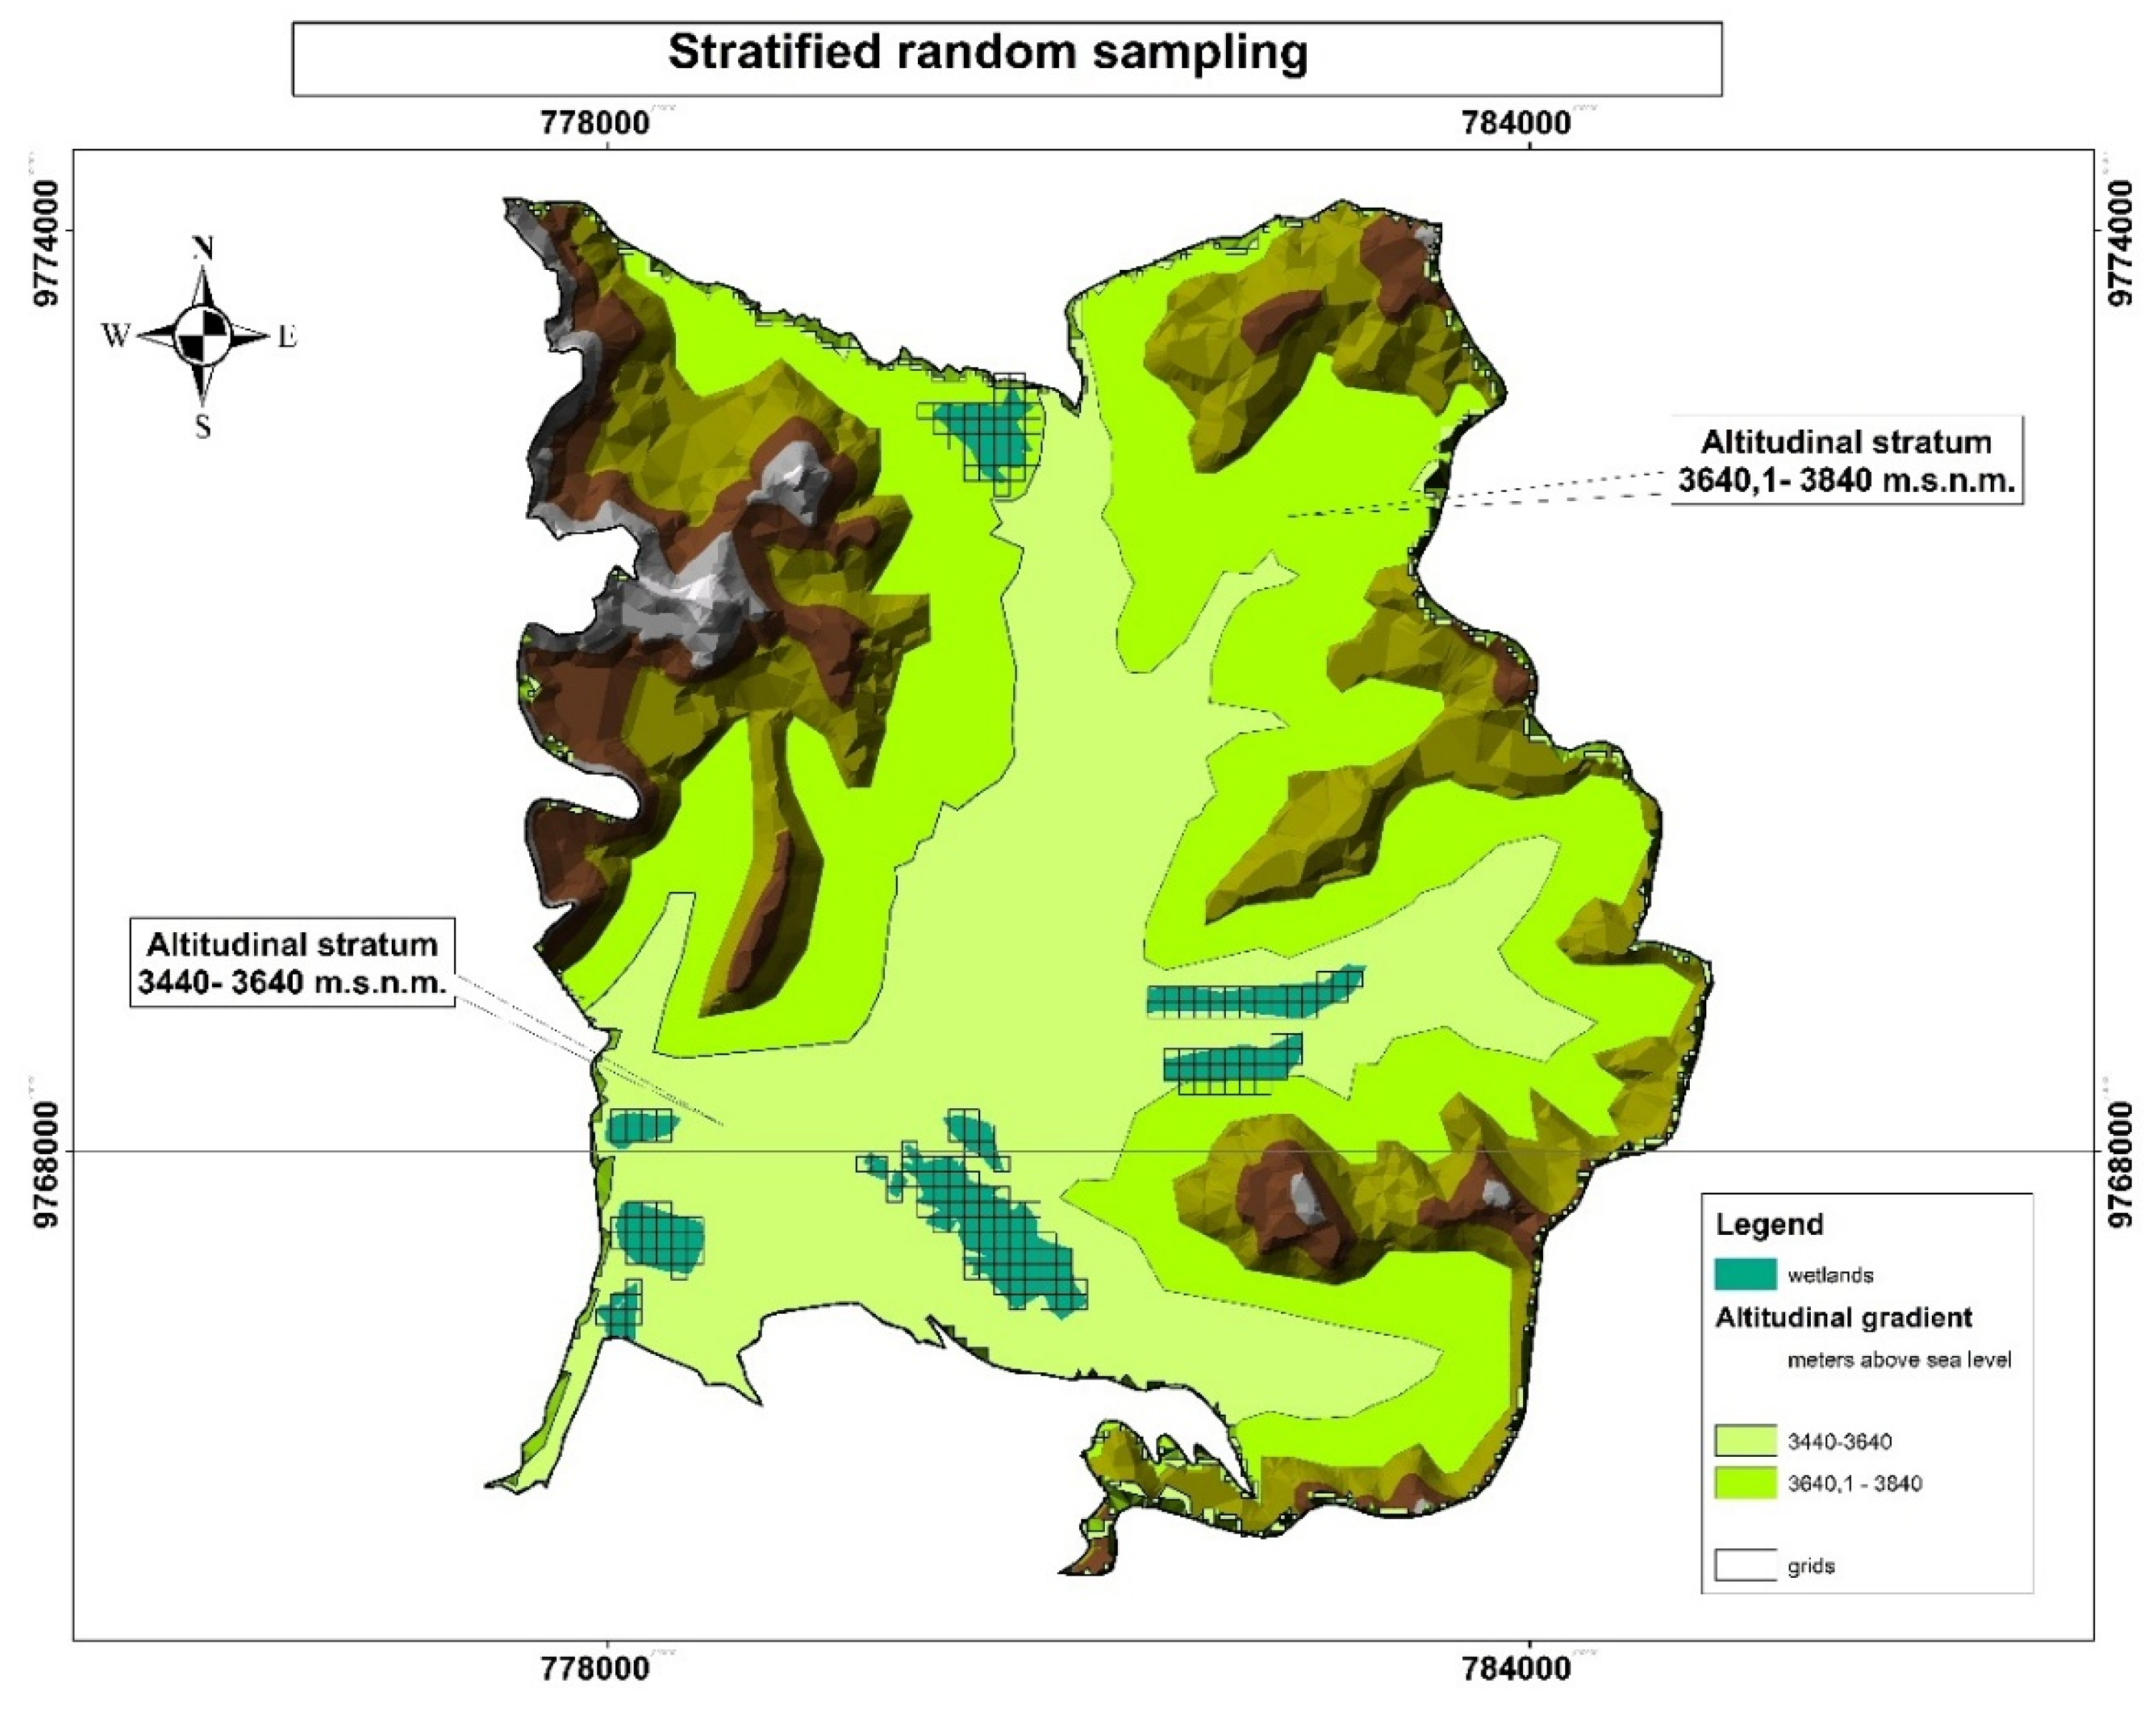
Figure 4.
A panoramic view of the paramo wetland is presented, with the superimposition of illustrations of eight plant species identified with the highest values of the importance value index.
Figure 4.
A panoramic view of the paramo wetland is presented, with the superimposition of illustrations of eight plant species identified with the highest values of the importance value index.
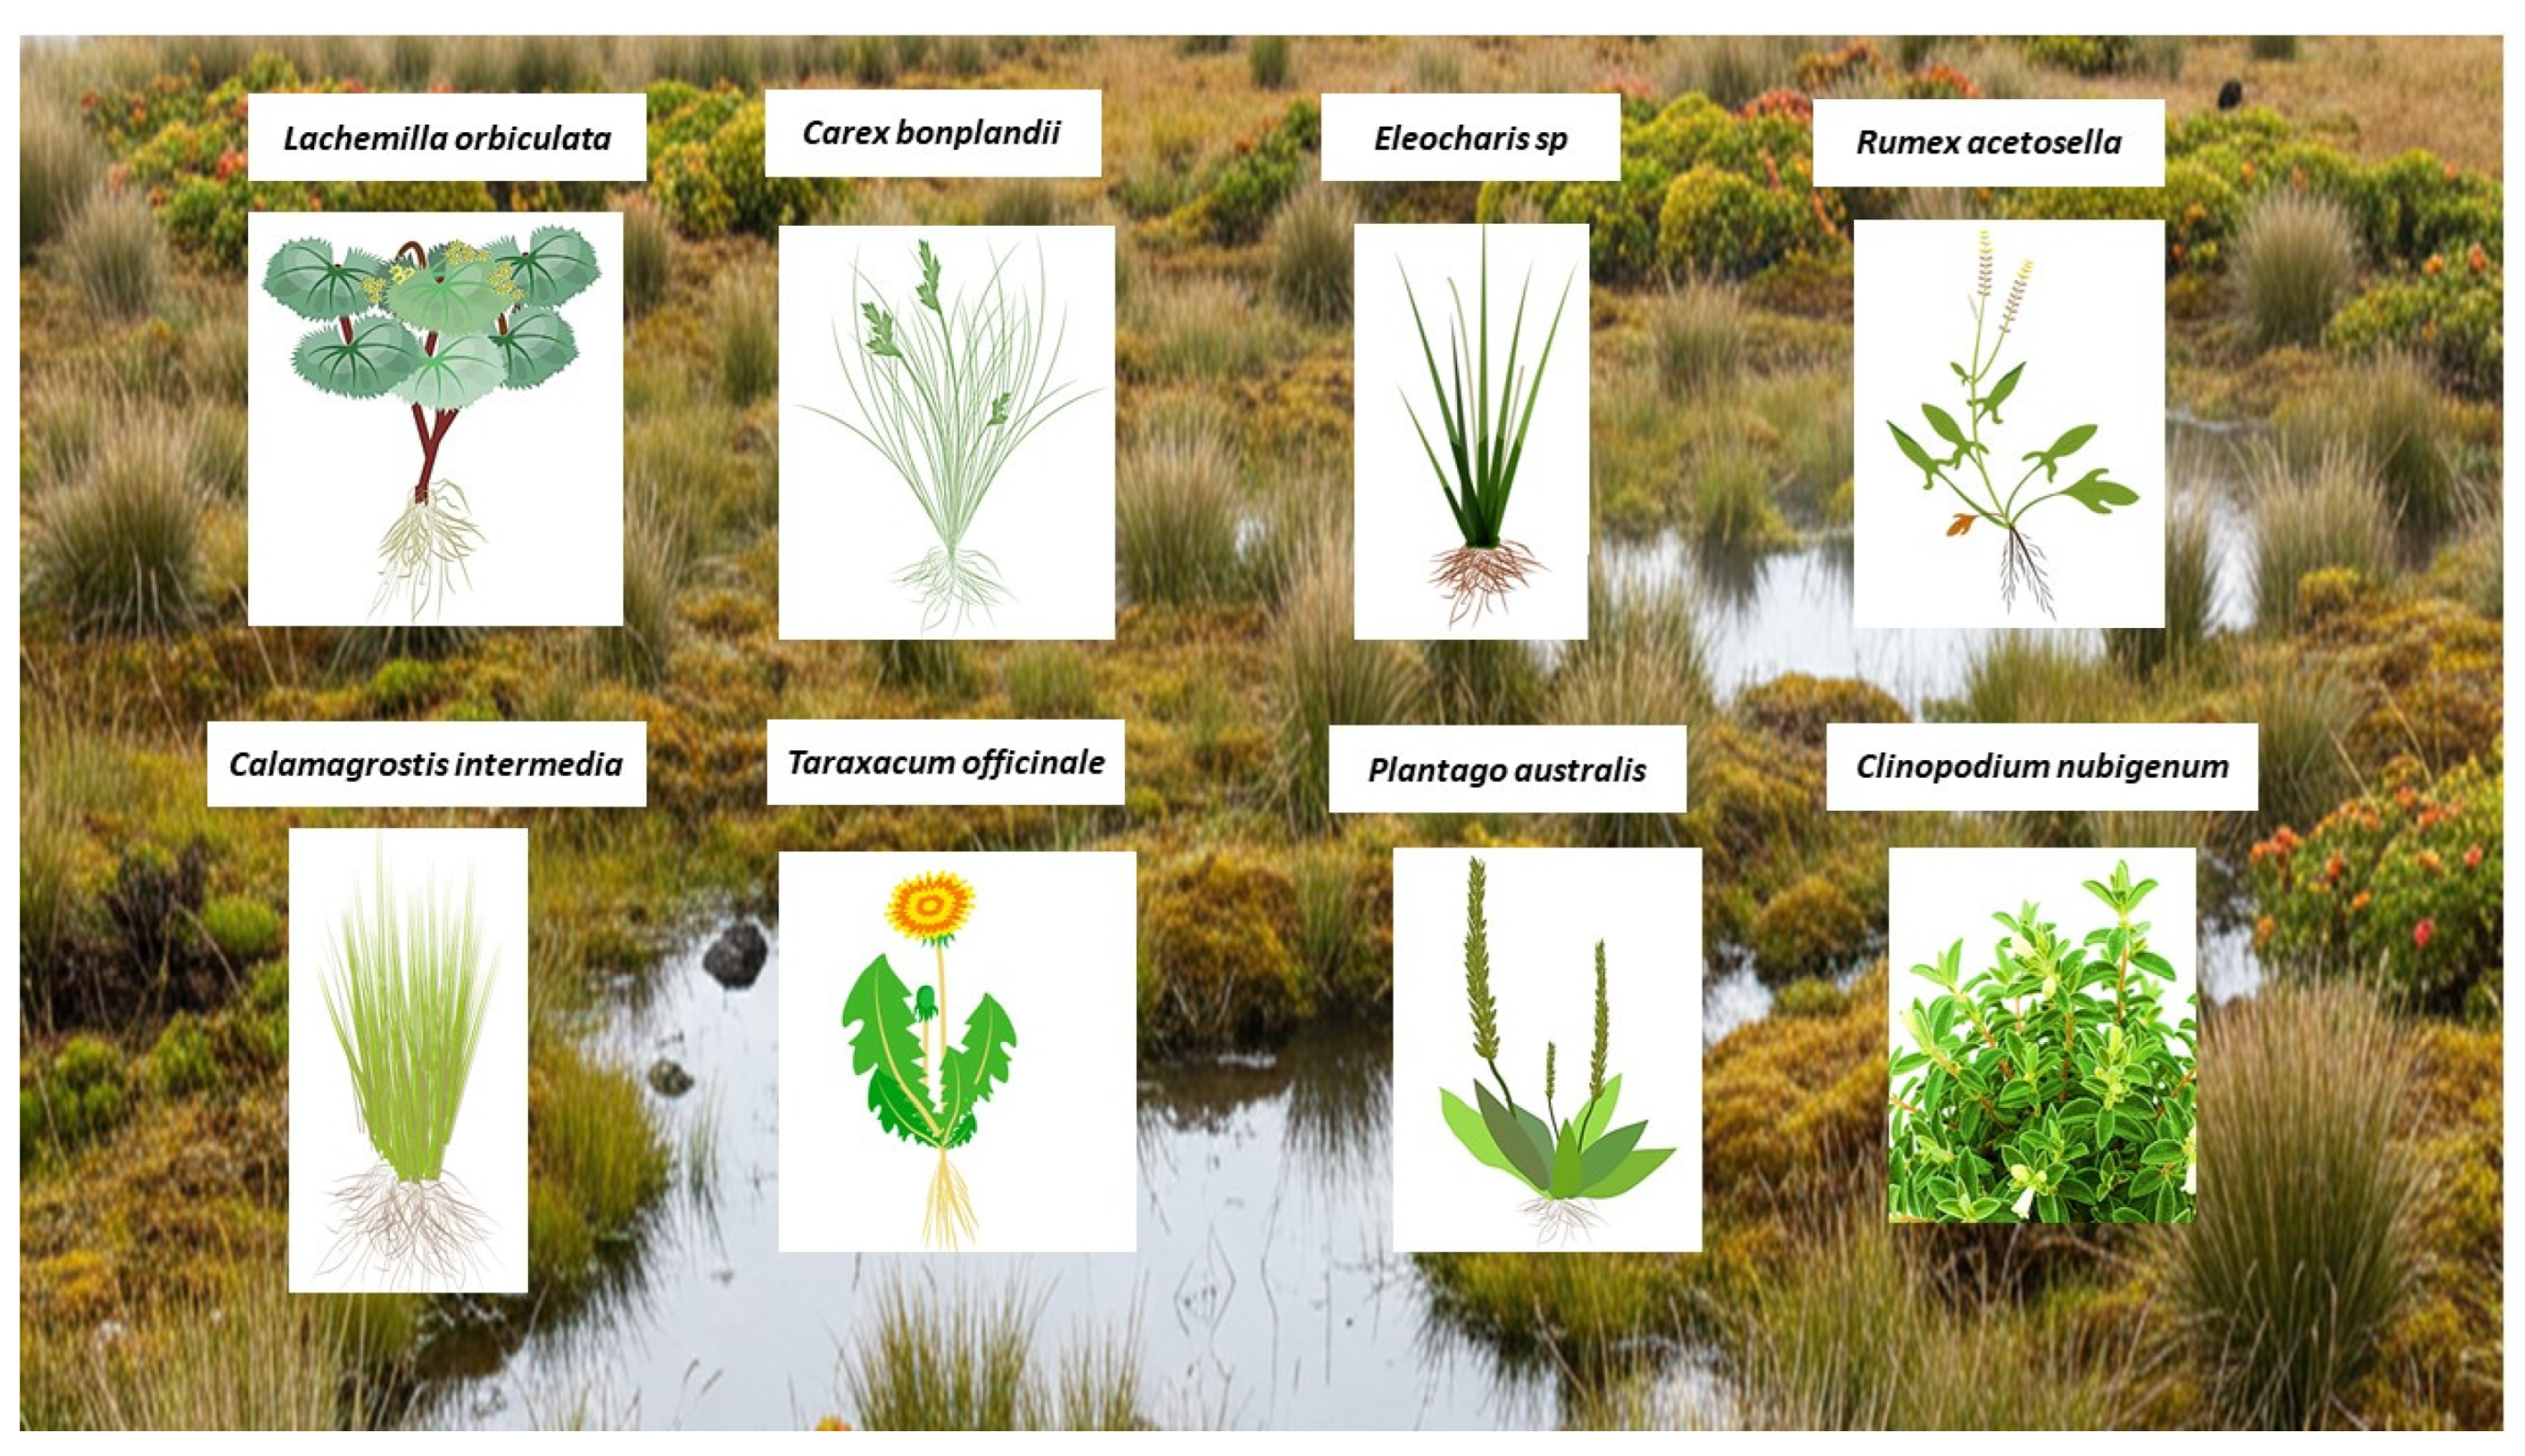
Figure 5.
Contributions to axes 1 and 2.
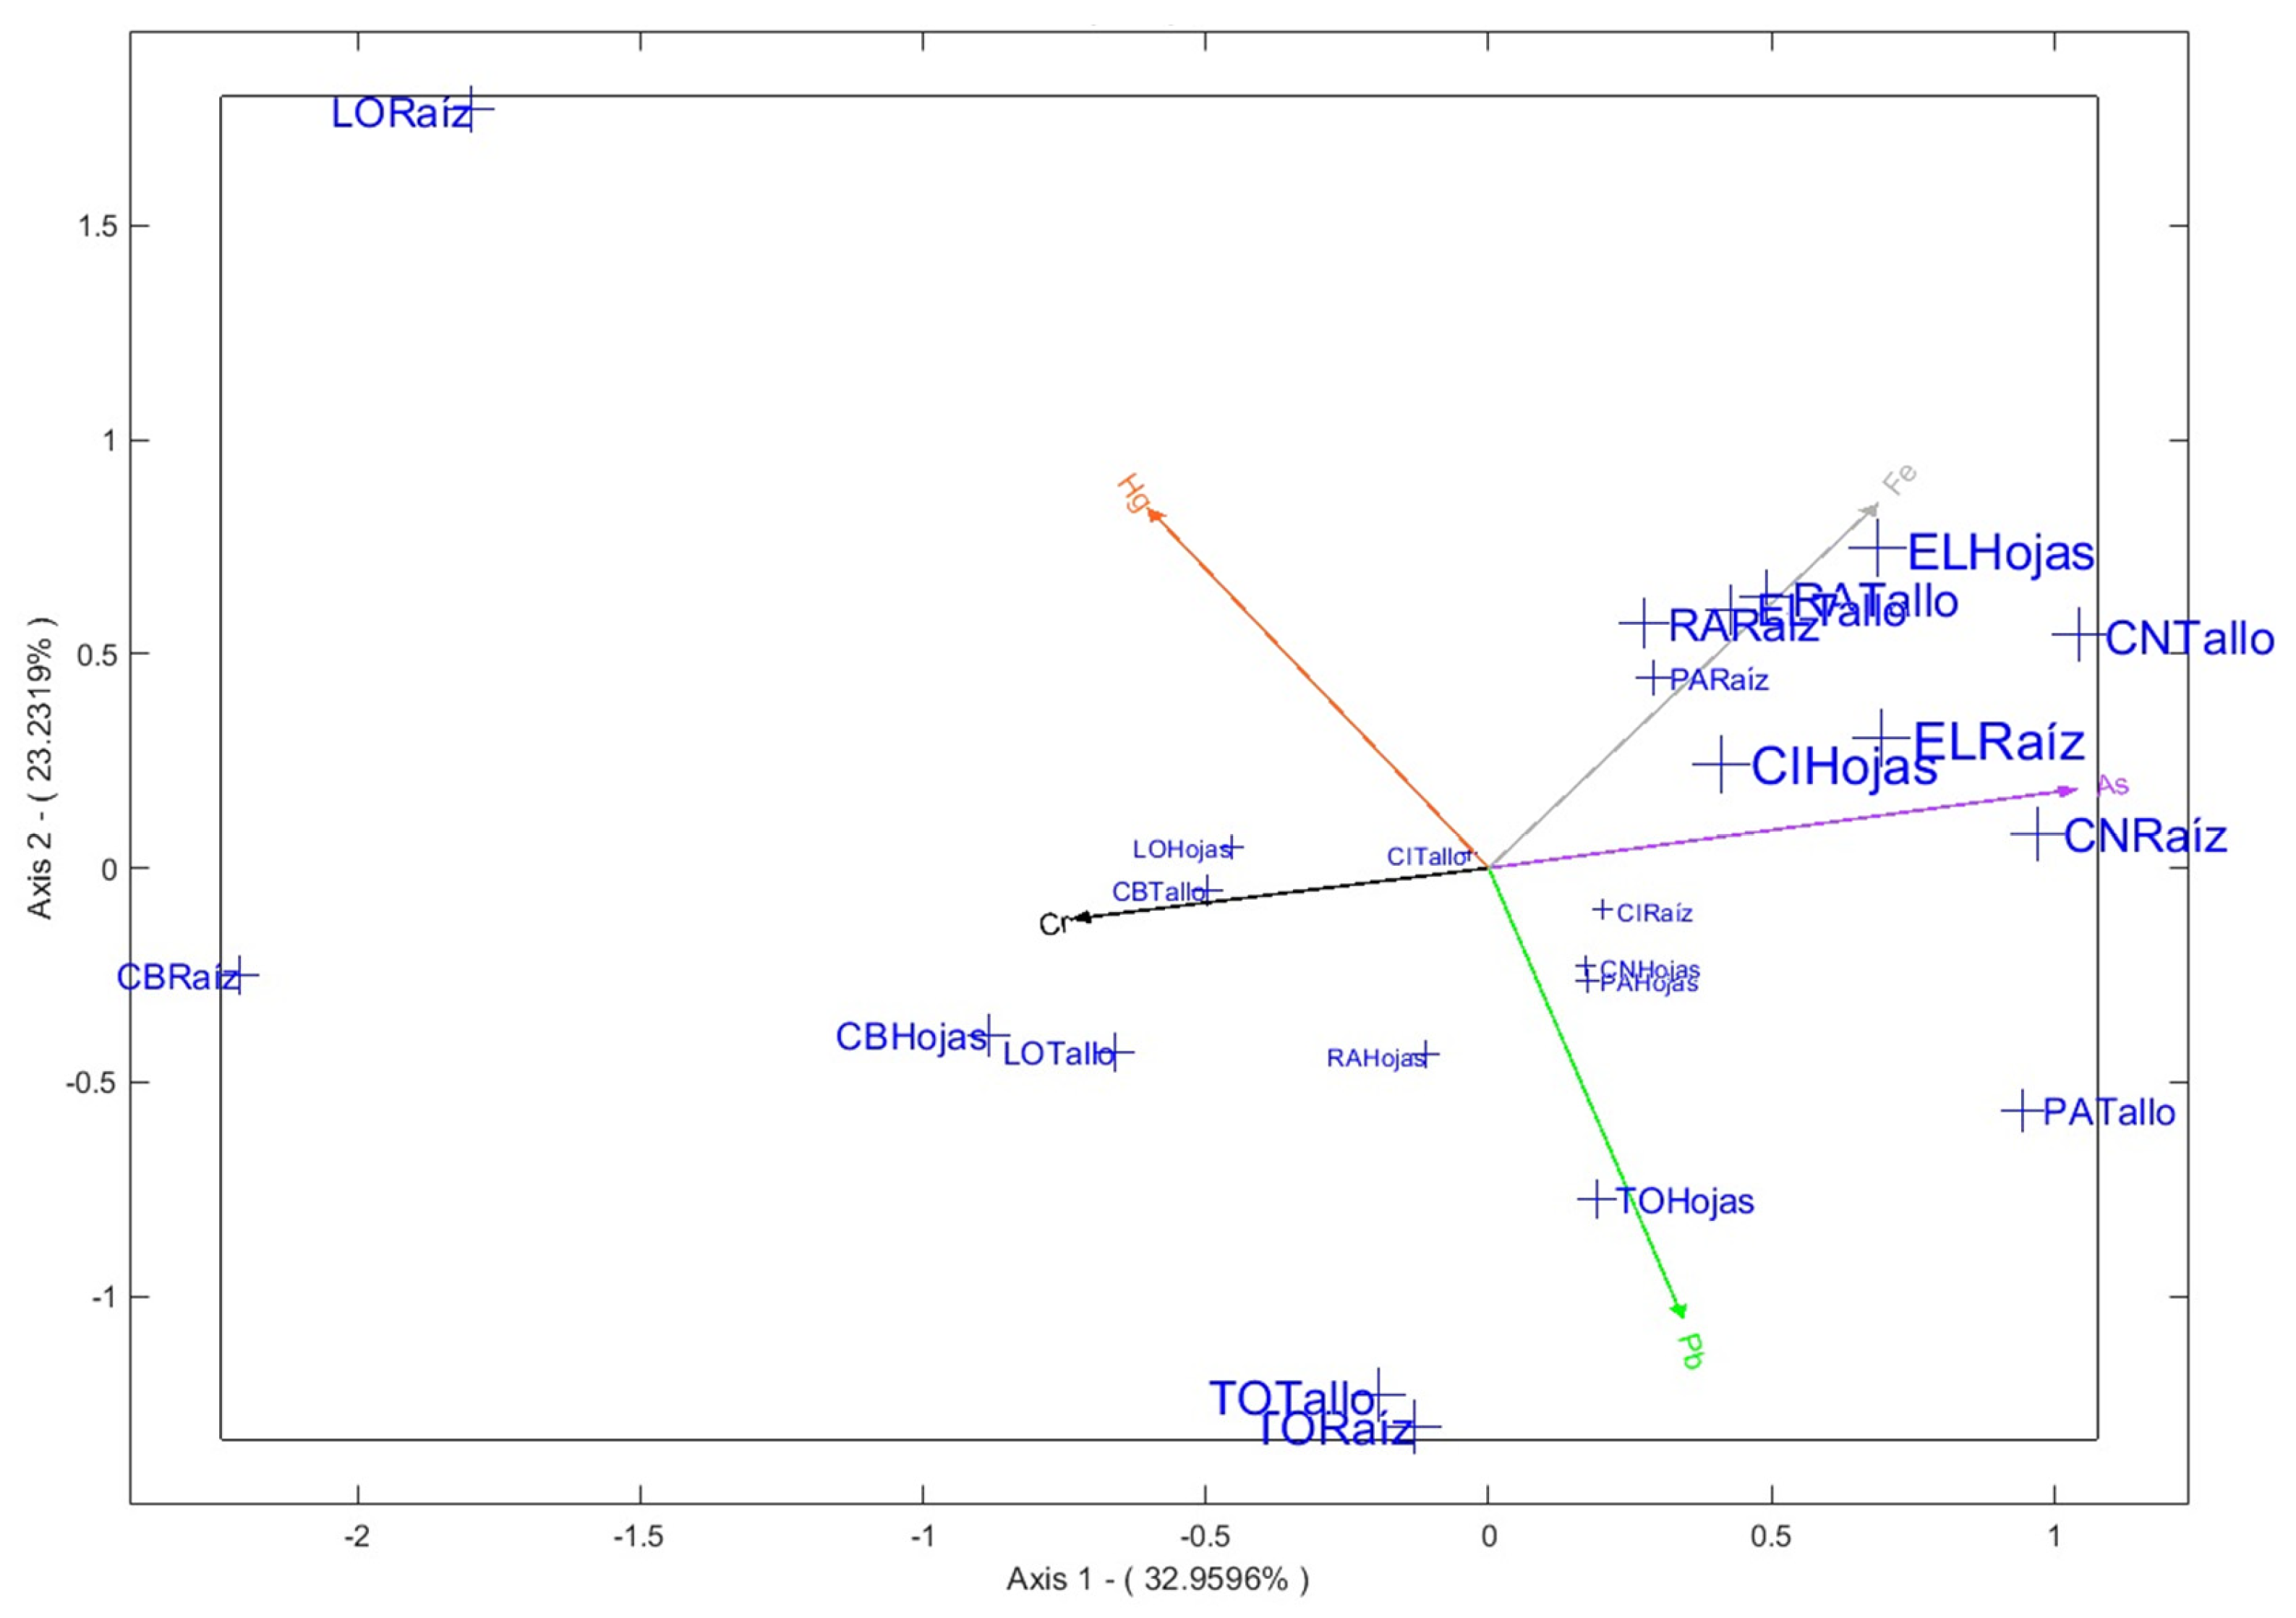
Figure 6.
Contributions to axes 3 and 4.
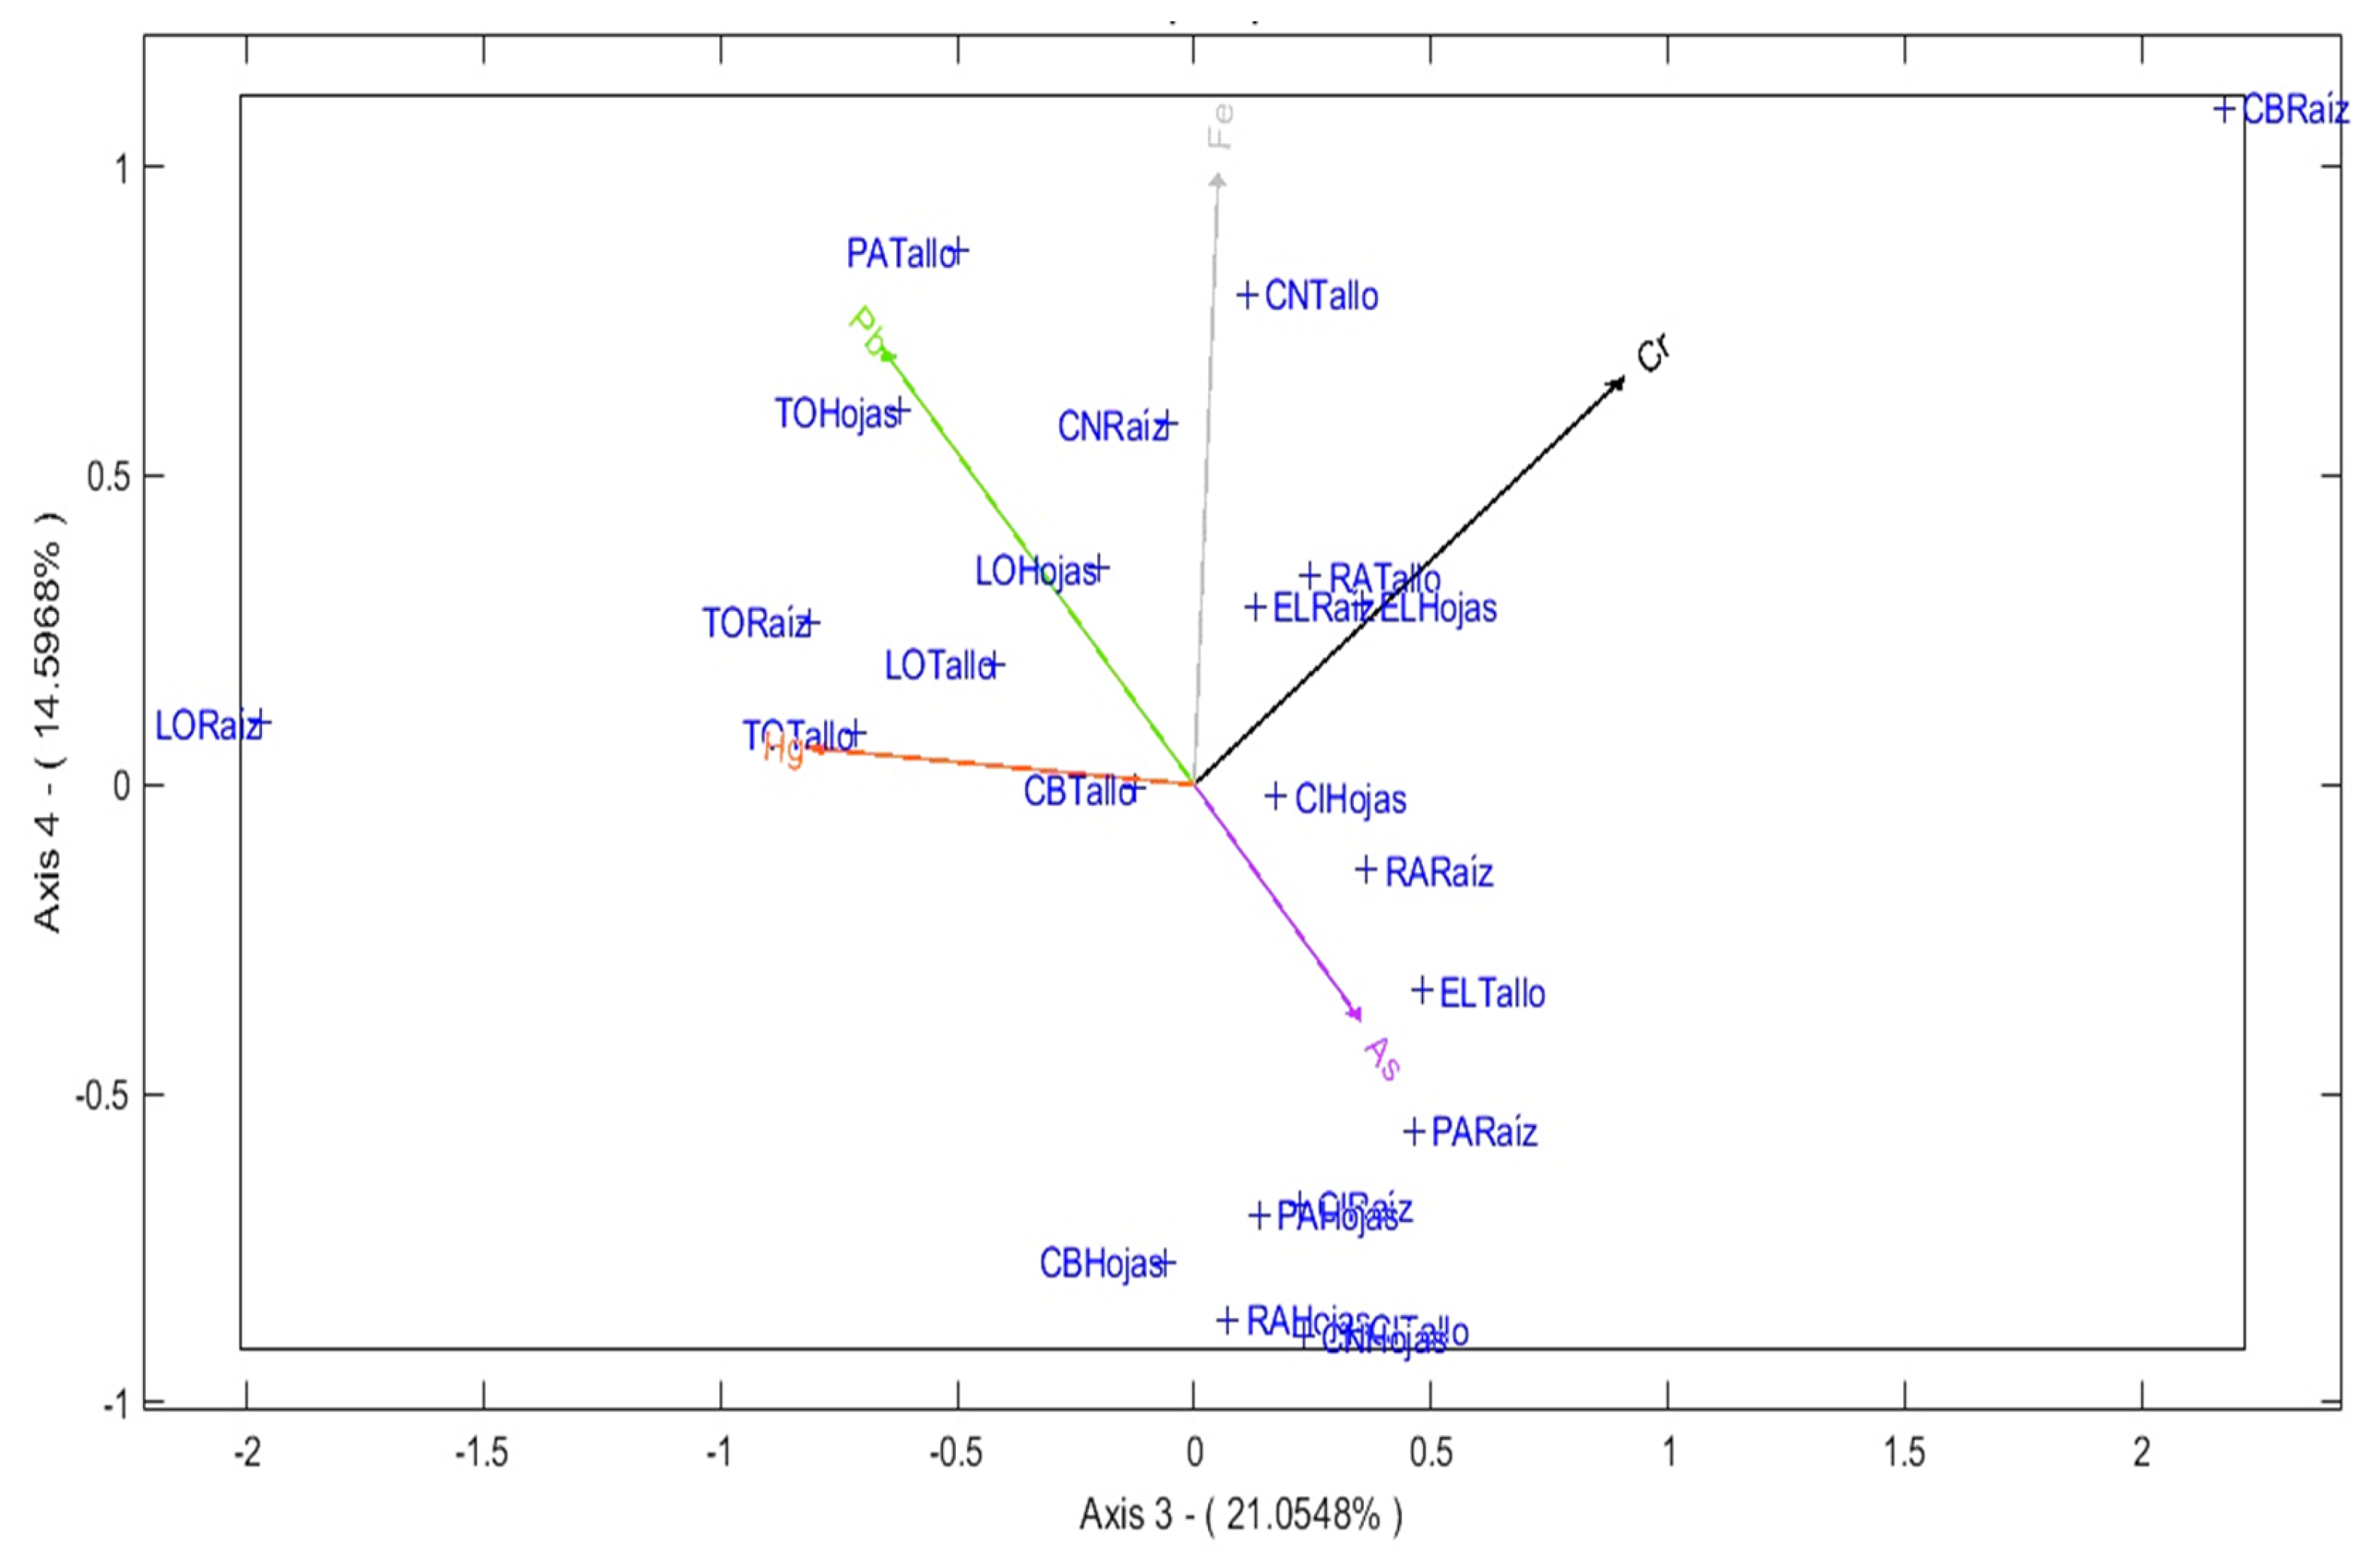
Figure 7.
Representation of the bicluster.
Disclaimer/Publisher’s Note: The statements, opinions and data contained in all publications are solely those of the individual author(s) and contributor(s) and not of MDPI and/or the editor(s). MDPI and/or the editor(s) disclaim responsibility for any injury to people or property resulting from any ideas, methods, instructions or products referred to in the content. |
© 2025 by the authors. Licensee MDPI, Basel, Switzerland. This article is an open access article distributed under the terms and conditions of the Creative Commons Attribution (CC BY) license (http://creativecommons.org/licenses/by/4.0/).
Copyright: This open access article is published under a Creative Commons CC BY 4.0 license, which permit the free download, distribution, and reuse, provided that the author and preprint are cited in any reuse.


